The Hongkong and Shanghai Banking ... - about.hsbc.com.hk · "Company") hereby releases the...
47
The Hongkong and Shanghai Banking Corporation Limited 2018 Interim Report In fulfilment of its obligations under section 6.3.5(1) of the Disclosure Guidance and Transparency Rules, The Hongkong and Shanghai Banking Corporation Limited (the "Company") hereby releases the unedited full text of its 2018 Interim Report for the six months ended 30 June 2018. The document is now available on the Company's website, www.hsbc.com.hk. Pursuant to Listing Rule 9.6.1, a copy of the above document has been submitted to the UK Listing Authority and will shortly be available for inspection at the UK Listing Authority's Document Viewing Facility via the National Storage Mechanism which is located at http://www.morningstar.co.uk/uk/NSM. The full text of the document follows:
Transcript of The Hongkong and Shanghai Banking ... - about.hsbc.com.hk · "Company") hereby releases the...

The Hongkong and Shanghai Banking Corporation Limited 2018 Interim Report
In fulfilment of its obligations under section 6.3.5(1) of the Disclosure Guidance and Transparency Rules, The Hongkong and Shanghai Banking Corporation Limited (the "Company") hereby releases the unedited full text of its 2018 Interim Report for the six months ended 30 June 2018.
The document is now available on the Company's website, www.hsbc.com.hk.
Pursuant to Listing Rule 9.6.1, a copy of the above document has been submitted to the UK Listing Authority and will shortly be available for inspection at the UK Listing Authority's Document Viewing Facility via the National Storage Mechanism which is located at http://www.morningstar.co.uk/uk/NSM.
The full text of the document follows:
The Hongkong and Shanghai Banking Corporation LimitedInterim Report 2018


The Hongkong and Shanghai Banking Corporation Limited Interim Report 2018 1
ContentsPage
Contents
Certain defined terms
Cautionary statement regarding forward-looking statements
Chinese translation
Changes to presentation from 1 January 2018
Financial Highlights
Chairman’s Comments
Consolidated income statement by global business
Financial Review
Risk
Capital Overview
Statement of Directors’ Responsibilities
Independent Review Report by PricewaterhouseCoopers
Interim Condensed Consolidated Financial Statements
Consolidated income statement
Consolidated statement of comprehensive income
Consolidated balance sheet
Consolidated statement of cash flows
Consolidated statement of changes in equity
Notes on the Interim Condensed Consolidated FinancialStatements
1 Basis of preparation and significant accounting policies
2 Effects of reclassification upon adoption of HKFRS 9
3 Dividends
4 Derivatives
5 Loans and advances to customers
6 Financial investments
7 Interests in associates and joint ventures
8 Prepayments, accrued income and other assets
9 Accruals and deferred income, other liabilities and provisions
10 Customer accounts
11 Contingent liabilities, contractual commitments and guarantees
12 Segmental analysis
13 Fair values of financial instruments carried at fair value
14 Fair values of financial instruments not carried at fair value
15 Related party transactions
16 Legal proceedings and regulatory matters
17 Additional information
18 Interim Report 2018 and statutory accounts
19 Ultimate holding company
Certain defined terms
This document comprises the Interim Report 2018 for The Hongkong and Shanghai Banking Corporation Limited (‘the Bank’) and its subsidiaries (together ‘the group’). References to ‘HSBC’, ‘the Group’ or ‘the HSBC Group’ within this document mean HSBC Holdings plc together with its subsidiaries. Within this document the Hong Kong Special Administrative Region of the People’s Republic of China is referred to as ‘Hong Kong’. The abbreviations ‘HK$m’ and ‘HK$bn’ represent millions and billions (thousands of millions) of Hong Kong dollars respectively.
Cautionary statement regarding forward-looking statementsThis Interim Report 2018 contains certain forward-looking statements with respect to the financial condition, results of operations and business of the group.
Statements that are not historical facts, including statements about the group’s beliefs and expectations, are forward-looking statements. Words such as ‘expects’, ‘anticipates’, ‘intends’, ‘plans’, ‘believes’, ‘seeks’, ‘estimates’, ‘potential’ and ‘reasonably possible’, variations of these words and similar expressions are intended to identify forward-looking statements. These statements are based on current plans, estimates and projections, and therefore undue reliance should not be placed on them. Forward-looking statements speak only as of the date they are made. The Hongkong and Shanghai Banking Corporation Limited makes no commitment to revise or update any forward-looking statements to reflect events or circumstances occurring or existing after the date of any forward-looking statement.
Forward-looking statements involve inherent risks and uncertainties. Readers are cautioned that a number of factors could cause actual results to differ, in some instances materially, from those anticipated or implied in any forward-looking statement.
Chinese translation
A Chinese translation of the Interim Report 2018 is available upon request from: Communications (Asia), Level 32, HSBC Main Building, 1 Queen’s Road Central, Hong Kong. The report is also available, in English and Chinese, on the Bank’s website at www.hsbc.com.hk.
Change to presentation from 1 January 2018
HKFRS 9The group adopted the requirements of HKFRS 9 ‘Financial Instruments’ from 1 January 2018, with the exception of the provisions relating to the presentation of gains and losses on financial liabilities designated at fair value, which were adopted from 1 January 2017. The impact of HKFRS 9 at 1 January 2018 on the consolidated financial statements of the group was a decrease in net assets of HK$12,313m, arising from:
• a decrease of HK$4,187m from additional impairment allowances;
• a decrease of HK$4,341m from the remeasurement of financial assets and liabilities as a consequence of classification changes;
• a decrease of HK$6,029m from our associates reducing their net assets; and
• a decrease in net deferred tax liabilities of HK$2,244m.
Refer to ‘Standards applied during the half-year to 30 June 2018’ and ‘Effects of reclassification upon adoption of HKFRS 9’ in notes 1 and 2 on the Interim Condensed Consolidated Financial Statements for further details.
1
1
1
1
1
2
3
4
5
9
14
16
17
18
18
19
20
21
22
24
24
32
36
36
37
37
38
38
39
39
39
39
40
41
41
41
42
43
43

Financial Highlights | Comment by John Flint, Chairman
2 The Hongkong and Shanghai Banking Corporation Limited Interim Report 2018
Financial Highlights• Profit before tax up 24% to HK$71,013m (HK$57,378m in the first half of 2017).
• Attributable profit up 24% to HK$53,759m (HK$43,443m in the first half of 2017).
• Return on average ordinary shareholders’ equity of 15.8% (14.0% in the first half of 2017).
• Total assets up 4% to HK$8,239bn (HK$7,943bn at the end of 2017).
• Common equity tier 1 ratio of 15.4% (15.9% at the end of 2017), total capital ratio of 19.0% (18.9% at the end of 2017).
• Cost efficiency ratio of 40.4% (41.9% for the first half of 2017).
Media enquiries to: Patrick Humphris Telephone no: + 852 2822 1268
Vinh Tran Telephone no: + 852 2822 4924
The Hongkong and Shanghai Banking Corporation Limited Interim Report 2018 3
Comment by John Flint, Chairman
Asia’s economies continued to grow during the first half of 2018, albeit with some concerns emerging in financial markets during the second quarter. In mainland China, the services sector, consumer spending and consumption remained strong, while the property and financial sectors responded to cooling measures. Investment in manufacturing showed early signs of an upturn. Hong Kong had a strong start to the year, driven primarily by domestic private consumption. In Singapore, manufacturing continued to drive growth, while elsewhere among the ASEAN countries, Malaysia sustained broad-based growth across private consumption, investment and exports. In India, public sector consumption and construction supported the economy’s strong rate of growth. In Australia, the economy picked up pace, supported by rising business sector activity and investment.
The Hongkong and Shanghai Banking Corporation Limited recorded profit before tax in the first half of 2018 of HK$71,013m, compared with HK$57,378m in the first six months of 2017, an increase of 24%. Net operating income before credit charges increased by 15%, driven by strong performances in all global businesses. Operating expenses increased by 11% as we continued to invest in staff and infrastructure to support business growth, and the cost efficiency ratio remained satisfactory at 40.4%. Expected credit losses were low in relation to average customer advances, amounting to HK$909m, compared with loan impairment charges of HK$3,483m in the first half of 2017.
Loans and advances to customers grew by 6% during the first half of 2018, with growth in all businesses. Customer deposits increased by 1%, and at the end of June 2018, the advances-to-deposits ratio stood at 67.9%. The net interest margin increased by 18 basis points from 1.85% in the first half of 2017 to 2.03% in the first half of 2018, principally from improved customer deposit spreads and increased yields on financial investments, partly offset by compressed lending spreads. Our capital position remained strong, with a common equity tier 1 ratio of 15.4% at the end of the period.
In Retail Banking and Wealth Management (‘RBWM’), we grew our market shares in mortgages and insurance in Hong Kong. We enhanced our HSBC Premier offering in Hong Kong to better support the needs of customers and their families, providing greater ease of financial connectivity and access to financial solutions. We also launched HSBC Reward+, a dedicated mobile app for our credit card holders to discover promotional offers and manage their card transactions. Our PayMe social payments app won two significant awards in the Information and Communications Technology awards in April in Hong Kong. PayMe now has over one million users, demonstrating its popularity in Hong Kong. In mainland China, we became the first foreign bank to enable students to pay for international tuition through mobile banking, using our International Education Payment Service.
In Commercial Banking (‘CMB’), our Global Liquidity and Cash Management business performed strongly, benefiting from improved deposit spreads. We grew loans in a number of markets, notably Hong Kong, India, Singapore, Taiwan and Australia, and maintained market share for trade finance in Hong Kong. We launched a new Business Internet Banking platform, drawing on big data analytics to give business customers fresh perspectives to make better decisions. We also launched a new mobile app ‘Business Express’, which allows customers to use biometrics to log in and access new tools including Trade Transaction Tracker, Incoming and Outgoing funds tracker, and a virtual assistant ‘Ask Amy’. Our HK-PRD Connectivity Proposition, which provides cash management solutions to small- and medium-sized enterprises in Hong Kong and the Pearl River Delta region, received an award in the first Shenzhen-Hong Kong Fintech Awards, jointly presented by the Shenzhen municipal government and the Hong Kong Monetary Authority.
In Global Banking and Markets (‘GB&M’), we continued to build our new majority-owned securities joint venture in mainland China, HSBC Qianhai Securities Limited, following its formal opening for business in December last year. In May, we successfully executed a live trade finance transaction for Cargill using R3’s Corda scalable blockchain platform, reducing the time to exchange from the usual 5-10 days to 24 hours. We consolidated our position as a leader in sustainable financing, participating in green bond issues for several major issuers, including the Republic of Indonesia’s first Sukuk green bond, and Tianjin Rail Transport Group. We were delighted to win a number of awards, including ‘Asia’s Best Bank for Sustainable Finance’ from Euromoney. We also achieved top ranking in all 10 categories of Asiamoney’s Global RMB Poll for 2018, as well as ‘Best Overall for RMB Products and Services’. This marks the seventh consecutive year of achieving all top rankings in the Poll, and reflects our clients’ confidence in HSBC as the go-to bank for all their RMB needs, at a time when confidence in the currency is growing and mainland China is accelerating the opening-up of its capital markets.
The world economy is facing the potential trio of tighter US financial conditions, higher oil prices and trade tensions. However, Asia’s dependence on exports to the West has reduced in recent years, and domestic demand, consumption and services are a larger share of many economies. Trade has also become more diversified and regionally focused. Mainland China has sufficient policy levers to support demand and continue to maintain growth in the medium term.
In our June Strategy Update, we set out our plans to accelerate growth in our Asia businesses. As I take on the role of Chairman, I am struck by the enormous potential in Asia’s economies to continue to grow and create wealth. HSBC has always been at the heart of Asia’s economies, serving corporate and individual customers as they develop and expand their activities. We are strongly positioned to participate in many exciting developments, in particular the economic integration in the Guangdong-Hong Kong-Macau Greater Bay Area, the Belt and Road initiative, the internationalisation of the renminbi, and the provision of sustainable finance.

Consolidated income statement by global business | Financial Review
4 The Hongkong and Shanghai Banking Corporation Limited Interim Report 2018
Consolidated income statement by global business
RetailBanking
and WealthManagement
CommercialBanking
GlobalBanking
and Markets
GlobalPrivate
BankingCorporate
Centre1 Total
HK$m HK$m HK$m HK$m HK$m HK$m
Half-year to 30 Jun 2018
Net interest income 29,795 18,445 10,518 1,304 1,289 61,351
Net fee income 11,945 5,702 5,316 1,405 54 24,422
Net income from financial instruments measured at fair value 210 1,407 10,272 501 2,308 14,698
Gains less losses from financial investments — (5) 70 — 225 290
Dividend income — — — — 8 8
Net insurance premium income/(expense) 30,288 2,621 — — (51) 32,858
Other operating income 3,102 429 470 37 1,132 5,170
Total operating income 75,340 28,599 26,646 3,247 4,965 138,797
Net insurance claims and benefits paid and movement in liabilitiesto policyholders (30,263) (2,307) — — — (32,570)
Net operating income before change in expected creditlosses and other credit risk provisions 45,077 26,292 26,646 3,247 4,965 106,227
Change in expected credit losses and other credit impairmentcharges (1,083) 36 119 — 19 (909)
Net operating income 43,994 26,328 26,765 3,247 4,984 105,318
Operating expenses (19,065) (8,964) (11,100) (1,717) (2,036) (42,882)
Operating profit 24,929 17,364 15,665 1,530 2,948 62,436
Share of profit in associates and joint ventures 131 — — — 8,446 8,577
Profit before tax 25,060 17,364 15,665 1,530 11,394 71,013
Balance at 30 Jun 2018
Loans and advances to customers (net) 1,101,006 1,218,349 1,046,631 129,083 1,848 3,496,917
Customer accounts 2,711,008 1,314,607 914,346 177,065 35,498 5,152,524
Half-year to 30 Jun 2017
Net interest income 24,280 14,616 9,169 831 3,680 52,576
Net fee income 10,026 5,387 5,093 780 94 21,380
Net income from financial instruments measured at fair value 9,967 1,349 8,240 542 488 20,586
Gains less losses from financial investments 75 46 — — 480 601
Dividend income 9 1 — — 23 33
Net insurance premium income/(expense) 25,284 2,115 — — (16) 27,383
Other operating income 1,417 336 412 16 1,408 3,589
Total operating income 71,058 23,850 22,914 2,169 6,157 126,148
Net insurance claims and benefits paid and movement in liabilitiesto policyholders (31,860) (2,068) — — — (33,928)
Net operating income before loan impairment charges and othercredit risk provisions 39,198 21,782 22,914 2,169 6,157 92,220
Loan impairment charges and other credit risk provisions (1,109) (1,742) (598) — (34) (3,483)
Net operating income 38,089 20,040 22,316 2,169 6,123 88,737
Operating expenses (16,752) (7,722) (9,696) (1,168) (3,266) (38,604)
Operating profit 21,337 12,318 12,620 1,001 2,857 50,133
Share of profit/(loss) in associates and joint ventures (88) — — — 7,333 7,245
Profit before tax 21,249 12,318 12,620 1,001 10,190 57,378
Balance at 30 Jun 2017
Loans and advances to customers (net) 990,883 1,094,647 913,930 107,947 19,111 3,126,518
Customer accounts 2,640,254 1,251,010 852,312 186,751 33,737 4,964,064
1 Includes inter-segment elimination.

The Hongkong and Shanghai Banking Corporation Limited Interim Report 2018 5
Financial ReviewThe group reported profit before tax of HK$71,013m, an increase of 24% compared with the first half of 2017, driven by higher net interest income and higher net fee income.
Net interest income increased by HK$8,775m, or 17%, compared with the first half of 2017, driven by Hong Kong from improved deposit spreads which benefited from interest rate rises, coupled with balance sheet growth, primarily in loans and advances to customers. Net interest income also increased in mainland China, Singapore and Malaysia.
Net fee income increased by HK$3,042m, or 14%, compared with the first half of 2017, mainly in Hong Kong from securities brokerage, unit trust, global custody and funds under management fees due to higher turnover from equity market activities in the first half of 2018. To a lesser extent, fee income also increased in mainland China, Singapore, Taiwan and Malaysia.
Net income from financial instruments measured at fair value decreased by HK$5,888m, or 29%, compared with the first half of 2017, driven by lower insurance income, mainly in Hong Kong due to lower revaluation gains on the equity portfolio as the favourable equity market performance in the first half of 2017 was not repeated. To the extent that revaluation is attributable to policyholders, there is an offsetting movement reported under ‘Net insurance claims and benefits paid and movement in liabilities to policyholders’. Income in mainland China was also lower, driven by the revaluation loss and higher interest expense on structured deposits and notes. These were partly offset by higher trading income in Hong Kong, which included the impact from the reclassification of stock borrowing assets from amortised cost to trading, coupled with increased holdings of trading debt securities. Income in Australia also increased, mainly from the favourable valuation adjustment on derivative contracts.
Net insurance premium income increased by HK$5,475m, or 20% compared with the first half of 2017, driven by the non-recurrence of a major reinsurance arrangement in 2017, coupled with higher premium from new business sales and higher renewals. This was largely offset by a corresponding movement in ‘Net insurance claims and benefits paid and movement in liabilities to policyholders’.
Other operating income increased by HK$1,581m, or 44%, compared with the first half of 2017, driven by the movement in the present value of in-force insurance business, mainly in Hong Kong. This was partly offset by a corresponding movement in ‘Net insurance claims and benefits paid and movement in liabilities to policyholders’.
Net insurance claims and benefits paid and movement in liabilities to policyholders decreased by HK$1,358m, or 4% compared with the first half of 2017, reflecting lower investment returns to policyholders as the favourable equity market performance in the first half of 2017 was not repeated, partly offset by the non-recurrence of a large reinsurance arrangement and the favourable movement in the present value of in-force insurance business.
Change in expected credit losses and other credit risk provisions amounted to HK$909m for the first half of 2018, mainly related to mainland China, Australia and Hong Kong in Retail Banking and Wealth Management (‘RBWM’).
Loan impairment charges and other credit risk provisions in the first half of 2017 (on HKAS 39 basis) amounted to HK$3,463m, mainly related to Hong Kong in Commercial Banking (‘CMB’).
Total operating expenses increased by HK$4,278m, or 11%, compared with the first half of 2017, driven by higher IT-related and staff costs from investments to support digital and business growth initiatives, and to a lesser extent in regulatory and compliance programmes.
Share of profit in associates and joint ventures increased by HK$1,332m, or 18%, compared with the first half of 2017, mainly from the favourable impact of foreign exchange translation and from higher share of profits from Bank of Communications Co., Limited.
Net interest income
Half-year to
30 Jun 30 Jun
2018 2017
HK$m HK$m
Net interest income 61,351 52,576
Average interest-earning assets 6,082,122 5,735,095
% %
Net interest spread 1.93 1.76
Contribution from net free funds 0.10 0.09
Net interest margin 2.03 1.85
Net interest income (‘NII’) increased by HK$8,775m compared with the first half of 2017, driven by Hong Kong from wider deposit spreads which benefited from interest rate increases, coupled with balance sheet growth, mainly in loans and advances to customers. NII also increased in mainland China from growth in customer advances and improved deposit spreads, and to a lesser extent, in Singapore and Malaysia.
Average interest-earning assets increased by HK$347bn, or 6%, compared with the first half of 2017, driven by Hong Kong from an increase in loans and advances to customers, notably in corporate term lending and residential mortgages. Increases were also noted in mainland China and Australia driven by growth in customer advances.
Net interest margin increased by 18 basis points compared with the first half of 2017. The increase in net interest margin was driven by Hong Kong and mainland China, and to a lesser extent by Singapore and Malaysia.
In Hong Kong, the net interest margin for the Bank increased by 25 basis points, primarily from wider customer deposit spreads and a change in asset portfolio mix due to growth in customer lending. Re-investment yields on financial investments also improved following interest rate increases. These increases were partly offset by compressed lending spreads and increase in financial liabilities to meet the ‘Total Loss Absorbing Capacity’ requirement.
At Hang Seng Bank, the net interest margin increased by 22 basis points, mainly from improved deposit spreads and higher re-investment yields on financial investments following interest rate increases, coupled with portfolio mix changes from growth in customer advances, partly offset by compressed lending spreads.
In mainland China, the increase in net interest margin was driven by portfolio mix changes as customer advances increased, improved deposit spreads and higher re-investment yields on financial investments following interest rate increases, partly offset by compressed lending spreads.

Financial Review
6 The Hongkong and Shanghai Banking Corporation Limited Interim Report 2018
Net fee income
Half-year to
30 Jun 30 Jun
2018 2017
Total Total
HK$m HK$m
Account services 1,447 1,447
Funds under management 3,871 3,375
Cards 4,087 3,607
Credit facilities 1,804 1,606
Broking income 2,915 1,831
Imports/exports 1,855 1,830
Unit trusts 4,279 3,579
Underwriting 659 760
Remittances 1,592 1,625
Global custody 2,010 1,674
Insurance agency commission 1,249 964
Other 3,788 3,153
Fee income 29,556 25,451
Fee expense (5,134) (4,071)
Net fee income 24,422 21,380
Net income from financial instruments measured at fair value
Half-year to
30 Jun 30 Jun
2018 2017
HK$m HK$m
Net trading income 15,909 12,401
– net interest income 5,533 1,318
– dividend income 1,331 1,497
– net gain/(loss) from hedging activities (113) 42
– other trading income 9,158 9,544
Net expense from financial instruments designated at fair value1 (540) (447)
– net interest income/(expense) (1,413) 8
– other income/(expense) 873 (455)
Net income/(expense) from assets and liabilities of insurance businesses measured at fair value1 (623) 8,313
– financial assets held to meet liabilities under insurance and investment contracts (769) 9,784
– liabilities to customers under investment contracts 146 (1,471)
Changes in fair value of other financial instruments measured at fair value2 (48) 319
Net income from financial instruments measured at fair value 14,698 20,586
1 The presentation has been updated to show the net income/(expenses) from assets and liabilities backing insurance and investment contracts separately. Comparatives have been represented accordingly.
2 Changes in fair value of other financial instruments measured at fair value included change in fair value of long-term debt and related derivatives, together with change in fair value of other financial instruments mandatorily measured at fair value under HKFRS 9. Comparatives have been represented accordingly.
With effect from 1 January 2018, certain stock borrowing assets have been reclassified from ‘Placings with and advances to banks’ and ‘Loans and advances to customers’ to ‘Trading assets’ as a result of the determination of the global business model for this activity and to align the presentation throughout the group. In addition, certain structured liabilities were reclassified from ‘Trading liabilities’ to ‘Financial instruments designated at fair value’ to better align with the presentation of similar financial instruments by peers. These reclassifications accounted for the majority of the increase in net interest income under ‘net trading income’ and net interest expense from financial instruments designated at fair value.
Other operating income
Half-year to
30 Jun 30 Jun
2018 2017
HK$m HK$m
Change in present value of in-force long-term insurance business 2,745 1,045
Gains on investment properties 182 206
Gains/(losses) on disposal of property, plant and equipment, and assets held for sale (20) 24
Other 2,263 2,314
Other operating income 5,170 3,589

The Hongkong and Shanghai Banking Corporation Limited Interim Report 2018 7
Insurance income
Included in net operating income are the following revenues earned by the insurance business
Half-year to
30 Jun 30 Jun
2018 2017
HK$m HK$m
Net interest income 6,645 6,058
Net fee income 1,508 1,390
Net income/(expense) from financial instruments held for trading or designated at fair value1 (49) 649
Net income/(expense) from assets and liabilities of insurance business measured at fair value1 (1,155) 8,186
Net insurance premium income 32,893 27,383
Change in present value of in-force long-term insurance business 2,745 1,045
Other operating income 128 234
Total operating income 42,715 44,945
Net insurance claims and benefits paid and movement in liabilities to policyholders (32,570) (33,928)
Net operating income from insurance business 10,145 11,017
1 The presentation has been updated to show the net income/(expenses) from assets and liabilities backing insurance and investment contracts separately. Comparatives have been represented accordingly.
Net operating income from the insurance business decreased by HK$872m, or 8%, as the favourable market condition in the first half of 2017 was not repeated.
Net interest income increased by 10% from growth in insurance fund size, reflecting net inflows from new and renewal of life insurance premiums.
Net income from financial instruments held for trading or designated at fair value decreased mainly in Hong Kong, driven by revaluation losses on foreign currency swaps and forwards in the first half of 2018, against revaluation gains reported in the first half of 2017.
Net income from assets and liabilities of insurance business decreased significantly, driven by Hong Kong mainly from the downward revaluation of the equity portfolio as the favourable market condition in the first half of 2017 was not repeated.
Net insurance premium income increased, mainly in Hong Kong due to the non-recurrence of a large reinsurance arrangement entered into in the first half of 2017, coupled with higher new business sales and renewals.
The more favourable movement in the present value of in-force long-term insurance business (‘PVIF’) was driven by the future sharing of lower investment returns with policyholders and higher new business sales, primarily in Hong Kong.
To the extent that the above gains or losses are attributable to policyholders, there is an offsetting movement reported under ‘Net insurance claims and benefits paid and movement in liabilities to policyholders’.
Change in expected credit losses and other credit impairment charges
Half-year to
30 Jun 30 Jun
2018 2017
HK$m HK$m
Change in expected credit losses/Loan impairment charges
Loans and advances to banks and customers 845 3,468
– new allowances net of allowance releases 1,313 3,889
– recoveries of amounts previously written off (469) (421)
– modification losses and other movements 1 N/A
Loan commitments and guarantees 90 15
Other financial assets (26) —
Change in expected credit losses and other credit impairment charges/Loan impairment charges and other credit riskprovisions 909 3,483
1 For retail overdrafts and credit cards, the total expected credit loss ('ECL') is recognised against the financial asset unless the total ECL exceeds the gross carrying amount of the financial asset, in which case the ECL is recognised against the loan commitment.
Operating expenses
Half-year to
30 Jun 30 Jun
2018 2017
HK$m HK$m
Employee compensation and benefits 20,858 20,065
General and administrative expenses 18,840 15,542
Depreciation of property, plant and equipment 2,336 2,295
Amortisation and impairment of intangible assets 848 702
Operating expenses 42,882 38,604
Financial Review | Risk
8 The Hongkong and Shanghai Banking Corporation Limited Interim Report 2018
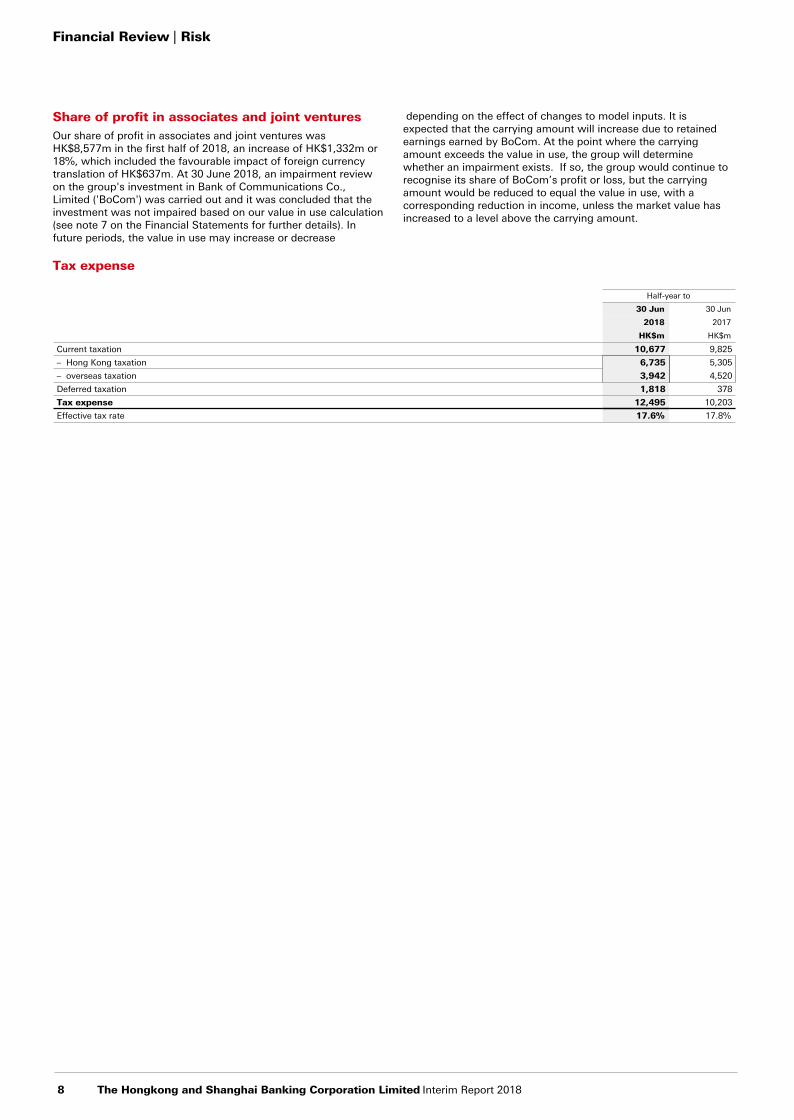
Share of profit in associates and joint venturesOur share of profit in associates and joint ventures was HK$8,577m in the first half of 2018, an increase of HK$1,332m or 18%, which included the favourable impact of foreign currency translation of HK$637m. At 30 June 2018, an impairment review on the group's investment in Bank of Communications Co., Limited ('BoCom') was carried out and it was concluded that the investment was not impaired based on our value in use calculation (see note 7 on the Financial Statements for further details). In future periods, the value in use may increase or decrease
depending on the effect of changes to model inputs. It is expected that the carrying amount will increase due to retained earnings earned by BoCom. At the point where the carrying amount exceeds the value in use, the group will determine whether an impairment exists. If so, the group would continue to recognise its share of BoCom’s profit or loss, but the carrying amount would be reduced to equal the value in use, with a corresponding reduction in income, unless the market value has increased to a level above the carrying amount.
Tax expense
Half-year to
30 Jun 30 Jun
2018 2017
HK$m HK$m
Current taxation 10,677 9,825
– Hong Kong taxation 6,735 5,305
– overseas taxation 3,942 4,520
Deferred taxation 1,818 378
Tax expense 12,495 10,203
Effective tax rate 17.6% 17.8%
The Hongkong and Shanghai Banking Corporation Limited Interim Report 2018 9
Risk
Principal risks and uncertainties
The group continuously monitors and identifies risks. Our principal risks are credit risk, liquidity and funding risk, market risk, operational risk, regulatory compliance risk, financial crime risk, reputational risk, pension risk, sustainability risk and insurance risk. There is no material change in the principal risks and uncertainties for the remaining six months of the financial year, the description of which can be found in the risk report of the Annual Report and Accounts 2017. A summary of our current policies and practices regarding the management of risk is set out in the ‘Risk’ section of the Annual Report and Accounts 2017.
Key developments in the first half of 2018
There were no material changes to the policies and practices for the management of risk, as described in the Annual Report and Accounts 2017, in the first half of 2018. The group is on track to integrate the majority of the Global Standards Programme financial crime risk core capabilities into our day-to-day operations by the end of 2018, and will complete the closure of the programme infrastructure in early 2019. The group will continue to take steps to further refine and strengthen our defences against financial crime by applying advanced analytics and artificial intelligence.
Credit risk profile
Credit risk is the risk of financial loss if a customer or counterparty fails to meet an obligation under a contract. Credit risk arises principally from direct lending, trade finance and leasing business, but also from certain other products, such as guarantees and derivatives.
Credit risk in the first half of 2018 The group has adopted the requirements of HKFRS 9 from 1 January 2018. Under HKFRS 9, the scope of impairment now covers amortised cost of financial assets, loan commitments and financial guarantees, as well as debt instruments measured at Fair Value through Other Comprehensive Income (‘FVOCI’). Impairment is calculated in three stages and financial instruments are allocated into one of the three stages where the transfer mechanism depends on whether there is a significant increase in credit risk between its first recognition and the relevant reporting period. After the allocation, the measurement of expected credit loss (‘ECL’), which is the product of probability of default (‘PD’), loss given default (‘LGD’) and exposure at default (‘EAD’), will reflect the change in risk of default occurring over the remaining life of the instruments.
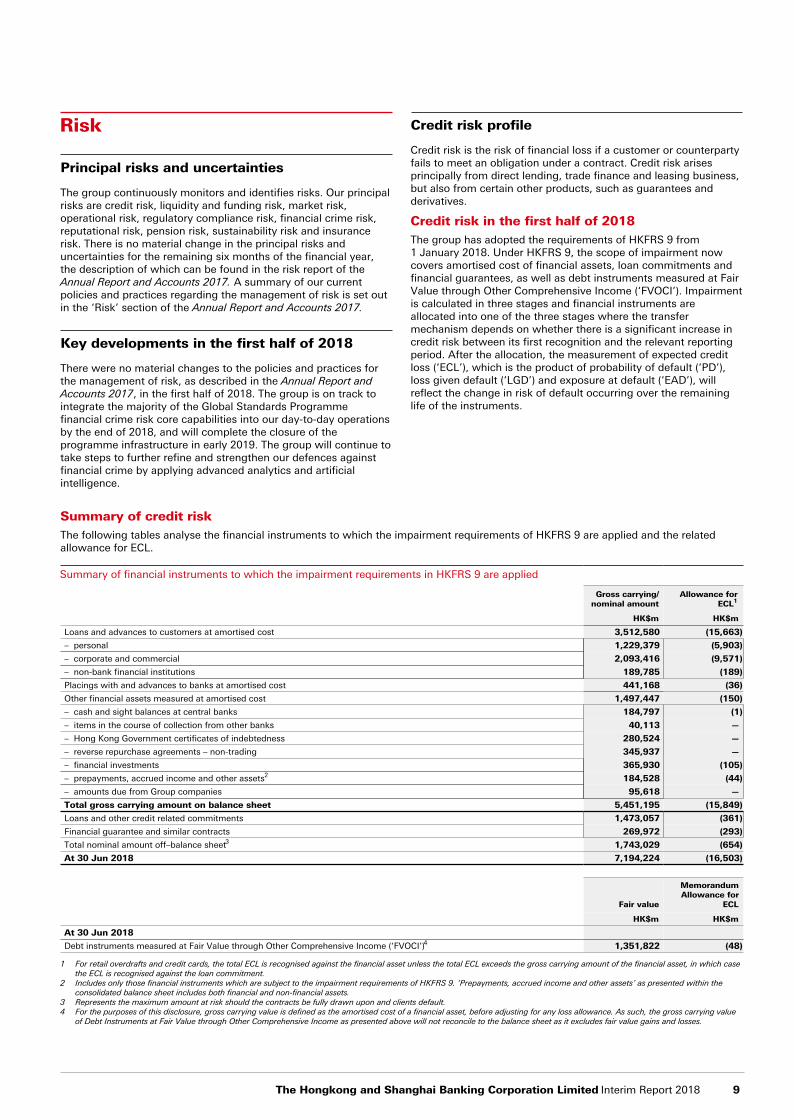
Summary of credit riskThe following tables analyse the financial instruments to which the impairment requirements of HKFRS 9 are applied and the related allowance for ECL.
Summary of financial instruments to which the impairment requirements in HKFRS 9 are applied
Gross carrying/nominal amount
Allowance for ECL1
HK$m HK$m
Loans and advances to customers at amortised cost 3,512,580 (15,663)
– personal 1,229,379 (5,903)
– corporate and commercial 2,093,416 (9,571)
– non-bank financial institutions 189,785 (189)
Placings with and advances to banks at amortised cost 441,168 (36)
Other financial assets measured at amortised cost 1,497,447 (150)
– cash and sight balances at central banks 184,797 (1)
– items in the course of collection from other banks 40,113 —
– Hong Kong Government certificates of indebtedness 280,524 —
– reverse repurchase agreements – non-trading 345,937 —
– financial investments 365,930 (105)
– prepayments, accrued income and other assets2 184,528 (44)
– amounts due from Group companies 95,618 —
Total gross carrying amount on balance sheet 5,451,195 (15,849)
Loans and other credit related commitments 1,473,057 (361)
Financial guarantee and similar contracts 269,972 (293)
Total nominal amount off–balance sheet3 1,743,029 (654)
At 30 Jun 2018 7,194,224 (16,503)
Fair value
MemorandumAllowance for
ECL
HK$m HK$m
At 30 Jun 2018
Debt instruments measured at Fair Value through Other Comprehensive Income (‘FVOCI’)4 1,351,822 (48)
1 For retail overdrafts and credit cards, the total ECL is recognised against the financial asset unless the total ECL exceeds the gross carrying amount of the financial asset, in which case the ECL is recognised against the loan commitment.
2 Includes only those financial instruments which are subject to the impairment requirements of HKFRS 9. ‘Prepayments, accrued income and other assets’ as presented within the consolidated balance sheet includes both financial and non-financial assets.
3 Represents the maximum amount at risk should the contracts be fully drawn upon and clients default.4 For the purposes of this disclosure, gross carrying value is defined as the amortised cost of a financial asset, before adjusting for any loss allowance. As such, the gross carrying value
of Debt Instruments at Fair Value through Other Comprehensive Income as presented above will not reconcile to the balance sheet as it excludes fair value gains and losses.

Risk
10 The Hongkong and Shanghai Banking Corporation Limited Interim Report 2018
Measurement uncertainty and sensitivityanalysis of ECL estimates
The recognition and measurement of expected credit loss (‘ECL’) is highly complex and involves the use of significant judgement and estimation. This includes the formulation and incorporation of multiple forward-looking economic conditions into the ECL estimates to meet the measurement objective of HKFRS 9.
MethodologyFor most portfolios, the group has adopted the use of three economic scenarios, representative of our view of forecast economic conditions, sufficient to calculate unbiased ECL. They represent a ‘most likely outcome’, (the Central scenario) and two, less likely, ‘outer’ scenarios on either side of the Central, referred to as an ‘Upside’ and a ‘Downside’ scenario respectively. Each outer scenario is consistent with a probability of 10%, while the Central scenario is assigned the remaining 80%. This weighting scheme is deemed appropriate for the computation of unbiased ECL. Key scenario assumptions are set using the average of forecasts from external economists, helping to ensure that the HKFRS 9 scenarios are unbiased and maximise the use of independent information.
For the Central scenario, the Group sets key assumptions – such as GDP growth, inflation, unemployment and policy rates – using either the average of external forecasts (commonly referred to as consensus forecasts) for most economies or market prices. An external provider’s global macro model, conditioned to follow the consensus forecasts, projects the other paths required as inputs to credit models. This external provider model is subject to HSBC’s risk governance framework, with oversight by a specialist internal unit.
The Upside and Downside scenarios are designed to be cyclical, in that GDP growth, inflation and unemployment usually revert back to the Central scenario after the first three years for major economies. The Group determine the maximum divergence of GDP growth from the Central scenario using the 10th and the 90th percentile of the entire distribution of forecast outcomes for major economies. Using externally available forecast distributions ensures independence in scenario construction. While key economic variables are set with reference to external distributional forecasts, the Group also align the overall narrative of the scenarios to the macroeconomic risks described in HSBC‘s top and emerging risks. This ensures that scenarios remain consistent with the more qualitative assessment of risks captured in top and emerging risks. The Group project additional variable paths using the external provider’s global macro model.
The Central, Upside and Downside scenarios selected with reference to external forecast distributions using the above approach are termed the ‘Consensus Economic Scenarios’.
The group apply the following to generate the three economic scenarios:
• Economic risk assessment – we develop a shortlist of the downside and upside economic and political risks most relevant to HSBC and the HKFRS 9 measurement objective. These risks include local and global economic and political risks which together affect economies that materially matter to HSBC, namely UK, eurozone, Hong Kong, mainland China and the US. We compile this list by monitoring developments in the global economy, by reference to HSBC’s top and emerging risks, and by consulting external and internal subject matter experts.
• Scenario generation – for the Central scenario, the group obtain a pre-defined set of economic forecasts from the average forecast taken from the consensus forecast survey of professional forecasters. Paths for the outer scenarios are benchmarked to the Central scenario and reflect the economic risk assessment. Scenario probabilities reflect management judgement and are informed by data analysis of past recessions, transitions in and out of recession, and the current economic outlook. The key assumptions made, and the accompanying paths, represent our ‘best estimate’ of a scenario at a specified probability. Suitable narratives are developed for the Central scenario and the paths of the outer scenarios.
• Variable enrichment – the group expand each scenario through enrichment of variables. This includes the production of more than 400 variables that are required to calculate ECL estimates. The external provider expands these scenarios by using as inputs the agreed scenario narratives and the variables aligned to these narratives. Scenarios, once expanded, continue to be benchmarked to the latest events and information. Late-breaking events could lead to revision of scenarios to reflect management judgement.
The Upside and Downside scenarios are generated at year end and are only updated during the year if economic conditions change significantly. The Central scenario is generated every quarter.
The group recognises that the Consensus Economic Scenario approach using three scenarios will be insufficient in certain economic environments. Additional analysis may be requested at management’s discretion, including the production of extra scenarios. We anticipate there will be only limited instances when the standard approach will not apply.

The Hongkong and Shanghai Banking Corporation Limited Interim Report 2018 11
The Central scenario
The group's Central scenario is characterised by steady growth over the forecast period 2018–2023. Global GDP growth is expected to be 3% on average over the period which is marginally higher than the average growth rate over 2011–2016. GDP growth rate is forecast at 3.2% in 2018 and 3.1% in 2019. The elevated growth rates through 2018–19 are considered temporary in nature, and global growth reverts to a trend rate of 2.9% by the third year of the five-year projection.
Across the key markets, we note that:
• Expected average rates of growth over the 2018–2023 period are lower than those experienced in the recent past for mainland China, suggesting a rebalancing at a pace in line with expectations.
• Hong Kong is expected to display similar average rates of GDP growth over the forecast period to recent historical experience, supported by cyclical factors.
Inflation is expected to be higher in 2018 across most of our key markets compared with 2017, but is expected to converge back towards central bank targets with varying speed over the projection period. Policy interest rates in advanced economies are expected to remain below their historical long-term averages over the five-year forecast horizon.
Unemployment rates displayed considerable positive cyclical momentum in 2017 across our key markets and such momentum is expected to continue to underpin labour market performance in the forecast period. Central scenario forecasts of the unemployment rate are stable and, for some markets, at historical lows.
Stabilisation of oil prices in 2017, helped by the Organization of Petroleum Exporting Countries’ output cuts and a fall in inventory, has enabled a stronger price outlook to develop. Despite this, Central scenario oil price expectations remain range-bound between US$60–US$62 per barrel over the forecast period.
Central scenario (average Q3 2018 – Q2 2023)
Hong KongMainland
China
GDP growth rate (%) 2.7 6.0
Inflation (%) 2.4 2.5
Unemployment (%) 3.2 4.0
Property price growth (%) 4.1 5.6
The Upside scenario
Globally, real GDP growth rises in the first two years of the Upside scenario before converging to the Central scenario. Improved confidence, accommodative monetary policy, fiscal expansion across major economies, including tax reform in the US and diminished political risk are the key themes that support the Upside scenario.
Upside scenario (average 2018-2022)
Hong KongMainland
China
GDP growth rate (%) 2.8 6.0
Inflation (%) 2.9 2.7
Unemployment (%) 3.2 3.7
Property price growth (%) 4.0 6.9
The Upside scenario was generated for HKFRS 9 adoption on 1 Jan 2018.
The Downside scenario
Globally, real GDP growth declines for two years in the Downside scenario before recovering to the Central scenario. Property price growth either stalls or contracts and equity markets correct abruptly. The global slowdown in demand drives commodity
prices lower and inflation falls. Central banks remain accommodative. This is consistent with the risk themes of rising protectionism, central bank policy uncertainty, mainland China choosing to rebalance at a faster pace, and an absence of fiscal support.
Downside scenario (average 2018-2022)
Hong KongMainland
China
GDP growth rate (%) 2.0 5.5
Inflation (%) 2.2 2.0
Unemployment (%) 3.8 4.2
Property price growth (%) 1.7 3.0
The Downside scenario was generated for HKFRS 9 adoption on 1Jan 2018.
How economic scenarios are reflected in the wholesale calculation of ECLHSBC has developed a globally consistent methodology for the application of forward economic guidance (‘FEG’) into the calculation of ECL. This involves the incorporation of FEG into the estimation of the term structure of probability of default (‘PD’) and loss given default (‘LGD’). For PDs, the group consider the correlation of FEG to default rates for a particular industry in a country. For LGD calculations we consider the correlation of FEG to collateral values and realisation rates for a particular country and industry. PDs and LGDs are estimated for the entire term structure of each instrument.
For stage 3 impaired loans, LGD estimates take into account independent recovery valuations provided by external consultants where available, or internal forecasts corresponding to anticipated economic conditions and individual company conditions. In estimating the ECL on impaired loans that are individually considered not to be significant, the group incorporates FEG via the application of a scalar. The scalar reflects the ratio of the probability-weighted outcome to the Central scenario outcome for non-stage 3 populations.
How economic scenarios are reflected in the retail calculation of ECLThe impact of FEG on PD is modelled at a portfolio level. Historic relationships between observed default rates and macroeconomic variables are integrated into HKFRS 9 ECL estimates by using economic response models. The impact of FEG on PD is modelled over a period equal to the remaining maturity of underlying asset(s). The impact on LGD is modelled for mortgage portfolios by forecasting future loan-to-value (‘LTV’) profiles for the remaining maturity of the asset, by using national-level forecasts of the property price index (‘PPI’) and applying the corresponding LGD expectation.
Effect of multiple economic scenarios on ECLThe ECL recognised in the financial statements (the ‘HKFRS 9 ECL’) reflects the effect on expected credit losses of a range of possible outcomes, calculated on a probability-weighted basis, based on the economic scenarios described above, including management overlays where required. The probability-weighted amount is typically a higher number than would result from using only the Central (most likely) economic scenario. Expected losses typically have a non-linear relationship to the many factors which influence credit losses, such that more favourable macroeconomic factors do not reduce defaults as much as less favourable macroeconomic factors increase defaults. The HKFRS 9 ECL is 1% higher than the ECL prepared using only Central Scenario assumptions, reflecting the relatively stable and benign economic outlook across most markets.

Risk
12 The Hongkong and Shanghai Banking Corporation Limited Interim Report 2018
Reconciliation of gross carrying/nominal amount and allowances for loans and advances to banks and customers including loancommitments and financial guarantees
Stage 1 Stage 2 Stage 3 POCI Total
Grosscarrying/nominalamount
Allowancefor ECL
Grosscarrying/nominalamount
Allowancefor ECL
Grosscarrying/nominalamount
Allowancefor ECL
Grosscarrying/nominalamount
Allowancefor ECL
Grosscarrying/nominalamount
Allowancefor ECL
HK$m HK$m HK$m HK$m HK$m HK$m HK$m HK$m HK$m HK$m
At 1 Jan 2018 5,040,175 (3,377) 314,074 (4,303) 18,167 (9,255) 1,231 (185) 5,373,647 (17,120)
Transfers of financialinstruments
– Transfers from Stage 1 toStage 2
(140,661) 355 140,661 (355) — — — — — —
– Transfers from Stage 2 toStage 1
159,701 (1,559) (159,701) 1,559 — — — — — —
– Transfers to Stage 3 (3,708) 8 (4,181) 509 7,889 (517) — — — —
– Transfers from Stage 3 156 (29) 979 (72) (1,135) 101 — — — —
– Net remeasurement of ECLarising from transfer ofstage — 910 — (892) — (77) — — — (59)
New financial assetsoriginated or purchased,assets derecognised,repayments and furtherlending 425,926 (516) (44,132) 538 (2,167) 1,166 (436) 12 379,191 1,200
Changes to risk parameters (model inputs) — 1,059 — (893) — (2,718) — (44) — (2,596)
Assets written off — — — — (1,985) 1,984 (4) 4 (1,989) 1,988
Foreign exchange and other (54,509) 90 675 34 (231) 107 (7) 3 (54,072) 234
At 30 Jun 2018 5,427,080 (3,059) 248,375 (3,875) 20,538 (9,209) 784 (210) 5,696,777 (16,353)
ECL income statement charge/(release) for the period (1,453) 1,247 1,629 32 1,455
Add: Recoveries — — (469) — (469)
Add/(less): Others (204) (28) 180 1 (51)
Total ECL income charge/(release) for the period (1,657) 1,219 1,340 33 935
The above table does not include balances due from Group companies.Movements within the same quarter are reported on a net basis, while movements between different quarters are reported on a gross basis. For Purchased or originated credit-impaired balances ('POCI'), the total amount of undiscounted ECL at initial recognition is nil.The contractual amount outstanding of financial assets written off during the period that are still subject to enforcement activities amounted to HK$1,701m.

The Hongkong and Shanghai Banking Corporation Limited Interim Report 2018 13
Credit quality of financial instrumentsThe following tables summarise the credit quality of the financial instruments that are subjected to HKFRS 9 impairment requirement by stages.
Distribution of financial instruments to which the impairment requirements in HKFRS 9 are applied, by credit quality and stage distribution
Gross carrying/notional amount
Allowancefor ECL NetStrong Good Satisfactory
Sub-standard
Creditimpaired Total
HK$m HK$m HK$m HK$m HK$m HK$m HK$m HK$m
Placings with and advances to banks at amortised cost 403,804 28,103 9,254 7 — 441,168 (36) 441,132
– stage 1 403,601 27,148 8,494 7 — 439,250 (30) 439,220
– stage 2 203 955 760 — — 1,918 (6) 1,912
– stage 3 — — — — — — — —
– POCI — — — — — — — —
Loans and advances to customers at amortised cost 1,800,513 901,398 768,290 22,722 19,657 3,512,580 (15,663) 3,496,917
– stage 1 1,794,323 854,887 645,163 4,123 — 3,298,496 (2,700) 3,295,796
– stage 2 6,190 46,511 123,127 18,402 — 194,230 (3,745) 190,485
– stage 3 — — — — 19,070 19,070 (9,008) 10,062
– POCI — — — 197 587 784 (210) 574
Other financial assets measured at amortised cost 1,200,478 101,523 99,211 540 77 1,401,829 (150) 1,401,679
– stage 1 1,200,360 100,470 95,935 91 — 1,396,856 (138) 1,396,718
– stage 2 118 1,053 3,276 448 — 4,895 (12) 4,883
– stage 3 — — — — 77 77 — 77
– POCI — — — 1 — 1 — 1
Loan and other credit-related commitments 1,046,717 275,953 147,512 2,747 128 1,473,057 (361) 1,472,696
– stage 1 1,044,316 268,443 136,271 1,259 — 1,450,289 (285) 1,450,004
– stage 2 2,401 7,510 11,241 1,488 — 22,640 (76) 22,564
– stage 3 — — — — 128 128 — 128
– POCI — — — — — — — —
Financial guarantees and similar contracts 104,900 98,162 61,544 4,026 1,340 269,972 (293) 269,679
– stage 1 102,613 89,611 46,427 394 — 239,045 (44) 239,001
– stage 2 2,287 8,551 15,117 3,632 — 29,587 (48) 29,539
– stage 3 — — — — 1,340 1,340 (201) 1,139
– POCI — — — — — — — —
At 30 Jun 2018 4,556,412 1,405,139 1,085,811 30,042 21,202 7,098,606 (16,503) 7,082,103
Debt instruments at FVOCI1 1,272,764 63,439 19,690 — — 1,355,893 (48) 1,355,845
– stage 1 1,272,706 63,439 19,689 — — 1,355,834 (46) 1,355,788
– stage 2 58 — 1 — — 59 (2) 57
– stage 3 — — — — — — — —
– POCI — — — — — — — —
At 30 Jun 2018 1,272,764 63,439 19,690 — — 1,355,893 (48) 1,355,845
The above table does not include balances due from Group companies.1 For the purposes of this disclosure, gross carrying value is defined as the amortised cost of a financial asset, before adjusting for any loss allowance. As such the gross carrying value
of debt instruments at FVOCI as presented above will not reconcile to the balance sheet as it excludes fair value gains and losses.
Quality classification definitions‘Strong’ exposures demonstrate a strong capacity to meet financial commitments, with negligible or low probability of default.‘Good’ exposures demonstrate a good capacity to meet financial commitments, with low default risk. ‘Satisfactory’ exposures require closer monitoring and demonstrate an average to fair capacity to meet financial commitments, with moderate default risk.‘Sub-standard’ exposures require varying degrees of special attention and default risk is of greater concern.‘Credit-impaired’ exposures have been assessed as impaired.
The five credit quality classifications defined above each encompass a range of granular internal credit rating grades assigned to wholesale and retail lending businesses and the external ratings attributed by external agencies to debt securities, as shown in the table below. Under HKAS 39 retail lending credit quality was disclosed based on expected-loss percentages. Under HKFRS 9 retail lending credit quality is now disclosed based on a 12-month probability-weighted PD. The credit quality classifications for wholesale lending are unchanged and are based on internal credit risk ratings.
Credit quality classification
Debt securitiesand other bills Wholesale lending Retail lending
Externalcredit rating
Internalcredit rating
12-month Basel probability of
default %Internal
credit rating
12-monthprobability-
weighted PD %
Quality classification
Strong A- and above CRR1 to CRR2 0.000–0.169 Band 1 and 2 0.000–0.500
Good BBB+ to BBB- CRR3 0.170–0.740 Band 3 0.501–1.500
SatisfactoryBB+ to B and
unrated CRR4 to CRR5 0.741–4.914 Band 4 and 5 1.501–20.000
Sub-standard B- to C CRR6 to CRR8 4.915–99.999 Band 6 20.001–99.999
Credit-impaired Default CRR9 to CRR10 100.000 Band 7 100.000

Capital Overview
14 The Hongkong and Shanghai Banking Corporation Limited Interim Report 2018
Capital OverviewThe following tables show the capital ratios, risk-weighted assets (‘RWAs’) and capital base on a consolidated basis, in accordance with the Banking (Capital) Rules:
Capital ratios and RWAs
At
30 Jun 31 Dec
2018 2017
% %
Capital ratios (transitional basis)
Common equity tier 1 (‘CET1’) ratio 15.4 15.9
Tier 1 ratio 16.7 17.0
Total capital ratio 19.0 18.9
HK$m HK$m
RWAs 2,785,568 2,758,609
The following table sets out the composition of the group’s capital base under Basel III at 30 June 2018. The position at 30 June 2018 benefits from transitional arrangements which will be phased out.
Capital base
At
30 Jun 31 Dec
2018 2017
HK$m HK$m
Common equity tier 1 (‘CET1’) capital
Shareholders’ equity 618,285 610,307
– shareholders’ equity per balance sheet 705,100 696,480
– revaluation reserve capitalisation issue (1,454) (1,454)
– other equity instruments (14,737) (14,737)
– unconsolidated subsidiaries (70,624) (69,982)
Non-controlling interests 25,398 24,416
– non-controlling interests per balance sheet 57,802 56,506
– non-controlling interests in unconsolidated subsidiaries (8,946) (8,590)
– surplus non-controlling interests disallowed in CET1 (23,458) (23,500)
Regulatory deductions to CET1 capital (215,105) (196,030)
– valuation adjustments (1,647) (1,485)
– goodwill and intangible assets (15,815) (15,347)
– deferred tax assets net of deferred tax liabilities (2,516) (2,237)
– cash flow hedging reserve 142 135
– changes in own credit risk on fair valued liabilities 573 (183)
– defined benefit pension fund assets (81) (79)
– significant capital investments in unconsolidated financial sector entities (104,182) (86,046)
– property revaluation reserves1 (65,718) (63,085)
– regulatory reserve (25,861) (27,703)
Total CET1 capital 428,578 438,693
Additional tier 1 (‘AT1’) capital
Total AT1 capital before regulatory deductions 35,959 39,203
– perpetual subordinated loans 14,737 14,737
– perpetual non-cumulative preference shares 19,446 19,367
– allowable non-controlling interests in AT1 capital 1,776 5,099
Regulatory deductions to AT1 capital — (9,875)
– significant capital investments in unconsolidated financial sector entities — (9,875)
Total AT1 capital 35,959 29,328
Total tier 1 capital 464,537 468,021
Tier 2 capital
Total tier 2 capital before regulatory deductions 69,083 67,874
– perpetual cumulative preference shares 1,570 1,563
– perpetual subordinated debt 3,139 3,126
– term subordinated debt 17,893 18,418
– property revaluation reserves1 30,227 29,043
– impairment allowances and regulatory reserve eligible for inclusion in tier 2 capital 16,254 15,724
Regulatory deductions to tier 2 capital (3,772) (13,651)
– significant capital investments in unconsolidated financial sector entities (3,772) (13,651)
Total tier 2 capital 65,311 54,223
Total capital 529,848 522,244
1 Includes the revaluation surplus on investment properties which is reported as part of retained earnings and adjustments made in accordance with the Banking (Capital) Rules issued by the HKMA.

The Hongkong and Shanghai Banking Corporation Limited Interim Report 2018 15
The following table shows the pro-forma Basel III end point basis position once all transitional arrangements have been phased out. It should be noted that the pro-forma Basel III end point basis position takes no account of, for example, any future profits or management actions. In addition, the current regulations or their application may change before full implementation.
Reconciliation of regulatory capital from transitional basis to a pro-forma Basel III end point basis
At
30 Jun 31 Dec
2018 2017
HK$m HK$m
CET1 capital on a transitional basis 428,578 438,693
Transitional provisions: Significant capital investments in unconsolidated financial sector entities — (19,750)
CET1 capital end point basis 428,578 418,943
AT1 capital on a transitional basis 35,959 29,328
Grandfathered instruments: Perpetual non-cumulative preference shares (19,446) (19,367)
Transitional provisions: — 6,406
– allowable non-controlling interests in AT1 capital — (3,469)
– significant capital investments in unconsolidated financial sector entities — 9,875
AT1 capital end point basis 16,513 16,367
Tier 2 capital on a transitional basis 65,311 54,223
Grandfathered instruments: (4,709) (5,287)
– perpetual cumulative preference shares (1,570) (1,563)
– perpetual subordinated debt (3,139) (3,126)
– term subordinated debt — (598)
Transitional provisions: Significant capital investments in unconsolidated financial sector entities — 9,875
Tier 2 capital end point basis 60,602 58,811

Statement of Directors' Responsibilities | Independent Review Report by PricewaterhouseCoopers
16 The Hongkong and Shanghai Banking Corporation Limited Interim Report 2018
Statement of Directors’ ResponsibilitiesThe Directors, the names of whom are set out below, confirm to the best of their knowledge that:
• the interim condensed consolidated financial statements have been prepared in accordance with Hong Kong Accounting Standard (‘HKAS’) 34 ‘Interim Financial Reporting’; and
• the interim report includes a fair review of the information required by DTR4.2.7R of the Disclosure Guidance and Transparency Rules issued by the UK Financial Conduct Authority, being an indication of important events that have occurred during the first six months of the financial year ending 31 December 2018 and their impact on the interim condensed consolidated financial statements; and a description of the principal risks and uncertainties for the remaining six months of the financial year.
John Michael Flint# (Chairman);
Peter Tung Shun Wong (Deputy Chairman & Chief Executive);
Laura May Lung Cha*, GBM (Deputy Chairman);
Zia Mody* (Deputy Chairman);
Graham John Bradley*;
Louisa Wai Wan Cheang, Chief Executive of Hang Seng Bank Limited;
Dr Christopher Wai Chee Cheng*, GBS, OBE;
Dr Raymond Kuo Fung Ch’ien*, GBS, CBE;
Yiu Kwan Choi*;
Irene Yun-lien Lee*;
Jennifer Xinzhe Li*;
Victor Tzar Kuoi Li#;
Bin Hwee Quek (née Chua)*, JP
Kevin Anthony Westley*, BBS;
Marjorie Mun Tak Yang*, GBS;
Tan Sri Dr Francis Sock Ping Yeoh*, CBE
* independent non-executive Director# non-executive Director
On behalf of the Board
John Flint
Chairman
6 August 2018

The Hongkong and Shanghai Banking Corporation Limited Interim Report 2018 17
Independent Review Report by PricewaterhouseCoopers
Report on Review of Interim Financial Information to the Board of Directors of The Hongkong and Shanghai Banking Corporation Limited
IntroductionWe have reviewed the interim condensed consolidated financial statements set out on pages 18 to 43, which comprises the consolidated balance sheet of The Hongkong and Shanghai Banking Corporation Limited (the ‘Bank’) and its subsidiaries (together, the ‘group’) as at 30 June 2018 and the related consolidated income statement, consolidated statement of comprehensive income, consolidated statement of changes in equity and consolidated statement of cash flows for the six-month period then ended, and a summary of significant accounting policies and other explanatory notes. The directors of the Bank are responsible for the preparation and presentation of the interim condensed consolidated financial statements in accordance with Hong Kong Accounting Standard 34 ‘Interim Financial Reporting’ issued by the Hong Kong Institute of Certified Public Accountants and the Disclosure Guidance and Transparency Rules of the United Kingdom’s Financial Conduct Authority. Our responsibility is to express a conclusion on the interim condensed consolidated financial statements based on our review and to report our conclusion solely to you, as a body, in accordance with our agreed terms of engagement and for no other purpose. We do not assume responsibility towards or accept liability to any other person for the contents of this report.
Scope of ReviewWe conducted our review in accordance with International Standard on Review Engagements (UK and Ireland) 2410, ‘Review of Interim Financial Information Performed by the Independent Auditor of the Entity’ issued by the United Kingdom’s Auditing Practices Board. A review of interim financial information consists of making inquiries, primarily of persons responsible for financial and accounting matters, and applying analytical and other review procedures.
A review is substantially less in scope than an audit conducted in accordance with International Standards on Auditing (UK and Ireland) and consequently does not enable us to obtain assurance that we would become aware of all significant matters that might be identified in an audit. Accordingly, we do not express an audit opinion.
ConclusionBased on our review, nothing has come to our attention that causes us to believe that the interim condensed consolidated financial statements are not prepared, in all material respects, in accordance with Hong Kong Accounting Standard 34 ‘Interim Financial Reporting’ and the Disclosure Guidance and Transparency Rules of the United Kingdom’s Financial Conduct Authority.
PricewaterhouseCoopers
Certified Public Accountants
Hong Kong
6 August 2018

Interim Condensed Consolidated Financial Statements (unaudited)
18 The Hongkong and Shanghai Banking Corporation Limited Interim Report 2018
Interim Condensed Consolidated Financial Statements
Consolidated income statement
Half-year to
30 Jun 30 Jun
2018 2017
HK$m HK$m
Net interest income 61,351 52,576
– interest income 79,476 65,794
– interest expense (18,125) (13,218)
Net fee income 24,422 21,380
– fee income 29,556 25,451
– fee expense (5,134) (4,071)
Net income from financial instruments measured at fair value 14,698 20,586
Gains less losses from financial investments 290 601
Dividend income 8 33
Net insurance premium income 32,858 27,383
Other operating income 5,170 3,589
Total operating income 138,797 126,148
Net insurance claims and benefits paid and movement in liabilities to policyholders (32,570) (33,928)
Net operating income before change in expected credit losses and other credit risk provisions 106,227 92,220
Change in expected credit losses and other credit impairment charges (909) N/A
Loan impairment charges and other credit risk provisions N/A (3,483)
Net operating income 105,318 88,737
Total operating expenses (42,882) (38,604)
Employee compensation and benefits (20,858) (20,065)
General and administrative expenses (18,840) (15,542)
Depreciation of property, plant and equipment (2,336) (2,295)
Amortisation and impairment of intangible assets (848) (702)
Operating profit 62,436 50,133
Share of profit in associates and joint ventures 8,577 7,245
Profit before tax 71,013 57,378
Tax expense (12,495) (10,203)
Profit for the period 58,518 47,175
Profit attributable to shareholders of the parent company 53,759 43,443
Profit attributable to non-controlling interests 4,759 3,732
The Hongkong and Shanghai Banking Corporation Limited Interim Report 2018 19
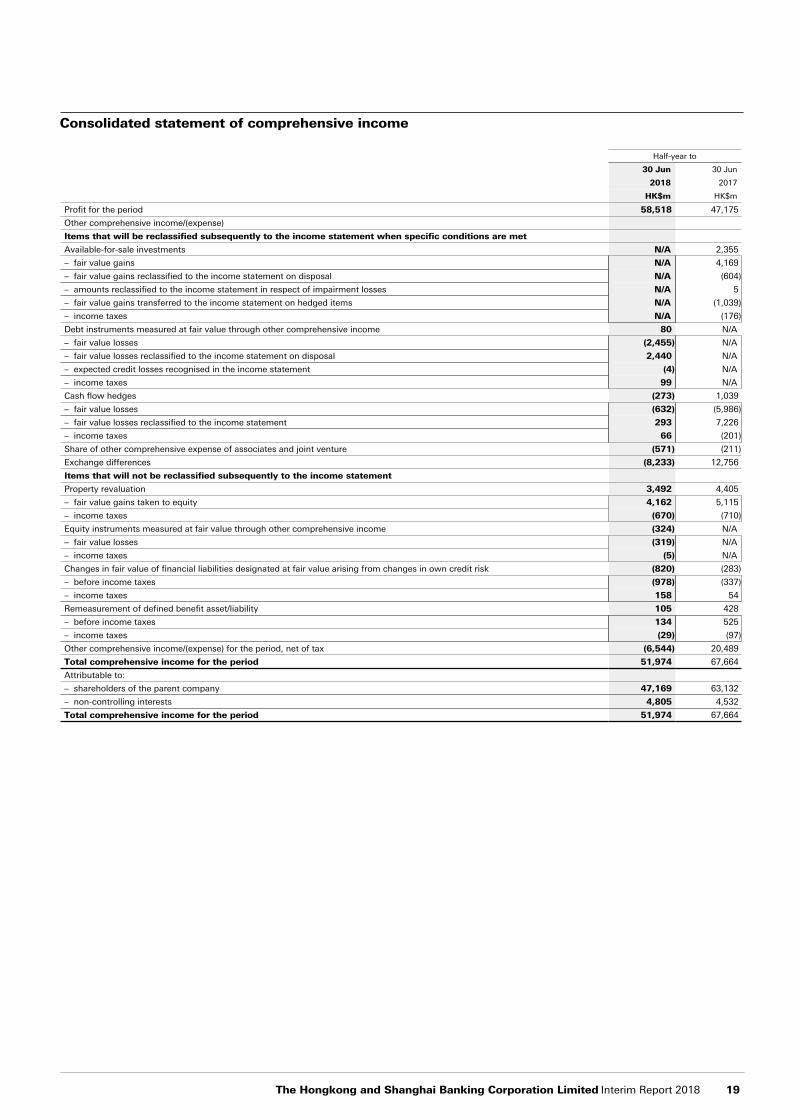
Consolidated statement of comprehensive income
Half-year to
30 Jun 30 Jun
2018 2017
HK$m HK$m
Profit for the period 58,518 47,175
Other comprehensive income/(expense)
Items that will be reclassified subsequently to the income statement when specific conditions are met
Available-for-sale investments N/A 2,355
– fair value gains N/A 4,169
– fair value gains reclassified to the income statement on disposal N/A (604)
– amounts reclassified to the income statement in respect of impairment losses N/A 5
– fair value gains transferred to the income statement on hedged items N/A (1,039)
– income taxes N/A (176)
Debt instruments measured at fair value through other comprehensive income 80 N/A
– fair value losses (2,455) N/A
– fair value losses reclassified to the income statement on disposal 2,440 N/A
– expected credit losses recognised in the income statement (4) N/A
– income taxes 99 N/A
Cash flow hedges (273) 1,039
– fair value losses (632) (5,986)
– fair value losses reclassified to the income statement 293 7,226
– income taxes 66 (201)
Share of other comprehensive expense of associates and joint venture (571) (211)
Exchange differences (8,233) 12,756
Items that will not be reclassified subsequently to the income statement
Property revaluation 3,492 4,405
– fair value gains taken to equity 4,162 5,115
– income taxes (670) (710)
Equity instruments measured at fair value through other comprehensive income (324) N/A
– fair value losses (319) N/A
– income taxes (5) N/A
Changes in fair value of financial liabilities designated at fair value arising from changes in own credit risk (820) (283)
– before income taxes (978) (337)
– income taxes 158 54
Remeasurement of defined benefit asset/liability 105 428
– before income taxes 134 525
– income taxes (29) (97)
Other comprehensive income/(expense) for the period, net of tax (6,544) 20,489
Total comprehensive income for the period 51,974 67,664
Attributable to:
– shareholders of the parent company 47,169 63,132
– non-controlling interests 4,805 4,532
Total comprehensive income for the period 51,974 67,664

Interim Condensed Consolidated Financial Statements (unaudited)
20 The Hongkong and Shanghai Banking Corporation Limited Interim Report 2018
Consolidated balance sheet
At
30 Jun 31 Dec
2018 2017
Notes HK$m HK$m
Assets
Cash and sight balances at central banks 184,796 208,073
Items in the course of collection from other banks 40,113 25,714
Hong Kong Government certificates of indebtedness 280,524 267,174
Trading assets 512,139 496,434
Derivatives 4 337,300 300,243
Financial assets designated and otherwise mandatorily measured at fair value 134,140 N/A
Financial assets designated at fair value N/A 122,646
Reverse repurchase agreements – non-trading 345,937 330,890
Placings with and advances to banks 441,132 433,005
Loans and advances to customers 5 3,496,917 3,328,980
Financial investments 6 1,723,754 1,720,873
Amounts due from Group companies 158,636 227,729
Interests in associates and joint ventures 7 144,193 144,717
Goodwill and intangible assets 62,931 59,865
Property, plant and equipment 119,181 116,336
Deferred tax assets 2,463 2,156
Prepayments, accrued income and other assets 8 254,711 158,511
Total assets 8,238,867 7,943,346
Liabilities
Hong Kong currency notes in circulation 280,524 267,174
Items in the course of transmission to other banks 49,317 38,283
Repurchase agreements – non-trading 60,991 47,170
Deposits by banks 208,402 201,697
Customer accounts 10 5,152,524 5,138,272
Trading liabilities 101,439 231,365
Derivatives 4 328,073 309,353
Financial liabilities designated at fair value 184,447 49,278
Debt securities in issue 46,962 38,394
Retirement benefit liabilities 2,128 2,222
Amounts due to Group companies 339,152 265,688
Accruals and deferred income, other liabilities and provisions 9 206,717 110,687
Liabilities under insurance contracts 456,920 438,017
Current tax liabilities 8,622 3,242
Deferred tax liabilities 24,520 24,391
Subordinated liabilities 4,111 4,090
Preference shares 21,116 21,037
Total liabilities 7,475,965 7,190,360
Equity
Share capital 151,360 151,360
Other equity instruments 14,737 14,737
Other reserves 115,033 123,417
Retained earnings 423,970 406,966
Total shareholders’ equity 705,100 696,480
Non-controlling interests 57,802 56,506
Total equity 762,902 752,986
Total equity and liabilities 8,238,867 7,943,346
The Hongkong and Shanghai Banking Corporation Limited Interim Report 2018 21
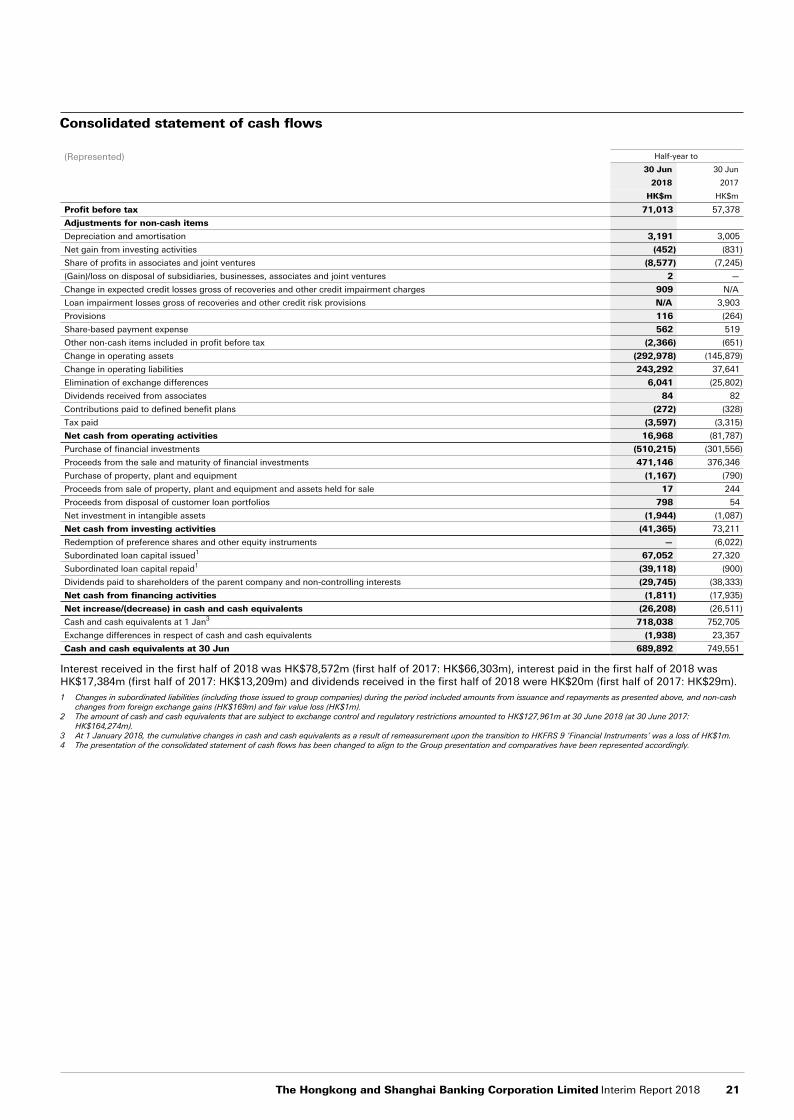
Consolidated statement of cash flows
(Represented) Half-year to
30 Jun 30 Jun
2018 2017
HK$m HK$m
Profit before tax 71,013 57,378
Adjustments for non-cash items
Depreciation and amortisation 3,191 3,005
Net gain from investing activities (452) (831)
Share of profits in associates and joint ventures (8,577) (7,245)
(Gain)/loss on disposal of subsidiaries, businesses, associates and joint ventures 2 —
Change in expected credit losses gross of recoveries and other credit impairment charges 909 N/A
Loan impairment losses gross of recoveries and other credit risk provisions N/A 3,903
Provisions 116 (264)
Share-based payment expense 562 519
Other non-cash items included in profit before tax (2,366) (651)
Change in operating assets (292,978) (145,879)
Change in operating liabilities 243,292 37,641
Elimination of exchange differences 6,041 (25,802)
Dividends received from associates 84 82
Contributions paid to defined benefit plans (272) (328)
Tax paid (3,597) (3,315)
Net cash from operating activities 16,968 (81,787)
Purchase of financial investments (510,215) (301,556)
Proceeds from the sale and maturity of financial investments 471,146 376,346
Purchase of property, plant and equipment (1,167) (790)
Proceeds from sale of property, plant and equipment and assets held for sale 17 244
Proceeds from disposal of customer loan portfolios 798 54
Net investment in intangible assets (1,944) (1,087)
Net cash from investing activities (41,365) 73,211
Redemption of preference shares and other equity instruments — (6,022)
Subordinated loan capital issued1 67,052 27,320
Subordinated loan capital repaid1 (39,118) (900)
Dividends paid to shareholders of the parent company and non-controlling interests (29,745) (38,333)
Net cash from financing activities (1,811) (17,935)
Net increase/(decrease) in cash and cash equivalents (26,208) (26,511)
Cash and cash equivalents at 1 Jan3 718,038 752,705
Exchange differences in respect of cash and cash equivalents (1,938) 23,357
Cash and cash equivalents at 30 Jun 689,892 749,551
Interest received in the first half of 2018 was HK$78,572m (first half of 2017: HK$66,303m), interest paid in the first half of 2018 was HK$17,384m (first half of 2017: HK$13,209m) and dividends received in the first half of 2018 were HK$20m (first half of 2017: HK$29m).1 Changes in subordinated liabilities (including those issued to group companies) during the period included amounts from issuance and repayments as presented above, and non-cash
changes from foreign exchange gains (HK$169m) and fair value loss (HK$1m).2 The amount of cash and cash equivalents that are subject to exchange control and regulatory restrictions amounted to HK$127,961m at 30 June 2018 (at 30 June 2017:
HK$164,274m).3 At 1 January 2018, the cumulative changes in cash and cash equivalents as a result of remeasurement upon the transition to HKFRS 9 ‘Financial Instruments’ was a loss of HK$1m.4 The presentation of the consolidated statement of cash flows has been changed to align to the Group presentation and comparatives have been represented accordingly.

Interim Condensed Consolidated Financial Statements (unaudited)
22 The Hongkong and Shanghai Banking Corporation Limited Interim Report 2018
Consolidated statement of changes in equity
Half-year to 30 Jun 2018
Other reserves
Sharecapital
Otherequityinstru-ments
Retainedearnings
Propertyrevaluation
reserve
Financial assets at
FVOCIreserve6
Cash flow
hedgereserve
Foreignexchange
reserve Other1
Totalshare-
holders’equity
Non- controlling
interestsTotal
equity
HK$m HK$m HK$m HK$m HK$m HK$m HK$m HK$m HK$m HK$m HK$m
At 31 Dec 2017 151,360 14,737 406,966 58,381 6,825 (197) (6,948) 65,356 696,480 56,506 752,986
Impact on transition to HKFRS 9 — — (7,478) — (4,512) — — — (11,990) (323) (12,313)
At 1 Jan 2018 151,360 14,737 399,488 58,381 2,313 (197) (6,948) 65,356 684,490 56,183 740,673
Profit for the period — — 53,759 — — — — — 53,759 4,759 58,518
Other comprehensive income/(expense) (net of tax) — — (680) 3,142 (675) (250) (8,117) (10) (6,590) 46 (6,544)
– debt instruments measured at fairvalue through othercomprehensive income — — — — 34 — — — 34 46 80
– equity instruments measured atfair value through othercomprehensive income — — — — (151) — — — (151) (173) (324)
– cash flow hedges — — — — — (250) — — (250) (23) (273)
– changes in fair value of financialliabilities designated at fair valuearising from changes in owncredit risk — — (816) — — — — — (816) (4) (820)
– property revaluation — — — 3,142 — — — — 3,142 350 3,492
– actuarial gains/(losses) on definedbenefit asset/liability — — 139 — — — — — 139 (34) 105
– share of other comprehensiveexpense of associates and jointventures — — (3) — (558) — — (10) (571) — (571)
Exchange differences — — — — — — (8,117) — (8,117) (116) (8,233)
Total comprehensive income/(expense) for the period — — 53,079 3,142 (675) (250) (8,117) (10) 47,169 4,805 51,974
Dividends paid — — (26,559) — — — — — (26,559) (3,186) (29,745)
Movement in respect of share-based payment arrangements — — (146) — — — — 69 (77) — (77)
Transfers and other movements4 — — (1,892) (664) — — — 2,633 77 — 77
At 30 Jun 2018 151,360 14,737 423,970 60,859 1,638 (447) (15,065) 68,048 705,100 57,802 762,902
Half-year to 30 Jun 2017
Other reserves
Sharecapital
Otherequityinstru-ments
Retainedearnings
Propertyrevaluation
reserve
Available- for-sale
investmentreserve
Cash flow
hedgereserve
Foreignexchange
reserve Other1
Totalshare-
holders’equity
Non- controlling
interestsTotal
equity
HK$m HK$m HK$m HK$m HK$m HK$m HK$m HK$m HK$m HK$m HK$m
At 1 Jan 2017 114,359 14,737 413,024 53,763 6,189 (793) (31,861) 58,588 628,006 51,130 679,136
Profit for the period –– –– 43,443 –– –– –– –– –– 43,443 3,732 47,175
Other comprehensive income (netof tax) –– –– 96 4,077 1,795 975 12,571 175 19,689 800 20,489
– available-for-sale investments –– –– –– –– 2,187 –– –– –– 2,187 168 2,355
– cash flow hedges –– –– –– –– –– 975 –– –– 975 64 1,039
– changes in fair value of financialliabilities designated at fair valuearising from changes in owncredit risk –– –– (281) –– –– –– –– –– (281) (2) (283)
– property revaluation –– –– –– 4,077 –– –– –– –– 4,077 328 4,405
– actuarial gains on defined benefitasset/liability –– –– 371 –– –– –– –– –– 371 57 428
– share of other comprehensiveincome/(expense) of associatesand joint ventures –– –– 6 –– (392) –– –– 175 (211) –– (211)
– exchange differences –– –– –– –– –– –– 12,571 –– 12,571 185 12,756
Total comprehensive income for theperiod –– –– 43,539 4,077 1,795 975 12,571 175 63,132 4,532 67,664
Dividends paid –– –– (35,438) –– –– –– –– –– (35,438) (2,895) (38,333)
Movement in respect of share-based payment arrangements –– –– (23) –– –– –– –– (25) (48) (3) (51)
Transfers and other movements3,4 35,257 –– (36,602) (702) –– –– –– 2,070 23 49 72
At 30 Jun 2017 149,616 14,737 384,500 57,138 7,984 182 (19,290) 60,808 655,675 52,813 708,488

The Hongkong and Shanghai Banking Corporation Limited Interim Report 2018 23
Consolidated statement of changes in equity (continued)
Half-year to 31 Dec 2017
Other reserves
Sharecapital
Otherequity
instrumentsRetainedearnings
Propertyrevaluation
reserve
Available- for-sale
investmentreserve
Cash flow
hedgereserve
Foreignexchange
reserve Other1
Totalshare-
holders’equity
Non- controlling
interestsTotal
equity
HK$m HK$m HK$m HK$m HK$m HK$m HK$m HK$m HK$m HK$m HK$m
At 1 Jul 2017 149,616 14,737 384,500 57,138 7,984 182 (19,290) 60,808 655,675 52,813 708,488
Profit for the period –– –– 45,087 –– –– –– –– –– 45,087 3,756 48,843
Other comprehensive income/(expense) (net of tax) –– –– 880 4,067 (1,159) (379) 12,342 (231) 15,520 768 16,288
– available-for-sale investments –– –– –– –– (765) –– –– –– (765) 19 (746)
– cash flow hedges –– –– –– –– –– (379) –– –– (379) (53) (432)
– changes in fair value of financialliabilities designated at fair valuearising from changes in owncredit risk –– –– 74 –– –– –– –– –– 74 –– 74
– property revaluation –– –– –– 4,067 –– –– –– –– 4,067 392 4,459
– actuarial gains on defined benefitasset/liability –– –– 822 –– –– –– –– –– 822 121 943
– share of other comprehensiveexpense of associates and jointventures –– –– (16) –– (394) –– –– (231) (641) –– (641)
– exchange differences –– –– –– –– –– –– 12,342 –– 12,342 289 12,631
Total comprehensive income/(expense) for the period –– –– 45,967 4,067 (1,159) (379) 12,342 (231) 60,607 4,524 65,131
Shares issued 1,744 –– –– –– –– –– –– –– 1,744 – 1,744
Dividends paid2 –– –– (20,822) –– –– –– –– –– (20,822) (1,737) (22,559)
Movement in respect of share-based payment arrangements –– –– (50) –– –– –– –– (299) (349) (6) (355)
Transfers and other movements4,5 –– –– (2,629) (2,824) –– –– –– 5,078 (375) 912 537
At 31 Dec 2017 151,360 14,737 406,966 58,381 6,825 (197) (6,948) 65,356 696,480 56,506 752,986
1 The other reserves mainly comprise share of associates’ other reserves, purchase premium arising from transfer of business from fellow subsidiaries and the share-based payment reserve. The share-based payment reserve is used to record the amount relating to share awards and options granted to employees of the group directly by HSBC Holdings plc.
2 Including distributions paid on perpetual subordinated loans classified as equity under HKFRS.3 In the first half of 2017, the Bank redeemed US$775m (HK$6,022m) of preference shares which were classified as a financial liability in the consolidated balance sheet. The
redemption was made by a payment out of distributable profits. The amount of preference shares has been credited to share capital with a corresponding adjustment to retained earnings in accordance with the capital maintenance requirements of the Companies Ordinance. In 2013, the Bank redeemed US$3,745m (HK$29,235m) of preference shares in the same manner. This amount was also credited to share capital with a corresponding adjustment to retained earnings in accordance with the capital maintenance requirements of the Companies Ordinance. The total amount credited to share capital with a corresponding adjustment to retained earnings in the first half of 2017 in respect of these transactions was HK$35,257m. This amount is non-distributable.
4 The movement from retained earnings to other reserves includes the relevant transfers in associates according to local regulatory requirements.5 The movement from property revaluation reserve to other reserve included HK$2,100m relating to transfer of properties to a fellow subsidiary as part of the Recovery and Resolution
Plan as set out in the Report of Directors in the Annual Report and Accounts 2017.6 The balance at 31 December 2017 represents the HKAS 39 Available-for-sale fair value reserve as at 31 December 2017.

Notes on the Interim Condensed Consolidated Financial Statements (unaudited)
24 The Hongkong and Shanghai Banking Corporation Limited Interim Report 2018
Notes on the Interim Condensed Consolidated Financial Statements
1 Basis of preparation and significant accounting policies
(a) Compliance with Hong Kong Financial Reporting StandardsThe interim condensed consolidated financial statements of the group have been prepared in accordance with HKAS 34 ‘Interim Financial Reporting’ as issued by the Hong Kong Institute of Certified Public Accountants (‘HKICPA’). These financial statements should be read in conjunction with the Annual Report and Accounts 2017.
Standards applied during the half-year to 30 June 2018
The group has adopted the requirements of HKFRS 9 'Financial Instruments' from 1 January 2018, with the exception of the provisions relating to the presentation of gains and losses on financial liabilities designated at fair value, which were adopted from 1 January 2017. This includes the adoption of ‘Prepayment Features with Negative Compensation (Amendments to HKFRS 9)’ which is effective for annual periods beginning on or after 1 January 2019 with early adoption permitted. The effect of its adoption is not considered to be significant. HKFRS 9 includes an accounting policy choice to remain with HKAS 39 hedge accounting, which the group has exercised. The classification and measurement and impairment requirements are applied retrospectively by adjusting the opening balance sheet at the date of initial application. As permitted by HKFRS 9, the group has not restated comparatives. Adoption reduced net assets at 1 January 2018 by HK$12,313m as set out in note 2.
The effect of HKFRS 9 on the carrying value of investments in associates has been included and this has resulted in a reduction in net assets of HK$5,023m from the previously disclosed impact.
In addition, the group has adopted the requirements of HKFRS 15 ‘Revenue from Contracts with Customers’ and a number of interpretations and amendments to standards which have had an insignificant effect on the consolidated financial statements of the group.
HKFRS 9 transitional requirements
The transition requirements of HKFRS 9 have necessitated a review of the designation of financial instruments at fair value. HKFRS 9 requires that the designation is revoked where there is no longer an accounting mismatch at 1 January 2018 and permits designations to be revoked or additional designations created at 1 January 2018 if there are accounting mismatches on that date. As a result, fair value designations for financial liabilities have been revoked where the accounting mismatch no longer exists, as required by HKFRS 9. The results of these changes are included in the reconciliation set out in note 2.
The group has been able to use reasonable and supportable information to determine the credit risk at initial recognition of financial assets, particularly wholesale loans. Therefore we have not relied on the transitional provisions for determination of whether there has been a significant increase in credit risk since initial recognition.
Changes in accounting policy
While not necessarily required by the adoption of HKFRS 9, the following voluntary changes in accounting policy and presentation have been made as a result of reviews carried out in conjunction with its adoption. The effect of presentational changes at 1 January 2018 is included in the reconciliation in note 2 and comparatives have not been restated.
• We have considered market practices for the presentation of financial liabilities which contain both deposit and derivative components. We have concluded that a change in accounting policy and presentation from ‘Trading liabilities’ would be appropriate, since this would better align with the presentation of similar financial instruments by peers and therefore provide more relevant information about the effect of these financial liabilities on our financial position and performance. As a result, rather than being classified as held for trading, we designate these financial liabilities as at fair value through profit or loss since they are managed and their performance evaluated on a fair value basis. A further consequence of this change in presentation is that the effects of changes in the liabilities’ credit risk is presented in Other comprehensive income with the remaining effect presented in profit or loss in accordance with group accounting policy adopted in 2017 (following the adoption of the requirements in HKFRS 9 relating to the presentation of gains and losses on financial liabilities designated at fair value).
• Cash collateral, margin and settlement accounts have been reclassified from ‘Trading assets’, ‘Placings with and advances to banks’ and ‘Loans and advances to customers’ to ‘Prepayments, accrued income and other assets’, and from ‘Trading liabilities’, ‘Deposits by banks' and 'Customer accounts‘ to ‘Accruals and deferred income, other liabilities and provisions’. The change in presentation for financial assets is in accordance with HKFRS 9 and the change in presentation for financial liabilities is considered to provide more relevant information, given the change in presentation for the financial assets. The change in presentation for financial liabilities has had no effect on measurement of these items and therefore on retained earnings or profit for any period.
• Certain stock borrowing assets have been reclassified from ‘Placings with and advances to banks’ and ‘Loans and advances to customers’ to ‘Trading assets’. The change in measurement is a result of the determination of the global business model for this activity and to align the presentation throughout the group.
Summary of significant accounting policies
Set out below are the new or substantially revised accounting policies implementing HKFRS 9 which replace the existing HKAS 39 policies. The accounting policies on hedge accounting are substantially unchanged and are not repeated. The following policies will substantially replace existing policies (d) and (e) in the Annual Report and Accounts 2017 with subsequent policies in the Annual Report and Accounts 2018 being renumbered:
(a) Financial instruments measured at amortised cost
Financial assets that are held to collect the contractual cash flows and that contain contractual terms that give rise on specified dates to cash flows that are solely payments of principal and interest, such as most loans and advances to banks and customers and some debt securities, are measured at amortised cost. In addition, most financial liabilities are measured at amortised cost. The carrying value of these financial assets at initial recognition includes any directly attributable transactions costs. If the initial fair value is lower than the

The Hongkong and Shanghai Banking Corporation Limited Interim Report 2018 25
cash amount advanced, such as in the case of some leveraged finance and syndicated lending activities, the difference is deferred and recognised over the life of the loan through the recognition of interest income, unless the loan becomes impaired.
The group may commit to underwriting loans on fixed contractual terms for specified periods of time. When the loan arising from the lending commitment is expected to be held for trading, the commitment to lend is recorded as a derivative. When the group intends to hold the loan, the loan commitment is included in the impairment calculations set out below.
(b) Financial assets measured at fair value through other comprehensive income (‘FVOCI’)
Financial assets held for a business model that is achieved by both collecting contractual cash flows and selling and that contain contractual terms that give rise on specified dates to cash flows that are solely payments of principal and interest are measured at FVOCI. These comprise primarily debt securities. They are recognised on the trade date when the group enters into contractual arrangements to purchase and are normally derecognised when they are either sold or redeemed. They are subsequently remeasured at fair value and changes therein (except for those relating to impairment, interest income and foreign currency exchange gains and losses) are recognised in other comprehensive income until the assets are sold. Upon disposal, the cumulative gains or losses in other comprehensive income are recognised in the income statement as ‘Gains less losses arising from derecognition of debt instruments measured at fair value through other comprehensive income’. Financial assets measured at FVOCI are included in the impairment calculations set out below and impairment is recognised in profit or loss.
(c) Equity securities measured at fair value with fair value movements presented in other comprehensive income ('OCI')
The equity securities for which fair value movements are shown in OCI are business facilitation and other similar investments where the group holds the investments other than to generate a capital return. Gains or losses on the derecognition of these equity securities are not transferred to profit or loss. Otherwise equity securities are measured at fair value through profit or loss (except for dividend income which is recognised in profit or loss).
(d) Financial instruments designated at fair value
Financial instruments, other than those held for trading, are classified in this category if they meet one or more of the criteria set out below and are so designated irrevocably at inception:
• the use of the designation removes or significantly reduces an accounting mismatch;
• when a group of financial assets and liabilities or a group of financial liabilities is managed and its performance is evaluated on a fair value basis, in accordance with a documented risk management or investment strategy; and
• where the financial liability contains one or more non-closely related embedded derivatives.
Designated financial assets are recognised when the group enters into contracts with counterparties, which is generally on trade date, and are normally derecognised when the rights to the cash flows expire or are transferred. Designated financial liabilities are recognised when the group enters into contracts with counterparties, which is generally on settlement date, and are normally derecognised when extinguished. Subsequent changes in fair values are recognised in the income statement in ‘Net income from financial instruments designated at fair value’.
Under the above criterion, the main classes of financial instruments designated by the group are:
• Long-term debt issues.
The interest and/or foreign exchange exposure on certain fixed rate debt securities issued has been matched with the interest and/or foreign exchange exposure on certain swaps as part of a documented risk management strategy.
• Financial assets and financial liabilities under unit-linked and non-linked investment contracts.
A contract under which the group does not accept significant insurance risk from another party is not classified as an insurance contract, other than investment contracts with discretionary participation features (‘DPF’), but is accounted for as a financial liability. Customer liabilities under linked and certain non-linked investment contracts issued by insurance subsidiaries are determined based on the fair value of the assets held in the linked funds. If no fair value designation was made for the related assets, at least some of the assets would otherwise be measured at either fair value through other comprehensive income or amortised cost. The related financial assets and liabilities are managed and reported to management on a fair value basis. Designation at fair value of the financial assets and related liabilities allows changes in fair values to be recorded in the income statement and presented in the same line.
(e) Derivatives
Derivatives are financial instruments that derive their value from the price of underlying items such as equities, interest rates or other indices. Derivatives are recognised initially and are subsequently measured at fair value. Derivatives are classified as assets when their fair value is positive or as liabilities when their fair value is negative. This includes embedded derivatives in financial liabilities which are bifurcated from the host contract when they meet the definition of a derivative on a stand-alone basis.
Where the derivatives are managed with debt securities issued by the group that are designated at fair value, the contractual interest is shown in ‘Interest expense’ together with the interest payable on the issued debt.
(f) Impairment of amortised cost and FVOCI financial assets
Expected credit losses are recognised for loans and advances to banks and customers, non-trading reverse repurchase agreements, other financial assets held at amortised cost, debt instruments measured at fair value through other comprehensive income, and certain loan commitments and financial guarantee contracts. At initial recognition, allowance (or provision in the case of some loan commitments and financial guarantees) is required for ECL resulting from default events that are possible within the next 12 months (or less, where the remaining life is less than 12 months) (’12-month ECL’). In the event of a significant increase in credit risk, allowance (or provision) is required for ECL resulting from all possible default events over the expected life of the financial instrument (‘lifetime ECL’). Financial assets where 12-month ECL is recognised are considered to be ‘stage 1’; financial assets which are considered to have experienced a significant increase in credit risk are in ‘stage 2’; and financial assets for which there is objective evidence of impairment so are considered to be in default or otherwise credit-impaired are in ‘stage 3’. Purchased or originated credit-impaired financial assets (‘POCI’) are treated differently as set out below.

Notes on the Interim Condensed Consolidated Financial Statements (unaudited)
26 The Hongkong and Shanghai Banking Corporation Limited Interim Report 2018
Credit-impaired (stage 3)
The group determines that a financial instrument is credit-impaired and in stage 3 by considering relevant objective evidence, primarily whether:
• contractual payments of either principal or interest are past due for more than 90 days;
• there are other indications that the borrower is unlikely to pay such as that a concession has been granted to the borrower for economic or legal reasons relating to the borrower’s financial condition; and
• the loan is otherwise considered to be in default.
If such unlikeliness to pay is not identified at an earlier stage, it is deemed to occur when an exposure is 90 days past due.
Interest income is recognised by applying the effective interest rate to the amortised cost amount, i.e. gross carrying amount less ECL allowance.
Write-off
Financial assets (and the related impairment allowances) are normally written off, either partially or in full, when there is no realistic prospect of recovery. Where loans are secured, this is generally after receipt of any proceeds from the realisation of security. In circumstances where the net realisable value of any collateral has been determined and there is no reasonable expectation of further recovery, write-off may be earlier.
Renegotiation
Loans are identified as renegotiated and classified as credit-impaired when we modify the contractual payment terms due to significant credit distress of the borrower. Renegotiated loans remain classified as credit-impaired until there is sufficient evidence to demonstrate a significant reduction in the risk of non-payment of future cash flows and retain the designation of renegotiated until maturity or derecognition.
A loan that is renegotiated is derecognised if the existing agreement is cancelled and a new agreement is made on substantially different terms or if the terms of an existing agreement are modified such that the renegotiated loan is a substantially different financial instrument. Any new loans that arise following derecognition events in these circumstances are considered to be POCI and will continue to be disclosed as renegotiated loans.
Other than originated credit-impaired loans, all other modified loans could be transferred out of stage 3 if they no longer exhibit any evidence of being credit-impaired and, in the case of renegotiated loans, there is sufficient evidence to demonstrate a significant reduction in the risk of non-payment of future cash flows, over the minimum observation period, and there are no other indicators of impairment. These loans could be transferred to stage 1 or 2 based on the mechanism as described below by comparing the risk of a default occurring at the reporting date (based on the modified contractual terms) and the risk of a default occurring at initial recognition (based on the original, unmodified contractual terms). Any amount written off as a result of the modification of contractual terms would not be reversed.
Loan modifications that are not credit-impaired
Loan modifications that are not identified as renegotiated are considered to be commercial restructuring. Where a commercial restructuring results in a modification (whether legalised through an amendment to the existing terms or the issuance of a new loan contract) such that the group’s rights to the cash flows under the original contract have expired, the old loan is derecognised and the new loan is recognised at fair value. The rights to cash flows are generally considered to have expired if the commercial restructure is at market rates and no payment-related concession has been provided.
Significant increase in credit risk (stage 2)
An assessment of whether credit risk has increased significantly since initial recognition is performed at each reporting period by considering the change in the risk of default occurring over the remaining life of the financial instrument. The assessment explicitly or implicitly compares the risk of default occurring at the reporting date compared to that at initial recognition, taking into account reasonable and supportable information, including information about past events, current conditions and future economic conditions. The assessment is unbiased, probability-weighted, and to the extent relevant, uses forward-looking information consistent with that used in the measurement of ECL. The analysis of credit risk is multifactor. The determination of whether a specific factor is relevant and its weight compared with other factors depends on the type of product, the characteristics of the financial instrument and the borrower, and the geographical region. Therefore, it is not possible to provide a single set of criteria that will determine what is considered to be a significant increase in credit risk and these criteria will differ for different types of lending, particularly between retail and wholesale. However, unless identified at an earlier stage, all financial assets are deemed to have suffered a significant increase in credit risk when 30 days past due. In addition, wholesale loans that are individually assessed, typically corporate and commercial customers, and included on a watch or worry list are included in stage 2.
For wholesale portfolios, the quantitative comparison assesses default risk using a lifetime probability of default which encompasses a wide range of information including the obligor’s customer risk rating, macroeconomic condition forecasts and credit transition probabilities. Significant increase in credit risk is measured by comparing the average PD for the remaining term estimated at origination with the equivalent estimation at reporting date (or that the origination PD has doubled in the case of origination CRR greater than 3.3). The significance of changes in PD was informed by expert credit risk judgement, referenced to historical credit migrations and to relative changes in external market rates. The quantitative measure of significance varies depending on the credit quality at origination as follows:
Origination CRR Significance trigger – PD to increase by
0.1–1.2 15bps2.1–3.3 30bpsGreater than 3.3 and not impaired 2x

The Hongkong and Shanghai Banking Corporation Limited Interim Report 2018 27
For loans originated prior to the implementation of HKFRS 9, the origination PD does not include adjustments to reflect expectations of future macroeconomic conditions since these are not available without the use of hindsight. In the absence of this data, origination PD must be approximated assuming through-the-cycle (‘TTC’) PDs and TTC migration probabilities, consistent with the instrument’s underlying modelling approach and the CRR at origination. For these loans, the quantitative comparison is supplemented with additional CRR deterioration based thresholds as set out in the table below:
Origination CRRAdditional significance criteria – Number of CRR grade notches deteriorationrequired to identify as significant credit deterioration (stage 2) (> or equal to)
0.1 5 notches1.1–4.2 4 notches4.3–5.1 3 notches5.2–7.1 2 notches7.2–8.2 1 notch8.3 0 notch
Further information about the 23-grade scale used for CRR can be found on page 19 of the Annual Report and Accounts 2017.
For certain portfolios of debt securities where external market ratings are available and credit ratings are not used in credit risk management, the debt securities will be in stage 2 if their credit risk increases to the extent they are no longer considered investment grade. Investment grade is where the financial instrument has a low risk of incurring losses, the structure has a strong capacity to meet its contractual cash flow obligations in the near term and adverse changes in economic and business conditions in the longer term may, but will not necessarily, reduce the ability of the borrower to fulfil their contractual cash flow obligations.
For retail portfolios, default risk is assessed using a reporting date 12-month PD derived from credit scores which incorporate all available information about the customer. This PD is adjusted for the effect of macroeconomic forecasts for periods longer than 12 months and is considered to be a reasonable approximation of a lifetime PD measure. Retail exposures are first segmented into homogeneous portfolios, generally by country, product and brand. Within each portfolio, the stage 2 accounts are defined as accounts with an adjusted 12-month PD greater than the average 12-month PD of loans in that portfolio 12 months before they become 30 days past due. The expert credit risk judgement is that no prior increase in credit risk is significant. This portfolio-specific threshold identifies loans with a PD higher than would be expected from loans that are performing as originally expected and higher than that which would have been acceptable at origination. It therefore approximates a comparison of origination to reporting date PDs.
Unimpaired and without significant increase in credit risk – (stage 1)
ECL resulting from default events that are possible within the next 12 months (’12-month ECL’) are recognised for financial instruments that remain in stage 1.
Purchased or originated credit-impaired
Financial assets that are purchased or originated at a deep discount that reflects the incurred credit losses are considered to be POCI. This population includes the recognition of a new financial instrument following a renegotiation where concessions have been granted for economic or contractual reasons relating to the borrower’s financial difficulty that otherwise would not have been considered. The amount of change-in-lifetime ECL is recognised in profit or loss until the POCI is derecognised, even if the lifetime ECL are less than the amount of ECL included in the estimated cash flows on initial recognition.
Movement between stages
Financial assets can be transferred between the different categories (other than POCI) depending on their relative increase in credit risk since initial recognition. Financial instruments are transferred out of stage 2 if their credit risk is no longer considered to be significantly increased since initial recognition based on the assessments described above. Except for renegotiated loans, financial instruments are transferred out of stage 3 when they no longer exhibit any evidence of credit impairment as described above. Renegotiated loans that are not POCI will continue to be in stage 3 until there is sufficient evidence to demonstrate a significant reduction in the risk of non-payment of future cash flows, observed over a minimum one-year period and there are no other indicators of impairment. For loans that are assessed for impairment on a portfolio basis, the evidence typically comprises a history of payment performance against the original or revised terms, as appropriate to the circumstances. For loans that are assessed for impairment on an individual basis, all available evidence is assessed on a case-by-case basis.
Measurement of ECL
The assessment of credit risk, and the estimation of ECL, are unbiased and probability-weighted, and incorporate all available information which is relevant to the assessment including information about past events, current conditions and reasonable and supportable forecasts of future events and economic conditions at the reporting date. In addition, the estimation of ECL should take into account the time value of money.
In general, the group calculates ECL using three main components, a probability of default, a loss given default and the exposure at default (‘EAD’).
The 12-month ECL is calculated by multiplying the 12-month PD, LGD and EAD. Lifetime ECL is calculated using the lifetime PD instead. The 12-month and lifetime PDs represent the probability of default occurring over the next 12 months and the remaining maturity of the instrument respectively.
The EAD represents the expected balance at default, taking into account the repayment of principal and interest from the balance sheet date to the default event together with any expected drawdowns of committed facilities. The LGD represents expected losses on the EAD given the event of default, taking into account, among other attributes, the mitigating effect of collateral value at the time it is expected to be realised and the time value of money.

Notes on the Interim Condensed Consolidated Financial Statements (unaudited)
28 The Hongkong and Shanghai Banking Corporation Limited Interim Report 2018
The group leverages the Basel II IRB framework where possible, with recalibration to meet the differing HKFRS 9 requirements as follows:
Model Regulatory capital HKFRS 9
PD
• Through the cycle (represents long-run average PD throughout a full economic cycle)
• The definition of default includes a backstop of 90+ days past due
• Point in time (based on current conditions, adjusted to take into account estimates of future conditions that will impact PD)
• Default backstop of 90+ days past due for all portfolios
EAD • Cannot be lower than current balance • Amortisation captured for term products
LGD
• Downturn LGD (consistent losses expected to be suffered during a severe but plausible economic downturn)
• Regulatory floors may apply to mitigate risk of underestimating downturn LGD due to lack of historical data
• Discounted using cost of capital• All collection costs included
• Expected LGD (based on estimate of loss given default including the expected impact of future economic conditions such as changes in value of collateral)
• No floors• Discounted using the original effective interest rate of the loan• Only costs associated with obtaining/selling collateral included
Other • Discounted back from point of default to balance sheet date
While 12-month PDs are recalibrated from Basel models where possible, the lifetime PDs are determined by projecting the 12-month PD using a term structure. For the wholesale methodology, the lifetime PD also takes into account credit migration, i.e. a customer migrating through the CRR bands over its life.
The ECL for wholesale stage 3 is determined on an individual basis using a discounted cash flow (‘DCF’) methodology. The expected future cash flows are based on the credit risk officer’s estimates as at the reporting date, reflecting reasonable and supportable assumptions and projections of future recoveries and expected future receipts of interest. Collateral is taken into account if it is likely that the recovery of the outstanding amount will include realisation of collateral based on its estimated fair value of collateral at the time of expected realisation, less costs for obtaining and selling the collateral. The cash flows are discounted at a reasonable approximation of the original effective interest rate. For significant cases, cash flows under four different scenarios are probability-weighted by reference to the three economic scenarios applied more generally by the group and the judgement of the credit risk officer in relation to the likelihood of the workout strategy succeeding or receivership being required. For less significant cases, the effect of different economic scenarios and work-out strategies is approximated and applied as an adjustment to the most likely outcome.
Period over which ECL is measured
Expected credit loss is measured from the initial recognition of the financial asset. The maximum period considered when measuring ECL (be it 12-month or lifetime ECL) is the maximum contractual period over which the group is exposed to credit risk. For wholesale overdrafts, credit risk management actions are taken no less frequently than on an annual basis and therefore this period is to the expected date of the next substantive credit review. The date of the substantive credit review also represents the initial recognition of the new facility. However, where the financial instrument includes both a drawn and undrawn commitment and the contractual ability to demand repayment and cancel the undrawn commitment does not serve to limit the group’s exposure to credit risk to the contractual notice period, the contractual period does not determine the maximum period considered. Instead, ECL is measured over the period the group remains exposed to credit risk that is not mitigated by credit risk management actions. This applies to retail overdrafts and credit cards, where the period is the average time taken for stage 2 exposures to default or close as performing accounts, determined on a portfolio basis and ranging from between two and six years. In addition, for these facilities it is not possible to identify the ECL on the loan commitment component separately from the financial asset component. As a result, the total ECL is recognised in the loss allowance for the financial asset unless the total ECL exceeds the gross carrying amount of the financial asset, in which case the ECL is recognised as a provision.
Forward-looking economic inputs
The group will in general apply three forward-looking global economic scenarios determined with reference to external forecast distributions, the Consensus Economic Scenario approach. This approach is considered sufficient to calculate unbiased expected loss in most economic environments. They represent a ‘most likely outcome’ (the Central scenario) and two, less likely, ‘Outer’ scenarios on either side of the Central, referred to as an Upside and a Downside scenario respectively. The Central scenario is used by the annual operating planning process and, with regulatory modifications, will also be used in enterprise-wide stress tests. The Upside and Downside are constructed following a standard process supported by a scenario narrative reflecting the group’s current top and emerging risks. The relationship between the Outer scenarios and Central scenario will generally be fixed with the Central scenario being assigned a weighting of 80% and the Upside and Downside scenarios 10% each, with the difference between the Central and Outer scenarios in terms of economic severity being informed by the spread of external forecast distributions among professional industry forecasts. The Outer scenarios are economically plausible, internally consistent states of the world and will not necessarily be as severe as scenarios used in stress testing. The period of forecast is five years, after which the forecasts will revert to a view based on average past experience. The central forecast and spread between the Central and Outer scenarios is grounded on the expected gross domestic product of the following major countries: UK, France, Hong Kong, mainland China, US, Canada, Mexico and the UAE. The economic factors include, but are not limited to, gross domestic product, unemployment, interest rates, inflation and commercial property prices across all the countries in which the group operates.
In general, the consequences of the assessment of credit risk and the resulting ECL outputs will be probability-weighted using the standard probability weights. This probability weighting may be applied directly or the effect of the probability weighting determined on a periodic basis, at least annually, and then applied as an adjustment to the outcomes resulting from the central economic forecast. The central economic forecast is updated quarterly.
The group recognises that the Consensus Economic Scenario approach using three scenarios will be insufficient in certain economic environments. Additional analysis may be requested at management’s discretion, including the production of extra scenarios. If conditions warrant, this could result in a management overlay for economic uncertainty which is included in the ECL estimates.

The Hongkong and Shanghai Banking Corporation Limited Interim Report 2018 29
Differences between HKAS 39 and HKFRS 9
Classification and measurement
Key similarities and differences between HKAS 39 and HKFRS 9 for the classification and measurement of financial assets are set out below. There are no differences for financial liabilities, except for the presentation of gains and losses on financial liabilities designated at fair value and the requirements to reconsider fair value designation on transition to HKFRS 9.
HKAS 39 HKFRS 9
Classificationcriteria
Financial assets are measured at amortised cost (loans &receivables and held to maturity), available-for-sale (‘AFS’), or fairvalue through profit or loss (derivatives and trading) based on thenature of the instrument and the purpose for which it is held.Embedded derivatives are separated from their host contract unlessthe contract as a whole is measured at fair value through profit orloss. The fair value option applies where there are non-closelyrelated embedded derivatives that are not bifurcated, financialinstruments are managed on a fair value basis or where measuringat fair value through profit or loss would reduce or eliminate anaccounting mismatch. AFS is the default category.
Debt instruments are measured at amortised cost or FVOCI based on their contractual terms and the business model in which they are held as set out in the accounting policies above. The concept of embedded derivatives does not apply to financial assets. Therefore, the fair value option only applies where it would reduce or eliminate an accounting mismatch. Fair value through profit or loss is the default category.
Equity securities are measured at fair value through profit or loss unless the option has been exercised to measure at FVOCI as set out in the accounting policies above.
Presentation Upon disposal of AFS securities (debt instruments and equitysecurities) the cumulative gains or losses in other comprehensiveincome are recognised in profit or loss.
Upon disposal of debt instruments measured at FVOCI thecumulative gains or losses in other comprehensive income arerecognised in profit or loss. Cumulative gains or losses in othercomprehensive income are not recognised in profit or loss on thedisposal of equity securities measured at FVOCI.
A reconciliation of presentational and measurement differences resulting from the adoption of HKFRS 9 at 1 January 2018 is set out in note 2.
In general:
• loans and advances to banks and to customers and non-trading reverse repurchase agreements that are classified as loans and receivables under HKAS 39 are measured at amortised cost under HKFRS 9;
• financial assets designated at Fair Value through Profit and Loss (‘FVPL’) remain at FVPL, because it is required under HKFRS 9 or the designation will continue;
• debt securities classified as available for sale are measured at amortised cost or FVOCI, with a small minority at FVPL either because of their contractual cash flow characteristics or the business model within which they are held;
• debt securities classified as held to maturity are measured at amortised cost;
• treasury and other eligible bills classified as available for sale are measured at amortised cost or FVOCI depending upon the business model in which they are held; and
• all equity securities remain measured at fair value. The equity securities for which fair value movements are shown in other comprehensive income are business facilitation and other similar investments where the group holds the investments other than to generate a capital return.
Impairment
Under HKFRS 9, the scope of impairment also covers amortised cost assets, debt instruments measured at FVOCI, as well as loan commitments and financial guarantees. The recognition and measurement of impairment is intended to be more forward-looking than under HKAS 39 and the resulting impairment charge may be more volatile. The adoption has resulted in an increase in the total level of impairment allowances on 1 January 2018 as set out on page 34, since all financial instruments are assessed for at least 12-month ECL and the population of financial instruments to which lifetime ECL applies is larger than the population for which there is objective evidence of impairment in accordance with HKAS 39.

Notes on the Interim Condensed Consolidated Financial Statements (unaudited)
30 The Hongkong and Shanghai Banking Corporation Limited Interim Report 2018
Key similarities and differences between HKAS 39 and HKFRS 9
HKAS 39 HKFRS 9
Scope For amortised cost assets, impairment is recognised when there is objective evidence of impairment. Losses are measured by comparing the carrying amount with the discounted future cash flows. Losses which may arise from future events are not recognised.For available-for-sale financial assets, impairment is recognised when there is objective evidence of a shortfall in the recovery of future cash flows. Impairment is measured as the decrease in fair value below the original cost at initial recognition.
Under HKFRS 9, the scope of impairment covers amortised costassets, debt instruments measured at FVOCI, as well as loancommitments and financial guarantees. The same recognition andmeasurement requirements apply to both amortised cost andFVOCI financial assets. Impairment is not recognised on equitysecurities which are measured at FVOCI. Impairment is recognisedfor all financial instruments in scope at either 12-month ECL orlifetime ECL. All reasonable and supportable information, includinginformation about past events, current conditions and reasonableand supportable forecasts of economic conditions at the reportingdate is used in measuring ECL.
Application Accounting policies generally make a distinction betweenindividually significant loans and homogeneous groups of loanswhich are assessed collectively.
The distinction between individual and collective assessment is lessrelevant. In general, whether loans are managed through wholesalecredit risk systems or retail credit risk systems is relevant becauseof differences in the types of information available and the waycredit risk is managed.
Impaired/Stage 3
The criteria used to determine whether there is objective evidence of impairment are the same for individually significant loans assessed under HKAS 39 and for HKFRS 9.
The determination of the realisable value of security is based on the most recently updated market value at the time the impairment assessment is performed and is not adjusted for expected future changes in market prices.
Statistical methods are used to determine impairment losses on a collective basis for homogeneous groups of loans that are not considered individually significant using either roll rate methodologies or historical loss rate experience for loans. Under these methodologies, impairment allowances are recognised at a portfolio level. However, loans are classified as impaired for presentation purposes when they are more than 90 days past due or have been renegotiated for credit risk reasons. For retail loans, an exception is made for individual loans that are in arrears by more than 90 days but have been individually assessed to have no indications of impairment, and these are not classified as impaired.
The stage 3 population is consistent with impaired loans under HKAS 39 which are considered individually significant.
For wholesale loans, individual discounted cash flow calculations continue to be performed. However, the net realisable value of security is adjusted for expected future changes in market and the losses reflecting cash flows under different scenarios are probability-weighted to determine the ECL rather than using the best estimate of cash flows.
For the retail population, stage 3 is determined by considering the relevant objective evidence, primarily whether contractual payments of either principal or interest are past due for more than 90 days, or a concession has been granted to the borrower for economic or legal reasons relating to the borrower’s financial condition, or the loan is otherwise considered to be in default.
The impairment allowance is determined by the same calculation used for stage 2, with the probability of default set to 1. The result may, therefore, not be the same as that determined by the HKAS 39 statistical methods and the population disclosed as stage 3 will not necessarily correspond with that disclosed as impaired in accordance with HKAS 39.
The accounting policies setting out the criteria for loans to be transferred to stage 3 and for POCI financial assets are set out in policy (f) on page 25.
Stage 2 This is not an HKAS 39 concept. The accounting policies setting out the criteria for loans to be transferred to stage 2 and the measurement of lifetime ECL are set out in policy (f) on page 25.
Stage 1 This is not an HKAS 39 concept. However, incurred but not yetidentified impairment is assessed loans for which no evidence ofimpairment has been specifically identified by estimating acollective allowance determined after taking into account factorsincluding the estimated period between impairment occurring andthe loss being identified. This is assessed empirically on a periodicbasis and may vary over time. Similarly, for homogeneous groups ofloans and advances which are assessed under HKAS 39 on acollective basis, the inherent loss is determined using risk factorsincluding the period of time between loss identification and write-off which is regularly benchmarked against actual outcomes.
Financial instruments which are not considered to have significantlyincreased in credit risk have loss allowances measured at anamount equal to 12-month ECL. This 12-month time horizon is likelyto be equal to or longer than the period estimated under HKAS 39(typically between 6 and 12 months). The measurement of 12-month ECL is set out in policy (f) on page 25.
(b) Use of estimates and judgements Management believes that the group’s critical accounting estimates and judgements are those which relate to impairment of financial instruments, the valuation of financial instruments, deferred tax assets, provisions for liabilities and interests in associates. The implementation of HKFRS 9 resulted in a change to the assessment of the critical accounting estimates and judgements related to impairment of financial instruments.
In determining ECL, management is required to exercise judgement in defining what is considered to be a significant increase in credit risk and in making assumptions and estimates to incorporate relevant information about past events, current conditions and forecasts of economic conditions. Judgement has been applied in determining the lifetime and point of initial recognition of revolving facilities.
The PD, LGD and EAD models which support these determinations are reviewed regularly in light of differences between loss estimates and actual loss experience, but given that HKFRS 9 requirements have only just been applied, there has been little time available to make these comparisons. Therefore, the underlying models and their calibration, including how they react to forward-looking economic conditions remain subject to review and refinement. This is particularly relevant for lifetime PDs, which have not been previously used in regulatory modelling and for the incorporation of ‘Upside scenarios’ which have not generally been subject to experience gained through stress testing.
The exercise of judgement in making estimations requires the use of assumptions which are highly subjective and very sensitive to the risk factors, in particular to changes in economic and credit conditions across a large number of geographical areas. Many of the factors have a high degree of interdependency and there is no single factor to which loan impairment allowances as a whole are sensitive. Pages 10 to 11 in the Risk Section set out the assumptions underlying the Central scenario and information about how scenarios are developed in relation to the group’s top and emerging risks and its judgements, informed by consensus forecasts of professional industry forecasters. The adjustment from the ECL determined by using the Central scenario alone, which is used to calculate an unbiased

The Hongkong and Shanghai Banking Corporation Limited Interim Report 2018 31
expected loss, provides an indication of the overall sensitivity of ECL to different economic assumptions. There were no other changes in the current period to the critical accounting estimates and judgements applied in 2018, which are stated in note 1 of the Annual Report and Accounts 2017.
(c) Composition of group There were no material changes in the composition of the group in the half-year to 30 June 2018.
(d) Future accounting developments In May 2016, the HKICPA issued HKFRS 16 ‘Leases’ with an effective date for annual periods beginning on or after 1 January 2019. HKFRS 16 results in lessees accounting for most leases within the scope of the standard in a manner similar to the way in which finance leases are currently accounted for under HKAS 17 ‘Leases’. Lessees will recognise a ‘right of use’ asset and a corresponding financial liability on the balance sheet. The asset will be amortised over the length of the lease, and the financial liability measured at amortised cost. Lessor accounting remains substantially the same as under HKAS 17. The group is currently assessing the impact of HKFRS 16, and it is not practicable to quantify the effect at the date of the publication of these financial statements.
HKFRS 17 ‘Insurance Contracts’ was issued in January 2018 and sets out the requirements that an entity should apply in accounting for insurance contracts it issues and reinsurance contracts it holds. HKFRS 17 is effective from 1 January 2021 and the group is considering its impact.
(e) Going concern The financial statements are prepared on a going concern basis, as the Directors are satisfied that the group and parent company have the resources to continue in business for the foreseeable future. In making this assessment, the Directors have considered a wide range of information relating to present and future conditions, including future projections of profitability, cash flows, capital requirements and capital resources.
(f) Accounting policies Except as described above, the accounting policies applied by the group for these interim condensed consolidated financial statements are consistent with those described in note 1 of the Annual Report and Accounts 2017, as are the methods of computation.

Notes on the Interim Condensed Consolidated Financial Statements (unaudited)
32 The Hongkong and Shanghai Banking Corporation Limited Interim Report 2018
2 Effects of reclassification upon adoption of HKFRS 9
Reconciliation of consolidated balance sheet at 31 December 2017 and 1 January 2018
HKFRS 9 reclassification to HKFRS 9 remeasure-
ment including expected
credit losses4
HKFRS 9carrying
amount at1 Jan 2018
HKAS 39carrying
amount at31 Dec
2017
Otherchangesin classi-fication
Fairvalue
throughprofit
and loss
Fair valuethrough
othercompre-hensiveincome
Amortisedcost
Carryingamount post
reclassification
Footnotes
HKAS 39measurement
category
HKFRS 9measurement
category HK$m HK$m HK$m HK$m HK$m HK$m HK$m HK$m
Assets
Cash and sightbalances atcentral banks
Amortisedcost
Amortisedcost 208,073 — — — — 208,073 (1) 208,072
Items in thecourse ofcollection fromother banks
Amortisedcost
Amortisedcost 25,714 — — — — 25,714 — 25,714
Hong KongGovernmentcertificates ofindebtedness
Amortisedcost
Amortisedcost 267,174 — — — — 267,174 — 267,174
Trading assets 1, 3 FVPL FVPL 496,434 36,282 — — (26,572) 506,144 9 506,153
Derivatives FVPL FVPL 300,243 — — — — 300,243 — 300,243
Financial assetsdesignated andotherwisemandatorilymeasured at fairvalue 2,5,6,7 FVPL FVPL 122,646 — 12,130 — (899) 133,877 158 134,035
Reverserepurchaseagreements –non-trading
Amortisedcost
Amortisedcost 330,890 — — — — 330,890 — 330,890
Placings withand advances tobanks 1, 2, 3
Amortisedcost
Amortisedcost 433,005 (37,095) (4,667) — — 391,243 (53) 391,190
Loans andadvances tocustomers 1, 2, 3, 4
Amortisedcost
Amortisedcost 3,328,980 (35,406) (2,654) — — 3,290,920 (3,492) 3,287,428
Financialinvestments
5
FVOCI(Availablefor sale –
debtinstruments) FVOCI 1,410,655 — (47) — (50,699) 1,359,909 — 1,359,909
6
FVOCI(Availablefor sale –
equityinstruments) FVOCI 9,275 — (3,093) 297 — 6,479 6 6,485
5
Amortisedcost
Amortisedcost 300,943 — — — 51,598 352,541 (4,457) 348,084
Amounts duefrom Groupcompanies
Amortisedcost / FVPL
Amortisedcost / FVPL 227,729 — — — — 227,729 (26) 227,703
Interests inassociates andjoint ventures 8 N/A N/A 144,717 — — — — 144,717 (6,029) 138,688
Goodwill andintangible assets 9 N/A N/A 59,865 — — — — 59,865 (616) 59,249
Property, plantand equipment N/A N/A 116,336 — — — — 116,336 — 116,336
Deferred taxassets N/A N/A 2,156 — — — — 2,156 383 2,539
Prepayments,accrued incomeand other assets 1, 7 N/A N/A 158,511 36,219 (1,669) (297) 26,572 219,336 (32) 219,304
Total assets 7,943,346 — — — — 7,943,346 (14,150) 7,929,196
For footnotes, see page 35.

The Hongkong and Shanghai Banking Corporation Limited Interim Report 2018 33
Reconciliation for consolidated balance sheet at 31 December 2017 and 1 January 2018 (continued)
HKFRS 9 reclassification to
Carryingamount post
reclassification
HKFRS 9 remeasure-
ment including expected
credit losses4
HKFRS 9carrying
amount at1 Jan 2018
HKAS 39carrying
amount at31 Dec
2017
Otherchangesin classi-fication
Fairvalue
throughprofit
and loss
Fair valuethrough
othercompre-hensiveincome
Amortisedcost
Footnotes
HKAS 39measurement
category
HKFRS 9measurement
category HK$m HK$m HK$m HK$m HK$m HK$m HK$m HK$m
Liabilities
Hong Kongcurrency notes incirculation
Amortisedcost
Amortisedcost 267,174 — — — — 267,174 — 267,174
Items in thecourse oftransmission toother banks
Amortisedcost
Amortisedcost 38,283 — — — — 38,283 — 38,283
Repurchaseagreements –non-trading
Amortisedcost
Amortisedcost 47,170 — — — — 47,170 — 47,170
Deposits bybanks 1
Amortisedcost
Amortisedcost 201,697 (24,023) — — — 177,674 — 177,674
Customeraccounts 1
Amortisedcost
Amortisedcost 5,138,272 (15,303) — — — 5,122,969 — 5,122,969
Trading liabilities 1, 10 FVPL FVPL 231,365 (147,654) — — — 83,711 — 83,711
Derivatives FVPL FVPL 309,353 — — — — 309,353 — 309,353
Financialliabilitiesdesignated at fairvalue 9, 10 FVPL FVPL 49,278 120,397 — — — 169,675 73 169,748
Debt securities inissue
Amortisedcost
Amortisedcost 38,394 — — — — 38,394 — 38,394
Retirementbenefit liabilities N/A N/A 2,222 — — — — 2,222 — 2,222
Amounts due toGroupcompanies
Amortisedcost / FVPL
Amortisedcost / FVPL 265,688 — — — — 265,688 — 265,688
Accruals anddeferred income,other liabilitiesand provisions 1, 4 N/A N/A 110,687 66,583 — — — 177,270 487 177,757
Liabilities underinsurancecontracts 9 N/A N/A 438,017 — — — — 438,017 (536) 437,481
Current taxliabilities N/A N/A 3,242 — — — — 3,242 — 3,242
Deferred taxliabilities N/A N/A 24,391 — — — — 24,391 (1,861) 22,530
Subordinatedliabilities
Amortisedcost
Amortisedcost 4,090 — — — — 4,090 — 4,090
Preferenceshares
Amortised cost
Amortised cost 21,037 — — — — 21,037 — 21,037
Total liabilities 7,190,360 — — — — 7,190,360 (1,837) 7,188,523
HKAS 39 carryingamount at 31 Dec
2017HKFRS 9
reclassification
Carrying amountpost
reclassification
HKFRS 9remeasurement
includingexpected credit
lossesCarrying amount
at 1 January 2018
Footnote HK$m HK$m HK$m HK$m HK$m
Equity
Called up share capital 151,360 — 151,360 — 151,360
Other equity instruments 14,737 — 14,737 — 14,737
Other reserves 11 123,417 (4,569) 118,848 57 118,905
Retained earnings 406,966 4,569 411,535 (12,047) 399,488
Total shareholders' equity 696,480 — 696,480 (11,990) 684,490
Non-controlling interests 56,506 — 56,506 (323) 56,183
Total equity 752,986 — 752,986 (12,313) 740,673
For footnotes, see page 35.

Notes on the Interim Condensed Consolidated Financial Statements (unaudited)
34 The Hongkong and Shanghai Banking Corporation Limited Interim Report 2018
Reconciliation of impairment allowance under HKAS 39 and provision under HKAS 37 to expected credit losses under HKFRS 9
Reclassification to Remeasurement
Total
Fair valuethrough profit
and loss
Fair valuethrough other
comprehensiveincome Amortised cost Stage 3 Stage 1 & Stage 2
HKAS 39 measurementcategory HK$m HK$m HK$m HK$m HK$m HK$m
Financial assets atamortised cost
HKAS 39 impairmentallowance at 31 Dec 2017 — — — — — 13,046
Cash and sight balances atcentral banks
Amortised cost (Loans and receivables) — — — — 1 1
Items in the course ofcollection from other banks
Amortised cost (Loans and receivables) — — — — — —
Hong Kong Governmentcertificates of indebtedness
Amortised cost (Loans and receivables) — — — — — —
Reverse repurchaseagreements – non-trading
Amortised cost (Loans and receivables) — — — — — —
Placings with and advancesto banks
Amortised cost (Loans and receivables) — — — — 53 53
Loans and advances tocustomers
Amortised cost (Loans and receivables) — — — 827 2,665 3,492
Financial investmentsAmortised cost
(Held to maturity) — — 23 — 99 122
Prepayments, accruedincome and other assets
Amortised cost (Loans and receivables) — — — — 32 32
Expected credit loss allowance at 1 Jan 2018 — — — — — 16,746
Loan commitments andfinancial guaranteecontracts
HKAS 37 provisions at 31Dec 2017 — — — — — 54
Provisions (loancommitments and financialguarantees) N/A N/A N/A N/A 1 486 487
Expected credit loss provision at 1 Jan 2018 — — — — — 541
The pre-tax net asset impact of additional impairment allowances on adoption of HKFRS 9 is HK$4,187m; HK$3,700m in respect of financial assets at amortised cost and HK$487m related to loan commitments and financial guarantee contracts. Total expected credit loss allowance at 1 January 2018 is HK$16,746m in respect of financial assets at amortised cost and HK$541m related to loan commitments and financial guarantee contracts.
Assuming no reclassification
Carrying amountat 30 Jun 2018
Fair value at 30Jun 2018
Gains/(losses)recognised inprofit or loss
Gains/(losses)recognised in
othercomprehensive
income
HK$m HK$m HK$m HK$m
Reclassified from available-for-sale to amortised cost
Debt instruments measured at amortised cost 42,575 45,195 N/A (1,538)
Majority of the assets reclassified from fair value through profit and loss to amortised cost matured during first half of 2018.

The Hongkong and Shanghai Banking Corporation Limited Interim Report 2018 35
Footnotes to Effects of reclassification upon adoption of HKFRS 91 Settlement accounts of HK$26,572m have been reclassified from ‘Trading assets’ to ‘Prepayments, accrued income and other assets’ as a result of the assessment of business
model in accordance with HKFRS 9. Cash collateral, margin and settlement accounts previously presented as ‘Placings with and advances to banks' of HK$28,032m and 'Loans and advances to customers’ of HK$8,187m have been represented in ‘Prepayments, accrued income and other assets’ to ensure consistent presentation of all such balances. Cash collateral, margin and settlement accounts previously presented as ‘Trading liabilities’ of HK$27,257m, ‘Deposits by banks' of HK$24,023m and 'Customer accounts' of HK$15,303m have been represented in 'Accruals and deferred income, other liabilities and provisions’. This change in presentation for financial liabilities is considered to provide more relevant information, given the change in presentation for the financial assets. These changes in presentation for financial assets and liabilities have had no effect on measurement of these items and therefore on 'Retained earnings'.
2 'Loans and advances to customers' of HK$2,654m and 'Placings with and advances to banks' of HK$4,667m did not meet the 'solely payments of principal and interest' (‘SPPI’)requirement for amortised cost classification under HKFRS 9. As a result, these financial assets were reclassified to ‘Financial assets designated and otherwise mandatorilymeasured at fair value'.
3 Stock borrowing assets of HK$36,282m have been reclassified from ‘Placings with and advances to banks' and 'Loans and advances to customers’ to ‘Trading assets’. The changein measurement is a result of the determination of the global business model for this activity and to align the presentation throughout the group.
4 HKFRS 9 expected credit losses have decreased net assets by HK$4,187m principally comprising of HK$3,492m reduction in the carrying value of assets classified as 'Loans andadvances to customers' and HK$487m increase in 'Provisions' relating to expected credit losses on loan commitments and financial guarantee contracts.
5 Debt instruments of HK$47m previously classified as available-for-sale under HKAS 39 did not meet the SPPI requirement for FVOCI classification. As a result, these financial assetswere classified as ‘Financial assets designated and otherwise mandatorily measured at fair value’ upon adoption of HKFRS 9. Debt instruments of HK$50,699m previouslyclassified as available-for-sale under HKAS 39, have been reclassified to amortised cost as a result of ‘hold to collect’ business model classification under HKFRS 9. This resulted ina HK$4,335m downward remeasurement of the financial assets now measured at amortised cost excluding expected credit losses.
6 HK$3,093m of available-for-sale equity instruments have been reclassified as ‘Financial assets designated and otherwise mandatorily measured at fair value’ in accordance withHKFRS 9. The group has elected to apply the FVOCI option under HKFRS 9 for the remaining HK$6,182m.
7 HK$1,669m of other financial assets, representing default fund contributions which were measured at amortised cost under HKAS 39, did not meet the SPPI requirement foramortised cost classification under HKFRS 9. As a result, these financial assets were classified as ‘Financial assets designated and otherwise mandatorily measured at fair value’.
8 'Interests in associates and joint ventures' includes the consequential downward remeasurement of our interests in associates and joint ventures as a result of these entitiesapplying HKFRS 9 of HK$6,029m.
9 Changes in the classification and measurement of financial assets held in our insurance business and the recognition of ECL under HKFRS 9 has resulted in secondary impacts onthe present value of in-force long-term insurance business ('PVIF') and liabilities to holders of insurance and investment contracts. The gross carrying value of PVIF reported in‘Goodwill and intangible assets’ and liabilities reported in ‘Liabilities under insurance contracts’ has decreased by HK$616m and HK$536m respectively. Liabilities reported under‘Financial liabilities designated at fair value’ have increased by HK$73m.
10 We have considered market practices for the presentation of HK$120,397m of financial liabilities which contain both deposit and derivative components. We have concluded that achange in accounting policy and presentation from ‘Trading liabilities’ would be appropriate, since it would better align with the presentation of similar financial instruments bypeers and therefore provide more relevant information about the effect of these financial liabilities on our financial position and performance. As a result, rather than being classifiedas held for trading, we have designated these financial liabilities as at fair value since they are managed and their performance evaluated on a fair value basis.
11 While HKFRS 9 ECL has no effect on the carrying value of FVOCI financial assets, which remain measured at fair value, the adoption of HKFRS 9 results in a transfer from theFVOCI reserve (formerly AFS reserve) to retained earnings to reflect the cumulative impairment recognised in profit or loss in accordance with HKFRS 9 (net of impairment lossespreviously recognised in profit or loss under HKAS 39). The resulting cumulative expected credit losses recognised in ‘Retained earnings’ on financial assets measured at FVOCI onadoption of HKFRS 9 is HK$55m. In addition, the cumulative AFS reserve relating to financial investments reclassified to 'Financial assets designated and otherwise mandatorilymeasured at fair value’ in accordance with HKFRS 9 has been transferred to retained earnings.

Notes on the Interim Condensed Consolidated Financial Statements (unaudited)
36 The Hongkong and Shanghai Banking Corporation Limited Interim Report 2018
3 Dividends
Half-year to
30 Jun 2018 30 Jun 2017
HK$ per share HK$m HK$ per share HK$m
Ordinary dividends paid
– fourth interim dividend in respect of the previous financial year approved and paid during the half-year 0.36 16,559 0.56 25,438
– first interim dividend paid 0.22 10,000 0.22 10,000
Total 0.58 26,559 0.78 35,438
The Directors have declared a second interim dividend in respect of the half-year ended 30 June 2018 of HK$0.22 per ordinary share (HK$10,000m) (half-year ended 30 June 2017 of HK$0.22 per ordinary share (HK$10,000m)).
4 Derivatives
Fair values of derivatives by product type
Fair value – Assets Fair value – Liabilities
TradingCash flow
hedgesFair value
hedges Total TradingCash flow
hedgesFair value
hedges Total
HK$m HK$m HK$m HK$m HK$m HK$m HK$m HK$m
Foreign exchange 234,475 1,002 — 235,477 222,490 2,929 — 225,419
Interest rate 167,991 44 4,794 172,829 173,810 88 2,454 176,352
Equity 23,429 — — 23,429 21,582 — — 21,582
Credit 6,471 — — 6,471 6,455 — — 6,455
Commodity and other 2,474 — — 2,474 1,645 — — 1,645
Gross total fair values 434,840 1,046 4,794 440,680 425,982 3,017 2,454 431,453
Offset (103,380) (103,380)
At 30 Jun 2018 337,300 328,073
Foreign exchange 198,483 2,449 — 200,932 201,829 3,575 — 205,404
Interest rate 145,569 62 2,369 148,000 147,460 70 632 148,162
Equity 22,116 — — 22,116 25,106 — — 25,106
Credit 5,591 — — 5,591 5,970 — — 5,970
Commodity and other 1,228 — — 1,228 2,335 — — 2,335
Gross total fair values 372,987 2,511 2,369 377,867 382,700 3,645 632 386,977
Offset (77,624) (77,624)
At 31 Dec 2017 300,243 309,353
Notional contract amounts of derivatives by product type
TradingCash flow
hedgesFair value
hedges Total
HK$m HK$m HK$m HK$m
Foreign exchange 21,548,524 112,667 — 21,661,191
Interest rate 28,937,509 29,840 325,761 29,293,110
Equity 776,574 — — 776,574
Credit 936,677 — — 936,677
Commodity and other 107,727 — — 107,727
At 30 Jun 2018 52,307,011 142,507 325,761 52,775,279
Foreign exchange 18,928,664 132,198 — 19,060,862
Interest rate 26,655,864 29,109 268,927 26,953,900
Equity 762,895 — — 762,895
Credit 659,200 — — 659,200
Commodity and other 82,181 — — 82,181
At 31 Dec 2017 47,088,804 161,307 268,927 47,519,038

The Hongkong and Shanghai Banking Corporation Limited Interim Report 2018 37
5 Loans and advances to customers
The following analysis of loans and advances to customers is based on categories used by the HSBC Group, which is based on Statistical Classification of economic activities in the European Community (‘NACE’) codes with effect from 2018. Comparatives figures have been represented to conform to current year presentation.
At
30 Jun 31 Dec
2018 2017
HK$m HK$m
Residential mortgages 895,870 855,788
Credit card advances 84,824 89,368
Other personal 248,685 230,119
Total personal 1,229,379 1,175,275
Real estate 622,333 563,921
Wholesale and retail trade 463,554 460,347
Manufacturing 425,394 411,225
Transportation and storage 108,322 95,834
Other 473,813 429,800
Total corporate and commercial 2,093,416 1,961,127
Total financial 189,785 205,623
Gross loans and advances to customers 3,512,580 3,342,025
Expected credit losses/Impairment allowances (15,663) (13,045)
Net loans and advances to customers 3,496,917 3,328,980
Gross loans and advances to customers increased by HK$171bn, which included unfavourable foreign exchange translation effects of HK$28bn. Excluding this impact, the underlying increase of HK$199bn was driven by an increase in corporate and commercial lending in Hong Kong and Singapore, coupled with an increase in residential mortgages mainly in Hong Kong and Australia.
6 Financial investments
At
30 Jun 31 Dec
2018 2017
HK$m HK$m
Financial investments measured at fair value through other comprehensive income 1,357,930 N/A
– treasury and other eligible bills 524,006 N/A
– debt securities 827,817 N/A
– equity shares 6,107 N/A
Debt instruments measured at amortised cost 365,824 N/A
– treasury and other eligible bills 723 N/A
– debt securities 365,101 N/A
Available-for-sale N/A 1,419,930
– treasury and other eligible bills N/A 539,014
– debt securities N/A 871,641
– equity shares N/A 9,275
Held-to-maturity N/A 300,943
– treasury and other eligible bills N/A 699
– debt securities N/A 300,244
1,723,754 1,720,873
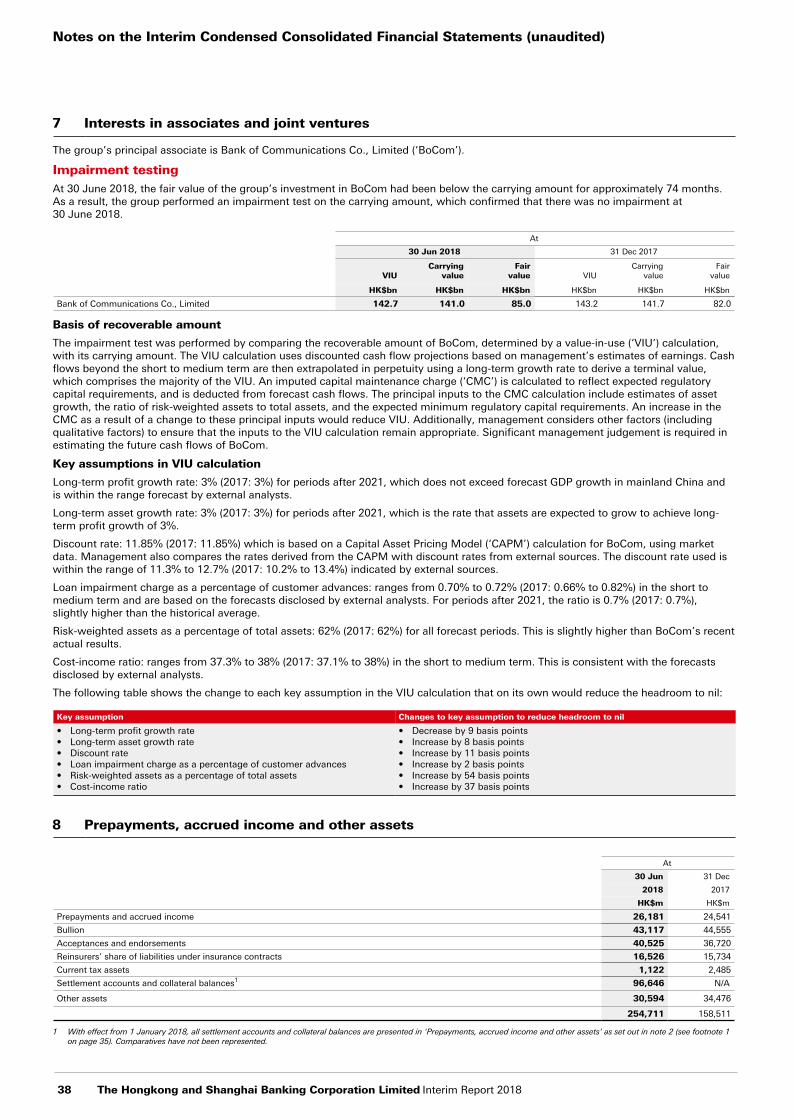
Notes on the Interim Condensed Consolidated Financial Statements (unaudited)
38 The Hongkong and Shanghai Banking Corporation Limited Interim Report 2018
7 Interests in associates and joint ventures
The group’s principal associate is Bank of Communications Co., Limited (‘BoCom’).
Impairment testingAt 30 June 2018, the fair value of the group’s investment in BoCom had been below the carrying amount for approximately 74 months. As a result, the group performed an impairment test on the carrying amount, which confirmed that there was no impairment at 30 June 2018.
At
30 Jun 2018 31 Dec 2017
VIUCarrying
valueFair
value VIUCarrying
valueFair
value
HK$bn HK$bn HK$bn HK$bn HK$bn HK$bn
Bank of Communications Co., Limited 142.7 141.0 85.0 143.2 141.7 82.0
Basis of recoverable amount
The impairment test was performed by comparing the recoverable amount of BoCom, determined by a value-in-use (‘VIU’) calculation, with its carrying amount. The VIU calculation uses discounted cash flow projections based on management’s estimates of earnings. Cash flows beyond the short to medium term are then extrapolated in perpetuity using a long-term growth rate to derive a terminal value, which comprises the majority of the VIU. An imputed capital maintenance charge (‘CMC’) is calculated to reflect expected regulatory capital requirements, and is deducted from forecast cash flows. The principal inputs to the CMC calculation include estimates of asset growth, the ratio of risk-weighted assets to total assets, and the expected minimum regulatory capital requirements. An increase in the CMC as a result of a change to these principal inputs would reduce VIU. Additionally, management considers other factors (including qualitative factors) to ensure that the inputs to the VIU calculation remain appropriate. Significant management judgement is required in estimating the future cash flows of BoCom.
Key assumptions in VIU calculation
Long-term profit growth rate: 3% (2017: 3%) for periods after 2021, which does not exceed forecast GDP growth in mainland China and is within the range forecast by external analysts.
Long-term asset growth rate: 3% (2017: 3%) for periods after 2021, which is the rate that assets are expected to grow to achieve long-term profit growth of 3%.
Discount rate: 11.85% (2017: 11.85%) which is based on a Capital Asset Pricing Model (‘CAPM’) calculation for BoCom, using market data. Management also compares the rates derived from the CAPM with discount rates from external sources. The discount rate used is within the range of 11.3% to 12.7% (2017: 10.2% to 13.4%) indicated by external sources.
Loan impairment charge as a percentage of customer advances: ranges from 0.70% to 0.72% (2017: 0.66% to 0.82%) in the short to medium term and are based on the forecasts disclosed by external analysts. For periods after 2021, the ratio is 0.7% (2017: 0.7%), slightly higher than the historical average.
Risk-weighted assets as a percentage of total assets: 62% (2017: 62%) for all forecast periods. This is slightly higher than BoCom’s recent actual results.
Cost-income ratio: ranges from 37.3% to 38% (2017: 37.1% to 38%) in the short to medium term. This is consistent with the forecasts disclosed by external analysts.
The following table shows the change to each key assumption in the VIU calculation that on its own would reduce the headroom to nil:
Key assumption Changes to key assumption to reduce headroom to nil
• Long-term profit growth rate• Long-term asset growth rate• Discount rate• Loan impairment charge as a percentage of customer advances• Risk-weighted assets as a percentage of total assets• Cost-income ratio
• Decrease by 9 basis points• Increase by 8 basis points• Increase by 11 basis points• Increase by 2 basis points • Increase by 54 basis points• Increase by 37 basis points
8 Prepayments, accrued income and other assets
At
30 Jun 31 Dec
2018 2017
HK$m HK$m
Prepayments and accrued income 26,181 24,541
Bullion 43,117 44,555
Acceptances and endorsements 40,525 36,720
Reinsurers’ share of liabilities under insurance contracts 16,526 15,734
Current tax assets 1,122 2,485
Settlement accounts and collateral balances1 96,646 N/A
Other assets 30,594 34,476
254,711 158,511
1 With effect from 1 January 2018, all settlement accounts and collateral balances are presented in 'Prepayments, accrued income and other assets' as set out in note 2 (see footnote 1 on page 35). Comparatives have not been represented.
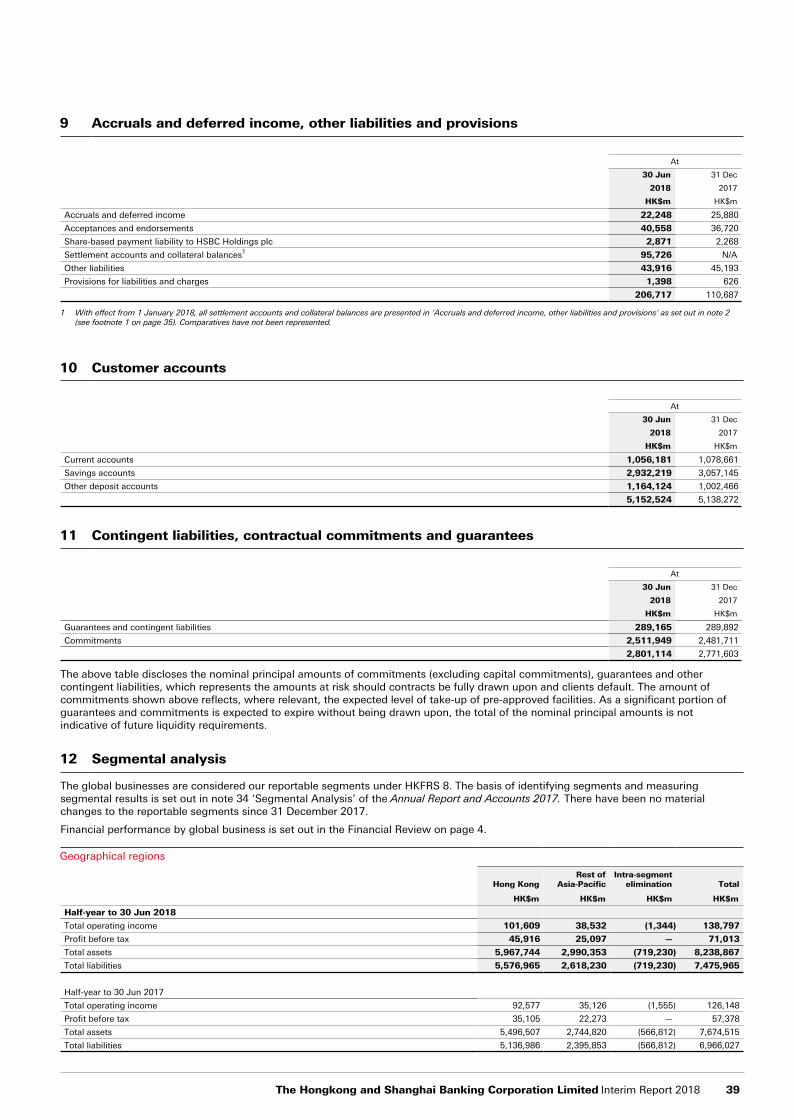
The Hongkong and Shanghai Banking Corporation Limited Interim Report 2018 39
9 Accruals and deferred income, other liabilities and provisions
At
30 Jun 31 Dec
2018 2017
HK$m HK$m
Accruals and deferred income 22,248 25,880
Acceptances and endorsements 40,558 36,720
Share-based payment liability to HSBC Holdings plc 2,871 2,268
Settlement accounts and collateral balances1 95,726 N/A
Other liabilities 43,916 45,193
Provisions for liabilities and charges 1,398 626
206,717 110,687
1 With effect from 1 January 2018, all settlement accounts and collateral balances are presented in 'Accruals and deferred income, other liabilities and provisions' as set out in note 2 (see footnote 1 on page 35). Comparatives have not been represented.
10 Customer accounts
At
30 Jun 31 Dec
2018 2017
HK$m HK$m
Current accounts 1,056,181 1,078,661
Savings accounts 2,932,219 3,057,145
Other deposit accounts 1,164,124 1,002,466
5,152,524 5,138,272
11 Contingent liabilities, contractual commitments and guarantees
At
30 Jun 31 Dec
2018 2017
HK$m HK$m
Guarantees and contingent liabilities 289,165 289,892
Commitments 2,511,949 2,481,711
2,801,114 2,771,603
The above table discloses the nominal principal amounts of commitments (excluding capital commitments), guarantees and other contingent liabilities, which represents the amounts at risk should contracts be fully drawn upon and clients default. The amount of commitments shown above reflects, where relevant, the expected level of take-up of pre-approved facilities. As a significant portion of guarantees and commitments is expected to expire without being drawn upon, the total of the nominal principal amounts is not indicative of future liquidity requirements.
12 Segmental analysis
The global businesses are considered our reportable segments under HKFRS 8. The basis of identifying segments and measuring segmental results is set out in note 34 ‘Segmental Analysis’ of the Annual Report and Accounts 2017. There have been no material changes to the reportable segments since 31 December 2017.
Financial performance by global business is set out in the Financial Review on page 4.
Geographical regions
Hong KongRest of
Asia-PacificIntra-segment
elimination Total
HK$m HK$m HK$m HK$m
Half-year to 30 Jun 2018
Total operating income 101,609 38,532 (1,344) 138,797
Profit before tax 45,916 25,097 — 71,013
Total assets 5,967,744 2,990,353 (719,230) 8,238,867
Total liabilities 5,576,965 2,618,230 (719,230) 7,475,965
Half-year to 30 Jun 2017
Total operating income 92,577 35,126 (1,555) 126,148
Profit before tax 35,105 22,273 — 57,378
Total assets 5,496,507 2,744,820 (566,812) 7,674,515
Total liabilities 5,136,986 2,395,853 (566,812) 6,966,027

Notes on the Interim Condensed Consolidated Financial Statements (unaudited)
40 The Hongkong and Shanghai Banking Corporation Limited Interim Report 2018
13 Fair values of financial instruments carried at fair value
The accounting policies, control framework and hierarchy used to determine fair values at 30 June 2018 are consistent with those applied for the Annual Report and Accounts 2017.
The following table provides an analysis of financial instruments carried at fair value and bases of valuation:
Fair Value Hierarchy
Level 1 Level 2 Level 3Third-party
totalInter-
company2 Total
HK$m HK$m HK$m HK$m HK$m HK$m
At 30 Jun 2018
Assets
Trading assets1 341,616 170,487 36 512,139 — 512,139
Derivatives 6,448 238,745 752 245,945 91,355 337,300
Financial assets designated and otherwise mandatorily measured atfair value 80,493 35,712 17,935 134,140 — 134,140
Financial investments at fair value through other comprehensiveincome 1,015,178 337,813 4,939 1,357,930 — 1,357,930
Liabilities
Trading liabilities1,3 93,601 7,838 — 101,439 — 101,439
Derivatives 6,360 238,057 1,232 245,649 82,424 328,073
Financial liabilities designated at fair value1,3 — 173,623 10,824 184,447 — 184,447
At 31 Dec 2017
Assets
Trading assets1 300,646 195,575 213 496,434 — 496,434
Derivatives 4,773 215,869 517 221,159 79,084 300,243
Financial assets designated at fair value 90,641 23,567 8,438 122,646 — 122,646
Available-for-sale financial investments 916,385 498,512 5,033 1,419,930 — 1,419,930
Liabilities
Trading liabilities1,3 79,209 141,972 10,184 231,365 — 231,365
Derivatives 4,501 232,627 1,959 239,087 70,266 309,353
Financial liabilities designated at fair value1,3 — 49,278 — 49,278 — 49,278
1 Amounts with HSBC Group entities are not included here.2 Derivatives balances with HSBC Group entities are largely under ‘Level 2’.3 With effect from 1 January 2018, financial liabilities which contain both deposit and derivative components (previously classified as trading liabilities) have been classified as
designated at fair value as set out in note 2 (see footnote 10 on page 35).
Transfers between Level 1 and Level 2 fair valuesAssets Liabilities
Financialinvestments
Tradingassets
Designated andotherwise
mandatorilymeasured at
fair value DerivativesTrading
liabilitiesDesignated at
fair value Derivatives
HK$m HK$m HK$m HK$m HK$m HK$m HK$m
At 30 Jun 2018
Transfers from Level 1 to Level 2 91 539 — — 23 — —
Transfers from Level 2 to Level 1 86,113 15,549 — — 68 — —
Assets Liabilities
Available-for-sale Held for trading
Designated atfair value Derivatives Held for trading
Designated atfair value Derivatives
HK$m HK$m HK$m HK$m HK$m HK$m HK$m
At 31 Dec 2017
Transfers from Level 1 to Level 2 5,424 9,402 — — — — —
Transfers from Level 2 to Level 1 63,280 — — — — — —
Transfers between levels of the fair value hierarchy are deemed to occur at the end of each quarterly reporting period. Transfers into and out of Levels of the fair value hierarchy are primarily attributable to changes in observability of valuation inputs and price transparency.
Movements in Level 3 financial instruments
Balances reported in Level 3 increased, mainly in financial assets designated at fair value due to growth in insurance business. There were no material transfers from/to Level 1 and 2 as a result of change in observability of valuation inputs in the first half of 2018 (1H2017: immaterial).

The Hongkong and Shanghai Banking Corporation Limited Interim Report 2018 41
14 Fair values of financial instruments not carried at fair value
Fair values of financial instruments not carried at fair value and bases of valuation
At
30 Jun 2018 31 Dec 2017
Carryingamount Fair value
Carryingamount Fair value
HK$m HK$m HK$m HK$m
Assets
Reverse repurchase agreements – non-trading 345,937 346,346 330,890 330,776
Placings with and advances to banks 441,132 440,869 433,005 433,213
Loans and advances to customers 3,496,917 3,486,437 3,328,980 3,322,511
Financial investments – at amortised cost 365,824 362,779 300,244 309,484
Liabilities
Repurchase agreements – non-trading 60,991 60,984 47,170 47,155
Deposits by banks 208,402 208,382 201,697 201,689
Customer accounts 5,152,524 5,152,172 5,138,272 5,138,352
Debt securities in issue 46,962 47,118 38,394 38,279
Subordinated liabilities 4,111 3,392 4,090 3,766
Preference shares 21,116 21,522 21,037 21,539
Other financial instruments not carried at fair value are typically short-term in nature or re-price to current market rates frequently. Accordingly, their carrying amount is a reasonable approximation of fair value.
Details of how the fair values of financial instruments that are not carried at fair value on the balance sheet are calculated can be found in note 37 of the Annual Report and Accounts 2017.
15 Related party transactions
There were no changes in the related party transactions described in the Annual Report and Accounts 2017 that have had a material effect on the financial position or performance of the group in the half-year to 30 June 2018. All related party transactions that took place in the half-year to 30 June 2018 were similar in nature to those disclosed in the Annual Report and Accounts 2017.
16 Legal proceedings and regulatory matters
The group is party to legal proceedings and regulatory matters in a number of jurisdictions arising out of its normal business operations. Apart from the matters described below, the Bank considers that none of these matters are material. The recognition of provisions is determined in accordance with the accounting policies set out in note 1.2(j) of the Annual Report and Accounts 2017. While the outcome of legal proceedings and regulatory matters is inherently uncertain, management believes that, based on the information available to it, appropriate provisions have been made in respect of these matters as at 30 June 2018. Any provision recognised does not constitute an admission of wrongdoing or legal liability. It is not practicable to provide an aggregate estimate of potential liability for our legal proceedings and regulatory matters as a class of contingent liabilities.
Anti-money laundering and sanctions-related mattersIn 2010, HSBC Bank USA entered into a consent cease and desist order with the Office of the Comptroller of the Currency (‘OCC’) and the indirect parent of that company, HSBC North America Holdings Inc. (‘HNAH’), entered into a consent cease and desist order with the US Federal Reserve Board (‘FRB’). In 2012, HSBC Bank USA further entered into an enterprise-wide compliance consent order with the OCC (together the ‘Orders’). These Orders required improvements to establish an effective compliance risk management programme across HSBC’s US businesses, including risk management related to the US Bank Secrecy Act (‘BSA’) and anti-money laundering (‘AML’) compliance. In 2012, an additional consent order was entered into with the OCC that required HSBC Bank USA to correct the circumstances noted in the OCC’s report and imposed restrictions on HSBC Bank USA acquiring control of, or holding an interest in, any new financial subsidiary, or commencing a new activity in its existing financial subsidiary, without the OCC’s approval.
In June 2018, the OCC terminated the 2010 consent cease-and-desist order and the 2012 enterprise-wide compliance consent order after determining that HSBC Bank USA had satisfied the requirements of those respective orders. The 2010 consent cease and desist order entered into with the FRB and the 2012 additional consent order entered into with the OCC, remain open.
In December 2012, HSBC Holdings plc, HNAH and HSBC Bank USA entered into agreements with US and UK government and regulatory agencies regarding past inadequate compliance with the BSA, AML and sanctions laws. Among those agreements, HSBC Holdings plc and HSBC Bank USA entered into a five-year deferred prosecution agreement with, among others, the US Department of Justice (‘DoJ’) (the ‘AML DPA’); and HSBC Holdings plc consented to a cease-and-desist order and HSBC Holdings plc and HNAH consented to a civil money penalty order with the FRB. HSBC Holdings plc also entered into an agreement with the Office of Foreign Assets Control (‘OFAC’) regarding historical transactions involving parties subject to OFAC sanctions, as well as an undertaking with the UK Financial Conduct Authority (‘FCA’) to comply with certain forward-looking AML and sanctions-related obligations. In addition, HSBC Bank USA entered into civil money penalty orders with the Financial Crimes Enforcement Network of the US Treasury Department and the OCC.
Under these agreements, HSBC Holdings plc and HSBC Bank USA made payments totalling US$1.9bn to US authorities and undertook various further obligations, including, among others, to retain an independent compliance monitor (who is, for FCA purposes, a ‘skilled person’ under section 166 of the Financial Services and Markets Act) to produce annual assessments of the Group’s AML and sanctions compliance programme (the ‘Monitor’). Under the 2012 cease-and-desist order issued by the FRB, the Monitor also serves as an independent consultant to conduct annual assessments. In February 2018, the Monitor delivered his fourth annual follow-up review report.
Notes on the Interim Condensed Consolidated Financial Statements (unaudited)
42 The Hongkong and Shanghai Banking Corporation Limited Interim Report 2018
Through his country-level reviews, the Monitor identified potential anti-money laundering and sanctions compliance issues that HSBC is reviewing further with the DoJ, FRB and/or FCA. In particular, the DoJ is investigating HSBC’s handling of a corporate customer’s accounts. In addition, the Financial Crimes Enforcement Network of the US Treasury Department, as well as the Civil Division of the US Attorney’s Office for the Southern District of New York are investigating the collection and transmittal of third-party originator information in certain payments instructed over HSBC’s proprietary payment systems. HSBC is cooperating with all of these investigations.
In December 2017, the AML DPA expired and the charges deferred by the AML DPA were dismissed. The Monitor will continue working in his capacity as a skilled person and independent consultant for a period of time at the FCA’s and FRB’s discretion.
These settlements with US and UK authorities have led to private litigation, and do not preclude further private litigation related to HSBC’s compliance with applicable BSA, AML and sanctions laws or other regulatory or law enforcement actions for BSA, AML, sanctions or other matters not covered by the various agreements.
Tax investigationsThe Bank continues to cooperate with the relevant US and other authorities, including with respect to clients of the Bank in India who may have had US tax reporting obligations.
In addition, various tax administration, regulatory and law enforcement authorities around the world, including in India, are conducting investigations and reviews of HSBC Swiss Private Bank and other HSBC companies in connection with allegations of tax evasion or tax fraud, money laundering and unlawful cross-border banking solicitation. In February 2015, the Indian tax authority issued a summons and request for information to the Bank in India.
The Bank and other HSBC companies are cooperating with the relevant authorities in these ongoing investigation. There are many factors that may affect the range of outcomes, and the resulting financial impact, of these investigations and reviews, which could be significant.
In light of the media attention regarding these matters, it is possible that other tax administration, regulatory or law enforcement authorities will also initiate or enlarge similar investigations or regulatory proceedings.
Mossack Fonseca & Co.HSBC has received requests for information from various regulatory and law enforcement authorities around the world concerning persons and entities believed to be linked to Mossack Fonseca & Co., a service provider of personal investment companies. HSBC is cooperating with the relevant authorities.
Based on the facts currently known, it is not practicable at this time for HSBC to predict the resolution of these matters, including the timing or any possible impact on HSBC, which could be significant.
Singapore Interbank Offered Rate (‘SIBOR’), Singapore Swap Offer Rate (‘SOR’) and Australia Bank Bill Swap Rate (‘BBSW’)In July 2016 and August 2016, HSBC and other panel banks were named as defendants in two putative class actions filed in the New York District Court on behalf of persons who transacted in products related to the SIBOR, SOR and BBSW benchmark rates. The complaints allege, among other things, misconduct related to these benchmark rates in violation of US antitrust, commodities and racketeering laws, and state law. In October 2017, the defendants moved to dismiss the SIBOR and SOR case and this motion remains pending. The defendants moved to dismiss the BBSW case in February 2017 and filed a renewed motion to dismiss on standing and capacity to sue grounds in February 2018, and these motions also remain pending. There are many factors that may affect the range of outcomes, and the resulting financial impact, of these matters, which could be significant.
Foreign exchange rate investigationsVarious regulators and competition and law enforcement authorities around the world, including in South Korea, are conducting civil and criminal investigations and reviews into trading by HSBC and others on the foreign exchange markets. The Bank and other HSBC companies are cooperating with these investigations and reviews.
In January 2018, HSBC Holdings plc entered into a three-year deferred prosecution agreement with the Criminal Division of the DoJ (the ‘FX DPA’), regarding fraudulent conduct in connection with two particular transactions in 2010 and 2011. This concluded the DoJ’s investigation into HSBC’s historical foreign exchange activities. Under the terms of the FX DPA, HSBC has a number of ongoing obligations, including continuing to cooperate with authorities and implementing enhancements to its internal controls and procedures in its Global Markets business, which will be the subject of annual reports to the DoJ. In addition, HSBC agreed to pay a financial penalty and restitution.
There are many factors that may affect the range of outcomes and the resulting financial impact of these investigations, which could be significant.
Hiring practices investigationThe US Securities and Exchange Commission (the ‘SEC’) is investigating multiple financial institutions, including HSBC Holdings plc, in relation to hiring practices of candidates referred by or related to government officials or employees of state-owned enterprises in Asia-Pacific. HSBC has received various requests for information and is cooperating with the SEC's investigation.
Based on the facts currently known, it is not practicable at this time for HSBC to predict the resolution of this matter, including the timing or any possible impact on HSBC, which could be significant.
17 Additional information
The Banking Disclosure Statement at 30 June 2018, which is prepared in accordance with the Banking (Disclosure) Rules made under section 60A of the Banking Ordinance, will be published on our website at www.hsbc.com.hk.

The Hongkong and Shanghai Banking Corporation Limited Interim Report 2018 43
18 Interim Report 2018 and statutory accounts
The information in this Interim Report 2018 is unaudited and does not constitute statutory accounts. The Interim Report 2018 was approved by the Board of Directors on 6 August 2018. The Bank’s statutory annual consolidated accounts for the year ended 31 December 2017 have been delivered to the Registrar of Companies and the Hong Kong Monetary Authority. The auditor has reported on those financial statements in their report dated 20 February 2018. The auditor’s report was unqualified; did not include a reference to any matters to which the auditor drew attention by way of emphasis without qualifying its report; and did not contain a statement under sections 406(2), 407(2) or (3) of the Hong Kong Companies Ordinance (Cap. 622).
19 Ultimate holding company
The Hongkong and Shanghai Banking Corporation Limited is an indirectly-held, wholly-owned subsidiary of HSBC Holdings plc, which is incorporated in England.

The Hongkong and Shanghai Banking Corporation Limited
HSBC Main Building1 Queen's Road Central, Hong KongTelephone: (852) 2822 1111Facsimile: (852) 2810 1112 www.hsbc.com.hk