The hitchhiker s guide to single-locus species delimitation
13
RESOURCE ARTICLE The hitchhiker’s guide to single-locus species delimitation Simon Dellicour 1,2 | Jean-Franc ßois Flot 3,4 1 Department of Microbiology and Immunology, Rega Institute, KU Leuven – University of Leuven, Leuven, Belgium 2 Spatial Epidemiology Lab (SpELL), Universit e libre de Bruxelles, Bruxelles, Belgium 3 Evolutionary Biology & Ecology, Universit e libre de Bruxelles, Bruxelles, Belgium 4 Interuniversity Institute of Bioinformatics in Brussels – (IB) 2 , Brussels, Belgium Correspondence Simon Dellicour, Department of Microbiology and Immunology, Rega Institute, KU Leuven – University of Leuven, Herestraat 49, 3000 Leuven, Belgium. Email: [email protected] and Jean-Franc ßois Flot, Evolutionary Biology & Ecology, Universit e libre de Bruxelles, C.P. 160/12, Avenue F. D. Roosevelt 50, 1050 Bruxelles, Belgium. Email: [email protected] Abstract Molecular approaches to species delimitation are increasingly used to ascertain the number of species in a sample prior to taxonomic, ecological or physiological stud- ies. Although multilocus approaches are gaining fast in popularity, single-gene methods still predominate in the literature. However, available simulation bench- marks of these methods focus exclusively on species-poor samples and/or tree- based approaches: as a result, travellers in the land of single-locus species delimita- tion lack a comprehensive “hitchhiker’s guide” highlighting the sweet spots and dangers on their road. To fill this gap, we compared the performances of distance- based (ABGD, “automatic barcode gap discovery”), allele sharing-based (haplowebs) and tree-based approaches (GMYC, “generalized mixed Yule-coalescent” and PTP, “Poisson tree processes”) to detect interspecific boundaries in samples of 6, 60 and 120 simulated species with various speciation rates, effective population sizes, mutation rates and sampling patterns. We found that all approaches performed poorly when population sizes and speciation rates were large, with haplowebs yielding best results followed by ABGD then tree-based approaches. The latter’s error type was mostly oversplitting, whereas ABGD chiefly overlumped and hap- lowebs leaned either way depending on simulation parameters: such widely diver- gent error patterns suggest that, if all three types of methods agree, then the resulting delimitation is probably correct. Perfect congruence being quite rare, trav- ellers in search of a one-size-fit-all approach to single-locus species delimitation should forget it; however, our hitchhiker’s guide raises hope that such species delimitation’s Holy Grail may be found in the relatively uncharted nearby land of multilocus species delimitation. KEYWORDS automatic barcode gap discovery, generalized mixed Yule-coalescent, haploweb, molecular markers, Poisson tree processes, species delimitation 1 | INTRODUCTION Species delimitation methods are increasingly used in integrative tax- onomic and systematic studies to delineate and identify species-level entities (Flot, 2015; Sites & Marshall, 2003). Indeed, species delimita- tion is a crucial prerequisite to, for example, ecological, population genetic or phylogeographic analyses, in which failure to ensure that all samples analysed are conspecific can lead to erroneous conclusions (Bortolus, 2008). In the last years, various single-locus and, more recently, multilocus species delimitation methods based on molecular data have been developed (Fontaneto, Flot, & Tang, 2015). While multilocus approaches have the appeal of simultane- ously considering several unlinked loci when delineating species, they are, on the other hand, computationally very demanding when dealing with large data sets (Fujisawa, Aswad, & Barraclough, 2016). Most single-locus approaches are considerably faster to run, and Received: 5 November 2017 | Revised: 23 May 2018 | Accepted: 24 May 2018 DOI: 10.1111/1755-0998.12908 Mol Ecol Resour. 2018;1–13. wileyonlinelibrary.com/journal/men © 2018 John Wiley & Sons Ltd | 1
Transcript of The hitchhiker s guide to single-locus species delimitation

R E SOU R C E A R T I C L E
The hitchhikerrsquos guide to single-locus species delimitation
Simon Dellicour12 | Jean-Francois Flot34
1Department of Microbiology and
Immunology Rega Institute KU Leuven ndash
University of Leuven Leuven Belgium
2Spatial Epidemiology Lab (SpELL)
Universite libre de Bruxelles Bruxelles
Belgium
3Evolutionary Biology amp Ecology Universite
libre de Bruxelles Bruxelles Belgium
4Interuniversity Institute of Bioinformatics
in Brussels ndash (IB)2 Brussels Belgium
Correspondence
Simon Dellicour Department of
Microbiology and Immunology Rega
Institute KU Leuven ndash University of Leuven
Herestraat 49 3000 Leuven Belgium
Email simondellicourkuleuvenbe
and
Jean-Francois Flot Evolutionary Biology amp
Ecology Universite libre de Bruxelles CP
16012 Avenue F D Roosevelt 50 1050
Bruxelles Belgium
Email jflotulbacbe
Abstract
Molecular approaches to species delimitation are increasingly used to ascertain the
number of species in a sample prior to taxonomic ecological or physiological stud-
ies Although multilocus approaches are gaining fast in popularity single-gene
methods still predominate in the literature However available simulation bench-
marks of these methods focus exclusively on species-poor samples andor tree-
based approaches as a result travellers in the land of single-locus species delimita-
tion lack a comprehensive ldquohitchhikerrsquos guiderdquo highlighting the sweet spots and
dangers on their road To fill this gap we compared the performances of distance-
based (ABGD ldquoautomatic barcode gap discoveryrdquo) allele sharing-based (haplowebs)
and tree-based approaches (GMYC ldquogeneralized mixed Yule-coalescentrdquo and PTP
ldquoPoisson tree processesrdquo) to detect interspecific boundaries in samples of 6 60
and 120 simulated species with various speciation rates effective population sizes
mutation rates and sampling patterns We found that all approaches performed
poorly when population sizes and speciation rates were large with haplowebs
yielding best results followed by ABGD then tree-based approaches The latterrsquos
error type was mostly oversplitting whereas ABGD chiefly overlumped and hap-
lowebs leaned either way depending on simulation parameters such widely diver-
gent error patterns suggest that if all three types of methods agree then the
resulting delimitation is probably correct Perfect congruence being quite rare trav-
ellers in search of a one-size-fit-all approach to single-locus species delimitation
should forget it however our hitchhikerrsquos guide raises hope that such species
delimitationrsquos Holy Grail may be found in the relatively uncharted nearby land of
multilocus species delimitation
K E YWORD S
automatic barcode gap discovery generalized mixed Yule-coalescent haploweb molecular
markers Poisson tree processes species delimitation
1 | INTRODUCTION
Species delimitation methods are increasingly used in integrative tax-
onomic and systematic studies to delineate and identify species-level
entities (Flot 2015 Sites amp Marshall 2003) Indeed species delimita-
tion is a crucial prerequisite to for example ecological population
genetic or phylogeographic analyses in which failure to ensure that
all samples analysed are conspecific can lead to erroneous
conclusions (Bortolus 2008) In the last years various single-locus
and more recently multilocus species delimitation methods based
on molecular data have been developed (Fontaneto Flot amp Tang
2015) While multilocus approaches have the appeal of simultane-
ously considering several unlinked loci when delineating species
they are on the other hand computationally very demanding when
dealing with large data sets (Fujisawa Aswad amp Barraclough 2016)
Most single-locus approaches are considerably faster to run and
Received 5 November 2017 | Revised 23 May 2018 | Accepted 24 May 2018
DOI 1011111755-099812908
Mol Ecol Resour 20181ndash13 wileyonlinelibrarycomjournalmen copy 2018 John Wiley amp Sons Ltd | 1
single-locus data are also much cheaper to acquire especially when
surveying large numbers of individuals Besides there are situations
in which single-locus approaches are the only available option for
instance when analysing existing barcode data obtained from the
sequencing of a single often mitochondrial gene fragment (Ratnas-
ingham amp Hebert 2007) or when surveying museum specimens for
which the quality and quantity of DNA recovered is often limited
Finally even when analysing multilocus data sets it can also be
interesting to compare results obtained from each locus considered
independently in order to look at their level of congruence for
instance by means of a conspecificity matrix (Debortoli et al 2016)
For all these reasons single-locus delimitation methods are still
widely used and will likely continue to be so for many years They
also remain an active field of study with new methods being regu-
larly proposed and published
Single-locus species delimitation methods fall under several
broad categories (Flot 2015 Fontaneto et al 2015) distance-based
approaches such as DNA barcoding and ABGD (automatic barcode
gap discovery Puillandre Lambert Brouillet amp Achaz 2012) allele
sharing-based approaches such as haplowebs (Flot Couloux amp Tillier
2010) and tree-based approaches that may be rooted in generalized
mixed Yule-coalescent (GMYC) models (Pons et al 2006) or in Pois-
son tree processes (PTP Zhang Kapli Pavlidis amp Stamatakis 2013)
Even within a given category there exists a wide variety of algo-
rithms and implementations For instance there are at least three
different implementations of GMYC models single-threshold (Pons
et al 2006) multiple-threshold (Monaghan et al 2009) and Baye-
sian (Reid amp Carstens 2012) that can yield strikingly different results
when applied to the same data set (Dellicour amp Flot 2015) Rigorous
reproducible benchmarks using simulated data are therefore needed
to quantify and compare the performances of the various approaches
available under a wide range of parameters However nearly all
simulation-based benchmarks have so far focused exclusively on tree-
based approaches while neglecting distance-based and allele sharing-
based methods (Esselstyn Evans Sedlock Anwarali Khan amp Heaney
2012 Fujisawa amp Barraclough 2013 Lohse 2009 Papadopoulou
et al 2008 Reid amp Carstens 2012 Tang Humphreys Fontaneto amp
Barraclough 2014 Zhang et al 2013) As a result travellers in the
land of species delimitation are left without a comprehensive
hitchhikerrsquos guide to inform them of the sweet spots and dangers on
their road
In 2015 we performed for the first time a benchmark (Dellicour
amp Flot 2015) including approaches from the three main groups out-
lined above namely barcode gaps three implementations of GMYC
and haplowebs For computational reasons we only tested these
methods on relatively species-poor simulated data sets comprising 1
3 or 6 species As ABGD is geared towards species-rich data sets
(Puillandre et al 2012) we did not include it in our benchmark
instead the ability of distance-based approaches to delineate species
correctly was assessed by comparing directly the distributions of
intraspecific and interspecific distances whereas the performance of
haplowebs and GMYC-based approaches was analysed by computing
the number of pairs of individuals correctly assigned as conspecific
or heterospecific One of the main conclusions of our article was
that among the methods we tested only haplowebs can be used to
detect species boundaries (or rather the lack thereof) in data sets
comprising a single species whereas the overall performance of all
methods improved when the number of species increased This is
not surprising as most of these methods (with the exception of hap-
lowebs) were designed with species-rich data sets in mind however
even for data sets of six species the various methods tested only
worked well in the ldquosweet spotrdquo where the effective population sizes
and speciation rates of our simulated species were low
Here we present a new benchmark dedicated to relatively ldquospe-
cies-richrdquo data sets comprising 6 60 and 120 species The 60-species
and 120-species cases were chosen based on a quick survey of the
usual number of species included in articles attempting single-locus
species delimitation although some articles include more species we
limited ourselves to a maximum of 120 species for computational
reasons In addition to the methods tested in our 2015 article this
time we included ABGD as well as PTP in our benchmark although
PTP is like GMYC a tree-based method it does not require ultra-
metric trees because it models speciation rate using directly the
number of substitutions (Zhang et al 2013) which makes it faster
and easier to run than GMYC while being according to a previous
simulation study (Tang et al 2014) at least as effective In order to
simulate sampling patterns closer to those typical of real-world bio-
diversity studies (Ahrens et al 2016 Lim Balke amp Meier 2012) we
departed from the equal sampling we had used in our 2015 study
and instead compared the results of two sampling schemes a ldquoshort-
tailrdquo sampling patterns with many abundant species and a few rare
ones and a ldquolong-tailrdquo sampling scheme with a few abundant species
and many rare ones Last but not least to include synthetic charts in
our hitchhikerrsquos guide we crafted condensed graphically intuitive
representations of our results in the form of ternary plots highlight-
ing the relative influence of each simulation parameter on the per-
formance of the approaches we tested The resulting benchmark
applies not only to single-locus studies sensu stricto but also to stud-
ies based on separate analyses of several markers (in contrast with
multilocus approaches that analyse several markers simultaneously
such approaches being computationally very intensive especially
when dealing with species-rich data sets were not included in our
study)
2 | MATERIAL AND METHODS
21 | Data sets simulations
Simulations were performed using the python package DENDROPY
3120 (Sukumaran amp Holder 2010) We first simulated trees of
either 6 60 or 120 species using a Yule model with three different
birth rates (01 1 and 10 births per lineage per million generations)
then used standard coalescent conditions with population sizes of
104 105 and 106 to simulate ten replicate genealogies for several
sampling patterns The selected birth rate values correspond to the
range of speciation rates reported for a variety of organisms and the
2 | DELLICOUR AND FLOT
effective population sizes to a range of biologically relevant values
as detailed in Esselstyn et al (2012) as well as in Dellicour and Flot
(2015) Although migration (ie gene flow between populations) may
potentially affect the performance of the different methods we
tested we limited ourselves here to considering a single panmictic
population for each simulated species
We implemented two different sampling patterns in our simula-
tions For the ldquoshort-tailrdquo pattern we simulated 10 sequences per
species (as obtained when sequencing five diploid individuals) for
five-sixths of the species and 2 sequences per species (as obtained
when sequencing a single diploid individual) for the remaining one-
sixth whereas for the ldquolong-tailrdquo pattern we simulated 10 sequences
per species for one-sixth of the species and two sequences per spe-
cies for the remaining five-sixths As in Dellicour and Flot (2015)
each simulated genealogy was turned into three alignments of
1000-bp sequences using mutation rates of 108 107 and 106
mutations per generation and per base The lowest figure is the
overall mutation rate reported for the human nuclear genome by
Roach et al (2010) and we also simulated mutation rates two orders
of magnitude higher to make our benchmark relevant to the highly
variable markers favoured in species delimitation studies (such as
mitochondrial genes intervening transcribed spacers and nuclear
gene introns) As haplowebs require as input pairs of sequences from
diploid individuals we simulated them by forming random pairs of
conspecific sequences (without replacement) from the alignments
obtained above thereby mimicking the process of sexual reproduc-
tion in panmictic populations (which is commonly modelled as pick-
ing randomly pairs of genes without replacement)
22 | Species delimitation methods
As in Dellicour and Flot (2015) we started by evaluating the potential
for DNA barcoding to delineate accurately species by comparing the
distributions of intraspecific and interspecific distances (ldquomismatch
distributionsrdquo) the rationale being that for distance-based approaches
to work intraspecific distances should be markedly smaller than inter-
specific ones (Fontaneto et al 2015) Mismatch distributions and the
corresponding Sarlersquos bimodality coefficients (a measure of bimodality
that varies between 0 for perfectly unimodal data and 1 for perfectly
bimodal data bi- or multimodal distributions have Sarlersquos coefficient
values between 59 and 1 whereas unimodal distribution have values
below 59 Ellison 1987 Pfister Schwarz Janczyk Dale amp Freeman
2013) were respectively computed using the R packages ldquopegasrdquo
(Paradis 2010) and ldquomomentsrdquo (Komsta amp Novomestky 2012)
Barcode gap analyses were performed using the command-line
version of the ABGD (automatic barcode gap discovery) program
(Puillandre et al 2012) ABGD requires users to provide several
parameters the choice of a distance metrics (eg JukesndashCantor or
p-distances) a prior limit to intraspecific diversity (P) and a proxy for
the minimum gap width (X) For each set of user parameters it
returns two delimitations a ldquoprimary partitionrdquo and a ldquorecursive onerdquo
obtained after applying its algorithm recursively To decide which
one of these many possible delimitations to follow ABGD authors
advise using other sources of information such as morphology How-
ever as our benchmark required a single delimitation output for each
method we ran ABGD under many different sets of parameters and
chose the output most frequently obtained Specifically we first ran
ABGD under its default set of parameters (JukesndashCantor distances
P = 0001000 0001668 0002783 0004642 0007743 0012915
0021544 0035938 0059948 et 0100000 X = 15) when ABGD
outputted ldquoOnly one partition found with your data Nothing to out-
put You should try to rerun with a lower Xrdquo we redid the analysis
with X = 10 then X = 05 (if ABGD still outputted the same mes-
sage for X = 05 we concluded that it considered the data set as
monospecific) For about one-third of our simulations ABGD failed
with the error message ldquoThe matrix is not symmetricrdquo probably
because some pairs of sequences in those data sets differed by more
than 75 (making calculation of the distance impossible) hence to
be able to analyse all our data sets we ran them using p-distances
as well then considered both the outputs obtained using JukesndashCan-
tor distances (when it worked) and p-distances when selecting the
most frequent delimitation obtained for each data set A script
automatizing this approach is available on httpsgithubcomjflot
ABGDconsensus
In contrast to distance-based approaches haploweb analyses do
not take into account the number of mutations separating two hap-
lotypes but simply aggregate individuals into putative species on the
basis of the haplotypes they share (Flot et al 2010) Following an
earlier proposal by Doyle (1995 reviewed in Sites amp Marshall 2003)
putative species obtained using this method are called ldquofields for
recombinationrdquo (in short FFRs) and their nonoverlapping sets of
haplotypes ldquogene poolsrdquo Haploweb analyses were performed using
an improved version of the Perl script countFFRspl used in Dellicour
and Flot (2015) the new version of this script is available at https
githubcomjflotcountFFRs2 It takes as input a FASTA alignment of
simulated sequences with names in the form ldquoTxxx_yyyrdquo (where xxx
is the species ID and yyy is the sequence ID) and randomly forms
diploid genotypes under the hypothesis that each species is panmic-
tic It then performs haploweb-based species delimitation on the
resulting data sets and returns a list of individuals marked according
to the species they have been assigned to
To investigate the impact of phylogenetic reconstruction on the
performance of GMYC and PTP methods we performed these analy-
ses both directly on our simulated genealogies and on the phyloge-
netic trees inferred from the DNA sequence alignments simulated
from these genealogies The GMYC method delineates species by
fitting models of inter- and intraspecific processes to ultrametric
phylogenetic trees in order to identify the limit between the two
regimes (Fujisawa amp Barraclough 2013) To do so it optimizes a
mixed model that combines diversification between species (the Yule
model Yule 1925) and genealogical branching within species (the
neutral coalescent model Hudson 1990) The PTP method also aims
to identify the transition points between inter- and intraspecific pro-
cesses (modelled as independent Poisson processes) but specifically
requires that tree branch lengths be proportional to the number of
substitutions (rather than to time as for the GMYC approach)
DELLICOUR AND FLOT | 3
For the GMYC and PTP methods phylogenetic analyses were
performed using the maximum-likelihood (ML) approach imple-
mented in FASTTREE 218 (Price Dehal amp Arkin 2010) As GMYC
methods require trees to be rooted we used the mid-point rooting
implemented in PATHD8 (Britton Anderson Jacquet Lundqvist amp
Bremer 2007) to transform our unrooted ML trees into rooted ultra-
metric We then used the R package ldquosplitsrdquo (Ezard Fujisawa amp Barr-
aclough 2013) to perform single-threshold GMYC (ST-GMYC)
analyses whereas analyses using the Bayesian implementation of
GMYC (bGMYC) were performed by running the eponymous R pack-
age For each analysis bGMYC was run over 110000 generations
discarding the first 10000 as burn-in and sampling every 100 gener-
ations afterwards Because bGMYC returns a probability of conspeci-
ficity for each pair of sequences in the data set its output is not
directly comparable to the groupings of individuals into putative spe-
cies returned by other approaches We therefore added as in Delli-
cour and Flot (2015) a discretization step (during which we retained
only pairs of individuals that had a probability of conspecificity
higher than 095) followed by a transitivization step (during which
individuals were aggregated into species individuals X and Y were
considered conspecific if X was conspecific with Z and Y conspecific
with Z even if the probability of conspecificity of X and Y was lower
than the aforementioned 095 threshold) In the text below
ldquobGMYC-1rdquo and ldquobGMYC-2rdquo refer respectively to the raw and
discretizedndashtransitivized results of bGMYC For Poisson tree pro-
cesses we tested both the original method (PTP Zhang et al 2013)
method and its Bayesian implementation (bPTP httpspeciesh-its
orgptp) We initially planned to include the multiple-threshold
GMYC (MT-GMYC) approach (Monaghan et al 2009) in our com-
parison as in Dellicour and Flot (2015) but it failed to run properly
when more than 6 species were simulated producing outputs only
for a small fraction of our simulated data sets (data not shown) Also
because of the computational challenge of simulating and analysing
large number of sequences we could not complete the benchmark
of 120 species with the short-tail sampling pattern hence for the
120-species case we report only results obtained using the long-tail
sampling pattern
23 | Performance assessment
To assess the performances of the different species delimitation
methods tested we calculated error rates following two distinct
approaches our original ldquopairwise sequence assessmentrdquo approach
(Dellicour amp Flot 2015) and an adaptation of the methods used by
Ratnasingham and Hebert (2013) and Eme et al (2017) to compare
the results of various species delimitation approaches called hence-
forth ldquospecies-unit assessmentrdquo
For the pairwise sequence assessment approach we calculated
the percentage of conspecific pairs of sequences wrongly returned
as heterospecific (hereafter referred to as oversplitting) and the
percentage of heterospecific pairs of sequences mistaken as con-
specific (overlumping) In the case of bGMYC we also computed
the percentage of pairs of sequences that were neither confidently
split nor lumped that is for which the probability of conspecificity
was between 005 and 095 (indecision) Finally we computed the
percentage of pairs of sequences correctly determined (suc-
cess = 100oversplittingoverlumpingindecision)
For the species-unit assessment approach we reported for each
simulation the frequency of the following events (a) matchmdashall the
sequences of a ldquotruerdquo species are detected as conspecific and the
corresponding inferred species does not include any other sequence
(match) (b) lumpmdashthe sequences in the inferred species belong to
more than one actual species and include all the sequences inferred
for those species (lump) (c) splitmdashthe sequences in the inferred
species belong to a single actual species but do not include all the
sequences of that species (split) and (d) reshufflemdashthe sequences
in the inferred species belong to more than one actual species and
do not include all the sequences of those species (reshuffle) As
the species-unit assessment approach compares the inferred species
entities with the actual ones it was not possible to use it for assess-
ing the raw results of bGMYC (bGMYC-1) which reports only pair-
wise conspecificity probabilities As a consequence only the error
rates of the discretizedndashtransitivized output of bGMYC (bGMYC-2)
were included in our species-unit assessment
For each assessment approach the different percentages were
averaged over 10 replicate data sets simulated for each set of simu-
lation parameters In the case of haplowebs diploid genotypes were
simulated for each replicate data set by picking up randomly pairs of
conspecific sequences without replacement This was performed 10
times per replicate data set yielding a total of 100 replicate diploid
populations per set of parameters
For the ldquospecies-unit assessmentrdquo we also performed an overall
comparison of the species delimitation results based on ternary
plots These triangular graphs were generated by plotting the
match split and (lump + reshuffle) on the three axes On these
plots each dot corresponds to the results presented in a single bar-
plot and thus corresponds to one 10-replicate average (or 100-repli-
cate average in the case of haplowebs) Five ternary plots were
generated for each delimitation method (one per simulation parame-
ter) to help visualize these global trends
3 | RESULTS AND DISCUSSION
31 | Pairwise sequence assessment vs species-unitassessment
Using the pairwise sequence assessment approach the performance
of haplowebs GMYC and PTP appeared to increase dramatically
with the number of species in the data set to the point that the
influence of the various parameters could not be visually distin-
guished on the barplots for 120 species (Supporting Information Fig-
ures S1ndashS3) This is because when there are many species most
pairs of heterospecific individuals attributed to the wrong species
are still correctly assigned to the ldquoheterospecificrdquo category By con-
trast the plots obtained using the species-unit assessment approach
were much less influenced by the number of species in the data sets
4 | DELLICOUR AND FLOT
allowing a precise dissection of the influence of each parameter
even when dealing with 120 species (Figures 1ndash4) hence in what
follows we based ourselves solely on the results of the species-unit
assessment In contrast to the pairwise sequence assessment
method the species-unit assessment approach showed very little
visible variation in the performance of the methods when dealing
with 6 60 or 120 species this suggests that our result obtained
using this approach may be extrapolated to even more species-rich
situation comprising hundreds of species
32 | Performance of distance-based speciesdelimitation
Although the average number of pairwise differences was often
lower within species than between them intraspecific and inter-
specific mismatch distributions overlapped for most sets of parame-
ters (Supporting Information Figures S4ndashS8) The only case in which
they did not overlap (ie when a clear barcode gap existed) was for
six species with low effective population sizes low speciation rates
and high mutation rates (Supporting Information Figures S4ndashS5) in
the 60-species and 120-species cases the distributions overlapped
under all tested conditions The distributions of Sarlersquos bimodality
coefficients revealed that intraspecific distances were frequently
multimodal especially when the number of species was low
whereas the global distribution of mismatches was quite often uni-
modal especially when the number of species was high and the
mutation rate of the marker was low (Supporting Information Fig-
ure S9) The above observations were not influenced by the sam-
pling pattern chosen (ldquolong-tailrdquo vs ldquoshort-tailrdquo)
Congruent with these observations we found that the main fac-
tors affecting the performance of ABGD were the effective population
size and the speciation rate this method was most effective for small
population sizes and low speciation rates whereas the success rate
decreased dramatically for large populations speciating fast Less dra-
matic was the influence of mutation rate (the higher the better)
whereas ABGD performed slightly worse on more speciose data sets
and on simulations using the long-tail sampling pattern (Figures 1ndash4
and Supporting Information Figure S10) Overall the main type of error
produced by ABGD was overlumping notably when mutation rate was
low andor speciation rate was high however high mutation rates
produced lots of oversplitting as well whereas elevated speciation
rates and effective population sizes led predominantly to reshuffling
33 | Performance of allele sharing-based speciesdelimitation
Compared with other approaches haplowebs yielded results that were
less variable (Supporting Information Figure S11) resulting in points
tightly grouped (or even piled on top of each other) in the ternary
diagrams Most points were grouped in the top part of the triangle
(Figure 4) highlighting a generally high success rate of species delimi-
tation using this approach (Figures 1ndash3) however some data sets
were oversplit or overlumped resulting in data points respectively
near the lower left or lower right corners of the plot (Figure 4) If spe-
cies delimitations were erroneous it was usually because of overlump-
ing when mutation rates effective population sizes andor speciation
rates were low whereas oversplitting was more prominent when using
markers with high mutation rates when dealing with species with high
effective population sizes andor when speciation rates were high
(Figure 4 and Supporting Information Figure S10) The number of
species did not influence the performance of the method but the
sampling pattern had a strong impact with data points from ldquolong-tailrdquo
sampling resulting in success or lumping and data points from ldquoshort-
tailrdquo sampling leaning more towards splitting (Figure 4)
34 | Performance of tree-based speciesdelimitation
The data points for the four tree-based approaches tested (GMYC-
ST bGMYC PTP and bPTP) were very dispersed in the ternary plots
revealing a high variability of their outcome (Figure 4 and Supporting
Information Figure S10) Still the position of the average points for
each parameter value (displayed as crosses on the ternary diagrams)
revealed a stronger tendency towards oversplitting in the case of
GMYC-ST and bGMYC vs a slightly better overall performance for
PTP and bPTP under the range of parameters used in our simula-
tions In the case of GMYC-ST and bGMYC there was no obvious
influence of the mutation rates of the markers but lumping
increased when the speciation rate went up and success was higher
when the effective population size was small (Figure 4) The success
rate also increased slightly when the number of species increased
and the results were better for the ldquoshort-tailrdquo sampling pattern than
for the ldquolong-tailrdquo one (especially for ST-GMYC Figures 1ndash4)
The influence of the mutation rate was much more prominent in
the case of PTP and bPTP with low mutation rate markers yielding
more overlumping whereas high mutation rates led to oversplitting
In terms of speciation rate however the trends for PTP and bPTP
were nearly identical to those of GMYC-ST and bGMYC increased
speciation rates led to more frequent reshuffling (Figures 1ndash4 and
Supporting Information Figure S10) PTP and bPTP mostly gave cor-
rect answers when effective population sizes were small whereas
even for small effective population sizes GMYC-ST and bGMYC
yielded frequently oversplit results (Figure 4) Sampling pattern also
impacted the performance of the four tree-based approaches tested
here with long-tail sampling patterns yielding better results than
short-tail ones (see below)
35 | Impact of sampling pattern
The tree-based and allele sharing-based approaches we tested per-
formed better on data sets simulated using a long-tail sampling pat-
tern whereas ABGD performed slightly better on data sets
simulated using the short-tail pattern In the case of GMYC and PTP
our findings corroborate the study of Ahrens et al (2016) highlight-
ing that rarely sampled species are not problematic per se for tree--
based approaches to species delimitation The impact of sampling
DELLICOUR AND FLOT | 5
GE 10ndash8 10ndash7 10ndash6
tS Ne haploweb ST-GMYC bGMYC-2 PTP bPTPtM
sampling
10ndash5 104
105
106
10ndash6 104
105
106
10ndash7 104
105
106
10ndash5 104
105
106
10ndash6 104
105
106
10ndash7 104
105
106
6 species(long-tailsamplingpattern)
6 species(short-tailsamplingpattern)
GE 10ndash8 10ndash7 10ndash6GE 10ndash8 10ndash7 10ndash6GE 10ndash8 10ndash7 10ndash610ndash8 10ndash7 10ndash610ndash8 10ndash7 10ndash6
ABGD
6 | DELLICOUR AND FLOT
pattern was most dramatic for haplowebs this is because the sam-
pling of only two sequences per species is equivalent to sampling a
single diploid individual the two haplotypes of which are automati-
cally considered conspecific using the haploweb approach (unlike
tree-based or distance-based approaches that may consider them as
heterospecific)
36 | Impact of species richness
Among the methods tested ABGD distinguished itself by performing
somewhat better on the less speciose data sets (Figures 1ndash4)
whereas the performance of haplowebs was not affected significantly
by the number of species (the averages for 6-species and 60-species
data sets on Figure 4 are similar whereas the performance for the
120-species data set appears higher but this is an artefact resulting
from the fact that only results from the short-tail pattern were pre-
sented) Tree-based methods in contrast performed better on spe-
cies-rich data sets probably because such data sets allow better
calibration of intraspecific vs interspecific branching rates species
richness had a major influence on GMYC methods but was less dra-
matic for PTP approaches
37 | Impact of effective population size
Overall all methods performed better when applied to species with
small effective population sizes than to species with large effective
population sizes In the case of distance-based approaches this is
because the low amount of genetic drift in species with large effec-
tive population sizes is inefficient at pruning their ancestral polymor-
phism resulting in genetic distances as large within species as
between them Similarly in the case of tree-based approaches large
effective population sizes slow down lineage sorting resulting in a
greater time lag between speciation and the acquisition of mono-
phyly that is required by these approaches to delineate species (Flot
et al 2010) Even though haplowebs do not require species mono-
phyly nor genetic distances smaller within species than between
them this approach is still negatively impacted by a large effective
population size for two reasons first it increases the probability that
a few haplotypes shared between species persist resulting in lump-
ing and second it increases haplotypic diversity resulting in splitting
as more individuals have to be sequenced to reach the point when
all the haplotypes sampled from a given species are connected by
heterozygous individuals
38 | Impact of speciation rate
Similarly all approaches worked better when applied to species with
low speciation rates than to species with high speciation rates This
is because species simulated using a low speciation rate are on aver-
age older than species simulated using a high speciation rate and
ancient species have had more time to reach mutual allelic exclusiv-
ity (in the case of allele sharing-based approaches) reciprocal allelic
monophyly (in the case of tree-based approaches) andor minimally
overlapping distributions of intra- vs interspecific distances (in the
case of distance-based approaches) The fact that among these
three stages reciprocal allelic monophyly is the one that takes
always the longest time to reach (because it implies the two others
Flot et al 2010) probably explains the relatively lower performance
of tree-based approaches compared to distance-based and allele
sharing-based approaches under the range of parameters tested
here
39 | Impact of mutation rate
Mutation rates had a very different impact depending on the method
Barcode gap detection and most tree-based approaches (except
GMYC-ST) worked better with markers that had high mutation rates
whereas GMYC-STrsquos performance was higher when mutation rate
was low In the case of haplowebs the success rate did not vary much
depending on mutation rate but affected the type of error the most
frequent error type was overlumping when low-variation markers
were used vs oversplitting in the case of highly variable markers
4 | CONCLUSIONS ANDRECOMMENDATIONS
All in all our present study confirms and extends the main findings
of our previous exploration of the ldquospecies-poorrdquo case (Dellicour amp
Flot 2015) The combination of a small effective population size and
a low speciation rate is globally confirmed as a ldquosweet spotrdquo for both
species-poor and species-rich data sets Our study also corroborates
the results of previous articles focusing on tree-based approaches
(Esselstyn et al 2012 Fujisawa amp Barraclough 2013) Notably small
effective populations sizes and low speciation rates were also previ-
ously identified by Esselstyn et al (2012) as good conditions for the
GMYC approach
F IGURE 1 Species delimitation results analysed with the ldquospecies-unit assessmentrdquo approach and based on the simulation of 6 speciesResults are reported for both long-tail (5 species with 2 sampled sequences and 1 species with 10 sampled sequences) and short-tail samplingpatterns (5 species with 10 sampled sequences and 1 species with 2 sampled sequences) tS refers to the speciation rate Ne to the effective(haploid) population size and tM to the mutation rate (number of mutations per locus per generation) Results are reported in barplots withfrom top to bottom the percentages of lumping events (hatched) of splitting events (crosshatched) of reshuffling events (in grey) and ofmatching events (in black) detected when comparing the species delimitations with the true boundaries of the simulated species For bGMYCthe reported percentages are those obtained after a discretization and transitivization step aimed at turning the probability matrices intospecies groupings (bGMYC-2 see details in text)
DELLICOUR AND FLOT | 7
GE 10ndash8 10ndash7 10ndash6
tS Ne haploweb ST-GMYC bGMYC-2 PTP bPTPtM
sampling
10ndash5 104
105
106
10ndash6 104
105
106
10ndash7 104
105
106
10ndash5 104
105
106
10ndash6 104
105
106
10ndash7 104
105
106
60 species(long-tailsamplingpattern)
60 species(short-tailsamplingpattern)
GE 10ndash8 10ndash7 10ndash6GE 10ndash8 10ndash7 10ndash6GE 10ndash8 10ndash7 10ndash610ndash8 10ndash7 10ndash610ndash8 10ndash7 10ndash6
ABGD
8 | DELLICOUR AND FLOT
Including for the first time in our benchmark distance-based (ABGD)
and allele sharing-based (haploweb) approaches allowed us to compare
them (Figures 1ndash3) and provide a synthetic ldquobirdrsquos eye viewrdquo of the
relative performance of existing single-locus species delimitation
approaches (Figure 4) Overall the points for haplowebs are closer to
the upper ldquomatchrdquo vertex of the ternary graphs than those for ABGD
F IGURE 2 Species delimitation results analysed with the ldquospecies-unit assessmentrdquo approach and based on the simulation of 60 speciesResults are reported for both long-tail (50 species with 2 sampled sequences and 10 species with 10 sampled sequences) and short-tailsampling patterns (50 species with 10 sampled sequences and 10 species with 2 sampled sequences) tS refers to the speciation rate Ne to theeffective (haploid) population size and tM to the mutation rate (number of mutations per locus per generation) Results are reported in barplotswith from top to bottom the percentages of lumping events (hatched) of splitting events (crosshatched) of reshuffling events (in grey) and ofmatching events (in black) detected when comparing the species delimitations with the true boundaries of the simulated species For bGMYCthe reported percentages are those obtained after a discretization and transitivization step aimed at turning the probability matrices intospecies groupings (bGMYC-2 see details in text)
GE 10ndash8 10ndash7 10ndash6
tS Ne haploweb ST-GMYC bGMYC-2 PTP bPTPtM
sampling
10ndash5 104
105
106
10ndash6 104
105
106
10ndash7 104
105
106
120 species(long-tailsamplingpattern)
GE 10ndash8 10ndash7 10ndash6GE 10ndash8 10ndash7 10ndash6GE 10ndash8 10ndash7 10ndash610ndash8 10ndash7 10ndash610ndash8 10ndash7 10ndash6
ABGD
F IGURE 3 Species delimitation results analysed with the ldquospecies-unit assessmentrdquo approach and based on the simulation of 120 species(long-tail sampling pattern only 100 species with 2 sampled sequences and 20 species with 10 sampled sequences see text for furtherdetails) tS refers to the speciation rate Ne to the effective (haploid) population size and tM to the mutation rate (number of mutations perlocus per generation) Results are reported in barplots with from top to bottom the percentages of lumping events (hatched) of splittingevents (crosshatched) of reshuffling events (in grey) and of matching events (in black) detected when comparing the species delimitations withthe true boundaries of the simulated species For bGMYC the reported percentages are those obtained after a discretization andtransitivization step aimed at turning the probability matrices into species groupings (bGMYC-2 see details in text)
DELLICOUR AND FLOT | 9
haploweb
ST-GMYC
bGMYC
PTP
bPTP
ABGDmatch
lump+ RS
split
ldquoshort-tailrdquo sampling paernldquolong-tailrdquo sampling paern
tS = 10ndash5
ndash
tS = 10ndash6
tS = 10ndash7
Ne = 1000000Ne = 100000Ne = 10000
120 species60 species6 species
tM = 10ndash6
tM = 10ndash7
tM = 10ndash8
match
lump+ RS
split
match
lump+ RS
split
match
lump+ RS
split
match
lump+ RS
split
match
lump+ RS
split
match
lump+ RS
split
match
lump+ RS
split
match
lump+ RS
split
match
lump+ RS
split
match
lump+ RS
split
match
lump+ RS
split
match
lump+ RS
split
match
lump+ RS
split
match
lump+ RS
split
match
lump+ RS
split
match
lump+ RS
split
match
lump+ RS
split
match
lump+ RS
split
match
lump+ RS
split
match
lump+ RS
split
match
lump+ RS
split
match
lump+ RS
split
match
lump+ RS
split
match
lump+ RS
split
match
lump+ RS
split
match
lump+ RS
split
match
lump+ RS
split
match
lump+ RS
split
match
lump+ RS
split
F IGURE 4 Birdrsquos eye view of species delimitation results using the ldquospecies-unit assessmentrdquo method The five ternary plots for eachmethod display the same set of dots (one point per replicate) but with different colours highlighting the influence of one simulation parameteron the efficiency of the species delimitation method tested On each triangle the uppermost vertex corresponds to 100 match (ie eachspecies is correctly delimited) the leftmost vertex corresponds to 100 splitting (ie all species are oversplit) and the rightmost vertex groupsthe remaining cases (overlumping and reshuffling) Crosses indicate the average position of each group of points
10 | DELLICOUR AND FLOT
which are themselves higher in the plots compared to tree-based
approaches This suggests that haplowebs perform generally better than
ABGD which performs generally better than tree-based approaches
The same pattern is also observed for the dispersion of the points data
points in the ternary graphs are tightly grouped for haploweb more dis-
persed for ABGD and extremely dispersed for tree-based approaches
(see also Supporting Information Figure S11) Hence haploweb results
are the most consistent followed by ABGD then by tree-based
approaches Last but not least the prominent type of error also varies
from one method to the next ABGDrsquos main error type is overlumping
whereas the outcomes of tree-based approaches tend to cluster around
the ldquooversplittingrdquo vertex and haplowebs produce both oversplitting and
overlumping depending on simulation parameters
What advice may our hitchhikerrsquos guide provide to fellow travellers
in the land of species delimitation If they are looking for a single one-
size-fit-all approach we might return the same laconic statement as
the 1972 edition of the Hitchhikerrsquos Guide to Europe regarding Alba-
nia (then a communist dictatorship) p42 ldquoForget itrdquo On a more opti-
mistic note they may find comfort in the fact that the patterns of
errors returned by ABGD GMYCPTP and haplowebs are widely dif-
ferent suggesting that if the three yield the same delimitation then
this delimitation should probably be correct However such congru-
ence among approaches is rarely observed in actual studies (eg Mir-
alles amp Vences 2013) Besides although a ldquosweet spotrdquo does exist
where all methods tested perform relatively well our barplots show
that 100 species delimitation success is only achieved for 6-species
data sets For more speciose data sets even an optimistic 99 per-
species delimitation success rate implies 55 chances of correctly
delimiting a 60-species data set and 30 chances of delimiting cor-
rectly a 120-species data set Hence even for ldquoideal groupsrdquo character-
ized by small effective population sizes and low speciation rates (such
as groundwater crustaceans Flot et al 2014 Copilaş-Ciocianu et al
2017) one should always consider the results of any of the methods
tested here with caution and cross-compare them with results
obtained using other approaches (andor using the same approach on
other independent markers)
Using all three types of delimitation approaches on the same data
set is only possible in the case of nuclear diploid markers To date
studies attempting to delineate species from single markers nearly
always use haploid organellar data sets (either chloroplastic or mito-
chondrial) as such markers are both easier to analyse (no double
peaks) and have smaller effective population sizes than single-copy
nuclear markers However ribosomal DNA markers such as interven-
ing spacer sequences (ITSs) are also characterized by small effective
population sizes due to their concerted mode of evolution and their
fast mutation rates make them ideal candidate markers for single-locus
species delimitation Although they remain rare studies using single
diploid sequence markers to delineate species are presently on the
rise either alone (Adjeroud et al 2014 Daeuroınou et al 2016) or in con-
junction with an organellar marker such as COI (Copilaş-Ciocianu
et al 2017 Flot Dahl amp Andre 2013 Papakostas et al 2016) Our
take-home message may therefore be if you sequence a single marker
to delineate species make it a nuclear one and if you sequence two
markers include at least one nuclear marker (instead of piling up two
mitochondrial or chloroplastic DNA regions which behave as a single
marker because they are linked together on the same molecule)
Indeed the best way to overcome the limitations of single-locus
approaches is to use information from several independent loci Several
tree-based multilocus methods have been already proposed notably
BPP (Rannala amp Yang 2013 Yang amp Rannala 2010) DISSECT (Jones
Aydin amp Oxelman 2015) SpeDeSTEM (Ence amp Carstens 2011) and
most recently PHRAPL (Jackson Morales Carstens amp OrsquoMeara 2017)
Such approaches may be able to deal with high speciation rates and large
population sizes by leveraging information provided by several indepen-
dent markers but given their very high computing requirements their
performances have not yet been thoroughly assessed Yet a first simula-
tion-based assessment of BPP recently showed that this popular
approach does not actually delineate species but differentiated popula-
tions (Sukumaran amp Knowles 2017) Given the relatively better perfor-
mance of allele sharing-based and distance-based approaches over tree-
based approaches observed in our benchmark of single-locus species
delimitation it seems reasonable to assume that multilocus approaches
based on allele sharing andor distances would perform better than BPP
but this hypothesis will have to be tested
ACKNOWLEDGEMENTS
We thank three anonymous reviewers for their helpful comments on
this study We are also grateful to Yann Speuroori for his help improving
the ABGDconsensus script SD is funded by the Fonds Weten-
schappelijk Onderzoek (FWO Belgium) as well as the Fonds National
de la Recherche Scientifique (FNRS Belgium) and was previously
funded by the Wiener-Anspach Foundation Computational
resources were provided by the Belgian High Performance Comput-
ing Centre cofunded by ULB and VUB (HPC cluster ldquoHydrardquo)
AUTHORS rsquo CONTRIBUTIONS
SD and J-FF jointly conceived the study designed its methodol-
ogy analysed the data and wrote the resulting manuscript
DATA ACCESSIBILITY
The scripts used are available online at httpsgithubcomjflot
ABGDconsensus and httpsgithubcomjflotcountFFRs2
ORCID
Simon Dellicour httporcidorg0000-0001-9558-1052
Jean-Francois Flot httporcidorg0000-0003-4091-7916
REFERENCES
Adjeroud M Guerecheau A Vidal-Dupiol J Flot J F Arnaud-Haond
S amp Bonhomme F (2014) Genetic diversity clonality and connec-
tivity in the scleractinian coral Pocillopora damicornis A multi-scale
DELLICOUR AND FLOT | 11
analysis in an insular fragmented reef system Marine Biology 161
531ndash541 httpsdoiorg101007s00227-013-2355-9
Ahrens D Fujisawa T Krammer H-J Eberle J Fabrizi S amp Vogler
A P (2016) Rarity and incomplete sampling in DNA-based species
delimitation Systematic Biology 65 478ndash494 httpsdoiorg10
1093sysbiosyw002
Bortolus A (2008) Error cascades in the biological sciences The
unwanted consequences of using bad taxonomy in ecology Ambio
37 114ndash118 httpsdoiorg1015790044-7447(2008)37[114
ECITBS]20CO2
Britton T Anderson C L Jacquet D Lundqvist S amp Bremer K (2007)
Estimating divergence times in large phylogenetic trees Systematic Biol-
ogy 56 741ndash752 httpsdoiorg10108010635150701613783
Copilaș-Ciocianu D Fiser C Borza P Balazs G Angyal D amp Petru-
sek A (2017) Low intraspecific genetic divergence and weak niche
differentiation despite wide ranges and extensive sympatry in two
epigean Niphargus species (Crustacea Amphipoda) Zoological Journal
of the Linnean Society 181 485ndash499 httpsdoiorg101093zoolin
neanzlw031
Daeuroınou K Blanc-Jolivet C Degen B Kimani P Ndiade-Bourobou D
Donkpegan A S L Hardy O J (2016) Revealing hidden species
diversity in closely related species using nuclear SNPs SSRs and
DNA sequences ndash A case study in the tree genus Milicia BMC
Evolutionary Biology 16 259 httpsdoiorg101186s12862-016-
0831-9
Debortoli N Li X Eyres I Fontaneto D Hespeels B Tang C Q
Van Doninck K (2016) Genetic exchange among bdelloid rotifers is
more likely due to horizontal gene transfer than to meiotic sex Cur-
rent Biology 26 723ndash732 httpsdoiorg101016jcub201601031
Dellicour S amp Flot J F (2015) Delimiting species-poor data sets using
single molecular markers A study of barcode gaps haplowebs and
GMYC Systematic Biology 64 900ndash908 httpsdoiorg101093sys
biosyu130
Ellison A M (1987) Effect of seed dimorphism on the density-depen-
dent dynamics of experimental populations of Atriplex triangularis
(Chenopodiaceae) American Journal of Botany 74 1280ndash1288
httpsdoiorg101002j1537-21971987tb08741x
Eme D Zagmajster M Delic T Fiser C Flot J F Konecny-Dupre L
Malard F (2017) Do cryptic species matter in macroecology
Sequencing European groundwater crustaceans yields smaller ranges
but does not challenge biodiversity determinants Ecography 41
424ndash436 httpsdoiorg101111ecog02683
Ence D D amp Carstens B C (2011) SPEDESTEM A rapid and accurate
method for species delimitation Molecular Ecology Resources 11
473ndash480 httpsdoiorg101111j1755-0998201002947x
Esselstyn J A Evans B J Sedlock J L Anwarali Khan F A amp Hea-
ney L R (2012) Single-locus species delimitation A test of the
mixed Yulendashcoalescent model with an empirical application to Philip-
pine round-leaf bats Proceedings of the Royal Society B Biological
Sciences 279 3678ndash3686 httpsdoiorg101098rspb20120705
Ezard T Fujisawa T amp Barraclough T (2013) R package splits SPeciesrsquoLImits by Threshold Statistics version 10-18r45 Retrieved from
httpr-forger-projectorgprojectssplits
Flot J F (2015) Species delimitationrsquos coming of age Systematic Biology
64 897ndash899 httpsdoiorg101093sysbiosyv071
Flot J F Bauermeister J Brad T Hillebrand-Voiculescu A Sarbu S M amp
Dattagupta S (2014) Niphargus-Thiothrix associations may be wide-
spread in sulfidic groundwater ecosystems Evidence from southeastern
Romania Molecular Ecology 23 1405ndash1417 httpsdoiorg101111
mec12461
Flot J F Couloux A amp Tillier S (2010) Haplowebs as a graphical tool
for delimiting species A revival of Doylersquos ldquofield for recombinationrdquoapproach and its application to the coral genus Pocillopora in Clipper-
ton BMC Evolutionary Biology 10 372 httpsdoiorg101186
1471-2148-10-372
Flot J F Dahl M amp Andre C (2013) Lophelia pertusa corals from the
Ionian and Barents seas share identical nuclear ITS2 and near-identi-
cal mitochondrial genome sequences BMC Research Notes 6 144
httpsdoiorg1011861756-0500-6-144
Fontaneto D Flot J F amp Tang C Q (2015) Guidelines for DNA tax-
onomy with a focus on the meiofauna Marine Biodiversity 45 433ndash
451 httpsdoiorg101007s12526-015-0319-7
Fujisawa T Aswad A amp Barraclough T G (2016) A rapid and scalable
method for multilocus species delimitation using Bayesian model
comparison and rooted triplets Systematic Biology 65 759ndash771
httpsdoiorg101093sysbiosyw028
Fujisawa T amp Barraclough T G (2013) Delimiting species using single-
locus data and the Generalized Mixed Yule Coalescent approach A
revised method and evaluation on simulated data sets Systematic
Biology 62 707ndash724 httpsdoiorg101093sysbiosyt033
Hudson R R (1990) Gene genealogies and coalescent process In D J
Futuyma amp J Antonivics (Eds) Oxford surveys in evolutionary biology
(pp 1ndash44) Oxford UK Oxford University Press
Jackson N D Morales A E Carstens B C amp OrsquoMeara B C (2017)
PHRAPL Phylogeographic inference using approximate likelihoods Sys-
tematic Biology 66 1045ndash1053 httpsdoiorg101093sysbio
syx001
Jones G Aydin Z amp Oxelman B (2015) DISSECT An assignment-free
Bayesian discovery method for species delimitation under the multi-
species coalescent Bioinformatics 31 991ndash998 httpsdoiorg10
1093bioinformaticsbtu770
Komsta L amp Novomestky F (2012) MOMENTS Moments cumulants skew-
ness kurtosis and related tests R package version 013 Available from
httpcranr-projectorgwebpackagesmoments
Lim G S Balke M amp Meier R (2012) Determining species bound-
aries in a world full of rarity Singletons species delimitation meth-
ods Systematic Biology 61 165ndash169 httpsdoiorg101093sysb
iosyr030
Lohse K (2009) Can mtDNA barcodes be used to delimit species A
response to Pons et al (2006) Systematic Biology 58 439ndash442
httpsdoiorg101093sysbiosyp039
Miralles A amp Vences M (2013) New metrics for comparison of tax-
onomies reveal striking discrepancies among species delimitation
methods in Madascincus lizards PLoS ONE 8 e68242 httpsdoi
org101371journalpone0068242
Monaghan M T Wild R Elliot M Fujisawa T Balke M Inward D J G
Vogler A P (2009) Accelerated species inventory on Madagascar
using coalescent-based models of species delineation Systematic Biology
58 298ndash311 httpsdoiorg101093sysbiosyp027
Papadopoulou A Bergsten J Fujisawa T Monaghan M T Barra-
clough T G amp Vogler A P (2008) Speciation and DNA barcodes
Testing the effects of dispersal on the formation of discrete
sequence clusters Philosophical Transactions of the Royal Society B
Biological Sciences 363 2987ndash2996 httpsdoiorg101098rstb
20080066
Papakostas S Michaloudi E Proios K Brehm M Verhage L Rota J
Declerck S A J (2016) Integrative taxonomy recognizes evolu-
tionary units despite widespread mitonuclear discordance Evidence
from a rotifer cryptic species complex Systematic Biology 65 508ndash
524 httpsdoiorg101093sysbiosyw016
Paradis E (2010) PEGAS An R package for population genetics with an
integrated-modular approach Bioinformatics 26 419ndash420 httpsdoi
org101093bioinformaticsbtp696
Pfister R Schwarz K A Janczyk M Dale R amp Freeman J (2013)
Good things peak in pairs A note on the bimodality coefficient Fron-
tiers in Psychology 4 700
Pons J Barraclough T G Gomez-Zurita J Cardoso A Duran D P
Hazell S Vogler A (2006) Sequence-based species delimitation
for the DNA taxonomy of undescribed insects Systematic Biology 55
595ndash609 httpsdoiorg10108010635150600852011
12 | DELLICOUR AND FLOT
Price M N Dehal P S amp Arkin A P (2010) FASTTREE 2 ndash Approxi-
mately maximum-likelihood trees for large alignments PLoS ONE 5
e9490 httpsdoiorg101371journalpone0009490
Puillandre N Lambert A Brouillet S amp Achaz G (2012) ABGD Automatic
Barcode Gap Discovery for primary species delimitation Molecular Ecol-
ogy 21 1864ndash1877 httpsdoiorg101111j1365-294X201105239x
Rannala B amp Yang Z (2013) Improved reversible jump algorithms for
Bayesian species delimitation Genetics 194 245ndash253 httpsdoi
org101534genetics112149039
Ratnasingham S amp Hebert P D N (2007) BOLD The barcode of life data sys-
tem (httpwwwbarcodinglifeorg)Molecular Ecology Notes 7 355ndash364
Ratnasingham S amp Hebert P D N (2013) A DNA-based registry for all
animal species The Barcode Index Number (BIN) system PLoS ONE
8 e66213 httpsdoiorg101371journalpone0066213
Reid N amp Carstens B (2012) Phylogenetic estimation error can
decrease the accuracy of species delimitation a Bayesian implemen-
tation of the general mixed Yule-coalescent model BMC Evolutionary
Biology 12 196 httpsdoiorg1011861471-2148-12-196
Roach J C Glusman G Smit A F A Huff C D Hubley R Shannon
P T Galas D J (2010) Analysis of genetic inheritance in a fam-
ily quartet by whole-genome sequencing Science 328 636ndash639
httpsdoiorg101126science1186802
Sites J W Jr amp Marshall J C (2003) Delimiting species A renaissance
issue in systematic biology Trends in Ecology amp Evolution 18 462ndash
470 httpsdoiorg101016S0169-5347(03)00184-8
Sukumaran J amp Holder M T (2010) DENDROPY A Python library for
phylogenetic computing Bioinformatics 26 1569ndash1571 httpsdoi
org101093bioinformaticsbtq228
Sukumaran J amp Knowles L L (2017) Multispecies coalescent delimits
structure not species Proceedings of the National Academy of Sciences
of the United States of America 114 1607ndash1612 httpsdoiorg10
1073pnas1607921114
Tang C Q Humphreys A M Fontaneto D amp Barraclough T G
(2014) Effects of phylogenetic reconstruction method on the robust-
ness of species delimitation using single-locus data Methods in
Ecology and Evolution 5 1086ndash1094 httpsdoiorg1011112041-
210X12246
Yang Z amp Rannala B (2010) Bayesian species delimitation using multi-
locus sequence data Proceedings of the National Academy of Sciences
of the United States of America 107 9264ndash9269 httpsdoiorg10
1073pnas0913022107
Yule G U (1925) A mathematical theory of evolution based on the
conclusions of Dr J C Willis FRS Philosophical Transactions of the
Royal Society B Biological Sciences 213 21ndash87 httpsdoiorg10
1098rstb19250002
Zhang J Kapli P Pavlidis P amp Stamatakis A (2013) A general species
delimitation method with applications to phylogenetic placements
Bioinformatics 29 2869ndash2876 httpsdoiorg101093bioinformatic
sbtt499
SUPPORTING INFORMATION
Additional supporting information may be found online in the
Supporting Information section at the end of the article
How to cite this article Dellicour S Flot J-F The hitchhikerrsquos
guide to single-locus species delimitation Mol Ecol Resour
2018001ndash13 httpsdoiorg1011111755-099812908
DELLICOUR AND FLOT | 13
View publication statsView publication stats

GE 10ndash8 10ndash7 10ndash6
tS Ne haploweb ST-GMYC bGMYC-2 PTP bPTPtM
sampling
10ndash5 104
105
106
10ndash6 104
105
106
10ndash7 104
105
106
10ndash5 104
105
106
10ndash6 104
105
106
10ndash7 104
105
106
6 species(long-tailsamplingpattern)
6 species(short-tailsamplingpattern)
GE 10ndash8 10ndash7 10ndash6GE 10ndash8 10ndash7 10ndash6GE 10ndash8 10ndash7 10ndash610ndash8 10ndash7 10ndash610ndash8 10ndash7 10ndash6
ABGD
6 | DELLICOUR AND FLOT
pattern was most dramatic for haplowebs this is because the sam-
pling of only two sequences per species is equivalent to sampling a
single diploid individual the two haplotypes of which are automati-
cally considered conspecific using the haploweb approach (unlike
tree-based or distance-based approaches that may consider them as
heterospecific)
36 | Impact of species richness
Among the methods tested ABGD distinguished itself by performing
somewhat better on the less speciose data sets (Figures 1ndash4)
whereas the performance of haplowebs was not affected significantly
by the number of species (the averages for 6-species and 60-species
data sets on Figure 4 are similar whereas the performance for the
120-species data set appears higher but this is an artefact resulting
from the fact that only results from the short-tail pattern were pre-
sented) Tree-based methods in contrast performed better on spe-
cies-rich data sets probably because such data sets allow better
calibration of intraspecific vs interspecific branching rates species
richness had a major influence on GMYC methods but was less dra-
matic for PTP approaches
37 | Impact of effective population size
Overall all methods performed better when applied to species with
small effective population sizes than to species with large effective
population sizes In the case of distance-based approaches this is
because the low amount of genetic drift in species with large effec-
tive population sizes is inefficient at pruning their ancestral polymor-
phism resulting in genetic distances as large within species as
between them Similarly in the case of tree-based approaches large
effective population sizes slow down lineage sorting resulting in a
greater time lag between speciation and the acquisition of mono-
phyly that is required by these approaches to delineate species (Flot
et al 2010) Even though haplowebs do not require species mono-
phyly nor genetic distances smaller within species than between
them this approach is still negatively impacted by a large effective
population size for two reasons first it increases the probability that
a few haplotypes shared between species persist resulting in lump-
ing and second it increases haplotypic diversity resulting in splitting
as more individuals have to be sequenced to reach the point when
all the haplotypes sampled from a given species are connected by
heterozygous individuals
38 | Impact of speciation rate
Similarly all approaches worked better when applied to species with
low speciation rates than to species with high speciation rates This
is because species simulated using a low speciation rate are on aver-
age older than species simulated using a high speciation rate and
ancient species have had more time to reach mutual allelic exclusiv-
ity (in the case of allele sharing-based approaches) reciprocal allelic
monophyly (in the case of tree-based approaches) andor minimally
overlapping distributions of intra- vs interspecific distances (in the
case of distance-based approaches) The fact that among these
three stages reciprocal allelic monophyly is the one that takes
always the longest time to reach (because it implies the two others
Flot et al 2010) probably explains the relatively lower performance
of tree-based approaches compared to distance-based and allele
sharing-based approaches under the range of parameters tested
here
39 | Impact of mutation rate
Mutation rates had a very different impact depending on the method
Barcode gap detection and most tree-based approaches (except
GMYC-ST) worked better with markers that had high mutation rates
whereas GMYC-STrsquos performance was higher when mutation rate
was low In the case of haplowebs the success rate did not vary much
depending on mutation rate but affected the type of error the most
frequent error type was overlumping when low-variation markers
were used vs oversplitting in the case of highly variable markers
4 | CONCLUSIONS ANDRECOMMENDATIONS
All in all our present study confirms and extends the main findings
of our previous exploration of the ldquospecies-poorrdquo case (Dellicour amp
Flot 2015) The combination of a small effective population size and
a low speciation rate is globally confirmed as a ldquosweet spotrdquo for both
species-poor and species-rich data sets Our study also corroborates
the results of previous articles focusing on tree-based approaches
(Esselstyn et al 2012 Fujisawa amp Barraclough 2013) Notably small
effective populations sizes and low speciation rates were also previ-
ously identified by Esselstyn et al (2012) as good conditions for the
GMYC approach
F IGURE 1 Species delimitation results analysed with the ldquospecies-unit assessmentrdquo approach and based on the simulation of 6 speciesResults are reported for both long-tail (5 species with 2 sampled sequences and 1 species with 10 sampled sequences) and short-tail samplingpatterns (5 species with 10 sampled sequences and 1 species with 2 sampled sequences) tS refers to the speciation rate Ne to the effective(haploid) population size and tM to the mutation rate (number of mutations per locus per generation) Results are reported in barplots withfrom top to bottom the percentages of lumping events (hatched) of splitting events (crosshatched) of reshuffling events (in grey) and ofmatching events (in black) detected when comparing the species delimitations with the true boundaries of the simulated species For bGMYCthe reported percentages are those obtained after a discretization and transitivization step aimed at turning the probability matrices intospecies groupings (bGMYC-2 see details in text)
DELLICOUR AND FLOT | 7
GE 10ndash8 10ndash7 10ndash6
tS Ne haploweb ST-GMYC bGMYC-2 PTP bPTPtM
sampling
10ndash5 104
105
106
10ndash6 104
105
106
10ndash7 104
105
106
10ndash5 104
105
106
10ndash6 104
105
106
10ndash7 104
105
106
60 species(long-tailsamplingpattern)
60 species(short-tailsamplingpattern)
GE 10ndash8 10ndash7 10ndash6GE 10ndash8 10ndash7 10ndash6GE 10ndash8 10ndash7 10ndash610ndash8 10ndash7 10ndash610ndash8 10ndash7 10ndash6
ABGD
8 | DELLICOUR AND FLOT
Including for the first time in our benchmark distance-based (ABGD)
and allele sharing-based (haploweb) approaches allowed us to compare
them (Figures 1ndash3) and provide a synthetic ldquobirdrsquos eye viewrdquo of the
relative performance of existing single-locus species delimitation
approaches (Figure 4) Overall the points for haplowebs are closer to
the upper ldquomatchrdquo vertex of the ternary graphs than those for ABGD
F IGURE 2 Species delimitation results analysed with the ldquospecies-unit assessmentrdquo approach and based on the simulation of 60 speciesResults are reported for both long-tail (50 species with 2 sampled sequences and 10 species with 10 sampled sequences) and short-tailsampling patterns (50 species with 10 sampled sequences and 10 species with 2 sampled sequences) tS refers to the speciation rate Ne to theeffective (haploid) population size and tM to the mutation rate (number of mutations per locus per generation) Results are reported in barplotswith from top to bottom the percentages of lumping events (hatched) of splitting events (crosshatched) of reshuffling events (in grey) and ofmatching events (in black) detected when comparing the species delimitations with the true boundaries of the simulated species For bGMYCthe reported percentages are those obtained after a discretization and transitivization step aimed at turning the probability matrices intospecies groupings (bGMYC-2 see details in text)
GE 10ndash8 10ndash7 10ndash6
tS Ne haploweb ST-GMYC bGMYC-2 PTP bPTPtM
sampling
10ndash5 104
105
106
10ndash6 104
105
106
10ndash7 104
105
106
120 species(long-tailsamplingpattern)
GE 10ndash8 10ndash7 10ndash6GE 10ndash8 10ndash7 10ndash6GE 10ndash8 10ndash7 10ndash610ndash8 10ndash7 10ndash610ndash8 10ndash7 10ndash6
ABGD
F IGURE 3 Species delimitation results analysed with the ldquospecies-unit assessmentrdquo approach and based on the simulation of 120 species(long-tail sampling pattern only 100 species with 2 sampled sequences and 20 species with 10 sampled sequences see text for furtherdetails) tS refers to the speciation rate Ne to the effective (haploid) population size and tM to the mutation rate (number of mutations perlocus per generation) Results are reported in barplots with from top to bottom the percentages of lumping events (hatched) of splittingevents (crosshatched) of reshuffling events (in grey) and of matching events (in black) detected when comparing the species delimitations withthe true boundaries of the simulated species For bGMYC the reported percentages are those obtained after a discretization andtransitivization step aimed at turning the probability matrices into species groupings (bGMYC-2 see details in text)
DELLICOUR AND FLOT | 9
haploweb
ST-GMYC
bGMYC
PTP
bPTP
ABGDmatch
lump+ RS
split
ldquoshort-tailrdquo sampling paernldquolong-tailrdquo sampling paern
tS = 10ndash5
ndash
tS = 10ndash6
tS = 10ndash7
Ne = 1000000Ne = 100000Ne = 10000
120 species60 species6 species
tM = 10ndash6
tM = 10ndash7
tM = 10ndash8
match
lump+ RS
split
match
lump+ RS
split
match
lump+ RS
split
match
lump+ RS
split
match
lump+ RS
split
match
lump+ RS
split
match
lump+ RS
split
match
lump+ RS
split
match
lump+ RS
split
match
lump+ RS
split
match
lump+ RS
split
match
lump+ RS
split
match
lump+ RS
split
match
lump+ RS
split
match
lump+ RS
split
match
lump+ RS
split
match
lump+ RS
split
match
lump+ RS
split
match
lump+ RS
split
match
lump+ RS
split
match
lump+ RS
split
match
lump+ RS
split
match
lump+ RS
split
match
lump+ RS
split
match
lump+ RS
split
match
lump+ RS
split
match
lump+ RS
split
match
lump+ RS
split
match
lump+ RS
split
F IGURE 4 Birdrsquos eye view of species delimitation results using the ldquospecies-unit assessmentrdquo method The five ternary plots for eachmethod display the same set of dots (one point per replicate) but with different colours highlighting the influence of one simulation parameteron the efficiency of the species delimitation method tested On each triangle the uppermost vertex corresponds to 100 match (ie eachspecies is correctly delimited) the leftmost vertex corresponds to 100 splitting (ie all species are oversplit) and the rightmost vertex groupsthe remaining cases (overlumping and reshuffling) Crosses indicate the average position of each group of points
10 | DELLICOUR AND FLOT
which are themselves higher in the plots compared to tree-based
approaches This suggests that haplowebs perform generally better than
ABGD which performs generally better than tree-based approaches
The same pattern is also observed for the dispersion of the points data
points in the ternary graphs are tightly grouped for haploweb more dis-
persed for ABGD and extremely dispersed for tree-based approaches
(see also Supporting Information Figure S11) Hence haploweb results
are the most consistent followed by ABGD then by tree-based
approaches Last but not least the prominent type of error also varies
from one method to the next ABGDrsquos main error type is overlumping
whereas the outcomes of tree-based approaches tend to cluster around
the ldquooversplittingrdquo vertex and haplowebs produce both oversplitting and
overlumping depending on simulation parameters
What advice may our hitchhikerrsquos guide provide to fellow travellers
in the land of species delimitation If they are looking for a single one-
size-fit-all approach we might return the same laconic statement as
the 1972 edition of the Hitchhikerrsquos Guide to Europe regarding Alba-
nia (then a communist dictatorship) p42 ldquoForget itrdquo On a more opti-
mistic note they may find comfort in the fact that the patterns of
errors returned by ABGD GMYCPTP and haplowebs are widely dif-
ferent suggesting that if the three yield the same delimitation then
this delimitation should probably be correct However such congru-
ence among approaches is rarely observed in actual studies (eg Mir-
alles amp Vences 2013) Besides although a ldquosweet spotrdquo does exist
where all methods tested perform relatively well our barplots show
that 100 species delimitation success is only achieved for 6-species
data sets For more speciose data sets even an optimistic 99 per-
species delimitation success rate implies 55 chances of correctly
delimiting a 60-species data set and 30 chances of delimiting cor-
rectly a 120-species data set Hence even for ldquoideal groupsrdquo character-
ized by small effective population sizes and low speciation rates (such
as groundwater crustaceans Flot et al 2014 Copilaş-Ciocianu et al
2017) one should always consider the results of any of the methods
tested here with caution and cross-compare them with results
obtained using other approaches (andor using the same approach on
other independent markers)
Using all three types of delimitation approaches on the same data
set is only possible in the case of nuclear diploid markers To date
studies attempting to delineate species from single markers nearly
always use haploid organellar data sets (either chloroplastic or mito-
chondrial) as such markers are both easier to analyse (no double
peaks) and have smaller effective population sizes than single-copy
nuclear markers However ribosomal DNA markers such as interven-
ing spacer sequences (ITSs) are also characterized by small effective
population sizes due to their concerted mode of evolution and their
fast mutation rates make them ideal candidate markers for single-locus
species delimitation Although they remain rare studies using single
diploid sequence markers to delineate species are presently on the
rise either alone (Adjeroud et al 2014 Daeuroınou et al 2016) or in con-
junction with an organellar marker such as COI (Copilaş-Ciocianu
et al 2017 Flot Dahl amp Andre 2013 Papakostas et al 2016) Our
take-home message may therefore be if you sequence a single marker
to delineate species make it a nuclear one and if you sequence two
markers include at least one nuclear marker (instead of piling up two
mitochondrial or chloroplastic DNA regions which behave as a single
marker because they are linked together on the same molecule)
Indeed the best way to overcome the limitations of single-locus
approaches is to use information from several independent loci Several
tree-based multilocus methods have been already proposed notably
BPP (Rannala amp Yang 2013 Yang amp Rannala 2010) DISSECT (Jones
Aydin amp Oxelman 2015) SpeDeSTEM (Ence amp Carstens 2011) and
most recently PHRAPL (Jackson Morales Carstens amp OrsquoMeara 2017)
Such approaches may be able to deal with high speciation rates and large
population sizes by leveraging information provided by several indepen-
dent markers but given their very high computing requirements their
performances have not yet been thoroughly assessed Yet a first simula-
tion-based assessment of BPP recently showed that this popular
approach does not actually delineate species but differentiated popula-
tions (Sukumaran amp Knowles 2017) Given the relatively better perfor-
mance of allele sharing-based and distance-based approaches over tree-
based approaches observed in our benchmark of single-locus species
delimitation it seems reasonable to assume that multilocus approaches
based on allele sharing andor distances would perform better than BPP
but this hypothesis will have to be tested
ACKNOWLEDGEMENTS
We thank three anonymous reviewers for their helpful comments on
this study We are also grateful to Yann Speuroori for his help improving
the ABGDconsensus script SD is funded by the Fonds Weten-
schappelijk Onderzoek (FWO Belgium) as well as the Fonds National
de la Recherche Scientifique (FNRS Belgium) and was previously
funded by the Wiener-Anspach Foundation Computational
resources were provided by the Belgian High Performance Comput-
ing Centre cofunded by ULB and VUB (HPC cluster ldquoHydrardquo)
AUTHORS rsquo CONTRIBUTIONS
SD and J-FF jointly conceived the study designed its methodol-
ogy analysed the data and wrote the resulting manuscript
DATA ACCESSIBILITY
The scripts used are available online at httpsgithubcomjflot
ABGDconsensus and httpsgithubcomjflotcountFFRs2
ORCID
Simon Dellicour httporcidorg0000-0001-9558-1052
Jean-Francois Flot httporcidorg0000-0003-4091-7916
REFERENCES
Adjeroud M Guerecheau A Vidal-Dupiol J Flot J F Arnaud-Haond
S amp Bonhomme F (2014) Genetic diversity clonality and connec-
tivity in the scleractinian coral Pocillopora damicornis A multi-scale
DELLICOUR AND FLOT | 11
analysis in an insular fragmented reef system Marine Biology 161
531ndash541 httpsdoiorg101007s00227-013-2355-9
Ahrens D Fujisawa T Krammer H-J Eberle J Fabrizi S amp Vogler
A P (2016) Rarity and incomplete sampling in DNA-based species
delimitation Systematic Biology 65 478ndash494 httpsdoiorg10
1093sysbiosyw002
Bortolus A (2008) Error cascades in the biological sciences The
unwanted consequences of using bad taxonomy in ecology Ambio
37 114ndash118 httpsdoiorg1015790044-7447(2008)37[114
ECITBS]20CO2
Britton T Anderson C L Jacquet D Lundqvist S amp Bremer K (2007)
Estimating divergence times in large phylogenetic trees Systematic Biol-
ogy 56 741ndash752 httpsdoiorg10108010635150701613783
Copilaș-Ciocianu D Fiser C Borza P Balazs G Angyal D amp Petru-
sek A (2017) Low intraspecific genetic divergence and weak niche
differentiation despite wide ranges and extensive sympatry in two
epigean Niphargus species (Crustacea Amphipoda) Zoological Journal
of the Linnean Society 181 485ndash499 httpsdoiorg101093zoolin
neanzlw031
Daeuroınou K Blanc-Jolivet C Degen B Kimani P Ndiade-Bourobou D
Donkpegan A S L Hardy O J (2016) Revealing hidden species
diversity in closely related species using nuclear SNPs SSRs and
DNA sequences ndash A case study in the tree genus Milicia BMC
Evolutionary Biology 16 259 httpsdoiorg101186s12862-016-
0831-9
Debortoli N Li X Eyres I Fontaneto D Hespeels B Tang C Q
Van Doninck K (2016) Genetic exchange among bdelloid rotifers is
more likely due to horizontal gene transfer than to meiotic sex Cur-
rent Biology 26 723ndash732 httpsdoiorg101016jcub201601031
Dellicour S amp Flot J F (2015) Delimiting species-poor data sets using
single molecular markers A study of barcode gaps haplowebs and
GMYC Systematic Biology 64 900ndash908 httpsdoiorg101093sys
biosyu130
Ellison A M (1987) Effect of seed dimorphism on the density-depen-
dent dynamics of experimental populations of Atriplex triangularis
(Chenopodiaceae) American Journal of Botany 74 1280ndash1288
httpsdoiorg101002j1537-21971987tb08741x
Eme D Zagmajster M Delic T Fiser C Flot J F Konecny-Dupre L
Malard F (2017) Do cryptic species matter in macroecology
Sequencing European groundwater crustaceans yields smaller ranges
but does not challenge biodiversity determinants Ecography 41
424ndash436 httpsdoiorg101111ecog02683
Ence D D amp Carstens B C (2011) SPEDESTEM A rapid and accurate
method for species delimitation Molecular Ecology Resources 11
473ndash480 httpsdoiorg101111j1755-0998201002947x
Esselstyn J A Evans B J Sedlock J L Anwarali Khan F A amp Hea-
ney L R (2012) Single-locus species delimitation A test of the
mixed Yulendashcoalescent model with an empirical application to Philip-
pine round-leaf bats Proceedings of the Royal Society B Biological
Sciences 279 3678ndash3686 httpsdoiorg101098rspb20120705
Ezard T Fujisawa T amp Barraclough T (2013) R package splits SPeciesrsquoLImits by Threshold Statistics version 10-18r45 Retrieved from
httpr-forger-projectorgprojectssplits
Flot J F (2015) Species delimitationrsquos coming of age Systematic Biology
64 897ndash899 httpsdoiorg101093sysbiosyv071
Flot J F Bauermeister J Brad T Hillebrand-Voiculescu A Sarbu S M amp
Dattagupta S (2014) Niphargus-Thiothrix associations may be wide-
spread in sulfidic groundwater ecosystems Evidence from southeastern
Romania Molecular Ecology 23 1405ndash1417 httpsdoiorg101111
mec12461
Flot J F Couloux A amp Tillier S (2010) Haplowebs as a graphical tool
for delimiting species A revival of Doylersquos ldquofield for recombinationrdquoapproach and its application to the coral genus Pocillopora in Clipper-
ton BMC Evolutionary Biology 10 372 httpsdoiorg101186
1471-2148-10-372
Flot J F Dahl M amp Andre C (2013) Lophelia pertusa corals from the
Ionian and Barents seas share identical nuclear ITS2 and near-identi-
cal mitochondrial genome sequences BMC Research Notes 6 144
httpsdoiorg1011861756-0500-6-144
Fontaneto D Flot J F amp Tang C Q (2015) Guidelines for DNA tax-
onomy with a focus on the meiofauna Marine Biodiversity 45 433ndash
451 httpsdoiorg101007s12526-015-0319-7
Fujisawa T Aswad A amp Barraclough T G (2016) A rapid and scalable
method for multilocus species delimitation using Bayesian model
comparison and rooted triplets Systematic Biology 65 759ndash771
httpsdoiorg101093sysbiosyw028
Fujisawa T amp Barraclough T G (2013) Delimiting species using single-
locus data and the Generalized Mixed Yule Coalescent approach A
revised method and evaluation on simulated data sets Systematic
Biology 62 707ndash724 httpsdoiorg101093sysbiosyt033
Hudson R R (1990) Gene genealogies and coalescent process In D J
Futuyma amp J Antonivics (Eds) Oxford surveys in evolutionary biology
(pp 1ndash44) Oxford UK Oxford University Press
Jackson N D Morales A E Carstens B C amp OrsquoMeara B C (2017)
PHRAPL Phylogeographic inference using approximate likelihoods Sys-
tematic Biology 66 1045ndash1053 httpsdoiorg101093sysbio
syx001
Jones G Aydin Z amp Oxelman B (2015) DISSECT An assignment-free
Bayesian discovery method for species delimitation under the multi-
species coalescent Bioinformatics 31 991ndash998 httpsdoiorg10
1093bioinformaticsbtu770
Komsta L amp Novomestky F (2012) MOMENTS Moments cumulants skew-
ness kurtosis and related tests R package version 013 Available from
httpcranr-projectorgwebpackagesmoments
Lim G S Balke M amp Meier R (2012) Determining species bound-
aries in a world full of rarity Singletons species delimitation meth-
ods Systematic Biology 61 165ndash169 httpsdoiorg101093sysb
iosyr030
Lohse K (2009) Can mtDNA barcodes be used to delimit species A
response to Pons et al (2006) Systematic Biology 58 439ndash442
httpsdoiorg101093sysbiosyp039
Miralles A amp Vences M (2013) New metrics for comparison of tax-
onomies reveal striking discrepancies among species delimitation
methods in Madascincus lizards PLoS ONE 8 e68242 httpsdoi
org101371journalpone0068242
Monaghan M T Wild R Elliot M Fujisawa T Balke M Inward D J G
Vogler A P (2009) Accelerated species inventory on Madagascar
using coalescent-based models of species delineation Systematic Biology
58 298ndash311 httpsdoiorg101093sysbiosyp027
Papadopoulou A Bergsten J Fujisawa T Monaghan M T Barra-
clough T G amp Vogler A P (2008) Speciation and DNA barcodes
Testing the effects of dispersal on the formation of discrete
sequence clusters Philosophical Transactions of the Royal Society B
Biological Sciences 363 2987ndash2996 httpsdoiorg101098rstb
20080066
Papakostas S Michaloudi E Proios K Brehm M Verhage L Rota J
Declerck S A J (2016) Integrative taxonomy recognizes evolu-
tionary units despite widespread mitonuclear discordance Evidence
from a rotifer cryptic species complex Systematic Biology 65 508ndash
524 httpsdoiorg101093sysbiosyw016
Paradis E (2010) PEGAS An R package for population genetics with an
integrated-modular approach Bioinformatics 26 419ndash420 httpsdoi
org101093bioinformaticsbtp696
Pfister R Schwarz K A Janczyk M Dale R amp Freeman J (2013)
Good things peak in pairs A note on the bimodality coefficient Fron-
tiers in Psychology 4 700
Pons J Barraclough T G Gomez-Zurita J Cardoso A Duran D P
Hazell S Vogler A (2006) Sequence-based species delimitation
for the DNA taxonomy of undescribed insects Systematic Biology 55
595ndash609 httpsdoiorg10108010635150600852011
12 | DELLICOUR AND FLOT
Price M N Dehal P S amp Arkin A P (2010) FASTTREE 2 ndash Approxi-
mately maximum-likelihood trees for large alignments PLoS ONE 5
e9490 httpsdoiorg101371journalpone0009490
Puillandre N Lambert A Brouillet S amp Achaz G (2012) ABGD Automatic
Barcode Gap Discovery for primary species delimitation Molecular Ecol-
ogy 21 1864ndash1877 httpsdoiorg101111j1365-294X201105239x
Rannala B amp Yang Z (2013) Improved reversible jump algorithms for
Bayesian species delimitation Genetics 194 245ndash253 httpsdoi
org101534genetics112149039
Ratnasingham S amp Hebert P D N (2007) BOLD The barcode of life data sys-
tem (httpwwwbarcodinglifeorg)Molecular Ecology Notes 7 355ndash364
Ratnasingham S amp Hebert P D N (2013) A DNA-based registry for all
animal species The Barcode Index Number (BIN) system PLoS ONE
8 e66213 httpsdoiorg101371journalpone0066213
Reid N amp Carstens B (2012) Phylogenetic estimation error can
decrease the accuracy of species delimitation a Bayesian implemen-
tation of the general mixed Yule-coalescent model BMC Evolutionary
Biology 12 196 httpsdoiorg1011861471-2148-12-196
Roach J C Glusman G Smit A F A Huff C D Hubley R Shannon
P T Galas D J (2010) Analysis of genetic inheritance in a fam-
ily quartet by whole-genome sequencing Science 328 636ndash639
httpsdoiorg101126science1186802
Sites J W Jr amp Marshall J C (2003) Delimiting species A renaissance
issue in systematic biology Trends in Ecology amp Evolution 18 462ndash
470 httpsdoiorg101016S0169-5347(03)00184-8
Sukumaran J amp Holder M T (2010) DENDROPY A Python library for
phylogenetic computing Bioinformatics 26 1569ndash1571 httpsdoi
org101093bioinformaticsbtq228
Sukumaran J amp Knowles L L (2017) Multispecies coalescent delimits
structure not species Proceedings of the National Academy of Sciences
of the United States of America 114 1607ndash1612 httpsdoiorg10
1073pnas1607921114
Tang C Q Humphreys A M Fontaneto D amp Barraclough T G
(2014) Effects of phylogenetic reconstruction method on the robust-
ness of species delimitation using single-locus data Methods in
Ecology and Evolution 5 1086ndash1094 httpsdoiorg1011112041-
210X12246
Yang Z amp Rannala B (2010) Bayesian species delimitation using multi-
locus sequence data Proceedings of the National Academy of Sciences
of the United States of America 107 9264ndash9269 httpsdoiorg10
1073pnas0913022107
Yule G U (1925) A mathematical theory of evolution based on the
conclusions of Dr J C Willis FRS Philosophical Transactions of the
Royal Society B Biological Sciences 213 21ndash87 httpsdoiorg10
1098rstb19250002
Zhang J Kapli P Pavlidis P amp Stamatakis A (2013) A general species
delimitation method with applications to phylogenetic placements
Bioinformatics 29 2869ndash2876 httpsdoiorg101093bioinformatic
sbtt499
SUPPORTING INFORMATION
Additional supporting information may be found online in the
Supporting Information section at the end of the article
How to cite this article Dellicour S Flot J-F The hitchhikerrsquos
guide to single-locus species delimitation Mol Ecol Resour
2018001ndash13 httpsdoiorg1011111755-099812908
DELLICOUR AND FLOT | 13
View publication statsView publication stats
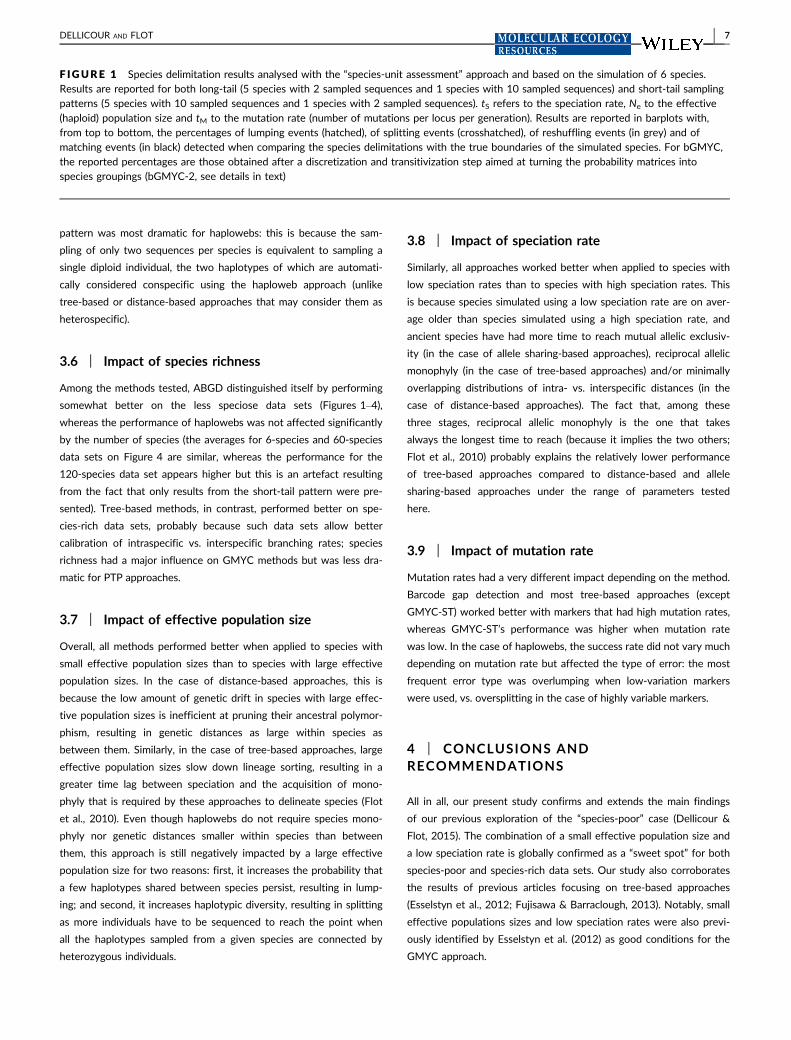
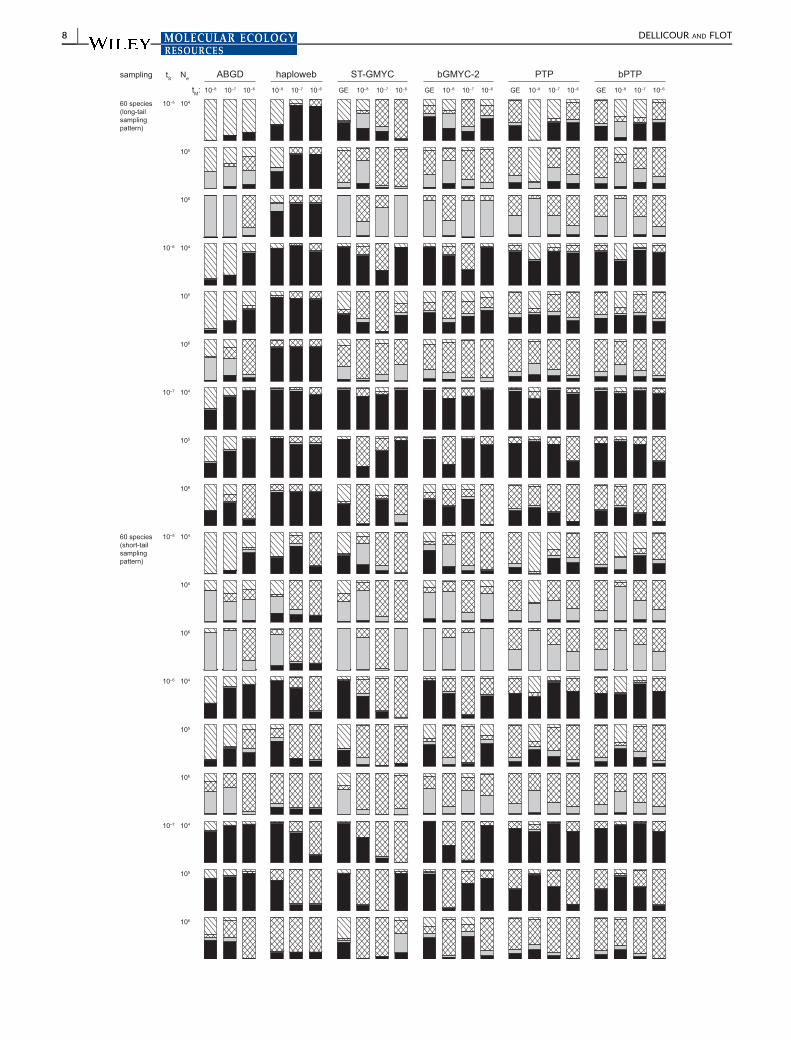
GE 10ndash8 10ndash7 10ndash6
tS Ne haploweb ST-GMYC bGMYC-2 PTP bPTPtM
sampling
10ndash5 104
105
106
10ndash6 104
105
106
10ndash7 104
105
106
10ndash5 104
105
106
10ndash6 104
105
106
10ndash7 104
105
106
60 species(long-tailsamplingpattern)
60 species(short-tailsamplingpattern)
GE 10ndash8 10ndash7 10ndash6GE 10ndash8 10ndash7 10ndash6GE 10ndash8 10ndash7 10ndash610ndash8 10ndash7 10ndash610ndash8 10ndash7 10ndash6
ABGD
8 | DELLICOUR AND FLOT
Including for the first time in our benchmark distance-based (ABGD)
and allele sharing-based (haploweb) approaches allowed us to compare
them (Figures 1ndash3) and provide a synthetic ldquobirdrsquos eye viewrdquo of the
relative performance of existing single-locus species delimitation
approaches (Figure 4) Overall the points for haplowebs are closer to
the upper ldquomatchrdquo vertex of the ternary graphs than those for ABGD
F IGURE 2 Species delimitation results analysed with the ldquospecies-unit assessmentrdquo approach and based on the simulation of 60 speciesResults are reported for both long-tail (50 species with 2 sampled sequences and 10 species with 10 sampled sequences) and short-tailsampling patterns (50 species with 10 sampled sequences and 10 species with 2 sampled sequences) tS refers to the speciation rate Ne to theeffective (haploid) population size and tM to the mutation rate (number of mutations per locus per generation) Results are reported in barplotswith from top to bottom the percentages of lumping events (hatched) of splitting events (crosshatched) of reshuffling events (in grey) and ofmatching events (in black) detected when comparing the species delimitations with the true boundaries of the simulated species For bGMYCthe reported percentages are those obtained after a discretization and transitivization step aimed at turning the probability matrices intospecies groupings (bGMYC-2 see details in text)
GE 10ndash8 10ndash7 10ndash6
tS Ne haploweb ST-GMYC bGMYC-2 PTP bPTPtM
sampling
10ndash5 104
105
106
10ndash6 104
105
106
10ndash7 104
105
106
120 species(long-tailsamplingpattern)
GE 10ndash8 10ndash7 10ndash6GE 10ndash8 10ndash7 10ndash6GE 10ndash8 10ndash7 10ndash610ndash8 10ndash7 10ndash610ndash8 10ndash7 10ndash6
ABGD
F IGURE 3 Species delimitation results analysed with the ldquospecies-unit assessmentrdquo approach and based on the simulation of 120 species(long-tail sampling pattern only 100 species with 2 sampled sequences and 20 species with 10 sampled sequences see text for furtherdetails) tS refers to the speciation rate Ne to the effective (haploid) population size and tM to the mutation rate (number of mutations perlocus per generation) Results are reported in barplots with from top to bottom the percentages of lumping events (hatched) of splittingevents (crosshatched) of reshuffling events (in grey) and of matching events (in black) detected when comparing the species delimitations withthe true boundaries of the simulated species For bGMYC the reported percentages are those obtained after a discretization andtransitivization step aimed at turning the probability matrices into species groupings (bGMYC-2 see details in text)
DELLICOUR AND FLOT | 9
haploweb
ST-GMYC
bGMYC
PTP
bPTP
ABGDmatch
lump+ RS
split
ldquoshort-tailrdquo sampling paernldquolong-tailrdquo sampling paern
tS = 10ndash5
ndash
tS = 10ndash6
tS = 10ndash7
Ne = 1000000Ne = 100000Ne = 10000
120 species60 species6 species
tM = 10ndash6
tM = 10ndash7
tM = 10ndash8
match
lump+ RS
split
match
lump+ RS
split
match
lump+ RS
split
match
lump+ RS
split
match
lump+ RS
split
match
lump+ RS
split
match
lump+ RS
split
match
lump+ RS
split
match
lump+ RS
split
match
lump+ RS
split
match
lump+ RS
split
match
lump+ RS
split
match
lump+ RS
split
match
lump+ RS
split
match
lump+ RS
split
match
lump+ RS
split
match
lump+ RS
split
match
lump+ RS
split
match
lump+ RS
split
match
lump+ RS
split
match
lump+ RS
split
match
lump+ RS
split
match
lump+ RS
split
match
lump+ RS
split
match
lump+ RS
split
match
lump+ RS
split
match
lump+ RS
split
match
lump+ RS
split
match
lump+ RS
split
F IGURE 4 Birdrsquos eye view of species delimitation results using the ldquospecies-unit assessmentrdquo method The five ternary plots for eachmethod display the same set of dots (one point per replicate) but with different colours highlighting the influence of one simulation parameteron the efficiency of the species delimitation method tested On each triangle the uppermost vertex corresponds to 100 match (ie eachspecies is correctly delimited) the leftmost vertex corresponds to 100 splitting (ie all species are oversplit) and the rightmost vertex groupsthe remaining cases (overlumping and reshuffling) Crosses indicate the average position of each group of points
10 | DELLICOUR AND FLOT
which are themselves higher in the plots compared to tree-based
approaches This suggests that haplowebs perform generally better than
ABGD which performs generally better than tree-based approaches
The same pattern is also observed for the dispersion of the points data
points in the ternary graphs are tightly grouped for haploweb more dis-
persed for ABGD and extremely dispersed for tree-based approaches
(see also Supporting Information Figure S11) Hence haploweb results
are the most consistent followed by ABGD then by tree-based
approaches Last but not least the prominent type of error also varies
from one method to the next ABGDrsquos main error type is overlumping
whereas the outcomes of tree-based approaches tend to cluster around
the ldquooversplittingrdquo vertex and haplowebs produce both oversplitting and
overlumping depending on simulation parameters
What advice may our hitchhikerrsquos guide provide to fellow travellers
in the land of species delimitation If they are looking for a single one-
size-fit-all approach we might return the same laconic statement as
the 1972 edition of the Hitchhikerrsquos Guide to Europe regarding Alba-
nia (then a communist dictatorship) p42 ldquoForget itrdquo On a more opti-
mistic note they may find comfort in the fact that the patterns of
errors returned by ABGD GMYCPTP and haplowebs are widely dif-
ferent suggesting that if the three yield the same delimitation then
this delimitation should probably be correct However such congru-
ence among approaches is rarely observed in actual studies (eg Mir-
alles amp Vences 2013) Besides although a ldquosweet spotrdquo does exist
where all methods tested perform relatively well our barplots show
that 100 species delimitation success is only achieved for 6-species
data sets For more speciose data sets even an optimistic 99 per-
species delimitation success rate implies 55 chances of correctly
delimiting a 60-species data set and 30 chances of delimiting cor-
rectly a 120-species data set Hence even for ldquoideal groupsrdquo character-
ized by small effective population sizes and low speciation rates (such
as groundwater crustaceans Flot et al 2014 Copilaş-Ciocianu et al
2017) one should always consider the results of any of the methods
tested here with caution and cross-compare them with results
obtained using other approaches (andor using the same approach on
other independent markers)
Using all three types of delimitation approaches on the same data
set is only possible in the case of nuclear diploid markers To date
studies attempting to delineate species from single markers nearly
always use haploid organellar data sets (either chloroplastic or mito-
chondrial) as such markers are both easier to analyse (no double
peaks) and have smaller effective population sizes than single-copy
nuclear markers However ribosomal DNA markers such as interven-
ing spacer sequences (ITSs) are also characterized by small effective
population sizes due to their concerted mode of evolution and their
fast mutation rates make them ideal candidate markers for single-locus
species delimitation Although they remain rare studies using single
diploid sequence markers to delineate species are presently on the
rise either alone (Adjeroud et al 2014 Daeuroınou et al 2016) or in con-
junction with an organellar marker such as COI (Copilaş-Ciocianu
et al 2017 Flot Dahl amp Andre 2013 Papakostas et al 2016) Our
take-home message may therefore be if you sequence a single marker
to delineate species make it a nuclear one and if you sequence two
markers include at least one nuclear marker (instead of piling up two
mitochondrial or chloroplastic DNA regions which behave as a single
marker because they are linked together on the same molecule)
Indeed the best way to overcome the limitations of single-locus
approaches is to use information from several independent loci Several
tree-based multilocus methods have been already proposed notably
BPP (Rannala amp Yang 2013 Yang amp Rannala 2010) DISSECT (Jones
Aydin amp Oxelman 2015) SpeDeSTEM (Ence amp Carstens 2011) and
most recently PHRAPL (Jackson Morales Carstens amp OrsquoMeara 2017)
Such approaches may be able to deal with high speciation rates and large
population sizes by leveraging information provided by several indepen-
dent markers but given their very high computing requirements their
performances have not yet been thoroughly assessed Yet a first simula-
tion-based assessment of BPP recently showed that this popular
approach does not actually delineate species but differentiated popula-
tions (Sukumaran amp Knowles 2017) Given the relatively better perfor-
mance of allele sharing-based and distance-based approaches over tree-
based approaches observed in our benchmark of single-locus species
delimitation it seems reasonable to assume that multilocus approaches
based on allele sharing andor distances would perform better than BPP
but this hypothesis will have to be tested
ACKNOWLEDGEMENTS
We thank three anonymous reviewers for their helpful comments on
this study We are also grateful to Yann Speuroori for his help improving
the ABGDconsensus script SD is funded by the Fonds Weten-
schappelijk Onderzoek (FWO Belgium) as well as the Fonds National
de la Recherche Scientifique (FNRS Belgium) and was previously
funded by the Wiener-Anspach Foundation Computational
resources were provided by the Belgian High Performance Comput-
ing Centre cofunded by ULB and VUB (HPC cluster ldquoHydrardquo)
AUTHORS rsquo CONTRIBUTIONS
SD and J-FF jointly conceived the study designed its methodol-
ogy analysed the data and wrote the resulting manuscript
DATA ACCESSIBILITY
The scripts used are available online at httpsgithubcomjflot
ABGDconsensus and httpsgithubcomjflotcountFFRs2
ORCID
Simon Dellicour httporcidorg0000-0001-9558-1052
Jean-Francois Flot httporcidorg0000-0003-4091-7916
REFERENCES
Adjeroud M Guerecheau A Vidal-Dupiol J Flot J F Arnaud-Haond
S amp Bonhomme F (2014) Genetic diversity clonality and connec-
tivity in the scleractinian coral Pocillopora damicornis A multi-scale
DELLICOUR AND FLOT | 11
analysis in an insular fragmented reef system Marine Biology 161
531ndash541 httpsdoiorg101007s00227-013-2355-9
Ahrens D Fujisawa T Krammer H-J Eberle J Fabrizi S amp Vogler
A P (2016) Rarity and incomplete sampling in DNA-based species
delimitation Systematic Biology 65 478ndash494 httpsdoiorg10
1093sysbiosyw002
Bortolus A (2008) Error cascades in the biological sciences The
unwanted consequences of using bad taxonomy in ecology Ambio
37 114ndash118 httpsdoiorg1015790044-7447(2008)37[114
ECITBS]20CO2
Britton T Anderson C L Jacquet D Lundqvist S amp Bremer K (2007)
Estimating divergence times in large phylogenetic trees Systematic Biol-
ogy 56 741ndash752 httpsdoiorg10108010635150701613783
Copilaș-Ciocianu D Fiser C Borza P Balazs G Angyal D amp Petru-
sek A (2017) Low intraspecific genetic divergence and weak niche
differentiation despite wide ranges and extensive sympatry in two
epigean Niphargus species (Crustacea Amphipoda) Zoological Journal
of the Linnean Society 181 485ndash499 httpsdoiorg101093zoolin
neanzlw031
Daeuroınou K Blanc-Jolivet C Degen B Kimani P Ndiade-Bourobou D
Donkpegan A S L Hardy O J (2016) Revealing hidden species
diversity in closely related species using nuclear SNPs SSRs and
DNA sequences ndash A case study in the tree genus Milicia BMC
Evolutionary Biology 16 259 httpsdoiorg101186s12862-016-
0831-9
Debortoli N Li X Eyres I Fontaneto D Hespeels B Tang C Q
Van Doninck K (2016) Genetic exchange among bdelloid rotifers is
more likely due to horizontal gene transfer than to meiotic sex Cur-
rent Biology 26 723ndash732 httpsdoiorg101016jcub201601031
Dellicour S amp Flot J F (2015) Delimiting species-poor data sets using
single molecular markers A study of barcode gaps haplowebs and
GMYC Systematic Biology 64 900ndash908 httpsdoiorg101093sys
biosyu130
Ellison A M (1987) Effect of seed dimorphism on the density-depen-
dent dynamics of experimental populations of Atriplex triangularis
(Chenopodiaceae) American Journal of Botany 74 1280ndash1288
httpsdoiorg101002j1537-21971987tb08741x
Eme D Zagmajster M Delic T Fiser C Flot J F Konecny-Dupre L
Malard F (2017) Do cryptic species matter in macroecology
Sequencing European groundwater crustaceans yields smaller ranges
but does not challenge biodiversity determinants Ecography 41
424ndash436 httpsdoiorg101111ecog02683
Ence D D amp Carstens B C (2011) SPEDESTEM A rapid and accurate
method for species delimitation Molecular Ecology Resources 11
473ndash480 httpsdoiorg101111j1755-0998201002947x
Esselstyn J A Evans B J Sedlock J L Anwarali Khan F A amp Hea-
ney L R (2012) Single-locus species delimitation A test of the
mixed Yulendashcoalescent model with an empirical application to Philip-
pine round-leaf bats Proceedings of the Royal Society B Biological
Sciences 279 3678ndash3686 httpsdoiorg101098rspb20120705
Ezard T Fujisawa T amp Barraclough T (2013) R package splits SPeciesrsquoLImits by Threshold Statistics version 10-18r45 Retrieved from
httpr-forger-projectorgprojectssplits
Flot J F (2015) Species delimitationrsquos coming of age Systematic Biology
64 897ndash899 httpsdoiorg101093sysbiosyv071
Flot J F Bauermeister J Brad T Hillebrand-Voiculescu A Sarbu S M amp
Dattagupta S (2014) Niphargus-Thiothrix associations may be wide-
spread in sulfidic groundwater ecosystems Evidence from southeastern
Romania Molecular Ecology 23 1405ndash1417 httpsdoiorg101111
mec12461
Flot J F Couloux A amp Tillier S (2010) Haplowebs as a graphical tool
for delimiting species A revival of Doylersquos ldquofield for recombinationrdquoapproach and its application to the coral genus Pocillopora in Clipper-
ton BMC Evolutionary Biology 10 372 httpsdoiorg101186
1471-2148-10-372
Flot J F Dahl M amp Andre C (2013) Lophelia pertusa corals from the
Ionian and Barents seas share identical nuclear ITS2 and near-identi-
cal mitochondrial genome sequences BMC Research Notes 6 144
httpsdoiorg1011861756-0500-6-144
Fontaneto D Flot J F amp Tang C Q (2015) Guidelines for DNA tax-
onomy with a focus on the meiofauna Marine Biodiversity 45 433ndash
451 httpsdoiorg101007s12526-015-0319-7
Fujisawa T Aswad A amp Barraclough T G (2016) A rapid and scalable
method for multilocus species delimitation using Bayesian model
comparison and rooted triplets Systematic Biology 65 759ndash771
httpsdoiorg101093sysbiosyw028
Fujisawa T amp Barraclough T G (2013) Delimiting species using single-
locus data and the Generalized Mixed Yule Coalescent approach A
revised method and evaluation on simulated data sets Systematic
Biology 62 707ndash724 httpsdoiorg101093sysbiosyt033
Hudson R R (1990) Gene genealogies and coalescent process In D J
Futuyma amp J Antonivics (Eds) Oxford surveys in evolutionary biology
(pp 1ndash44) Oxford UK Oxford University Press
Jackson N D Morales A E Carstens B C amp OrsquoMeara B C (2017)
PHRAPL Phylogeographic inference using approximate likelihoods Sys-
tematic Biology 66 1045ndash1053 httpsdoiorg101093sysbio
syx001
Jones G Aydin Z amp Oxelman B (2015) DISSECT An assignment-free
Bayesian discovery method for species delimitation under the multi-
species coalescent Bioinformatics 31 991ndash998 httpsdoiorg10
1093bioinformaticsbtu770
Komsta L amp Novomestky F (2012) MOMENTS Moments cumulants skew-
ness kurtosis and related tests R package version 013 Available from
httpcranr-projectorgwebpackagesmoments
Lim G S Balke M amp Meier R (2012) Determining species bound-
aries in a world full of rarity Singletons species delimitation meth-
ods Systematic Biology 61 165ndash169 httpsdoiorg101093sysb
iosyr030
Lohse K (2009) Can mtDNA barcodes be used to delimit species A
response to Pons et al (2006) Systematic Biology 58 439ndash442
httpsdoiorg101093sysbiosyp039
Miralles A amp Vences M (2013) New metrics for comparison of tax-
onomies reveal striking discrepancies among species delimitation
methods in Madascincus lizards PLoS ONE 8 e68242 httpsdoi
org101371journalpone0068242
Monaghan M T Wild R Elliot M Fujisawa T Balke M Inward D J G
Vogler A P (2009) Accelerated species inventory on Madagascar
using coalescent-based models of species delineation Systematic Biology
58 298ndash311 httpsdoiorg101093sysbiosyp027
Papadopoulou A Bergsten J Fujisawa T Monaghan M T Barra-
clough T G amp Vogler A P (2008) Speciation and DNA barcodes
Testing the effects of dispersal on the formation of discrete
sequence clusters Philosophical Transactions of the Royal Society B
Biological Sciences 363 2987ndash2996 httpsdoiorg101098rstb
20080066
Papakostas S Michaloudi E Proios K Brehm M Verhage L Rota J
Declerck S A J (2016) Integrative taxonomy recognizes evolu-
tionary units despite widespread mitonuclear discordance Evidence
from a rotifer cryptic species complex Systematic Biology 65 508ndash
524 httpsdoiorg101093sysbiosyw016
Paradis E (2010) PEGAS An R package for population genetics with an
integrated-modular approach Bioinformatics 26 419ndash420 httpsdoi
org101093bioinformaticsbtp696
Pfister R Schwarz K A Janczyk M Dale R amp Freeman J (2013)
Good things peak in pairs A note on the bimodality coefficient Fron-
tiers in Psychology 4 700
Pons J Barraclough T G Gomez-Zurita J Cardoso A Duran D P
Hazell S Vogler A (2006) Sequence-based species delimitation
for the DNA taxonomy of undescribed insects Systematic Biology 55
595ndash609 httpsdoiorg10108010635150600852011
12 | DELLICOUR AND FLOT
Price M N Dehal P S amp Arkin A P (2010) FASTTREE 2 ndash Approxi-
mately maximum-likelihood trees for large alignments PLoS ONE 5
e9490 httpsdoiorg101371journalpone0009490
Puillandre N Lambert A Brouillet S amp Achaz G (2012) ABGD Automatic
Barcode Gap Discovery for primary species delimitation Molecular Ecol-
ogy 21 1864ndash1877 httpsdoiorg101111j1365-294X201105239x
Rannala B amp Yang Z (2013) Improved reversible jump algorithms for
Bayesian species delimitation Genetics 194 245ndash253 httpsdoi
org101534genetics112149039
Ratnasingham S amp Hebert P D N (2007) BOLD The barcode of life data sys-
tem (httpwwwbarcodinglifeorg)Molecular Ecology Notes 7 355ndash364
Ratnasingham S amp Hebert P D N (2013) A DNA-based registry for all
animal species The Barcode Index Number (BIN) system PLoS ONE
8 e66213 httpsdoiorg101371journalpone0066213
Reid N amp Carstens B (2012) Phylogenetic estimation error can
decrease the accuracy of species delimitation a Bayesian implemen-
tation of the general mixed Yule-coalescent model BMC Evolutionary
Biology 12 196 httpsdoiorg1011861471-2148-12-196
Roach J C Glusman G Smit A F A Huff C D Hubley R Shannon
P T Galas D J (2010) Analysis of genetic inheritance in a fam-
ily quartet by whole-genome sequencing Science 328 636ndash639
httpsdoiorg101126science1186802
Sites J W Jr amp Marshall J C (2003) Delimiting species A renaissance
issue in systematic biology Trends in Ecology amp Evolution 18 462ndash
470 httpsdoiorg101016S0169-5347(03)00184-8
Sukumaran J amp Holder M T (2010) DENDROPY A Python library for
phylogenetic computing Bioinformatics 26 1569ndash1571 httpsdoi
org101093bioinformaticsbtq228
Sukumaran J amp Knowles L L (2017) Multispecies coalescent delimits
structure not species Proceedings of the National Academy of Sciences
of the United States of America 114 1607ndash1612 httpsdoiorg10
1073pnas1607921114
Tang C Q Humphreys A M Fontaneto D amp Barraclough T G
(2014) Effects of phylogenetic reconstruction method on the robust-
ness of species delimitation using single-locus data Methods in
Ecology and Evolution 5 1086ndash1094 httpsdoiorg1011112041-
210X12246
Yang Z amp Rannala B (2010) Bayesian species delimitation using multi-
locus sequence data Proceedings of the National Academy of Sciences
of the United States of America 107 9264ndash9269 httpsdoiorg10
1073pnas0913022107
Yule G U (1925) A mathematical theory of evolution based on the
conclusions of Dr J C Willis FRS Philosophical Transactions of the
Royal Society B Biological Sciences 213 21ndash87 httpsdoiorg10
1098rstb19250002
Zhang J Kapli P Pavlidis P amp Stamatakis A (2013) A general species
delimitation method with applications to phylogenetic placements
Bioinformatics 29 2869ndash2876 httpsdoiorg101093bioinformatic
sbtt499
SUPPORTING INFORMATION
Additional supporting information may be found online in the
Supporting Information section at the end of the article
How to cite this article Dellicour S Flot J-F The hitchhikerrsquos
guide to single-locus species delimitation Mol Ecol Resour
2018001ndash13 httpsdoiorg1011111755-099812908
DELLICOUR AND FLOT | 13
View publication statsView publication stats