THE HISTORY AND FUNCTIONING OF THE FREE ENTRY SYSTEM
50
Transcript of THE HISTORY AND FUNCTIONING OF THE FREE ENTRY SYSTEM


THE FREE ENTRY MINERAL ALLOCATION SYSTEM IN CANADA’S NORTH: ECONOMICS, SUSTAINABILITY, AND
ALTERNATIVES
Prepared for: Canadian Arctic Resources Committee
By: Malcolm Taggart
August 28, 1998
ISBN 0-919996-81-7

ABSTRACT: A free entry system of mineral allocation such as that used in the Canadian North will grant any individual or corporation the exclusive rights to the minerals under a given area of public land. The free entry system consists of three inter-linked rights: the right of entry onto lands containing minerals, the right to acquire a claim on those lands, and the right to go to a lease and produce the minerals. Non-free entry systems (e.g. a leasing or concession system) give the state far more discretionary power in the process of deciding who will develop mineral resources and where. This paper examines whether free entry helps or hinders in the collection of the economic rent of minerals and so helps or hinders the efforts to apply the criterion of sustainability to the management of minerals in the North. The mineral industry plays a very large economic role in Canada’s North and it health is of great concern to many. The level of mineral exploration (and so the likely health of the mining industry) in any given jurisdiction is dependent on promising geology, metal prices, security of tenure (however acquired), investor confidence, and other factors. The exact nature of the mineral acquisition system is generally not a crucial deciding factor in investment decisions but it does play a crucial role in determining how much economic rent is available for collection. The criterion for sustainability for exhaustible resources is that the full economic rent of the resource be captured and invested in some other form of capital, and preferably a renewable substitute for that resource. Economic rent can be viewed as either the return imputed to land, or the surplus above the return required to motivate production. The mineral rent collection regime in the Canadian North is a value based royalty regime, but, because of some of the deductions permitted, can also be viewed as a project specific profit tax. It would collect more of the available rent while minimizing the distortion of investment decisions if it were converted to a resource rent tax. The free entry system as it is currently practiced in the Canadian North, coupled with the existing royalty regime, hinders rather than helps in the collection of mineral rents. Rent is dissipated by the ground staking requirement, by the subsidization of prospectors, by the higher than necessary administration costs, and by the costs associated with disputes over claim boundaries and ownership. Much of this rent dissipation could be prevented by either the reform of the free entry system or its replacement. Options for reform include switching from ground to map staking and increasing the required assessment work on mineral claims. Options for replacement include leasing and concession systems, the Greenland model among them.

TABLE OF CONTENTS:
INTRODUCTION 1
SUSTAINABILITY AND MINERAL RENTS: 3
Definition and Origins of Sustainability and Sustainable Development: 3
Sustainability and Economics: 4
The Sustainability Criterion Versus Regional Economic Development: 5
MINING AND FREE ENTRY IN THE CANADIAN NORTH 7
The Importance of Mining in the Canadian North: 7
A Brief History of the Free Entry System: 8
The Functioning of the Free Entry System in the North: 9
THE ECONOMICS OF MINERAL EXPLORATION 12
The Fundamentals: 12
Mineral Occurrences: 13
Significant Deposits: 14
Economic Deposits: 15
THE COLLECTION OF MINERAL RENTS 17
Defining Mineral Rent: 17
Options for the Collection of Mineral Rents: 18
The Existing Royalty Regime in the North: 20
Fees, Mining Royalties, and Administrative Costs in the North: 21
THE COSTS OF FREE ENTRY IN THE CANADIAN NORTH 24
Direct Costs: 24

Indirect Costs: 26
Environmental Costs: 27
THE BENEFITS OF FREE ENTRY 28
Industry Confidence: 28
Diversity in the Mineral Exploration Industry: 29
Size and Efficiency of Exploration: 30
POTENTIAL REFORMS OF THE FREE ENTRY SYSTEM 32
Paper Staking: 32
The Work Assessment Process: 32
ALTERNATIVES TO THE FREE ENTRY SYSTEM 34
The Greenland Model: 34
A Possible Long Term Mineral Rent Collection System for the North: 36
CONCLUSIONS 37
REFERENCES 39

1
INTRODUCTION
In simple terms, a free entry system of mineral allocation grants individuals or corporations the exclusive rights to the minerals under a given area of public land. There are certain rules to be followed (the staking and registration process) and the claimant must perform a certain amount of work on the area claimed (known as assessment work). Following these rules represents a cost to the claimant (and when staking is done on a large scale the costs can be considerable), but the government, as owner of the resource, receives little or nothing directly for granting these rights. The free entry system consists of three inter-linked rights: the right of entry onto lands containing minerals, the right to acquire a claim on those lands, and the right to go to a lease and produce the minerals.1 Free entry is defined by these rights. The laws governing hardrock mining in the Canadian North, the Yukon Quartz Mining Act in the Yukon and the Canada Mining Regulations in the NWT, are examples of free entry allocation systems. Under these laws the state has only one very crude discretionary power in making allocation decisions: the power to withdraw lands from staking. Beyond that blunt instrument, the government has no right to refuse a claimant provided that the claimant has followed the procedures called for by the relevant laws and regulations. (One exception, rarely enforced, is the ability to refuse a claimant who has been guilty of staking fraud in the past).2 Non-free entry systems (e.g. a leasing or concession system) give the state far more discretionary power in the process of deciding who will develop mineral resources and where. Over the past several decades there has been increasing pressure to reform or replace the free entry system. Competing land uses have increased in economic and political importance, there has been a rise in environmental awareness in general public, and governments have largely adopted the principle of sustainability. For non-renewable resources such as minerals, applying the criterion of sustainability emphasizes the need to collect the economic rent of the resource and invest it in substitutes for the mineral or in renewable forms of economic activity. In general, economic rent can be defined as either the return imputed to land, or the surplus above the return required to motivate production. For natural resources such as minerals, the second definition is most applicable. Thus the rent of a mineral deposit is the difference between unit extraction costs (including not only a normal profit but a risk premium as well due to the risky nature of mining investments) and the final selling price of the product. In Canada the vast majority of mineral resources are publicly owned but privately extracted. In return for the right to
1 Barton, Barry. 1997. p. 85. 2 Van Kalsbeek, Leo. 1997.

2
extract the resource, companies pay to governments the rent of the resource. Because of the wide variation in extraction costs from deposit to deposit and in the final selling price of minerals over time, the rent available for collection will also vary widely. This paper will examine the economic implications of: the free entry system as it now stands governing the allocation of hardrock minerals in the Canadian North, proposals for reforming the system without altering its fundamental free entry nature, and the possibility of replacing the free entry system. The major focus will be how various allocation systems help or hinder in the collection of the economic rent of minerals. The economic efficiency of free entry will also be examined as efficiency and rent collection are very closely related. Inefficiencies result in the dissipation of rents in the long run.
3
Sustainability and Mineral Rents:
Definition and Origins of Sustainability and Sustainable Development:
Since their emergence as integrated concepts in the 1980s, sustainability and sustainable development have gained wide acceptance. Part of that wide acceptance has stemmed from the wide varieties of definitions applied to the concepts. In 1987 the concept of sustainable development was popularized when the World Commission on Environment published “Our Common Future” (also known as the Brundtland Report). In the report sustainable development was defined as: "development that meets the needs of the present without compromising the ability of future generations to meet their own needs." 3 This masterfully innocuous definition, coupled with the insistence that all development be within the bounds of the ecologically possible, and a call for accelerated economic growth to meet the present needs of the world's poor, insured widespread support for the concept. But it also created a fundamental split in that support as various proponents could not agree about what they were agreeing to. While the debate did result in the broad acceptance of the need to bring environmental considerations into economic policy making, the recognition that development can mean a qualitative as well as or instead of a quantitative improvement, and the commitment to at least some form of social and intergenerational equity, there was no agreement on precisely what those goals entailed, or how to reach them. For many, the debate over sustainable development pointed to the need for a broader framework in which these conflicting ideas and approaches could be reconciled. Thus there has been a shift from sustainable development, with its focus on meeting human needs, to the much broader concept of sustainability. This may be seen as a shift towards a systems approach to the issues of economics, development, environment, and social and intergenerational equity. While there are a large number of definitions of sustainability, almost all require that the quality of life for humans should not decline over the long-term future and that human activities be ecologically sound. Costanza et al. define sustainability as:
"...a relationship between dynamic human economic systems and the larger dynamic, but normally slower-changing ecological systems, in which (1) human life can continue indefinitely, (2) human individuals can flourish, and (3) human cultures can develop; but in which effects of human activities
3 World Commission on Environment and Development. 1987. p. 8.

4
remain within bounds, so as not to destroy the diversity, complexity, and function of the ecological support system." 4
In the Canadian North, governments have officially adopted the concepts of sustainability and sustainable development as a framework for decision making. The federal Department of Indian Affairs and Northern Development for example, has adopted the Brundtland Commission’s definition as a guiding principle, but has added that of the Council of Yukon First Nations (“Beneficial socio-economic change that does not undermine the ecological and social systems upon which communities and societies are dependent.”).5
Sustainability and Economics:
For the discipline of economics, the concept of sustainability has revolved around the idea of substitutability between different forms of capital. Pearce and co-workers, for example, address the concept of sustainable development as an issue of non-declining wealth and non-declining natural wealth in particular. Weak sustainability is defined as maintaining the total stock of capital intact regardless of its composition. Implicit in this approach is the belief that human-made capital can be substituted readily (albeit at increasing cost) for natural capital. Strong sustainability is defined as maintaining the different kinds of capital separately intact. Thus the receipts from the exploitation of natural energy capital (oil for example) must be invested in renewable energy production. Implicit in strong sustainability is the assumption that human-made capital can not readily be substituted for natural capital.6 The World Bank has adopted a blended view of the two, (giving it the rather loaded label of sensible sustainability), which recognizes that there are good substitutes for some forms of natural capital (e.g. tin) while for others there are no conceivable substitutes (e.g. a functioning ozone layer).7 Non-renewable resources have always presented a thorny problem to proponents of strong sustainability. Taken to the extreme, strong sustainability would require that no non-renewables could be utilized by the present generation as that would result in decreasing the stock (the oil example above being a possible exception). Of course, the same would also hold true for all future generations, and no use of non-renewables could ever take place. Thus, in order to justify using non-renewable resources, one must accept (as the World Bank has done) that substitution between forms of capital is necessary for many of those resources. It has therefore been almost by default that the criterion for sustainability for exhaustible resources has been established. That is, that all the economic rent of 4 Costanza , Robert. et al. 1991. p. 8. 5 Department of Indian Affairs and Northern Development. 1997a. pp. 9-10. 6 Pearce, David W. et al. 1989. 7 Serageldin, Ismail. 1996. p. 8.

5
the resource be captured and invested in some other form of capital, and preferably a renewable substitute for that resource.8 This criterion is a direct adaptation of work done in the 1970s by John Hartwick and Robert Solow on substitution among exhaustible resources and intergenerational equity.9 Hartwick’s models show that if all the rents of exhaustible resources were invested in some other form of reproducible capital, then future generations would enjoy exactly the same level of per capita consumption as the present one assuming constant population and no technological change.10 This became known as Hartwick’s Rule and has been summed up as:
“... a society that invests in reproducible capital the competitive rents on its current extraction of exhaustible resources, will enjoy a consumption stream constant in time [and therefore achieve intergenerational equity]...this result can be interpreted as saying that an appropriately defined stock of capital — including the initial endowment of resources — is being maintained intact, and that consumption can be interpreted as the interest on that patrimony. This seems like a useful rule of thumb for policy.” 11
Hartwick and Solow’s emphasis on the investment of rents in reproducible capital (i.e. any form of productive human-made capital) meets the criterion of weak sustainability. Strong sustainability would require the investment to be made directly toward replacing the resource with some renewable substitute for it. While the latter is easy to visualize in the case of solar energy as substitute for oil, it is far more difficult when there is no obvious renewable substitute for the resource. Thus the criterion is not clear cut, but, as Solow points out, a useful rule of thumb for policy.
The Sustainability Criterion Versus Regional Economic Development:
Any attempt to apply the sustainability criterion to the mineral sector in the North must clearly recognize the fundamental conflicts inherent in doing so. First is the conflict between collecting the economic rent now for long term benefit versus trading off the future benefits for more economic activity and economic development now. In practical terms this is what occurs at the present as government directly and indirectly trades off the mineral rents in an attempt to encourage greater investment by the mineral industry in the North. A second conflict is simply a version of the first. That is, the shorter term economic costs (in the form of less mining) stemming from a policy of sustainability would be high for, and be largely borne by, northern residents, while the longer term benefits would be spread throughout the population of Canada. 8 See for example: Young, M. D. 1992, outlining UNESCO’s adoption of the criterion. 9 See: Solow, Robert M. 1974, and Hartwick, John M. 1977 and 1978. 10 Hartwick, John M. 1978. 11 Solow, Robert M. 1986. p. 141.

6
Applying the sustainability criterion to mineral resource extraction requires a three-stage process. First, institutional and market structures must be configured in such a way as to minimize the dissipation of rent, that is, to leave the maximum possible amount of rent available for collection. Second, the mechanism of rent collection should be such as to allow for the collection of the maximum possible amount of that available rent. And third, a mechanism is required to prevent those rents from being treated as general revenue but instead allows them to be invested appropriately. Because of this paper’s focus on the means of mineral allocation in general and the free entry system in particular, it is the means of minimizing the dissipation of rent which will receive the most emphasis. Although various mechanisms of rent collection will be examined and compared, the examination will be a general one only. And the possible mechanisms for ensuring the investment of rents, although a crucial factor in the sustainability equation (without which the criterion will simply not be met), is considered beyond the scope of this paper.

7
MINING AND FREE ENTRY IN THE CANADIAN NORTH
The Importance of Mining in the Canadian North:
The importance of mining in the measured economies (i.e. excluding non-market and subsistence activities) of the Yukon and the NWT is summed up in the tables below. Table I: Mining Industry Share of Northern GDP
Annual value of mineral
production12 (1991-1996 average)
GDP multiplier13 (per $1.00 exogenous
industry output
“shock”)
Mining sector contribution
to GDP (direct and
indirect)
Total GDP14 (annual average,
1991-1996)
Mining sector share of GDP
Yukon $258.8m 1.077 $278.8m $775.4m 36% NWT $702.2m 1.182 $830.0m $1,755.7m 47%
Table II: Mining Industry Share of Northern Employment
Annual value of mineral
production15 (1991-1996 average)
Employment multiplier16 (total per $1,000 of output)
Mining industry
contribution to
employment (direct and
indirect)
Total employment
(annual average,
1991-1996)17
Mining sector share of
employment
Yukon $258.8m 0.00317 820 11,879 6.9% NWT $702.2m 0.00316 2,219 22,352 9.9%
As can be seen in the tables, mining is responsible for a considerable proportion of the North’s GDP. (As nearly 100% of mineral production is exported, the full value of mineral production is considered to be exogenous industry output “shock”). The industry, however, produces a much smaller share of Northern employment. The 12 Yukon Bureau of Statistics and Northwest Territories Bureau of Statistics. 13 Statistics Canada. 14 Yukon Bureau of Statistics and Northwest Territories Bureau of Statistics. 15 Ibid. 16 Statistics Canada. 17 Yukon Bureau of Statistics and Northwest Territories Bureau of Statistics.

8
difference is due to the capital intensive nature of mining, where few people are required to produce large amounts of ore. It should be noted that the choice of and use of multipliers is often highly contentious. The multipliers used here are from Statistics Canada’s 1990 inter-provincial input-output tables (the latest available) and are a reflection of the actual conditions when the numbers were collected. Both the GDP and the employment figures include the direct and indirect benefits accruing from the actual production of ore but not from exploration work. It is estimated that in the early stages of a mineral exploration project (the first year or two) 30-50% of total expenditures are on wages. In the early stage those employed are predominantly skilled workers (geologists, technical people) who tend to not be Northern residents. In the later stages of exploration 15-20% of the budget is spent on wages and more jobs are available for locals. However, these jobs (drilling for example) tend to require fewer skills. There is a strong bias toward seasonal employment in the mineral exploration industry in the North regardless of the skill level of the jobs.18 Spending on mineral exploration in the two territories and the estimated number of jobs resulting are summed up in Table III below. Table III: Mining Exploration Spending and Jobs: Annual averages 1991-1996
Yukon NWT Estimated total exploration expenditures in the North19 $21.1m $98.9m Estimated wage expenditures for exploration.20 $5.3m $24.7m Estimated number of full time equivalent jobs generated for Northern residents.21
99 463
A Brief History of the Free Entry System:
The free entry system of mineral allocation originates in the mining laws which prevailed as customary law in the tin producing areas of England and in the coal fields of Germany in medieval times. Under these laws, miners had the right to enter onto land and to mine it irrespective of who owned the surface rights. The free entry system spread to the New World (likely carried abroad by emigrating miners from England’s stanneries) and it fitted perfectly with the expansionist mentality of the 19th century in North America and Australia. Miners were seen as the leading edge of the wave of settlement. The land was perceived to be an unpopulated wasteland (a perception not shared by the aboriginal peoples needless to say), and its exploitation and settlement were high priorities. A fundamental premise of the
18 Diament, Rick. 1997. 19 Taken from Natural Resources Canada statistics. Assumes that 90% of NRCan’s figures (which include overheads) are actually spent in the North. 20 Assumes that 25% of exploration expenditures are wages. 21 Assumes that 75% of wages go to Northern residents at $40,000 per job per year.

9
free entry system is that mining is the best (and often only) possible use for very large areas of land. In North America mining laws have long reflected this premise. In the United States under the 1872 Mining Law, lands subject to the law were declared open for exploration and occupation, and could be purchased for very small sums.22 In Canada, the free entry laws — beginning in British Columbia in 1859 — did not allow for the easy acquisition of the surface rights of mineral claims. They did however, allow the miner the full use of the surface of the claim as required to extract minerals.23 The first laws governing hardrock mining in the Canadian North were the Quartz Mining Regulations made under the Dominion Lands Act in 1898. These were a slightly altered version of British Columbia’s Mineral Act of 1896. The Regulations were re-enacted as the Yukon Quartz Mining Act to govern mining in the Yukon Territory. Hardrock mining in the Northwest Territories is governed by the Canada Mining Regulations, the direct descendent of the Quartz Mining Regulations. The Yukon Quartz Mining Act is now described as the least-amended mining legislation in Canada.24
The Functioning of the Free Entry System in the North:
Given their common origins, it is not surprising that the means of acquiring title to minerals in the Yukon and the NWT are very similar. In both jurisdictions anyone over the age of 18 years has the right to enter, prospect, and claim minerals on unoccupied crown lands. The NWT — unlike the Yukon — requires the possession of a prospector’s license (available to any individual for $5.00) in order to stake and register a claim. The process of staking and registering a claim confers on the staker a set of exclusive rights to any minerals on that claim. In the Yukon:
“The holder of a recorded mineral claim has the exclusive right to all minerals within the claimed area together with the right to enter on and occupy his claim for the efficient and miner-like operation of the mines and minerals contained within the claim. The initial term of the claim is one year with an absolute right of renewal from year to year subject to the performance of work...”25
22 Barton, Barry. 1997. pp. 104. 23 Barton, Barry. 1993. p. 119. 24 Ibid. p. 147. 25 Prospectors and Developers Association of Canada. 1996. Yukon Territory. p. 4-7.

10
In the NWT rights acquired are the same but the claims may be held for a maximum of 10 years. However, the claim holder has the right to convert the claim into a renewable 21 year mineral lease. The actual staking process used is different in the two northern jurisdictions. The Yukon uses the two-post system which requires that a claim be delineated by a location line anchored by two posts which must be placed in the field. The claim must be a four-sided plot, with no side being longer than 1,500 feet. As the location line may be used to delineate two claims (with the line as the border between them), most quartz claims are staked as two claim “units” in order to cut down on the cost of staking. The NWT, in contrast, uses a four-post system of staking on the ground:
“A mineral claim in NWT may not exceed 2582.5 acres (10.45 km2) and should be rectangular, as nearly as possible with its length no more than five times its width. The length and width of the claim should each be 1500 ft or multiples of 1500 ft (457m). Each corner must be marked by a post... Outer boundaries shall be marked at intervals of 1500 feet by posts...”26
This system allows for the block staking of large claims, and lessens the possibility of over-staking as the outer boundaries of the claim are marked. The Northwest Territories has one major feature in its mineral acquisition system which the Yukon does not share: the prospecting permit. Any holder of a prospector’s license may apply for a prospecting permit covering one quarter of a mineral claim staking sheet (i.e. 1/4 of National Topographic 1:50,000 series maps) from Dec. 1 to Dec. 31 on a first come first served basis. The permit grants exclusive right to prospect and stake claims in the permit area for a period of 3 years (south of 680N) or 5 years (north of 680N). The permit area varies with latitude from 33,862 to 71,661 acres.27 In both northern jurisdictions the up-front fees or charges for acquiring mineral rights are nominal. The expense to the prospective miner consists of the staking itself and the ongoing assessment work requirements. The Yukon requires that $100.00 worth of work be done per quartz claim per year or that the same amount be paid in lieu of work in order to maintain the claim in good standing. A quartz claim covers an area of 51 acres, therefore the work requirement amounts to approximately $2.00 per acre. In the NWT, the work requirement is also $2.00 per acre averaged over the 10 years the claims may be held. The types of work allowed as assessment work are not specified under the Yukon Quartz Act except in dollar terms, but in the NWT expenditures for the following activities are credited as assessment work:
26 Prospectors and Developers Association of Canada. 1996. Northwest Territories. p. 4-10. 27 Ibid. p. 4-12.

11
1. stripping, drilling, trenching, sinking shafts and driving adits or drifts; 2. geological, geochemical, and geophysical surveys; 3. any other exploratory work approved by the engineer of mines; 4. a survey of the claim approved by the Surveyor General; 5. construction of roads or airstrips to provide access to the claim.28
These activities are also generally accepted as assessment work in the Yukon.
28 Ibid. p. 4-16.
12
THE ECONOMICS OF MINERAL EXPLORATION
The Fundamentals:
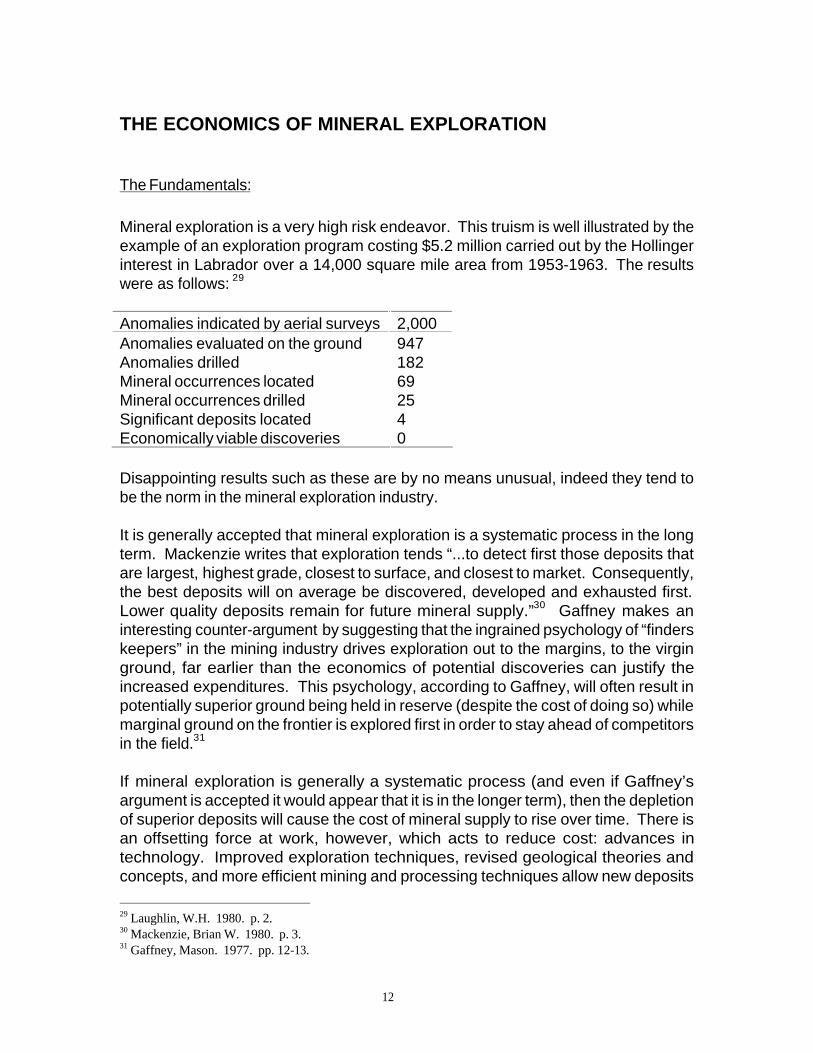
Mineral exploration is a very high risk endeavor. This truism is well illustrated by the example of an exploration program costing $5.2 million carried out by the Hollinger interest in Labrador over a 14,000 square mile area from 1953-1963. The results were as follows: 29
Anomalies indicated by aerial surveys 2,000 Anomalies evaluated on the ground 947 Anomalies drilled 182 Mineral occurrences located 69 Mineral occurrences drilled 25 Significant deposits located 4 Economically viable discoveries 0
Disappointing results such as these are by no means unusual, indeed they tend to be the norm in the mineral exploration industry. It is generally accepted that mineral exploration is a systematic process in the long term. Mackenzie writes that exploration tends “...to detect first those deposits that are largest, highest grade, closest to surface, and closest to market. Consequently, the best deposits will on average be discovered, developed and exhausted first. Lower quality deposits remain for future mineral supply.”30 Gaffney makes an interesting counter-argument by suggesting that the ingrained psychology of “finders keepers” in the mining industry drives exploration out to the margins, to the virgin ground, far earlier than the economics of potential discoveries can justify the increased expenditures. This psychology, according to Gaffney, will often result in potentially superior ground being held in reserve (despite the cost of doing so) while marginal ground on the frontier is explored first in order to stay ahead of competitors in the field.31 If mineral exploration is generally a systematic process (and even if Gaffney’s argument is accepted it would appear that it is in the longer term), then the depletion of superior deposits will cause the cost of mineral supply to rise over time. There is an offsetting force at work, however, which acts to reduce cost: advances in technology. Improved exploration techniques, revised geological theories and concepts, and more efficient mining and processing techniques allow new deposits
29 Laughlin, W.H. 1980. p. 2. 30 Mackenzie, Brian W. 1980. p. 3. 31 Gaffney, Mason. 1977. pp. 12-13.

13
to be discovered even on well explored ground and known marginal or uneconomic deposits to become viable. A northern example of this process at work is the discovery of the Brewery Creek gold deposit near Dawson City in the Yukon Territory. The combination of a new geological concept (stemming from the Fort Knox discovery in Alaska), the use of geochemical analysis of stream sediments as an exploration technique, and the use of cyanide heap leaching as a low cost ore processing technique allowed the deposit to be discovered and brought into production.32 Mineral exploration for the industry as a whole is driven by the expected value of that exploration. The expected value is the average value that exploration will yield in the long term given all the successes and failures associated with a very large number of discoveries. The calculation is made from an average time distribution of cash flows for all economic discoveries within an environment of interest. The expected value must be realized in the long term or investment in the industry would cease. It is important, however, to recognize that high discovery risk (i.e. the low probability of finding an economic deposit) and the variability of return among economic deposits make the realization of expected value difficult for any particular investment. 33
Mineral Occurrences:
The fruits of mineral exploration occur in three forms: mineral occurrences, significant deposits, and economic deposits. A mineral occurrence is any confirmed incidence of a mineral, regardless of its size or grade. In the Yukon, these occurrences are registered on the territorial MinFile when they have been confirmed. Currently the Yukon MinFile contains over 2,500 occurrences. The equivalent data base for the NWT contains approximately 2,800 occurrences. The NWT data base is not considered complete, however, and its manager estimates that there could be as many as 15,000 known mineral occurrences in the Territories.34 Although occurrences have an obvious importance (every significant and economic deposit must first be recognized as an occurrence), that importance should not be exaggerated. The discovery rate for occurrences does not appear to be linked to the delineation rate of significant deposits (see section below). Unpublished work by Grant Abbot indicates that the number of new discoveries made in the Yukon each year has decreased dramatically since 1974. The decrease has occurred despite tremendous surges in exploration spending in the early and late 1980s. Indeed, there appears to be no direct correlation between the level of exploration
32 Mineral Resources Branch, Yukon Department of Economic Development. 1997, and Diament, Rick. 1997. 33 Mackenzie, Brian W. 1980. pp. 5-7. 34 Sage, Beth. 1998.

14
(measured either by expenditures or by staking activity) and the rate of discovery of mineral occurrences over the years 1971-1991.35 The decline in the discovery rate is almost certainly the result of the law of diminishing returns. The relatively easy and obvious occurrences (given the current level of geological knowledge and exploration technology) have been found, and so the odds against finding new ones lengthen. Up to 1991, only two of the occurrences contained in the Yukon’s MinFile did not have a surface showing but were found by drilling “blind” i.e. relying strictly on interpreting the geology of the area. In the longer term discovering new occurrences will rely increasingly on expensive and risky blind drilling. This is now the case in heavily explored areas of Ontario, for example.36 This pattern almost certainly bodes ill for the independent prospector and the smaller junior companies in the longer term. Without surface showings to interest investors, raising funds to carry out exploration will become increasingly difficult.
Significant Deposits:
The term significant deposit is often used somewhat loosely but for the purposes of this paper it is defined as “...a mineral deposit sufficiently attractive to have warranted the expenditure necessary to establish its tonnage and grade.”37 The delineation rate for significant deposits tends to vary wildly over quite short periods. Lemieux charts the annual delineation rate for Canada from 1960 to 1984 and shows the rate dropping from a peak of 40 in 1968 to a low of 15 in 1972, only to climb erratically to a new high of 42 in 1981 before plunging again to 12 in 1984.38 It is therefore important to examine the average delineation rates over time in order to gain a reasonable idea of the likely future viability of the industry. In the North the average number of significant deposits delineated per year has remained remarkably constant over time. Over the 28 year period from 1955-1981 there were 38 significant deposits delineated in the Yukon for an average of 1.4 per year.39 From 1982 to 1995 the Yukon rate dropped slightly to 1.3 per year over the 14 year period. In the Northwest Territories the rate stands at approximately 1.6 per year over the 48 years from 1933 to 1981 and at 1.4 per year from 1982-1995.40
35 Abbot, Grant. 1998. 36 Ibid. 37 Lemieux, Andre et al. 1986. p.23. 38 Ibid. p. 30. 39 Abbot, Grant. 1982. p. 18. 40 Figures given are derived from: Sinclair, W.D. et al. 1994 and, Mineral Resources Division. 1995. These numbers should not be taken as exact but rather as close approximations due to somewhat different definitions of significant and the problems of dating the delineation accurately.

15
That the rate of delineation of significant deposits has remained relatively constant over many decades in the North bodes very well for the continued long term viability of the mining industry in the region. Given the right economic conditions, almost any significant deposit may become economically viable and result in a producing mine. It is also interesting to note how the delineation rate has remained relatively constant given the marked decline of the discovery rate as outlined above. Thus the discovery rate has little direct impact on the delineation rate.
Economic Deposits:
The definition of an economic mineral deposit is also slippery. The usefulness of the concept as an analytical tool is questionable given the enormously variable nature of what is economic at any given time. The simplest approach is to rate as economic any deposit that has become a producing mine and no others. From a rent collection point of view, this is the obvious approach as only operating mines can pay economic rent. To estimate the expected value of mineral exploration however, the cost and return characteristics of all deposits in the area of interest must be brought to a common point. This requires that they be examined under a common set of economic and technological outlook conditions whether or not they are actually a producing mine. This was done by Mackenzie et al. in a study of the economics of base metal mining in the Canadian North. 41 Given its assumptions about prices, exchange rates, and rates of return, the study gives expected value assessments (in millions of mid-1983 dollars) of base metal discoveries for 1946-1977 in the North of:42 Table IV: Expected Value and Rate of Return for Base Metal Exploration
Yukon NWT North of 60 Total exploration expenditures 197 140 337 Number of economic discoveries 11 18 29 Average exploration expenditures per discovery 15 7 12 Average return 145 258 210 Expected value 130 251 200 Rate of return (%) 23 38 32
The study concludes that the expected value of base metal exploration in the North was approximately twice as high as in southern Canada. Such high expected values of exploration would lead to increased mineral activity in the North in the long term, recessions and slumps notwithstanding. 43 Mackenzie’s study, coupled with the steady rate of delineation of significant deposits, give weight to the argument
41 Mackenzie, Brian W. et al. 1984. 42 Ibid. pp. 34, 36, & 48. 43 Ibid. p. viii & xii.

16
that the mineral industry in the North is generally healthy and that its long term prospects are good. Despite the often wild swings in exploration investment from year to year, the industry is highly unlikely to abandon the North, despite dire warnings to the contrary, in the event of changes to the allocation system.

17
THE COLLECTION OF MINERAL RENTS
Defining Mineral Rent:
One of the problems faced by governments attempting to collect the economic rent of mineral resources is the difficulty in pinning down just what that economic rent is. In theory, defining rent is simple. Rent can be viewed as either the return imputed to land, or the surplus above the return required to motivate production. It is important not to confuse rent with profit. The total “profit”, or return from a property is the sum of the rent and the returns to the capital used to develop that property. Gaffney gives the following compact summary of how rent should be calculated: Cash Flow = [Gross Receipts] - [Current and Ancillary Expenses] Profit = [Cash Flow] - [Depreciation] Rent = [Cash Flow] - [Capital Recovery] Capital Recovery = [Depreciation] + [Interest] Rent = [Profit] - [Interest] 44 Interest refers to the return to capital, whether or not there is interest actually being paid on debt. It is the return to capital which becomes the point of contention in defining the rent. How much is required to motivate production? And how does one distinguish between genuine required return and return disguised as excess expenses, excessive depreciation, and other financial shell games? For the purpose of comparing the various means of rent collection as outlined in the next section, Figure I shows a simplified model of the rent available from the mineral industry as a whole.45 It is assumed that there is no absolute limit to the supply of any particular metal for the foreseeable future and therefore there will be no scarcity rent. That is, there is sufficient under used production capacity (mothballed mines and known reserves) to enable supply to rise relatively quickly in response to a rise in the price, and there is sufficient further potential supply to be brought into production to meet longer term increased demand. Thus there is only differential rent (the area between the unit cost of production curve and the price line) available for collection.
44 Gaffney, Mason. 1977. p. 20. 45 Adapted from: Van Kooten, G.Corneilius. 1993. p. 23.

18
Figure I: Simplified Diagram of Available Rent Available rent
Options for the Collection of Mineral Rents:
When faced with the task of collecting the rents which are its due, government has four broad objectives in view. These are: to maximize the revenue collected; to ensure the neutrality of the rent collection system (i.e. to avoid distorting the investment decisions made both within the mining industry and between mining and other industries); to reduce the uncertainty and risk both for itself and for the industry; and, perhaps least importantly, to avoid undue delays in the collection to rents.46 There are many possible mechanisms available to governments for the collection of mineral rents. These fall into two basic categories: ex ante (i.e. rents are collected prior to production), or ex post (rents collected after minerals have been produced). Ex ante mechanisms include fixed fees and cash bonus bidding. Although cash bonus bidding is commonly used in the oil and gas industry, it has not been applied in the mineral industry. Ex post options include royalties and various forms of profit or income taxes. Selling mining rights for a fixed fee is a means of collecting rents independently of the outcome of the investment. In fact, the government collects “rents” even if there is no investment at all.47 If all mining operations begin with the payment of the same fixed fee then the effect is to raise the production cost curve in Figure I. At any given
46 Garnaut, Ross and Anthony Clunies Ross. 1983. p. 87. 47 Ibid. p. 91.
Price or cost
Quantity
Price line
Production cost per unit

19
price level, this reduces the number of economically viable operations but ensures the collection of at least some of the overall mineral rent (represented by the area between the old and new cost curves). By treating all operations identically however, the fixed fee approach fails to collect any of the differential rent generated by the most cost effective operations (those on the bottom end of the cost curve). In general, a fixed fee approach to rent collection “...is most appropriate when the government has little idea of the value of what it is selling or the investor of what he is buying, and where the actual proceeds will be hard to assess in any case. Thus it may be suitable for the sale of exploration, as distinct from extraction, rights.”48 Fixed fees are simple to administer and provide a high degree of certainty to both industry and government, but are somewhat distortionary and tend to leave much of the mineral rents in the hands of industry. Cash bonus bidding, in which companies bid for the mineral rights over particular areas can be viewed as a variation of the fixed fee approach, with the fees being set by auction. Under ideal conditions, with near perfect information as to the productive power of the asset shared by a sufficient number of bidders, the cash bonus bidding system would be the perfect means of rent collection. It would be completely non-distortionary with the most efficient operator paying the entire differential rent for that asset through their bid. It would be relatively simple to administer, and the government would receive much if not all of the rent up front. Of course geological information is never perfect or even near perfect. The cash bonus bidding system has had considerable success in the sale of offshore oil rights in the continental US, where the geology was sufficiently predictable to at least calculate reasonable odds for success, where there were sufficient numbers of bidders, and where it was possible for large producers to acquire a large number of diverse blocks thereby decreasing their overall risks. Under those conditions, a reasonable amount of the differential rent of the resource was collected.49 Cash bonus bidding has not yet been applied to the metal mining industry largely due to the lack of any form of reliable information as to the likely value of the resource, if any, in any particular area before it has been thoroughly explored. There is also the problem of attracting a sufficient number of bidders. Of the ex post means of rent collection, royalties are by far the most common. Royalties can be levied either on the amount of mineral extracted or on its value as it is being produced. In either case, royalties have the attraction of being very simple to administer as they are based on the amount produced which is easy to check and not open to interpretation. Unfortunately, royalties (and particularly those based on the volume of production), have a similar effect as fixed fees in that they raise the unit cost of extraction for every operation and so do little to collect much of the differential rent. In addition, royalty systems tend to reduce both the pace and the
48 Ibid. 49 Ibid.

20
extent of extraction (the high grading effect). This is socially wasteful as ore is left in the ground even though its price exceeds the social cost of its extraction.50 Other means of ex post rent collection, all of which attempt to collect the differential rent, involve taxing either the income or profits of mining companies, or taxing the positive net present value or simply the cash flows of mining operations. The imposition of a higher rate of income tax on mining companies would have the advantage of operating through the existing tax system, and, as a general rule, would bring in a greater amount of the mineral rents available than either the fixed fee or royalty approach.51 The potential disadvantages of such an approach include its blanket nature (rather than being sensitive to the features of each project), the problem of setting the rate so as to collect as much rent as possible without discouraging too many potential projects, and the incentive it gives all companies (but especially those mining superior deposits) to dissipate rents through higher overheads and so on. A variation of this approach is the progressive profits tax which is analogous to the progressive individual income tax system. A progressive tax would likely collect more of the differential rents than the flat higher tax, but it suffers from the same problems of setting the best rate and the thresholds at which the rate will increase. The resource rent tax aims to tax the positive net present value of a mining project as it is realized. The tax is assessed at a discount rate which would aim to match the investor’s discount rate as closely as possible, thereby taxing only the positive net present value as the investor sees it. All cash flows of a project, both positive and negative, would be summed each year to yield a net figure. Those net figures accumulate year by year at a set interest rate until a cumulative total is attained which is then taxed at the tax rate. The resource rent tax, if properly applied, does ensure that much of the differential rent is collected, and does so with minimal distortion of investment decisions. Its drawbacks include the difficulty in matching the investor’s discount rate with sufficient accuracy, and the relatively high administrative costs. The resource rent tax has been applied in Papua New Guinea and in Tanzania. 52
The Existing Royalty Regime in the North:
The mineral rent collection regime in the Canadian North is a value based royalty regime. However, it can also be viewed as a project specific profit tax because of some of the deductions permitted. In both the Yukon and the NWT, a sliding scale of royalties apply to each mining operation which has a net value of output of more than $10,000. The two jurisdictions are compared in Table IV below. 50 Ibid. p. 93. 51 Ibid. p. 95. 52 Ibid. pp. 97-99.
21
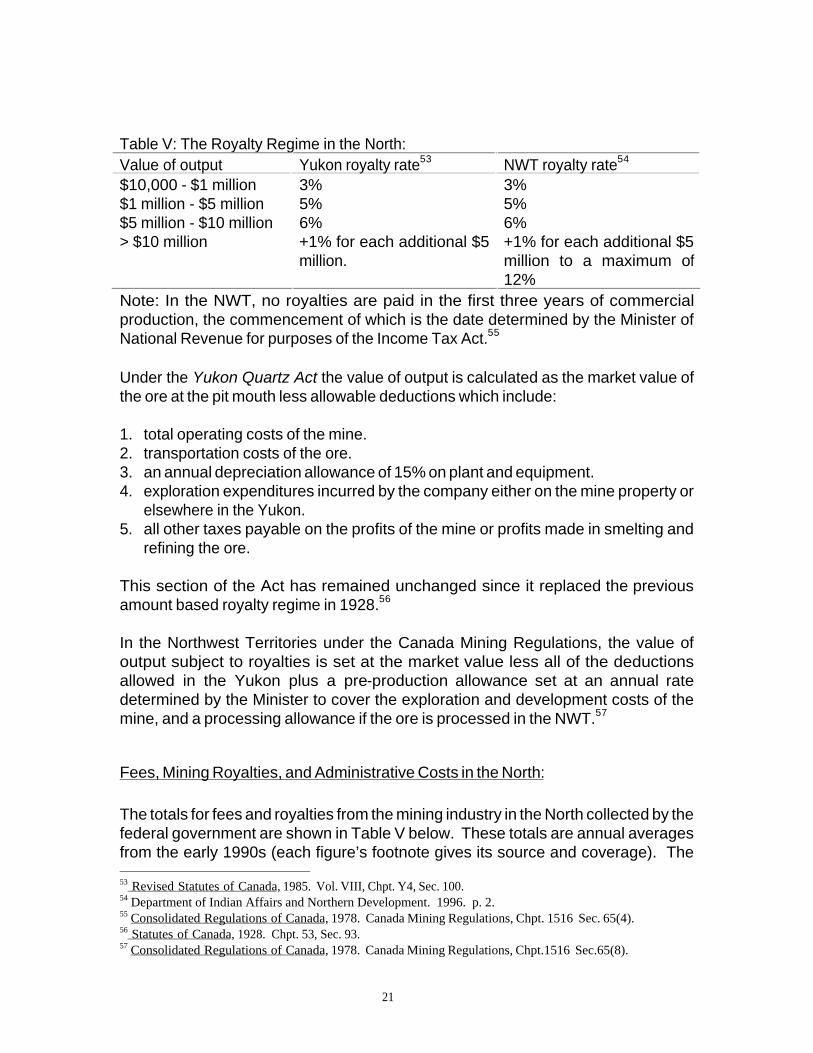
Table V: The Royalty Regime in the North:
Value of output Yukon royalty rate53 NWT royalty rate54 $10,000 - $1 million 3% 3% $1 million - $5 million 5% 5% $5 million - $10 million 6% 6% > $10 million +1% for each additional $5
million. +1% for each additional $5 million to a maximum of 12%
Note: In the NWT, no royalties are paid in the first three years of commercial production, the commencement of which is the date determined by the Minister of National Revenue for purposes of the Income Tax Act.55 Under the Yukon Quartz Act the value of output is calculated as the market value of the ore at the pit mouth less allowable deductions which include: 1. total operating costs of the mine. 2. transportation costs of the ore. 3. an annual depreciation allowance of 15% on plant and equipment. 4. exploration expenditures incurred by the company either on the mine property or
elsewhere in the Yukon. 5. all other taxes payable on the profits of the mine or profits made in smelting and
refining the ore. This section of the Act has remained unchanged since it replaced the previous amount based royalty regime in 1928.56 In the Northwest Territories under the Canada Mining Regulations, the value of output subject to royalties is set at the market value less all of the deductions allowed in the Yukon plus a pre-production allowance set at an annual rate determined by the Minister to cover the exploration and development costs of the mine, and a processing allowance if the ore is processed in the NWT.57
Fees, Mining Royalties, and Administrative Costs in the North:
The totals for fees and royalties from the mining industry in the North collected by the federal government are shown in Table V below. These totals are annual averages from the early 1990s (each figure’s footnote gives its source and coverage). The 53 Revised Statutes of Canada, 1985. Vol. VIII, Chpt. Y4, Sec. 100. 54 Department of Indian Affairs and Northern Development. 1996. p. 2. 55 Consolidated Regulations of Canada, 1978. Canada Mining Regulations, Chpt. 1516 Sec. 65(4). 56 Statutes of Canada, 1928. Chpt. 53, Sec. 93. 57 Consolidated Regulations of Canada, 1978. Canada Mining Regulations, Chpt.1516 Sec.65(8).

22
current budgets for both the federal and the two territorial government’s spending on the administration and promotion of the mineral sector in the North are also shown. Table VI: Average Annual Fees, Royalties, and Administration Costs: 1992-1997.
Yukon Northwest Territories North of 600 Totals Fees $1.3 million58 $1.9 million59 $3.2 million Royalties60 $0.4 million $2.1 million $2.5 million Territorial costs -$2.3 million61 -$2.0 million62 -$4.3 million Federal costs -$3.0 million63 -$3.4 million64 -$6.4 million Totals -$3.1 million -$1.4 million -$5.0 million
It is clear that the fees and royalties levied on the mineral industry in the North do not cover the costs of administering, subsidizing, and promoting the industry. Of course, governments also reap tax benefits from the activities of the industry both directly and indirectly. These include corporate income tax, income tax from those employed in the industry, taxes from firms and individuals working as suppliers to the industry, and the general spin-off effects generated by the economic activity. The territorial governments appear to be the greatest gainers. Although their corporate tax take tends to be minimal, the personal income tax generated from mining can be considerable. As a very rough estimate, the total of approximately 3,600 jobs generated annually in the North (see Tables I and III) would produce approximately $10m in income taxes for the two territorial governments.65 This figure, however, does not take into account any changes to federal transfers which result from the generation of revenue in the territories or any change in population.
58 Wiebe, Dave. 1997. Average for the fiscal years 1991/92 to 1995/96. Includes application and transfer fees, payments in lieu of assessment work, certificates of work, quartz lease renewal fees, and miscellaneous income from the sales of maps and claim sheets. Does not include any fees collected from placer mining. Taken from Yukon Mining Recorder’s Annual Reports. 59 Department of Indian Affairs and Northern Development. 1997b. Annual average 1992-1996. 60 Camlucci, Doug. 1998. Annual average of royalties collected under the authority of the Yukon Quartz Mining Act and the Canada Mining Regulations for the fiscal years 1991/92 to 1996/97. 61 Abercrombie, Shirley. 1998. Includes resource assessment, marketing programs, the Yukon Mining Incentive program, mining facilitator, mineral development unit, and the cost-shared geology program (which absorbs nearly $1.4 million of the total). 62 Jones, Adrian. 1998. The approximate budget for the Mineral, Oil, and Gas Division of the NWT Department of Resources, Wildlife, and Economic Development. 63 Estimate only. DIAND Yukon could not give a figure for mineral administration due to the its amalgamated budget system. 64 Nutter, Dave. 1998. Current annual budget for federal administration of minerals in the NWT. Includes regulatory, research, policy development and general management costs. It should be noted that federal costs in both territories are likely understated as many aspects of mineral administration and enforcement are spread out between sections of DIAND and often involve other departments as well. 65 Kischuck, Paul. 1998. Based on assumed $40,000 annual gross salary per job and a territorial tax take of 7% of that gross. This very rough yardstick is sometimes used by the Yukon Government.

23
The federal government and country as a whole however, likely do not benefit greatly. While it is impossible to accurately predict the exact proportion, some, and perhaps most of the capital and labour involved in northern mining would be employed elsewhere in the country producing similar benefits if they were not in the North.

24
THE COSTS OF FREE ENTRY IN THE CANADIAN NORTH
The costs estimated and discussed in this section are those costs specifically associated with the free entry system and do not include those costs endemic to mining or mineral exploration as a whole. All of the costs discussed could be eliminated in large part or in whole by either the reform of the free entry system or its replacement. Some of the costs are direct and easily measured while others are indirect and therefore the estimates given are open to debate. An effort has been made however to keep the estimates conservative. Environmental costs, while real, have not been included due to difficulties in estimation, and in determining how much of the costs are linked to the free entry system. The costs of free entry are summed up in Table VII below. How the figures were arrived at is discussed in detail in the sections below. Table VII: Costs of Free Entry: Annual Averages: 1992-1996
Yukon NWT North of 60 Field staking $1,450,000 $7,150,000 $8,600,000 Subsidization of prospectors
$640,00 $132,000 $732,000
Administration costs - - $100,000 Dispute costs - - $100,000 Total - - $9,532,000
Direct Costs:
The direct costs of the free entry system as it functions in the Canadian North are the staking costs borne by the industry, and the direct subsidization of prospectors by both territorial governments. The process of staking claims in the field is an expensive one, and, from an economic perspective, is grossly inefficient. It is inefficient because the same lands could be allocated at nearly no cost by the paper staking process, avoiding the dissipation of moneys on totally non-productive field staking. And because the costs of field staking are borne up front by industry, in the end these expenditures take the form of lost potential rent to the government as the industry must still receive its required return after all its costs are factored in before mineral development will occur. In the Yukon the total cost of hardrock mineral staking can be estimated with a fair degree of accuracy due to the standard size of claims. Staking contractors currently

25
charge $130 per “unit” or pair of claims set on either side of a 1,500 foot long location line. This average cost includes all expenses in the field but not the registration fee of $10 per claim which must be paid.66 A total of 55, 795 claims were staked in the Yukon from 1992-1996, at a cost of approximately $7.25 million over those 5 years. The estimated annual average cost was therefore $1.45m. Staking costs in the Northwest Territories are much more difficult to estimate due to the possible variations in claim sizes and the sometimes much greater distances involved in setting up a staking job. The figure of $0.45 per acre is used here as a reasonable estimate.67 (As a point of comparison, the equivalent cost per acre in the Yukon is $1.27). The diamond staking rush resulted in the staking of approximately 63.5 million acres over the four years from 1992-1995. At $0.45 per acre this comes to a total staking expenditure of approximately $28.6 million over that time. This estimate may be somewhat high as staking jobs during the rush often involved upwards of 1 million acres at a time and so average costs could have been somewhat lower. On the other hand, during the height of the rush, the enormous demand drove up costs and speculators were staking large blocks and selling them to mining companies for $1.00 per acre.68 The estimate is therefore more likely to be low. The estimated average annual cost of staking in the NWT was therefore $7.15m. While it is recognized that the diamond rush in the NWT and the Finlayson Lake rush in the Yukon skew the averages, these estimates demonstrate that field staking costs are not insignificant. The subsidization of mineral prospecting by governments is another direct cost of the free entry system as it is currently practiced in the North. In the Yukon, subsidization programs have been in place since 1986 using the rationale that granting small amounts of funds (the maximum grant for exploration is $10,000/year while the maximum for target evaluation is $20,000/year) will act as seed money, encouraging further exploration activity and expenditures. The average annual disbursement over the fiscal years 1992/3 to 1994/5 has been approximately $640,000.69 The equivalent program in the NWT is considerably smaller and disbursed approximately $132,000 in 1997.70 Although highly popular among the independent prospectors who are its primary clients, this program appears to be of somewhat dubious value in increasing the likelihood of discovering and delineating significant deposits especially given the greatly decreasing discovery rate for new deposits. The subsidy programs appear to act more as a form of regional or
66 Davidson, Graham and Denis Jacob. 1997. 67 McLean, Malcolm and Vic Waugh. 1997. The figure per acre is based on the assumption that the average staking job involves 15 claim blocks each of the maximum size (a total of 38,730 acres) at an average on the ground cost of $800 per block. An allowance of $6,000 per job is included for mobilization and helicopter costs. 68 Ibid. 69 Graham & Associates. 1996. 70 Jones, Adrian. 1998.

26
community economic development than as a serious effort to increase mineral discovery and development.
Indirect Costs:
The indirect costs of the free entry system include: higher than required administrative costs borne by governments, and the costs generated by disputes over staking and mineral title borne by both the government and the industry. Newfoundland is an example of a jurisdiction which, while retaining the free entry system of allocation, has recently moved from the traditional ground staking to a process of paper staking on the island portion of the province (Labrador was already using the paper staking process). Newfoundland’s experience has shown that administration costs are roughly the same between the two approaches (paper staking saves approximately $1,000 per 15,000 claims staked over ground staking), but that there have been savings of $10,000 to $30,000 per year in government field inspection costs.71 It seems reasonable to assume that greater savings would result in the North if map staking were adopted due to its much greater area and greater exploration activity. A figure of $100,000 per year has therefore been selected as a conservative estimate of potential savings. Disputes over the boundaries of staked claims, over fractions, and over whether or not the required procedures have been followed are commonplace in the North. The great majority of such disputes are settled outside of the formal hearing structures of the mining recorders let alone the courts. This is most likely due to the unknown and perhaps ephemeral value of the ground under dispute and the well known and concrete costs of hearings and court cases. But even settling disputes outside of the formal channels does have a cost. Negotiations between companies, delays, and general bad feeling all impose costs although these are very difficult to estimate. In addition, the government commonly bears a part of the costs of any staking dispute as the parties often demand that the mining recorder inspect the entire area under dispute in detail. When large areas are involved, this can be prohibitively expensive and the mining recorder has been known to refuse such unreasonable demands and order the parties to settle the dispute among themselves. This was recently done in the Finlayson Lake area of the Yukon where Cominco and Westmin were disputing one another’s claims.72 In the Yukon over the years 1981-1997 there have been approximately 125 notices of hearing filed by the Mining Recorder, each being an attempt to resolve some issue concerning mining claims. Of the 125, only 4 have dealt with the staking of hardrock claims. The vast majority deal with disputes over placer claims.73 Each 71 Andrews, Kenneth. 1998. 72 Van Kalsbeek, Leo. 1997. 73 Taken from: Notices of Hearing File. Mining Recorder, Whitehorse.
27
hearing is estimated to cost the government $1,500.74 There appear to have been no court cases at all over the same period disputing the staking or boundaries of quartz claims. In the Northwest Territories, there have been a total of 6 appeals of claim boundary decisions in the past 5 years and one protest which has gone to the Minister in Ottawa over the same period. The protest is expected to end up in court in the near future.75 Total costs associated with a civil court case of this nature can easily reach the $30,000 to $40,000 range.76 Taken together, dispute costs have been roughly estimated at an average of $100,000 per year in the North.
Environmental Costs:
The historical right to enter onto lands conferred on miners by the free entry system and the rights to do largely as they pleased on their claims has resulted in the industry having a less than stellar environmental record. Of course, the process of mineral exploration must inevitably lead to some environmental disturbance. This cost must be accepted as part of the mining equation no matter what form of allocation system is used. However, the free entry system in Canada’s North does appear to impose higher environmental costs than those strictly necessary to locate and delineate mineral deposits. It does so in part by encouraging poorly financed speculative exploration efforts to be made. Most are legitimate efforts to locate minerals but some are little more than stock promotion scams. Because of the lack of financing and the sometimes transitory nature of the companies involved, these efforts result in the abandonment of exploration camps and sites, along with assorted garbage and contaminants. In the Yukon, DIAND has approximately 133 abandoned mineral exploration sites on their files, and has cleaned up 79 of them to date. The average cost of clean up is given at approximately $10,000 per site giving a total direct cost of $1.33 million. 77 It should be emphasized that these are the direct costs only. If the costs of identifying the sites and of any environmental costs caused by contaminants were to be included the totals would be much higher. Due to the difficulties in estimating the total environmental costs of mineral exploration, and the further difficulty in estimating what portion of those costs can be ascribed to the nature of the free entry system, environmental costs have been left out of the totals in Table VI. It must be emphasized however, that these costs are both real and important.
74 Wiebe, Dave. 1997. 75 Mazure, Jerry. 1997. 76 Radke, Mark. 1998. 77 Hartshorne, Bert. 1997.

28
THE BENEFITS OF FREE ENTRY
Proponents claim two general benefits of the free entry system of mineral allocation. Neither is easily quantified. The first is that the existing system gives the mineral industry the necessary level of confidence to operate in the North, and the second is that the system is required to maintain diversity in the industry, in particular to allow the independent prospector and the small junior companies continued existence.
Industry Confidence:
Representatives of the mining industry often assert that industry confidence is a delicate flower and in need of careful nurturing. Security of tenure is usually cited as the number one concern in choosing where to invest exploration dollars (behind promising geology of course), and any suggestion of modifying the allocation system quickly raises concerns about tenure. That concern almost inevitably precedes comment on how badly the government of B.C. damaged its mining industry by short circuiting established processes and expropriating the Windy Craggy deposit in 1993. Indeed, some make the claim that mining in B.C. is effectively finished, that exploration is in such a steep decline that, as existing deposits are exhausted, there will be none in the pipeline to replace them.78 Oddly enough, this strong and persistent perception is not supported by the actual pattern of exploration expenditures in B.C. since 1992. Table VIII below shows the mineral exploration expenditures in selected provinces and the territories from 1992 to 1997 both in dollar terms (in millions) and in percentage share of the Canadian total. Table VIII: Canadian Mineral Exploration Expenditures: 79 1992
1993
1994
1995
1996
1997(p)
$ % $ % $ % $ % $ % $ %
B.C. 71.6 18.6 66.0 13.8 85.0 13.5 79.4 11.1 104.9 11.7 96.8 12.0
Que. 94.1 24.4 106.1 22.2 130.3 20.7 123.3 17.2 137.2 15.3 140.3 17.4
Ont. 77.4 20.1 75.6 15.8 113.0 18.0 129.7 18.1 194.9 21.8 173.9 21.6
Nfld. 11.1 2.9 8.9 1.9 12.4 2.0 71.1 9.9 92.5 10.3 69.0 8.6
Man. 32.0 8.3 27.4 5.7 40.5 6.5 32.6 4.5 41.2 4.6 39.3 4.9
NWT 42.7 11.1 100.7 21.1 149.5 23.8 172.1 24.0 194.5 21.7 151.9 19.0
Y.T. 9.7 2.5 19.2 4.0 25.7 4.1 39.3 5.5 46.4 5.2 37.2 4.6
While it can be seen that B.C.’s share of total Canadian exploration did drop from a high of 18.6% in 1992 to 11.1% in 1995, it has since begun to climb and the 78 McFaul, Jim. 1997. 79 Natural Resources Canada. 1997.

29
province’s share is expected to be 13.8% in 1998. In dollar terms the rebound has been even more marked. Over the same five year period, the NWT’s share has nearly doubled, Newfoundland’s has increased almost three-fold, Quebec has followed a similar pattern as B.C. (though less marked), and Manitoba’s has been roughly halved. B.C. in no way stands out from the other jurisdictions as having destroyed its mineral industry. And Canada as a whole remains among the top three destinations in the world for mineral exploration investments. Mining industry confidence appears to be a hardier plant than industry people would like outsiders to believe. It is commonplace for mineral exploration to be carried out in countries which are subject to considerable political risk and wide-spread corruption. It is very difficult to believe that a somewhat altered mineral allocation system which continues to grant security of tenure would drive the industry out of the North.
Diversity in the Mineral Exploration Industry:
It appears to be intuitively obvious that a free entry system allows for, if it does not encourage a diverse range of companies in the mineral exploration industry. Low entry costs allow independent prospectors and small junior exploration companies to make a go of the exploration business notwithstanding that it is becoming increasingly dominated by the senior companies because of the growing sophistication and expense of exploration. If intuition is correct, then jurisdictions with free entry should be more attractive to junior mining companies than those with non-free entry. A statistical analysis of the ratio of senior to junior exploration expenditures in two non-free entry jurisdictions in Canada (Alberta and Nova Scotia) versus the ratio in the free entry jurisdictions (all the rest except PEI), shows this to be the case.80 Too much weight should not be placed on this analysis however, as the amount of exploration in Alberta and Nova Scotia is small in comparison with the rest of the country. For the senior companies having a free entry system is not a particularly important requirement, indeed it is not a requirement at all. Provided that there is no obvious threat to security of tenure (however acquired), the distinction between jurisdictions using free entry and those who do not is not a weighty issue to seniors compared with the geology of the area of interest. Kenecott Canada for example, would be equally ready to explore for diamonds in Alberta, the NWT, or in Greenland, provided the ground looked equally promising. 81 The senior companies have both
80 A T-test was performed on the senior/junior ratios of the two groups of jurisdictions over the period 1992-1997. (Data source: Natural Resources Canada. 1997. The result was t=0.25 with 12 degrees of freedom, leading to the rejection of the null hypothesis that the ratios were the same. 81 Finlayson, Eric. 1997.

30
the financial resources and the experience needed to operate under a large variety of regulatory regimes.
Size and Efficiency of Exploration:
Given that free entry allows and encourages small exploration outfits to operate, the question becomes whether this is an economically desirable state of affairs. It has already been argued above that small, poorly financed exploration companies can impose unnecessary environmental costs. It has also been argued elsewhere that free entry results in a mining industry version of the tragedy of the commons as every prospector will explore and stake as soon as he or she perceives the value of the claim to equal his or her outlay. The process is often repeated several times, sometimes over decades, before a deposit is eventually developed. This results in the dissipation of the economic rent of the resource as all of the expenditures plus the interest on them must be paid out (in theory at least) of the producing deposit.82 Historically the prospector and the smaller juniors have played a strong role in the exploration industry, discovering many deposits and generally adding value before deposits went to production. Is this still the case? And will it continue to be the case? A twenty year old analysis by P.A. Bailly on the optimum size of an exploration budget suggests that even by the 1970s, the large majority of economic mineral discoveries were made by medium to large (but not too large) sized exploration teams.83 The following table was adapted from the study. Table IX: Exploration Budgets and Economic Discoveries
A n n u a l E x p l o r a t i o n Budget (1974 dollars)
% of Economic Discoveries
% of Exploration Expenditures
> $5 million 15 44 $2-5 million 35 14 $1-2 million 40 13 < $1 million 10 29
Overall, the outlook for the independent prospector and the small junior mining company does not look bright in the long term no matter what form of mineral allocation is used. As discussed in the economics of exploration section, the decline of the mineral occurrence discovery rate means that many if not most of the readily detectable deposits have already been found and exploration becomes
82 Gaffney, Mason. 1977. pp. 17-18. 83 Bailly, P.A. 1977. Quoted in: Mackenzie, 1980.

31
increasingly costly. While the nimbleness and entrepreneurial spirit of the small operators will likely carry them on for a considerable time yet, it appears that in the long run their fate will be that of the small farmer on the prairies: a few will hang on but their time will be past.

32
POTENTIAL REFORMS OF THE FREE ENTRY SYSTEM
There are two areas in the current free entry system which can be reformed to both increase economic efficiency and so increase the available mineral rents without fundamentally altering the nature of the system: replacing field staking with paper staking, and altering the assessment work process.
Paper Staking:
To move from field to paper staking is an easy and obvious means of improving the efficiency of the mineral allocation process. The industry would save many millions of dollars in staking costs over the years and be able to put that money to more productive uses. Comparing the difference in costs to mining companies between the diamond rush in the NWT and the Voisey’s Bay rush in Labrador (where paper staking was used) is instructive. As calculated above, the diamond rush imposed estimated staking costs of $28.6 million for approximately 63.5 million acres from 1992-1995. If field staking had been used in Labrador and assuming the same $0.45 per acre staking costs, the companies involved would have spent approximately $6.8 million staking the 14.8 million acres acquired during the height of the rush from November 1994 to June 1995. The costs of conflicts over claim boundaries and disputes over whether correct staking procedure was followed would also be eliminated. Governments would reduce their costs as staking inspections would no longer be needed. Using the figures given in Table VI, the use of paper staking in the North in the early 1990s would have resulted in a reduction in rent dissipation of approximately $8.8 million per year. Of course, a change to paper staking would not result in universal joy. Field staking can be viewed as a tradeoff that governments make between future resource rents and current regional economic stimulation. Staking dollars currently end up in the pockets of local staking contractors and their employees, local helicopter pilots, and various other suppliers.
The Work Assessment Process:
The requirement that those wishing to hold a claim must do a certain amount of exploration related work on their claims or pay the equivalent sum as rent is an effort to: discourage holding large tracts of land for speculative purposes; encourage the development of mineral deposits into producing mines; and, as a side benefit, create some employment and economic activity in what is usually an economic

33
hinterland. All of these goals could be better served by expanding the list of eligible work, and raising the value of the work requirements. When the Yukon Quartz Mining Act was passed in 1924, the representation (or assessment) work requirement was set at $100.00 per claim or approximately $2.00 per acre.84 The current assessment work requirement in the Yukon is still $100.00 per claim while the NWT also has a current requirement of $2.00 per acre. Using the consumer price index as measured by Statistics Canada as a deflator, that $2.00 per acre in 1925 (the first year for which inflation figures are available) is equivalent to approximately $20.00 per acre today. (More specifically, $100.00 in 1925 would be worth $993.20 in 1997 dollars). If $2.00 an acre was considered sufficient in 1924 to meet the three goals outlined above, it appears obvious that one tenth of that amount (in real terms) is inadequate to meet them today. That the assessment work requirement is now lower than the optimum is shown by the degree to which companies which are seriously exploring their properties exceed the required minimums. For example, Viceroy Exploration, the owner of the Brewery Creek mine in the central Yukon, spent US$1.4m exploring their claims in 1997, far exceeding the required minimum of C$320,000.85 Another example is Cominco’s spending approximately $11m on the Kudz Ze Kayah property in the Yukon since discovering it in late 1993, again far more than the minimum required.86 Just what the minimum work requirement should be today in order to encourage the development of mineral properties without discouraging the necessary degree of initial exploration is open for debate. It may well be less than $20.00 per acre, but is certainly greater than the current $2.00 per acre. Given a rise (perhaps substantial) in the required assessment work, it would make sense to simultaneously revisit the list of types of work eligible to be claimed as assessment work. Adding such things as environmental baseline studies, environmental impact assessments, and other work required to bring a mine into production (including marketing studies) to the list would both recognize the importance of such work and also mitigate some of the financial impact felt by the industry. It should also be clearly recognized that any substantial increase in the minimum assessment work requirement would likely force out some of the smaller and less well financed of those currently exploring for minerals in the North.
84 Statutes of Canada, 1924. Chpt. 74 Sect. 54. 85 Diament, Rick. 1997. 86 Mineral Resources Branch, Yukon Department of Economic Development. 1997.

34
ALTERNATIVES TO THE FREE ENTRY SYSTEM
The Greenland Model:87
The system of mineral allocation used in Greenland offers a possible alternative to the current free entry system in Canada’s North. While not a cash bonus bid leasing system, it would readily lend itself to that means of allocation. Indeed the Greenland model might be viewed as an intermediate step between free entry and a cash bonus bid leasing system. The Greenland system consists of a three staged process for acquiring mineral title: the prospecting license, the exploration license, and the exploitation license. A summary of the system is given in Table X below. Table X: Greenland’s Mineral Allocation System: License type: Time period: Area covered: Fee: (DKK) Work obligations:
(DKK)
Prospecting Personal: 1 year. Corporate: 5 years.
Unlimited within one of three regions.
Personal: 100 Corporate: 3,000
None
Exploration 5 years, renewable for 5 years.
5 km2 minimum, no maximum.
25,000 for each 5 year term. 25,000/ year additional during second 5 year term.
Years 1-2: 100,000 /year plus 1,000/km2 Years 3-5: 200,000/year plus 5,000/km2 Years 6-10: 400,000/year plus 10,000/km2.
Exploitation 30 years. Approx. 5 km2 100,000 DKK None
Note: The exchange rate on February 2, 1998 was 1 DKK = C$0.22. Note: All fees and work obligations are linked to inflation via the Danish consumer price index. A prospecting license, which can be either individual or corporate, is valid for five years and grants permission to prospect on lands in one of the three regions of Greenland. The right to prospect is valid only on those lands not already covered by an exclusive exploration license. The prospecting license does not grant rights to any minerals found. Corporate prospecting licenses require that the company supply information on its technical and financial capabilities (including annual reports) and the government reserves the right to refuse any applicant. The 3,000 DKK fee is due on application and is non-refundable even if the application is refused. There are no exploration obligations attached to a prospecting license. 87 All information in this section is from: Mineral Resources Administration for Greenland, 1996, unless otherwise noted.

35
An exploration license grants a five year exclusive right to explore a minimum defined area of 5 km2 (there is no maximum area). The license is renewable for a further five years, and, under exceptional circumstances may be extended to a total of 16 years. As with the prospecting license, the company’s financial and technical capabilities are examined as is its track record in Greenland (this can include its success in hiring and training local labour). And again the government retains the right to refuse any applicant. In addition to the 25,000 DKK fee levied on granting of a license, there is a non-refundable 5,000 DKK application fee. There is a sliding scale of assessment work obligations based on flat fee plus area rate. Work obligations may be met in part with either environmental or feasibility studies. The exploration license does not in itself grant title to any minerals found, but provided the licensee has met the stipulated obligations of the license, he is entitled to be granted an exploitation license for any minerals found. An exploitation license is for a 30 year term and will be granted if the holder intends to exploit the deposit. The applicant must have an ore body delineated, a bankable feasibility study, an environmental assessment report, and a closure plan in place before the license is granted. The area covered by the license will be the delineated ore body plus one kilometre in every direction, but may be extended on evidence of ore bodies extending beyond the area. The scale of work obligations was designed to increase sharply toward the end of the exploration license period in order to encourage companies to focus their exploration onto a smaller area relatively rapidly and so free up areas for new companies to move in, perhaps with fresh geological theories. Greenland’s experience over the past five years indicates that this indeed is happening as areas let go by some companies have been taken up by others.88 (The holder of an exploration license may reduce its size at the end of each year in the license period.) Although Greenland’s system might seem very restrictive to those in the industry accustomed to the free entry system, this approach was instituted in 1991 in order to make Greenland more attractive to mining investment. In particular, the 1991 revision of Greenland’s mining laws eliminated the right that government held to become a partner in any mining venture, a right which could be exercised at any point within two years of the granting of an exploration license, and allowed the government to acquire up to 50% of any project. In addition, the old laws gave no fixed terms for the granting of exploitation licenses. These terms would be negotiated on a case by case basis when an exploitation license was applied for.89 Under the new laws, there has been no lack of industry interest in the country, particularly with the interest generated by a geology similar to both Voisey’s Bay in
88 Mineral Resources Administration for Greenland, 1997. p. 37. 89 Mineral Resources Administration for Greenland, 1990. pp. 26-29.

36
Labrador, and the Lac de Gras area in the NWT. This interest is illustrated in Table XI below. Table XI: Mineral Exploration in Greenland, 1992-1997.90 Year end.
1992 1993 1994 1995 1996 1997 (April)
Prospecting licenses 12 15 17 21 22 22 Exploration licenses 22 23 25 35 60 70 Area under license(km2)
10, 029 10,790 8,788 23,127 60,525 75,810
Exploration expenditures (DKK)
27.1m 47.6m 46.4m 69.5m 66.6m -
Metres drilled. 0 6,679 12,733 17,134 8,538 -
A system similar to Greenland’s would not be an entirely foreign concept if adopted for the Canadian North given that the prospecting permits issued in the NWT are similar to Greenland’s exploration licenses. The advantages of screening prospective miners, the elimination of the need to field stake, and a steeply rising scale of assessment work discouraging the holding of large blocks of land for speculative purposes would certainly decrease the dissipation of rent as it occurs under the current free entry system.
A Possible Long Term Mineral Rent Collection System for the North:
The current means of collecting mineral rents as they are now applied in the Canadian North are woefully inadequate. Even those mineral rents that remain after the dissipation which occurs during exploration and start up of projects tend not to be collected due to the inadequate nature of the royalty system or the conscious decisions by governments to trade off those remaining rents for the often elusive goal of regional economic development. Although a cash bonus bidding system of rent collection could be near perfect in theory, in practice it does not yet appear to be feasible. It would prove interesting, however, to experiment with such a system by putting up for bid the prospecting permits which are currently given away to the first applicant in the NWT on an annual basis. This would determine very quickly whether there would be any willingness at all in the mineral industry to bid for exploration rights. A more immediately practical change to the rent collection regime is its conversion to a resource rent tax. As discussed in the “Options for rent collection” section above, the RRT collects the maximum possible available rent with minimal distortion
90 Mineral Resources Administration for Greenland, 1997. p. 36.

37
of investment decisions. The existing royalty regime could be converted to an RRT with the following changes: 1. corporate taxes (paid within the jurisdiction) should be allowed as a deduction. 2. all extraction capital costs should be allowed as deductions. 3. the depreciation of extraction capital should not be allowed. 4. unrecovered capital costs should be carried forward at a rate of interest
corresponding to the industry’s required rate of return on capital.91
91 Adapted from: Anderson, F.J. 1985. p. 168.

38
CONCLUSIONS
The free entry system as it is currently practiced in the Canadian North is far from ideal from the perspective of long-term sustainability. It is rife with economic inefficiencies and it hinders the collection of mineral rents. If the commitment by governments to the principles of sustainability are to be taken seriously, these inefficiencies should be corrected, and far more of the mineral rents must be collected.
Reform of the free entry system is one option to achieve the goals of greater economic efficiency and greater rent collection. The current system was designed to encourage the greatest possible level of exploration and acquisition of mineral title by the greatest possible number of miners with little regard for efficiency, rent collection, or other land uses. As argued above, even simply moving from field to paper staking would result in a considerable gain in efficiency. Modifying the assessment work process by: increasing the requirement, linking it to inflation, and making new forms of work eligible in order to discourage the speculative holding of mineral title would also result in efficiency gains. And finally, the rent collection mechanism could be converted to a resource rent tax.
If it were determined that the free entry system should be replaced, the Greenland model would bear careful examination as a possible alternative. It has most of the features which this paper has argued increase the efficiency of the mineral allocation process. If adopted, it would also potentially lend itself to modification so as to allow a cash bonus bidding system if it were ever determined that there was sufficient geological knowledge to allow the system to function efficiently. Areas open to mineral exploration could be auctioned off in blocks just as the prospecting permits are currently given away to the first applicant in the NWT. But as with the reform option, the best current practical choice of rent collection mechanism would be a resource rent tax. In the long run, mineral exploration is driven by the expected value of that exploration. In the shorter term, exploration expenditures vary wildly in response to new discoveries, metal prices, investor confidence, changes to the tax structure, and other factors. The North has seen great surges in mineral exploration— and deep slumps — over decades. Whether the current free entry system is left unchanged, is reformed, or is replaced, there will continue to be wild gyrations in exploration. Provided mineral tenure, however acquired, is secure, mineral exploration and development will continue in the North.

39
REFERENCES
Abbot, Grant. 1982. “Mineral Exploration in Yukon and Western District of
Mackenzie: Deposit Discovery Rate and Exploration Potential”. In: Yukon: Exploration and Geology, 1981. Indian and Northern Affairs Canada: Ottawa.
Abbot, Grant. Department of Economic Development, Government of the Yukon.
Personal communication. January 23, 1998. Abercrombie, Shirley. Department of Economic Development, Government of the
Yukon. Personal communication. February 4, 1998. Anderson, F.J. 1985. Natural Resources in Canada: Economic Theory and Policy.
Methuen Publications: Agincourt, Ontario. Andrews, Kenneth. Department of Natural Resources, Government of
Newfoundland. Personal communication. January 15, 1998. Bailly, P.A. April 1977. “Changing Rates of Success in Metallic Exploration.”
Paper presented at Geological Association of Canada meeting. Quoted in: Mackenzie, Brian. 1980.
Barton, Barry. 1993. Canadian Law of Mining. Canadian Institute of Resources
Law, University of Calgary: Calgary. Barton, Barry. 1997. “The Future of the Free Entry System for Mining in Canada’s
North” in: Disposition of Natural Resources: Options and Issues for Northern Lands. M.M. Ross and J.O. Saunders eds. Canadian Institute of Resources Law, University of Calgary: Calgary.
Camlucci, Doug. Mineral Resources Directorate, Department of Indian Affairs and
Northern Development, Government of Canada. Personal communication. February 16, 1998.
Consolidated Regulations of Canada, 1978. Queen’s Printer: Ottawa. Costanza, Robert, Herman E. Daly, and Joy A. Bartholomew. 1991. “Goals,
agenda, and policy recommendations for ecological economics.” In: Ecological Economics: The Science and Management of Sustainability. Robert Costanza ed. Columbia University Press: New York.

40
Davidson, Graham and Denis Jacob. Staking contractors, Whitehorse. Personal communication. November 10, 1997.
Department of Indian Affairs and Northern Development, Government of Canada.
1 9 9 6 . Discussion Paper: Proposed Amendments to the Northwest Territories Mining Royalty Regime in the Canada Mining Regulations. Ottawa.
Department of Indian Affairs and Northern Development, Government of Canada.
1997a. Towards Sustainable Development: Volume I: A Strategy for the Department of Indian Affairs and Northern Development. Minister of Public Works and Government Services: Ottawa.
Department of Indian Affairs and Northern Development, Government of Canada.
1997b. Discussion Paper on the Administrative Review of the Canada Mining Regulations. Ottawa.
Diament, Rick. Viceroy Explorations. Personal communication. December 4,
1997. Finlayson, Eric. Kennecott Canada. Personal communication. November 28,
1997. Gaffney, Mason. 1977. “Objectives of Government Policy in Leasing Mineral
Lands” in: Mineral Leasing as an Instrument of Public Policy. M. Crommelin and A.R. Thompson eds. University of British Columbia Press: Vancouver.
Garnaut, Ross and Anthony Clunies Ross. 1983. Taxation of Mineral Rents.
Clarion Press: Oxford. Graham & Associates. January 1996. A Review of the Yukon Mining Incentive
Program. Report prepared for the Department of Economic Development, Government of the Yukon.
Hartshorne, Bret. DIAND Contaminants Division, Whitehorse. Personal
communication. December 15, 1997. Hartwick, John M. 1977. “Intergenerational Equity and the Investing of Rents from
Exhaustible Resources.” The American Economic Review. Vol. 67, pp. 972-974.
Hartwick, John M. 1978. “Substitution Among Exhaustible Resources and
Intergenerational Equity.” Review of Economic Studies. Vol. 45, pp. 347-354.

41
Jones, Adrian. Department of Resources, Wildlife, and Economic Development, Government of the Northwest Territories, Yellowknife. Personal communication. February 4, 1998.
Kischuck, Paul. Department of Finance, Government of the Yukon, Whitehorse.
Personal communication. August 26, 1998. Laughlin, W.H. 1980. Non-Fuel Mineral Exploration in Canada to 1985.
Department of Energy, Mines and Resources: Ottawa. Mineral Policy Sector Internal Report MRI 80/21.
Lemieux, Andre, Lo-Sun Jen, and W.H. Laughlin. 1986. Canadian Mines:
Perspective from 1985. Reserves, Production Capability, Exploration, Development. Energy, Mines and Resources Canada: Ottawa. Mineral Bulletin MR 211.
Mackenzie, Brian W. 1980. Looking for the Improbable Needle in a Haystack: The
Economics of Base Metal Exploration in Canada. Queen’s University: Kingston, Ontario. Centre for Resource Studies Working Paper No. 19.
Mackenzie, Brian W., M.L. Bilodeau and Leo J. Verleun. 1984. Base Metal
Potential North of 60: Economic Viability, Endowment Quality, Competitive Position. Centre for Resource Studies, Queen’s University: Kingston, Ontario.
Mazure, Jerry. DIAND Mining Clerk, Mining Recorder’s Office, Yellowknife.
Personal communication. December 4, 1997. McFaul, Jim. Past President, Yukon Chamber of Mines. Personal communication.
November 15, 1997. McLean, Malcolm and Vic Waugh. Staking contractors, Yellowknife. Personal
communication. November 18, 1997. Mineral Resources Administration for Greenland. May 1990. Report from the
Strategy Group for Mineral Resources in Greenland. MRA: Copenhagen. Unofficial translation.
Mineral Resources Administration for Greenland. January 1996. Application
Procedures and Standard Terms for Exploration and Prospecting Licenses for Minerals in Greenland. MRA: Copenhagen. Unofficial Translation.
Mineral Resources Administration for Greenland. June 1997. 1996 Annual Report
from the Joint Committee on Mineral Resources in Greenland. MRA: Copenhagen.

42
Mineral Resources Branch, Department of Economic Development. October 24,
1 9 9 7 . Yukon Mineral Property Update. Government of the Yukon: Whitehorse.
Mineral Resources Division. 1995. Significant Mineral Deposits of the Northwest
Territories. Government of the Northwest Territories: Yellowknife. Mining Recorder. Recorder Notices of Hearing File. Mining Recorder’s Office,
Whitehorse, Yukon. Natural Resources Canada, Minerals and Mining Statistics Division. June 17,
1998. Internet address: www.nrcan.gc.ca Northwest Territories Bureau of Statistics. 1998. Internet address:
www.stats.gov.nt.ca Nutter, Dave. Director, Mineral Resources DIAND, Yellowknife. Personal
communication. January 27, 1998. Pearce, David W., Annil Markandyna and Edward B. Barbier. 1989. Blueprint for a
Green Economy. Earthscan Publications Ltd.; London. Prospectors and Developers Association of Canada. January 1996. A Guide to
Regulatory Requirements and Procedures for Exploration, Development and Mining in Canada: Northwest Territories. Prospectors and Developers Association of Canada; Toronto.
Radke, Mark. Barrister and solicitor, Whitehorse. Personal communication.
February 2, 1998. Revised Statutes of Canada, 1985. Queen’s Printer: Ottawa. Robinson, J.G., G. Francis, R. Legge, and S. Lerner. 1990. "Defining a
Sustainable Society: Values, Principles, and Definitions." Alternatives 17(2) pp. 36-46.
Sage, Beth. DIAND Geological Data Base Manager, Yellowknife. Personal
Communication. January 13, 1998. Serageldin, Ismail. 1996. Sustainability and the Wealth of Nations: First Steps in
an Ongoing Journey. Environmentally Sustainable Development Studies and Monographs Series No. 5. World Bank; Washington.
Sinclair, W.D. J.M. Richardson, A.E. Heagy and D.F. Garson. 1994. Mineral
Deposits of Canada: Preliminary Map and Deposit List. Natural Resources Canada: Ottawa.

43
Solow, Robert M. 1974. “Intergenerational Equity and Exhaustible Resources.”
Review of Economic Studies (Symposium). pp. 29-46. Solow, Robert M. 1986. “On the Intergenerational Allocation of Natural Resources.”
Scandinavian Journal of Economics Vol. 88(1), pp. 141-149. Statistics Canada. 1995. Catalogue No. 15F0046 XDB. Statutes of Canada, 1924. Queen’s Printer: Ottawa. Statutes of Canada, 1928. Queen’s Printer: Ottawa. Van Kalsbeek, Leo. DIAND Mining Claims Inspector, Whitehorse. Personal
communication. December 7, 1997. Van Kooten, G. Corneilius. 1993. Land Resource Economics and Sustainable
Development: Economic Policies and the Common Good. UBC Press: Vancouver.
World Commission on Environment and Development. 1987. Our Common Future:
Report of the World Commission on Environment and Development. Oxford University Press; London.
Wiebe, Dave. Mineral Rights Division, DIAND, Whitehorse. Personal
communication. November 24, 1997. Young, M.D. 1992. Sustainable Investment and Resource Use: Equity,
Environmental Integrity and Economic Efficiency. United Nations Educational, Scientific and Cultural Organization: Paris.
Yukon Bureau of Statistics. 1998. Internet address:
www.yukonweb.com/government/ybs