THE HISTORICAL BASIS RECORD FOR GRAIN AND …ageconsearch.umn.edu/bitstream/15810/1/er030001.pdf ·...
90
THE HISTORICAL BASIS RECORD FOR GRAIN AND SOYBEANS IN DELAWARE; MARKETING YEARS 1998/99 TO 2002/03 Amanda Tuttle 1 Carl L. German 2 U.C. Toensmeyer 3 November 7, 2003 ER03-01 1 Research Assistant, Summer 2003 2 Extension Marketing Specialist, University of Delaware, Newark, Delaware. 3 Professor, Agriculture Marketing, Department of Food and Resource Economics, University of Delaware, Newark, Delaware.
-
Upload
vuongxuyen -
Category
Documents
-
view
223 -
download
0
Transcript of THE HISTORICAL BASIS RECORD FOR GRAIN AND …ageconsearch.umn.edu/bitstream/15810/1/er030001.pdf ·...

THE HISTORICAL BASIS RECORD FOR GRAIN AND SOYBEANS
IN DELAWARE; MARKETING YEARS 1998/99 TO 2002/03
Amanda Tuttle1 Carl L. German2
U.C. Toensmeyer3
November 7, 2003 ER03-01
1Research Assistant, Summer 2003 2 Extension Marketing Specialist, University of Delaware, Newark, Delaware. 3 Professor, Agriculture Marketing, Department of Food and Resource Economics, University of
Delaware, Newark, Delaware.

Acknowledgments
The authors express their appreciation to the Delaware Soybean Board for providing partial funding for this project. We also would like to recognize the Agriculture Statistics Service in Annapolis, Maryland for contributing the data used in the project.
i

Prelude
Historical basis records for given geographical locations should be updated periodically. The historical basis record for the most recent three to five year period is necessary to effect grain marketing decisions. This publication updates the historical basis record for corn, soybeans, and wheat for the 1998/99 to 2002/03 Marketing Years. Five-year average basis table summaries for Northern and Southern Eastern Shore Corn can be found on pages 17 and 23. Corresponding graphical illustrations are given on pages 54 and 60. Five-year average basis table summaries for Northern and Southern Eastern Shore Soybeans can be found on pages 29 and 35. Corresponding graphical illustrations are given on pages 66 and 72. Five-year average basis table summaries for Northern and Southern Eastern Shore Wheat can be found on pages 41 and 47. Corresponding graphical illustrations are given on pages 78 and 84.
ii

Table of Contents
Page
Acknowledgements i. Prelude ii.
I. Introduction 1
II. Objectives 1
III. Procedure 2
IV. How to Use the Basis Tables; An Example 2
V. Analysis of The Northern and Southern Eastern Shore Basis for Corn, Soybeans,
And Wheat for Selected Marketing Years 3
VI. Summary and Conclusions 8
VII. Selected References 10 VIII. Appendix A: Basis Tables 11
IX. Appendix B: Basis Figures 48

I. Introduction
Basis is a key component of all grain marketing and sales decisions. It is the
difference between the cash (spot) price and a futures market price at the time and place
where delivery is to take place. In the case of grains, the futures price generally refers
to the price quoted for a specified delivery month for a commodity at the Chicago
Board of Trade. Familiarity with the basis usually lies within a description of the term
and a method for tracking or recording it for various locations. Basis is used in the
grain marketing industry as a guide in making marketing decisions.
Basis is important to grain and soybean farmers in that it affects and is involved in
every grain sale and purchase decision. Recent estimates suggest that the value of the
movement in the basis in Delaware is anywhere between $3.6 to $10.8 million,
annually. The historical basis record is necessary to assist Delaware farmers in
profitably marketing grain and soybeans in order to capture as much of the basis value
as possible. The purpose of this publication is to provide information by on the
historical basis record for the five most recent marketing years (1998/99 to 2002/03).
II. Objectives:
• To update historical corn, soybean, and wheat basis records for the
Northern and Southern Eastern Shore.
• To develop basis tables for the 1998/99 to 2002/03 marketing years.
• To graphically illustrate and analyze the change in basis, for the 1998/99
to 2002/03 marketing years.
1

III. Procedure
Cash and futures prices were obtained from the Maryland Grain & Livestock Report
for the Marketing Years 2001/02 and 2002/03. Basis tables were utilized for the
Marketing Years 1998/99, 1999/00 and 2000/01 from a previous report published in May
2002. (German, Towle, 2002). Basis analysis, tables and graphs were completed utilizing
Microsoft Excel.
IV. How to Use the Basis Tables; An Example
1. Select the appropriate table for the commodity and year in question (Table A-6:
Northern Eastern Shore Average Corn Basis; Marketing Years 1998/99-2002/03).
2. Choose the futures contact month (across the top) in which you wish to hedge,
forward contract, or make the cash (spot) sale; for example, December futures.
3. Choose the month (left margin) in which the hedge, forward contract or spot
sale is to be made; for example, December.
4. The figure corresponding to the contract month and calendar month will be the
correct historical basis to use in effecting the grain marketing decision being
considered; for example, the basis for December Corn futures and the December
calendar month for the 1998/99-2002-03 Marketing Years is $.14/ bushel (14 over
the Dec).
5. The tables can be used as a guide in calculating returns to both the storage and
production hedge. Technical assistance in using the tables can be obtained by
contacting Carl German, Extension Specialist, Marketing, University of Delaware
[email protected] or 302-831-1317.
Note: Five-year average basis table summaries for Northern and Southern Eastern Shore Corn can be found on pages 17 and 23. Corresponding graphical illustrations are given on pages 54 and 60.
2

Five-year average basis table summaries for Northern and Southern Eastern Shore Soybeans can be found on pages 29 and 35. Corresponding graphical illustrations are given of pages 66 and 72. Five-year average basis table summaries for Northern and Southern Eastern Shore Wheat can be found on pages 41 and 47. Corresponding graphical illustrations are given on pages 78 and 84.
V. Analysis of The Northern and Southern Eastern Shore Basis for Corn,
Soybeans, and Wheat; Selected Marketing Years
Northern Eastern Shore Corn Basis
• The Northern Eastern Shore average corn basis for the Marketing Years
1998/99 to 2002/03 was 14 cents over the Dec future (ranging from 25
cents under to 39 cents over) (Table A-6).
• The strongest basis offerings occurred in the 2002/03 Marketing Year at
39 cents over December (Table A-5).
• The weakest basis offerings occurred in the 2000/01 Marketing Year at 25
under Dec (Table A-3).
Observations: The average corn basis offering for the Northern Eastern Shore
improved 64 cents per bushel (from -25 cents to +39 cents) for December
futures from the 2000/01 Marketing Year to the 2002/03 Marketing Year.
With the addition of the marketing years 2001/02 and 2002/03, to the
previous report, and the subtraction of the marketing years 1996/97 and
1997/98, the overall averages did not change significantly. When comparing
Table A-6 to Table A-6 of the previous report, 18 of the averages were
stronger, while 16 were weaker (German, Towle, 2002), showing a very slight
strengthening in the corn basis. Both marketing years (2001/02 and 2002/03)
had an overall stronger basis (Table A-4 and A-5) for every contract than the
3

average basis in the previous report, Marketing Years 1996/97-2000/01 (Table
A-6 of the previous report).
Southern Eastern Shore Corn Basis
• The Southern Eastern Shore average corn basis for the Marketing Years
1998/99 to 2002/03 was 26 cents over the Dec (ranging from 0 (even) to
48 over) (Table A-12).
• The strongest basis offering for the Southern Eastern Shore occurred in the
2002/03 Marketing Year, at 48 cents over the Dec (Table A-11).
• The weakest basis offering for the Southern Eastern Shore occurred in the
2000/01 Marketing Year, at 0 (even) Dec. (Table A-9).
Observation: The average basis offering for the Southern Eastern Shore
2002/03 Marketing Year, increased 48 cents per bushel from the 2000/01
Marketing Year (from 0 to +48 cents). This represents a 22-cent improvement
in the average basis from the 5-year average of 26 cents (Table A-12).
Table A-12 shows an overall strengthening in basis, from Table A-12 of
the previous report (German, Towle, 2002). The Marketing Year 2001/02 for
Southern Eastern Shore Corn (Table A-10) had an overall lower basis for all
contracts when compared to the average basis for the same contracts in the
Marketing Years 1996/97 through 2000/01 (Table A-12 from the previous
report). The corn basis for every contract in 2002/03 (Table-13) was higher
than the average basis for the contracts in the Marketing Years 1996/97
through 2000/01.
4

Northern Eastern Shore Soybean Basis
• The Northern Eastern Shore average soybean basis for the Marketing
Years 1998/99 to 2002/03 was 25 cents under the November (ranging
from 44 under to 8 under) (Table A-18).
• The strongest basis offering for Northern Eastern Shore soybeans occurred
in the 1999/00 Marketing Year at 8 cents under the Nov (Table A-14).
• The weakest basis offering for Northern Eastern Shore soybeans occurred
in the 2000/01 marketing year at 44 under the Nov (Table A-15).
Observations: There was a 36 cent per bushel weakening in the average basis
offering for Nov soybeans from the 1999/00 Marketing Year to the 2000/01
Marketing Year, representing a 19 cent decline from the 5-year Average.
Table A-18 shows an overall decline in basis, from the previous
report’s Table A-18 (German, Towle, 2002). The Marketing Year 2001/02 for
Northern Eastern Shore Soybeans (Table A-16) had weaker basis offerings for
all contracts when compared to the average basis for the same contracts in the
Marketing Years 1996/97 through 2000/01 (Table A-18 from the previous
report). The average soybean basis for every contract in 2002/03 (Table A-17)
was stronger than the average basis for the contracts in the Marketing Years
1996/97 through 2000/01.
Southern Eastern Shore Soybean Basis
5
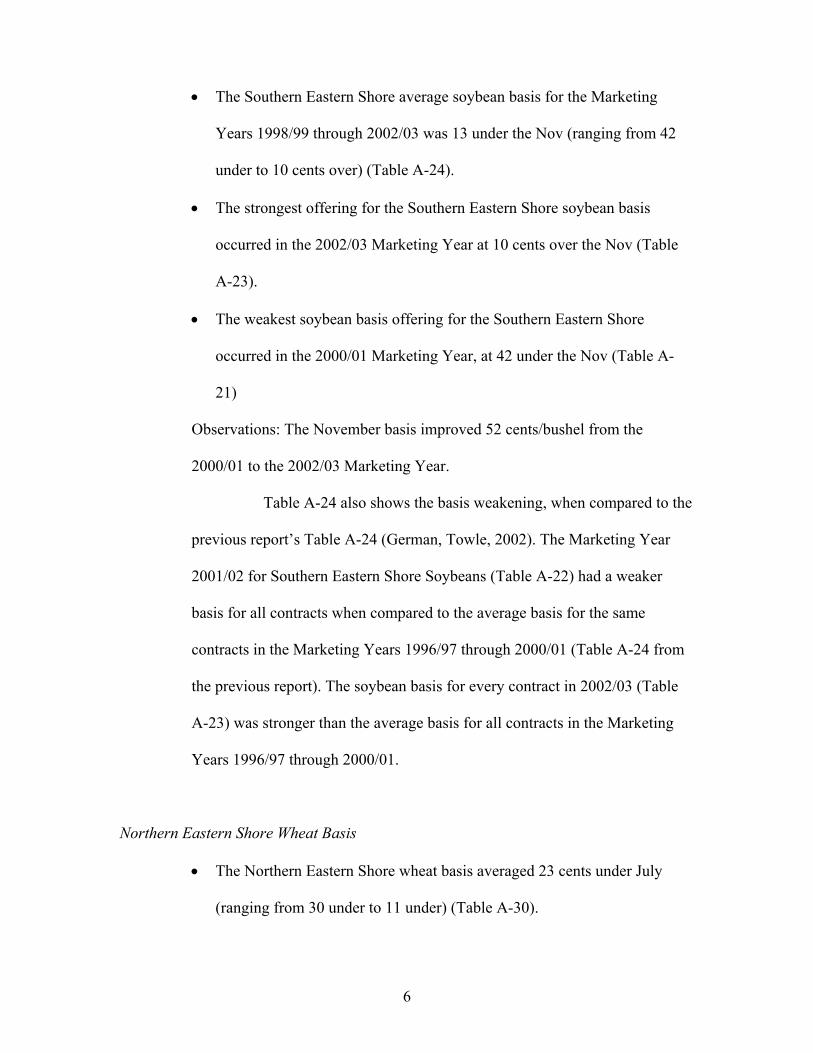
• The Southern Eastern Shore average soybean basis for the Marketing
Years 1998/99 through 2002/03 was 13 under the Nov (ranging from 42
under to 10 cents over) (Table A-24).
• The strongest offering for the Southern Eastern Shore soybean basis
occurred in the 2002/03 Marketing Year at 10 cents over the Nov (Table
A-23).
• The weakest soybean basis offering for the Southern Eastern Shore
occurred in the 2000/01 Marketing Year, at 42 under the Nov (Table A-
21)
Observations: The November basis improved 52 cents/bushel from the
2000/01 to the 2002/03 Marketing Year.
Table A-24 also shows the basis weakening, when compared to the
previous report’s Table A-24 (German, Towle, 2002). The Marketing Year
2001/02 for Southern Eastern Shore Soybeans (Table A-22) had a weaker
basis for all contracts when compared to the average basis for the same
contracts in the Marketing Years 1996/97 through 2000/01 (Table A-24 from
the previous report). The soybean basis for every contract in 2002/03 (Table
A-23) was stronger than the average basis for all contracts in the Marketing
Years 1996/97 through 2000/01.
Northern Eastern Shore Wheat Basis
• The Northern Eastern Shore wheat basis averaged 23 cents under July
(ranging from 30 under to 11 under) (Table A-30).
6

• The strongest basis offering for wheat was 11 cents under July, during the
2000/01 Marketing Year (Table A-27).
• The weakest basis offering occurred during the Marketing Year of
1998/99, at 30 cents under July (Table A-25).
Observations: The average Northern Eastern Shore wheat basis improved
from the Marketing Year 1998/99 to 2000/01, by 19 cents per bushel.
Table A-30 shows a weaker overall basis than the previous report’s Table
A-30 (German, Towle, 2002). The Marketing Year 2001/02 for Northern
Eastern Shore Wheat (Table A-28) had weaker basis offerings for the March
and May futures contract months when compared to the average basis for the
same contracts in the Marketing Years 1996/97 through 2000/01 (Table A-30
from the previous report). The basis for the futures contract months of July,
September, and December were stronger when compared to Table A-30. The
wheat basis for the March futures contract month in 2002/03 (Table A-29)
was stronger overall than the average basis for the March futures contract in
the Marketing Years 1996/97 through 2000/01. The average basis for the July,
September, December, and May contracts was stronger than the average basis
for these contracts in the Marketing Years 1996/97 through 2000/01 (Table A-
30 in previous report).
Southern Eastern Shore Wheat Basis
• The Southern Eastern Shore wheat basis averaged 25 under the July for
the Marketing Years 1998/99 through 2002/03 (-30 to -20) (Table A-36).
7

• The strongest basis offering was 20 under the July during the Marketing
Year of 1998/99 (Table A-31).
Observations: The basis improved 10 cents per bushel for July futures,
between 1998/99 and 2002/03.
In Table A-36, the overall average basis is weaker than the previous
report’s Table A-36 (German, Towle, 2002). The Marketing Year 2001/02 for
Southern Eastern Shore Wheat (Table A-34) had weaker average basis
offerings for the July, September, and December futures contract months. The
March contract’s basis was weaker overall, while the May contract had six
calendar monthly averages that were stronger than those in the Marketing
Years 1996/97 through 2000/01, and 5 monthly averages that were weaker
(Table A-36 from the previous report). The soybean basis for every contract
month in 2002/03 (Table A-35) was stronger than the average basis for the
contracts in the Marketing Years 1996/97 through 2000/01.
VI. Summary and Conclusions
Conclusions for the Historical Corn Basis
With the addition of the 2001/02 and 2002/03 marketing years, the five-
year corn basis average strengthened for both the Northern and Southern
Eastern Shore, from the previous five-year average. The marketing years
2001/02 and 2002/03 basis showed an improvement from the previous
report’s five-year average for the Northern and Southern Eastern Shore.
8

Conclusions for the Historical Soybean Basis
With the addition of the two most recent marketing years, the five-year
soybean basis average weakened for both the Northern and Southern Eastern
Shore. The marketing year 2001/02 recorded weaker basis averages than the
five-year averages of the previous report. The marketing year 2002/03 had
stronger basis averages than the previous 5-year average.
Conclusions for the Historical Wheat Basis
By adding the marketing years 2001/02 and 2002/03, to the 5-year moving
averages for the historical wheat basis, the new 5-year averages were weaker
than the previous, for both the Northern and Southern Eastern Shore.
Basis in Summary
Basis is simply the price difference between the local cash price of grain
and the nearby futures price. Anyone in the grain trade, buying or selling, has
two basic factors that ultimately determine the final sale or purchase price of a
commodity; the futures price and the basis. The futures price is a market
projection of how current world fundamentals will affect the supply and
demand for a commodity in the near and distant future. It's the price agri-
businesses use as a benchmark to gauge cash bids and offers for commodities
at the local level. All grain sales and purchase decisions involve the basis.
Profits can be improved considerably when marketing grain by learning to
use basis as a key indicator in all grain sales decisions.
9

VI. Selected References
German, Carl L., Towle, Philip L., Toensmeyer, Ulrich C., ER02-02, The Historical Basis Record for Grain and Soybeans in Delaware: Marketing Years 1996/97 to 2000/01, May 31, 2002.
German, Carl L., “Grain Marketing Highlights,” Weekly Crop Update, Volume 11,
Issues 1 to 15, March-June 2003
German, Carl L., “Grain Marketing Highlights”, Weekly Crop Update, Volume 10, Issues 1 to 24, March – September 2002.
German, Towle, Philip L., German, Carl L., Toensmeyer, U.C., The Historical
Basis Record for Grain and Soybeans in Delaware; Marketing Years 1996/97 to 2000/01, May 31, 2002.
German, Carl L., “Basis: The Economics of Where and When”, The Delmarva
Farmer, Volume 26, No. 41, December 2001.
German, Carl L., “Basis: The Economics of Where and When”, Grain Marketing Discussion Group on the Internet, Volume III, Issue No. 6, December 2001.
German, Carl L., Toensmeyer, U.C., “An Analysis of Crop Production and
Marketing for Delaware Grain and Soybeans; 1978-1998”, Delaware 2020 Project, November 1999.
German, Carl L., “Grain Marketing Highlights”, Basis: A Key Indicator to All
Grain Marketing Decisions, Weekly Crop Update, Volume 6, Issue 2, April 1998.
Risser, E.C., Toensmeyer, U.C., German, C.L. et al., “An Analysis of Hedging as a
Soybean Marketing Alternative”, Senior Thesis, Department of Food & Resource Economics, February 1996.
German, C.L., Toensmeyer, U.C., et al., “Historical Analysis of Upper Eastern
Shore Soybean Forward Cash Pricing Opportunities; 1973-1993”, Cooperative Bulletin #51, College of Agriculture Sciences, Newark, DE, June 1994.
10

VIII.
Appendix A: Basis Tables
11

Table A-1: Northern Eastern Shore Corn Basis; Marketing Year 1998-1999
Month September December March-99 May-99 July-99dollars/bu
August 0.14 0.05 -0.08 -0.15 -0.21(.08 to .18) (-.01 to .08) (-.12 to -.05) (-.20 to -.12) (-.25 to -.18)
September 0.20 0.09 -0.04 -0.11 -0.18(.20 to .21) (.08 to .09) (-.04 to -.04) (-.12 to -.11) (-.19 to -.17)
October 0.08 -0.03 -0.10 -0.14(.08 to .08) (-.03 to -.03) (-.10 to -.10) (-.14 to -.14)
November 0.11 -0.01 -0.08 -0.14(.09 to .14) (-.04 to .03) (-.11 to -.05) (-.18 to -.11)
December 0.21 0.13 0.06 -0.01(.21 to .21) (.12 to .14) (.05 to .07) (-.01 to 0)
January 0.23 0.17 0.12(.22 to .24) (.16 to .18) (.10 to .13)
February 0.26 0.20 0.15(.26 to .27) (.20 to .21) (.15 to .16)
March 0.29 0.26 0.20(.29 to .29) (.24 to .27) (.18 to .21)
April 0.22 0.13(.21 to .23) (.07 to .17)
May 0.18 0.14(.17 to .19) (.14 to .14)
June 0.16(.16 to .17)
July 0.23(.22 to .23)
Source: University of Delaware Basis = Cash - Futures
Futures Contract
12

Table A-2: Northern Eastern Shore Corn Basis; Marketing Year 1999-2000
Month September December March-00 May-00 July-00dollars/bu
August 0.18 0.05 -0.05 -0.10 -0.14(.13 to .19) (.02 to .06) (-.08 to -.04) (-.12 to -.09) (-.16 to -.12)
September 0.33 0.18 0.06 0 -0.04(.31 to .35) (.10 to .22) (-.01 to .11) (-.07 to .06) (-.12 to .02)
October 0.15 0.04 -0.02 -0.08(.13 to .17) (.03 to .05) (-.04 to -.01) (-.10 to -.07)
November 0.24 0.13 0.06 -0.01(.21 to .26) (.10 to .15) (.03 to .08) (-.04 to .02)
December 0.29 0.15 0.08 0.01(.28 to .30) (.04 to .20) (-.02 to .13) (-.08 to .06)
January 0.21 0.13 0.06(.13 to .26) (.05 to .18) (-.02 to .10)
February 0.28 0.20 0.12(.23 to .34) (.15 to .26) (.07 to .18)
March 0.26 0.18 0.10(.26 to.26) (.12 to .24) (.04 to .16)
April 0.17 0.08(.07 to .26) (-.02 to .17)
May 0.30 0.22(.30 to .30) (.16 to .25)
June 0.25(.16 to .32)
July 0.22(.14 to .29)
Source: University of Delaware Basis = Cash - Futures
Futures Contract
13

Table A-3: Northern Eastern Shore Corn Basis; Marketing Year 2000-2001
Month September December March-01 May-01 July-01dollars/bu
August 0.09 -0.03 -0.15 -0.23 -0.31(.05 to .12) (-.07 to 0) (-.19 to -.12) (-.27 to -.20) (-.40 to -.27)
September 0.10 -0.09 -0.21 -0.28 -0.35(.10 to .10) (-.21 to 0) (-.33 to -.12) (-.40 to -.19) (-.47 to -.26)
October -0.21 -0.31 -0.39 -0.47(-.28 to -.14) (-.39 to -.24) (-.46 to -.33) (-.54 to -.40)
November -0.30 -0.41 -0.49 -0.56(-.40 to -.22) (-.51 to -.34) (-.59 to -.42) (-.66 to -.49)
December -0.25 -0.32 -0.39 -0.47(-.25 to -.25) (-.37 to -.26) (-.44 to -.33) (-.52 to -.41)
January -0.11 -0.19 -0.27(-.17 to -.04) (-.25 to -.12) (-.32 to -.20)
February -0.11 -0.19 -0.27(-.13 to -.10) (-.21 to -.18) (-.29 to -.26)
March -0.10 -0.16 -0.24(-.10 to -.10) (-.20 to -.09) (-.28 to -.17)
April -0.01 -0.08(-.07 to .11) (-.15 to .03)
May 0.16 -0.04(.16 to .16) (-.45 to .14)
June 0.05(-.02 to .11)
July -0.15(-.15 to -.15)
Source: University of Delaware Basis = Cash - Futures
Futures Contract
14

Table A-4: Northern Eastern Shore Corn Basis; Marketing Year 2001-2002
Month September December March-02 May-02 July-02dollars/bu
August 0.16 0.04 -0.06 -0.11 -0.15(-.03 to .74) (-.15 to .61) (-.23 to .49) (-.28 to .45) (-.33 to .40)
September 0.10 -0.06 -0.18 -0.24 -0.29(.10 to .10) (-.11 to -.03) (-.23 to -.14) (-.31 to -.19) (-.36 to -.23)
October -0.21 -0.33 -0.40 -0.46(-.23 to -.17) (-.35 to -.29 (-.43 to -.37) (-.49 to -.42)
November -0.03 -0.15 -0.23 -0.29(-.20 to .18) (-.32 to .06) (-.39 to -.01) (-.46 to -.08)
December 0.04 -0.04 -0.11 -0.16(-.06 to .14) (-.15 to .05) (-.22 to -.02) (-.28 to -.07)
January 0.04 -0.03 -0.10( 0 to .05) (-.07 to -.02) (-.13 to -.08)
February 0.10 0.03 -0.04(.07 to .14) (0 to .07) (-.06 to 0)
March 0.13 0.08 0.01(.12 to .14) (.08 to .08) (.01 to .01)
April 0.11 0.05(.10 to .12) (.04 to .05)
May 0.14 0.11(.11 to .16) (.05 to .14)
June 0.17(.17 to .17)
July 0.16(.15 to .16)
Source: University of Delaware Basis = Cash - Futures
Futures Prices
15

Table A-5: Northern Eastern Shore Corn Basis; Marketing Year 2002-2003
Month September December March-03 May-03 July-03dollars/bu
August 0.24 0.11 0.03 0.01 0.01(.14 to .38) (.03 to .18) (-.02 to .10) (-.04 to .07) (-.06 to .07)
September 0.29 0.24 0.19 0.16 0.17(.29 to .29) (.16 to .30) (.12 to .23) (.10 to .19) (.13 to .19)
October 0.32 0.26 0.23 0.22(.30 to .35) (.23 to .31) (.20 to .28) (.19 to .26)
November 0.35 0.32 0.30 0.29(.35 to .35) (.31 to .34) (.28 to .33) (.26 to .32)
December 0.39 0.36 0.34 0.31(.38 to .40) (.35 to .38) (.33 to .36) (.30 to .33)
January 0.36 0.33 0.30(.33 to .37) (.30 to .35) (.27 to .32)
February 0.40 0.37 0.35(.40 to .40) (.36 to .38) (.35 to .35)
March 0.42 0.43 0.42(.41 to .43) (.43 to .43) (.41 to .43)
April 0.46 0.45(.43 to .49) (.43 to .48)
May 0.37 0.40(.33 to .40) (.38 to .43)
June 0.39(.38 to .39)
July 0.38(.38 to .38)
Source: University of Delaware Basis = Cash - Futures
Futures Prices
16

Table A-6: Northern Eastern Shore Average Corn Basis; Marketing Years 1998/99 - 2002/03
Month September December March May Julydollars/bu
August 0.16 0.04 -0.06 -0.11 -0.16(.09 to .24) (-.03 to .11) (-.15 to .03) (-.23 to .01) (-.31 to .01)
September 0.20 0.07 -0.04 -0.09 -0.14(.10 to .33) (-.09 to .24) (-.21 to .19) (-.28 to .16) (-.35 to .17)
October 0.03 -0.07 -0.14 -0.19(-.21 to .32) (-.33 to .26) (-.40 to .23) (-.47 to .22)
November 0.07 -0.02 -0.09 -0.14(-.30 to .35) (-.41 to .32) (-.49 to .30) (-.56 to.29)
December 0.14 0.06 0.00 -0.06(-.25 to .39) (-.32 to .36) (-.39 to .34) (-.47 to .31)
January 0.15 0.08 0.13(-.11 to .36) (-.19 to .33) (-.27 to .60)
February 0.19 0.12 0.06(-.11 to .40) (-.19 to .37) (-.27 to .35)
March 0.20 0.16 0.10(-.10 to .42) (-.16 to .43) (-.24 to .42)
April 0.19 0.12(-.01 to .46) (-.08 to .45)
May 0.23 0.17(.14 to .37) (-.04 to .40)
June 0.20(.05 to .39)
July 0.17(-.15 to .38)
Source: University of Delaware Basis = Cash - Futures
Futures Contracts
17

Table A-7: Southern Eastern Shore Corn Basis: Marketing Year 1998-1999
Month September December March-99 May-99 July-99dollars/bu
August 0.26 0.16 0.04 -0.03 -0.09(.23 to .29) (.13 to .20) (.01 to .09) (-.06 to .01) (-.12 to -.04)
September 0.29 0.17 0.04 -0.03 -0.10(.28 to .29) (.16 to .17) (.04 to .05) (-.04 to -.03) (-.11 to -.09)
October 0.11 0 -0.07 -0.11(.11 to .11) (0 to 0) (-.07 to -.07) (-.11 to -.11)
November 0.20 0.08 -0.02 -0.05(.17 to .24) (.04 to .13) (-.03 to .05) (-.10 to -.01)
December 0.28 0.22 0.15 0.09(.28 to .28) (.19 to .25) (.12 to .18) (.06 to .11)
January 0.30 0.24 0.18(.29 to .30) (.23 to .24) (.17 to .19)
February 0.31 0.25 0.20(.30 to .31) (.24 to .25) (.19 to .20)
March 0.32 0.25 0.19(.32 to .32) (.23 to .27) (.17 to .21)
April 0.26 0.18(.26 to .27) (.11 to .21)
May 0.23 0.19(.21 to .25) (.18 to .20)
June 0.27(.24 to .31)
July 0.38(.36 to .40)
Source: University of Delaware Basis = Cash - Futures
Futures Contract
18

Table A-8: Southern Eastern Shore Corn Basis; Marketing Year 1999-2000
Month September December March-00 May-00 July-00dollars/bu
August 0.30 0.17 0.07 0.02 -0.02(.27 to .33) (.16 to .20) (.06 to .09) (.01 to .04) (-.03 to 0)
September 0.44 0.24 0.12 0.07 0.02(.39 to .49) (.13 to .36) (.01 to .25) (-.05 to .20) (-.09 to .16)
October 0.20 0.09 0.02 -0.04(.16 to .22) (.06 to .11) (-.01 to .05) (-.07 to 0)
November 0.30 0.18 0.11 0.05(.26 to .34) (.15 to .21) (.08 to .14) (.01 to .07)
December 0.38 0.23 0.16 0.10(.37 to .38) (.15 to .27) (.09 to .20) (.03 to .14)
January 0.28 0.21 0.13(.18 to .37) (.10 to .29) (.03 to .21)
February 0.34 0.26 0.18(.32 to .37) (.24 to .29) (.16 to .21)
March 0.32 0.28 0.20(.32 to .32) (.18 to .41) (.10 to .33)
April 0.24 0.15(.13 to .33) (.04 to .24)
May 0.35 0.28(.35 to .35) (.23 to .32)
June 0.34(.22 to .39)
July 0.32(.22 to .42)
Source:University of Delaware Basis = Cash - Futures
Futures Contract
19

Table A-9: Southern Eastern Shore Corn Basis; Marketing Year 2000-2001
Month September December March-01 May-01 July-01dollars/bu
August 0.22 0.10 -0.02 -0.10 -0.18(.16 to .29) (.04 to .17) (-.08 to .05) (-.16 to -.03) (-.29 to -.10)
September 0.19 0 -0.12 -0.19 -0.26(.19 to .19) (-.12 to .09) (-.24 to -.30) (-.31 to -.10) (-.38 to -.17)
October -0.10 -0.21 -0.29 -0.36(-.13 to -.07) (-.24 to -.17) (-.31 to -.26) (-.39 to -.33)
November -0.13 -0.25 -0.33 -0.40(-.23 to -.06) (-.34 to -.18) (-.42 to -.26) (-.49 to -.33)
December 0 -0.13 -0.21 -0.28(0 to 0) (-.19 to -.10) (-.26 to -.17) (-.34 to -.25)
January 0.01 -0.07 -0.14(-.06 to .17) (-.14 to .09) (-.21 to .01)
February 0.05 -0.03 -0.11(.01 to .10) (-.07 to .02) (-.15 to -.06)
March 0.06 0 -0.08(.06 to .06) (-.04 to .06) (-.12 to -.02)
April 0.17 0.09(.09 to .28) (.01 to .20)
May 0.28 0.09(.28 to .28) (-.32 to .11)
June 0.27(.20 to .33)
July 0.08(.08 to .08)
Source: University of Delaware Basis = Cash - Futures
Futures Contract
20

Table A-10: Southern Eastern Shore Corn Basis; Marketing Year 2001-2002
Month September December March-02 May-02 July-02dollars/bu
August 0.20 0.08 -0.03 -0.07 -0.11(.18 to .24) (.06 to .12) (-.06 to .02) (-.10 to -.03) (-.15 to -.07)
September 0.17 0.01 -0.11 -0.17 -0.22(.14 to .19) (-.04 to .06) (-.16 to -.05) (-.23 to -.10) (-.28 to -.14)
October -0.14 -0.26 -0.33 -0.39(-.15 to -.11) (-.27 to -.23) (-.35 to -.31) (-.41 to -.36)
November 0.09 -0.03 -0.10 -0.17(-.09 to .31) (-.21 to .19) (-.29 to .12) (-.35 to.05)
December 0.15 0.07 0.00 -0.05(.14 to .15) (.05 to .09) (-.02 to .02) (-.08 to -.04)
January 0.18 0.11 0.04(.15 to .20) (.08 to .13) (.01 to .06)
February 0.26 0.19 0.13(.24 to .30) (.17 to .23) (.11 to .16)
March 0.34 0.29 0.22(.31 to .37) (.26 to .31) (.19 to .24)
April 0.30 0.24(.28 to .32) (.22 to .26)
May 0.35 0.31(.35 to .35) (.29 to .34)
June 0.31(.30 to .34)
July 0.70(.32 to 1.08)
Source: University of Delaware Basis = Cash - Futures
Futures Contract
21

Table A-11: Southern Eastern Shore Corn Basis; Marketing Year 2002-2003
Month September December March-03 May-03 July-03dollars/bu
August 0.39 0.26 0.18 0.16 0.16(.32 to .53) (.21 to .33) (.16 to .21) (.14 to .16) (.12 to .18)
September 0.39 0.31 0.25 0.22 0.23(.39 to .39) (.26 to .37) (.22 to .30) (.20 to .26) (.21 to .25)
October 0.41 0.35 0.32 0.31(.36 to .45) (.30 to .41) (.27 to .38) (.27 to .36)
November 0.45 0.42 0.40 0.39(.45 to .45) (.41 to .44) (.38 to .43) (.36 to .42)
December 0.48 0.45 0.43 0.40(.47 to .49) (.44 to .47) (.42 to .45) (.39 to .42)
January 0.47 0.44 0.41(.46 to .49) (.43 to .47) (.40 to .44)
February 0.53 0.50 0.48(.52 to .53) (.49 to .51) (.47 to .48)
March 0.53 0.53 0.52(.52 to .53) (.53 to .54) (.51 to .53)
April 0.53 0.52(.52 to .55) (.50 to .54)
May 0.45 0.49(.43 to .48) (.47 to .51)
June 0.47(.44 to .49)
July 0.47(.47 to .47)
Source: University of Delaware Basis = Cash - Futures
Futures Prices
22

Table A-12: Southern Eastern Shore Average Corn Basis; Marketing Years 1998/99-2002/03
Month September December March May Julydollars/bu
August 0.27 0.15 0.05 0.00 -0.05(.20 to .39) (.08 to .26) (-.03 to .18) (-.10 to .16) (-.18 to .16)
September 0.30 0.15 0.04 -0.02 -0.07(.17 to .44) (0 to .31) (-.12 to .25) (-.19 to .22) (-.26 to .23)
October 0.10 -0.01 -0.07 -0.12(-.14 to .41) (-.26 to .35) (-.33 to .32) (-.39 to .31)
November 0.18 0.08 0.01 -0.04(-.13 to .45) (-.25 to .35) (-.33 to .40) (-.40 to .39)
December 0.26 0.17 0.11 0.05(0 to .48) (-.13 to .45) (-.21 to .43) (-.28 to .40)
January 0.25 0.19 0.12(.01 to .47) (-.07 to .44) (-.14 to .41)
February 0.30 0.23 0.17(.05 to .53) (-.03 to .5) (-.11 to .48)
March 0.31 0.27 0.21(.06 to .53) (0 to .53) (-.08 to .52)
April 0.30 0.24(.24 to .53) (.09 to .52)
May 0.33 0.27(.23 to .45) (.09 to.49)
June 0.33(.27 to .47)
July 0.39(.08 to .70)
Source: University of Delaware Basis = Cash - Futures
Futures Contracts
23

Table A-13: Northern Eastern Shore Soybean Basis; Marketing Year 1998-1999
Month September November January-99 March-99 May-99 July-99 August-99
September -0.06 -0.03 -0.13 -0.24 -0.33 -0.43 -0.46(-.11 to .01) (-.03 to -.03) (-.14 to -.13) (-.25 to -.23) (-.34 to -.32) (-.45 to -.41) (-.56 to -.42)
October -0.25 -0.25 -0.35 -0.43 -0.51 -0.53(-.25 to -.25) (-.25 to -.25) (-.35 to -.35) (-.43 to -.43) (-.51 to -.51) (-.53 to -.53)
November -0.16 -0.23 -0.32 -0.38 -0.48 -0.49(-.16 to -.15) (-.24 to -.23) (-.33 to -.32) (-.40 to -.34) (-.49 to -.46) (-.52 to -.46)
December -0.24 -0.31 -0.38 -0.44 -0.45(-.25 to -.23) (-.32 to -.29) (-.40 to -.35) (-.47 to -.40) (-.48 to -.41)
January -0.13 -0.14 -0.18 -0.22 -0.23(-.13 to -.13) (-.16 to -.12) (-.21 to -.15) (-.25 to -.19) (-.26 to -.20)
February -0.14 -0.18 -0.24 -0.26(-.14 to -.13) (-.19 to -.17) (-.27 to -.22) (-.29 to -.24)
March -0.14 -0.18 -0.26 -0.29(-.14 to -.14) (-.19 to -.17) (-.26 to -.26) (-.29 to -.28)
April -0.23 -0.29 -0.36(-.24 to -.22) (-.23 to -.33) (-.36 to -.35)
May -0.27 -0.32 -0.35(-.29 to -.24) (-.32 to -.31) (-.35 to -.34)
June -0.32 -0.33(-.34 to -.29) (-.34 to -.31)
July -0.25 -0.30(-.29 to -.21) (-.32 to -.29)
August -0.27(-.27 to -.27)
Source: University of Delaware Basis = Cash - Futures
Futures Contract
dollars/bu
24

Table A-14: Northern Eastern Shore Soybean Basis: Marketing Year 1999-2000
Month September November January-00 March-00 May-00 July-00 August-00
September -0.27 -0.26 -0.35 -0.43 -0.48 -0.53 -0.54(-.50 to -.04) (-.55 to -.09) (-.64 to -.18) (-.71 to -.26) (-.76 to -.31) (-.80 to -.36) (-.78 to -.37)
October -0.15 -0.27 -0.34 -0.40 -0.45 -0.45(-.29 to -.01) (-.40 to -.14) (-.47 to -.22) (-.53 to -.29) (-.59 to -.35) (-.59 to -.34)
November -0.08 -0.23 -0.30 -0.36 -0.42 -0.41(-.09 to -.06) (-.32 to -.14) (-.39 to -.21) (-.46 to -.26) (-.51 to -.31) (-.52 to -.30)
December -0.17 -0.23 -0.29 -0.35 -0.35(-.40 to -.01) (-.41 to -.08) (-.46 to -.14) (-.52 to -.20) (-.52 to -.19)
January -0.10 -0.22 -0.30 -0.39 -0.40(-.10 to -.10) (-.38 to -.07) (-.46 to -.16) (-.55 to -.25) (-.56 to -.26)
February -0.05 -0.15 -0.24 -0.25(-.13 to .01) (-.23 to -.08) (-.32 to -.16) (-.33 to -.18)
March -0.11 -0.20 -0.30 -0.33(-.11 to -.11) (-.29 to -.10) (-.41 to -.20) (-.44 to -.23)
April -0.19 -0.32 -0.35(-.37 to -.09) (-.49 to -.21) (-.51 to -.25)
May -0.05 -0.08 -0.11(-.05 to -.05) (-.22 to .12) (-.24 to .09)
June -0.07 -0.03(-.14 to -.04) (-.15 to .05)
July -0.07 -0.09(-.07 to -.07) (-.15 to -.05)
August -0.06(-.06 to -.06)
Source: University of Delaware Basis = Cash - Futures
Futures Contract
dollars/bu
25

Table A-15: Northern Eastern Shore Soybean Basis; Marketing Year 2000-2001
Month September November January-01 March-01 May-01 July-01 August-01
September -0.20 -0.24 -0.35 -0.44 -0.51 -0.59 -0.59(-.20 to -.20) (-.34 to -.14) (-.45 to -.24) (-.54 to -.35) (-.61 to -.42) (-.69 to -.50) (-.68 to -.49)
October -0.23 -0.35 -0.43 -0.50 -0.58 -0.59(-.32 to -.17) (-.41 to -.28) (-.50 to -.37) (-.57 to -.45) (-.65 to -.52) (-.66 to -.52)
November -0.44 -0.30 -0.39 -0.47 -0.53 -0.53(-.44 to -.44) (-.54 to .47) (-.64 to .38) (-.75 to .31) (-.79 to .24) (-.80 to .24)
December -0.39 -0.48 -0.56 -0.61 -0.60(-.44 to -.31) (-.53 to -.41) (-.59 to -.50) (-.64 to -.55) (-.64 to -.54)
January -0.21 -0.21 -0.28 -0.35 -0.34(-.21 to -.21) (-.28 to -.15) (-.35 to -.22) (-.42 to -.30) (-.41 to -.27)
February -0.07 -0.08 -0.14 -0.14(-.15 to .02) (-.15 to .02) (-.20 to -.04) (-.19 to -.04)
March 0.09 -0.06 -0.12 -0.11(.09 to .09) (-.14 to .07) (-.20 to 0) (-.19 to 0)
April -0.17 -0.21 -0.17(-.34 to -.03) (-.33 to -.03) (-.31 to -.02)
May -0.31 -0.27 -0.21(-.31 to -.31) (-.39 to -.16) (-.32 to -.10)
June -0.29 -0.23(-.61 to -.12) (-.56 to -.04)
July -0.62 -0.39(-.62 to -.62) (-.59 to -.27)
August -0.45(-.49 to -.40)
Source: University of Delaware Basis = Cash - Futures
Futures Contract
dollars/bu
26

Table A-16: Northern Eastern Shore Soybean Basis; Marketing Year 2001-2002
Month September November Jan-02 Mar-02 May-02 Jul-02 Aug-02dollars/bu
September -0.26 -0.36 -0.43 -0.49 -0.51 -0.54 N.A.*(-.26 to -.26) (-.40 to -.31) (-.46 to -.38) (-.52 to -.44) (-.56 to -.45) (-.61 to -.47) N.A.
October -0.37 -0.44 -0.49 -0.54 -0.57 N.A.(-.38 to -.35) (-.46 to -.42) (-.51 to -.46) (-.57 to -.50) (-.61 to -.55) N.A.
November -0.40 -0.42 -0.45 -0.49 -0.54 -0.53(-.42 to -.38) (-.43 to -.41) (-.47 to -.44) (-.51 to -.47) (-.56 to -.52) (-.56 to -.50)
December -0.28 -0.30 -0.34 -0.38 -0.38(-.32 to -.25) (-.34 to -.25) (-.39 to -.28) (-.43 to -.33) (-.43 to -.34)
January -0.22 -0.19 -0.23 -0.28 -0.27(-.23 to -.21) (-.23 to -.15) (-.27 to -.20) (-.32 to -.24) (-.31 to -.23)
February -0.13 -0.17 -0.21 -0.21(-.15 to -.10) (-.20 to -.15) (-.24 to -.18) (-.24 to -.19)
March -0.08 -0.14 -0.17 -0.17(-.11 to -.06) (-.15 to -.13) (-.20 to -.14) (-.20 to -.14)
April -0.16 -0.14 -0.11(-.31 to -.08) (-.16 to -.12) (-.13 to -.10)
May -0.12 -0.14 -0.10(-.15 to -.08) (-.20 to -.11) (-.17 to -.06)
June -0.10 -0.04(-.12 to -.08) (-.05 to -.02)
July -0.21 -0.02(-.34 to -.08) (-.07 to 0)
August 0.03(-.07 to .21)
Source: University of Delaware Basis = Cash - Futures
*N.A.= Not Available
Futures Prices
27

Table A-17: Northern Eastern Shore Soybean Basis; Marketing Year 2002-2003
Month September November January-03 March-03 May-03 July-03 August-03dollars/bu
September -0.08 -0.12 -0.15 -0.15 -0.13 -0.11 -0.09(-.08 to -.08) (-.15 to -.05) (-.19 to -.08) (-.20 to -.07) (-.18 to -.02) (-.18 to 0) (-.11 to -.08)
October -0.05 -0.07 -0.07 -0.06 -0.05 0.02(-.15 to -.01) (-.19 to .05) (-.21 to 0.10) (-.22 to .17) (-.22 to .20) (-.16 to .28)
November -0.15 -0.05 -0.01 0.07 0.12 0.20(-.30 to .01) (-.24 to .05) (-.20 to .09) (-.12 to .18) (-.07 to .23) (.02 to .31)
December 0.06 0.10 0.17 0.20 0.29(.05 to .09) (.08 to .12) (.15 to .20) (.17 to .24) (.24 to .33)
January -0.03 0.05 0.11 0.14 0.20(-.03 to -.03) (.05 to .07) (.09 to .13) (.11 to .17) (.17 to .25)
February 0.03 0.05 0.06 0.16(-.01 to .05) (0 to .08) (.02 to .10) (.09 to .18)
March 0.04 0.01 0.04 0.15(.04 to .04) (-.05 to .05) (-.02 to .07) (.10 to .18)
April -0.07 -0.08 0.03(-.12 to -.01) (-.15 to .01) (-.07 to .15)
May -0.11 -0.15 -0.11(-.11 to -.10) (-.16 to -.15) (-.14 to -.07)
June -0.13 -0.12(-.15 to -.05) (-.16 to -.01)
July -0.15 -0.05(-.15 to -.14) (-.05 to -.05)
August -0.37(-.52 to -.05)
Source: University of Delaware Basis = Cash - Futures
Futures Prices
28

Table A-18: Northern Eastern Shore Average Soybean Basis; Marketing Years 1998/99-2002/03
Month September November January March May July Augustdollars/bu
September -0.17 -0.20 -0.28 -0.35 -0.39 -0.44 -0.42(-.27 to -.06) (-.36 to -.03) (-.43 to -.13) (-.49 to -.15) (-.51 to -.13) (-.59 to -.11) (-.59 to -.09)
October -0.21 0.00 -0.34 -0.39 -0.43 -0.39(-.37 to -.15) (-.44 to -.25) (-.49 to -.34) (-.54 to -.40) (-.58 to -.45) (-.59 to -.45)
November -0.25 -0.25 -0.29 -0.33 -0.37 -0.35(-.44 to-.08) (-.42 to -.05) (-.45 to -.01) (-.49 to .07) (-.54 to .12) (-.53 to .20)
December -0.20 -0.24 -0.28 -0.32 -0.30(-.39 to .06) (-.48 to .10) (-.56 to .17) (-.61 to .20) (-.60 to .29)
January -0.14 -0.14 -0.18 -0.22 -0.21(-.22 to -.03) (-.22 to .05) (-.30 to .11) (-.39 to .14) (-.40 to .20)
February -0.07 -0.11 -0.15 -0.14(-.14 to .03) (-.21 to .05) (-.24 to .06) (-.26 to .16)
March -0.04 -0.11 -0.16 -0.15(-.14 to .09) (-.20 to .01) (-.30 to .04) (-.33 to .15)
April -0.15 -0.19 -0.19(-.23 to -.07) (-.32 to -.07) (-.36 to -.03)
May -0.17 -0.17 -0.17(-.31 to -.05) (-.32 to -.01) (-.35 to -.09)
June -0.16 -0.15(-.32 to .03) (-.33 to -.03)
July -0.26 -0.17(-.62 to -.07) (-.39 to -.02)
August -0.22(-.45 to .03)
Source: University of Delaware Basis = Cash - Futures
Futures Prices
29

A-19: Southern Eastern Shore Soybean Basis; Marketing Year 1998-1999
Month September November January-99 March-99 May-99 July-99 August-99
September 0 0.04 -0.07 -0.18 -0.27 -0.36 -0.40(-.02 to .06) (.02 to .07) (-.09 to -.04) (-.20 to -.14) (-.29 to -.23) (-.40 to -.32) (-.47 to -.33)
October -0.25 -0.25 -0.35 -0.43 -0.51 -0.53(-.25 to -.25) (-.25 to -.25) (-.35 to -.35) (-.43 to -.43) (-.51 to -.51) (-.53 to -.53)
November -0.04 -0.12 -0.21 -0.29 -0.37 -0.37(-.04 to -.04) (-.14 to -.11) (-.23 to -.21) (-.32 to -.27) (-.38 to -.34) (-.40 to -.34)
December -0.11 -0.17 -0.24 -0.30 -0.31(-.11 to -.10) (-.19 to -.15) (-.27 to -.21) (-.34 to -.26) (-.35 to -.27)
January -0.02 -0.05 -0.09 -0.13 -0.14(-.02 to -.02) (-.05 to -.05) (-.10 to -.08) (-.14 to -.12) (-.15 to -.13)
February -0.06 -0.10 -0.16 -0.18(-.06 to -.05) (-.11 to -.09) (-.19 to -.14) (-.21 to -.16)
March -0.07 -0.13 -0.21 -0.24(-.07 to -.07) (-.14 to -.12) (-.23 to -.19) (-.25 to -.22)
April -0.12 -0.22 -0.25(-.13 to -.11) (-.22 to -.21) (-.25 to -.24)
May -0.17 -0.22 -0.25(-.18 to -.15) (-.23 to -.21) (-.26 to -.24)
June -0.19 -0.20(-.22 to -.14) (-.22 to -.16)
July -0.13 -0.19(-.14 to -.11) (-.22 to -.15)
August -0.18(-.18 to -.17)
Source: University of Delaware Basis = Cash - Futures
Futures Contract
dollars/bu
30

Table A-20: Southern Eastern Shore Soybean Basis; Marketing Year 1999-2000
Month September November January-00 March-00 May-00 July-00 August-00
September -0.11 -0.16 -0.25 -0.33 -0.38 -0.44 -0.44(-.22 to 0) (-.27 to -.05) (-.36 to -.14) (-.43 to -.22) (-.48 to -.27) (-52 to -.32) (-.53 to -.33)
October -0.08 -0.19 -0.27 -0.33 -0.38 -0.38(-.23 to .06) (-.34 to -.07) (-.41 to -.15) (-.47 to -.22) (-.53 to -.28) (-.53 to -.27)
November 0.02 -0.12 -0.20 -0.26 -0.31 -0.31(.01 to .04) (-.19 to -.04) (-.26 to -.11) (-.33 to -.16) (-.39 to -.21) (-.39 to -.20)
December -0.07 -0.13 -0.19 -0.25 -0.25(-.26 to .10) (-.31 to .03) (-.37 to -.03) (-.43 to -.09) (-.43 to -.08)
January -0.08 -0.09 -0.18 -0.26 -0.27(-.08 to -.08) (-.31 to .27) (-.39 to .18) (-.48 to .09) (-.49 to .08)
February 0.01 -0.09 -0.17 -0.19(-.05 to .07) (-.15 to -.02) (-.24 to -.10) (-.25 to -.12)
March -0.09 -0.13 -0.23 -0.26(-.09 to -.09) (-.22 to .03) (-.34 to -.07) (-.37 to -.10)
April -0.11 -0.24 -0.27 (-.29 to -.01) (-.41 to -.13) (-.43 to -.17)
May -0.02 -0.02 -0.05(-.02 to -.02) (-.16 to .18) (-.18 to .15)
June 0 0.04(-.08 to .05) (-.09 to .15)
July -0.01 0.01(-.01 to -.01) (-.03 to .08)
August 0.01(.01 to .01)
Source: University of Delaware Basis = Cash - Futures
Futures Contract
dollars/bu
31

Table A-21: Southern Eastern Shore Soybean Basis; Marketing Year 2000-2001
Month September November January-01 March-01 May-01 July-01 August-01
September -0.13 -0.17 -0.27 -0.37 -0.44 -0.52 -0.51(-.13 to -.13) (-.27 to -.50) (-.38 to -.15) (-.47 to -.26) (-.54 to -.33) (-.62 to -.41) (-.61 to -.40)
October -0.20 -0.31 -0.40 -0.47 -0.55 -0.56(-.28 to -.12) (-.23 to -.37) (-.46 to -.32) (-.53 to -.40) (-.61 to -.47) (-.62 to -.47)
November -0.42 -0.47 -0.56 -0.64 -0.70 -0.71(-.42 to -.42) (-.52 to -.38) (-.62 to -.47) (-.73 to -.55) (-.77 to -.62) (-.78 to -.63)
December -0.38 -0.47 -0.55 -0.60 -0.59(-.42 to -.30) (-.51 to -.40) (-.57 to -.49) (-.62 to -.54) (-.62 to -.53)
January -0.28 -0.17 -0.24 -0.31 -0.30(-.28 to -.28) (-.35 to -.50) (-.42 to -.12) (-.49 to -.19) (-.48 to -.19)
February 0.01 0.01 -0.05 -0.05(-.03 to .08) (-.03 to .08) (-.10 to .02) (-.10 to .02)
March 0.19 0.03 -0.03 -0.02(.19 to .19) (-.03 to .17) (-.09 to .10) (-.08 to .10)
April -0.06 -0.10 -0.06(-.26 to .08) (-.25 to .08) (-.23 to .09)
May -0.11 -0.12 -0.06(-.11 to -.11) (-.26 to -.01) (-.19 to .01)
June -0.17 -0.10(-.50 to .01) (-.45 to .09)
July -0.54 -0.33(-.54 to -.54) (-.51 to -.22)
August -0.38(-.40 to -.35)
Source: University of Delaware Basis = Cash - Futures
Futures Contract
dollars/bu
32

Table A-22: Southern Eastern Shore Soybean Basis; Marketing Year 2001-2002
Month September November Jan-02 Mar-02 May-02 Jul-02 Aug-02dollar/bu
September -0.34 -0.33 -0.40 -0.46 -0.48 -0.50(-.45 to -.22) (-.47 to -.27) (-.53 to -.34) (-.58 to -.4) (-.6 to -.41) (-.61 to -.43)
October -0.29 -0.36 -0.41 -0.46 -0.49(-.29 to -.28) (-.37 to -.33) (-.43 to -.37) (-.48 to -.41) (-.5 to -.46)
November -0.34 -0.34 -0.37 -0.41 -0.46 -0.45(-.35 to -.32) (-.36 to -.32) (-.41 to -.33) (-.44 to -.36) (-.49 to -.41) (-.48 to -.39)
December -0.16 -0.18 -0.22 -0.26 -0.26(-.22 to -.12) (-.24 to -.12) (-.29 to -.15) (-.33 to -.2) (-.33 to -.21)
January -0.08 -0.06 -0.10 -0.15 -0.14(-.09 to -.06) (-.09 to -.03) (-.13 to -.07) (-.18 to -.11) (-.18 to -.11)
February -0.01 -0.05 -0.09 -0.09(-.04 to .03) (-.08 to -.02) (-.12 to -.05) (-.12 to -.06)
March 0.01 -0.05 -0.08 -0.08(-.04 to .04) (-.08 to -.04) (-.09 to -.06) (-.09 to -.06)
April -0.09 -0.07 -0.04(-.2 to -.04) (-.1 to -.04) (-.07 to .01)
May 0.04 -0.01 0.03(.03 to .04) (-.01 to 0) (.02 to .05)
June 0.03 0.09(0 to .06) (.07 to .12)
July -0.09 0.10(-.23 to .04) (.01 to .17)
August 0.12(-.09 to .38)
Source: University of Delaware Basis = Cash - Futures
Futures Prices
33

Table A-23: Southern Eastern Shore Soybean Basis; Marketing Year 2002-2003
Month September November January-03 March-03 May-03 July-03 August-03dollars/bu
September 0.01 -0.02 -0.05 -0.06 -0.03 -0.02 0.01(.01 to .01) (-.05 to 0.01) (-.09 to .01) (-.01 to .02) (-.08 to .07) (-.08 to .09) (-.01 to .02)
October 0.11 0.11 0.13 0.18 0.20 0.28(-.05 to .16) (-.09 to .15) (-.11 to .20) (-.12 to .27) (-.12 to .30) (-.06 to .38)
November 0.10 0.15 0.19 0.27 0.31 0.40(.09 to .11) (.15 to .15) (.19 to .19) (.26 to .28) (.29 to .33) (.37 to .41)
December 0.16 0.20 0.27 0.30 0.39(.15 to .19) (.18 to .22) (.25 to .30) (.27 to .34) (.34 to .43)
January 0.07 0.15 0.20 0.23 0.30(.07 to .07) (.15 to .15) (.19 to .23) (.21 to .27) (.27 to .35)
February 0.14 0.16 0.17 0.26(.10 to .16) (.11 to .18) (.13 to .20) (.20 to .29)
March 0.16 0.13 0.16 0.27(.15 to .16) (.06 to .17) (.09 to .19) (.21 to .30)
April 0.04 0.04 0.15( 0 to .11) (-.04 to .13) (.04 to .27)
May -0.02 -0.06 -0.01(-.02 to -.01) (-.06 to -.06) (-.04 to .02)
June -0.03 -0.02(-.06 to .04) (-.07 to .08)
July -0.04 0.05(-.05 to -.04) (.05 to .05)
August -0.16(-.34 to .05)
Source: University of Delaware Basis = Cash - Futures
Futures Prices
34

Table A-24: Southern Eastern Shore Average Soybean Basis; Marketing Years 1998/99-2002/03
Month September November January March May July Augustdollars/bu
September -0.11 -0.12 -0.21 -0.28 -0.32 -0.37 -0.34(-.34 to .01) (-.27 to .04) (-.40 to -.05) (-.46 to -.06) (-.48 to -.03) (-.50 to -.02) (-.51 to .01)
October -0.15 -0.22 -0.28 -0.33 -0.37 -0.34(-.29 to .06) (-.36 to .03) (-.41 to .03) (-.47 to .04) (-.55 to .06) (-.56 to .12)
November -0.13 -0.18 -0.23 -0.27 -0.31 -0.29(-.42 to .10) (-.47 to .15) (-.56 to .19) (-.64 to .27) (-.70 to .31) (-.71 to .40)
December -0.18 -0.23 -0.28 -0.33 -0.33(-.38 to .16) (-.47 to .20) (-.55 to .27) (-.60 to .30) (-.59 to .39)
January -0.11 -0.09 -0.14 -0.20 -0.20(-.28 to .07) (-.17 to .15) (-.24 to .20) (-.31 to .23) (-.30 to .30)
February 0.02 -0.01 -0.06 -0.05(-.06 to .14) (-.10 to .16) (-.17 to .17) (-.19 to .26)
March 0.04 -0.03 -0.08 -0.07(-.09 to .19) (-.13 to .13) (-.23 to .16) (-.26 to .27)
April -0.06 -0.12 -0.09(-.12 to .04) (-.22 to .04) (-.25 to .15)
May -0.06 -0.09 -0.07(-.17 to .04) (-.22 to -.01) (-.25 to .03)
June -0.07 -0.04(-.19 to .03) (-.20 to .09)
July -0.16 -0.07(-.54 to -.01) (-.33 to .10)
August -0.12(-.38 to .12)
Source:University of Delaware Basis = Cash - Futures
Futures Prices
35

Table A-25: Northern Eastern Shore Wheat Basis; Marketing Year 1998-1999
Month July September December March-99 May-99
June -0.38 -0.49 -0.64 -0.77 -0.83(-.41 to -.35) (-.52 to -.47) (-.68 to -.61) (-.80 to -.74) (-.87 to -.79)
July -0.30 -0.40 -0.55 -0.68 -0.76(-.31 to -.29) (-.42 to -.37) (-.58 to -.52) (-.70 to -.67) (-.76 to -.75)
August -0.37 -0.54 -0.69 -0.77 (-.40 to -.35) (-.56 to -.52) (-.71 to -.68) (-.77 to -.77)
September -0.27 -0.44 -0.58 -0.68(-.35 to -.19) (-.49 to -.40) (-.64 to -.51) (-.74 to -.61)
October -0.30 -0.45 -0.53(-.30 to -.30) (-.45 to -.45) (-.53 to -.53)
November -0.33 -0.47 -0.55(-.58 to -.11) (-.69 to -.28) (-.76 to -.37)
December -0.09 -0.22 -0.32(-.09 to -.09) (-.22 to -.22) (-.32 to -.32)
January -0.25 -0.35(-.25 to -.24) (-.35 to -.35)
February -0.19 -0.30(-.20 to -.19) (-.31 to -.30)
March -0.18 -0.24(-.18 to -.18) (-.24 to -.24)
April -0.24(-.24 to -.24)
May N.A.*
Source: University of Delaware Basis = Cash - Futures
*N.A.= Not Available
Futures Contract
dollars/bu
36

Table A-26: Northern Eastern Shore Wheat Basis; Marketing Year 1999-2000
Month July September December March-00 May-00
June
July
August -0.29 -0.47 -0.61 -0.70(-.32 to -.22) (-.50 to -.40) (-.65 to -.54) (-.74 to -.64)
September -0.27 -0.37 -0.52 -0.62(-.29 to -.24) (-.49 to -.15) (-.65 to -.31) (-.74 to -.41)
October -0.33 -0.49 -0.59(-.37 to -.26) (-.53 to -.42) (-.62 to -.52)
November -0.21 -0.37 -0.47(-.24 to -.18) (-.40 to -.33) (-.50 to -.44)
December -0.15 -0.29 -0.39(-.15 to -.15) (-.32 to -.17) (-.42 to -.28)
January -0.26 -0.37(-.33 to -.19) (-.44 to -.30)
February -0.31 -0.43(-.34 to -.27) (-.46 to -.39)
March -0.39 -0.37(-.39 to -.39) (-.80 to .09)
April -0.26(-.33 to -.20)
May N.A.
Source: University of Delaware Basis = Cash - Futures
NA* = Not Available
NA*
NA*
Futures Contract
dollars/bu
37

Table A-27:Northern Eastern Shore Wheat Basis; Marketing Year 2000-2001
Month July September December March-01 May-01
June -0.35 -0.47 -0.64 -0.77 -0.77(-.49 to -.16) (-.61 to -.26) (-.78 to -.43) (-.91 to -.57) (-.90 to -.66)
July -0.11 -0.43 -0.60 -0.77 -0.86(-.11 to -.11) (-.54 to -.20) (-.72 to -.37) (-.89 to -.53) (-.99 to -.63)
August -0.43 -0.61 -0.78 -0.89(-.60 to -.27) (-.78 to -.45) (-.95 to -.62) (-1.06 to -.72)
September - -0.68 -0.85 -0.94(-.68 to -.68) (-.85 to -.85) (-.94 to -.94)
October 0.06 -0.12 -0.22(.03 to .10) (-.15 to -.08) (-.26 to -.18)
November 0.05 -0.13 -0.24(-.03 to .13) (-.19 to -.05) (-.30 to -.15)
December - -0.55 -0.66(-.55 to -.55) (-.66 to -.66)
January -0.33 -0.45(-.33 to -.33) (-.45 to -.45)
February -0.40 -0.51(-.40 to -.40) (-.51 to -.51)
March -0.28 -0.33(-.28 to -.28) (-.41 to -.22)
April N.A.*
May N.A.
Source: University of Delaware Basis = Cash - Futures
*N.A.= Not Available
Futures Contract
dollars/bu
38

Table A-28: Northern Eastern Shore Wheat Basis; Marketing Year 2001-2002
Month July September December-01 March-02 May-02dollars/bu
June -0.32 -0.43 -0.59 -0.72 -0.69(-.35 to -.27) (-.46 to -.37) (-.62 to -.53) (-.75 to -.66) (-.83 to -.36)
July -0.29 -0.35 -0.50 -0.62 -0.66(-.32 to -.25) (-.38 to -.32) (-.53 to -.46) (-.66 to -.57) (-.72 to -.59)
August -0.26 -0.41 -0.54 -0.58(-.31 to -.16) (-.46 to-.29) (-.60 to -.40) (-.65 to -.44)
September -0.31 -0.25 -0.35 -0.38(-.31 to -.31) (-.42 to -.08) (-.52 to -.18) (-.56 to -.20)
October -0.26 -0.34 -0.35(-.34 to -.14) (-.43 to -.22) (-.46 to -.24)
November -0.22 -0.30 -0.32(-.27 to -.07) (-.36 to -.16) (-.39 to -.17)
December -0.03 -0.19 -0.19(-.19 to .13) (-.27 to .04) (-.31 to .03)
January -0.22 -0.18(-.24 to -.18) (-.22 to -.19)
February -0.18 -0.25(-.20 to -.14) (-.26 to -.22)
March -0.17 -0.22(-.17 to -.16) (-.24 to -.17)
April -0.02(-.22 to -.22)
May -0.18(-.18 to -.18)
Source: University of Delaware Basis = Cash - Futures
Futures Contracts
39

Table A-29: Northern Eastern Shore Wheat Basis; Marketing Year 2002-2003
Month July September December-02 March-03 May-03dollars/bu
June -0.25 -0.32 -0.41 -0.42 -0.36(-.26 to -.24) (-.32 to -.32) (-.42 to -.39) (-.44 to -.40) (-.38 to -.34)
July -0.23 -0.23 -0.35 -0.43 -0.36(-.24 to -.22) (-.32 to -.01) (-.41 to -.21) (-.46 to -.40) (-.38 to -.34)
August -0.18 -0.34 -0.44 -0.34(-.25 to .03) (-.37 to -.27) (-.45 to -.43) (-.37 to -.32)
September -0.32 -0.29 -0.33 -0.12(-.32 to -.32) (-.30 to -.24) (-.35 to -.30) (-.14 to -.10)
October -0.27 -0.28 -0.06(-.27 to -.27) (-.32 to -.23) (-.17 to .09)
November 0.04 -0.23 0.02(-.24 to .56) (-.25 to -.22) (-.03 to .11)
December -0.10 -0.18 -0.06(-.14 to -06) (-.21 to .12) (-.10 to .01)
January -0.21 -0.18(-.21 to -.21) (-.19 to -.16)
February -0.21 -0.20(-.21 to -.20) (-.21 to -.19)
March -0.29 -0.20(-.29 to -.29) (-.21 to -.18)
April -0.17(-.22 to -.06)
May -0.19(-.19 to -.18)
Source: University of Delaware Basis = Cash - Futures
Futures Contracts
40

Table A-30: Northern Eastern Shore Average Wheat Basis; Marketing Years 1998/99- 2002/03
Futures ContractsMonth July September December March May
dollars/bu
June -0.33 -0.43 -0.57 -0.67 -0.31(-.38 to -.25) (-.49 to -.32) (-.64 to -.41) (-.77 to -.42) (-.83 to -.36)
July -0.23 -0.35 -0.50 -0.63 -0.66(-.30 to -.11) (-.43 to -.23) (-.60 to -.35) (-.77 to -.43) (-.86 to -.36)
August -0.31 -0.47 -0.61 -0.66(-.43 to -.18) (-.61 to -.34) (-.78 to -.44) (-.89 to -.34)
September -0.29 -0.34 -0.45 -0.45(-.32 to -.27) (-.68 to -.25) (-.85 to -.33) (-.94 to -.12)
October -0.22 -0.34 -0.35(-.33 to .06) (-.49 to -.12) (-.59 to -.06)
November -0.13 -0.30 -0.31(-.33 to .05) (-.47 to -.13) (-.55 to .02)
December -0.07 -0.29 -0.32(-.15 to -.03) (-.55 to -.18) (-.66 to -.06)
January -0.25 -0.31(-.33 to -.21) (-.45 to -.18)
February -0.26 -0.34(-.40 to -.18) (-.51 to -.20)
March -0.26 -0.27(-.39 to -.17) (-.37 to -.20)
April -0.17(-.26 to -.02)
May -0.19(-.19 to -.18)
Source: University of Delaware Basis = Cash - Futures
41

Table A-31: Southern Eastern Shore Wheat Basis; Marketing Year 1998-1999
Month July September December March-99 May-99
June -0.36 -0.48 -0.63 -0.75 -0.81(-.38 to -.34) (-.49 to -.46) (-.65 to -.60) (-.79 to -.73) (-.85 to -.78)
July -0.30 -0.40 -0.55 -0.68 -0.76(-.34 to -.28) (-.45 to -.37) (-.61 to -.52) (-.73 to -.67) (-.79 to -.73)
August -0.36 -0.52 -0.68 -0.76(-.37 to -.34) (-.54 to -.51) (-.70 to -.66) (-.79 to -.79)
September -0.33 -0.49 -0.62 -0.72(-.34 to -.31) (-.58 to -.45) (-.65 to -.60) (-.75 to -.70)
October -0.51 -0.64 -0.72(-.51 to -.51) (-.64 to -.64) (-.72 to -.72)
November -0.57 -0.72 -0.80(-.78 to -.45) (-.89 to -.62) (-.96 to -.71)
December -0.27 -0.35 -0.45(-.27 to -.27) (-.40 to -.30) (-.50 to -.40)
January -0.37 -0.48(-.39 to -.35) (-.50 to -.45)
February -0.33 -0.44(-.35 to -.31) (-.46 to -.42)
March -0.41 -0.47(-.41 to -.41) (-.47 to -.47)
April -0.47(-.48 to -.47)
May -0.44(-.47 to -.44)
Source: University of Delaware Basis = Cash - Futures
Futures Contract
dollars/bu
42

Table A-32: Southern Eastern Shore Wheat Basis; Marketing Year 1999-2000
Month July September December March-00 May-00
June
July
August -0.22 -0.40 -0.54 -0.63(-.37 to .09) (-.54 to -.08) (-.68 to -.22) (-.77 to -.31)
September -0.01 -0.35 -0.50 -0.60(-.27 to .12) (-.62 to -.05) (-.78 to -.19) (-.87 to -.29)
October -0.42 -0.58 -0.67(-.46 to -.35) (-.62 to -.51) (-.71 to -.61)
November -0.32 -0.48 -0.58(-.36 to -.29) (-.52 to -.45) (-.62 to -.55)
December -0.31 -0.45 -0.55(-.32 to -.29) (-.56 to -.38) (-.66 to -.49)
January -0.46 -0.57(-.72 to -.31) (-.83 to -.42)
February -0.35 -0.47(-.45 to -.27) (-.57 to -.39)
March -0.41 -0.44(-.41 to -.41) (-.81 to -.17)
April -0.37(-.49 to -.24)
May -0.30(-.30 to -.30)
Source: University of Delaware Basis = Cash - Futures
N.A.* = Not Available
Futures Contract
dollars/bu
N.A.*
N.A.*
43

Table A-33: Southern Eastern Shore Wheat Basis; Marketing Year 2000-2001
Month July September December March-01 May-01
June -0.35 -0.47 -0.64 -0.77 -0.75(-.52 to -.17) (-.64 to -.27) (-.81 to -.44) (-.94 to -.58) (-.82 to -.67)
July -0.22 -0.42 -0.60 -0.76 -0.86(-.22 to -.22) (-.53 to -.31) (-.71 to -.48) (-.88 to -.64) (-.98 to -.74)
August -0.51 -0.69 -0.86 -0.96(-.63 to -.39) (-.81 to -.58) (-.98 to -.74) (-1.08 to -.86)
September -0.46 -0.57 -0.75 -0.84(-.46 to -.46) (-.73 to -.39) (-.90 to -.56) (-1.00 to -.65)
October -0.63 -0.80 -0.90(-.74 to -.51) (-.92 to -.69) (-1.01 to -.79)
November -0.52 -0.70 -0.80(-.65 to -.26) (-.83 to -.44) (-.93 to -.54)
December -0.45 -0.58 -0.69(-.45 to -.45) (-.62 to -.50) (-.73 to -.60)
January -0.51 -0.63(-.61 to -.42) (-.72 to -.54)
February -0.41 -0.53(-.50 to -.32) (-.62 to -.43)
March N.A.* -0.36N.A. (-.26 to -.46)
April -0.37(-.39 to -.35)
May N.A.
Source: University of Delaware Basis = Cash - Futures
*N.A.= Not Available
Futures Contract
dollars/bu
44

Table A-34: Southern Eastern Shore Wheat Basis; Marketing Year 2001-2002
Month July September December March-02 May-02dollars/bu
June -0.32 -0.42 -0.58 -0.71 -0.77(-.35 to -.27) (-.46 to -.37) (-.62 to -.53) (-.74 to -.66) (-.80 to -.74)
July -0.28 -0.36 -0.51 -0.63 -0.67(-.30 to -.26) (-.38 to -.34) (-.52 to -.48) (-.65 to -.59) (-.72 to -.61)
August -0.30 -0.44 -0.57 -0.61(-.33 to -.18) (-.48 to -.31) (-.62 to -.42) (-.67 to -.46)
September -0.33 -0.42 -0.53 -0.57(-.34 to -.32) (-.43 to -.40) (-.57 to -.50) (-.63 to -.52)
October -0.37 -0.44 -0.45(-.40 to -.34) (-.48 to -.41) (-.49 to -.41)
November -0.33 -0.41 -0.43(-.35 to .28) (-.44 to -.37) (-.45 to -.40)
December -0.27 -0.35 -0.35(-.27 to -.26) (-.35 to -.35) (-.39 to -.32)
January -0.24 -0.24(-.27 to -.14) (-.28 to -.19)
February -0.20 -0.27(-.22 to -.17) (-.29 to -.25)
March -0.17 -0.25(-.17 to -.16) (-.29 to -.23)
April -0.22(-.23 to -.21)
May -0.20(-.19 to -.21)
Source: University of Delaware Basis = Cash - Futures
Futures Contracts
45

Table A-35: Southern Eastern Shore Wheat Basis; Marketing Year 2002-2003
Month July September December March-03 May-03dollars/bu
June -0.24 -0.31 -0.40 -0.41 -0.35(-.26 to -.23) (-.33 to -.29) (-.42 to -.36) (-.43 to -.37) (-.39 to -.31)
July -0.20 -0.20 -0.31 -0.39 -0.32(-.20 to -.19) (-.25 to .01) (-.35 to -.19) (-.41 to -.36) (-.32 to -.31)
August -0.16 -0.32 -0.42 -0.32(-.24 to .05) (-.36 to -.25) (-.43 to -.40) (-.35 to -.31)
September -0.31 -0.28 -0.32 -0.11(-.31 to -.31) (-.29 to -.23) (-.34 to -.29) (-.13 to -.09)
October -0.25 -0.26 -0.04(-.25 to -.25) (-.30 to -.21) (-.15 to .11)
November 0.04 -0.23 0.02(-.23 to .59) (-.24 to -.22) (-.02 to .09)
December -0.07 -0.15 -0.03(-.11 to -.03) (-.18 to -.09) (-.07 to 0.04)
January -0.18 -0.15(-.18 to -.17) (-.16 to -.13)
February -0.19 -0.18(-.21 to -.17) (-.19 to -.17)
March -0.27 -0.18(-.28 to -.26) (-.20 to -.15)
April -0.17(-.19 to -.17)
May -0.16(-.17 to -.15)
Source: University of Delaware Basis = Cash - Futures
Futures Contracts
46

Table A-36: Southern Eastern Shore Average Wheat Basis; Marketing Years 1998/99- 2002/03
Futures ContractsMonth July September December March May
dollars/bu
June -0.32 -0.42 -0.57 -0.66 -0.67(-.36 to -.24) (-.48 to -.31) (-.64 to -.40) (-.77 to -.41) (-.81 to -.35)
July -0.25 -0.34 -0.49 -0.61 -0.65(-.30 to -.20) (-.42 to -.20) (-.60 to -.31) (-.76 to -.39) (-.86 to -.32)
August -0.30 -0.47 -0.61 -0.65(-.51 to -.16) (-.69 to -.32) (-.86 to -.42) (-.96 to -.32)
September -0.28 -0.39 -0.51 -0.53(-.46 to -.01) (-.57 to -.25) (-.75 to -.32) (-.84 to -.11)
October -0.41 -0.52 -0.54(-.63 to -.25) (-.80 to -.26) (-.90 to -.04)
November -0.32 -0.49 -0.50(-.57 to .04) (-.72 to -.23) (-.80 to .02)
December -0.23 -0.34 -0.38(-.45 to -.03) (-.58 to -.15) (-.69 to -.03)
January -0.35 -0.40(-.51 to -.18) (-.63 to -.15)
February -0.29 -0.37(-.41 to -.18) (-.53 to -.18)
March -0.32 -0.33(-.41 to -.17) (-.47 to -.18)
April -0.28(-.47 to -.02)
May -0.27(-.44 to -.16)
Source: University of Delaware Basis = Cash - Futures
47

IX.
Appendix B: Basis Figures
48

Source: University of Delaware 49
Figure B-1: Northern Eastern Shore Corn Basis; Marketing Year 1998/99
-0.50
-0.40
-0.30
-0.20
-0.10
0.00
0.10
0.20
0.30
0.40
0.50
Augus
tSep
tembe
r
Octobe
rNov
embe
rDec
embe
r
Janu
ary
Februa
ry
March
April
May
June Ju
ly
Dol
lars
/bu September
DecemberMarchMayJuly
Futures

Source: University of Delaware 50
B-2: Northern Eastern Shore Corn Basis; Marketing Year 1999/00
-0.50
-0.40
-0.30
-0.20
-0.10
0.00
0.10
0.20
0.30
0.40
0.50
Augus
tSep
tembe
r
Octobe
rNov
embe
rDec
embe
r
Janu
ary
Februa
ry
March
April
May
June Ju
ly
Dol
lars
/bu September
DecemberMarchMayJuly
Futures

Source: University of Delaware 51
B-3: Northern Eastern Shore Corn Basis; Marketing Year 2000/01
-0.60
-0.50
-0.40
-0.30
-0.20
-0.10
0.00
0.10
0.20
0.30
0.40
0.50
Augus
tSep
tembe
r
Octobe
rNov
embe
rDec
embe
r
Janu
ary
Februa
ry
March
April
May
June Ju
ly
Dol
lars
/bu September
DecemberMarchMayJuly
Futures

Source: University of Delaware 52
Figure B-4: Northern Eastern Shore Corn Basis: Marketing Year 2001/02
-0.50
-0.40
-0.30
-0.20
-0.10
0.00
0.10
0.20
0.30
Augus
tSep
tembe
r
Octobe
rNov
embe
rDec
embe
r
Janu
ary
Februa
ry
March
April
May
June Ju
ly
Dol
lars
/bu
SeptemberDecemberMarchMayJuly
Futures

Source: University of Delaware 53
Figure B-5: Northern Eastern Shore Corn Basis; Marketing Year 2002/2003
0.00
0.10
0.20
0.30
0.40
0.50
Augus
tSep
tembe
r
Octobe
rNov
embe
rDec
embe
r
Janu
ary
Februa
ry
March
April
May
June Ju
ly
Dol
lars
/bu Sepember
DecemberMarchMayJuly
Futures

Source: University of Delaware 54
Figure B-6:Northern Eastern Shore Average Corn Basis; Marketing Years 1998/99-2002/03
-0.30
-0.20
-0.10
0.00
0.10
0.20
0.30
Augus
tSep
tembe
rOcto
ber
Novem
ber
Decem
ber
Janu
aryFeb
ruary
March
April
May
June Ju
ly
Dol
lars
/bu
September
December
March
May
July
Futures

Source: University of Delaware 55
Figure B-7: Southern Eastern Shore Corn Basis; Marketing Year 1998/99
-0.50
-0.40
-0.30
-0.20
-0.10
0.00
0.10
0.20
0.30
0.40
0.50
Augus
tSep
tembe
r
Octobe
rNov
embe
rDec
embe
r
Janu
ary
Februa
ry
March
April
May
June Ju
ly
Dol
lars
/bu September
DecemberMarchMayJuly
Futures

Source: University of Delaware 56
Figure B-8: Southern Eastern Shore Corn Basis; Marketing Year 1999/00
-0.30
-0.20
-0.10
0.00
0.10
0.20
0.30
0.40
0.50
Augus
tSep
tembe
r
Octobe
rNov
embe
rDec
embe
r
Janu
ary
Februa
ry
March
April
May
June Ju
ly
Dol
lars
/bu September
DecemberMarchMayJuly
Futures

Source: University of Delaware 57
Figure B-9: Southern Eastern Shore Corn Basis; Marketing Year 2000/01
-0.50
-0.40
-0.30
-0.20
-0.10
0.00
0.10
0.20
0.30
0.40
Augus
tSep
tembe
r
Octobe
rNov
embe
rDec
embe
r
Janu
ary
Februa
ry
March
April
May
June Ju
ly
Dol
lars
/bu September
DecemberMarchMayJuly
Futures

Source: University of Delaware 58
Figure B-10: Southern Eastern Shore Corn Basis; Marketing Year 2001/02
-0.50
-0.40
-0.30
-0.20
-0.10
0.00
0.10
0.20
0.30
0.40
0.50
0.60
0.70
0.80
Augus
tSep
tembe
r
Octobe
rNov
embe
rDec
embe
r
Janu
ary
Februa
ry
March
April
May
June Ju
ly
Dol
lars
/bu September
DecemberMarchMayJuly
Futures

Source: University of Delaware 59
Figure B-11: Southern Eastern Shore Corn Basis; Marketing Year 2002/03
0.00
0.10
0.20
0.30
0.40
0.50
0.60
Augus
tSep
tembe
r
Octobe
rNov
embe
rDec
embe
r
Janu
ary
Februa
ry
March
April
May
June Ju
ly
Dol
lars
/bu September
December MarchMay July
Futures

Source: University of Delaware 60
B-12: Southern Eastern Shore Average Corn Basis; Marketing Years 1998/99-2002/03
-0.50
-0.40
-0.30
-0.20
-0.10
0.00
0.10
0.20
0.30
0.40
0.50
Augus
tSep
tembe
r
Octobe
rNov
embe
rDec
embe
r
Janu
ary
Februa
ry
March
April
May
June Ju
ly
Dol
lars
/bu
September DecemberMarchMayJuly
Futures

Source: University of Delaware 61
B-13: Northern Eastern Shore Soybean Basis; Marketing Year 1998/99
-0.60
-0.50
-0.40
-0.30
-0.20
-0.10
0.00
Septem
ber
Octobe
rNov
embe
rDec
embe
r
Janu
ary
Februa
ry
March
April
May
June Ju
ly
Augus
t
Dol
lars
/bu
SeptemberNovemberJanuaryMarchMayJulyAugust
Futures

Source: University of Delaware 62
Figure B-14: Northern Eastern Shore Soybean Basis; Marketing Years 1999/2000
-0.60
-0.50
-0.40
-0.30
-0.20
-0.10
0.00
Septem
ber
Octobe
rNov
embe
rDec
embe
r
Janu
ary
Februa
ry
March
April
May
June Ju
ly
Augus
t
Dol
lars
/bu
SeptemberNovemberJanuaryMarchMayJulyAugust
Futures

Source: University of Delaware 63
Figure B-15: Northern Eastern Shore Soybean Basis; Marketing Years 2000/01
-0.70
-0.60
-0.50
-0.40
-0.30
-0.20
-0.10
0.00
0.10
0.20
Septem
ber
Octobe
rNov
embe
rDec
embe
r
Janu
ary
Februa
ry
March
April
May
June Ju
ly
Augus
t
Dol
lars
/bu
SeptemberNovemberJanuaryMarchMayJulyAugust
Futures

Source: University of Delaware 64
B-16: Northern Eastern Shore Soybean Basis; Marketing Year 2001/02
-0.60
-0.50
-0.40
-0.30
-0.20
-0.10
0.00
0.10
Augus
t
Octobe
rNov
embe
rDec
embe
r
Janu
ary
Februa
ry
March
April
May
June Ju
ly
Augus
t
Dol
lars
/bu
SeptemberNovemberJanuaryMarchMayJulyAugust
Futures

Source: University of Delaware 65
B-17: Northern Eastern Shore Soybean Basis; Marketing Year 2002/03
-0.20
-0.10
0.00
0.10
0.20
0.30
0.40
Septem
ber
Octobe
rNov
embe
rDec
embe
r
Janu
ary
Februa
ry
March
April
May
June Ju
ly
Augus
t
Dol
lars
/bu
SeptemberNovemberJanuaryMarchMayJulyAugust
Futures

Source: University of Delaware 66
Figure B-18: Northern Eastern Shore Average Soybean Basis; Marketing Years 1998/99- 2002/03
-0.50
-0.40
-0.30
-0.20
-0.10
0.00
Septem
ber
Octobe
rNov
embe
rDec
embe
r
Janu
ary
Februa
ry
March
April
May
June Ju
ly
Augus
t
Dol
lars
/bu
SeptemberNovemberJanuaryMarchMayJulyAugust
Futures

Source: University of Delaware 67
Figure B-19: Southern Eastern Shore Soybean Basis; Marketing Years 1998/99
-0.60
-0.50
-0.40
-0.30
-0.20
-0.10
0.00
0.10
Septem
ber
Octobe
rNov
embe
rDec
embe
r
Janu
ary
Februa
ry
March
April
May
June Ju
ly
Augus
t
Dol
lars
/bu September
NovemberJanuaryMarchMayJulyAugust
Futures

Source: University of Delaware 68
Figure B-20: Southern Eastern Shore Soybean Basis; Marketing Years 1999/00
-0.50
-0.40
-0.30
-0.20
-0.10
0.00
0.10
Septem
ber
Octobe
rNov
embe
rDec
embe
r
Janu
ary
Februa
ry
March
April
May
June Ju
ly
Augus
t
Dol
lars
/bu
SeptemberNovemberJanuaryMarchMayJulyAugust
Futures

Source: University of Delaware 69
Figure B-21: Southern Eastern Shore Soybean Basis; Marketing Years 2000/01
-0.80
-0.70
-0.60
-0.50
-0.40
-0.30
-0.20
-0.10
0.00
0.10
0.20
Septem
ber
Octobe
rNov
embe
rDec
embe
r
Janu
ary
Februa
ry
March
April
May
June Ju
ly
Augus
t
Dol
lars
/bu
SeptemberNovemberJanuaryMarchMayJulyAugust
Futures

Source: University of Delaware 70
Figure B-22: Southern Eastern Shore Soybean Basis; Marketing Year 2001/02
-0.60
-0.50
-0.40
-0.30
-0.20
-0.10
0.00
0.10
0.20
Septem
ber
Octobe
rNov
embe
rDec
embe
r
Janu
ary
Februa
ry
March
April
May
June Ju
ly
Augus
t
Dol
lars
/bu
SeptemberNovemberJanuaryMarchMayJulyAugust
Futures

Source: University of Delaware 71
Figure B-23: Southern Eastern Shore Soybean Basis; Marketing Year 2002/03
-0.10
0.00
0.10
0.20
0.30
0.40
Septem
ber
Octobe
rNov
embe
rDec
embe
r
Janu
ary
Februa
ry
March
April
May
June Ju
ly
Augus
t
Dol
lars
/bu
SeptemberNovemberJanuaryMarchMayJulyAugust
Futures

Source: University of Delaware 72
Figure B-24: Southern Eastern Shore Average Soybean Basis; Marketing Years 1998/99-2002/03
-0.40
-0.30
-0.20
-0.10
0.00
0.10
Septem
ber
Octobe
rNov
embe
rDec
embe
r
Janu
ary
Februa
ry
March
April
May
June Ju
ly
Augus
t
Dol
lars
/bu
SeptemberNovemberJanuaryMarchMayJulyAugust
Futures

Source: University of Delaware 73
Figure B-25: Northern Eastern Shore Wheat Basis; Marketing Year 1998/99
-0.90
-0.80
-0.70
-0.60
-0.50
-0.40
-0.30
-0.20
-0.10
0.00
June
July
Augus
tSep
tembe
r
Octobe
r
Novem
ber
Decem
ber
Janu
ary
Februa
ry
March
April
Dol
lars
/bu July
SeptemberDecemberMarchMay
Futures

Source: University of Delaware 74
Figure B-26: Northern Eastern Shore Wheat Basis; Marketing Year 1999/00
-0.80
-0.70
-0.60
-0.50
-0.40
-0.30
-0.20
-0.10
Augus
t
Septem
ber
Octobe
r
Novem
ber
Decem
ber
Janu
ary
Februa
ry
March
April
Dol
lars
/bu
JulySeptemberDecemberMarchMay
Futures

Source: University of Delaware 75
Figure B-27: Northern Eastern Shore Wheat Basis; Marketing Year 2000/01
-1.00
-0.90
-0.80
-0.70
-0.60
-0.50
-0.40
-0.30
-0.20
-0.10
0.00
0.10
0.20
June
July
Augus
tSep
tembe
r
Octobe
r
Novem
ber
Decem
ber
Janu
ary
Februa
ry
March
Dol
lars
/bu July
SeptemberDecemberMarchMay
Futures

Source: University of Delaware 76
Figure B-28: Northern Eastern Shore Wheat Basis; Marketing Year 2001/02
-1.00
-0.90
-0.80
-0.70
-0.60
-0.50
-0.40
-0.30
-0.20
-0.10
0.00
0.10
June Ju
ly
Augus
tSep
tembe
r
Octobe
rNov
embe
rDec
embe
r
Janu
ary
Februa
ry
March
April
May
Dol
lars
/bu July
SeptemberDecemberMarchMay
Futures

Source: University of Delaware 77
Figure B-29: Northern Eastern Shore Wheat Basis; Marketing Year 2002/03
-0.60
-0.50
-0.40
-0.30
-0.20
-0.10
0.00
0.10
June
July
Augus
tSep
tembe
r
Octobe
rNov
embe
rDec
embe
r
Janu
ary
Februa
ry
March
April
May
Dol
lars
/bu July
SeptemberDecemberMarchMay
Futures

Source: University of Delaware 78
Figure B-30: Northern Eastern Shore Average Wheat Basis; Marketing Years 1998/99-2002/03
-0.80
-0.70
-0.60
-0.50
-0.40
-0.30
-0.20
-0.10
0.00
0.10
June
July
Augus
tSep
tembe
rOcto
ber
Novem
ber
Decem
ber
Janu
aryFeb
ruary
March
April
MayD
olla
rs/b
u JulySeptemberDecemberMarchMay
Futures

Source: University of Delaware 79
Figure B-31: Southern Eastern Shore Wheat Basis; Marketing Year 1998/99
-0.90
-0.80
-0.70
-0.60
-0.50
-0.40
-0.30
-0.20
June
July
Augus
tSep
tembe
r
Octobe
rNov
embe
rDec
embe
r
Janu
ary
Februa
ry
March
April
May
Dol
lars
/bu July
SeptemberDecemberMarchMay
Futures

Source: University of Delaware 80
Figure B-32: Southern Eastern Shore Wheat Basis; Marketing Year 1999/00
-0.80
-0.70
-0.60
-0.50
-0.40
-0.30
-0.20
-0.10
0.00
Augus
tSep
tembe
r
Octobe
r
Novem
ber
Decem
ber
Janu
ary
Februa
ry
March
April
May
Dol
lars
/bu July
SeptemberDecemberMarchMay
Futures

Source: University of Delaware 81
Figure B-33: Southern Eastern Shore Wheat Basis; Marketing Year 2000/01
-1.00
-0.90
-0.80
-0.70
-0.60
-0.50
-0.40
-0.30
-0.20
June
July
Augus
tSep
tembe
r
Octobe
r
Novem
ber
Decem
ber
Janu
ary
Februa
ry
March
April
Dol
lars
/bu July
SeptemberDecemberMarchMay
Futures

Source: University of Delaware 82
Figure B-34: Southern Eastern Shore Wheat Basis; Marketing Year 2001/02
-0.80
-0.70
-0.60
-0.50
-0.40
-0.30
-0.20
-0.10
0.00
June Ju
ly
Augus
tSep
tembe
r
Octobe
rNov
embe
rDec
embe
r
Janu
ary
Februa
ry
March
April
May
Dol
lars
/bu July
SeptemberDecemberMarchMay
Futures

Source: University of Delaware 83
Figure B-35: Southern Eastern Shore Wheat Basis; Marketing Year 2002/03
-0.50
-0.40
-0.30
-0.20
-0.10
0.00
0.10
June
July
Augus
tSep
tembe
r
Octobe
rNov
embe
rDec
embe
r
Janu
aryFeb
ruary
March
April
May
Dol
lars
/bu
JulySeptemberDecemberMarchMay
Futures

Source: University of Delaware 84
Figure B-36: Southern Eastern Shore Average Wheat Basis; Marketing Years 1998/99- 2002/03
-0.80
-0.70
-0.60
-0.50
-0.40
-0.30
-0.20
-0.10
0.00
June
July
Augus
tSep
tembe
rOcto
ber
Novem
ber
Decem
ber
Janu
aryFeb
ruary
March
April
May
Dol
lars
/bu
JulySeptemberDecemberMarchMay
Futures

The Department of Food and Resource EconomicsCollege of Agriculture and Natural Resources
University of Delaware
The Department of Food and Resource Economics carries on an extensive and coordinatedprogram of teaching, organized research, and public service in a wide variety of the followingprofessional subject matter areas:
Subject Matter Areas
Agricultural Finance Natural Resource ManagementAgricultural Policy and Public Programs Operations Research and Decision AnalysisEnvironmental and Resource Economics Price and Demand AnalysisFood and Agribusiness Management Rural and Community DevelopmentFood and Fiber Marketing Statistical Analysis and Research MethodsInternational Agricultural Trade
The department’s research in these areas is part of the organized research program of theDelaware Agricultural Experiment Station, College of Agriculture and Natural Resources. Muchof the research is in cooperation with industry partners, other state research stations, the USDA, andother State and Federal agencies. The combination of teaching, research, and service provides anefficient, effective, and productive use of resources invested in higher education and service to thepublic. Emphasis in research is on solving practical problems important to various segments of theeconomy.
The department’s coordinated teaching, research, and service program provides professionaltraining careers in a wide variety of occupations in the food and agribusiness industry, financialinstitutions, and government service. Departmental course work is supplemented by courses in otherdisciplines, particularly in the College of Agriculture and Natural Resources and the College ofBusiness and Economics. Academic programs lead to degrees at two levels: Bachelor of Scienceand Masters of Science. Course work in all curricula provides knowledge of tools and techniquesuseful for decision making. Emphasis in the undergraduate program centers on developing thestudent’s managerial ability through three different areas, Food and Agricultural BusinessManagement, Natural Resource Management, and Agricultural Economics. The graduate programbuilds on the undergraduate background, strengthening basic knowledge and adding moresophisticated analytical skills and business capabilities. The department also cooperates in theoffering of an MS and Ph.D. degrees in the inter disciplinary Operations Research Program. Inaddition, a Ph.D. degree is offered in cooperation with the Department of Economics.
For further information write to: Dr. Thomas W. Ilvento, ChairDepartment of Food and Resource EconomicsUniversity of DelawareNewark, DE 19717-1303

FREC Research Reports
are published as a
service to Delaware’s
Food and Agribusiness
Community by the
Department of
Food and Resource
Economics, College
of Agriculture and
Natural Resources
of the University of
Delaware.