The HILDA Survey: a case study in the design and ...
13
Longitudinal and Life Course Studies 2012 Volume 3 Issue 3 Pp 369 – 381 ISSN 1757-9597 369 The HILDA Survey: a case study in the design and development of a successful household panel study Nicole Watson Melbourne Institute of Applied Economic and Social Research, University of Melbourne Mark Wooden Melbourne Institute of Applied Economic and Social Research, University of Melbourne [email protected] (Received May 2012 Revised September 2012) Abstract The Household, Income and Labour Dynamics in Australia (HILDA) Survey is one of only a small number of well-established, large, nationally-representative household panel studies conducted in the world. With annual data collection commencing in 2001 there are now over 10 years of unit record data available to researchers, with the promise of many more to come. While the design of the HILDA Survey owes much to other older household panel studies conducted elsewhere, it has a number of features which make it relatively unique. This paper provides a brief history of the HILDA Survey’s progress to date, focusing first on its origins, design, content and data collection processes, before reviewing its achievements with respect to survey response and usage. Keywords: Australia, HILDA Survey, household panel surveys, longitudinal survey research Introduction With over a decade of data collection behind it, the Household, Income and Labour Dynamics in Australia (or HILDA) Survey is one of only a small number of large, nationally-representative household panel studies that can claim to have made the transition into a successful long-running study. An initiative of the Australian Government, the contract to design and manage the study was awarded to the Melbourne Institute of Applied Economic and Social Research (at the University of Melbourne), with the first wave of data collection taking place in 2001. The contract has been renewed or extended on a number of occasions, including most recently in 2012. Currently the HILDA Survey is assured of continuing until at least 2016, with all indications that the study will continue to be funded well beyond that. This paper provides a brief history of the HILDA Survey’s progress to date, focusing first on its origins, design, content and data collection processes, before reviewing its achievements with respect to survey response and usage. Origins Australia, like other industrial nations, has long invested heavily in the collection of statistical data. Indeed, Australia arguably has one of the most effective national statistical agencies in the world, the Australian Bureau of Statistics (ABS). Nevertheless, there has always existed one glaring gap in the ABS collection – the absence of any long-running longitudinal survey data collection. Longitudinal survey data collections in Australia have thus mostly been funded and managed by other agencies, and have been designed with quite specific purposes in mind, reflected in studies that focus on relatively small sub-groups of the population (such as youth or recent immigrants) and / or on quite narrowly-defined subject matter (e.g., post-migration settlement or women’s health). In the late 1990s, with the greater
Transcript of The HILDA Survey: a case study in the design and ...
Longitudinal and Life Course Studies 2012 Volume 3 Issue 3 Pp 369 – 381 ISSN 1757-9597
369
The HILDA Survey: a case study in the design and development of a successful household panel study
Nicole Watson Melbourne Institute of Applied Economic and Social Research, University of Melbourne
Mark Wooden Melbourne Institute of Applied Economic and Social Research, University of Melbourne [email protected]
(Received May 2012 Revised September 2012)
Abstract
The Household, Income and Labour Dynamics in Australia (HILDA) Survey is one of only a small number of well-established, large, nationally-representative household panel studies conducted in the world. With annual data collection commencing in 2001 there are now over 10 years of unit record data available to researchers, with the promise of many more to come. While the design of the HILDA Survey owes much to other older household panel studies conducted elsewhere, it has a number of features which make it relatively unique. This paper provides a brief history of the HILDA Survey’s progress to date, focusing first on its origins, design, content and data collection processes, before reviewing its achievements with respect to survey response and usage.
Keywords: Australia, HILDA Survey, household panel surveys, longitudinal survey research
Introduction With over a decade of data collection behind it,
the Household, Income and Labour Dynamics in Australia (or HILDA) Survey is one of only a small number of large, nationally-representative household panel studies that can claim to have made the transition into a successful long-running study. An initiative of the Australian Government, the contract to design and manage the study was awarded to the Melbourne Institute of Applied Economic and Social Research (at the University of Melbourne), with the first wave of data collection taking place in 2001. The contract has been renewed or extended on a number of occasions, including most recently in 2012. Currently the HILDA Survey is assured of continuing until at least 2016, with all indications that the study will continue to be funded well beyond that.
This paper provides a brief history of the HILDA Survey’s progress to date, focusing first on its origins, design, content and data collection
processes, before reviewing its achievements with respect to survey response and usage.
Origins Australia, like other industrial nations, has long
invested heavily in the collection of statistical data. Indeed, Australia arguably has one of the most effective national statistical agencies in the world, the Australian Bureau of Statistics (ABS). Nevertheless, there has always existed one glaring gap in the ABS collection – the absence of any long-running longitudinal survey data collection. Longitudinal survey data collections in Australia have thus mostly been funded and managed by other agencies, and have been designed with quite specific purposes in mind, reflected in studies that focus on relatively small sub-groups of the population (such as youth or recent immigrants) and / or on quite narrowly-defined subject matter (e.g., post-migration settlement or women’s health). In the late 1990s, with the greater
Nicole Watson, Mark Wooden The HILDA Survey: a case study in design and development
370
emphasis in government in Australia on the need for evidence-based policy, the significance of this data gap became much more obvious. Nowhere was this perhaps noticed more than in the Department of Families and Community Services, which was responsible for delivery of income support and social services to Australian families, and at the time was coordinating a major review of social welfare services and policy.
It was thus against this background that the Australian Government, and more specifically the Department of Families and Community Services, commissioned (following a public tender process) the Melbourne Institute to design and implement the HILDA Survey. As stated in the Request for Tender, the primary objectives were to support research within three broad inter-related areas: family and household dynamics; income and welfare dynamics; and labour market dynamics. At the same time, the winning tender emphasized the advantages of appealing to as broad a cross-section of users within the social sciences as possible, and hence the expansion of the coverage of the survey to topic areas such as subjective well-being. It was also explicitly designed to inform policy development, especially in the areas of economic and social participation, and stronger families. However, it was also recognised that such a survey would not be well suited to the evaluation of a particular set of policy initiatives. Rather the hope was that the HILDA Survey would collect information on a range of policy-relevant variables that would provide baseline information prior to policy changes and assist in the evaluation of future, and unknown, policy changes.
Design The design of the HILDA Survey owes much to
other household panel studies conducted elsewhere in the world, and especially the German Socio-Economic Panel (GSOEP) and the British Household Panel Survey (BHPS) (Haisken-DeNew, 2001; Frick, Jenkins, Lillard, Lipps & Wooden, 2007). Indeed, the winning tender was built on the assumption that the most cost-effective approach, especially given tight timelines, a limited budget and a risk-averse client, was to mimic practices adopted by existing long-running, and thus successful, household panel studies. Thus, like these studies, the HILDA Survey:
i. commenced with a population sample that was intended to be broadly representative of the national population resident in private households;
ii. conducts survey waves on an annual basis; iii. follows members of the original sample
households and their offspring for an indefinite life;
iv. interviews all ‘adult’ members of the household; and
v. augments the sample in later waves with persons who join a sample household. It is also common for these studies to
introduce new representative samples over time. The GSOEP, for example, has added new representative samples on three occasions since starting in 1984. In this vein the HILDA Survey now has two population samples – the original sample, which commenced in 2001, and a top-up sample that was introduced in 2011.
Reflecting the parallels with its predecessors, in 2007 the HILDA Survey became the 5th member of the Cross-National Equivalence File, which provides harmonised data from comparable nationally representative household panel surveys (Frick et al., 2007). Of course, no two studies are identical. There are many important differences in design across studies, including, for example, the extent of reliance on different survey modes, the use of incentives, and the rules adopted for determining when to re-issue non-responding cases (Watson & Wooden, 2011).
Reference population
The reference population for the initial sample was, with only minor exceptions, all persons residing in private dwellings in Australia in 2001. The exceptions were diplomatic personnel of overseas governments, overseas residents (who intend staying in Australia for less than one year), members of non-Australian defence forces (and their dependents) stationed in Australia, and people living in the most remote and sparsely populated parts of Australia. An essentially identical reference population was used for the wave 11 top-up, but with the obvious difference that all persons had to be residing in private dwellings in Australia in 2011.
Nicole Watson, Mark Wooden The HILDA Survey: a case study in design and development
371
The sampling unit
The sampling unit is the household, defined as ‘a group of people who usually reside and eat together’. Persons who usually lived in the household but were temporarily absent for work, school or other purposes were treated as part of the household, meaning that a small proportion of interviews had to be conducted at locations other than the household address. Persons who live in more than one household were only treated as members of the household where they spent most of their time. Visitors to the household were not treated as part of the household.
Sample selection
The initial sample of households was selected, in 2001, using a multi-stage approach. First, a sample of 488 Census Collection Districts (CDs) was selected from across Australia (each of which consists of approximately 200 to 250 households). To ensure the sample provided adequate coverage of all parts of Australia, the frame of CDs was stratified by State, and within the five most populous States, by metropolitan and non-metropolitan regions. The CDs were sampled with a probability proportional to their size, as measured by the number of dwellings recorded in each CD at the 1996 Census. Second, within each of these CDs, a sample of 22 to 34 dwellings was selected, the precise number depending on the expected response and occupancy rates of the area. The selections were made after all dwellings within each of the CDs were fully enumerated. Finally, within each dwelling, up to three households were selected to be part of the sample. This process resulted in a total of 12,252 addresses being issued to field, though 804 of these addresses were subsequently discovered during the fieldwork to be out of scope (because the dwelling was vacant, not a primary private residence, or all of the occupants did not meet the selection criteria).
The process for selecting the top-up sample for wave 11 was very similar, but with 125 CDs selected (and based on 2006 Census boundaries). A total of 3250 addresses were issued to field. After the removal of addresses determined to be out of scope and adjusting for addresses with multiple households, the initial sample numbered 3117 households.
Following rules
All members of households where at least one person provided an interview in the initial wave form the basis of the panel to be pursued in each subsequent wave. In addition, the sample is gradually extended to include any new household members resulting from changes in the composition of the original households. All children born to, or adopted by, an original sample member become permanent or continuing sample members. Most other persons only remain in the sample for as long as they remain living in a household with a continuing sample member. There are, however, two exceptions to this practice. First, any person who has a child with a continuing sample member is converted to continuing sample member status. Second, from wave 9, new household members who arrived in Australia for the first time after 2001, were also added to the sample on a continuing basis.
Note that while original sample members had to be residents of private households, in subsequent survey waves, sample members are followed to wherever they move, including into institutions. Interviews, however, are not conducted with persons found to be in prison or living overseas.
Survey content Like other major household panel surveys, the
data collected during the HILDA Survey are almost entirely self-reported, and the coverage is both extremely broad and includes topics that are included in every survey wave, and others that appear less frequently. Below, we provide brief summaries of the survey instruments that are used to collect the data. For further information, including paper versions of all the instruments used in every survey wave, readers should consult the HILDA Survey web site at: http://melbourneinstitute.com/hilda/doc/questionnaires
Annual content: interview components
The main survey instruments were designed to be administered in a personal interview, usually conducted at the home of the respondent. Further, this interview content involved both an individual component, administered to all household members aged 15 years and over, and a shorter

Nicole Watson, Mark Wooden The HILDA Survey: a case study in design and development
372
household component administered to just one person in the household.
The household component comprises two separate instruments – the Household Form (HF) and the Household Questionnaire (HQ). The HF is designed to record and verify basic information about the composition of the household immediately after making contact. The HQ collects information about the household rather than about individual household members, and is only administered to one member of the household, though interviewers are given the flexibility to deliver part of this interview to one household member and part to another. In each wave, the HQ contains questions about childcare arrangements, housing, and housing wealth. A very small number of questions about household expenditure (on groceries, food and drink, and meals out) are also included.
The individual interview component involves the administration of either the Continuing Person Questionnaire (CPQ) or the New Person Questionnaire (NPQ). The CPQ is administered to every individual who has responded in a previous wave. The ‘core’ topics included every year are:
Education – collects details about any study undertaken since the last interview.
Employment status – determines employment status using the labour force framework recommended by the International Labour Organization.
Current employment – collects details about any current employment including, for example, usual hours worked, work schedule, occupation, industry of employer, contractual status, and workplace and firm size. Subjective data about job satisfaction and perceived probability of changing jobs are also collected. For persons that leave a job between interview waves, data are also collected on the reason for ceasing that job.
Persons not in paid employment – administered to persons not currently employed, this section collects data on recent job search activity, reasons for not looking for work, retirement, and details of any previous job held since the last interview. It is also used to determine unemployment status.
Other labour market activity – the centerpiece of this section is a calendar which records labour market status and educational
attendance for a period extending from 1 July in the year prior to the survey wave, up until the date of interview. Additional information is also collected about government-imposed jobseeker requirements, work-related training (since wave 3) and days of leave from paid work (since wave 5).
Income – collects detailed information about income by source for the preceding financial year (year ended 30 June) as well as current income information for wages and salaries and government pensions and benefits.
Family formation – records details about any children. Special emphasis is given to the role of absent parents and the amount of contact with, and support given to, non-resident children.
Partnering and relationships – records information about changes in marital status, co-residential relationships and changes in those relationships, and marriage expectations.
Living in Australia – includes short sequences of questions on topics that do not fit easily anywhere else in the survey instruments. Included here are disability, life satisfaction, residential mobility, and since wave 5, caring responsibilities.
Tracking information – records contact details that could be used to help locate the respondent in the future.
Interview situation – records interviewer observations about the interview (e.g., the presence of adults during the interview, how cooperative the respondent was, and whether the respondent needed any assistance to complete the interview). The NPQ has the same format but in addition
collects information about respondents’ background. Included here are country of birth and language, visa status and migration category (if born overseas), educational attainment, employment history, marital history, family background and parents’ characteristics.
Rotating content: interview components
Each wave of the HILDA Survey now includes at least one major topic, typically taking around 10 minutes of interview time per person, which is repeated every four years. These topics are as follows:
Nicole Watson, Mark Wooden The HILDA Survey: a case study in design and development
373
Household wealth – conducted in waves 2, 6 and 10, this module seeks to provide estimates of total household wealth disaggregated by type of asset and liability (Headey, Marks & Wooden, 2005).
Family formation and fertility – conducted in waves 5, 8 and 11 (but thereafter to be moved on to a 4-year cycle), in this module, additional information about family formation is collected that is not collected on an annual basis. This includes questions on issues such as: recent pregnancies and whether they were intended; use and method of contraception; factors influencing fertility decisions; and return to work following childbirth.
Retirement from the workforce – conducted in waves 3, 7 and 11, this module is restricted to persons aged 45 years or older and focuses on retirement intentions and decisions, the transition into retirement, expectations about life post-retirement, and the retirement experience.
Health – introduced for the first time in wave 9, this module includes questions on: expectations about health; difficulties caused by health conditions and disabilities; serious illness conditions; retrospective childhood health; private health insurance; use of healthcare services; diet; and the health status of, and use of health care services by, children in the household.
Education, skills and abilities – while detailed information about educational attainment is collected every year, relatively little information is collected about cognitive skills and abilities. This module, included for the first time in wave 12, will redress this deficiency. It includes questions on English language and mathematical abilities as well as three short tests of cognitive ability. Also collected is information about the schooling experiences of children in the household, as well as additional information about the education experience of respondents (e.g., field and place of study).
In addition, there are a small number of
shorter question sequences included on a rotating basis. Included here are: job-related discrimination (included in waves 8 and 10, but next scheduled to be included in wave 14); intentions and plans
regarding mobility, education and work (included in waves 5, 8 and 11 and thereafter to be moved on to a 4-year cycle); and non-coresidential family relationships (included in waves 8 and 12).
Self-completion questionnaire
A feature of the HILDA Survey is that, like the BHPS and Understanding Society panels in the UK, all persons successfully interviewed are also asked to complete a pen-and-paper questionnaire. The instrument in the HILDA Survey, however, is much longer than that administered in the UK studies – it can take anywhere from 20 minutes to 40 minutes to complete – and hence cannot always be completed while the interviewer is in the household.
This self-completion questionnaire (SCQ) consists mainly of questions which are difficult to administer in a time-effective manner in a personal interview, or which respondents may feel slightly uncomfortable answering in a face-to-face interview. The types of topics covered each year include: health status (the SF36 health survey); lifestyle behaviours and outcomes, such as smoking, exercise, alcohol consumption and height and weight; relationship satisfaction; social interaction and support; time use; life events; financial stress; and work-family balance. Other topics appear on a less frequent basis, examples of which include: psychological distress (Kessler 10); religion; neighbourhood characteristics; participation in community activities; and personality traits. In wave 5 the length of the SCQ was expanded from 16 to 20 pages, enabling the inclusion of an inventory of items measuring household expenditure.
Data collection Survey mode and interview length
The principal mode of data collection is face-to-face interviews, usually conducted at the home of the respondent. From wave 1 to wave 8 these were conducted using pen and paper methods. In wave 9 pen and paper was replaced by computer tablet consoles (see Watson 2010 for discussion of the impact of this mode change). Telephone interviews are conducted both as a last resort and to reach sample members who move to locations not covered by the network of face-to-face interviewers. The proportion of interviews
Nicole Watson, Mark Wooden The HILDA Survey: a case study in design and development
374
conducted by telephone in wave 1 was negligible, but by wave 10 was around 8%.
Interview length varies from wave to wave, but in general, the aim is to ensure that the average time spent by interviewers in a two-adult household does not exceed 83 minutes.
As already mentioned, all interviewees are also given a self-administered questionnaire to complete. This is either handed directly to the respondent by the interviewer at time of interview or, in the event of telephone interviewees, mailed out after the interview is completed. In the case of personal interviews, if respondents are unable to complete the questionnaire while the interviewer is present, then interviewers are required to make at least one more trip to the household to collect the completed forms. In instances where forms are still not complete, respondents are instructed to return the forms by post in reply-paid envelopes.
Fieldwork
Interviews are conducted on an annual basis, with the fieldwork clustered into three phases spread over the period between August and February the following year.
The data collection task is sub-contracted out to a private research organisation that specialises in survey administration. This organisation is responsible for the recruitment, training and deployment of all interviewers used on the study. In 2009, a change in sub-contractor was required, creating the potential for significant disruption to the continuity of the study. All available evidence, however, suggests this change had minimal, if any, impact on the data collection process (Watson 2010). A likely major reason for this was that a large fraction (72%) of the face-to-face interviewers that worked on the project in wave 8 were subsequently engaged by the new sub-contractor (Roy Morgan Research) to work on the project in wave 9.
Incentives
To encourage response, all households in waves 1 to 4 were paid either $20 or $50 each year they participated, with the higher amount only paid when interviews were completed with all in-scope household members. Payment was made by cheque mailed to households after interviewing was completed. For waves 5 to 8, the incentive was changed to $25 per completed personal
interview, with a $25 bonus paid to households where all in-scope household members completed the personal interview. In wave 9, the payment was increased to $30 and, more importantly, where interviews were conducted in person, the payment was made in cash at the time of interview. In wave 13 this amount will rise to $35.
Initial wave response
After adjusting for out-of-scope dwellings and households, and multiple households within dwellings, the number of households identified as in-scope in wave 1 was 11,693. Interviews were completed with all eligible members at 6,872 of these households and with at least one eligible member at a further 810 households. Within the 7,682 households at which interviews were conducted, 13,969 persons were successfully interviewed (out of a total of 15,127 eligible household members). This provides a household response rate of 66% (and an effective individual response rate of 61%).
While non-response was considerable, the characteristics of the initial sample appear to match the broader population quite well. The main exceptions to this are an under-representation of immigrants from a non-English-speaking background, and of residents of Australia’s largest city, Sydney (Wooden, Freidin & Watson, 2002).
For the top-up sample introduced in wave 11, interviews were obtained at 2,153 households out of a total of 3,117 selected households identified as in-scope, giving a household response rate of 69.1%. Within these participating households there were 4,280 persons eligible for interview, 93.7% of whom (4,009) were successfully interviewed.
Response rates for the wave 11 top-up sample were thus noticeably higher than obtained in wave 1. Given the accumulated experience of both the survey managers and interviewers, this perhaps should not be surprising. Nevertheless, it contrasts with the international experience from both repeated cross-sections (e.g., de Leeuw & de Heer, 2002) and other household panel studies. The new UK household panel study, Understanding Society, which succeeds and subsumes the BHPS, for example, only obtained a household response rate of 57.2% for its first wave, conducted during 2009 and 2010 (Buck and McFall 2012). By comparison, the equivalent response rate for wave 1 of the BHPS, conducted in 1991, was 74%. A similarly
Nicole Watson, Mark Wooden The HILDA Survey: a case study in design and development
375
marked decline in initial wave response is also evident in the successive refreshment samples that have been added to the GSOEP. For the 1998, 2000, and 2006 refreshments these were 54%, 52% and 41% respectively. By comparison, for the original West German sample, and despite the exclusion of all partially responding households, a noticeably higher response rate of 61% was reported for its first survey wave in 1984 (see Frick et al., 2007, Table 1).
Sample attrition and growth
All longitudinal surveys have to confront the problem that with each successive survey wave, some sample members are lost, either because of a failure to locate sample members who have moved, or because sample members withdraw their cooperation. For example, after 10 waves there were 20,287 persons eligible for interview in wave 11, of whom 768 are no longer issued to field because after numerous attempts they could not be located, and a further 3,829 people with whom contact is no longer attempted given previous adamant refusals or long-term irrecoverable illness. With this type of design, however, it is not inevitable that overall sample size will decline. Indeed, since wave 4, sample growth due to changing household composition has more than offset the loss coming from attrition.
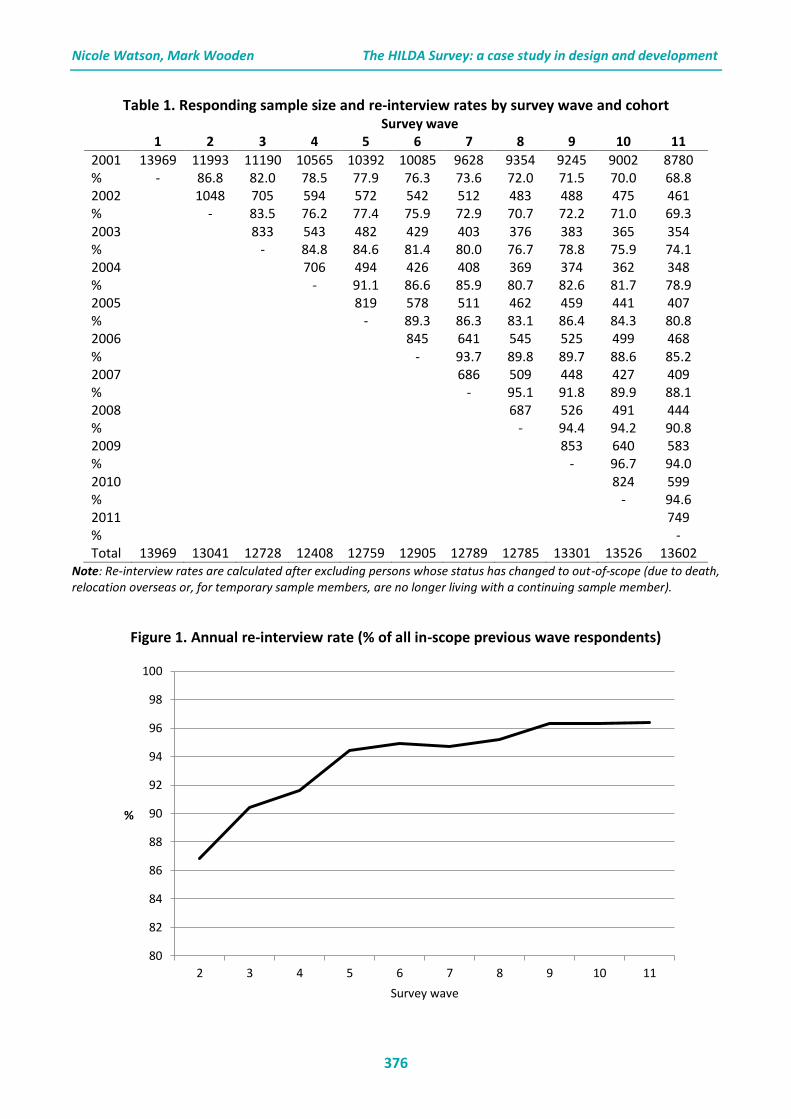
A numerical summary of the evolving sample over the first 11 survey waves (but excluding the top-up sample introduced in wave 11) is provided in Table 1. The first row of this table shows that of the 13,969 persons originally interviewed (in wave 1), 8780 were re-interviewed in wave 11. This represents a re-interview rate of 62.9%, rising to
68.8% after excluding deaths and persons known to have moved overseas on a long-term basis. The other rows in the table report comparable figures for persons joining the responding sample at later waves. Note that the gaps between the raw re-interview rates and the adjusted rates reported in the table can be quite large for these new entrants, which reflects the fact that many of these persons only remain in the sample for as long as they co-reside with a continuing sample member.
A better guide to trends in sample attrition is provided by the annual re-interview rate of previous wave respondents. This is graphed in Figure 1, and shows the annual re-interview rate rising from 87% in wave 2 to over 96% by wave 9, and remaining at that level since. While these response rates imply levels of attrition that are non-trivial, they nevertheless compare favourably with the rates achieved over the first 11 waves in other long-running panels, such as the BHPS and the SOEP (Watson and Wooden 2011).
Attrition, however, still has the potential to adversely affect the representativeness of the sample. To help address this problem, considerable effort is put into the construction of population weights that adjust for selective attrition (see below). Despite this, some biases are likely to remain in the sample. Preliminary (and unpublished) research, based on comparisons with Labour Force Survey data from the ABS, suggests that more highly educated, higher income earners are over-represented in the HILDA wave 10 sample. Such differences, however, are both small and uncertain (given differences in the way these variables are defined and measured in the HILDA Survey and by the ABS).
Nicole Watson, Mark Wooden The HILDA Survey: a case study in design and development
376
Table 1. Responding sample size and re-interview rates by survey wave and cohort Survey wave 1 2 3 4 5 6 7 8 9 10 11
2001 13969 11993 11190 10565 10392 10085 9628 9354 9245 9002 8780 % - 86.8 82.0 78.5 77.9 76.3 73.6 72.0 71.5 70.0 68.8 2002 1048 705 594 572 542 512 483 488 475 461 % - 83.5 76.2 77.4 75.9 72.9 70.7 72.2 71.0 69.3 2003 833 543 482 429 403 376 383 365 354 % - 84.8 84.6 81.4 80.0 76.7 78.8 75.9 74.1 2004 706 494 426 408 369 374 362 348 % - 91.1 86.6 85.9 80.7 82.6 81.7 78.9 2005 819 578 511 462 459 441 407 % - 89.3 86.3 83.1 86.4 84.3 80.8 2006 845 641 545 525 499 468 % - 93.7 89.8 89.7 88.6 85.2 2007 686 509 448 427 409 % - 95.1 91.8 89.9 88.1 2008 687 526 491 444 % - 94.4 94.2 90.8 2009 853 640 583 % - 96.7 94.0 2010 824 599 % - 94.6 2011 749 % - Total 13969 13041 12728 12408 12759 12905 12789 12785 13301 13526 13602
Note: Re-interview rates are calculated after excluding persons whose status has changed to out-of-scope (due to death, relocation overseas or, for temporary sample members, are no longer living with a continuing sample member).
Figure 1. Annual re-interview rate (% of all in-scope previous wave respondents)
80
82
84
86
88
90
92
94
96
98
100
2 3 4 5 6 7 8 9 10 11
%
Survey wave
Nicole Watson, Mark Wooden The HILDA Survey: a case study in design and development
377
Panel maintenance Like other panel studies, the HILDA Survey devotes considerable effort to both tracking sample members over time and encouraging participation. Contact rates in the HILDA Survey are very high, which reflects a relatively low rate of cases that cannot be found. As already noted, of the total sample eligible for interview in wave 11, just 3.8% are no longer being followed because they cannot be found. The tracking procedures employed include: (i) extensive pre-field office activity, generated by notifications of changes of contact details by sample members, returns to senders from the distribution of annual primary approach letters and mid-wave thank you gifts, and information collected at the previous wave about the likelihood of moving; (ii) seeking information about the whereabouts of the absent sample member during fieldwork from other household members, new residents, neighbours and community resources; (iii) consulting online telephone directories; and (iv) using the extensive contact information collected at the last interview (and especially the contact details of two persons not living with the sample member). In terms of maximising response once respondents are located, the most significant strategies are: (i) Use of cash incentives and other small gifts
(e.g., a thank you gift sent to respondents around Christmas).
(ii) Maintaining a highly-trained, experienced, motivated and engaged interviewer workforce, who are matched, as far as practicably possible, to responding households over time.
(iii) A three-phase fieldwork structure, which emphasises multiple call attempts and refusal conversion, and includes the use of tailored follow-up letters to sample members who are non-respondents in phase 1, and reallocation of workloads to more experienced or successful interviewers at phases 2 and 3.
(iv) Distribution of a wide variety of materials to sample members to promote interest in and engagement with the study. This includes the use of primary approach letters at each wave, annual newsletters, newspaper articles highlighting the use of HILDA Survey data, a dedicated website for sample members, and even the annual statistical report. A particularly important feature of the annual
newsletter has been short contributions from significant Australians (such as the Governor-General and the Governor of the Reserve Bank) testifying to the value of the study.
Data adjustments Weights
Weights are used to adjust for differential non-response and attrition experienced at both the household- and person-level, as well as to adjust for unequal probabilities of selection. Both cross-sectional and longitudinal weights are provided on the HILDA data files. The cross-sectional weights apply to households, enumerated persons (all individuals in responding households) and responding persons (those individuals providing an interview) in each wave. The longitudinal weights apply to balanced panels of responding persons or enumerated persons from every wave to every other wave, and for the balanced panel of any combination of a pair of waves.
The weights are calculated via a three-step process. For wave 1, the steps are as follows: i) the initial weight is calculated as the inverse of the probability of selection; ii) these initial weights are multiplied by the inverse of the probability each unit had of responding; and iii) the adjusted weights are simultaneously calibrated to known population totals (for household composition, sex and age, labour force status, marital status, and geographic distribution). From wave 2 onwards, the weighting process becomes more complicated, due to both changes in household composition and sample attrition, but essentially the same three-step process is used. The factors used to estimate non-response probabilities, however, are much expanded to include information collected in prior waves.
Users can take into account the complex sample design of the HILDA Survey when calculating standard errors for population estimates in a number of ways (Hayes, 2008). Stratification and cluster variables are provided for those using the Taylor series linearisation method (which can be undertaken in SAS, SPSS and Stata) and replicate weights are provided for those using the Jackknife method (which can be undertaken in Stata or via user-written macros).
Nicole Watson, Mark Wooden The HILDA Survey: a case study in design and development
378
Imputation
Even when a respondent provides an interview, they do not necessarily provide answers to all questions asked, resulting in item non-response. The level of item non-response in the HILDA Survey is generally quite low (usually less than 1%), but for questions seeking monetary values (such as income, wealth and expenditure) the rates are much higher. The proportion of individuals, for whom at least some of the information necessary to construct total individual income is missing, has varied between 10% and 16% across the waves. At the household level this rises to between 15% and 21%, since interviews are not always obtained with all adults residing in responding households.
The data files contain both imputed and non-imputed versions of the income, wealth and expenditure derived variables, along with an imputation flag. The imputation uses a method developed by Little and Su (1989) that incorporates (via a multiplicative model) the trend across waves, the individual’s departure from that trend, and a residual effect donated from another respondent with complete information. Suitable donors are identified from within imputation classes defined by age. Where a respondent has not provided the monetary component in at least one wave, a nearest neighbour regression method is used to impute starting values. These imputation methods were identified as preserving the best longitudinal and cross-sectional properties of the data in an evaluation study of eight commonly used, longitudinal imputation methods (Watson & Starick, 2011). As this is a single imputation method, the standard errors will be a little understated. The proportion of total individual income that is imputed is between 4% and 7%, as it can often be a small component of income that is missing. At the household level this rises to between 8% and 13%. Users can undertake their own multiple imputation procedures, but we are not aware of any having done so as yet.
Governance structures and scientific stewardship
As a government-owned study, all decisions about the design, content and administration of the HILDA Survey are subject to the approval of the funding agency, the Australian Government Department of Families, Housing, Community Services and Indigenous Affairs (FaHCSIA).
Governance structures, however, were established to ensure the study serves the interests of a much wider group of users, including both other government agencies and the broader academic research community.
The Director of the HILDA Survey has thus been required to report regularly to an advisory group convened by FaHCSIA, but comprising representatives from all of the major government departments and agencies in Australia with an interest in economic and social policy. This group is most important in identifying emerging concerns among policy-makers that the HILDA Survey may be in a position to address. In addition, the Melbourne Institute established two further reference groups, one comprising representatives from the academic research community, to mainly provide advice about survey content, and the other, comprising persons with high level expertise in survey statistics, to provide advice about methodological issues.
Data access A confidentialised, unit-record data file is
available, under licence, to bona fide researchers in academia, government and other selected research organisations. To access the data an application must be submitted to FaHCSIA using application forms that can be downloaded from the HILDA Survey website at: http://melbourneinstitute.com/hilda/data/. All applicants must agree to terms and conditions of use, which include keeping all unit record data secure, not attempting to identify or disclose the identities of any respondents, and not performing any matching, sharing, merging or linkage with any other individual-level datasets without prior written consent from FaHCSIA. Decisions about who can access the data are solely at the discretion of FaHCSIA. The key differences between the confidentialised and non-confidentialised versions of the data are the withholding of some variables (notably postcode and precise date of birth), the aggregation of some variables (such as occupation and industry), and the top-coding of some variables (such as income and wealth variables).
Interested persons can apply either through an organisation licence (many Australian universities and government agencies have such a licence) or as an individual. There is a nominal charge to obtain the data (currently AU$121 for overseas-based
Nicole Watson, Mark Wooden The HILDA Survey: a case study in design and development
379
users). The data files are supplied on DVD and are provided in SAS, SPSS and STATA formats. Also provided on the DVD is extensive documentation, including coding frameworks, marked-up questionnaires, variable frequencies and the key reference source, the user manual. The data are released on an annual basis in early December each year, but each release includes all unit record data from the previous waves.
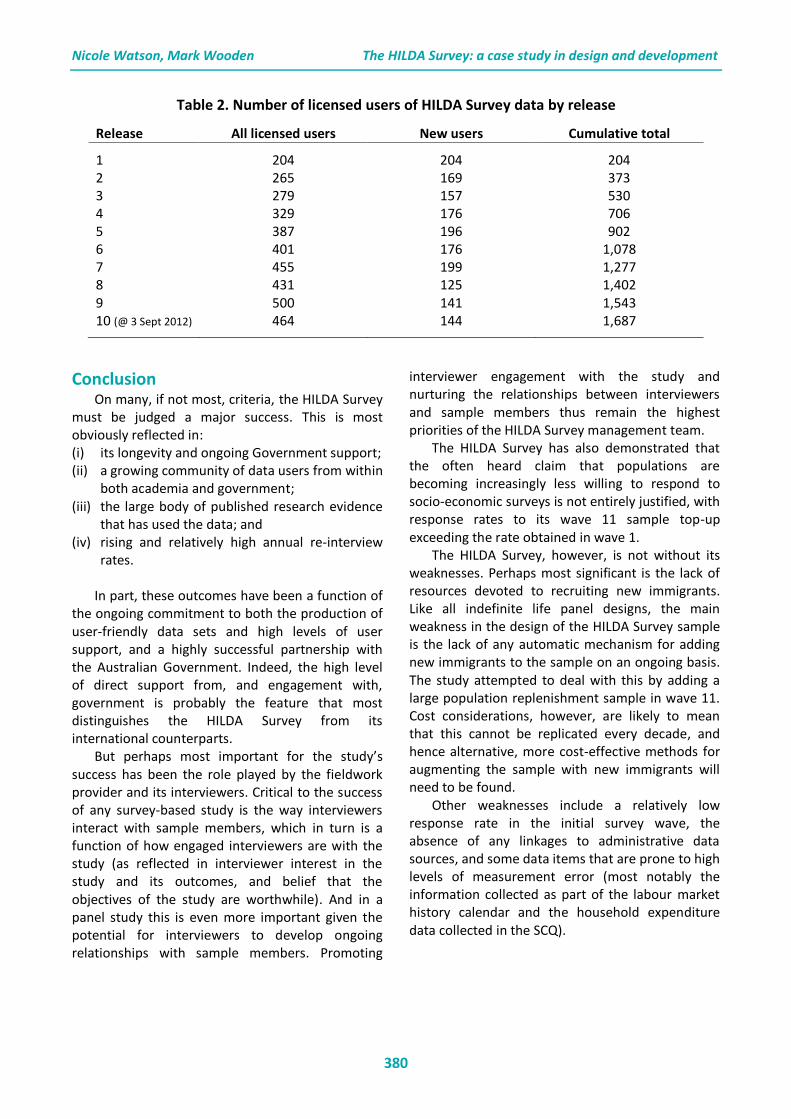
Data use and outputs As shown in Table 2, the number of licensed
users of each annual release is now around 500, with the cumulative number of users over the first ten releases (covering the first ten waves of data collection and spanning the period 2001 to 2010) numbering almost 1700.
Not surprisingly, given the size of this community of users, the HILDA Survey data has already spawned a large number of outputs. An attempt at tracking these outputs is maintained on the HILDA Survey website in the form of a bibliography. As at September 2012, this bibliography contained details of some 370 academic journal articles, seven books, 17 chapters in books, and more than 170 reports and other difficult-to-classify publications.
A key feature of this body of research is its breadth, spanning virtually the entirety of the social sciences. Examples of just a select few of the many varied topics covered include: poverty dynamics (Buddelmeyer & Verick, 2008); gender wage inequality (Barón & Cobb-Clark, 2010); transitions in and out of non-standard employment (Buddelmeyer & Wooden, 2011); the changing relationship between cohabitation and divorce (Hewitt & de Vaus, 2009); the association between income inequality and mental health (Bechtel, Lordan & Prasada Rao, 2012); and the adaptation of subjective well-being to major life events (Frijters, Johnston & Shields, 2011). Numerous researchers have also used the data to evaluate specific policy initiatives. Examples include the impact of:
Australia’s Baby Bonus payments on fertility behaviour (Drago, Sawyer, Seffler, Warren & Wooden, 2011); smoking bans on smoking behavior (Buddelmeyer & Wilkins, 2011); public housing assistance on employment outcomes of labour market program participants (Feeny, Ong, Spong & Wood, 2012); and family benefits payments and child care subsidies on couples’ labour supply (Guest & Parr, forthcoming).
The data have also been well used by government, with government employees accounting for 36% of all HILDA Survey data users. Demonstrating a direct impact on policy, however, is more difficult, in part because rarely are policy interventions or changes in policy the result of any single piece of evidence, and in part because much of the use being made of the HILDA Survey data by government happens behind closed doors and so often not available for public scrutiny. We do, however, know that the data have featured prominently in numerous reports published, and inquiries conducted, by the Productivity Commission, Australia’s key government agency with a research and advisory role in the area of economic and social policy, covering such issues as paid parental leave, disability care, and the use of labour hire employment. The data on household wealth have also been much used by the Reserve Bank of Australia to assess the amount of risk that households are prepared to accept, and have featured frequently in the Bank’s quarterly financial stability reviews. The HILDA Survey data have also figured prominently in submissions to successive Annual Wage Reviews, with the findings from the data analysis highlighted in the decisions handed down by Fair Work Australia in 2011 and 2012. Finally, the data have been much used by the host agency, now the Department of Families, Housing, Community Services and Indigenous Affairs, and have been central to numerous reports, both in-house and commissioned, and in a number of key reviews, and notably the Pension Review (Harmer 2009).
Nicole Watson, Mark Wooden The HILDA Survey: a case study in design and development
380
Table 2. Number of licensed users of HILDA Survey data by release
Release All licensed users New users Cumulative total
1 204 204 204 2 265 169 373 3 279 157 530 4 329 176 706 5 387 196 902 6 401 176 1,078 7 455 199 1,277 8 431 125 1,402 9 500 141 1,543 10 (@ 3 Sept 2012) 464 144 1,687
Conclusion On many, if not most, criteria, the HILDA Survey
must be judged a major success. This is most obviously reflected in: (i) its longevity and ongoing Government support; (ii) a growing community of data users from within
both academia and government; (iii) the large body of published research evidence
that has used the data; and (iv) rising and relatively high annual re-interview
rates. In part, these outcomes have been a function of
the ongoing commitment to both the production of user-friendly data sets and high levels of user support, and a highly successful partnership with the Australian Government. Indeed, the high level of direct support from, and engagement with, government is probably the feature that most distinguishes the HILDA Survey from its international counterparts.
But perhaps most important for the study’s success has been the role played by the fieldwork provider and its interviewers. Critical to the success of any survey-based study is the way interviewers interact with sample members, which in turn is a function of how engaged interviewers are with the study (as reflected in interviewer interest in the study and its outcomes, and belief that the objectives of the study are worthwhile). And in a panel study this is even more important given the potential for interviewers to develop ongoing relationships with sample members. Promoting
interviewer engagement with the study and nurturing the relationships between interviewers and sample members thus remain the highest priorities of the HILDA Survey management team.
The HILDA Survey has also demonstrated that the often heard claim that populations are becoming increasingly less willing to respond to socio-economic surveys is not entirely justified, with response rates to its wave 11 sample top-up exceeding the rate obtained in wave 1.
The HILDA Survey, however, is not without its weaknesses. Perhaps most significant is the lack of resources devoted to recruiting new immigrants. Like all indefinite life panel designs, the main weakness in the design of the HILDA Survey sample is the lack of any automatic mechanism for adding new immigrants to the sample on an ongoing basis. The study attempted to deal with this by adding a large population replenishment sample in wave 11. Cost considerations, however, are likely to mean that this cannot be replicated every decade, and hence alternative, more cost-effective methods for augmenting the sample with new immigrants will need to be found.
Other weaknesses include a relatively low response rate in the initial survey wave, the absence of any linkages to administrative data sources, and some data items that are prone to high levels of measurement error (most notably the information collected as part of the labour market history calendar and the household expenditure data collected in the SCQ).
Nicole Watson, Mark Wooden The HILDA Survey: a case study in design and development
381
Acknowledgements The HILDA Survey project was initiated and is funded by the Australian Government Department of Families, Housing, Community Services and Indigenous Affairs and is managed by the Melbourne Institute of Applied Economic and Social Research.
References Barón, J.D., & Cobb-Clark, D. (2010). Occupational segregation and the gender wage gap in private- and
public-sector employment: A distributional analysis. The Economic Record, 86, 227-246. Bechtel, L., Lordan, G., & Prasada Rao, D.S. (2012). Income inequality and mental health: empirical evidence
from Australia. Health Economics, 21, 4-17. Buck, N., & McFall, S. (2012). Understanding Society: design overview. Longitudinal and Life Course Studies,
3, 5-17. Buddelmeyer, H., & Verick, S. (2008). Understanding the drivers of poverty dynamics in Australian
households. The Economic Record, 84, 310-321. Buddelmeyer, H., & Wilkins, R. (2011). Effects of tightening smoking regulations on take-up and cessation of
smoking. Australian Economic Review, 44, 167-181. Buddelmeyer, H., & Wooden, M. (2011). Transitions out of casual employment: the Australian experience.
Industrial Relations, 50, 109-130. de Leeuw, E., & de Heer, W. (2002). Trends in household survey nonresponse: a longitudinal and
international comparison. In R.M. Groves, D.A. Dillman, J.L. Eltinge & R.J.A. Little (Eds.), Survey Nonresponse (pp. 41-54). New York: John Wiley and Sons.
Drago, R., Sawyer, K., Sheffler, K., Warren, D. & Wooden, M. (2011). Did Australia’s Baby Bonus increase fertility intentions and births? Population Research and Policy Review, 30, 381-397.
Feeny, S., Ong, R., Spong, H., & Wood, G. (2012). The impact of housing assistance on the employment outcomes of labour market programme participants. Urban Studies, 49, 821-844.
Frick, J.R., Jenkins, S.P., Lillard, D.R., Lipps, O., & Wooden, M. (2007). The Cross-National Equivalent File (CNEF) and its member country household panel studies. Schmollers Jahrbuch: Journal of Applied Social Science Studies, 127, 627-654.
Frijters, P., Johnston, D.W. & Shields, M.A. (2011). Life satisfaction dynamics with quarterly life event data. Scandinavian Journal of Economics, 113, 190-211.
Guest, R., & Parr, N. (forthcoming). Family policy and couples’ labour supply: an empirical assessment. Journal of Population Economics.
Harmer, J. (2009). Pension Review Report, 27 February 2009. Canberra: Department of Families, Housing, Community Services and Indigenous Affairs.
Haisken-DeNew, J.P. (2001). A hitchhiker’s guide to the world’s household panel data sets. Australian Economic Review, 34, 356-366.
Hayes, C. (2008). HILDA standard errors: user guide. HILDA Project Technical Paper Series no. 2/08. Melbourne: Institute of Applied Economic and Social Research, University of Melbourne.
Headey, B., Marks, G., & Wooden, M. (2005). The structure and distribution of household wealth in Australia. Australian Economic Review, 38, 159-175.
Hewitt, B., & de Vaus, D. (2009). Change in the association between premarital cohabitation and separation, Australia 1945-2000. Journal of Marriage and Family, 71, 353-361.
Little, R.J.A., & Su, H.L. (1989). Item non-response in panel surveys. In D. Kasprzyk, G.J. Duncan, G. Kalton, & M.P. Singh. (Eds.), Panel Surveys (pp. 400-425). New York: John Wiley and Sons.
Watson, N. (2010). The impact of the transition to CAPI and a new fieldwork provider on the HILDA Survey. HILDA Survey Discussion Paper no. 2/10. Melbourne: Institute of Applied Economic and Social Research, University of Melbourne.
Watson, N., & Starick, R. (2011). Evaluation of alternative income imputation methods for a longitudinal survey. Journal of Official Statistics, 27, 693-715.
Watson, N., & Wooden, M. (2011). Re-engaging with survey non-respondents: the BHPS, SOEP and HILDA Survey experience. Melbourne Institute Working Paper Series no. 2/11. Melbourne: Institute of Applied Economic and Social Research, University of Melbourne.
Wooden, M., Freidin, S., & Watson, N. (2002). The Household, Income and Labour Dynamics in Australia (HILDA) Survey: wave 1. The Australian Economic Review, 35, 339-348.