The heterogeneity of the left dorsal premotor cortex ...
28
The heterogeneity of the left dorsal premotor cortex evidenced by multimodal connectivity-based parcellation and functional characterization Sarah Genon a,* , Andrew Reid g , Hai Li e,f , Lingzhong Fan e,f , Veronika I. Müller a,c , Edna C. Cieslik a,c , Felix Hoffstaedter a , Robert Langner a,c , Christian Grefkes b,d , Angela R. Laird h , Peter T. Fox i , Tianzi Jiang e,f , Katrin Amunts a,j , and Simon B. Eickhoff a,c a Institute of Neuroscience and Medicine (INM-1), Research Centre Jülich, Germany b Institute of Neuroscience and Medicine (INM-3), Research Centre Jülich, Germany c Institute of Systems Neuroscience, Medical Faculty, Heinrich-Heine University Düsseldorf, Germany d Department of Neurology, Cologne University Hospital, Cologne, Germany e Brainnetome Center, Institute of Automation, Chinese Academy of Sciences, Beijing 100190, China f National Laboratory of Pattern Recognition, Institute of Automation, Chinese Academy of Sciences, Beijing 100190, China g Department of Artificial Intelligence, Donders Centre for Cognition, Radboud University Nijmegen, The Netherlands h Neuroinformatics and Brain Connectivity Lab, Miami, Florida, USA i Research Imaging Institute, University of Texas Health Science Center at San Antonio, TX, USA j C. and O. Vogt Institute for Brain Research, Heinrich-Heine-University Düsseldorf, Düsseldorf, Germany Abstract Despite the common conception of the dorsal premotor cortex (PMd) as a single brain region, its diverse connectivity profiles and behavioral heterogeneity argue for a differentiated organization of the PMd. A previous study revealed that the right PMd is characterized by a rostro-caudal and a ventro-dorsal distinction dividing it into five subregions: rostral, central, caudal, ventral and dorsal. The present study assessed whether a similar organization is present in the left hemisphere, by capitalizing on a multimodal data-driven approach combining connectivity-based parcellation (CBP) based on meta-analytic modeling, resting-state functional connectivity, and probabilistic diffusion tractography. The resulting PMd modules were then characterized based on multimodal functional connectivity and a quantitative analysis of associated behavioral functions. Analyzing the clusters consistent across all modalities revealed an organization of the left PMd that mirrored its right counterpart to a large degree. Again, caudal, central and rostral modules reflected a cognitive- motor gradient and a premotor eye-field was found in the ventral part of the left PMd. In addition, a distinct module linked to abstract cognitive functions was observed in the rostro- Correspondence to: Institut für Neurowissenschaften und Medizin (INM-1), Forschungszentrum Jülich GmbH, D-52425 Jülich, Germany. [email protected]. Publisher's Disclaimer: This is a PDF file of an unedited manuscript that has been accepted for publication. As a service to our customers we are providing this early version of the manuscript. The manuscript will undergo copyediting, typesetting, and review of the resulting proof before it is published in its final citable form. Please note that during the production process errors may be discovered which could affect the content, and all legal disclaimers that apply to the journal pertain. HHS Public Access Author manuscript Neuroimage. Author manuscript; available in PMC 2019 April 15. Published in final edited form as: Neuroimage. 2018 April 15; 170: 400–411. doi:10.1016/j.neuroimage.2017.02.034. Author Manuscript Author Manuscript Author Manuscript Author Manuscript brought to you by CORE View metadata, citation and similar papers at core.ac.uk provided by Repository@Nottingham
Transcript of The heterogeneity of the left dorsal premotor cortex ...

The heterogeneity of the left dorsal premotor cortex evidenced by multimodal connectivity-based parcellation and functional characterization
Sarah Genona,*, Andrew Reidg, Hai Lie,f, Lingzhong Fane,f, Veronika I. Müllera,c, Edna C. Cieslika,c, Felix Hoffstaedtera, Robert Langnera,c, Christian Grefkesb,d, Angela R. Lairdh, Peter T. Foxi, Tianzi Jiange,f, Katrin Amuntsa,j, and Simon B. Eickhoffa,c
aInstitute of Neuroscience and Medicine (INM-1), Research Centre Jülich, Germany bInstitute of Neuroscience and Medicine (INM-3), Research Centre Jülich, Germany cInstitute of Systems Neuroscience, Medical Faculty, Heinrich-Heine University Düsseldorf, Germany dDepartment of Neurology, Cologne University Hospital, Cologne, Germany eBrainnetome Center, Institute of Automation, Chinese Academy of Sciences, Beijing 100190, China fNational Laboratory of Pattern Recognition, Institute of Automation, Chinese Academy of Sciences, Beijing 100190, China gDepartment of Artificial Intelligence, Donders Centre for Cognition, Radboud University Nijmegen, The Netherlands hNeuroinformatics and Brain Connectivity Lab, Miami, Florida, USA iResearch Imaging Institute, University of Texas Health Science Center at San Antonio, TX, USA jC. and O. Vogt Institute for Brain Research, Heinrich-Heine-University Düsseldorf, Düsseldorf, Germany
Abstract
Despite the common conception of the dorsal premotor cortex (PMd) as a single brain region, its
diverse connectivity profiles and behavioral heterogeneity argue for a differentiated organization
of the PMd. A previous study revealed that the right PMd is characterized by a rostro-caudal and a
ventro-dorsal distinction dividing it into five subregions: rostral, central, caudal, ventral and dorsal.
The present study assessed whether a similar organization is present in the left hemisphere, by
capitalizing on a multimodal data-driven approach combining connectivity-based parcellation
(CBP) based on meta-analytic modeling, resting-state functional connectivity, and probabilistic
diffusion tractography. The resulting PMd modules were then characterized based on multimodal
functional connectivity and a quantitative analysis of associated behavioral functions. Analyzing
the clusters consistent across all modalities revealed an organization of the left PMd that mirrored
its right counterpart to a large degree. Again, caudal, central and rostral modules reflected a
cognitive- motor gradient and a premotor eye-field was found in the ventral part of the left PMd.
In addition, a distinct module linked to abstract cognitive functions was observed in the rostro-
Correspondence to: Institut für Neurowissenschaften und Medizin (INM-1), Forschungszentrum Jülich GmbH, D-52425 Jülich, Germany. [email protected].
Publisher's Disclaimer: This is a PDF file of an unedited manuscript that has been accepted for publication. As a service to our customers we are providing this early version of the manuscript. The manuscript will undergo copyediting, typesetting, and review of the resulting proof before it is published in its final citable form. Please note that during the production process errors may be discovered which could affect the content, and all legal disclaimers that apply to the journal pertain.
HHS Public AccessAuthor manuscriptNeuroimage. Author manuscript; available in PMC 2019 April 15.
Published in final edited form as:Neuroimage. 2018 April 15; 170: 400–411. doi:10.1016/j.neuroimage.2017.02.034.
Author M
anuscriptA
uthor Manuscript
Author M
anuscriptA
uthor Manuscript
brought to you by COREView metadata, citation and similar papers at core.ac.uk
provided by Repository@Nottingham

ventral left PMd across all CBP modalities, implying greater differentiation of higher cognitive
functions for the left than the right PMd.
Keywords
Precentral gyrus; eye-field; meta-analytic connectivity modeling; probabilistic diffusion tractography; fMRI
I. Introduction
The dorsal premotor cortex (PMd) constitutes a transitional region between the primary
motor and prefrontal cortex (Geyer et al. 2000), encompassing the dorsal portion of the
precentral gyrus. While the PMd is usually referred to as a single brain region corresponding
to Brodmann area 6, its diverse connectivity profile and the heterogeneity of functions
attributed to this region argue for functional and anatomical diversity within it (Boussaoud
2001; Picard and Strick 2001; Hoshi and Tanji 2007; Abe and Hanakawa 2009; Hanakawa
2011). Such diversity extends that of the lateral prefrontal cortex, which is organized along
different axes (including the rostro-caudal; Badre 2008; Badre and D’Esposito 2009; Cieslik
et al. 2013; Bahlmann et al. 2015)). Consistent with this view, a parcellation of the
precentral gyrus based on probabilistic diffusion tractography (PDT-CBP) suggested that the
dorsal part of the precentral gyrus, roughly corresponding to the functional PMd, can be
further subdivided into a superior and an inferior portion (Schubotz et al. 2010). Thus,
several lines of evidence converge to suggest that the PMd is not a uniform functional
region, but rather a functional and/or an anatomical mosaic.
In a previous study, we investigated this issue in the right hemisphere (Genon et al. 2016)
using connectivity-based parcellation (CBP) based on meta-analytic connectivity modeling
(MACM-CBP; (Eickhoff et al. 2011)), resting-state functional connectivity (RSFC-CBP;
(Yeo et al. 2011a)) and probabilistic diffusion tractography (PDT-CBP; (Behrens et al.
2003b)). Across modalities, we found a convergent subdivision of the right PMd into five
modules organized along a rostro-caudal axis and a ventro-dorsal axis (Genon et al., 2016).
Functional characterization of the defined subregions revealed that the rostral-caudal
organization formed by the rostral, central and caudal subregions reflected a cognitive-motor
gradient. The rostral subregion was associated with higher-order functions and connected to
the prefrontal cortex, the central subregion showed a mixed pattern and connections to the
parietal lobe, while the caudal subregion was related to motor functions and connected to the
sensorimotor network. In turn, the dorsal subregion was related to both cognitive and motor
aspects of sequencing and timing while the ventral subregion showed a functional profile
implicating it as a “premotor eye field” (Genon et al. 2016).
It remains an open question to what extent the organization of the left hemisphere mirrors
the organization of the right hemisphere. According to previous whole brain parcellations,
the left hemisphere showed a similar rostro-caudal organization to the right one, reflecting a
general cognitive-motor gradient (Orban et al. 2015). There is also evidence that the frontal
eye-fields should be similarly located in the ventral part of the PMd in both hemispheres
(Amiez and Petrides 2009). However, the left hemisphere is known to be more functionally
Genon et al. Page 2
Neuroimage. Author manuscript; available in PMC 2019 April 15.
Author M
anuscriptA
uthor Manuscript
Author M
anuscriptA
uthor Manuscript

dominated by language functions (such as speech preparation and execution, e.g. (Kell et al.
2010)) than the right hemisphere and, in turn, less engaged in visuospatial processes (e.g.
(De Schotten et al. 2011)) with such functional asymmetry including the PMd (Wager et al.
2004). Moreover, the left premotor cortex has been demonstrated to have a more pronounced
engagement in bimanual coordination, motor learning (Hardwick et al., 2014) and mental
calculations (Hanakawa 2011). Relatedly, eye movements and right hand movement are
usually executed in unison (Kantak et al. 2012), possibly rendering the functional interaction
within the left PMd more complex than in the right PMd. Based on these findings, we
expected the functional organization of the left PMd to be different from the one previously
demonstrated for the right PMd (Genon et al., 2016). In particular, we predicted that the
functional segregation of eye-field functions and visuo-spatial integration would be less
prominent in the left PMd, while language functions would be represented by a specific
subregion in the left PMd. Supporting this possibility, Glasser at al. (2016) have recently
proposed a “new” language subregion termed “area 55b” in the inferior portion of both the
left and right PMd. In our previous study, however, we did not find evidence of such a
language subregion in the right PMd, highlighting the possibility that this subregion is
specific to the left hemisphere. Importantly, previous functional studies have, albeit often
indirectly, already suggested a different organization of the left and right PMd. For example,
when examining activations of cognitive functions attributed to the PMd with a meta-
analytic approach, Hanakawa (2011) concluded: “The right rostral premotor cortex was located 3–6 mm rostral to the left rostral premotor cortex consistently across different task sets” In the same line, previous whole-brain parcellations based on RSFC-CBP revealed
slightly different patterns for the left and right PMd ((Yeo et al. 2011b; Laumann et al. 2015)
see Supplementary Material). Nevertheless, such asymmetries may be related to peculiarities
of functional imaging and resting-state modeling. Hence, a multi-modal approach is
necessary to examine the presence of potentially subtle differences in the neurobiological
organization of the left PMd.
We here used CBP (Eickhoff et al. 2015) in order to provide a robust picture of the
organization of the left PMd. First, we investigated evidence for a topographical organization
that is “modality independent” by employing three different connectivity modalities:
MACM, RSFC and PDT. MACM is a functional connectivity approach that capitalizes on
the robust profile of co-activations of the brain voxels across a wide range of task-based
fMRI and PET studies (Eickhoff et al. 2011). That is, MACM reveals how voxels interact, or
are organized, to support a behavioral task (in an fMRI or a PET scanner). It thus provides
clustering of voxels that is more “behaviorally meaningful” than other CBP approaches, but
it comes with the limitation that the clustering might be driven by epiphenomena and
peculiarities of task-based neuroimaging experiments such as a dominance of right-hand
responses. Furthermore, as MACM is based on a meta-analytic approach, it is subject to the
possibility of a publication bias (Rothstein et al. 2006). In turn, RSFC provides a clustering
that is driven by the behaviorally unconstrained functional connectivity pattern of the voxels
(Foster et al. 2016). Notably, the effect of noise and non-neuronal signals in RSFC is still an
open issue (e.g. (Birn 2012; Murphy et al. 2013)) and therefore spurious correlations may
influence the clustering patterns of voxels based on RSFC. Importantly, as both MACM and
RSFC are correlative approaches, functional connectivity profiles may be indirect (e.g.
Genon et al. Page 3
Neuroimage. Author manuscript; available in PMC 2019 April 15.
Author M
anuscriptA
uthor Manuscript
Author M
anuscriptA
uthor Manuscript

driven by a third region). PDT suffers less from these limitations as it estimates structural
connectivity based on diffusion data (Behrens et al. 2003b). Therefore, PDT brings into
account the structural constraints of brain networks. However, despite substantial
developments in PDT methods over the last years, the pattern revealed by this approach is
still sensitive to technical limitations such as gyral bias and questionable validity in
estimating long-distance connection (Van Essen et al. 2013). In summary, RSFC-CBP
reveals an unconstrained functional organization of the voxels, MACM-CBP reveals a
behavior-driven organization of the voxels, and PDT-CBP reveals a structural organization of
the voxels. Each connectivity approach has its own advantages and limitations, rendering
them complementary and making their integration a powerful tool for characterizing brain
organization. This issue is particularly relevant when addressing the organization of a brain
region as complex as the left PMd (cfr. Figure S1).
By capitalizing on the complementarity of these connectivity modalities, the present study
investigated subdivisions of the left PMd in a data-driven and multimodal manner. In
addition, the current work capitalized on several recent developments in the field as
compared to earlier work. First, MACM-CBP was performed on a higher number of
available experiments in the Brainmap database. Second, RSFC-CBP and PDT-CBP were
performed on a large, publicly available dataset of healthy adult subjects (enhanced NKI/
Rockland sample). Finally, RSFC-CBP benefited from recent developments in signal
denoising (Salimi-Khorshidi et al. 2014). Potentially even more important, however, is the
fact that the current work represents the first multi-modal CBP that employs the same
analysis pipeline across modalities, rendering the actual parcellation algorithms constant. As
we found a good convergence across modalities for the right PMd, we expected a similar
convergence for the left one given the aforementioned improvements. The next step of the
current work was then to functionally characterize the identified modules forming the left
PMd mosaic with multimodal functional connectivity and functional behavioral profiling
(e.g.(Clos et al. 2013; Genon et al. 2016)). In summary, our approach aimed to provide the
first robust modular map of the left PMd based on multi-modal CBP combined with a
detailed characterization of the behavioral functions and connectivity of the identified
modules.
II. Methods
2.1. PMd Volume of interest (VOI)
We used the same functional approach to the definition of a PMd VOI as previously
described in detail for the right side (Genon et al., 2016). In short, we first merged PMd
activation sites from multiple meta-analyses on functions attributed to the PMd such as
action observation (Caspers et al. 2010), motor learning (Hardwick et al. 2013), movement
perception (Grosbras et al. 2012), sustained attention (Langner and Eickhoff 2013), and
working memory (Rottschy et al. 2012). The ensuing PMd VOI was symmetrized and
exclusively masked with the cytoarchitectonic maps of primary sensorimotor areas (BA4a,
4p 3 a, 3b, 1, 2) as provided by using the SPM Anatomy Toolbox (Eickhoff et al. 2005). This
procedure ensured that the PMd VOI did not overlap with primary sensorimotor cortex at the
caudal border. Rostrally, however, the PMd VOI was not restricted to Area 6 but rather
Genon et al. Page 4
Neuroimage. Author manuscript; available in PMC 2019 April 15.
Author M
anuscriptA
uthor Manuscript
Author M
anuscriptA
uthor Manuscript

covered the full extent of functionally defined PMd. This procedure resulted in a left PMd
VOI of 4039 voxels.
2.2. Connectivity computation
We used MACM applied to the peaks of activation studies available in Brainmap database
(https://www.brainmap.org/) as a robust measure of task-based functional connectivity while
RSFC and PDT were computed respectively on the resting-state (RS) and diffusion-
weighted imaging (DWI) data of 124 healthy adults (84 females; mean age 46.56 ± 17.56)
from the open-access enhanced “Rockland” sample (http://fcon_1000.projects.nitrc.org/indi/
enhanced).
2.2.1. Meta-analytic connectivity modeling (MACM)—MACM was used to identify
the task-based functional connectivity profile of all left PMd VOI voxels as previously
described (Clos et al. 2013; Genon et al. 2016). For each voxel within the left PMd all
experiments that activated this voxel or its immediate vicinity were identified and whole-
brain co-activation patterns computed using the BrainMap database. To this end, we first
calculated the Euclidean distances between a given seed voxel and the individual foci of all
experiments and then used a multi-filter approach including the closest 20 to 200
experiments in steps of two (i.e., retrieving the 20, 22, 24, 26,…, 200 experiments reporting
activation closest to the seed voxel) to generate robust co-activation maps (Cieslik et al.
2013; Clos et al. 2013; Genon et al. 2016). The brain-wide co-activation profile for each
seed voxel given each of the 91 filter sizes was then computed by a meta-analysis over the
associated experiments. This meta-analysis was performed using the revised ALE algorithm
(Eickhoff et al. 2012). To take into account the complete brain-wide pattern of co-activation
likelihood of each seed voxel, no height threshold was set. The brain-wide co-activation
profiles for all left PMd VOI voxels were combined into a NS × NB connectivity matrix. NS
is the number of seed voxels (4039) and NB the number of target voxels in the reference
brain volume at 4×4×4mm resolution (26459 grey-matter voxels). Altogether, 91 individual
connectivity matrices were computed, each representing the connectivity of the seed voxels
for a given filter size.
2.2.2. Resting state functional connectivity (RSFC)—Resting-state data (TR 1.4 s)
was cleaned for physiological and movement artifacts by applying FIX (FMRIB’s ICA-
based Xnoiseifier, version 1.061; (Salimi-Khorshidi et al. 2014)) implemented in FSL
version 5.0.9 (http://fsl.fmrib.ox.ac.uk/fsl/fslwiki/FSL). FIX uses independent component
analysis and automatically classifies noise components by using a large number of distinct
spatial and temporal features via pattern classification. We utilized the training dataset
provided with FIX and recommended settings for noise and movement regression (Griffanti
et al. 2014). Further image processing was performed using SPM8 (Wellcome Trust Centre
for Neuroimaging, London, http://www.fil.ion.ucl.ac.uk/spm/software/spm8). Following
deletion of the first four scans preprocessing of the EPI images included affine registration to
the mean EPI and normalization to MNI space using the unified segmentation approach
before band-pass filtering for frequencies between 0.01–0.08 Hz. Linear (Pearson)
correlations between the time series of each seed left PMd voxel and all other grey-matter
voxels (at 4×4×4mm3 resolution) were computed. The correlation coefficients were Fisher-Z
Genon et al. Page 5
Neuroimage. Author manuscript; available in PMC 2019 April 15.
Author M
anuscriptA
uthor Manuscript
Author M
anuscriptA
uthor Manuscript

transformed and defined a per-subject connectivity matrix in the same form as the (per filter)
connectivity matrices obtained from the MACM computation.
Of note, one recent study (published after the time of our analyses) suggested that FIX
should be optimally combined with global signal regression (Burgess et al. 2016). Therefore,
we also performed Fix combined with linear global signal regression (GSR). However,
addition of GSR did not impact on the subsequent RSFC-CBP parcellation as illustrated in
Figure S5 in Supplementary Material. Furthermore, a high-quality dataset of RS fMRI data
acquired in healthy young adults has been made available by the Human Connectome
Project (HCP; http://www.humanconnectome.org/data/) after the time of our analysis.
Therefore, we also performed RSFC-CBP on a sample from this dataset (324 young healthy
adults, 164 females; mean age: 28.22 ± 3.88). This additional analysis yielded a similar
parcellation pattern than the one obtained from the enhanced NKI sample as illustrated in
Figure S6.
2.2.3. Probabilistic Diffusion Tractography (PDT)—Using FSL (http://
www.fmrib.ox.ac.uk/fsl) the diffusion scans were first corrected for eddy current distortions
and motion, followed by brain extraction based on the average b0 image and finally the
estimation of a multi-fiber model using BEDPOSTX (which infers the existence of crossing
fibers and estimates the contribution of each crossing fiber to the diffusion-weighted signal;
cf. Behrens et al., 2007). In addition, linear and nonlinear transforms between diffusion and
MNI-152 space were estimated using the FLIRT and FNIRT tools. Probabilistic Diffusion
Tractography was then ran using Probtrackx (Behrens et al. 2003a; Behrens et al. 2007),
generating 5000 streamline samples for every seed voxel based on the distributions of voxel-
wise principal diffusion directions (using a curvature threshold of .2 and a step-length of .5
mm). Recording for every seed-voxel the streamline-count at every voxel within the white-
matter at a resolution of 3×3×3 mm then defined a per-subject connectivity matrix in the
same form as the (per subject) RSFC connectivity matrices and the (per filter) connectivity
matrices obtained for MACM.
2.3. k-means clustering
For all the three connectivity modalities, the parcellation was performed by the same
pipeline (for minor adjustments cf. Supplementary Material) using k-means clustering as
implemented in the yael package (https://gforge.inria.fr/projects/yael). Given that we
previously found a robust parcellation of the right PMd VOI into 5 clusters (Genon et al.
2016), we here investigated potential subdivisions obtained up to 7 clusters, i.e., the 2-cluster
solution, 3-cluster solution, and so on, up to the 7-cluster solution, That is, we a-priori assumed that meaningful organizations of the left PMd can be observed at low resolution
and high resolution but not at very high resolution (i.e. not in subdivision into more than 7
subregions). For each parcellation, the best solutions from 500 replications with a randomly
placed initial centroid were computed. Importantly, for each k, k-means clustering is
performed at the individual level (i.e. filter level for MACM-CBP, and subject level for
RSFC-CBP and PDT-CBP) and the different parcellations are then combined into a single
parcellation for each modality by computing the most frequent cluster assignment for each
PMd VOI voxel across subjects/filter sizes.
Genon et al. Page 6
Neuroimage. Author manuscript; available in PMC 2019 April 15.
Author M
anuscriptA
uthor Manuscript
Author M
anuscriptA
uthor Manuscript

2.4. Cluster validity criteria
Assuming that parcellations at a coarse scale (into 2–3 subregions) should represent the
more stable primary patterns such as a rostro-caudal organization, we first considered these
before moving to finer parcellations with a particular focus on those close to the granularity
of the solution obtained for the right side, i.e., k = 4 – 6. Importantly, however, at these finer
scales, only some solutions should be expected to represent stable and hence supposedly
meaningful subdivisions, necessitating an objective choice of the solution most supported by
the data (Eickhoff et al., 2015). Here we employed four different cluster-validity metrics
employed individually to all three modalities. In line with our parcellation of the right PMd
VOI (Genon et al, 2016), we examined percentage of deviants and silhouette value. Of note,
variation of information across filter sizes, which was investigated in our MACM-CBP of
the right PMd VOI is a MACM-CBP specific metric, therefore it was not used in the current
multimodal procedure. Rather, in the current multimodal CBP study, we additionally
examined hierarchy index and change in inter/intra cluster distance (Clos et al. 2013). Thus,
we examined four different criteria: a topological criterion (hierarchy index), a consistency
criterion (percentage of deviants) and two cluster separation criteria (change in inter/intra
cluster distance and silhouette value).
Hierarchy index—The topological criterion was the percentage of voxels not related to the
dominant parent cluster compared to the previous (k – 1) solution, i.e., the hierarchy-index
(Kahnt et al., 2012). It corresponds to the percentage of lost voxels when only voxels
consistent across the entire hierarchy are considered for the final clustering. For example,
voxels assigned to cluster X in the 4-cluster solution that were assigned to cluster A (at k=3)
would be excluded if the majority of cluster X voxels actually stemmed from cluster B (at
k=3). A large fraction of such voxels indicates a hierarchically unstable solution (Clos et al.
2013).
Percentage of deviants—The percentage of deviants or “misclassified voxels”, i.e. the
average percentage of voxels for each filter size/subject that were assigned to a different
cluster compared to the most frequent (mode) assignment of these voxels across filter sizes/
subjects, was used as a consistency criterion. A significant difference in percentage of
deviants between a given cluster solution and the previous (k-1) one was tested using a two-
sample t-test. Optimal solutions are those k parcellations where the percentage of deviants
(presumably reflecting noise and local variance) is not significantly increased compared to
the previous (k-1) solution, while the subsequent (k+1) solution leads to a significantly
higher percentage of deviants.
Change in inter/intra cluster distance—The inter/intra cluster ratio (Chang et al.
2012), that is, the ratio between the average distance of a voxel to its cluster centre and the
average distance between the cluster centers, was used as cluster separation criterion. Since
the higher the distance ratio, the better is the separation, a significant increased ratio
compared to the previous k-1 solution would indicate a better separation of the obtained
clusters. However, because of the monotonous increase usually observed with this ratio, we
used the first derivative to evaluate the change in this ratio across solutions. A local optimum
is reached when there is a significant increase in the change from the previous k-1 to the
Genon et al. Page 7
Neuroimage. Author manuscript; available in PMC 2019 April 15.
Author M
anuscriptA
uthor Manuscript
Author M
anuscriptA
uthor Manuscript
current k solution while the subsequent k+1 solution does not show a significantly larger
increase.
Silhouette value—The silhouette value ranges from −1 to 1 and assesses, for each voxel,
how similar the voxel is to others within the same cluster, versus, how similar this voxel is to
voxels in other clusters regarding connectivity profile. A significant difference in the
silhouette value between a given cluster solution and the previous one was tested with a two-
sample t-test. Cluster solutions were considered favorable if they show a significantly higher
silhouette value, as compared to the previous (k-1) solution.
2.5. Identification and characterization of multimodal modules within the left PMd
To identify anatomical modules reflected by consistent subregion across the three
modalities, we first identified the best solution for each of these and then performed a
(spatial) minimum-statistic conjunction across the ensuing clusters (i.e. conjunctions of each
cluster of each modality with all other clusters of all other modalities) to arrive at a final,
multi-modal parcellation of the left PMd VOI. In order to only retain modules that reflect
meaningful overlaps between the uni-modal clusters but not, e.g., stripe-like fringe area
resulting from a slight displacement of the cluster border between modalities, we
additionally employed a module-size criterion of 150 continuous voxels. That is, following
the identification of the best solution per modality and the parcellation of the left PMd VOI
based on each aspect of brain connectivity, we computed the intersection between all
possible combinations of the ensuing MACM-CBP, RS-CBP and PDT-CBP clusters. We
then retained only those intersections between clusters from different modalities, which
yielded at least 150 continuous voxels, as our final, multi-modal modules. These modules
were subsequently characterized by their multi-modal functional interaction patterns and the
behavioral tasks engaging them in functional neuroimaging studies.
2.5.1. Functional connectivity of multimodal modules
Specific task-related functional connectivity (MACM): For each obtained PMd module,
an ALE meta-analysis was performed across all BrainMap experiments featuring at least one
focus of activation within each of the derived modules using the same approach as described
above. In contrast to the MACM underlying CBP, where ALE maps were not thresholded to
retain the complete pattern of co-activation likelihoods, we here performed statistical
inference to identify brain regions showing significant co-activations (correcting the cluster-
level family-wise error rate (cFWE at p < .05, using a cluster-forming threshold at voxel
level of p < .001).
To compare the brain-wide co-activation pattern between modules, we performed meta-
analytic contrasts as previously described (Eickhoff et al., 2011, Genon et al., 2016). Finally,
we identified the specific co-activation pattern for each module, that is, brain regions that
were significantly more co-activated with a given module than with any of the other ones.
This was achieved by performing a minimum-statistic conjunction across the results of the
four contrasts between a given module and the remaining others.
Genon et al. Page 8
Neuroimage. Author manuscript; available in PMC 2019 April 15.
Author M
anuscriptA
uthor Manuscript
Author M
anuscriptA
uthor Manuscript

Specific resting-state functional connectivity: To compute the significant RSFC of each
multimodally defined module, the time series of a given module was represented (per
subject) by the first eigenvariate of the resting-state time courses of all voxels attributed to
this module. Linear (Pearson) correlations between the time series of each module and all
other grey-matter voxels were computed and transformed into Fisher’s z-scores. These
Fisher’s z-scores were entered into a flexible factorial model as implemented in SPM8 to
test for consistency across subjects (main effect) as well as for significant differences
between the modules (again correcting the cluster-level family-wise error rate (FWE at p < .
05, using a cluster-forming threshold at voxel level of p < .001). As for MACM, we
identified the specific connectivity pattern of each module by performing a minimum-
statistic conjunction across the results of the four contrasts between a given module and the
remaining others.
In order to identify the robust, modality-independent, (specific) functional connectivity
pattern for each module (cf. Amft et al., 2014), we finally combined MACM and RSFC
results for each module using a minimum-statistic conjunction.
2.5.2. Behavioral functional characterization of multimodal modules—As in
previous work (e.g. (Clos et al. 2013; Genon et al. 2016)), functional characterization of the
left PMd modules was performed using the “behavioral domain” (BD) and “paradigm class”
(PC) meta-data within the BrainMap database (Laird et al. 2009) for those experiments that
activate the respective module. BDs include the main categories cognition, action, perception, emotion, interoception, as well as their subcategories. In turn, PCs categorize the
specific task employed. To robustly characterize the individual functional profile of each left
PMd module, we combined quantitative “forward inference” and “reverse inference”. In
forward inference, a module’s functional profile is assessed by identifying taxonomic labels
for which the probability of finding activation in the respective module is significantly
higher than finding activation for that label across the whole database by chance (p < .05
corrected for multiple comparisons using Bonferroni’s method (Clos et al. 2013; Rottschy et
al. 2013). That is, we tested whether the conditional probability of activation in a particular
region given a particular label [P(Activation|Task)] was higher than the baseline probability
of activating this particular region [P(Activation)]. In reverse inference, a module’s
functional profile was determined by identifying the most likely BDs and PCs given
activation in a particular module, i.e., the likelihood P(Task|Activation). This likelihood can
be derived from P(Activation|Task) as well as P(Task) and P(Activation) using Bayes’ rule.
Significance (at p < .05 corrected) was then assessed by means of a chi-squared test. In sum,
forward inference assesses the probability of activation given a behavioral label, whereas
reverse inference tests the probability of each behavioral label given an activation. For the
sake of robustness, only behavioral labels that were significantly associated to the modules
across both, forward and reverse inferences, were taken into account.
Genon et al. Page 9
Neuroimage. Author manuscript; available in PMC 2019 April 15.
Author M
anuscriptA
uthor Manuscript
Author M
anuscriptA
uthor Manuscript

III. Results
3.1. Multimodal parcellation
We first examined how each of the three CBP modalities divided the left PMd VOI at lower
and higher scales. Then we investigated how the different cluster-solutions were supported
by the data (using various cluster-stability criteria) within each CBP modality and combined
the supported parcellations to finally identify multi-modal modules. Importantly, we
compared the derived multimodal modules with the three subregions defined within the
superior part of Area 6 (Sigl et al. 2016) by independent mapping modality
(cytoarchitecture) and with the different subregions found in by the recent multimodal
mapping of the cerebral cortex (Glasser et al. 2016).
3.1.1. Rostro-caudal organization of the left PMd at lower scales (k = 2–3)—All
three modalities first subdivided the left PMd VOI along the rostro-caudal axis at lower
scales. At k = 2, all modalities differentiated a caudal part on the precentral gyrus from a
rostral part. Of note, while the borders defining subregions based on functional data (i.e.
MACM-CBP and RSFC-CBP) did not meet macroanatomical landmarks, the border
between the rostral and the caudal subregions defined by PDT-CBP was found close to the
precentral sulcus. At k = 3, all three modalities differentiated a caudal subregion mainly
covering the precentral gyrus, a central region centered on the precentral sulcus and a rostral
subregion anterior to the precentral sulcus (Figure 1).
As expected, these coarse parcellations tended to be more stable than finer parcellations in
the subject-based modalities (i.e., RSFC-CBP and PDT-CBP, see Figure S4). In other words,
the rostro-caudal organization into three subregions appeared as a more stable feature than
further subdivisions within the left PMd VOI.
3.1.2. Ventro-dorsal organization of the left PMd at higher scales (k = 4–6)—Subsequent splitting of the PMd VOI highlighted differences as well as similarities between
modalities (Figure 2).
All CBPs further subdivided the intermediate subregion (from k=3) along the ventro-dorsal
axis at k=4. MACM and RSFC-CBPs both revealed that a “central” subregion, located at the
intersection of the superior frontal and precentral gyri, can be distinguished from a more
ventral and a more dorsal one as previously observed for the right PMd VOI (Genon et al.,
2016). In contrast, PDT-CBP distinguished a superior part, roughly corresponding to the
superior frontal sulcus portion of the left PMd VOI.
At k=5, divergence between modalities increased. Both RSFC-CBP and PDT-CBP
subdivided the rostral subregion into two modules along the ventro-dorsal axis disentangling
a rostral module located in the superior sulcus either from a more rostroventral subregion
(PDT-CBP) or from the cortex both rostro-ventral and rostro-dorsal to it (RSFC-CBP). In
contrast, MACM-CBP subdivided the central cluster into a surface subregion and a deeper
subregion, in the fundus of superior frontal sulcus, where it meets the precentral gyrus.
Genon et al. Page 10
Neuroimage. Author manuscript; available in PMC 2019 April 15.
Author M
anuscriptA
uthor Manuscript
Author M
anuscriptA
uthor Manuscript

At k = 6, all CBPs further subdivided the superior rostral subregion along the ventro-dorsal
axis. Both, RSFC-CBP and PDT-CBP isolated the extreme dorsal part. In turn, MACM-CBP
distinguished the rostral module located on the superior frontal sulcus from the more rostro-
ventral and rostro-dorsal subregions, in line with the subdivision revealed by RSFC-CBP at
the previous clustering step (k = 5).
Overall, for the 6 cluster solutions we identified across all three CBPs two rostral
subregions: a rostral one located in the superior frontal sulcus (consistently with our
previous CBPs of the right PMd VOI) and a rostro-ventral one, a central subregion located in
the posterior superior frontal sulcus, where it meets the precentral gyrus, a ventral subregion
and a caudal one adjacent to primary motor area.
3.1.3. Selection of cluster solutions and cross-modal identification of modules within the left PMd—We next examined how the parcellations were supported by the data
for the higher scales (k = 4–6) independently for each CBP modality (MACM, RSFC and
PDT; see Supplementary Material for illustration and a detailed description of the results of
the cluster stability assessment).
MACM-CBP: whereas the percentage of deviants and the silhouette value were not
informative for choosing a cluster solution at higher scale (see Supplementary Material), the
two other criteria promoted the k = 6 parcellation over other.
RSFC-CBP: whereas the intra/inter distance ratio, the percentage of deviants and the
silhouette value were not informative for choosing a cluster solution at higher scale, the
hierarchy index promoted the k = 4 and the k = 6 parcellations over the 5k parcellation.
PDT-CBP: whereas the percentage of the intra/inter distance ratio was not informative for
choosing a cluster solution at higher scale, the silhouette value promoted the k = 5
parcellationat higher scale. Nevertheless, the two other criteria promoted the k = 6
parcellation over other k parcellations.
Thus, both within MACM-CBP and PDT-CBP, k = 6 can be regarded as the most stable
solution. Of note the 6k was also supported by examination of the percentage of voxels not
with parents for RSFC-CBP (despite the 4k was also supported). Thus, the 6k appeared as a
data-supported cluster solution within each modality. Importantly, MACM-CBP and PDT-
CBP modalities that similarly promoted the 6k are based on different data sets. Therefore, in
the sake of cross-modality validity, we focused on the k = 6 solution to identify multimodal
modules.
To identify modules consistent across the three topological organizations and infer the
multimodal organization of the left PMd, we performed conjunction analyses between all
possible combination of MACM, RSFC and PDT clusters. This procedure revealed 5
modules (Figure 3): a caudal one (green, 400 voxels), a central one (blue, 333 voxels), a
rostral one (red, 241 voxels), a ventral one (yellow, 158 voxels) and a rostro-ventral one
(pink, 260 voxels). The volumes are available through ANIMA (http://anima.fz-juelich.de/,
(Reid et al. 2016)). These five modules were consistent with the corresponding five
subregions revealed by each CBP modality independently, while the surface subregion
Genon et al. Page 11
Neuroimage. Author manuscript; available in PMC 2019 April 15.
Author M
anuscriptA
uthor Manuscript
Author M
anuscriptA
uthor Manuscript

revealed by MACM-CBP alone and the dorsal subregion revealed by RSFC-CBP and PDT-
CBP were not evidenced by the conjunction across CBP modalities.
3.1.4. Comparison with cytoarchitecture-based mapping and multimodal cortex parcellation—Recent cytoarchitecture-based mapping of the superior part of Area
6 has revealed three distinct areas: a caudal one (6d1), a deep anterior one (6d3) and a more
dorsal anterior one (6d2) (Sigl et al. 2016). The comparison of our two multimodal modules
located in the superior part of Area 6, i.e., the caudal and the central one, with the caudal and
deep anterior anatomical areas showed that our caudal and central modules are consistent in
their spatial pattern with these anatomical areas (this comparison is illustrated in Figure S7
in the Supplementary Material). Thus, the comparison of our resulting modules with ex-vivo
microstructure-based mapping suggests that our conjunction of overlapping clusters across
CBP modalities retains topographically valid patterns.
Recently, Glasser et al. (2016) proposed a surface-based multimodal parcellation of the
cerebral cortex. In order to reliably relate our multimodal left PMd volumes to the
multimodal surface parcels of Glasser et al., we performed a two-fold comparison (see
Figure S8). We transposed the surface parcellation map of Glasser et al. to volume in MNI
space and displayed our volumes on the volume map (Figure S8 A), but we also mapped our
volumes to surface with the Connectome workbench (http://www.humanconnectome.org/
software/connectome-workbench.html) and displayed the yielded surface modules on the
surface parcellation map of Glasser et al. (Figure S8 B). Both comparisons showed that our
left PMd caudal module mirrors a caudal PMd subregion identified by Glasser et al. In
contrast, both comparisons showed that our rostral and central modules have not been
distinguished in Glasser et al.’s parcellation as they are both part of a single parcel located
within the posterior part of the superior frontal sulcus in this map. Both comparisons
similarly suggest that our rostro-ventral module belongs to a larger, rather prefrontal, parcel.
In turn, volume definition of area 55b from Glasser et al. suggests that this region
corresponds to our ventral module while surface mapping of our ventral module shows that
it overlaps with both Area 55b and the area superior to this latter.
3.2. Functional characterization of left PMd modules
3.2.1. Multimodal functional connectivity—The specific cross-modal functional
connectivity patterns of each module are illustrated in Figure 4 and detailed in Table 1. For
reader’s information, the task-based functional connectivity (MACM) and resting-state
functional connectivity (RSFC) are illustrated separately in Figure S9 and Figure S10,
respectively, in Supplementary Material. Furthermore, the corresponding maps are available
in ANIMA (http://anima.fz-juelich.de/).
The caudal module was specifically coupled with bilateral primary sensorimotor areas,
secondary somatosensory cortex and cerebellum. The central module compared to all other
modules was stronger connected with bilateral superior parietal cortex/IPS, but it also with
the right supramarginal and inferior frontal gyri. In contrast, the rostral module was
specifically coupled with bilateral middle frontal cortex, precuneus and inferior parietal
cortex. In turn, the ventral module was functionally stronger connected with bilateral
Genon et al. Page 12
Neuroimage. Author manuscript; available in PMC 2019 April 15.
Author M
anuscriptA
uthor Manuscript
Author M
anuscriptA
uthor Manuscript

superior temporal cortex and pre-SMA, as well as left Broca’s Area, left temporal pole and
right cerebellum. Finally, the rostro-ventral cortex was specifically connected with bilateral
inferior frontal, left lateral orbitofrontal, dorsomedial prefrontal and inferior parietal
cortices.
3.2.2. Behavioral association: Behavioral domains and paradigm classes—Functional characterization across behavioral domains and paradigm classes of the
BrainMap database are summarized in Figure 5. This functional characterization revealed
that the caudal module was mainly associated with motor-related functions while the rostral
module was mainly associated with executive cognitive- and visuospatial-related functions.
The central subregion, in turn, showed a mixed behavioral profile including motor and
visuospatial functions and paradigms, but also related to working memory and attention. In
contrast, the ventral module was mainly associated with speech and also eyes-related
functions. Finally, the rostro-ventral module was associated with functions and paradigms
requiring abstraction abilities, namely long term explicit memory, scene imagination and
deception.
IV. Discussion
In this study, we addressed the heterogeneity of the left PMd using a multimodal
connectivity-based parcellation (CBP) approach combining meta-analytic connectivity
modeling (MACM), resting-state functional connectivity (RSFC), and probabilistic diffusion
tractography (PDT). At the coarser level – that is, when dividing the PMd into two and then
three subregions based on the respective connectivity profiles of its individual voxels – all
three modalities congruently revealed that the left PMd is organized along the rostro-caudal
axis. At finer levels, when searching for further subdivisions, some divergence, as well as
similarities, were observed across modalities. By crossing modalities and identifying voxels
that are kept clustered together across parcellation modalities, we showed that five modules
could be robustly distinguished within the left PMd. The five PMd subregions identified by
the conjunction analyses corresponded to independent parcels within each CBP modality,
suggesting that none of them could be considered as a conjunction artifact across modalities.
In other words, all the five subregions identified by the conjunction analysis showed
correspondence with the topographical organization revealed independently by the different
modalities, thus truly reflecting convergence on the organization of the left PMd. These five
subregions included a caudal module, a central module, a rostral module, a ventral module,
and a rostro-ventral module.
4.1. Topographical similarities and differences between right and left PMd
The main modules identified in the right and left PMd multimodal CBP are illustrated in
Figure 6.
The convergent organization across modalities found in the left PMd showed
correspondence with the topographical organization previously highlighted in the right
hemisphere, in which corresponding caudal, central, rostral and ventral subregions were also
identified by different CBP modalities. In line with the rostro-caudal clusters identified in
the right PMd, the left rostral subregion was mainly anterior to the precentral sulcus, the
Genon et al. Page 13
Neuroimage. Author manuscript; available in PMC 2019 April 15.
Author M
anuscriptA
uthor Manuscript
Author M
anuscriptA
uthor Manuscript

central subregion was found at the level of the precentral sulcus and the caudal subregion
was located on the precentral gyrus. In addition, in line with the ventral right PMd
subregion, the ventral left PMd subregion was located on the ventral part of the middle
portion of the precentral gyrus, bordering the ventral PMd. Nevertheless, while in our
previous study of the PMd in the right hemisphere, different CBP modalities all isolated a
dorsal subregion located on the superior frontal sulcus adjacent to pre-SMA, such a dorsal
region was hardly distinguished from other subregions in the left PMd. In particular,
MACM-CBP maintained the extreme dorsal voxels functionally linked to, on the one hand,
the rostro-ventral subregions, and on the other hand, the ventral subregion. These findings
suggest that the voxels on the dorsal part of the superior frontal gyrus of the PMd may not
form a coherent functional module in the left PMd. In turn, all our CBP modalities and the
subsequent conjunction analysis in the left PMd isolated a rostro-ventral module located
anteriorly to the precentral sulcus on the ventral part of the middle frontal gyrus that was not
evidenced in the right PMd.
4.2. Evidence for hemispheric asymmetry of the right and left PMd
In order to further examine whether asymmetry of the right and left PMd were truly
supported by the data and could not be driven by methodological artifacts, we performed
additional parcellation whose results are reported and described in Supplementary Material.
First, to ensure that the method differences did not account for the differences in
organization found in the two independent parcellations of the left and right PMd, CBP of
the right PMd was performed with exactly the same methods and dataset as used for the left
PMd. The 5-cluster parcellations found in the right PMd did not mirror the 5-cluster
parcellation found in the left PMd (neither in Genon et al.’s original study nor with the
improved method in Supplemental Material). In particular, whereas the ventral part of the
left PMd was already subdivided into two subregions with a substantial rostro-ventral
subregion in the left PMd, this rostro-ventral subregion was not evidenced in any of the right
PMd parcellations (see Supplementary discussion III.2 and Figure S11). Second, we
investigated whether a rostro-ventral subregion could be evidenced in the right PMd when
further splitting this region into six clusters. However, this further subdivivsion revealed an
inconsistent pattern across modalities (see Supplementary discussion III.2 and Figure S12),
thus not supporting the hypothesis of a robust rostro-caudal subdivision in the inferior part
of the right PMd. Third, in order to further investigate the hemispheric specificity hypothesis
of the right dorsal PMd subregion and the left rostro-ventral PMd subregion, we examined
how the PMd subregions could be clustered together across both hemispheres according to
their behavior-related functional similarity. That is, we performed MACM-CBP on a
bilateral PMd VOIs. The main findings (which are described and illustrated in
Supplementary Material, Figure S13) confirmed that the right dorsal PMd subregion and the
left rostro-ventral PMd subregion did not show respective homotopic subregions in the
opposite hemisphere. Thus, altogether, these additional findings support the hypothesis of
different topographical organizations in the right and left PMd. The functional
characterization of each left PMd module and their (lack of) correspondence to the right
PMd subregions are further discussed below.
Genon et al. Page 14
Neuroimage. Author manuscript; available in PMC 2019 April 15.
Author M
anuscriptA
uthor Manuscript
Author M
anuscriptA
uthor Manuscript
4.3. A Rostro-caudal organization mapping cognitive-motor gradient in the left PMd
At lower resolution (k = 2–3), all CBP modalities highlighted a rostro-caudal organization,
which could also be found at higher resolution (k = 5–6) as three rostro-caudally organized
modules on the superior part of the PMd: rostral, central and caudal. The ensuing functional
characterization indicated a gradient from cognitive to motor functions with the rostral part
being mainly connected to inferior parietal and lateral prefrontal cortex and associated with
higher cognitive and visuospatial functions; the central part being associated with the top-
down control network (Vossel et al. 2014) and being engaged in a wide range of behavioral
functions from action execution to working memory; and the caudal part being functionally
integrated in a sensorimotor network and associated with sensorimotor functions. The
identified modules and their functional characterization bear similarities with the subregions
described in non-human primates. The rostral module indeed mirrors area F7 (Matelli et al.
1985, 1991), a region predominantly receiving prefrontal inputs (Boussaoud et al. 1995;
Rizzolatti and Luppino 2001) and supporting cognitive functions such as spatial attention or
memory (Boussaoud 2001; Lebedev and Wise 2001; Nakayama et al. 2016). Similarly, the
central module likely corresponds to F2vr (for a review see Abe and Hanakawa 2009), a
subregion receiving inputs from dorsolateral prefrontal cortex (DLPFC) and medial IPS
(Luppino et al. 2003), and assumed to support the integration of visuospatial and
somatosensory/motor functions to complete a motor plan (for a review see Abe and
Hanakawa 2009). The caudal module mirrors F2 itself, a subregion connected to M1 and the
spinal cord (for reviews see Geyer et al. 2000; Abe and Hanakawa 2009). Furthermore, our
multimodal characterization along the rostro-caudal axis is consistent with previous
parcellations of the frontal lobe showing a cognitive-motor gradient mapping a rostro-caudal
organization of the frontal cortex (e.g. (Koechlin and Summerfield 2007; Bellec et al. 2010;
Yeo et al. 2011c; Orban et al. 2015; Glasser et al. 2016) as well as with our previous
parcellation of the right PMd (Genon et al. 2016), thus confirming that the rostro-caudal
organization of the PMd is a primary principle of organization within the frontal cortex.
4.4. The left premotor eye-field 55b
On the ventral part of the middle frontal gyrus, our multimodal parcellation of the left PMd
identified a ventral module that shows correspondence with the ventral subregion previously
observed in the right PMd. Functional characterization of the left PMd ventral module
showed a behavioral pattern dominated by visual and language-related functions.
Accordingly, functional connectivity across MACM and RSFC showed that the ventral left
PMd is functionally coupled with Broca’s area and TE areas assigned to the ventral
processing stream supporting object recognition (Gross 1994). When examining the
functional profile of the left PMd ventral module and its spatial correspondence with the
right PMd premotor eye-field, it appeared that the left PMd ventral module conceptually
overlapped with the left premotor eye-field. In support of this view, a recent meta-analysis
has identified a premotor eye-field located in our left PMd ventral module (Cieslik et al.
2016) as illustrated in Figure S14 (Supplementary Material). Nevertheless, the left premotor
ventral module appeared additionally related to language functions and overlaps with Area
55b, a language-related area recently suggested by Glasser et al. (2016). However,
behavioral functional characterization of the volume definition of Area 55b across the
BrainMap database (reported in Supplementary Material) revealed that this subregion is also
Genon et al. Page 15
Neuroimage. Author manuscript; available in PMC 2019 April 15.
Author M
anuscriptA
uthor Manuscript
Author M
anuscriptA
uthor Manuscript

associated with simple eye movements and shows a similar profile to our ventral cluster (see
Figure S15). Thus, the current evidence converges to suggest that the ventral subregion of
the left PMd consists jointly of premotor eye-field and Area 55b. Such a mixed behavioral
profile could reflect the integration/coordination of visual identification (visual screening)
processes with word production (speech execution) processes in the ventral PMd, although
future studies are needed to empirically confirm this hypothesis.
4.5. Abstraction in the rostro-ventral left PMd
At finer levels of parcellation, all CBP modalities isolated a rostro-ventral module located
anteriorly to the precentral sulcus on the ventral part of the middle frontal gyrus, which was
accordingly delineated by our conjunction analysis. Importantly, previous whole-brain
parcellations have already suggested a finer subdivision of the inferior part of the PMd in the
left hemisphere when compared to right hemisphere ((Yeo et al. 2011b; Laumann et al.
2015), see Supplementary Material). The subsequent characterization of our delineated
rostro-ventral module highlighted a conspicuous functional pattern that was both clearly
distinct from other left PMd modules and any module on the right hemisphere. In particular,
this region showed specific functional connectivity with the ventrolateral and dorsomedial
prefrontal cortex, as well as with inferior parietal lobule. Accordingly, this module was
integrated within a broader, rather prefrontal subregion in the parcellation of Glasser et al.
(2016). In the present study, activity in the rostro-ventral left PMd was associated with tasks
related to explicit longterm memory, object/scenes imagination, and deception paradigms.
This pattern of functional interaction with higher associative regions and engagement in
abstract behavioral functions suggests that this region, at the transition between left
prefrontal cortex and left ventral PMd, may be involved in deriving mental abstractions from
one’s current ongoing situation/environment. Such abstraction involves reference to a
different time frame (required for long-term memory retrieval), a different spatial frame
(required for scenes imagination), and a different mental frame (required for deception). In
line with whole-brain parcellation, there was no clear evidence for such rostro-ventral
subregion in our right PMd parcellation suggesting that the right and left PMd are differently
functionally characterized. To further confirm this hypothesis, we mirrored this module in
the right hemisphere and examined its behavioral functional characterization (the results are
reported in Supplementary Material, Figure S16). In this right hemisphere VOI, we did not
find any significant relationship with the abstract functions evidenced in the left rostro-
ventral module. Instead, this rostro-ventral part of the right PMd showed a similar behavioral
characterization to the more superior rostral right PMd subregion. Therefore, we suggest that
abstract functions are more predominantly represented in the posterior part of prefrontal
cortex/anterior part of premotor cortex in the left hemisphere than in the right hemisphere.
4.6. Conclusion
In conclusion, for the first time, we described a parcellation, using a multimodal approach,
of the left premotor cortex into five robust modules. The reliability of this approach was
demonstrated by comparing the defined modules with previous coarser parcellations and the
behavioral relevance of our modules was evidenced by robust functional characterization.
The caudal, central and rostral left PMd modules confirmed the rostro-caudal organization
reflecting a cognitive-motor gradient previously highlighted in the right PMd (Genon et al.
Genon et al. Page 16
Neuroimage. Author manuscript; available in PMC 2019 April 15.
Author M
anuscriptA
uthor Manuscript
Author M
anuscriptA
uthor Manuscript

2016) and the frontal lobes as a whole (Yeo et al. 2011a; Glasser et al. 2016). Furthermore,
our analysis suggested a left inferior PMd subregion involved in eye-field functions and thus
mirroring a right premotor eye-field (Genon et al. 2016), but also engaged in language
functions and overlapping with Area 55b (Glasser et al., 2016). Finally, our multimodal
parcellation also revealed a specific module in the rostro-ventral subregion supporting
abstract cognitive functions, not evidenced in the corresponding PMd region in the right
hemisphere.
Supplementary Material
Refer to Web version on PubMed Central for supplementary material.
Acknowledgments
Funding
This study was supported by the Deutsche Forschungsgemeinschaft (DFG, EI 816/4–1, LA 3071/3–1, GE 2835/1–1), the National Institute of Mental Health (R01-MH074457), the Helmholtz Portfolio Theme “Supercomputing and Modelling for the Human Brain”, the European Union’s Horizon 2020 Research and Innovation Programme under Grant Agreement No. 7202070 (HBP SGA1) and the National Institute of Mental Health (R01-MH074457).
References
Abe M, Hanakawa T. Functional coupling underlying motor and cognitive functions of the dorsal premotor cortex. Behavioural brain research. 2009; 198:13–23. [PubMed: 19061921]
Amiez C, Petrides M. Anatomical organization of the eye fields in the human and non-human primate frontal cortex. Progress in neurobiology. 2009; 89:220–230. [PubMed: 19665515]
Amunts K, Schleicher A, Bürgel U, Mohlberg H, Uylings H, Zilles K. Broca’s region revisited: cytoarchitecture and intersubject variability. Journal of Comparative Neurology. 1999; 412:319–341. [PubMed: 10441759]
Badre D. Cognitive control, hierarchy, and the rostro-caudal organization of the frontal lobes. Trends in cognitive sciences. 2008; 12:193–200. [PubMed: 18403252]
Badre D, D’Esposito M. Is the rostro-caudal axis of the frontal lobe hierarchical? Nature reviews Neuroscience. 2009; 10:659–669. [PubMed: 19672274]
Bahlmann J, Blumenfeld RS, D’Esposito M. The Rostro-Caudal Axis of Frontal Cortex Is Sensitive to the Domain of Stimulus Information. Cereb Cortex. 2015; 25:1815–1826. [PubMed: 24451658]
Behrens T, Berg HJ, Jbabdi S, Rushworth M, Woolrich M. Probabilistic diffusion tractography with multiple fibre orientations: What can we gain? NeuroImage. 2007; 34:144–155. [PubMed: 17070705]
Behrens TE, Woolrich MW, Jenkinson M, Johansen-Berg H, Nunes RG, Clare S, Matthews PM, Brady JM, Smith SM. Characterization and propagation of uncertainty in diffusion-weighted MR imaging. Magnetic resonance in medicine. 2003a; 50:1077–1088. [PubMed: 14587019]
Behrens TEJ, Johansen-Berg H, Woolrich MW, Smith SM, Wheeler-Kingshott CAM, Boulby PA, Barker GJ, Sillery EL, Sheehan K, Ciccarelli O. Non-invasive mapping of connections between human thalamus and cortex using diffusion imaging. Nature neuroscience. 2003b; 6:750–757. [PubMed: 12808459]
Bellec P, Rosa-Neto P, Lyttelton OC, Benali H, Evans AC. Multi-level bootstrap analysis of stable clusters in resting-state fMRI. Neuroimage. 2010; 51:1126–1139. [PubMed: 20226257]
Birn RM. The role of physiological noise in resting-state functional connectivity. Neuroimage. 2012; 62:864–870. [PubMed: 22245341]
Boussaoud D. Attention versus intention in the primate premotor cortex. Neuroimage. 2001; 14:S40–S45. [PubMed: 11373131]
Genon et al. Page 17
Neuroimage. Author manuscript; available in PMC 2019 April 15.
Author M
anuscriptA
uthor Manuscript
Author M
anuscriptA
uthor Manuscript

Boussaoud D, di Pellegrino G, Wise SP. Frontal lobe mechanisms subserving vision-for-action versus vision-for-perception. Behav Brain Res. 1995; 72:1–15. [PubMed: 8788851]
Burgess GC, Kandala S, Nolan D, Laumann TO, Power JD, Adeyemo B, Harms MP, Petersen SE, Barch DM. Evaluation of Denoising Strategies to Address Motion-Correlated Artifacts in Resting-State Functional Magnetic Resonance Imaging Data from the Human Connectome Project. Brain connectivity. 2016
Caspers S, Geyer S, Schleicher A, Mohlberg H, Amunts K, Zilles K. The human inferior parietal cortex: cytoarchitectonic parcellation and interindividual variability. NeuroImage. 2006; 33:430–448. [PubMed: 16949304]
Caspers S, Zilles K, Laird AR, Eickhoff SB. ALE meta-analysis of action observation and imitation in the human brain. Neuroimage. 2010; 50:1148–1167. [PubMed: 20056149]
Cieslik EC, Seidler I, Laird AR, Fox PT, Eickhoff SB. Different involvement of subregions within dorsal premotor and medial frontal cortex for pro- and antisaccades. Neuroscience and biobehavioral reviews. 2016; 68:256–269. [PubMed: 27211526]
Cieslik EC, Zilles K, Caspers S, Roski C, Kellermann TS, Jakobs O, Langner R, Laird AR, Fox PT, Eickhoff SB. Is There “One” DLPFC in Cognitive Action Control? Evidence for Heterogeneity From Co-Activation-Based Parcellation. Cereb Cortex. 2013; 23:2677–2689. [PubMed: 22918987]
Clos M, Amunts K, Laird AR, Fox PT, Eickhoff SB. Tackling the multifunctional nature of Broca’s region meta-analytically: co-activation-based parcellation of area 44. NeuroImage. 2013; 83:174–188. [PubMed: 23791915]
De Schotten MT, Dell’Acqua F, Forkel SJ, Simmons A, Vergani F, Murphy DG, Catani M. A lateralized brain network for visuospatial attention. Nature neuroscience. 2011; 14:1245–1246. [PubMed: 21926985]
Diedrichsen J, Balsters JH, Flavell J, Cussans E, Ramnani N. A probabilistic MR atlas of the human cerebellum. NeuroImage. 2009; 46:39–46. [PubMed: 19457380]
Eickhoff SB, Amunts K, Mohlberg H, Zilles K. The human parietal operculum. II. Stereotaxic maps and correlation with functional imaging results. Cereb Cortex. 2006; 16:268–279. [PubMed: 15888606]
Eickhoff SB, Bzdok D, Laird AR, Kurth F, Fox PT. Activation likelihood estimation meta-analysis revisited. NeuroImage. 2012; 59:2349–2361. [PubMed: 21963913]
Eickhoff SB, Bzdok D, Laird AR, Roski C, Caspers S, Zilles K, Fox PT. Co-activation patterns distinguish cortical modules, their connectivity and functional differentiation. Neuroimage. 2011; 57:938–949. [PubMed: 21609770]
Eickhoff SB, Stephan KE, Mohlberg H, Grefkes C, Fink GR, Amunts K, Zilles K. A new SPM toolbox for combining probabilistic cytoarchitectonic maps and functional imaging data. Neuroimage. 2005; 25:1325–1335. [PubMed: 15850749]
Eickhoff SB, Thirion B, Varoquaux G, Bzdok D. Connectivity-based parcellation: Critique and implications. Human brain mapping. 2015; 36:4771–4792. [PubMed: 26409749]
Foster BL, He BJ, Honey CJ, Jerbi K, Maier A, Saalmann YB. Spontaneous Neural Dynamics and Multi-scale Network Organization. Frontiers in systems neuroscience. 2016; 10:7. [PubMed: 26903823]
Genon S, Li H, Fan L, Muller VI, Cieslik EC, Hoffstaedter F, Reid AT, Langner R, Grefkes C, Fox PT, Moebus S, Caspers S, Amunts K, Jiang T, Eickhoff SB. The Right Dorsal Premotor Mosaic: Organization, Functions, and Connectivity. Cereb Cortex. 2016
Geyer S, Ledberg A, Schleicher A, Kinomura S, Schormann T, Burgel U, Klingberg T, Larsson J, Zilles K, Roland PE. Two different areas within the primary motor cortex of man. Nature. 1996; 382:805–807. [PubMed: 8752272]
Geyer S, Matelli M, Luppino G, Zilles K. Functional neuroanatomy of the primate isocortical motor system. Anatomy and embryology. 2000; 202:443–474. [PubMed: 11131014]
Geyer S, Schleicher A, Zilles K. Areas 3a, 3b, and 1 of human primary somatosensory cortex. Neuroimage. 1999; 10:63–83. [PubMed: 10385582]
Glasser M, Coalson T, Robinson E, Hacker C, Harwell J, Yacoub E, Ugurbil K, Anderson J, Beckmann C, Jenkinson M. A Multi-modal parcellation of human cerebral cortex. Nature. 2016
Genon et al. Page 18
Neuroimage. Author manuscript; available in PMC 2019 April 15.
Author M
anuscriptA
uthor Manuscript
Author M
anuscriptA
uthor Manuscript

Grefkes C, Geyer S, Schormann T, Roland P, Zilles K. Human somatosensory area 2: observer-independent cytoarchitectonic mapping, interindividual variability, and population map. Neuroimage. 2001; 14:617–631. [PubMed: 11506535]
Griffanti L, Salimi-Khorshidi G, Beckmann CF, Auerbach EJ, Douaud G, Sexton CE, Zsoldos E, Ebmeier KP, Filippini N, Mackay CE, Moeller S, Xu J, Yacoub E, Baselli G, Ugurbil K, Miller KL, Smith SM. ICA-based artefact removal and accelerated fMRI acquisition for improved resting state network imaging. Neuroimage. 2014; 95:232–247. [PubMed: 24657355]
Grosbras MH, Beaton S, Eickhoff SB. Brain regions involved in human movement perception: a quantitative voxel-based meta-analysis. Human brain mapping. 2012; 33:431–454. [PubMed: 21391275]
Gross CG. How inferior temporal cortex became a visual area. Cerebral cortex. 1994; 4:455–469. [PubMed: 7833649]
Hanakawa T. Rostral premotor cortex as a gateway between motor and cognitive networks. Neuroscience research. 2011; 70:144–154. [PubMed: 21382425]
Hardwick RM, Rottschy C, Miall RC, Eickhoff SB. A quantitative meta-analysis and review of motor learning in the human brain. NeuroImage. 2013; 67:283–297. [PubMed: 23194819]
Hoshi E, Tanji J. Distinctions between dorsal and ventral premotor areas: anatomical connectivity and functional properties. Current opinion in neurobiology. 2007; 17:234–242. [PubMed: 17317152]
Kantak SS, Stinear JW, Buch ER, Cohen LG. Rewiring the brain: potential role of the premotor cortex in motor control, learning, and recovery of function following brain injury. Neurorehabilitation and neural repair. 2012; 26:282–292. [PubMed: 21926382]
Kell CA, Morillon B, Kouneiher F, Giraud AL. Lateralization of speech production starts in sensory cortices—a possible sensory origin of cerebral left dominance for speech. Cerebral Cortex. 2010:bhq167.
Koechlin E, Summerfield C. An information theoretical approach to prefrontal executive function. Trends in cognitive sciences. 2007; 11:229–235. [PubMed: 17475536]
Laird AR, Eickhoff SB, Kurth F, Fox PM, Uecker AM, Turner JA, Robinson JL, Lancaster JL, Fox PT. ALE meta-analysis workflows via the brainmap database: progress towards a probabilistic functional brain atlas. Frontiers in neuroinformatics. 2009; 3
Langleben DD, Schroeder L, Maldjian JA, Gur RC, McDonald S, Ragland JD, O’Brien CP, Childress AR. Brain activity during simulated deception: an event-related functional magnetic resonance study. NeuroImage. 2002; 15:727–732. [PubMed: 11848716]
Langner R, Eickhoff SB. Sustaining attention to simple tasks: a meta-analytic review of the neural mechanisms of vigilant attention. Psychological bulletin. 2013; 139:870–900. [PubMed: 23163491]
Laumann TO, Gordon EM, Adeyemo B, Snyder AZ, Joo SJ, Chen MY, Gilmore AW, McDermott KB, Nelson SM, Dosenbach NU, Schlaggar BL, Mumford JA, Poldrack RA, Petersen SE. Functional System and Areal Organization of a Highly Sampled Individual Human Brain. Neuron. 2015; 87:657–670. [PubMed: 26212711]
Lebedev MA, Wise SP. Tuning for the orientation of spatial attention in dorsal premotor cortex. European Journal of Neuroscience. 2001; 13:1002–1008. [PubMed: 11264673]
Luppino G, Rozzi S, Calzavara R, Matelli M. Prefrontal and agranular cingulate projections to the dorsal premotor areas F2 and F7 in the macaque monkey. The European journal of neuroscience. 2003; 17:559–578. [PubMed: 12581174]
Matelli M, Luppino G, Rizzolatti G. Patterns of cytochrome oxidase activity in the frontal agranular cortex of the macaque monkey. Behavioural brain research. 1985; 18:125–136. [PubMed: 3006721]
Matelli M, Luppino G, Rizzolatti G. Architecture of superior and mesial area 6 and the adjacent cingulate cortex in the macaque monkey. Journal of Comparative Neurology. 1991; 311:445–462. [PubMed: 1757597]
Morosan P, Schleicher A, Amunts K, Zilles K. Multimodal architectonic mapping of human superior temporal gyrus. Anat Embryol (Berl). 2005; 210:401–406. [PubMed: 16170539]
Murphy K, Birn RM, Bandettini PA. Resting-state fMRI confounds and cleanup. NeuroImage. 2013; 80:349–359. [PubMed: 23571418]
Genon et al. Page 19
Neuroimage. Author manuscript; available in PMC 2019 April 15.
Author M
anuscriptA
uthor Manuscript
Author M
anuscriptA
uthor Manuscript

Nakayama Y, Yamagata T, Hoshi E. Rostrocaudal functional gradient among the pre-dorsal premotor cortex, dorsal premotor cortex and primary motor cortex in goal-directed motor behaviour. The European journal of neuroscience. 2016; 43:1569–1589. [PubMed: 27062460]
Orban P, Doyon J, Petrides M, Mennes M, Hoge R, Bellec P. The Richness of Task-Evoked Hemodynamic Responses Defines a Pseudohierarchy of Functionally Meaningful Brain Networks. Cereb Cortex. 2015; 25:2658–2669. [PubMed: 24729172]
Picard N, Strick PL. Imaging the premotor areas. Current opinion in neurobiology. 2001; 11:663–672. [PubMed: 11741015]
Reid AT, Bzdok D, Genon S, Langner R, Muller VI, Eickhoff CR, Hoffstaedter F, Cieslik EC, Fox PT, Laird AR, Amunts K, Caspers S, Eickhoff SB. ANIMA: A data-sharing initiative for neuroimaging meta-analyses. NeuroImage. 2016; 124:1245–1253. [PubMed: 26231246]
Rizzolatti G, Luppino G. The Cortical Motor System. Neuron. 2001; 31:889–901. [PubMed: 11580891]
Rothstein, HR., Sutton, AJ., Borenstein, M. Publication Bias in Meta-Analysis. John Wiley & Sons, Ltd; 2006. Publication Bias in Meta-Analysis; p. 1-7.
Rottschy C, Caspers S, Roski C, Reetz K, Dogan I, Schulz JB, Zilles K, Laird AR, Fox PT, Eickhoff SB. Differentiated parietal connectivity of frontal regions for “what” and “where” memory. Brain structure & function. 2013; 218:1551–1567. [PubMed: 23143344]
Rottschy C, Langner R, Dogan I, Reetz K, Laird AR, Schulz JB, Fox PT, Eickhoff SB. Modelling neural correlates of working memory: a coordinate-based meta-analysis. NeuroImage. 2012; 60:830–846. [PubMed: 22178808]
Salimi-Khorshidi G, Douaud G, Beckmann CF, Glasser MF, Griffanti L, Smith SM. Automatic denoising of functional MRI data: combining independent component analysis and hierarchical fusion of classifiers. NeuroImage. 2014; 90:449–468. [PubMed: 24389422]
Scheperjans F, Eickhoff SB, Homke L, Mohlberg H, Hermann K, Amunts K, Zilles K. Probabilistic maps, morphometry, and variability of cytoarchitectonic areas in the human superior parietal cortex. Cereb Cortex. 2008; 18:2141–2157. [PubMed: 18245042]
Schubotz RI, Anwander A, Knösche TR, von Cramon DY, Tittgemeyer M. Anatomical and functional parcellation of the human lateral premotor cortex. NeuroImage. 2010; 50:396–408. [PubMed: 20035880]
Sigl B, Caspers S, Mohlberg H, Cieslik EC, Eickhoff SB, Amunts K. The human dorsal premotor cortex – cytoarchitecture, maps and function. Proceedings of the OHBM 2016 Annual Meeting. 2016
Van Essen, DC., Jbabdi, S., Sotiropoulos, SN., Chen, C., Dikranian, K., Coalson, T., Harwell, J., Behrens, TE., Glasser, MF. Mapping connections in humans and nonhuman primates: aspirations and challenges for diffusion imaging Diffusion MRI. 2nd. Johansen-Berg, H., Behrens, TEJ., editors. 2013. p. 337-358.
Vossel S, Geng JJ, Fink GR. Dorsal and ventral attention systems distinct neural circuits but collaborative roles. The Neuroscientist. 2014; 20:150–159. [PubMed: 23835449]
Wager TD, Jonides J, Reading S. Neuroimaging studies of shifting attention: a metaanalysis. NeuroImage. 2004; 22:1679–1693. [PubMed: 15275924]
Yeo BT, Krienen FM, Sepulcre J, Sabuncu MR, Lashkari D, Hollinshead M, Roffman JL, Smoller JW, Zöllei L, Polimeni JR. The organization of the human cerebral cortex estimated by intrinsic functional connectivity. Journal of neurophysiology. 2011a; 106:1125–1165. [PubMed: 21653723]
Yeo BT, Krienen FM, Sepulcre J, Sabuncu MR, Lashkari D, Hollinshead M, Roffman JL, Smoller JW, Zollei L, Polimeni JR, Fischl B, Liu H, Buckner RL. The organization of the human cerebral cortex estimated by intrinsic functional connectivity. J Neurophysiol. 2011b; 106:1125–1165. [PubMed: 21653723]
Yeo BTT, Krienen FM, Sepulcre J, Sabuncu MR, Lashkari D, Hollinshead M, Roffman JL, Smoller JW, Zollei L, Polimeni JR. The organization of the human cerebral cortex estimated by intrinsic functional connectivity. Journal of neurophysiology. 2011c; 106:1125–1165. [PubMed: 21653723]
Genon et al. Page 20
Neuroimage. Author manuscript; available in PMC 2019 April 15.
Author M
anuscriptA
uthor Manuscript
Author M
anuscriptA
uthor Manuscript

Figure 1. Rendering of the two subregions (k2, upper row) and three subregions (k3, lower row) of the
left PMd yielded by the three CBP modalities.
Genon et al. Page 21
Neuroimage. Author manuscript; available in PMC 2019 April 15.
Author M
anuscriptA
uthor Manuscript
Author M
anuscriptA
uthor Manuscript

Figure 2. Rendering of the subregions yielded by the three CBP modalities at high resolution (k > 3).
Please note that for MACM-CBP the deeper cluster (blue) in the superior frontal sulcus is
not fully illustrated in the rendering (k = 5 and k = 6). The orange frame denotes the three 6k
parcellations that were combined for defining the multimodal modules.
Genon et al. Page 22
Neuroimage. Author manuscript; available in PMC 2019 April 15.
Author M
anuscriptA
uthor Manuscript
Author M
anuscriptA
uthor Manuscript

Figure 3. The five left PMd modules identified by multimodal CBP: red, rostral subregion; pink,
rostro-ventral subregion; blue, central subregion; green, caudal subregion; yellow, ventral
subregion. The five volumes are available in MNI space in the ANIMA database (http://
anima.fz-juelich.de/).
Genon et al. Page 23
Neuroimage. Author manuscript; available in PMC 2019 April 15.
Author M
anuscriptA
uthor Manuscript
Author M
anuscriptA
uthor Manuscript

Figure 4. Specific functional connectivity of the five left PMd modules: green, caudal; blue, central;
red, rostral; yellow, ventral; violet, rostro-ventral. The left multimodal PMd modules and the
right PMd clusters (previously identified in Genon et al., 2016) are illustrated as white blobs.
Genon et al. Page 24
Neuroimage. Author manuscript; available in PMC 2019 April 15.
Author M
anuscriptA
uthor Manuscript
Author M
anuscriptA
uthor Manuscript

Figure 5. Functional decoding across behavioral domains and paradigm classes of the BrainMap
database of the five multimodal modules of the left PMd.
Genon et al. Page 25
Neuroimage. Author manuscript; available in PMC 2019 April 15.
Author M
anuscriptA
uthor Manuscript
Author M
anuscriptA
uthor Manuscript

Figure 6. Schematized PMd topography revealed by right (Genon et al., 2016) and left PMd
parcellations.
Genon et al. Page 26
Neuroimage. Author manuscript; available in PMC 2019 April 15.
Author M
anuscriptA
uthor Manuscript
Author M
anuscriptA
uthor Manuscript

Author M
anuscriptA
uthor Manuscript
Author M
anuscriptA
uthor Manuscript
Genon et al. Page 27
Tab
le 1
Spec
ific
fun
ctio
nal c
onne
ctiv
ity o
f th
e fi
ve m
ultim
odal
mod
ules
acr
oss
task
s (M
AC
M)
and
rest
(R
SFC
).
Reg
ion
Ove
rlap
wit
h cy
toar
chit
ecto
nic
area
xy
zC
lust
er s
ize
Spec
ific
to c
auda
l PM
d
Prim
ary
sens
orim
otor
cor
tex
LA
rea
3bd /
4pc
−31
−22
5825
02
RA
rea
3bd /
4pc
38−
2159
346
Are
a 2b
/3be
40−
3960
12
SMA
RN
A5
−7
5124
LN
A−
4−
1668
Cer
ebel
lum
RL
obul
e V
/VIg
19−
52−
2141
9
Rol
andi
c op
ercu
lum
LA
rea
OP1
/OP3
/OP4
e−
48−
2219
216
Spec
ific
to c
entr
al P
Md
Supe
rior
par
ieta
l lob
ule/
IPS
LA
rea
7Af /
Are
a7PC
f /PF
t/5L
f−
27−
5352
404
RA
rea
hlP3
i24
−62
4812
7
Are
a hl
P3i /A
rea
2b33
−44
4712
1
Supr
amar
gina
l gyr
usR
Are
a PF
th45
−32
4024
Infe
rior
Fro
ntal
gyr
usR
Are
a 44
a51
929
56
Rig
ht h
omot
ope
of le
ft c
entr
al P
Md
RN
A28
−4
5333
9
Spec
ific
to r
ostr
al P
Md
Rig
ht h
omot
ope
of le
ft r
ostr
al P
Md
RN
A27
1252
441
Infe
rior
par
ieta
l lob
ule
RA
rea
PGph
/NA
37−
6937
129
LN
A−
32−
7835
115
Supe
rior
par
ieta
l lob
ule/
Prec
uneu
sL
Are
a 7A
f /7P
f−
6−
6851
117
RN
A8
−60
5110
0
Mid
dle
Fron
tal
RN
A47
4314
50
LN
A−
4536
2727
Spec
ific
to v
entr
al P
Md
Supe
rior
tem
pora
l/hig
her
audi
tory
cor
tex
LA
rea
TE
3i
−59
−37
1414
4
Tem
pora
l pol
eR
Are
a T
E 3
i59
−33
855
Neuroimage. Author manuscript; available in PMC 2019 April 15.
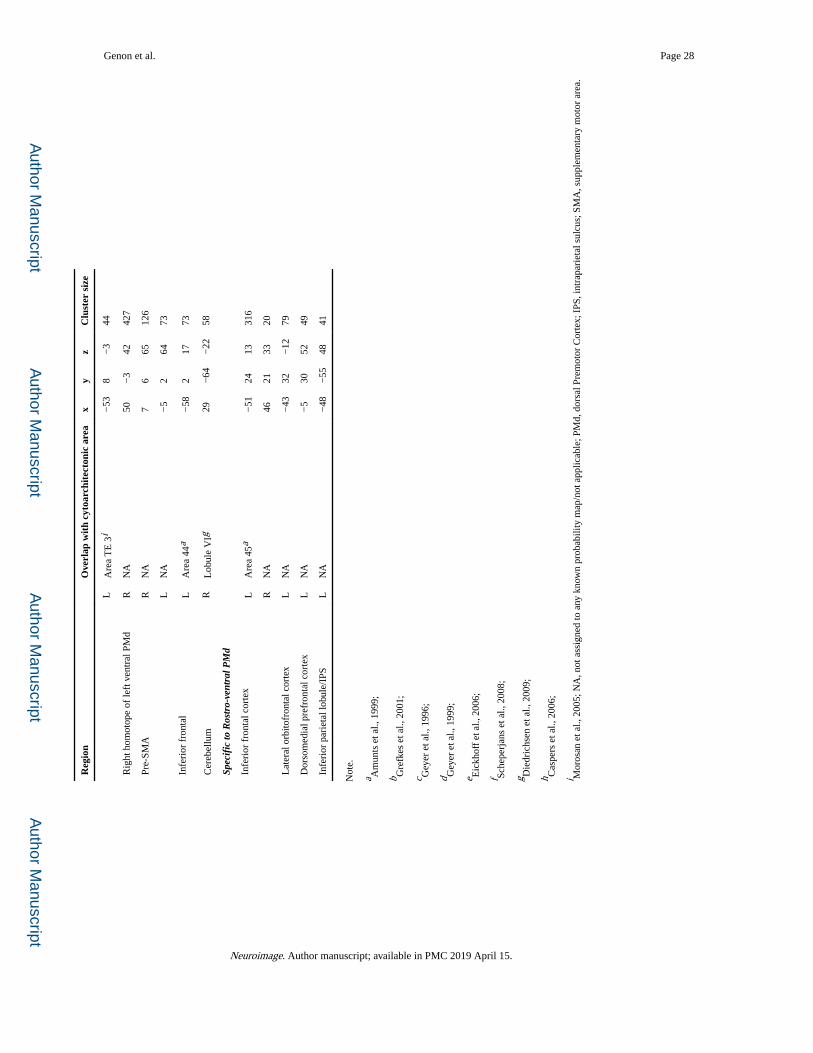
Author M
anuscriptA
uthor Manuscript
Author M
anuscriptA
uthor Manuscript
Genon et al. Page 28
Reg
ion
Ove
rlap
wit
h cy
toar
chit
ecto
nic
area
xy
zC
lust
er s
ize
LA
rea
TE
3i
−53
8−
344
Rig
ht h
omot
ope
of le
ft v
entr
al P
Md
RN
A50
−3
4242
7
Pre-
SMA
RN
A7
665
126
LN
A−
52
6473
Infe
rior
fro
ntal
LA
rea
44a
−58
217
73
Cer
ebel
lum
RL
obul
e V
Ig29
−64
−22
58
Spec
ific
to R
ostr
o-ve
ntra
l PM
d
Infe
rior
fro
ntal
cor
tex
LA
rea
45a
−51
2413
316
RN
A46
2133
20
Lat
eral
orb
itofr
onta
l cor
tex
LN
A−
4332
−12
79
Dor
som
edia
l pre
fron
tal c
orte
xL
NA
−5
3052
49
Infe
rior
par
ieta
l lob
ule/
IPS
LN
A−
48−
5548
41
Not
e.
a Am
unts
et a
l., 1
999;
b Gre
fkes
et a
l., 2
001;
c Gey
er e
t al.,
199
6;
d Gey
er e
t al.,
199
9;
e Eic
khof
f et
al.,
200
6;
f Sche
perj
ans
et a
l., 2
008;
g Die
dric
hsen
et a
l., 2
009;
h Cas
pers
et a
l., 2
006;
i Mor
osan
et a
l., 2
005;
NA
, not
ass
igne
d to
any
kno
wn
prob
abili
ty m
ap/n
ot a
pplic
able
; PM
d, d
orsa
l Pre
mot
or C
orte
x; I
PS, i
ntra
pari
etal
sul
cus;
SM
A, s
uppl
emen
tary
mot
or a
rea.
Neuroimage. Author manuscript; available in PMC 2019 April 15.