The Height of Eighteenth-Century Americans
46
Komlos, John: On the Biological Standard of Living of Eighteenth-Century Americans: Taller, Richer, Healthier Munich Discussion Paper No. 2003-9 Department of Economics University of Munich Volkswirtschaftliche Fakultät Ludwig-Maximilians-Universität München Online at https://doi.org/10.5282/ubm/epub.53
Transcript of The Height of Eighteenth-Century Americans

Komlos, John:
On the Biological Standard of Living of
Eighteenth-Century Americans: Taller, Richer, Healthier
Munich Discussion Paper No. 2003-9
Department of Economics
University of Munich
Volkswirtschaftliche Fakultät
Ludwig-Maximilians-Universität München
Online at https://doi.org/10.5282/ubm/epub.53

1
On the Biological Standard of Living of Eighteenth-Century Americans:
Taller, Richer, Healthier
John Komlos
Department of Economics
University of Munich
Abstract:
This study analyses the physical stature of runaway apprentices and military deserters
based on advertisements collected from 18th
-century newspapers, in order to explore the
biological welfare of colonial and early-national Americans. The results indicate that
heights declined somewhat at mid-century, but increased substantially thereafter. The
findings are generally in keeping with trends in mortality and in economic activity. The
Americans were much taller than Europeans: by the 1780s adults were as much as 6.6
cm taller than Englishmen, and at age 16 American apprentices were some 12 cm taller
than the poor children of London.
JEL: N11, N31, I12, I31
Key Words: Anthropometrics, Living Standards, 18th
century, colonial US

2
While the extremely rapid – and historically unprecedented - population growth
in the New World enables us to infer indirectly that the physical environment must have
been quite propitious to the health of its inhabitants relative to that of Europe, reliable
quantitative evidence substantiating this view in the colonial and early national periods
remains somewhat sparse.1 Conventional indicators of living standards such as income,
wealth, and per-capita GNP are limited both regionally and temporally, or are based on
either backward extrapolations of nineteenth century values or on Jones’s monumental
study of the wealth distribution at the time of the revolution (Jones, 1980).2 Our
knowledge of the demographic characteristics of the population is also incomplete prior
to the first federal census of 1790, and regional and local studies enable us to make few
generalizations with much confidence, particularly for the country as a whole. Though
all estimates confirm that the fertility rate was extremely high – around seven to eight
live births per married woman, - mortality trends are much more difficult to document,
because regional and local variation was considerable (Haines, 2000, p. 163). There is
consensus only in that mortality rates were lowest in New England and the Mid-Atlantic
states followed by the Upper- and then by the Lower South. Yet, the lack of systematic
information on the health (morbidity) of the population is an additional factor that
inhibits broad generalizations about the biological welfare of eighteenth-century
Americans (Duffy, 1953)
This limited evidential basis has led historians to the analysis of extant
anthropometric evidence to gain further insights into this complex of issues. Among the
first startling revelations of the this research program was the finding that the average
height of soldiers who fought in the Revolutionary War was an astonishing 172.8 cm
(68.0 inches), well above European standards for a very long time to come – even that of
the aristocracy (Sokoloff and Villaflor, 1982, p. 457; Fogel, 1986, p. 511).3 Sokoloff and

3
Villaflor’s result made it crystal clear that the low population density and abundant
natural resources of the New World combined with the diligence, hence productivity, of
the American population, conferred considerable – until then unknown - biological
advantages on its inhabitants.4 Although these benefits may not have translated
immediately into higher per-capita incomes per se, by the early national period, per
capita income in the United States might well have exceed those then prevailing in the
mother country (Prados de la Escosura, 2000; Steckel, 1999). Thus, very shortly after its
founding, the U.S. population became not only the tallest, but also one of the richest in
the world, and life expectancy, too, at least in New England was well above European
norms.5
To be sure, the physical stature of a population ought not be conflated with the
standard of living. Rather, it is useful to distinguish between conventional
conceptualizations of living standards (based on monetary aggregates), and the
biological well-being of a population. The biological standard of living is, thus, meant to
indicate in a historical context how well the human organism throve in its socio-
economic and epidemiological environment. The concept is conceived so as to capture
the biologically relevant quality-of-life component of welfare, and acknowledges
explicitly that the human experience is inherently multidimensional: welfare
encompasses more than the command over goods and services. Health in general,
including the frequency and duration of sickness, the extent of exposure to diseases, and
longevity all have a contribution to welfare independent of income.
The United Nations acknowledged these shortcomings of the conventional
measures of living standards by formulating a human development index, that merges
such factors as life expectancy, education, and, of course, income as well. As one of the
reports stated, „Human development is the end -- economic growth a means. So, the

4
purpose of growth should be to enrich people’s lives. But far too often it does not....
there is no automatic link between [economic] growth and human development (United
Nations, 1996, p. 1). Hence, we use anthropometric indicators as proxy measures for
biological welfare. To be sure, by no means do they measure the contribution of all
goods and services to well-being, and therefore they lay no claim to being a universal
indicator of living standards.
Physical stature is an ordinal measure of the biological standard of living. A
certain level of height does not necessarily have a unique counterpart in other
dimensions of well being, such as income, morbidity or mortality. It has, however, been
documented that the relationship between height and morbidity is a “U” shaped
function. Optimum height in developed economies is about 185 cm. Thereafter,
increases in height become disadvantageous to health. Moreover stunting in childhood is
associated with health outcomes throughout the life course (Costa and Steckel, 1997).
That Americans were the tallest in the world in the eighteenth century – and
remained so until the twentieth - mirrors the benefits of low population densities, a
healthier disease environment, and the seemingly endless supply of highly productive
arable land in the New World that provided an abundant source of nutrients including
proteins beneficial to the human organism.6 There were essentially no Malthusian
constraints on population growth.7 In vivid contrast, the rapid demographic expansion in
Europe after c. 1760 brought about diminishing returns to labor in the agricultural
sector, thereby impinging on the per capita availability of nutrients (Komlos, 1994,
1998).
The anthropometric evidence on eighteenth century Americans has been limited
to two sources: military enlistment records and runaway slave advertisements. In order
to broaden the evidential basis on the biological standard of living in colonial and early-

5
national America data were gleaned from newspaper advertisements pertaining to
runaway apprentices and military deserters (ICPSR Data set no. 9721). This is the first
estimate of the height of American youth in the 18th
century as well as those of soldiers
known to have been born in America. In contrast to previous studies, we also adjust our
estimates in order to account for the fact that a minimum height requirement was
imposed on soldiers.8 The results indicate that heights declined somewhat at mid-
century, but increased substantially thereafter. The findings are generally in keeping
with trends in mortality and in economic activity. By the end of the century Americans
were as much as 6.6 cm taller than Englishmen, and at age 16 American apprentices
were some 12 cm taller than the poor children of London.
The Sample
Advertisements for runaways were published regularly in newspapers in the hope
of apprehending those who broke their obligations and fled either their masters
(apprentices), or their military regiments.9 The notices generally include the name, age,
and physical description of the individuals in question, while the place of birth is
mentioned much less frequently.10
The references to physical stature of apprentices were
based on the recollection of masters, and not on actual measurements.11
This is unlikely
to be a serious source of bias, insofar as masters had an incentive to recall the height of
runaways as accurately as possible, because their return depended upon it.12
In case of
the deserters, the officers did not need to resort to memory to recall their physical
stature, because they had a written record of it obtained at mustering.13
We presume that the height of the runaways did not differ systematically from
those of the population from which they originated. In case of apprentices, this
assumption is supported by the evidence that their height profile is situated precisely
where one would expect on the basis of their social status and geographic origin. Insofar

6
as apprentices were mainly (84%) Northerners who were invariably shorter than
Southerners, it is reasonable that the height profile of the apprentices was uniformly
below those of Georgian convicts (Figure 1). Moreover, the anthropometric research of
the last two decades has found without exception that height within a population
correlated positively with social status. An exception to this generalization has not been
found. As a consequence, it is quite reassuring that the apprentices were shorter than
West Point cadets, whose families were undoubtedly better off than those of the
apprentices.
Figure 1 About Here
Similarly, there is reason to think that deserters were representative of all
enlisted men. This is the case, because desertion, as running away in case of the
apprentices, had a considerable psychological component, and must have depended in
large part on group cohesion and treatment by the officer or master. In addition,
knowledge of the terrain, access to a social support network, and such opportunistic
considerations as timing of the flight must have been more important components of the
willingness to run away than mere physical attributes. Though robustness might have
given a slight advantage initially, it must have been minimal in comparison with the
possibility of speedy apprehension with the use of horses and would have provided
little, if any, advantage in evading legal authorities on route. It is also reassuring that, in
the main, the average height of the military deserters is quite comparable to those found
in muster rolls.14
This implies that the inferences drawn on the basis of these data do not
depend as much on the nature of the sample itself as on the procedure of analysis.

7
Table 1 About Here
Apprentices
Data were collected on runaway apprentices between the ages of 14 and 23 born
between the 1730s and the turn of the nineteenth century (Table 1). These records are
valuable because they provide the very first evidence on the physical stature of
American youth at such an early date.15
The social status of the apprentices cannot be
ascertained from the advertisements, but they probably originated among the middling
sorts.16
The growth profile is estimated using regression analysis in which, in addition to
the age of the apprentices, their decade of birth, place of birth (if known), and state in
which the advertisement appeared were entered.17
Those of unknown birthplaces were
included in the analysis.18
The results pertain to the apprentices resident in
Pennsylvania, the state in which most of the advertisements were found.19
The age-by-
height-profile reveals an early and pronounced adolescent growth spurt (growth
velocity) between ages 14 and 15 of 9.1 cm (3,6 in). Both the intensity of the growth
spurt, and its early onset are signs of high nutritional status by contemporary norms
(Table 2).20
The trend over time indicates a considerable decline in nutritional status in
the 1740s of some 2 cm, of which half was recovered immediately in the 1750s.
Thereafter, heights remained constant until the 1790s (Figure 2).
Table 2 and Figure 2 about here
The height-by-age profile of the white adolescents is comparable to those of
runaway slaves of the eighteenth century and consistently above those of slaves
transported from the upper to the lower South in the nineteenth century (Figure 1 and
Table 2). Their height advantage is particularly noticeable at age 20, by which time the
apprentices were 2.6 cm (1.0 in) taller than the transported slaves. The inference is that
the free youth probably did enjoy some nutritional advantages over their slave

8
counterparts, but not overwhelmingly so. This is particularly the case inasmuch as the
slave adolescent growth spurt tended to be smaller (among the transported slaves) and
occurred at a later age of 16 or 17 (in both slave samples) than among the apprentices.
Nonetheless, the similarity between the height profiles implies that free parents probably
did not provide far greater amounts of nutrients to their children than did slave owners
for their human property.21
Both groups were rather short by modern standards until
they reached adolescence,22
when catch-up growth occurred as they entered the labor
force,23
and received additional nutrients as a form of remuneration, or efficiency wages
(Steckel, 1987).24
The apprentices were consistently much shorter than 19th
century white youth,
including both the middle-class cadets of the West Point Military Academy, and the
Georgia convicts (Figure 1). This is not surprising, given that the cadets came from
higher-status families, and that Southerners were invariably taller than Northerners. Yet,
by age 20 the apprentices were able to catch up to the stature of Georgia youth.
International comparisons reveal the immense nutritional advantages of the New World:
the lower-class American apprentices were as tall as contemporary middle-class German
youth, and at age 15 and 16 by as much as 8 cm (3.1 in) taller than their lower-class
German counterparts (Figure 3).
Table 3 and Figure 3 about here
Soldiers
Nearly 4,000 observations were collected pertaining to American army
deserters.25
Sailors, Europeans, and those of unknown provenance are excluded from the
analysis (Table 3).26
We confine our investigation to adults born in America, but do not
include the handful of men known to have been born in the Lower South (N = 15) in
order to obtain as accurate a trend as possible.27
We do not include date with unknown

9
ages or unknown birthplaces. In contrast to Sokoloff and Villaflor’s and to Fogel’s
procedure, we discard the few observations (.03 %) to the left of the minimum height
requirement (mhr) of 65 inches (165.1 cm) in order to control for variations in the
stringency with which this regulation was enforced, and also exclude men of unknown
provenance.28
Those older than 20 are included in the truncated OLS regression, and
dummy variables control for ages 20 to 22.29
Those known to have been born in a town
(N = 27) were 1.7 cm shorter on average (sig. = 0.1). The reported trend (based on 516
observations) pertains to the height of rural northern adults (older than 23 years). The
regression results were adjusted in two ways: 0.5 cm was subtracted in order to allow
for the possibility that the advertised heights were intended to describe the deserters
with their boots on, and secondly, the results were adjusted to account for the fact that
the men smaller than the mhr were not accepted into the military, and hence are absent
from the sample. Thus, the findings do not pertain to soldiers, but, instead, reflect the
estimated average height of the American population of free Northern men from whom
the soldiers were recruited. The basic result, robust across all specifications, is that
physical stature declined in the first half of the century by some 4.3 cm (1.7 in) and
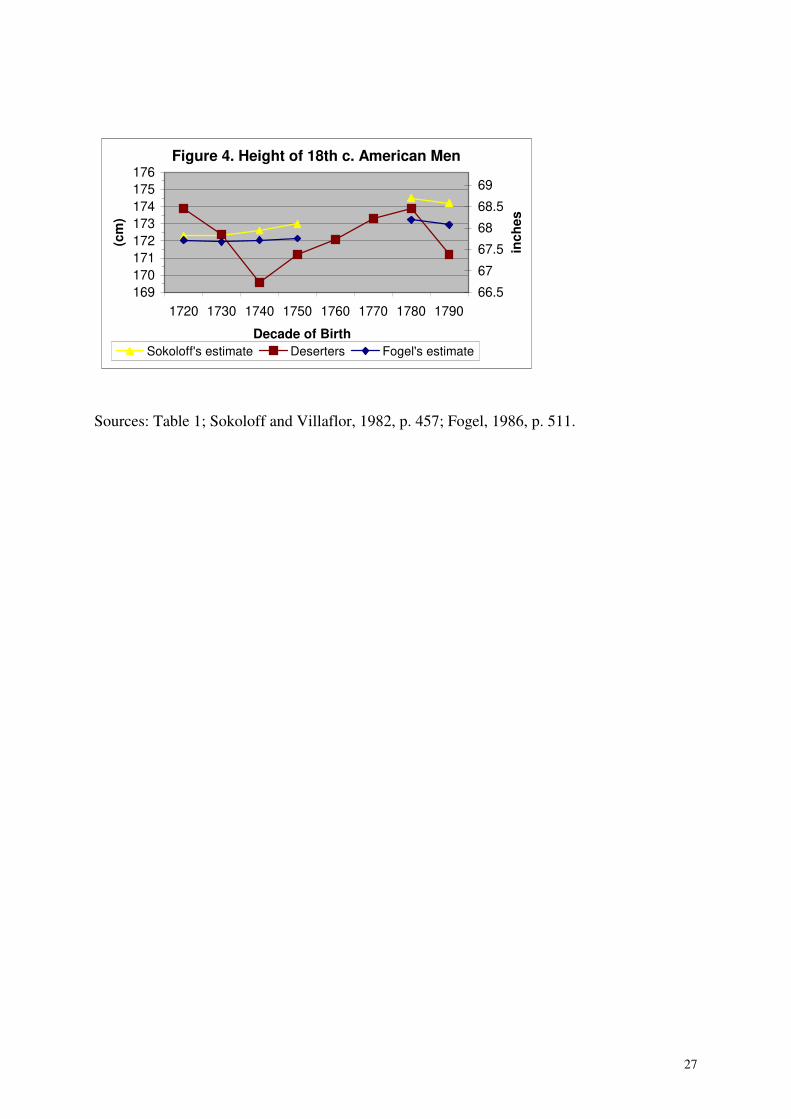
reached a trough of 169.6 cm (66.8 in) among the birth cohorts of the 1740s (Figure 4).
Estimated heights increased thereafter continuously and substantially until reaching
173.9 cm (68.5 in) in the 1780s. A reversal of 2.7 cm (1.1 in) is evident at the end of
the century.30
The trend in the height of young soldiers cannot be estimated accurately
on account of the small number of observations31
(N = 96 for ages 17-20). It is,
nonetheless, worthy of note that a marked decline is evident at mid-century among the
youth as well.32
Figures 4 and 5 about here

10
To be sure, the substantial decline in heights until mid-century is based on a
handful of observations until 1739 (N = 92).33
Yet, it is important in this regard that the
decline corresponds quite well to the decline in the physical stature of apprentices,
though their trend diverges considerably thereafter. Moreover, it is also noteworthy that
the distribution of heights in the early period is quite similar to the one obtained at the
end of the century, when heights again rose to levels comparable to the early part of the
century (Figure 5). This resemblance suggests that our sample is not distorted by the
small number of observations among the birth cohorts of the 1720s and 1730s. We also
have very tall men among the 1720s and 1780s birth cohorts with mean raw height
before adjustment of 175.2 cm. These heights are comparable to the amazing mean of
177.3 cm reported on the basis of 14 skeletal remains found at Ft. William Henry of
soldiers who died around mid-century and must have been born at the beginning of the
period under current examination (Steegmann, 1986). The distributions reveal
additionally, that in the middle period there were clearly a larger number of shorter men
in the 65 - 67 inches category. This suggests also that the middle period had an
excessive number of shorter men.
Admittedly, the negative trend does diverge from the results reported previously
for the first half of the eighteenth century, according to which heights were either
increasing slightly, or were remaining constant (Figure 4).34
This discrepancy could be
due to the fact that prior analysis was not confined to soldiers born in the New World.35
Moreover, heights of runaway slaves and the apprentices did not decline in stature
(Figure 2). What could explain this divergence? The slaves were born overwhelmingly
in the South, while the soldiers mostly in the North, so a divergence in the trends might
be due partly to the different geographic provenance. The differences in the trend in the
height of apprentices and that of soldiers might be due to the fact that adults could

11
benefit from a number of extra years of nutritional intake. If food consumption changed
primarily in the late teens and early twenties, then it is more likely to have shown up
among the adults than among the youth. Nonetheless, all in all, the trend ought to be
considered somewhat controversial until further evidence is available.
The results on the adults appear more reliable after mid-century, because the
number of observations is much larger. The trend is clearly positive until in the 1780s
by which time the same height was reached as in the 1720s. These estimates essentially
corroborate earlier findings: the other studies also found that height of soldiers increased
until the 1780s only to decline in the 1790s (Figure 4).36
This implies, in turn, that the
biological well being of Americans born after the revolution must have improved
substantially.
Conclusion
Anthropometric history enables us to illuminate the interaction of complex
demographic, economic, and biological processes for an epoch when other indicators of
well-being are rare, not extant at all, or are controversial. In spite of all their limitations,
the new height data under consideration provide rare, even if not very sharply focused
glimpses into the early history of the biological standard of living in the New World.
The analysis is based on two distinct data sets: on apprentice youth and on soldiers who
deserted. In case of the apprentices, this is the very first evidence on free American
youth in the 18th
century, and it situates for the American growth profile in a domestic
and international context. Evidently, American youth were much better nourished than
their European counterparts. Admittedly, the data set does have its own limitations. It
has few number of observations at the beginning of the period under discussion and at
younger ages. Hence, the tentative nature of some of the conclusions should be taken
into consideration in future research.

12
The height profile of the free apprentices reveals that their nutritional status was
quite similar to that of the slave population in the New World, and to that of middle
class youth in the Old. This implies, in turn, that the nutritional intake of children in
lower-class free American families must have been fairly similar to those of slave
children. In both cases children were apparently not given much protein-rich food until
they entered the labor force as teenagers (Steckel, 1987; Rees, Komlos, Lang, Woitek,
2001).37
However, insofar as mortality among slave youth was at twice the level of free
children, the generalization obviously does not apply to living standards in general
(Bodenhorn, 1998, Table 3; Steckel, 1986). American apprentices, who were not among
the elite by any means, and whose social status could, on average, be described as
middling-sort, were as tall as middle-class German youth, and much taller than their
lower class European counterparts (Figure 3).38
The advantage of our analysis of the military data is that it is confined to the
height of men known to have been born in America. Sokoloff and Villaflor did not
restrict their analysis to American-born men, and Fogel probably did not either. As a
consequence, they were unable to estimate changes in American physical stature
precisely (Figure 4). Furthermore, they also did not correct for the fact that the military
enforced a minimum height requirement that meant that shorter men were excluded
from their sample. Part of the increased volatility in heights reported above can be
ascribed to the fact that we have adjusted our estimates for the truncated height
distribution due to the minimum height requirement. For example, Fogel’s height
estimates increase by 1.5 cm between 1750 and 1780, while our estimates increase by
2.7 cm, but 1 cm of the latter increment was due to the adjustment for the truncation
bias. Our “raw” estimates increase by only 1.7 cm, almost identical to prior estimates
(Figure 9). Nonetheless, both the previous and current results confirm the biological

13
advantages of the New World already in the 18th
century: the height of Americans were
comparable, in fact, to many modern populations.
Admittedly, more archival research is needed before we can ascertain with greater
confidence the secular trend in the biological standard of living of the population of the
British Colonies of North America prior to the middle of the eighteenth century. The
small number of height observations in our sample prior to 1739 (N = 92 soldiers, and N
= 32 apprentices) do not lead to confident inferences for the first half of the 18th
century,
beyond raising the possibility of a falling trend.39
Yet, the soldiers born in the 1740s and
1750s were short relative not only to the earlier cohorts, but also to later ones, and it is
reassuring that the decline among the 1740s birth cohort is similar among both the
soldiers and the apprentices.
Figures 6, 7, 8 about here
Yet, a number of collateral evidence suggests that the data under analysis should
be taken seriously. For example, evidence on gnp and on life expectancy during the first
half of the century lends credence to the mid-century diminution in physical stature.
Estimates of per capita gnp, even if approximations, indicate a marked decline during
the revolution (Figure 6) (McCusker, 2000, p. 156).40
Similarly with life expectancy: in
Massachusetts, the state for which colonial mortality rates are best documented, life
expectancy declined during the first half of the century (Haines, 2000, p. 4).41
Furthermore, the inhabitants of several colonial towns, including Andover, MA (1735-
50), Boston (1745-1755), and Philadelphia (1745-1764), experienced a marked, even if
temporary, increase in mortality (Figure 7) (Gemery, 2000, Table 5). Moreover,
Kasakoff and Adams (2000, 117) document a substantial decline in period life
expectancy in the 1750s with rapid improvement thereafter, reaching a peak at the end
of the century42
(Figure 8). Obviously, the shortest soldiers in this sample, born in the

14
1740s, would have lived through the decade of the 1750s, and if the disease experience
in this decade was as unusually adverse, as the Kasakoff and Adams study suggests,
then the decline-in-height thesis does gain in plausibility. If lagged by a decade, their
longevity series has an extremely close correspondence with the height trends found in
this study. All in all, the demographic evidence suggests that the epidemiological
environment was by no means improving consistently during the first half of the
century, and was probably even deteriorating markedly, even if sporadically, thus
corroborating to some extent our finding of a negative height trend in this period among
the soldiers. (Figures 7 and 8).
In contrast to the results pertaining to the first half of the century under
discussion, it is quite probable that the biological standard of living was improving
substantially among Northern free men born after mid-century, corroborating earlier
findings in both the level and trend in heights, and correlating quite well with reported
significant gains in life expectancy (Gemery, 2000, Table 5; Fogel, 1986, p. 465). The
increase in New-World adult heights is also in keeping with the limited evidence we
have on dietary trends.43
We rely in this regard more on the evidence in the trend among
soldiers than among the apprentices, because adult height reflects the nutritional intake
of a longer period than those of the youth, and consequently, provide a more accurate
history of nutritional status.
Moreover, American men who were born during the first half of the century were
only slightly taller than their English cousins, but their height advantage increased
significantly thereafter.44
Insofar as European heights decreased, while American
heights increased after mid-century, the height advantage of the latter became quite
pronounced by the 1780s: possibly as much as 5.5 cm (Table 4). This anthropometric

15
evidence provides new insights on the relative advantages in biological well-being of
the New World population.
Table 4 about here
More research is obviously needed to resolve the inconsistencies between the
various estimates, but much speaks for taking the evidence at hand as the best estimates
available. The increasing trend in the physical stature of American adult men
corroborates the commonly accepted notion that the economy of the colonies was
growing robustly during the second half of the century, interrupted - temporarily, to be
sure - by the disruptive effects of the revolution (McCusker and Menard, 1991, p. 268).
Not only socially and politically was America exceptional from the very beginning of
the New Republic: it had abundant natural resources, including productive soil, a
temperate climate, low population density, and an improving epidemiological
environment in which the human organism could thrive.45
The generations of Americans
born after the birth of the new republic was no doubt taller, richer, and healthier than the
populations left behind in the Old World. This was by no means a small achievement at
the threshold of the industrial age, a time when Europeans were increasingly feeling the
binding Malthusian resource constraints associated with the demographic revolution.46
Consequently, Europeans experienced a widespread decline in physical stature, in
marked contrast to their relatives across the sea. The American apprentices at the turn of
the nineteenth century literally dwarfed the “Oliver Twists” of London by a full 12 cm
(at age 15) (Figure 3), and even relatively well nourished Austrian boys were 7 cm
below American standards. These results reveal most vividly the biological advantages
of the new continent. No wonder then, that so many Europeans were tempted to cross
the ocean in subsequent centuries in search not only of a more rewarding, but also a
more robust and healthier life.

16
Acknowledgement
I thank Bernard Harris and Jörg Baten for commenting on the manuscript and Lee Craig,
Gillian Hamilton, and John Murray for guidance on the history of apprenticeship in
America.
Appendix
Newspapers consulted
CT: The Connecticut Gazette (New Haven, 1755-1759, 1763-1820); The Connecticut
Courant (1764-1820)
DC: Washington Advertiser and National Intelligencer (1801-1814)
DE: The Delaware Gazette; or The Faithful Centinel (1785-1790)
GA: The Augusta Chronicle and Gazette of the State (1789-1806); The Gazette of the
State of Georgia (Savannah, 1763-1796) The Georgia Gazette (Savannah, 1763-
1796); The Royal Georgia Gazette (Savannah, 1779-1781)
KY: The Kentucky Gazette (Lexington, 1787-1820); Knoxville Gazette (1792-1803)
LA: The Louisiana Gazette (New Orleans, 1804-1812); Moniteur de la Louisiane 1802-
1803, 1811-1812)
Fig. 9. Height of 18th c. Soldiers (American and
unknown birthplaces)
169
170
171
172
173
174
175
176
1720 1730 1740 1750 1760 1770 1780 1790
Decade of Birth
(cm
)
66.5
67
67.5
68
68.5
69
inc
he
sSokoloff's estimate Deserters Fogel's estimate

17
MA: Boston Chronicle (1767-1770); Boston Evening Post and Chronicle (1752-1783);
The Boston Gazette and Weekly Republican Journal (1719-1798); Boston
Independent Ledger (1778-1781); Boston Evening Post (1735-1784); Boston
Independent Ledger (1778-1786); The Boston News-Letter (1704-1776); Boston
Patriot (1809-1820); New England Chronicle (Boston, 1776-1820); New England
Weekly Journal (Boston, 1727-1741)
MD: Maryland Gazette (1729-1789)
NC: The Cape Fear Mercury (Wilmington, 1769-1775); The North Carolina Gazette (
New Bern, 1751-1784)
NH: The New Hampshire Gazette (Portsmouth, 1756-1820)
NJ: The New Jersey Gazette (1777-1786)
NY: New York Gazette (1726-1739); New York Gazette or Weekly Postboy (1744-
1773); New York Mercury (1752-1768); New York Weekly Journal (1733-1751)
PA: American Weekly Mercury (Philadelphia, 1719-1746); Carlisle Gazette (1785-
1816); Freeman’s Journal (Philadelphia (1781-1790); Pennsylvania Gazette (1768-
1775); PA Journal (Philadelphia, 1742-1793) Pennsylvania Journal and Weekly
Advertiser (1773-1793); Pennsylvania Packet and The General Advertiser
(Philadelphia, 1771-1790); Pittsburgh Gazette (1786-1825); Wöchentliche Phil.
Staatsbote (1762-1779)
RI: The Newport Mercury or Weekly Advertiser (1758-1820); Providence Gazette
(1762-1825)
SC: Charleston Gazette (1778-1780); The South Carolina Gazette (Charleston, 1732-
1753)
VA: The Virginia Gazette (Williamsburg, 1736-1780); Virginia Herald and
Fredericksburg Advertiser (1792-1810)

18
VT: Vermont Gazette (1783-1792)

19
References
Baron, W. R., 1995. Historical climate records from the northeastern United States, 1640-
1900, in: Bradley, R. S., Jones, P. D. (Eds.), Climate Since A.D. 1500. Routledge, 2nd
ed.,
London and New York, pp. 74-91.
Bodenhorn, H., 1998. Early Achievement of Modern Growth: Height and Health of Free
Black Children in Antebellum Virginia. Unpublished Manuscript, Lafayette College.
Chesher, A., 1997. Diet Revealed?: Semiparametric Estimation of Nutrient Intake-Age
Relationships. Journal of the Royal Statistical Society 160 A, Part 3, 389-428.
Cheung, C., Goldberger, A., 1984. Proportional Projections in limited Dependent Variable
Models. Econometrica 52, 531-34.
Costa, D. L., Steckel, R. H., 1997. Long-Term Trends in Health, Welfare and Economic
Growth in the United States, in: Steckel, R. H., Floud, R. (Eds.), Health and Welfare during
Industrialization, University of Chicago Press, Chicago, pp. 47-90.
Duffy, J., 1953. Epidemics in Colonial America. Kennikat Press, Port Washington, N.Y..
Dye, I., 1995. Heights of Early American Seafarers, 1812-1815, in: Komlos, J. (Ed.), The
Biological Standard of Living on Three Continents: Further Explorations in Anthropometric
History. Westview Press, Boulder, pp. 95-104.
Egnal, M., 1998. The Growth of the Thirteen Colonies and Early Canada. Oxford University
Press, New York.
Eltis, D., 1982. Nutritional Trends in Africa and the Americas: Heights of Africans, 1819-
1839. Journal of Interdisciplinary History XII, 453-475.
Floud, R., Wachter, K., Gregory, A., 1990. Height, Health and History, Nutritional Status
in the United Kingdom, 1750-1980. Cambridge University Press, Cambridge.

20
Fogel, R., 1986. Nutrition and the Decline in Mortality since 1700: Some Preliminary
Findings, in: Engerman, S., Gallman, R. (Eds.), Long-Term Factors in American Economic
Growth. University of Chicago Press,Chicago, pp. 439-555.
Gemery, H. A., 2000. The White Population of the Colonial United States, 1607-1790, in:
Haines, M. R., Steckel, R. H. (Eds.), A Population History of North America. Cambridge
University Press, Cambridge, England, pp. 143-190.
Goldin, C., Parsons, D. O., 1989. Parental Altruism and Self-Interest: Child Labor among Late
Nineteenth-Century American Families. Economic Inquiry 27, no. 4, 637-659.
Haines, M. R., 2000. The Population of the United States, 1790-1920, in: Engerman, S.
(Ed.), The Cambridge Economic History of the United States, Vol. II: The Long
Nineteenth Century. Cambridge University Press, New York, pp. 143-207.
Hamilton. G., 2000. The Decline of Apprenticeship in North America: Evidence from
Montreal. Journal of Economic History 60, 627-665.
Heintel, M., 1996. Historical Height Samples with Shortfall: A Computational Approach.
History & Computing 8, 24-37.
Herndon, R. 2000. Unwelcome Americans: Living on the Margin in Early New England.
University of Pennsylvania Press, Philadelphia.
ICPSR. Data set no. 9721. Komlos, J. P.I. Descriptors and measurements of the height of
runaway slaves and indentured servants in the United States, 1700-1850
Jones, A. H., 1980. Wealth of a Nation To Be: The American Colonies on the Eve of the
Revolution. Columbia University Press, New York.
Kasakoff, A., Adams, J., 2000. The Effects of Migration, Place and Occupation on Adult
Mortality in the American North, 1740-1880. Historical Methods 33 no. 2, 115-130.
Komlos, J., 1990. Height and Social Status in Eighteenth-Century Germany. Journal of
Interdisciplinary History 20, 607-621.

21
Komlos, J., 1993. The Secular Trend in the Biological Standard of Living in the United
Kingdom, 1730-1860. Economic History Review 46, 115-144.
Komlos, J., 1994. The Height of Runaway Slaves in Colonial America, 1720-1770, in:
Komlos, J. (Ed.), Stature, Living Standards, and Economic Development. Essays in
Anthropometric History. University of Chicago Press, Chicago, pp. 93-116.
Komlos, J., 1998. Shrinking in a Growing Economy? The Mystery of Physical Stature
during the Industrial Revolution. Journal of Economic History 58, 3, 779-802.
Komlos, J., Kim, J. H., 1990. Estimating Trends in Historical Heights. Historical
Methods 23, 116-120.
Komlos, J., Rees, R., Van Lang, N., Woitek, U., 2001. The Puzzle of Slave Heights in
Antebellum America. Unpublished Manuscript, University of Munich.
Mancall, P. C., Weiss, T., 1999. Was Economic Growth Likely in Colonial British North
America?. Journal of Economic History 59, 1, 17-40.
McCusker, J. J., Menard, R. R., 1985. The economy of British America, 1607-1789.
Published for the Institute of Early American History and Culture, the University of
North Carolina Press, Chapel Hill.
McCusker, J. J., 2000. Estimating Early American Gross Domestic Product. Historical
Methods 33, 3, 155-162.
McMahon, S., 1981. Provisions Laid up for the Family: Toward a History of Diet in New
England, 1650-1850. Historical Methods 14, 22-30.
Murray, J., 1997. Generation(s) of Human Capital: Literacy in American Families, 1830-
1875 Journal of Interdisciplinary History 27: 3: 413-435
Prados de la Escosura, L., 2000. International Comparisons of Real Product, 1820-1990:
An Alternative Data Set. Explorations in Economic History 37, 1-41.
Purvis, T. L., 1995. Revolutionary America, 1763 to 180 . Facts on File, New York.
22
Sarson, S., 2000. Distribution of Wealth in Prince George’s County, Maryland, 1800-
1820. Journal of Economic History 60, 3, 847-855.
Sokoloff, K., Villaflor, G., 1982. The Early Achievement of Modern Stature in America.
Social Science History 6, 453-481.
Steckel, R., 1979. Slave Height Profiles from Coastwise Manifests. Explorations in
Economic History XVI, 363-380.
Steckel, R., 1986. A Dreadful Childhood: The Excess Mortality of American Slaves.
Social Science History X, 427-465.
Steckel, R., 1987. Growth Depression and Recovery: The Remarkable Case of American
Slaves. Annals of Human Biology XIV, 2, 111-32.
Steckel, R., 1996. Percentiles of Modern Height Standards for Use in Historical
Research. Historical Methods 29, 4 , 157-166.
Steckel, R., 1999. Nutritional Status in the Colonial American Economy. William and
Mary Quarterly 56, 1, 31-52.
Steegmann, A. T. Jr., 1986. Skeletal Stature Compared to Archival Stature in Mid-
Eighteenth Century America: Ft. William Henry. American Journal of Physical
Anthropology 71, 431-435.
Steegmann, A.T., Haseley, P.A., 1988. Stature Variation in the British American
Colonies: French and Indian War Records, 1755-1763. American Journal of Physical
Anthropology 75, 413-421.
Towner, W., 1998. A Good Master Well Served. Garland, New York.
United Nations Development Programme, 1996. Human Development Report, Oxford
University Press, New York.

23
Weir, D., 1997. Economic Welfare and Physical Well-Being in France, 1750-1990, in:
Steckel, R., Floud, R. (Eds.), Health and Welfare during Industrialization. University of
Chicago Press,Chicago, pp. 161-200.
Wrigley, E. A., Schofield, R., 1981. The Population History of England, 1541-1871: A
Reconstruction. Cambridge University Press, Cambridge.
Wrigley, E. A., Davies, R.S., Oeppen, J.E. and Schofield, R.S., 1997. English
Population History from Family Reconstitution 1580-1837. Cambridge University
Press, Cambridge

24
Sources: Table 1; Steckel, 1979: Komlos, 1987; Komlos and Coclanis, 1997.
Figure 1. American Growth Profiles
145
150
155
160
165
170
175
14 15 16 17 18 19 20 Age
cm
57
59
61
63
65
67
inc
he
s
Apprentices West Point Cadets
Georgia Convicts Transported Slaves

25
Source: Table 1; Komlos, 1994, p. 108.
Figure 2. Height of 18th c. American Men
169
170
171
172
173
174
175
176
1720 1730 1740 1750 1760 1770 1780 1790
Decade of Birth
cm
66.5
67
67.5
68
68.5
69
inc
he
s
Army Deserters Apprentices, Age 20 Runaway Slaves

26
Sources: Table 1; Komlos, 1990; Komlos, 1993.
Figure 3. International Growth Profiles
135
140
145
150
155
160
165
170
175
14 15 16 17 18 19 20 Age
cm
53
55
57
59
61
63
65
67
inc
he
s
German Lower Class US Apprentices
German Middle Class German Aristocrats
London poor
27
Sources: Table 1; Sokoloff and Villaflor, 1982, p. 457; Fogel, 1986, p. 511.
Figure 4. Height of 18th c. American Men
169
170
171
172
173
174
175
176
1720 1730 1740 1750 1760 1770 1780 1790
Decade of Birth
(cm
)
66.5
67
67.5
68
68.5
69
inc
he
s
Sokoloff's estimate Deserters Fogel's estimate

28
Source : Table 1.
Figure 5. Height Distributions in Three Periods
0
5
10
15
20
25
65 66 67 68 69 70 71 72 73 74 75
Inches
Perc
en
t
1720-1739; N = 92 1740-1759; N = 113
1770-1789; N = 201

29
Sources: Table 1; McCusker, 2000, p. 156.
Figure 6. Height and Per Capita GNP
168
170
172
174
1720 1730 1740 1750 1760 1770 1780 1790
Decade of Birth
cm
40
45
50
55
60
65
18
40
do
lla
rs
Adult Soldiers GNP

30
Source: Table 1; Gemery, 2000, p. 159.
Figure 7. Height (cm) and Crude Death Rates in
Colonial America
167
169
171
173
175
1720 1730 1740 1750 1760 1770 1780 1790
5
10
15
20
2530
35
40
45
CD
R
Height CDR - Andover CDR - Boston Philadelphia

31
Sources: Table 1; Kasakoff and Adams, 2000, p. 117.
Figure 8. Height (cm) and Period Longevity
(1870=1) in America
168
169
170
171
172
173
174
175
1720 1730 1740 1750 1760 1770 1780 1790 1800
0.2
0.4
0.6
0.8
1
1.2
1.4
1.6
Height Longevity lagged by a decade

32
Table 1. Characteristics of the Apprentice Sample - Number of Observations
Birthplace Unknown or America
Unknown 1017
American 29
Total 1046
Age Decade of Birth Residence
14 17 1730 32 New England 99
15 31 1740 103 New York 165
16 73 1750 150 Pennsylvania 589
17 171 1760 47 Ohio 15
18 263 1770 207 Upper South 156
19 304 1780 220 Lower South 10
20 157 1790 223 Unknown 12
21 8 1800 64 Total 1046
22 13 Total 1046
23 9
Total 1046
Decade of Advertisement
Percent
1740 0.4
1750 3.3
1760 13.4
1770 13.7
1780 5.1
1790 22.3
1800 17.9
1810 21.5
1820 2.4
Total 100.0
Source: ICPSR. Data set no. 9721.

33
Table 2. The Age-by-Height Profile of American Youth (cm)
Eighteenth Century Nineteenth Century
Apprentices1 Runaway Soldiers
2 Transported West Point
Slaves Slaves Cadets
Age Height Vel.3 Height Vel.
3 Height Vel.
3 Height Vel.
3
14 145.3 146.6
15 154.4 9.1 152.1 5.5
16 159.5 5.1 156.0 158.8 6.6 166.1
17 163.8 4.3 165.4 9.4 164.7 162.8 4.1 169.2 3.0
18 166.6 2.8 168.4 3.0 167.1 166.1 3.3 170.7 1.5
19 169.7 3.0 169.2 0.8 167.2 168.4 2.3 171.2 0.5
20 171.5 1.8 168.4 -- 169.3 168.9 0.5 171.7 0.5
Sources: Table 1; Komlos, 1994, p. 111; Steckel, 1979; Komlos, 1987.
1 American or Unknown Birthplaces
2 Standardized on those born in the 1780s.
3 Growth Velocity

34
Table 3. Characteristics of the Military Sample - Number of Observations
Army Deserters 3307 Birthplace Birthdecade1
Navy Deserters 609 CT 56 1710 99
Total 3916 MA 47 1720 309
Age RI 27 1730 729
16 18 New England (other) 39 1740 442
17 42 MD 54 1750 1219
18 87 VA 83 1760 244
19 128 NJ 55 1770 331
20 184 NY 84 1780 333
21 226 PA 127 1790 210
22 252 Lower South 30 Total 3916
23 243 America (other) 218
>23 1678 America Sub-total 820
unknown 1058 England 344
Total 3916 Ireland 619
Scotland 63
Wales 18
Germany 163
Holland 26
France 28
Europe Sub-total 1261
Unknown 1835
Total 3916
Source: See Table 1.
1 For those of unknown ages the birthdecade was estimated by imputing the average age of 26. The 1710s
includes those born earlier, and the 1790s includes those born thereafter.

35
Table 4. Comparison of American and English Adult Male Heights, 1720-1780
Decade of Birth
1720 1750 1790
American 171.9 to 173.9 171.2 to 172.1 173.2 to 173.9
English 172.2 170.9 168.4
Difference -0.2 to 1.7 1.2 to 2.2 4.8 to 5.5
Sources: The American ranges are from this study and from Fogel, 1986, p. 511;
Nicholas and Steckel, 1993; Komlos, 1993.

36
Endnotes
1 The population increased from about 200,000 to some 3.2 million in the course of the 18
th
century. (Gemery 2000, p. 178.)
2 For an excellent recent survey of this literature, see McCusker (2000.
3 These results were confirmed in Steegmann and Haseley (1988). They report a mean
height of 172.2 cm for those born in the 1730s. In contrast, 20-year-old German
aristocrats were 169 cm tall. (Komlos, 1990).
4 „The demand for labor in the colonies forestalled the creation of a depressed economic class,
and thereby promoted general health.“ (Duffy, 1953, p. 244).
5 Gemery suggests that the crude death rate in New England was in the range of 15-25 and in
the 30s and 40s in the cities. (2000, Table 5). In contrast, in 18th
century England, the CDR
was in the high twenties. (Wrigley and Schofield, 1981, p. 533; Wrigley, Davies, Oeppen, and
Schofield, 1997, p. 295).
6 Surprisingly, not only did free Americans benefit from the easy access to nutrients.
Unexpectedly, the nutritional and epidemiological advantages accrued to some degree, to
even the most unfortunate members of society, namely, to those of African ancestry.
Studies have consistently shown that American-born slaves were taller, and lived longer
than the brethren they were forced to leave behind in Africa. Already in the eighteenth
century American adult slaves were almost as tall as the most privileged classes in
Europe (Steckel, 1979; Eltis, 1982).
7 That the free settlers were better off in material terms than most of their contemporaries
in Europe is widely recognized (McCusker and Menard, 1985, pp. 54, 213.) Americans

37
lost their height advantage permanently only in the 1960s, to West-Europeans and
Scandinavians, whom they now trail behind by as much as seven centimeters.
8 Previous estimates underestimated the height of Americans on account of the fact that
they included soldiers of unknown provenance in the sample, but overestimated it on
account of disregarding the minimum height requirement. As it turns out, the two biases
tend to cancel each other for the most part, except for the middle of the century.
9 See appendix for a list of the newspapers consulted. We chose the newspapers simply
on the basis of availability either locally or through interlibrary loan. We did not attempt
to obtain a random sample, since the universe of all newspaper advertisements was not
known to us. Those advertisements which did not mention height were not sampled. Data
with height records were not excluded on any grounds except as specified below.
10 The trade in which the apprentices were engaged was not given in the advertisements.
11 Because most of the advertisements were placed after the 1750s, when most Americans
were numerate, there were only a handful of advertisements that mentioned a descriptor,
such as tall or short, for the size of the apprentice. Rather, numbers were used
predominantly to describe the physical stature of the youth in question. The percentage of
the advertisements that mentioned heights was not counted.
12 This is the case even though there was considerable rounding on even numbers and on
half feet intervals. However, these were largely self-canceling random errors. That is to
say, some of those who were 63 inches tall were as likely to have been advertised as 62 as
64 inches. This is evidenced by the fact that the growth profiles of the adolescents are
quite smooth over the various ages, and not markedly different from growth profiles
obtained from other populations (Figure 1). Systematic biases are not apparent. For
example, though the histogram of the 18- and 19-year-olds appear quite different from
one another, the difference in the mean height of the two age groups is quite plausible

38
(the distributions are not reported here, but are available from the author upon request).
The growth velocity of 3 cm is reasonable, insofar as they are similar to those
experienced by transported slaves (Table 2).
13 As a consequence, the height distributions of the soldiers do not show excessive
heaping on even numbers except in the period before 1740 (Figure 5).
14 The average height of the deserters including those of unknown provenance and not
adjusting for the existence of the mhr, is quite similar to those reported by Sokoloff and
Villaflor and by Fogel with the single exception of the decade of the 1740s (Appendix
Figure 9).
15 Height records on youth are rare even in the nineteenth century, with the exception of
those of slaves on account of the extant shipping manifests. The records of West Point
Cadets and Amherst students begin at age 16, which is too late to estimate the adolescent
growth spurt.
16 Many eighteenth-century apprentices came from middling sort families; their parents
wanted them to learn additional or more lucrative skills. But some pauper apprentices, for
example propertyless orphans, are probably also included in the sample (Hamilton 2000,
Herndon, 2000, Murray, 1997, Towner, 1998).
17 The regression is not reported here in its entirety, because all variables except age were
insignificant, with the only exception being the residents of New England, who tended to
be taller than the means reported in Table 2 by some 1.7 cm (0.7 inches). ). The level is
standardized on height of 20-year-old apprentices advertised in Pennsylvania.
Pennsylvanian youth were equal to the average height across the sample.
18 Insofar as birthplaces were not mentioned in 97 % of the advertisements, the
presumption is that it was considered common knowledge of the time that apprentices
were predominantly American born. Nonetheless, a handful of European boys might well
39
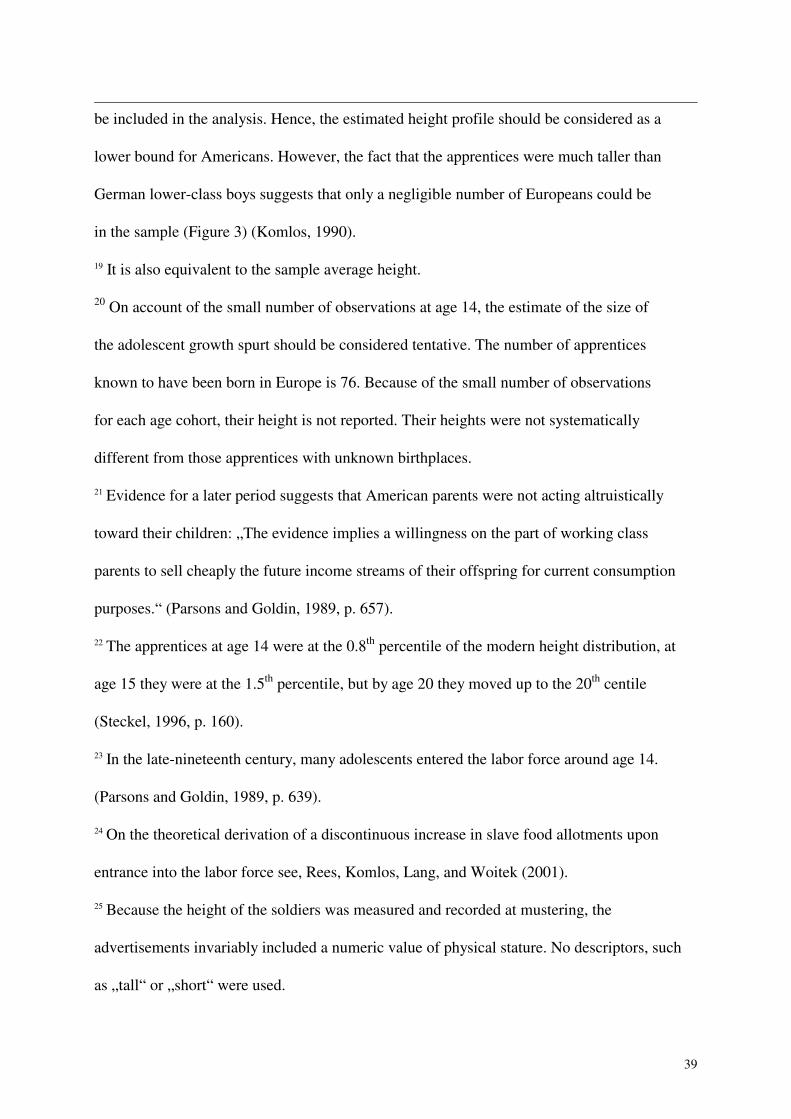
be included in the analysis. Hence, the estimated height profile should be considered as a
lower bound for Americans. However, the fact that the apprentices were much taller than
German lower-class boys suggests that only a negligible number of Europeans could be
in the sample (Figure 3) (Komlos, 1990).
19 It is also equivalent to the sample average height.
20 On account of the small number of observations at age 14, the estimate of the size of
the adolescent growth spurt should be considered tentative. The number of apprentices
known to have been born in Europe is 76. Because of the small number of observations
for each age cohort, their height is not reported. Their heights were not systematically
different from those apprentices with unknown birthplaces.
21 Evidence for a later period suggests that American parents were not acting altruistically
toward their children: „The evidence implies a willingness on the part of working class
parents to sell cheaply the future income streams of their offspring for current consumption
purposes.“ (Parsons and Goldin, 1989, p. 657).
22 The apprentices at age 14 were at the 0.8
th percentile of the modern height distribution, at
age 15 they were at the 1.5th
percentile, but by age 20 they moved up to the 20th
centile
(Steckel, 1996, p. 160).
23 In the late-nineteenth century, many adolescents entered the labor force around age 14.
(Parsons and Goldin, 1989, p. 639).
24 On the theoretical derivation of a discontinuous increase in slave food allotments upon
entrance into the labor force see, Rees, Komlos, Lang, and Woitek (2001).
25 Because the height of the soldiers was measured and recorded at mustering, the
advertisements invariably included a numeric value of physical stature. No descriptors, such
as „tall“ or „short“ were used.

40
26
The analysis of the height distribution of the runaway sailors reveals right hand truncation.
They were not subject to a minimum height requirement, but to a maximum one: 70 inches for
Americans and 69 inches for Europeans. As a consequence, they were shorter than the
infantry. The number of observations is much too small, however, to attempt to extract
meaningful information on the trend in the sailors’ height. Subsequent samples of the height
of sailors also show that there were both minimum and maximum height requirements (Dye,
1995). The height of the British and Irish soldiers in our sample are not comparable to their
American-born counterparts, because, as for sailors, their height distribution reveals the
presence of not only a left-hand, but also of a right-hand truncation. This should not be
surprising, because that was also the case among the Royal Marines. Having a physical stature
much above the average was a disadvantage aboard ships, and a maximum height limit was
obviously applied to those soldiers who were shipped across the ocean to fight in America
(Komlos, 1993).
27 Those born in the Lower South were not included, because they were too few in
number to ascertain the trend in their height independently from that of Northerners. The
trend we report is very robust: the inclusion of these data has only a marginal impact on
the results. Similarly, if we include in the analysis the height of ages 16 to 19 known to
have been born in America, the basic trends reported here remain unaffected. State in
which the advertisement appeared was not included in this regression.
28 Of the adults, 13 from 381 were excluded from the regresssion on this ground (Komlos
and Kim, 1990).
29 (Adjusted) R
2 = 0.03, F = 2.5 (significant at the 1 percent level) N = 516. Truncated
regression analysis (TOLS) has been found in simulation exercises to yield the most robust
and accurate estimates of trends (Heintel, 1996; Cheung and Goldberger, 1984). TOLS is
based on ordinary least squares regression after eliminating all observations below the

41
minimum height requirement (mhr); the distribution of heights is unbiased to the right of this
point. Though the conditional coefficient estimates obtained by TOLS are not accurate, they
are biased by a constant factor of proportionality. That is to say, both the signs of the
coefficients, and their relative ordering are unbiased. This is crucial, because after we obtain
our estimates of the height of the soldiers from the truncated regressions, we convert the
coefficients to the true population means of all Northern free men as follows: assume that the
standard deviation of 6.858 cm for modern populations also held in 18th
century America;
assume, furthermore, that the truncation point was at the mhr of 65 inches (165.1 cm); take a
normal distribution with mean 170.0 cm and s.d. 6.858 cm and discard all observations below
165.1 cm; then calculate the mean of the truncated distribution and obtain 172.78 cm. That is,
if the mean of the soldiers‘ height above the mhr in the sample was 172.78 cm, then the mean
height of the population of men from which the soldiers were drawn was 170.0 cm. In this
manner the following schedule was obtained:
Mean of Truncated Mean of true
Distribution(cm) Distribution (cm)
169.0 172.25
170.0 172.78
171.0 173.34
172.0 173.95
173.0 174.60
174.0 175.29
This schedule was used to obtain the estimates of the height of the American male
population from the calculated truncated means. We assume that the standard deviation
of the height of the underlying population remained unchanged throughout the period at
6.858 cm, inasmuch as research on modern population has shown that the standard
deviation remains essentially constant even if the mean of the distribution changes
substantially over time.

42
30 The trend of the height of young soldiers (17-20 years old) cannot be estimated accurately
on account of the small number of observations (N = 96)
31 The growth profiles of the young soldiers is also inaccurate, but at some ages, the estimates
are similar to those of apprentices (Table 2).
32 Height is standardized on age 20.
-1739 18 174.7
1740-1769 30 169.3
1770-1799 48 173.7
33 Nonetheless, the decline in height in the 1740s and 1750s relative to the 1720s and 1730s is
significant at the 0.03 level. Put another way, the likelihood that they originated from a
population of the same average height is 3 out of a 1000. Similarly, the increase in height
between the 1740s and 1750s and the 1770s and 1780s is significant at the 0.04 level.
34 Sokoloff and Villaflor report a constant trend until the 1740s and a slightly increasing
one in the 1750s, while Fogel reports a constant trend throughout the first half of the
century (Figure 4). However, our procedure for analysis is not comparable. While we
confine our analysis to soldiers known to have been born in America, Sokoloff and
Villaflor included in their regressions also the height of European-born soldiers as well as
those of unknown provenance. As a consequence, the trend in the height of Americans is
unavailable by themselves in their study. Fogel, on the other hand, does not report the
method of his analysis, and it is left to the reader to surmise that his data are probably
based on those reported by Sokoloff and Villaflor.
35 Steegman and Haseley’s (1988) study does analyze American-born men separately, but their
study is confined, in the main, to the birth-cohorts of the 1730s, and hence not suitable for
determining a trend.

43
36
Sokoloff and Villaflor and Fogel also report that heights increased between 1750 and the
1780s only to decline in the 1790s (Figure 4). The diminution in heights in the 1790s is
perhaps an indication that the distribution of wealth became more unequal at the turn of the
century. One local study finds that to have been the case in Maryland between 1800 and 1820.
(Sarson, 2000). Another possibility is that the physical stature of the 1790s birth cohort is a
reflection of the disruptions of associated with the War of 1812 – which many of them would
have lived through as teenagers.
37 Food consumption today among adolescents increases substantially during their
growth spurt: in Britain calorie intake increases from circa 1500 to about 2000 kcalories
between the ages of 10 and 15 (Chesher, 1997).
38 During the second half of the eighteenth century American apprentices at age 20 were -
at 171.5 inches - fully 7.5 cm taller than French youth of the same age (Weir, 1997, p.
191; Komlos, 1990).
39 In addition, a recent study finds that the colonial economy was probably not growing
(Mancall and Weiss, 1999). However, another study emphasizes the increase in living
standards (Egnal, 1998).
40 While this economic downturn would not have affected the birth cohorts of the 1740s, it
could well have had an impact on the nutritional status of those born in the 1750s.
41 A genealogical study indicates that among northern white males period life expectancy at
age 10 seems to have declined slightly between 1725 and 1739, and then stagnated thereafter
until 1760 (Fogel, 1986 p. 465).
42 There is a bit of evidence that climatic conditions may not have been propitious in the
1750s. This was much colder than average decade with many thunderstorms, but the 1760s
and 1780s were also cold when heights increased (Baron, 1995, pp. 83, 88).

44
43
Though, during the first half of the century the meat-consumption trend does not correlate
positively with the height trend reported here. Meat allowances for widows increased steadily
during the course of the 18th
century from about 120 pounds to 180 pounds, and peaked in the
early 19th
century at 200 pounds. Most noticeable were the increases among the least well-to-
do widows. While only 20 percent of them received any meat allowance at the beginning of
the century, this share doubled by 1800. Fresh meat allowances were not mentioned in wills at
all until 1800, but then increased quickly until fully 20 percent of all wills mentioned them
(McMahon, 1981, pp. 17-18).
44 Initial research underestimated the height of Englishmen, because it was not known
that the recruiters of the Royal Marines systematically discriminated against tall men.
Thus, the average height reported of 164.3 cm for the birth cohort c. 1740-1750 is
downwardly biased and not representative of the English male population. Sokoloff and
Villaflor, 1982 , pp. 457-58). The heights reported by Floud, Wachter and Gregory (1990,
p. 148) fluctuate too randomly to be considered reliable for international comparisons.
45 “The eighteenth century brought a definite improvement in colonial health. The rising
standards of living... and the development of a colonial-born population were primarily
responsible for this change.„ For example, because of improved drainage, New England was
free of malaria by the outbreak of the Revolution, and the introduction of inoculation by the
second half of the century brought an end to epidemics of smallpox (Duffy, 1953, pp. 242-
243).
46 Compared to a population density of 157 persons per square mile in England, in the
United States there were merely 13 inhabitants per square mile around 1800, even
though population size had doubled during the quarter century after the Revolution from
3.1 to 6.6 millions. Even in densely populated Connecticut average farm size was 60

45
acres with 13 head of cattle and 7 swine in stock. European peasants and farmers only
dreamt of such prosperity (Purvis, 1995, pp. 11, 38).