The Healthy Neighbourhood Audit Instrument:...
20
School of Economics and Finance Curtin Business School 7 th Australasian Housing Researchers’ Conference 6 th – 8 th February 2013 Esplanade Hotel, Fremantle, Western Australia The Healthy Neighbourhood Audit Instrument: Understanding the Environmental and Socio-Cultural Conditions to Support Healthy, Happy and Resilient Residential Communities Emily Mitchell City Futures Research Centre, University of New South Wales, Sydney, Australia Susan Thompson City Futures Research Centre, University of New South Wales, Sydney, Australia Corresponding author: Emily Mitchell [email protected]
Transcript of The Healthy Neighbourhood Audit Instrument:...

School of Economics and Finance
Curtin Business School
7th Australasian Housing Researchers’ Conference
6th – 8th February 2013
Esplanade Hotel, Fremantle, Western Australia
The Healthy Neighbourhood Audit Instrument: Understanding the Environmental and Socio-Cultural Conditions to Support Healthy,
Happy and Resilient Residential Communities
Emily Mitchell City Futures Research Centre, University of New South Wales, Sydney, Australia
Susan Thompson City Futures Research Centre, University of New South Wales, Sydney, Australia
Corresponding author:
Emily Mitchell [email protected]

2
Abstract:
It is now well understood, in both the research literature and urban planning practice, that residential environments have a critical role to play in supporting human health. This is particularly so in relation to the prevention of chronic illnesses such as heart disease, diabetes, depression and some cancers. The built environment has a significant impact on three of the main behavioural risk factors for these chronic diseases - physical inactivity, social isolation and obesity. This paper presents our Healthy Neighbourhood Audit Instrument which we use to examine the intricate relationship between human health and the built environment. The central aim of our Audit is to systematically document, using a comprehensive observational thematic framework, how diverse residential neighbourhoods mitigate the major risk factors for chronic disease, thereby supporting good physical and mental health. The paper provides a description of the full instrument, explaining its theoretical foundations in urban planning and its developmental stages. We discuss how the Audit has been applied in an ongoing research project examining four diverse neighbourhoods in the state of New South Wales (NSW), Australia. These sites have varying residential densities, as well as commercial, open space, food and transport provision. The Audit captures these qualities via meticulous environmental observations, GIS mapping of key facilities and infrastructure, as well as recording qualitative socio-cultural environmental observations about the use of space. The paper concludes with a brief discussion of the wider applicability of the Healthy Neighbourhood Audit for housing and related researchers. It is also of use to planning and health practitioners. The combination of the instrument’s detailed observational approach, its use of quantitative and qualitative data and the incorporation of GIS mapping, facilitate a comprehensive understanding of how diverse residential neighbourhood environments positively and negatively affect human health.
Keywords:
Healthy built environments; observational audit instrument; urban planning; health

3
Introduction: Physical inactivity, social isolation and poor nutrition are three of the key risk factors for chronic disease. These factors contribute to the burden of diseases such as cardiovascular disease, diabetes, depression and some cancers (Daar et al 2007). There is a significant, and still growing, body of evidence exploring the relationship between the design of neighbourhoods and the ability of people to be physically active, interact socially with others, and access healthy foods in their everyday lives (see for example, Dannenberg et al 2011; Kent et al 2011; Corburn 2009; Mead et al 2006; Frumkin et al 2004; Barton and Tsourou 2000). This research suggests that public transportation systems; street networks; walking and cycling infrastructure; composition of land uses; location of destinations and services; and open space are some of the key factors in determining the extent to which people are willing and able to engage in healthier lifestyles (Kent et al 2012; Dannenberg et al 2011; Kent et al 2011; Pikora et al 2003). From our perspectives as urban planners, we have been actively engaged in building understandings about the role of the built environment in supporting human health and well-being. We are part of the Healthy Built Environments Program (HBEP) – a collaboration between the University of New South Wales (UNSW) and the New South Wales (NSW) State Department of Health (HBEP 2013). Established in 2009, the HBEP receives its core funding from the Department of Health. It is situated in a built environment faculty at the University and is one of the key programs in the City Futures Research Centre. In 2011, the HBEP completed a review of the research evidence relating to the role of the built environment in supporting human health as part of everyday living (Kent et al 2011). A set of related Fact Sheets, particularly designed to assist health and urban planning practitioners working in this field, has also been developed from the Literature Review (HBEP 2013a). This major Review demonstrates that the relationship between health and the built environment is strong, however, it is also complex and highly contextual, and further research is needed to understand how best to plan and design neighbourhoods which support and enhance active living, social interaction and access to healthy food sources (Kent et al 2011:105). As part of our research in the HBEP, we have been using the findings of our Literature Review in an ongoing longitudinal study examining how urban environments support health in four residential sites in, and just south of, Sydney. The research, entitled Planning and Building Healthy Communities, is being undertaken with Australian Research Council (ARC) funding in partnership with built environment and health partners – UrbanGrowth NSW (formerly Landcom), the South Western Sydney Local Health District and the National Heart Foundation (HBEP 2013b). The main objective of the research is to identify the design features, social interventions and locational qualities that positively benefit human health, and describe the likely health outcomes for future Australians living in areas with similar characteristics. A major methodology for the ARC research project has been the development and utilisation of a Healthy Neighbourhood Audit Instrument to examine the intricate relationship between human health and the built environment. Of particular interest is the evaluation of the study sites where people live, move and interact. Employing the HBEP Literature Review, our principal aim has been to explore the impact of these environments on physical activity levels, social interaction and cohesion, and access to healthy food options. This paper presents our full Audit Instrument. We explain the Audit’s theoretical foundations in urban planning and its developmental stages. Further, we discuss how the Audit has been applied in the ARC research project – demonstrating how the Instrument captures residential, commercial, recreational and institutional land use information, food availability and transport options with its application of meticulous environmental observations,

4
Geographic Information System (GIS) mapping of key facilities and infrastructure, as well as recording qualitative socio-cultural environmental observations about the use of space. The paper concludes with a brief discussion of the wider applicability of our Healthy Neighbourhood Audit. The instrument has the potential to be used by researchers, policy-makers, urban planners and public health practitioners as they continue to build an understanding of the key design elements that facilitate or hinder engagement in healthy behaviours. Environmental Audit Instruments: A number of different measures have been developed to assess and quantify the relationship between the built environment and health – including accelerometers, surveys and questionnaires, GIS analysis, walkability assessment tools, and audit tools. The majority of these instruments have been developed to explore the relationship between neighbourhood design and utilitarian or leisure time physical activity (Wong 2011; Schaefer-McDaniel 2010; Pikora et al 2002). There are also a number of tools which look at the social and food environments, but few have been developed to explore the impact of a particular neighbourhood on physical activity, social interaction and access to healthy food sources at the same time. The Healthy Neighbourhood Audit Instrument we have developed differs from existing measures by including consideration of the food and social environment as well as the walking and cycling environment. It is intended that a completed audit will provide a holistic overview of the subject neighbourhood, and an in depth understanding of the character of the neighbourhood as well as the physical attributes, destinations, facilities, services, and food sources available. So what is an audit? According to Brownson et al, an audit uses ‘systematic observations’ to ‘objectively and unobtrusively quantify attributes of the built environment’ (2009: S100). It is a reliable method for recording the presence and quality of land uses, street networks and design elements, and the behaviour of people in specific settings (Brownson et al 2009: S106; Brownson et al 2004:478). Although some data relating to features of the built environment can be gathered from GIS databases and aerial photographs, many elements are not commonly captured by these sources. It is essential to use direct observation of the environments under study. Audits typically explore the presence, type and quality of land uses; streets and traffic; sidewalks; bicycling facilities; public space and amenities; parking; built form and safety indicators. Some also include measures of noise; presence of dogs; incidence of health promotion supports; and counting of people (Brownson et al 2009: S107). Schaefer-McDaniel et al describe how systematic social observations of the neighbourhood context have become a popular method for exploring and measuring neighbourhood conditions (2010: 278). Such observations take a number of different forms – such as making videotapes or conducting ‘windshield’ assessments while driving through a neighbourhood, or completing a checklist on foot. These methods allow researchers to capture data relating to social behaviours and interactions, signs of physical disorder such as rubbish and graffiti, and quality and use of neighbourhood facilities (Schaefer-McDaniel 2010: 278; Dunstan et al 2005: 294). As Brownson et al state, ‘Research questions that involve the human qualities of the environment (how a place looks and feels) are especially appropriate for a direct observation. The detailed data that can be collected by direct observation can produce results of particular value for those who can act on the findings such as urban designers, landscape architects, and traffic engineers’ (2009:S107). We have used these understandings of auditing in the development of our Healthy Neighbourhood Audit, which is presented in the next section.

5
Development of our Healthy Neighbourhood Audit Instrument: The Healthy Neighbourhood Audit Instrument allows for the user to systematically record, map and evaluate the environments in which people live, move and interact through direct observation methods, with the aim of exploring the impact of these environments on physical activity levels, social interaction and cohesion, and access to healthy food options. The first version of our audit instrument was developed for teaching purposes by Thompson and Romero (2008) utilising the principles of classic urban planning observational practice and theory. The importance of understanding the relationship between physical place and human interaction has long been a central concern of urban planners and related professionals such as urban sociologists (Whyte 1980), geographers (Tuan 1977; Relph 1976) and designers/place makers (Jan Gehl writing in Danish in the 1970s and then translated into English in 1987). Detailed observations of the everyday actions of people in familiar and ordinary places characterise their work. This has enabled an appreciation of the complexities of spatial qualities and human interaction in all their diversity, complexity and messiness. Jane Jacobs (1961) observed the use of New York neighbourhoods in her ground breaking development of principles to create people centered cities – ones where safety, walkability, sense of belonging and vibrant street life are prioritised over and above car dominated and socially isolating urban environments. More recently, theories of place and place making, using detailed observations of ordinary, every-day places, have been linked to environmental and human health (Eyles and Williams 2008). Gehl (2010; Gehl et al 2006) has built on his earlier work, reinforcing the importance of detailed observations of city life enabling in-depth insights into the nature of urban spaces and how people move within and use them. Together with her own urban planning experience of conducting land use surveys of different neighbourhoods, Thompson used the urban planning legacy of detailed observational practice in developing her audit tool. To better understand how health is supported by different environmental qualities, reference was also made to healthy built environment resources, such as the National Heart Foundation’s Neighbourhood Walkability Checklist (http://www.heartfoundation.org.au/SiteCollectionDocuments/HFW-Walkability-Checklist.pdf); the NSW Premier’s Council for Active Living’s Healthy Planning Checklist (http://www.pcal.nsw.gov.au/resources/presentations); the St Louis University School of Public Health Active Neighbourhood Checklist (http://www.activeforlife.info/generations/Resources/Toolkits/Active%20Neighborhood%20Checklist.pdf); and the Healthy Urban Environments Site Assessment Audit (http://www.heartfoundation.org.au/SiteCollectionDocuments/ABD-HUE-Site-Audit-Tool.pdf) published by the Heart Foundation, Vic Health, SunSmart and the Planning Institute of Australia, as well as traditional planning models such as Crime Prevention Through Environmental Design (see for example Cozens 2007). Initially tested by students in a healthy planning course, Thompson’s audit had the following main sections, relating to: General impressions of the site Street network (pedestrian and bicycling facilities; public transport) Land use (residential, commercial, institutional and recreational) Food access (prepared meals and fresh produce) Social interaction Psychological, emotional and spiritual belonging
This tool was used as the basis for our Healthy Neighbourhood Audit. After testing and retesting in the field, it was reworked to allow for greater efficiency in data collection and incorporation of complementary GIS data. The conceptual framework supporting the instrument was largely derived from the three key domains of healthy built environments

6
identified in the Healthy Built Environments Program’s Literature Review – Getting People Active, Connecting and Strengthening Communities and Providing Healthy Food Options (Kent et al 2011:13). The intention was to capture and incorporate the broadest range of built environment considerations identified by researchers, practitioners and industry leaders into one comprehensive audit instrument. The Healthy Neighbourhood Audit Instrument: In this section of the paper we give full details of the Audit so that other researchers and practitioners can make best use of the instrument – adapting it for their specific circumstances. A full copy of the Audit can also be downloaded from the HBEP web site (HBEP 2013b). Initially, it is critical to record basic data regarding auditors, localities, weather and other conditions on the day of data collection. We have developed this rudimentary list which is at the start of the Audit:
• Names of auditors • Date (including the day of the week) and time of audit • Description of weather conditions • Please note any other particulars which may have an impact on the results of the audit
(e.g. whether the audit is being undertaken during the school holiday period) The first substantive section of Audit focuses on collection and assessment of land use data. This is reproduced in Table One below. Lists of typical residential, recreational, institutional, commercial, community and other uses are provided in table format, with corresponding map reference codes. The auditor can use these reference codes to quickly and efficiently record the land uses on either a paper or digital map. The land use section also contains questions relating to the character and quality of land uses in the neighbourhood; the behaviour of people present in the locality at the time of the audit; availability, quality and affordability of commercial food sources; the presence and quality of community gardens and farmers’ markets; and the impact of form and style of buildings on the quality of the pedestrian environment. Using a cadastral map of the site, auditors note the category of land use on each allotment according to the table. Aerial photos and site plans can be used to collect land use information, but they have to be current. Data from aerial photos and site plans must be verified through site visits and noted on the audit. The emphasis of data collection is on detailed observations in the field – mostly on foot as auditors undertake the work in teams.

7
Table One: Land use data
Detailed nature of land use Ref. on map
Residential:
Detached dwelling R1 Terrace/ townhouse R2 Duplex/semi-detached R3 Dual occupancy R4 Unit (up to 3 storey) R5 Unit (3 storeys and above – note the amount of storeys on the map) R6
Other Describe on map
Mixed use: Commercial/Residential - Note the specific uses on the map MU
Recreational:
Open/green space Rec1 Park Rec2 Playground Rec3 Equal access playground Rec4 Sports field Rec5 Recreational walking path/cycleway Rec6 Outdoor gym Rec7 Basketball/tennis court Rec8 Swimming pool Rec9 Lawn bowling green Rec10 Amenities for people with physical impairments (describe on map) Rec11
Water Sensitive Urban Design/open space Rec12 Private open space Rec13 Other Describe on map
Institutional/ services:
Hospital or ‘long hours’ medical centre S1 Doctor’s surgery S2 Chemist S3 Dentist S4 Other health/medical facility (describe on map) S5 Child care centre S6 Nursing home/aged housing S7 Primary school S8 Secondary school S9 Other Describe on map
Commercial:
Fast food/takeaway shop F1 Café/restaurant F2 Pub/bar F3 Supermarket/grocery store F4 Convenience store F5 Retail store (describe on map) C1 Office (describe on map) C2 Other Describe on map
Community facilities:
Community centre Com1 Library Com2 Town square Com3 Other Describe on map
Community gardens/edible
plantings:
Note the location of community, verge or school gardens Com.G
Derelict buildings/spaces:
Note the location of derelict buildings/spaces (if possible note last use) D
Vacant buildings/spaces or construction:
Note the location of vacant buildings or spaces (if possible note last use) V
Note the details of any construction (i.e. future use) Con

8
An important aspect of the Audit data is site photography and careful recording of the exact location of images so that they can be digitally linked to the GIS maps. Here we show some examples of recording land use photographically from our ARC study sites.
Above (L to R): Rouse Hill - Main Street in the Town Centre; medium density residential development; children’s playground designed for different abilities by providing wheelchair access and a range of sensory experiences (such as a water pump and plants with different textures and smells).
Above (L to R): Airds Bradbury – shopping centre; newly developed seniors’ housing; The Pond – a community landmark; the Men’s Shed.
Above (L to R): Victoria Park - high density residential development; green open space; community library. As well as completing the table, the Audit requires further assessment of land uses to be recorded as qualitative assessments. Detailed information is categorised exactly as follows: General
• What overall quality/character dominates the land use? Take note of the residential density, types of housing, extent of commercial development, and any other key built, natural or social features present within the neighbourhood.
• Describe the number of people present in the locality at the time of the audit. What spaces are they using? Make a note of particular spaces which are popular with children, young people, adults and older adults.

9
Commercial and Food Access • Is there a sufficient mix of retail to serve the local community?
Prepared Meals • What is the general price of a meal in a fast food/takeaway shop? • What is the general price of a meal in a café/restaurant? • What is the general price of a meal in a pub/bar? • Overall comments about the quality of prepared meals available – quality and value Community Gardens & Farmers’ Markets • Describe the types of crops in the garden/s. • If there are no edible gardens in the area, is there potential for some? Where? • Nearest location of farmers’ market: • Frequency of farmers’ markets: • What is the price of a kilo of a basic vegetable or fruit (i.e. carrot, lettuce, apple,
orange) at the farmer’s market? • What is the price of a kilo of organic carrots at the farmers’ market?
Built Form
• Consider the form and style of the residential, institutional and commercial buildings. • Does the built form provide an opportunity for passive surveillance (i.e. through
allowing people to overlook the street)? • Do the buildings and their uses encourage pedestrian activity? • How does the building relate to the human scale? (i.e. is it welcoming, does it
contribute to a pleasant and safe environment for those walking past?) • How easy is it to identify the land use from the facade of the building?
The second section of the instrument provides for the collection of data relating to the street network. This is provided in Table Two below. Cadastral maps are used to create a number of street network maps that include the street pattern and details of the road network; parking; walking and cycling infrastructure; street furniture; traffic calming elements; public transport; and safety and surveillance. Rating systems and reference codes are provided. This section also contains questions about how the streets accommodate the needs of all users, the amenity of the streets, and connectivity between different land uses. As with the land use table data collection, aerial photos and site plans can be used for street network information, as long as the material is up-to-date and verified on site during the audit.

10
Table Two: Street network
Streetscape Issue Element Ref. On map
Traffic lanes Note the number of lanes and direction of traffic on
the map Posted speed limits Note speed limits for each
street on the map Road use Light (T-L)
Moderate (T-M) Heavy (T-H)
Signage/way finding Note and describe the directional and instructional
signage around the site Other Describe on map
Parking:
Unrestricted parking P1 Metered parking P2 Time restricted parking (note time on map) P3
Parking station P4 Resident only parking P5 Disabled parking P6 Mothers with prams parking P7 Car share parking spaces P8 Motorcycle parking P9 Bicycle parking P8 Loading zones P10 Taxi rank P11 Bus stop P12 Other Describe on map
Walking/Footpaths:
Footpaths W1 Signalised pedestrian crossings W2 Painted pedestrian crossings W3 Note whether crossing the street is accessible for all (e.g. people with limited mobility or parents with prams)*
Accessible (Acc.) Not accessible (N/Acc.)
Material of footpaths Dirt (D) Concrete (Con) Bitumen (Bit) Paving (Pav)
Cobblestone (Cobb) Other (describe on map)
Quality of footpaths (i.e. consistency and evenness of surfaces, presence of trip/slip hazards)
Poor (M-P) Average (M-A)
Good (M-G) Width of footpaths Measure and note the width
of footpaths on the map Gradient of footpaths Flat (G-F)
Moderate (G-M) Steep (G-S)
Other (describe on map) Type of buffer between footpath and street (i.e. trees, fence/railing)
Note and describe on the map
Types of obstructions along the footpaths (e.g. overgrown vegetation, café dining)
Note and describe on the map

11
Walking/Footpaths: (ctd)
Visibility along footpaths Poor (V-P) Average (V-A)
Good (V-G) Connectivity of footpaths Continuous (Cont.)
Abrupt end (Abr.) Type of shading of footpaths Awning (Awn.)
Shade structures (Sh.St) Vegetation (Veg)
Other (describe on map) Quality of shading of footpaths Poor (Sh-P)
Average (Sh-A) Good (Sh-G)
Other Describe on map
Street furniture/amenities:
Street lights A1 Benches/seating A2 Shade structure/awnings A3 Trees A4 Gardens/plants A5 Telephone booths A6 Bubblers/ drinking fountains A7 Public toilets A8 Rubbish bins A9 Flagpoles/banners A10 Community noticeboards A11 Public art (describe on map) A12 Dog litter bags and bins A13 Other Describe on map
Cycling:
Recreational cycling lanes C1 Utilitarian cycling lanes (i.e. for transport) C2
Shower/changing facilities C3 Bicycle storage C4 Types of obstructions along cycle lanes (e.g. overgrown vegetation)
Note and describe on the map
Connectivity of cycle lanes Continuous (Cont.) Abrupt end (Abr.)
Other Describe on map
Traffic calming:
Speed hump TC1 Chicane/ one way slow point TC2 Roundabout TC3 Flashing lights TC4 Restricted street entry TC5 Landscaping TC6 Designated share zones TC7 Traffic calming absent but required (describe particular issues on the map) No TC
Other Describe on map
Public Transport:
Bus stops PT1 Train stations PT2 Time schedule TS Frequency of service arrival Note and describe on the
map Signage/ way finding Note and describe the
directional and instructional signage relating to the public transport stop
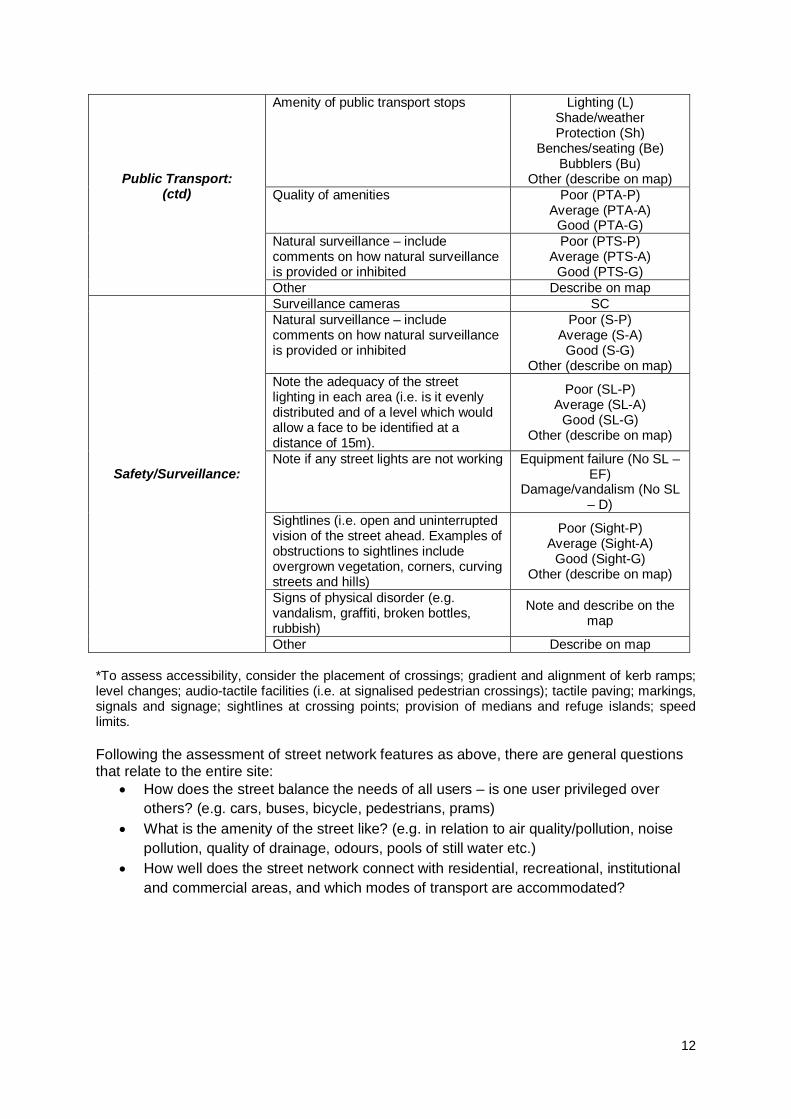
12
Public Transport: (ctd)
Amenity of public transport stops Lighting (L) Shade/weather Protection (Sh)
Benches/seating (Be) Bubblers (Bu)
Other (describe on map) Quality of amenities Poor (PTA-P)
Average (PTA-A) Good (PTA-G)
Natural surveillance – include comments on how natural surveillance is provided or inhibited
Poor (PTS-P) Average (PTS-A)
Good (PTS-G) Other Describe on map
Safety/Surveillance:
Surveillance cameras SC Natural surveillance – include comments on how natural surveillance is provided or inhibited
Poor (S-P) Average (S-A)
Good (S-G) Other (describe on map)
Note the adequacy of the street lighting in each area (i.e. is it evenly distributed and of a level which would allow a face to be identified at a distance of 15m).
Poor (SL-P) Average (SL-A)
Good (SL-G) Other (describe on map)
Note if any street lights are not working Equipment failure (No SL – EF)
Damage/vandalism (No SL – D)
Sightlines (i.e. open and uninterrupted vision of the street ahead. Examples of obstructions to sightlines include overgrown vegetation, corners, curving streets and hills)
Poor (Sight-P) Average (Sight-A)
Good (Sight-G) Other (describe on map)
Signs of physical disorder (e.g. vandalism, graffiti, broken bottles, rubbish)
Note and describe on the map
Other Describe on map *To assess accessibility, consider the placement of crossings; gradient and alignment of kerb ramps; level changes; audio-tactile facilities (i.e. at signalised pedestrian crossings); tactile paving; markings, signals and signage; sightlines at crossing points; provision of medians and refuge islands; speed limits. Following the assessment of street network features as above, there are general questions that relate to the entire site:
• How does the street balance the needs of all users – is one user privileged over others? (e.g. cars, buses, bicycle, pedestrians, prams)
• What is the amenity of the street like? (e.g. in relation to air quality/pollution, noise pollution, quality of drainage, odours, pools of still water etc.)
• How well does the street network connect with residential, recreational, institutional and commercial areas, and which modes of transport are accommodated?

13
The Audit results in a thorough record of every detail of the street network. Images from our research, which can be linked to the GIS maps, demonstrate this below.
Images above (L to R): Airds Bradbury – damaged footpath; bus shelter; footpath network; damaged street light.
Images above (L to R): Rouse Hill – bicycle storage lockers; signage for shared pathway; damaged tactile surface at foot of staircase; signage promoting active transport.
Images above (L to R): Victoria Park - a footpath located alongside a heavy traffic road, with a buffer of trees; bicycle parking; a dedicated parking space for a car sharing service; a shaded streetscape. The third section of the Audit relates to overall issues and impressions of the site. It includes open ended questions about the following issues:
• Relationship of the site to the broader area, including public transport nodes; services, shops and destinations
• Feelings and perceptions of safety (this is particularly important and needs to relate to both day and evening conditions, as well as the different sensitivities and realities for men, women, the aged, children and those with disabilities)
• Social inclusion and belonging (for example, are there specific facilities, services and spaces provided for different community groups; are there any obvious signs of disharmony)
• Religious and cultural diversity (again, facilities are noted here as well as cultural features, monuments and celebratory spaces)
• Use of public spaces for social interaction. Psychological, emotional and spiritual belonging are also considered in this part of the Audit. Specifically, what aspects of this environment might contribute to a feeling of belonging in this locality? Auditors note both physical and socio-cultural features. Space is also provided in this section for the auditor to record overall impressions in response to the following questions:

14
What is your overall impression of the neighbourhood? How do you think others from different backgrounds would feel about this area? What is the general accessibility of the area? What is the general level of safety in the area? Is it easy to be physically active in this area? Is it easy to access healthy foods in this area? What is the aesthetic condition of the neighbourhood? Is this neighbourhood a healthy built environment? Would you live here? Why/why not?
Images below show examples of social and cultural features in our study sites that contribute to feeling safe or unsafe, community facilities that engender a sense of belonging and alienation, and inclusive public spaces such as dog parks.
Images above (L to R): Airds Bradbury – Reiby Juvenile Detention Centre; Greengate Community Garden; a temporary community garden in a demolished area; an underpass.
Images above (L to R): Rouse Hill – pet parking station; community garden in residential area; community garden in Town Centre.
Images above (L to R): Victoria Park – residents socialising with their dogs in Joynton Park; green open space; seating alongside Joynton Park. The final two sections of the audit provide space for the auditor to record any recommendations for improvements in the neighbourhood, as well as any additional thoughts or observations not covered by the questions in the instrument. The paper now turns to a description of how the audit instrument is used in the field.

15
The Healthy Neighbourhood Audit in Practice: Given the theoretical and practice assumptions embraced by the Healthy Neighbourhood Audit, it is designed to be completed on foot with auditors spending a lot of time in the field taking detailed observations. While data collection can be complemented by windshield observations and use of existing GIS data, the aim is for auditors to experience a form of immersion in the neighbourhood as they conduct their assessments. This in the tradition of urban planning observational practice as discussed previously. The audit instrument provides for a combination of objective observations – for example, the presence or lack of certain features like footpaths and street furniture, as well as the level of maintenance of such features – and subjective observations based on perceptions and feelings. While the inclusion of subjective items can be problematic in terms of reliability and validity of data, the intention is to record as comprehensive and all-encompassing a picture of each neighbourhood as possible. This data is subsequently used to inform surveys and interviews with residents and key stakeholders (described further in the next section of the paper). It has been noted in other research that even though items which require subjective assessment show poor reliability, there is no real alternative method for measuring such important elements as community feelings of safety and belonging (Millington et al 2009: 480). Additionally, although repeated observations undertaken at the same time, during similar weather and other conditions would allow for greater validation of findings (Schaefer-McDaniel et al 2010: 288), due to the labour intensive nature of the exercise, this is unable to take place. To address this, qualitative assessments are completed on a weekday, weekend day and at night to account as much as possible for time-varying items (for example, public spaces which may be used more heavily on a weekend; or places which may feel safe during the day but not at night). For the Planning and Building Healthy Communities study, cadastral maps of each site were acquired from the relevant local councils and used as a base map. The information on these maps was of variable quality, and at times needed to be augmented with data from other sources, such as Google Maps (http://maps.google.com.au/) or NearMap (http://www.nearmap.com/). The audits were completed by a team of interdisciplinary auditors – from urban planning and health backgrounds, with GIS expert support. Each audit was undertaken by the same core group of people to ensure a shared understanding of the items in the audit and consistent evaluation across the sites. Coding for land uses, street networks and infrastructure was entered into a GIS application on an iPad, while observations were recorded via note taking (pen and paper on the audit instrument). Every detail of each site was also recorded photographically. The images below show our audit team in the field – day and night.
Images above (L to R): assessing safety and quality of lighting at night; auditors entering data into the GIS software on the iPad and paper copy of the audit instrument; measuring footpaths.

16
Following finalisation of data collection using the Audit, a comprehensive report will be generated for each study site. This will include tabulated information, images, maps and text descriptions. A ‘Report Card’ will be included to provide a qualitative assessment of the overall availability and quality of distinct elements of the built environment in each neighbourhood (for example, whether the quality of street lighting is ‘poor’, ‘needs improvement’, or ‘good’). The purpose of the Report Card is to highlight the ways in which the built environment in each locality may or may not support healthy behaviours in everyday life. Recommendations for improvements will conclude the report. Preliminary GIS mapping has been completed for three of the four case study sites – Airds Bradbury, Victoria Park and Rouse Hill. Some examples are shown below.
Maps above (L to R): Street lights in Airds Bradbury; footpaths in Airds Bradbury
Maps above (L to R): Trees and land uses in Rouse Hill

17
Map above shows an amalgam of GIS data on land uses, street trees, amenities and cycling facilities in Victoria Park. In addition to the audits, separate assessments of the food environments of each neighbourhood are being undertaken to provide a deeper understanding of how residents access healthy food. A Market Basket Survey Instrument is used to record the availability, price and quality of food items needed to satisfy typical nutritional requirements. A similar assessment tool has been developed to investigate the cost, quality and diversity of produce at farmers’ markets, as well as perceptions and attitudes of customers, stallholders, and residents. This research is currently underway. Based on detailed understandings of the study sites that the Audit has given us, a list of questions for discussion at focus groups for each neighbourhood has been developed. A survey has also been created, which focus group participants will be asked to complete immediately prior to the group discussion. The survey includes questions about how the environment supports healthy living. They relate to perceptions of neighbourhood quality and amenity; walking and cycling; active recreation; social interaction; and access to fruits and vegetables. The results of the audits, GIS mapping, and food environment assessments, interviews and focus groups will be analysed in relation to quantitative population health data for each of the four sites. This will include basic demographic data (socio-economic status, ethnicity, age) and certain characteristics used to assess ill-health like chronic disease rates (e.g. heart disease, diabetes rates); skin cancer prevalence (e.g. melanoma rates); mental health hospitalisation rates; and overweight and obesity. Data on healthy eating (fruit and vegetable consumption) and physical activity rates will also be used. It is anticipated that the results will be written up and published early in 2014. Conclusion: This paper has presented our Healthy Neighbourhood Audit in all its detail so that it can be used and adapted by researchers, policymakers and practitioners wanting to understand how a broad range of environments, particularly residential, positively or negatively affect health. The combination of the instrument’s meticulous and detailed observational approach, grounded in the traditions of urban planning, its use of quantitative and qualitative data and the incorporation of GIS mapping, facilitate a comprehensive understanding of the qualities of the built environment that support health and wellbeing. The Healthy Neighbourhood Audit can help us understand - on a deeper level - how people interact with their local environment
18
– and the sorts of facilities, infrastructure and different design elements we need to provide, to enable people to live healthier lives. References: Badland, H.M., Schofield, G.M., Witten, K., Schluter, P.J., Mavoa, S., Kearns, R.A., Jinckson, E.A., Oliver, M., Kaiwai, H., Jensen, V.G., Ergler, C., McGrath, L. and McPhee, J. 2009. ‘Understanding the Relationship between Activity and Neighbourhoods (URBAN) Study: research design and methodology.’ BMC Public Health 9: 224. Barton, H and Tsourou, C. 2000. Healthy Urban Planning: A WHO guide to planning for people. London: Spon Press on behalf of the World Health Organisation Regional Office for Europe. Brownson, R.C., Chang, J., Eyler, A.A., Ainsworth, B.E., Kirtland, K.A., Saelens, B.E. and Sallis, J.F. 2004. ‘Measuring the Environment for Friendliness Toward Physical Activity: A Comparison of the Reliability of 3 Questionnaires.’ American Journal of Public Health 94(3): 473-483. Brownson, R.C., Hoehner, C.M., Day, K., Forsyth, A. and Sallis, J.F. 2009. ‘Measuring the Built Environment for Physical Activity: State of the Science.’ American Journal of Preventive Medicine 36(4S): S99-S123. Corburn, J. 2009. Toward the Healthy City: People, places, and the politics of urban planning. Cambridge: The MIT Press. Cozens, P. 2007. ‘Public health and the potential benefits of Crime Prevention Through Environmental Design.’ NSW Public Health Bulletin 18(11-12): 232-237. Daar, A.S., Singer, P.A., Persad, D.L., Pramming, S.K., Matthews, D.R., Beaglehole, R., Bernstein, A., Borysiewicz, L.K., Colagiuri, S. Gangully, N., Glass, R.I., Finegood, D.T., Koplan, J., Nabel, E.G., Sarna, G., Sarrafzadegan, N., Smith, R., Yach, D. and Bell, J. 2007. ‘Grand Challenges in chronic non-communicable diseases.’ Nature, 450(22): 494-496. Dannenberg, A., Frumkin, H. and Jackson, R. (Eds). 2011. Making Healthy Places: A Built Environment for Health, Well-Being and Sustainability. Washington: Island Press. Dunstan, F., Weaver, N., Araya, R., Bell, T., Lannon, S., Lewis, G., Patterson, J., Thomas, H., Jones, P. and Palmer, S. 2005. ‘An observation tool to assist with the assessment of urban residential environments.’ Journal of Environmental Psychology 25(3): 293-305. Eyles, J. and Williams, A. (Eds). 2008. Sense of Place, Health and Quality of Life. Aldershot: Ashgate: 31-44. Frumkin, H., Frank, L. and Jackson, R. 2004. Urban Sprawl and Public Health: Designing, planning and building for healthy communities. Washington: Island Press. Gehl, J. 2010. Cities for People. Washington: Island Press. Gehl, J. 1987. Life Between Buildings: Using Public Space. New York: Van Nostrand Reinhold. Gehl, J., Gemzøe, L., Kirknaes, S. and Søndergaard, B. 2006. New City Life. Copenhagen: The Danish Architectural Press.

19
HBEP (Healthy Built Environments Program). 2013. Healthy Built Environments Program. http://www.be.unsw.edu.au/programmes/healthy-built-environments-program/about accessed 4 April 2013. HBEP (Healthy Built Environments Program). 2013a. Fact Sheets. http://www.be.unsw.edu.au/programs/healthy-built-environments-program/fact-sheets accessed 4 April 2013. HBEP (Healthy Built Environments Program). 2013b. Australian Research Council Linkage Grant: Planning and Building Healthy Communities: A Multidisciplinary Longitudinal Study of the Relationship Between the Built Environment and Health. http://www.be.unsw.edu.au/healthy-built-environments-program/research accessed 4 April 2013.
Jacobs, J. 1961. The Death and Life of Great American Cities. New York: Random House. Kent, J., Thompson, S. and Capon, A. 2012. ‘Healthy Planning’, Chapter16 in Thompson, S. and Maginn, P.J. (Eds). Planning Australia: An Overview of Urban and Regional Planning. Melbourne: Cambridge University Press. Kent, J., Thompson, S.M. and Jalaludin, B. 2011. Healthy Built Environments: A review of the literature. Sydney: Healthy Built Environments Program, City Futures Research Centre, UNSW. Leslie, E., Coffee, N., Frank, L., Owen, N., Bauman, A. and Hugo, G. 2007. ‘Walkability of local communities: Using geographic information systems to objectively assess relevant environmental attributes.’ Health & Place 13(1): 111-122. McMillan, T.E., Cubbin, C., Parmenter, B., Medina, A.V. and Lee, R.E. 2010. ‘Neighbourhood sampling: how many streets must an auditor walk?’ International Journal of Behavioural Nutrition and Physical Activity 7:20. Mead, E., Dodson, J., and Ellway, C. 2006. Urban Environments & Health: Identifying Key Relationships & Policy Imperatives. Brisbane: Urban Research Program on behalf of Griffith University. Millington, C., Thompson, C.W., Rowe, D., Aspinall, P., Fitzsimons,C., Nelson, N., and Mutrie, N. 2009. ‘Development of the Scottish Walkability Assessment Tool (SWAT).’ Health & Place 15(2): 474-481. National Heart Foundation of Australia. 2011. Neighbourhood Walkability Checklist: How walkable is your community? Victoria: National Heart Foundation of Australia. National Heart Foundation of Australia. (Victorian Division). 2004. Healthy by Design: a planners’ guide to environments for active living. Victoria: National Heart Foundation of Australia (Victorian Division). National Heart Foundation of Australia. (Victorian Division) (No date) Healthy Urban Environments Site Assessment Audit. National Heart Foundation of Australia, Vic Health, SunSmart and the Planning Institute of Australia.

20
Pikora, T.J., Bull, F.C.L., Jamrozik, K., Knuiman, M., Giles-Corti, B. and Donovan, R.J. 2002. ‘Developing a Reliable Audit Instrument to Measure the Physical Environment for Physical Activity.’ American Journal of Preventive Medicine 23(3): 187-194. Pikora, T., Giles-Corti, B., Bull, F., Jamrozik, K. and Donovan, R. 2002. ‘Developing a framework for assessment of the environmental determinants of walking and cycling.’ Social Science and Medicine 56(8): 1693-1703. Relph, E., Place and Placelessness. Pion: London. Schaefer-McDaniel, N., O’Brien Caughy, M., O’Campo, P. and Gearey, W. 2010. ‘Examining methodological details of neighbourhood observations and the relationship to health: A literature review.’ Social Science and Medicine 70(2): 277-292. St Louis University School of Public Health. 2006. Active Neighbourhood Checklist. St Louis, USA: St Louis University School of Public Health. Thompson, S.M and Romero, V. (2008) ‘Healthy Planning – An innovative interdisciplinary learning experience for built environment and medical students’, Paper presented to the 46th International Making Cities Livable Conference, "True Urbanism: Designing the Healthy City", Santa Fe, NM, June 1-5, 2008. Tuan, Y-F. 1977. Space and Place: The perspective of experience. Minneapolis: University of Minnesota Press. Whyte, WH. 1980. The Social Life of Small Urban Spaces. Washington: The Conservation Foundation. Wiggins, D. 2009. Healthy Planning Checklist. Sydney: NSW Premier’s Council for Active Living. Wong, F., Stevens, D., O’Connor-Duffany, K., Siegel, K. and Gao, Y. 2011. ‘Community Health Environment Scan Survey (CHESS): a novel tool that captures the impact of the built environment on lifestyle factors.’ Global Health Action 4:5276.