
The Health and Economic Impacts of Obesity in Alameda County · the Health and economic Impacts of...
66
The Health and Economic Impacts of Obesity in Alameda County Potential Policy Interventions jsi.com May 2014 changelabsolutions.org
Transcript of The Health and Economic Impacts of Obesity in Alameda County · the Health and economic Impacts of...
The Health and Economic Impacts of Obesity in Alameda CountyPotential Policy Interventions
jsi.comMay 2014changelabsolutions.org
2The Health and Economic Impacts of Obesity in Alameda County changelabsolutions.org I jsi.com
Acknowledgments
Many thanks to the following organizations for their support in conducting key informant interviews
and focus groups:
•Alameda County Public Health Department
•Alameda County Public Health Commission
•REACH Ashland Youth Center
•Oakland Unified School District
•HOPE Collaborative
•Oakland Food Policy Council
The research team would also like to thank the Alameda County Community, Assessment, Planning,
Education and Evaluation (CAPE) Unit for providing much of the data and figures for this report.
Thanks also to the individuals listed in Appendix 3 who provided valuable insight as key informants.
ChangeLab Solutions is a nonprofit organization that provides legal information on matters relating
to public health. The legal information in this document does not constitute legal advice or legal
representation. For legal advice, readers should consult a lawyer in their state.
© 2014 ChangeLab Solutions

3The Health and Economic Impacts of Obesity in Alameda County changelabsolutions.org I jsi.com
tAble of contents
executive summary 4
development of this Report 6
Health and economic Impacts of obesity in Alameda county 7
findings from Qualitative Research with stakeholders 19
Policy scan and gaps Analysis 28
conclusion 44
Appendix 1. secondary data Analysis methods 45
Appendix 2. methods for Qualitative Research with stakeholders 46
Appendix 3. key Informants Interviewed 47
Appendix 4. documents Reviewed and/or searched for Policy scan 48
Appendix 5. Policy scan matrix 49
endnotes 59

4The Health and Economic Impacts of Obesity in Alameda County changelabsolutions.org I jsi.com
executIve summARy
the damaging health effects of obesity are creating a diminished quality of life for too many Alameda county residents and costing the county billions of dollars every year.
Obesity, and childhood obesity in particular, has reached crisis proportions throughout the United States.
Although most Alameda County residents fare better than much of the nation, the rates of obesity and
overweight are still alarmingly high. Rates are disproportionately high in low-resource communities,
including East and West Oakland and parts of Hayward and Union City. Obesity puts people at risk for a
host of chronic diseases, including diabetes, cardiovascular disease, high cholesterol, hypertension, and
some cancers.
•In Alameda County, more than half (54.6 percent) of adults1 and a third (34.7 percent) of school-aged
children (in grades 5, 7, and 9)2 are overweight or obese.
•Heart disease and diabetes—both of which are tied to obesity—were among the 10 leading causes of
death in Alameda County in 2010.3
•Diabetes and metabolic/nutritional disorders were among the 10 most common reasons for
hospitalization of children in Alameda County between 2007 and 2011.4
obesity is costing Alameda countyobesity and obesity-related chronic diseases are extremely costly with an estimated 20.6 percent
of all healthcare dollars nationwide spent treating obesity.5 In 2006, the combined costs of health care
spending and lost productivity associated with overweight, obesity, and physical inactivity in Alameda
County were estimated at $2.17 billion, and were projected to rise by as much as much as 28 percent
between 2007 and 2011.6 Alameda County itself spends an astounding amount of money each year on
obesity-related health care costs alone. In the 2013-14 fiscal year, the County allocated $653.9 million to
healthcare costs;7 according to national estimates of spending on obesity-related disease, $134.7 million of
these allocated costs will be spent treating obesity-related diseases.
sugary drinks contribute to obesity and dental diseasesugary drink consumption is a key contributor to high rates of overweight and obesity8,9 and is
also associated with increased risk of dental disease.10 Sugary drinks include any beverage with added
caloric sweeteners, such as sodas, energy drinks, sweetened iced teas, sports drinks, flavored milk,
flavored waters, and sweetened juice drinks that are not 100 percent fruit juice.
•Nearly a third (31.3 percent) of Alameda County children aged 2 to 11 and almost two-thirds (63.7
percent) of Alameda County adolescents aged 12 to 17 drink one or more sugary drinks per day.11 As a
result, they may be adding upwards of 1,000 calories per week to their diets from sugary drinks alone.
•Dental disease among children is rampant across Alameda County school districts: 69 percent of
third graders have experienced some form of dental disease, including 31 percent with untreated
dental caries.12
the local food environment discourages Healthy eatingHigh rates of sugary drink consumption are fueled by a local food environment that offers easy
access to retailers that sell unhealthy foods. It is very difficult to make healthy choices in this
environment that is inundated with unhealthy choices.
•In 2007, there were nearly five times as many fast food restaurants and convenience stores as
supermarkets and produce vendors in Alameda County.13
•Residents in many parts of the County rely on convenience stores and other small food retailers with
a limited selection of healthy foods.14
5The Health and Economic Impacts of Obesity in Alameda County changelabsolutions.org I jsi.com
Potential Policy InterventionsUnless the County takes bolder action to combat the obesity epidemic, it will fail to fulfill its responsibility to
protect the health and welfare of county residents. Many social and environmental factors influence individual
behaviors and contribute to high rates of obesity. Just as there is no single cause of obesity, there is no single
solution. The good news is that local government can have a significant impact on the environmental factors
that contribute to obesity by implementing strong policy interventions that promote health.
No one policy intervention will radically improve public health; rather, a collection of strategies will create
environments that promote health. In this report, we identify a number of policy strategies that have the
potential to advance the healthy eating landscape in Alameda County. These strategies fall into four broad
categories and include:
1. Public Awareness: Create new public awareness campaigns conducted by the Alameda County
Department of Public Health to directly support policy strategies and interventions.
2. Healthy eating on government Property: Update the Alameda County Nutrition and Physical Activity
Policy and Guidelines by adopting stronger nutrition standards that apply to a broader range of County
facilities and programs.
3. Healthy eating in schools: Support and encourage school districts in Alameda County to adopt
policies that go well beyond state and federal minimums in order to support healthy eating and active
living by students.
4. community-wide Policies: Adopt innovative community-wide policies aimed at improving the local food
environment in Alameda County, potentially including:
› Impose an excise tax on sales of sugary drinks and earmark the proceeds for public health initiatives.
› Limit unhealthy food sales by mobile vendors, particularly near schools and parks.
› Establish certification programs to improve the nutritional quality of foods in stores and/or
restaurants.
› Adopt a licensing ordinance requiring retailers to stock healthy foods and beverages.
› Use zoning or Conditional Use Permits (CUPs) to restrict sales of unhealthy foods, particularly near
schools and parks.
› Establish nutrition standards for restaurant children’s meals, or prevent sugary drinks from being
included with a children’s meal.
The Public Health Department, working closely with the community, county leaders, and other stakeholders, can
decide which strategies most closely meet the needs of Alameda County residents, are the most feasible, and
will best promote a healthy food environment. This report provides a brief description of each strategy listed
above to help guide these decisions. There are, however, political, legal, administrative, and enforcement issues
related to each policy that are beyond the scope of this report and must be developed further to create a sound
policy that will succeed in Alameda County. It is important to note that across the United States, few policies
have been implemented to specifically address the consumption of sugary drinks, and the policies and programs
that are currently most widely utilized (educational campaigns, government procurement and vending, and
sales in schools, Nos. 1-3 above) are also already employed in the County to some extent. Going beyond these
foundational strategies will require bold action and a comprehensive vision for the County’s built environment.
conclusionAlameda County and its cities have a strong history of promoting community health by addressing the social
and environmental factors that drive chronic disease rates. In order to succeed in the ongoing fight against the
obesity epidemic, the County must leverage and strengthen its existing programmatic and policy efforts and
adopt wide-reaching strategies to combat high rates of obesity and associated chronic diseases.
6The Health and Economic Impacts of Obesity in Alameda County changelabsolutions.org I jsi.com
develoPment of tHIs RePoRt
Alameda County public health officials are developing a better understanding of how the health of
County residents is impacted by the environments in which they live, work, and play, in order to identify
population-based policy strategies to create an environment that is more conducive to healthy lifestyles.
As part of that effort, the Alameda County Department of Public Health commissioned this report on
obesity in the County, focu sing on four areas:
1. The health and economic effects of obesity and obesogenic foods through a review of current
literature and secondary data analysis of existing health data. The report places a particular
emphasis on the impact of sugary drink consumption, a key contributor to high rates of overweight
and obesity, as well as dental disease.
2. Current policies across Alameda County regarding healthy eating and sugary drinks in particular.
3. Stakeholder perspectives on the causes and impacts of obesity in Alameda County, and potential
solutions, through key informant interviews and focus groups.
4. Recommendations for potential policy and regulatory changes that could be implemented by
Alameda County to curb obesity and reduce consumption of sugary drinks.
The purpose of this report is to provide information to stimulate discussion among Alameda County Public
Health Department staff, Public Health Commission members, elected officials, and other stakeholders
about different policy options for promoting healthy eating in Alameda County.
7The Health and Economic Impacts of Obesity in Alameda County changelabsolutions.org I jsi.com
HeAltH And economIc ImPActs of obesIty
In AlAmedA county
In the past thirty years, obesity has reached epidemic proportions in the United States and Alameda
County is no exception. Nationally, obesity rates among adults have soared to 34.9 percent while an
additional 33.6 percent are overweight, and therefore at risk of becoming obese.15 Among U.S. children
and adolescents up to age 19, 16.9 percent are obese.16 Obesity rates are higher among racial and ethnic
minorities, particularly among the Hispanic/Latino and African-American populations (42.5 percent and
47.8 percent are obese, respectively), compared to non-Hispanic whites (32.6 percent).17
Although California and Alameda County fare better than much of the nation, the rates are still alarmingly
high. In the state of California, 24.8 percent of adults are obese and another 35 percent are overweight.18
Among adults in Alameda County, 21 percent are obese and 33.6 percent are overweight.19 Just over a
third (34.7 percent) of school-aged children (in grades 5, 7, and 9) in Alameda County are overweight or
obese, a rate that is slightly below California’s statewide average (38 percent).20
The health effects of obesity are both devastating and costly: obesity increases one’s risk of numerous
chronic diseases, including type II diabetes, cardiovascular disease, stroke, and some cancers. For
California’s counties, obesity and obesity-related chronic disease impose significant costs on the
healthcare system, particularly for the public sector.21 Obesity is a condition with many contributing
factors; poor diet and lack of physical activity are central among its many causes. The food system in
the United States is characterized by a plethora of cheap and unhealthy food options in large portions,
readily available to consumers at fast food establishments, convenience stores, and grocery stores.22 In
low-income neighborhoods in particular, access to healthy foods is limited or prohibitively expensive when
compared to junk foods.
The following section describes the health and economic impact of obesity in Alameda County, based
on a secondary analysis of data from the Alameda County Public Health Department and other publicly
available sources (see Appendix 1 for methods and limitations).
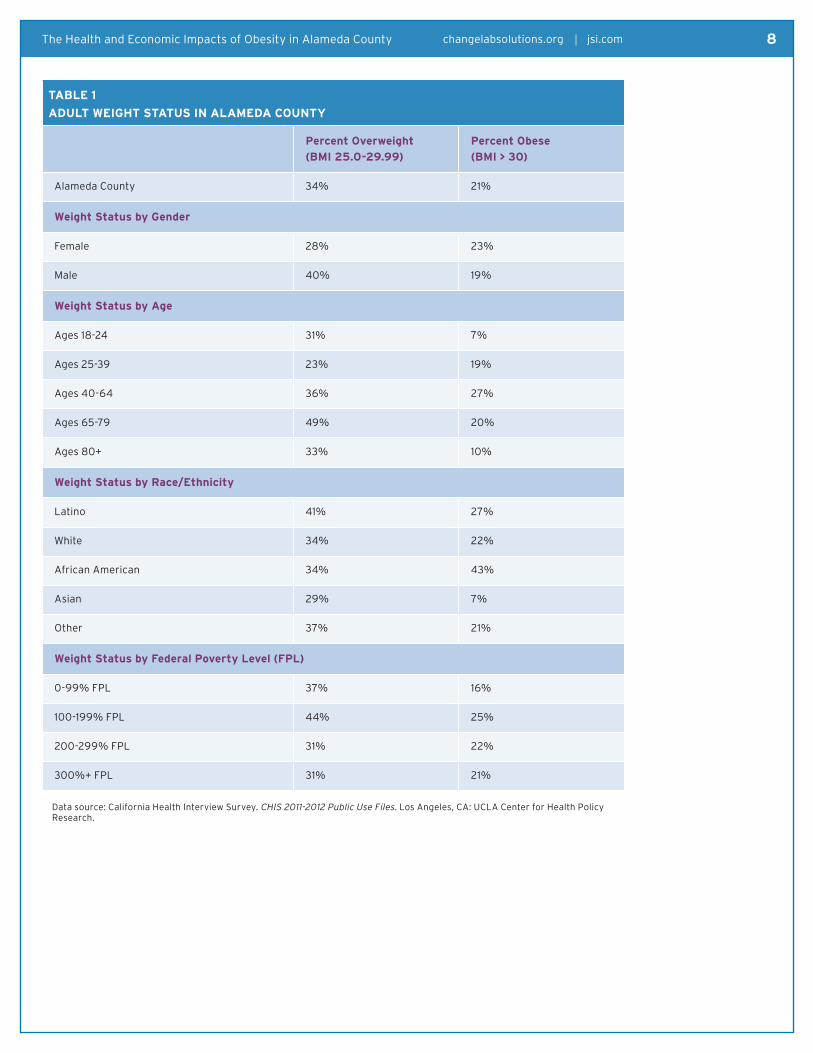
the obesity epidemic in Alameda county Rates of obesity vary by gender, race/ethnicity, and socioeconomic status across Alameda County. While
men in Alameda County are more likely than women to be overweight, rates of obesity are higher in
women (22.9 percent) compared to men (18.9 percent). The prevalence of overweight and obesity varies
by age with those between 40 and 79 years of age experiencing the highest rates of overweight and
obesity. Nearly sixty-three (62.5) percent of those ages 40 to 64 and 69.3 percent of those ages 65 to 79
are overweight or obese.23 As is true nationwide, obesity rates in Alameda County vary by race/ethnicity:
in 2011-12, 27 percent of Latinos and 43.1 percent of African Americans were obese compared to 21.6
percent of Whites. Those between 100 and 199 percent of the federal poverty level (FPL) are significantly
more obese than those in the income group at 300 percent or above the FPL. Nearly 70 percent of adults
are overweight or obese in the 100 to 199 percent FPL group, compared to rates of approximately 50
percent for other income levels.24 Socioeconomic status may influence the nutritional intake of individuals
by limiting the amount of income they can spend on food and the choice of food outlets available in low-
income neighborhoods. Table 1 shows rates of overweight and obesity among Alameda County adults by
various demographic factors.
8The Health and Economic Impacts of Obesity in Alameda County changelabsolutions.org I jsi.com
tAble 1
Adult weIgHt stAtus In AlAmedA county
Percent overweight
(bmI 25.0-29.99)
Percent obese
(bmI > 30)
Alameda County 34% 21%
weight status by gender
Female 28% 23%
Male 40% 19%
weight status by Age
Ages 18-24 31% 7%
Ages 25-39 23% 19%
Ages 40-64 36% 27%
Ages 65-79 49% 20%
Ages 80+ 33% 10%
weight status by Race/ethnicity
Latino 41% 27%
White 34% 22%
African American 34% 43%
Asian 29% 7%
Other 37% 21%
weight status by federal Poverty level (fPl)
0-99% FPL 37% 16%
100-199% FPL 44% 25%
200-299% FPL 31% 22%
300%+ FPL 31% 21%
Data source: California Health Interview Survey. CHIS 2011-2012 Public Use Files. Los Angeles, CA: UCLA Center for Health Policy Research.

9The Health and Economic Impacts of Obesity in Alameda County changelabsolutions.org I jsi.com
fIguRe 1
estImAted obesIty PRevAlence Among AlAmedA county Adults, 2011-2012
Rates of obesity also differ depending on the area of the County. The map in Figure 1 shows obesity rates
across Alameda County using information from the 2011-2012 California Health Interview Survey and 2010
Census estimates.25 Obesity rates are highest (greater than 27 percent) in East and West Oakland, as well
as sections of Hayward and Union City.26
More than one third (34.7 percent) of children in Alameda County are overweight or obese according to
2011-2012 data.27 The California Department of Education conducts a statewide physical fitness test called
FITNESSGRAM with students in grades 5, 7, and 9, to collect data about weight among California’s school-
age children. The test assesses students in six different fitness areas and scores them based on fitness
standards; meeting criteria indicates that students demonstrated “a level of fitness that offers some
protection against the diseases associated with physical inactivity.” Data from the 2012-2013 FITNESSGRAM
indicates that rates of overweight and obesity vary across Alameda County school districts for students
in grades 5, 7, and 9, with average rates between 40 and 44 percent across grades. Hayward, Oakland,
and San Lorenzo had higher rates of overweight and obesity across all three grade levels compared to
the rest of the county’s school districts. These rates are consistent with the recent physical fitness data
shown in Figure 2 indicating that 26 to 29 percent of students in grades 5, 7, and 9 are at health risk for
chronic diseases based on their body composition (a measure that combines BMI and body fat percentage
measurements), while an additional 14 to 16 percent need improvement in their fitness level.28
Source: Alameda County Public Health Department. Data from the Community Assessment, Planning, Education, and Evaluation (CAPE) Unit. January 2014.

10The Health and Economic Impacts of Obesity in Alameda County changelabsolutions.org I jsi.com
Source: California Department of Education. Physical Fitness Testing Research Files, 2012-2013.
Source: California Health Interview Survey. CHIS 2005 & 2011-2012 Public Use Files. Los Angeles, CA: UCLA Center for Health Policy Research.
Health Impacts of obesity and sugary drink consumption in Alameda county Obesity is a known risk factor for many chronic diseases such as diabetes, cardiovascular disease, high
cholesterol, hypertension, osteoarthritis, and some types of cancer. Rates of obesity-related chronic
diseases are high in Alameda County: 28 percent of residents had high blood pressure, 20.3 percent had
high blood cholesterol, 6.7 percent had diabetes, and 6 percent had heart disease. As shown in Figure 3,
rates of diabetes were higher among Latinos (9.7 percent) and African Americans (12.5 percent) compared
to Whites (4.5 percent), consistent with national data. Nearly half (47.5 percent) of African Americans had
been diagnosed with high blood pressure. Whites had higher rates of high blood pressure compared to
Latinos, and higher blood cholesterol compared to both Latinos and African-Americans.29
fIguRe 2
body comPosItIon of students In AlAmedA county scHool dIstRIcts, 2012-2013
fIguRe 3
obesIty-RelAted cHRonIc dIseAse RAtes by RAce/etHnIcIty, AlAmedA county
11The Health and Economic Impacts of Obesity in Alameda County changelabsolutions.org I jsi.com
A recent national study estimated that overweight and obesity were responsible for 18.2 percent of deaths
among African-American and white adults over a 20-year period (1986-2006).30 Diabetes was responsible
for 2.8 percent of deaths in the U.S. in 2010.31 Both obesity and obesity-related diseases are responsible
for increased risk of mortality and years of life lost — in some cases, as many 20 years — particularly
among the severely obese and those who were obese as younger adults.32,33 In Alameda County, heart
disease and diabetes were among the top 10 leading causes of death in 2010. Mortality rates for diabetes,
cardiovascular disease, and cancer attributable to obesity were higher in East and West Oakland and parts
of Hayward.34
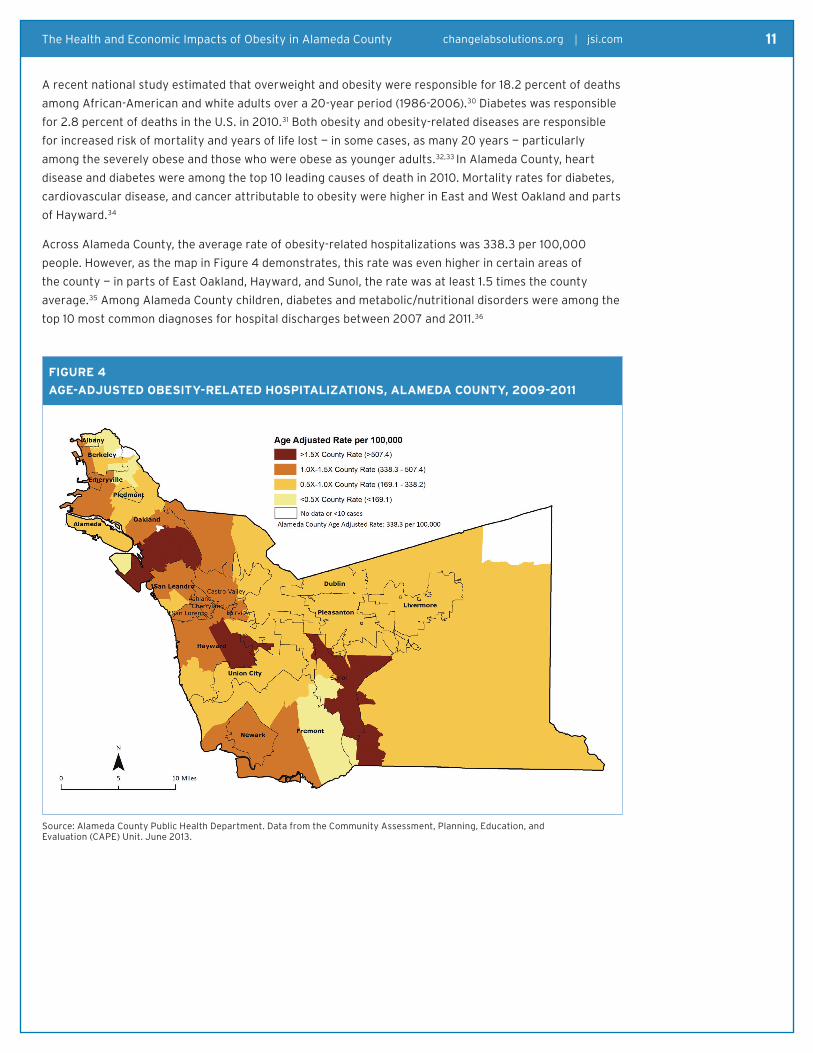
Across Alameda County, the average rate of obesity-related hospitalizations was 338.3 per 100,000
people. However, as the map in Figure 4 demonstrates, this rate was even higher in certain areas of
the county — in parts of East Oakland, Hayward, and Sunol, the rate was at least 1.5 times the county
average.35 Among Alameda County children, diabetes and metabolic/nutritional disorders were among the
top 10 most common diagnoses for hospital discharges between 2007 and 2011.36
fIguRe 4
Age-Adjusted obesIty-RelAted HosPItAlIzAtIons, AlAmedA county, 2009-2011
Source: Alameda County Public Health Department. Data from the Community Assessment, Planning, Education, and Evaluation (CAPE) Unit. June 2013.

12The Health and Economic Impacts of Obesity in Alameda County changelabsolutions.org I jsi.com
Alameda County residents also struggle with dental disease. Dental caries, or cavities, are related to
overall poor dietary intake and sugary drinks, and represent the most widespread childhood disease.37,38
Soda consumption is associated with an 80 to 100 percent increased risk of dental caries among children
under 5 years old.39 When left untreated, dental caries are painful and can have lasting effects on
children’s dietary habits by impeding their ability to chew and swallow. Dental caries can also impact
learning due to school absences as well as cause unnecessary suffering.40 In 2007, dental problems
caused 74 percent of California youth ages 5 to 17 to miss two or more days of school and 27 percent to
miss one day of school due to a dental problem when they could not afford care. Among children whose
family income was below 100 percent of the federal poverty level, dental problems caused 53 percent to
miss two or more days of school and 47 percent missed one day of school.41
Dental disease is rampant among third graders in Alameda County school districts: 69 percent of third
graders have experienced some form of dental disease, including 31 percent with untreated dental caries.
Both rates are higher than the Healthy People 2020 objectives for oral health indicators. Dental disease
appears to have a greater impact in low-income areas of the county. As shown in Figure 5, in schools
where more than half of students receive free or reduced lunches, 46 percent of kindergarteners and 44
percent of third graders have untreated tooth decay. These rates are higher than in schools where fewer
students receive free or reduced lunch. Among students attending schools where less than a quarter of
students receive subsidized meals, only 23 percent of kindergarteners and 18 percent of third graders had
untreated decay.42
Source: Alameda County Department of Public Health, Office of Dental Health. More Than a Toothache: Untreated Dental Disease in Our School Children. 2006, p.6.
fIguRe 5
PeRcentAge of AlAmedA county students wItH untReAted tootH decAy by scHool PoveRty stAtus, 2002-2004
13The Health and Economic Impacts of Obesity in Alameda County changelabsolutions.org I jsi.com
economic Impacts of obesity nationwideIn 2008, the U.S. spent between $147 and $209.7 billion on healthcare related to obesity, or an estimated
20.6 percent of all healthcare spending.43,44 If national obesity rates continue to grow at their current rate,
these costs could rise by an estimated $48 to 66 billion per year.45 The cost of obesity and obesity-related
disease includes direct medical costs, such as the cost of diabetes treatment or medications or hospital visits,
as well as indirect costs such as increased cost of health insurance premiums and lost productivity. Lost
productivity includes absenteeism, presenteeism (attending work while sick), and short-term disability.46
Per capita health care spending on inpatient, non-inpatient, and prescription drugs for obese adults is
substantially higher than for normal weight adults, resulting in as much as 42 percent greater costs.47
Obesity-related costs are also higher for adults on Medicaid or the uninsured (compared to the privately
insured), implying that a huge amount of public dollars are being spent on treating obesity.48 Among
individuals with multiple chronic health conditions, healthcare spending for the obese population is
proportionately higher.49
Employers are often saddled with the economic burdens of obesity. Studies show higher medical
expenditures, absenteeism, and presenteeism among obese employees compared to non-obese employees,
resulting in an average of one to three additional missed days of work per year.50,51,52 Employees who are
obese and diabetic are more likely to have higher per capita absenteeism costs, compared to nondiabetic
obese adults.53 One 2007 study estimated the annual cost of obesity-related absenteeism to be as much as
$4.3 billion dollars (in 2004 dollars).54
Similar trends in obesity-related spending and utilization of healthcare hold true for children. Research
has found that obese children ages 6 to 19 had higher utilization and expenditures for outpatient visits,
prescription drugs, and emergency room visits compared with normal weight or underweight children.
The same study estimated that $14.1 billion (in 2005 dollars) was spent on direct medical expenditures
resulting from childhood obesity.55
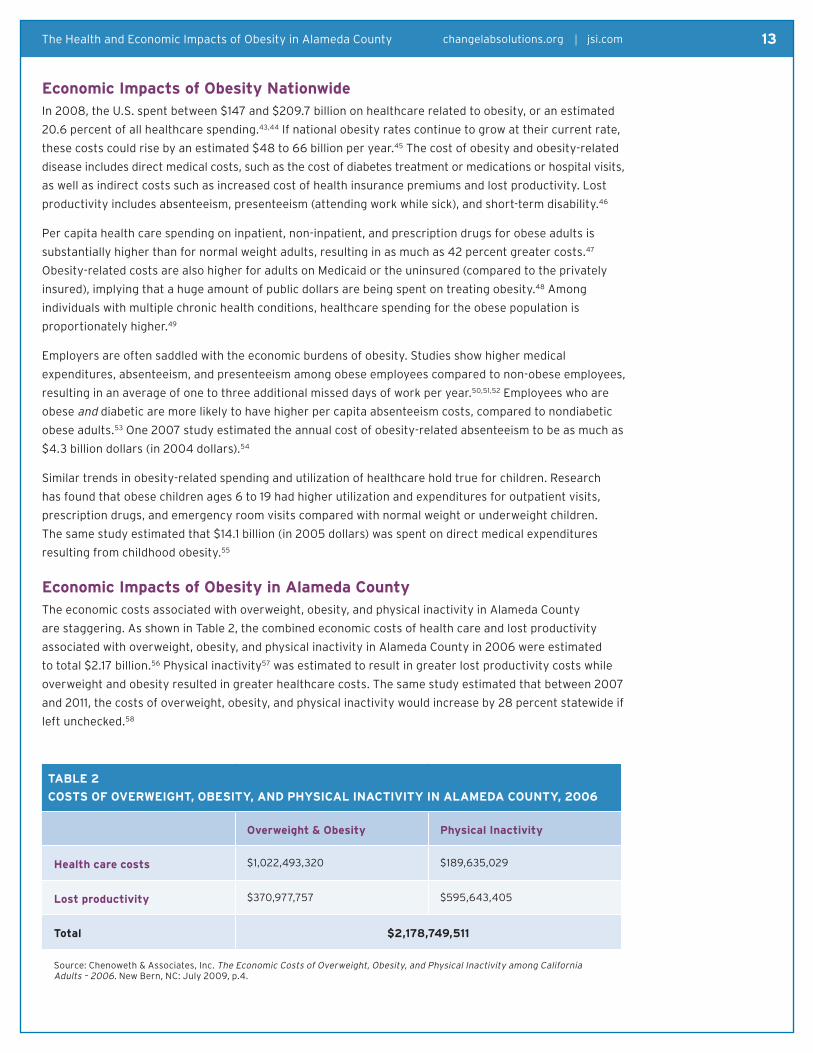
economic Impacts of obesity in Alameda countyThe economic costs associated with overweight, obesity, and physical inactivity in Alameda County
are staggering. As shown in Table 2, the combined economic costs of health care and lost productivity
associated with overweight, obesity, and physical inactivity in Alameda County in 2006 were estimated
to total $2.17 billion.56 Physical inactivity57 was estimated to result in greater lost productivity costs while
overweight and obesity resulted in greater healthcare costs. The same study estimated that between 2007
and 2011, the costs of overweight, obesity, and physical inactivity would increase by 28 percent statewide if
left unchecked.58
tAble 2
costs of oveRweIgHt, obesIty, And PHysIcAl InActIvIty In AlAmedA county, 2006
overweight & obesity Physical Inactivity
Health care costs $1,022,493,320 $189,635,029
lost productivity $370,977,757 $595,643,405
total $2,178,749,511
Source: Chenoweth & Associates, Inc. The Economic Costs of Overweight, Obesity, and Physical Inactivity among California Adults – 2006. New Bern, NC: July 2009, p.4.

14The Health and Economic Impacts of Obesity in Alameda County changelabsolutions.org I jsi.com
Alameda County itself spends an astounding amount of money each year on obesity-related health care costs
alone. In the 2013-14 fiscal year, the County allocated $653.9 million to healthcare costs (24.3 percent of the
total budget);59 according to national estimates of spending on obesity-related disease, $134.7 million of these
allocated costs would be spent treating obesity-related diseases.60 Thus, even a modest reduction of 5 percent
in overweight and obesity could potentially save Alameda County significant public funds.61
Among children, school absences resulting from health issues such as dental caries, asthma, and diabetes,
can cost school districts substantially and may contribute to poor academic performance. Overweight and
obese children have been shown to have significantly more school absences compared to their normal
weight peers.62 California school districts receive state funding based on student attendance, meaning that
every missed day of school results in lost revenue. For example, Oakland Unified School District receives
$7,362 annually for a student with perfect attendance; therefore, every missed day of school for a student
results in $40.90 less revenue for the district (based on 180 school days per year).63 Students with dental
problems, especially those who are low-income, have frequent absences; it was estimated that California
school districts lost a combined $29.7 million as a result of missed student days for dental problems in
2007.64
Obesity and its related health conditions resulting from poor diets — including consumption of sugary drinks
and other junk foods — impose a significant cost burden on Alameda County residents. The cost of obesity
is not only shouldered by public systems — such as local and county agencies, health systems, schools, and
correctional facilities — but also on the individuals or employers who pay for the costs of healthcare and lost
productivity in the workplace due to obesity and related chronic diseases.
the Role of sugary drinks in the obesity epidemic Because sugary drinks are a major contributor to obesity and dental disease, particularly among children
and adolescents, Alameda County has expressed particular interest in examining their impact on the
health of residents. The broadest definition of a sugary drink is any non-alcoholic beverage that contains
added caloric sweeteners, including sodas, energy drinks, sweetened iced teas, sports drinks, flavored
milk, flavored waters, sweetened juices, and fruit drinks.65 Definitions of sugary drinks vary greatly across
the legislative, policy, and research landscapes: for example, some policies treat flavored milk as a sugary
drink, but others do not. That said, as a whole, sugary drinks are calorically dense while providing little to no
nutritional value in the diet and make up a large portion of the average American’s total caloric intake.66
Nationwide, it is estimated that added sugars — largely from beverages — account for 16 percent of total
caloric intake for children and adolescents.67 Consumption of sugary drinks has increased by 300 percent
over the past two decades and an estimated 8.7 percent of obesity cases are attributable to consumption of
calorically-sweetened beverages.68,69 Sugary drink consumption is associated with increased BMI, increased
weight, higher total caloric intake, decreased satiety, and dental caries in both children and adults.70,71,72,73,74
Conversely, intervention research suggests that reductions in sugary drink consumption are significantly
associated with weight loss.75,76 Associations between soda consumption and overweight have been found in
children as young as two years old; one study found that the odds of being overweight increased more than
three-fold for 2-year-olds who consumed at least one soda a day compared to children who consumed no
soda.77
Sugary drink consumption poses a significant health risk given that nearly half (48 percent) of Americans
reported drinking at least one soda every day in 2012, according to a recent Gallup poll.78 The same poll
demonstrated that young adults (ages 18-34), non-whites, and men were more likely than other groups to be
regular soda drinkers.79 National data indicates that overall soda consumption has been declining, but that
consumption of other sugary drinks (e.g. energy drinks, sports drinks) has increased as beverage companies
diversify their product lines.80 In California, consumption of sugary drinks has decreased by 11 percent
overall except among adolescents aged 12 to 17. Sixty-five percent of California teens (ages 12 to 17) drank
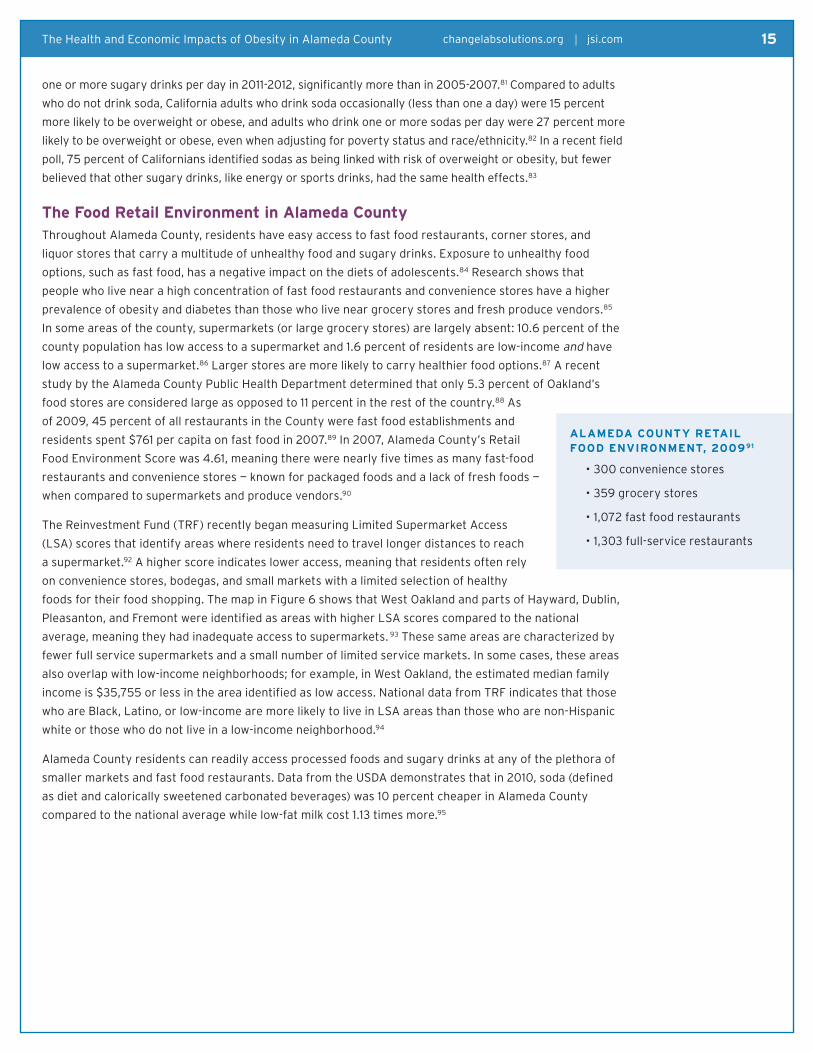
AlAmedA county RetAIl food envIRonment, 200991
•300 convenience stores
•359 grocery stores
•1,072 fast food restaurants
•1,303 full-service restaurants
15The Health and Economic Impacts of Obesity in Alameda County changelabsolutions.org I jsi.com
one or more sugary drinks per day in 2011-2012, significantly more than in 2005-2007.81 Compared to adults
who do not drink soda, California adults who drink soda occasionally (less than one a day) were 15 percent
more likely to be overweight or obese, and adults who drink one or more sodas per day were 27 percent more
likely to be overweight or obese, even when adjusting for poverty status and race/ethnicity.82 In a recent field
poll, 75 percent of Californians identified sodas as being linked with risk of overweight or obesity, but fewer
believed that other sugary drinks, like energy or sports drinks, had the same health effects.83
the food Retail environment in Alameda county Throughout Alameda County, residents have easy access to fast food restaurants, corner stores, and
liquor stores that carry a multitude of unhealthy food and sugary drinks. Exposure to unhealthy food
options, such as fast food, has a negative impact on the diets of adolescents.84 Research shows that
people who live near a high concentration of fast food restaurants and convenience stores have a higher
prevalence of obesity and diabetes than those who live near grocery stores and fresh produce vendors.85
In some areas of the county, supermarkets (or large grocery stores) are largely absent: 10.6 percent of the
county population has low access to a supermarket and 1.6 percent of residents are low-income and have
low access to a supermarket.86 Larger stores are more likely to carry healthier food options.87 A recent
study by the Alameda County Public Health Department determined that only 5.3 percent of Oakland’s
food stores are considered large as opposed to 11 percent in the rest of the country.88 As
of 2009, 45 percent of all restaurants in the County were fast food establishments and
residents spent $761 per capita on fast food in 2007.89 In 2007, Alameda County’s Retail
Food Environment Score was 4.61, meaning there were nearly five times as many fast-food
restaurants and convenience stores — known for packaged foods and a lack of fresh foods —
when compared to supermarkets and produce vendors.90
The Reinvestment Fund (TRF) recently began measuring Limited Supermarket Access
(LSA) scores that identify areas where residents need to travel longer distances to reach
a supermarket.92 A higher score indicates lower access, meaning that residents often rely
on convenience stores, bodegas, and small markets with a limited selection of healthy
foods for their food shopping. The map in Figure 6 shows that West Oakland and parts of Hayward, Dublin,
Pleasanton, and Fremont were identified as areas with higher LSA scores compared to the national
average, meaning they had inadequate access to supermarkets. 93 These same areas are characterized by
fewer full service supermarkets and a small number of limited service markets. In some cases, these areas
also overlap with low-income neighborhoods; for example, in West Oakland, the estimated median family
income is $35,755 or less in the area identified as low access. National data from TRF indicates that those
who are Black, Latino, or low-income are more likely to live in LSA areas than those who are non-Hispanic
white or those who do not live in a low-income neighborhood.94
Alameda County residents can readily access processed foods and sugary drinks at any of the plethora of
smaller markets and fast food restaurants. Data from the USDA demonstrates that in 2010, soda (defined
as diet and calorically sweetened carbonated beverages) was 10 percent cheaper in Alameda County
compared to the national average while low-fat milk cost 1.13 times more.95

16The Health and Economic Impacts of Obesity in Alameda County changelabsolutions.org I jsi.com
consumption of obesogenic foods and beverages by Alameda county Residents The lack of access to healthy foods in Alameda County is reflected in the diets of its residents, which
includes frequent consumption of fast food and sugary drinks. Children and adolescents in Alameda
County are consistently eating fewer than the recommended servings of fruits and vegetables per day,
and continuing this habit as they age in adulthood. Only 40.5 percent of children and roughly 1 in 5
adolescents (21.5 percent) reported eating at least 5 servings of fruits and vegetables per day. As Figures
7 and 8 demonstrate, the majority of Alameda County residents also regularly eat fast food. More than
half of Alameda County residents ate fast food at least one time per week among all age groups except for
seniors (ages 64 and older). Fast food consumption is particularly high among adolescents and children:
65 percent of adolescents and 59 percent of children eat fast food one or more times per week. Frequency
of fast food consumption is higher among those who are obese, non-white, and below 300 percent of
the FPL. Among those County residents at the lowest income level (below 99 percent of the FPL), 62
percent consume fast food at least once per week, likely in part due to its easy availability in low-income
neighborhoods.96
fIguRe 6
lImIted suPeRmARket Access scoRe, AlAmedA county, 2011
Source: The Reinvestment Fund. The Reinvestment Fund Policy Map, 2010.

17The Health and Economic Impacts of Obesity in Alameda County changelabsolutions.org I jsi.com
Source: California Health Interview Survey. CHIS 2011-2012 Public Use Files. Los Angeles, CA: UCLA Center for Health Policy Research.
Source: California Health Interview Survey. CHIS 2011-2012 Public Use Files. Los Angeles, CA: UCLA Center for Health Policy Research.
fIguRe 7
fAst food consumPtIon In tHe PRIoR week by Age, AlAmedA county, 2011-2012
fIguRe 8
fAst food consumPtIon In tHe PRIoR week by fedeRAl PoveRty level, AlAmedA county, 2011-2012

18The Health and Economic Impacts of Obesity in Alameda County changelabsolutions.org I jsi.com
The California Health Interview Survey (CHIS) collects data on sugary drink consumption among adolescents
and children. Figure 9 presents CHIS data for 2003-2012 and shows that sugary drink consumption remains
high among Alameda County children and adolescents. In Alameda County in 2011-2012, 31.3 percent of
children ages 2 to 11 and 63.7 percent of adolescents ages 12 to 17 reported drinking one or more sugary
drinks per day.97 As Figure 9 demonstrates, levels of sugary drink consumption fluctuate over time. Analysis
conducted by the Alameda County Public Health Department’s Community Assessment, Planning, Education,
and Evaluation Unit found that the differences between the data years presented in Figure 9—including the
increase shown in consumption levels among both teens and younger children from 2009 to 2011-2012—were
not statistically significant.
Source: California Health Interview Survey. CHIS 2003, 2005, 2007, 2009, & 2011-12 Public Use Files. Los Angeles, CA: UCLA Center for Health Policy Research. Available at: http://ask.chis.ucla.edu
fIguRe 9
PeRcentAge of cHIldRen And Adolescents wHo consumed 1 oR moRe sodA/sweetened dRInks PeR dAy, AlAmedA county
Researchers from the UCLA Center for Health Policy Research have also assessed trends in sugary
drink consumption by comparing CHIS state and county level data from combined years 2005-2007 and
2011-2012. They found that the prevalence of Alameda County youth ages 2 to 17 consuming one or more
sugary drinks per day increased by 16 percent over the five-year period, despite a decrease of 11 percent
statewide. The increase was higher among Alameda County children ages 2 to 11 (24 percent) than among
adolescents (10 percent). However, the increase was not statistically significant in either group. The UCLA
researchers hypothesize that consumption of non-traditional sugary drinks such as energy and sports
drinks and rampant marketing of sugary drinks to youth were driving these increases.98

19The Health and Economic Impacts of Obesity in Alameda County changelabsolutions.org I jsi.com
fIndIngs fRom QuAlItAtIve ReseARcH
wItH stAkeHoldeRs
In assessing potential policies to reduce obesity and consumption of sugary drinks, engaging with and
learning from stakeholders is essential. We conducted interviews with key informants, as well as focus
groups with Alameda County residents from diverse backgrounds, the majority of whom came from
organizations based in Oakland. We engaged these stakeholders in order to gather perspectives on the
scope and impact of the obesity epidemic in the County, collect information about past obesity prevention
or reduction efforts in the County (particularly those focusing on sugary drinks), gauge support for
various policies and regulatory changes to address obesity and sugary drink consumption, as well as
hear ideas and suggestions for future efforts. This section summarizes key findings across the eleven key
informant interviews and four focus groups described in Table 3. (See Appendix 2 for qualitative research
methods and limitations and Appendix 3 for a list of key informants.)
tAble 3
stAkeHoldeRs engAged In QuAlItAtIve ReseARcH
stakeholder group Participant description specific topics discussed
key informants from Alameda county organizations (interviews)
Informants included healthcare providers, staff from community-based organizations, local government agencies, school districts, and academic researchers
Perspectives on the scope of obesity in the county; awareness of previous obesity prevention/sugary drink reduction programs or policies; potential policy or regulatory approaches to reducing obesity and sugary drink consumption
youth from ReAcH Ashland youth center, san leandro (focus group)
Two groups of 7-10 youth aged 13-20, engaged in programs at the Youth Center and recruited by a member of their staff
Youth’s own understanding of obesity and its causes and effects, personal dietary habits, and perspectives on sugary drink consumption
school nurses, oakland unified school district (focus group)
Six school nurses working across the Oakland Unified School District (OUSD). The nurses worked in multiple schools across the district with a variety in the number of years of experience in the OUSD system
Nurses’ experiences with obesity and sugary drink consumption working in OUSD and among the student population; school-based approaches to reducing sugary drink consumption and promoting healthy habits among children and adolescents
Alameda county Public Health commission (focus group)
Seven members of the Public Health Commission’s Oral Health Committee. Public Health Commission members include representatives of the Alameda Board of Supervisors, the Public Health Department, Health Services Agency, and other county and community organizations
Perspectives on the scope of obesity in the county; awareness of previous obesity prevention/sugary drink reduction programs or policies; potential policy or regulatory approaches to reducing obesity and sugary drink consumption
“Kids can buy a huge number
of calories cheaply, in the
form of soda.”
~ Pediatric obesity expert at UC
Berkeley
20The Health and Economic Impacts of Obesity in Alameda County changelabsolutions.org I jsi.com
understanding of causes of obesity in Alameda county Key informants and focus group participants generally agreed upon the causes of and contributing factors
to obesity in Alameda County. The majority of adult participants indicated that obesity disproportionately
impacts low-income communities and communities of color, and that the “the effect of obesity is not
uniform” across the County. Several people mentioned specific neighborhoods or locations where obesity
was concentrated — such as East and West Oakland, and the southern part of the County (Newark and
Fremont areas). They also acknowledged the “rather extreme health disparities” related to obesity, chronic
disease, and dental caries between low- and high-income groups in Oakland and noted that poverty and
other social determinants of health play a significant role in one’s health outcomes.
Many of the key informants and focus group participants focused on the local food environment as a
significant contributor to obesity in the county, particularly in low-income neighborhoods. Respondents
noted that many of the County’s neighborhoods lacked access to full-service grocery stores or
supermarkets and thus relied on fast food, convenience stores, or liquor stores that carry primarily
packaged foods and sugary drinks. Several focus group participants and key informants
specifically mentioned West Oakland as an area lacking large grocery stores. Nurses and
youth noted that smaller retailers (e.g., convenience stores or bodegas), plus mobile food
vendors, are often located in close proximity to schools, providing easy access to youth as
they go to and from school. In addition, these same neighborhoods were characterized by a
lack of access to safe places for physical activity, such as parks or walkable neighborhoods.
As one key informant noted, “I think it’s an environment almost made to foster obesity.”
Several respondents also mentioned marketing by food and beverage companies as a factor,
especially the frequency and amount directed at youth.
The majority of adults emphasized upstream factors that impede residents’ access to affordable and
healthy foods. The Oakland Unified School District (OUSD) school nurses who were interviewed did,
however, mention that the lack of nutrition education in schools might be a potential contributor to
unhealthy eating habits among school-aged youth. The school nurses reported that OUSD students do
not have a dedicated class or curriculum for nutrition and that physical education and health are often
combined. While the nurses have the skills and ability to provide basic nutrition counseling, their time
is mostly spent caring for students with acute health issues. The school nurses also noted that many of
their students complained about stomachaches and headaches, which nurses believed to be due to lack of
meals or dehydration. Their experiences suggested the need for improved nutrition education in schools,
as well as specific targeted messaging around the importance of eating breakfast and lunch meals during
the school day.
In the youth focus groups, the discussion of obesity’s causes and effects focused more on individual-
level factors. The majority of youth demonstrated at least basic knowledge about obesity and its causes
and effects, citing some of the long-term effects, including diabetes and death. Most were aware of
the multiple causes of obesity, and focused particularly on unhealthy diet, lack of physical activity, and
genetics. Several youth also listed stress and depression as potential causes of obesity. Youth tended
to think about obesity within the context of unhealthy eating and lack of physical activity rather than
the more upstream, environmental factors that adults focused on. Among youth, there was a general
consensus that the responsibility for preventing obesity lies with individuals who make choices about their
diet and health.

21The Health and Economic Impacts of Obesity in Alameda County changelabsolutions.org I jsi.com
Awareness of Previous obesity Prevention efforts When asked what obesity prevention initiatives or policies had occurred in the past in Alameda County, most
informants could list a number of specific programs that had been implemented locally. Many noted that the
Bay Area (Berkeley and Oakland in particular) has long been active in promoting healthy lifestyles and diets.
Specific programs mentioned by informants included: Mandela Marketplace; clinic-based programs at local
hospitals; urban agriculture and urban gardening initiatives; HOPE Collaborative’s healthy corner store pilot;
Alameda County Department of Public Health’s Places Matter initiative; and various nutrition education
campaigns through public benefits programs (WIC, Medi-Cal, SNAP-Ed, etc.). Although there appeared to be
a sense that many programs and initiatives were happening or had previously happened, most informants
were unsure of the impact or effectiveness of these in changing people’s diets.
In contrast to discussions about programs, informants and focus group participants had difficulty citing
specific policies addressing obesity or sugary drinks in the County. A member of the Public Health
Commission stated, “I think Alameda County has done a credible job in program areas, but I think a
weakness is in policy and trying to change policies. Programs take money and they come and they go,
but policies can last. We really haven’t done enough in that area.” Commission members stressed the
importance of wide-reaching policy changes given that programs can have a limited impact and often
require more resources to implement and sustain than policy.
Several informants identified schools as a place where numerous programs and some policy changes have
taken place to support healthy eating practices. For example, schools have hosted community health fairs,
cooking classes, farmers’ markets, and “Harvest of the Month” programs in the past. In addition, school
districts across the County have established school-based health clinics and adopted School Wellness
Policies. Nurses and another informant from OUSD spoke about their district wellness policy, which includes
provisions that remove sugary foods from school events and discourages rewarding students with food.
The school nurses noted that programs are hard to sustain because they often depend on staff or parent
volunteers to champion and maintain them, as well as upon funding and other resources. They also noted
great variation between schools in terms of the programs offered, noting that these are not uniform
across the OUSD. Likewise, they reported that the wellness policy was inconsistently applied, enforced, and
implemented at individual schools across OUSD. For example, one nurse revealed that her school’s vending
machine is stocked with “allegedly healthy junk foods,” such as sugary juices, despite restrictions on
sugary drinks. There appeared to be some confusion among the nurses about the OUSD’s policy on vending
machines and whether or not they were allowed on campuses. One informant perceived restrictions on what
could be sold in vending machines at public schools to be a “symbolic success,” in that it had not necessarily
reduced consumption of sugary drinks or changed student behavior.
The most frequently mentioned effort related to sugary drinks that informants were aware of was Soda Free
Summer, a public awareness initiative launched in Alameda County in 2007 that has since spread across the
entire Bay Area. Most of the key informants had heard of Soda Free Summer, but were unsure of its impact
on Alameda County residents. Participants in the youth focus group, however, had not heard of it and were
confused as to the intentions of the program, including one youth who thought it meant someone was giving
away free sodas. Public Health Department staff and members of the Public Health Commission, however,
believed the program had been relatively effective in reducing consumption of SBBs during the program’s
duration and in changing long-term behaviors, citing evaluations done in 200999 and 2010.100 Fewer people
were aware of other local efforts focused on increasing water consumption; those mentioned included
Potter the Otter, Take Back the Tap, and a water campaign at Skyline High School in Oakland.
22The Health and Economic Impacts of Obesity in Alameda County changelabsolutions.org I jsi.com
youth Attitudes towards sugary drinks and water consumption Participants in the youth focus groups revealed that they were regular consumers of sugary drinks,
including a variety of sodas, sports drinks, energy drinks, fruit drinks, and sweetened coffee drinks (e.g.,
Frappuccinos). They reported purchasing sugary drinks at corner and convenience stores, liquor stores,
and grocery stores in their neighborhoods and on their way to and from school. They also brought sugary
drinks with them to school, either from home or purchased them on the way. School nurses confirmed
these trends, noting that students often brought sugary drinks and unhealthy snacks (e.g., “hot chips,”
junk food) with them to school after having bought them at a retailer in close proximity to school. Both
nurses and youth noted that soda was cheaper than water and other healthy options at these retailers.
The term “sugar-sweetened beverage” did not resonate with youth. Youth opted to call them “sweets” or
“unhealthy drinks,” and grouped sugary drinks with candy in the same category due to “high sugar.” When
asked what beverages they thought fell into this category, the youth listed soda, energy drinks, sports
drinks, sugar water, lemonade, sweetened coffee and tea drinks, and many listed specific brands of drinks.
Some incorrect answers were also given during this portion of the discussion in the youth groups (e.g., diet
sodas, Crystal Light, sparkling water), suggesting there may be some misinformation about sugary drinks.
Youth were also asked about their consumption of water to gauge whether water consumption campaigns
might be appropriate for young populations. Most, if not all, reported drinking water regularly and cited
some of the benefits, including hydration during hot weather or while playing sports, and because “it is
healthy for you.” Most reported drinking bottled or filtered tap water. Some disliked drinking tap water
because of the taste. Others reported a belief that tap water was bad for you or that tap water was okay to
drink depending on where one lived. Youth seemed receptive to campaigns that would encourage people
to drink water, and suggested having a celebrity or other notable role model promote drinking water or
other healthy beverages as a way to encourage youth to avoid sugary drinks. They also thought that
moving water to the front of stores (and moving soda to the back) and offering a variety of water choices
would encourage water consumption.
OUSD school nurses and youth shared the perception that even if youth are aware that sugary drinks are
unhealthy, it does not change their behavior. Nurses also perceived that kids do not like the taste of water,
and reported students refuse water or unsweetened tea offered to them during nurse visits at school. The
nurses thought that youth were so accustomed to drinking sugary drinks that they did not want to drink
anything else.
stakeholder strategies for Reducing sugary drink consumption A tax on sugary drinks was a popular idea among stakeholders, but informants and focus group
participants also thought that the County needed to think outside the box in approaching obesity and
sugary drink consumption. As one informant noted, “given that taxes have been met with significant
resistance — because of the personal responsibility issue and the American ideal of choice — I think we
need to look at this more creatively, and differently, if we’re going to win.” Many of the suggested policies
could be described as environmental change policies, or as one person put it, “we need to change the
environment to make it easier for people to make the healthy choice.”
Stakeholders had many ideas for institutional or organizational policies and strategies for reducing sugary
drink consumption. Table 4 lists all of the sugary drink consumption related strategies mentioned by at
least one individual during an interview or focus group. (Note that while this list overlaps in part with the
policy strategies discussed in the Policy Scan section below, many are novel ideas.) Table 4 notes if the
policies or strategies are likely to impact any of 3 categories of Alameda County residents: 1) children;
2) County employees; and 3) County residents. The policies that are most the comprehensive fall into
the “County residents” category because they do not necessarily target a single population group, but

23The Health and Economic Impacts of Obesity in Alameda County changelabsolutions.org I jsi.com
tAble 4
PolIcIes foR ReducIng sugARy dRInk consumPtIon mentIoned by ResPondents
PRImARy PoPulAtIon ImPActed
PolIcychildren and/or schools
county employees
county residents
Retail environment strategies
Implement a tax on sugary drinks X
Restrict sales of sugary drinks to minors X
Zoning policy prohibiting sugary drink inclusion in kids’ fast food meals X
County Health Officer warning label on sodas X
Offer tax incentives for grocery stores/retailers implementing harm reduction strategies (e.g. limiting shelf space for sugary drinks or placing them in the back)
X
Incentivize healthy food retailers to limit or restrict sugary drink sales X
Incentivize healthy food retailers to open mini-markets in low-income areas X – low income
Change unit pricing on sugary drinks (e.g. to make larger sizes less cost-effective) X
Require local movie theaters and sports concessions to list nutrition information and offer healthy options
X
Zoning policy requiring supermarkets in areas with low food access X – low income
Ban mobile vendors (e.g. food trucks) near schools X
Ban free refills of sugary drinks at restaurants X
Procurement and Purchasing strategies
Offer preferred vendor relationships to healthy retailers through the County (as a purchaser) X X – clients of county services
Change concessions policy at County venues (e.g. Coliseum) to include healthy menu options X
Work with food vendors (e.g. Aramark, Sysco) as a County to prescribe healthier foods be purchased with county dollars
X X – clients of county services
Require County only use vendors/restaurants that have a certain percentage of healthy menu options available
X
Revise County vending machine policy to be a 100% healthy beverage policy (rather than 50% as it currently is)
X
Ask local businesses to adopt healthy vending and meeting policies X
Ban sales of sugary drinks in public buildings and spaces (e.g. parks, libraries) X X
Policies focused on sugary drink companies
Implement product stewardship ordinance for sugary drink distributors or producers to establish plans for harm reduction
X
Implement labeling restrictions X
Request labeling redesign X
Restrict advertising for sugary drinks and junk food targeted at youth X
other strategies
Ban sponsorship by sugary drink companies in school districts X
Ensure stricter enforcement of school policies towards sugary drinks that already exist X
Remove chocolate and flavored milk (and all other sugary drinks) from school lunches X
Remove juice from WIC packages X – WIC program
Prohibit or limit sugary drink purchases permitted by CalFresh/SNAP X – low income
Implement healthy foods at the County fair X
Add a fee to County fair ticket that would be spent on obesity programs or education X
Implement short-term community-wide challenges (contests) to reduce consumption X
Pass a County resolution pertaining to sugary drink consumption – e.g., “Soda Free Month” X

24The Health and Economic Impacts of Obesity in Alameda County changelabsolutions.org I jsi.com
rather the entire County (except where a special population is noted). Note that some policies may have
an indirect impact on secondary populations — for example, school policies may affect behaviors among
parents in addition to students.
stakeholder support for taxing sugary drinks Overall, key informants and Public Health Commission focus group participants expressed support for a tax
on sugary drinks. Informants reported that a tax would be the strategy most likely to have a broad impact
on reducing consumption and obesity rates in the long-term. The majority of informants (8 out of 11) and
Public Health Commission focus group participants indicated they would support a sugary drink tax but
also believed it was unlikely to be approved by local government and voters. They acknowledged that a tax
would be challenging to pass for a number of reasons, including: 1) heavily funded counter-campaigns by
the beverage industry; 2) resistance from local retailers (e.g., grocery stores, corner markets); 3) resistance
from residents; and 4) lack of awareness of sugary drink consumption as problematic.
Several stakeholders mentioned the sugary drink tax that recently failed to pass in the City of Richmond,
California, as evidence that the beverage industry would be willing to spend significant
funds to defeat a similar measure in Alameda County. As one informant noted, “the soft
drink industry has too much money and they have statewide and national resources to
defeat this kind of thing.” Another said, “it’s going to be really hard to pass a soda tax in our
county or anywhere else because the beverage industry is so adept at fighting those things
and will pour a lot of money into it — much more than the proponents of the task [of getting
the tax passed].”
Informants also identified retailers and the business community as being resistant to
sugary drink reduction strategies such as a tax or harm reduction policy. They suspected
that retailers would oppose a tax if they believed it would negatively impact their revenue in any way. One
informant said, “Both the retailers and the soda industry are dead set against it, so unless you have a lot
of money…I’m not saying it’s never going to happen, but it’s not an easy thing to do.” When asked about
engaging retailers in discussions about potential policies, one respondent said with a laugh, “Good luck!”
Another respondent spoke about political resistance the County encountered in implementing the Soda
Free Summer program, saying “One of the mayors told me he couldn’t do it because Coke was a large
employer in his jurisdiction — companies in a jurisdiction may limit what they can support. Some of the
finance coming from [the soda industry] — if they have fiscal support for politicians or employers [sugary
drink companies] in their jurisdiction — alters their ability or desire to do something [about sugary drinks].”
Informants also felt they would encounter resistance to a sugary drink tax from residents who would likely
view a tax as an infringement on their individual rights. Informants felt that because many people do not
perceive sugary drink consumption to be harmful to one’s health, they would see a tax as an unfair penalty
or restriction on their ability to choose what they drink. One informant said that, “People don’t see the
impact of drinking sugary drinks … even if they know the science. They see it as a choice they’re making.
They’re not seeing the hidden taxes, healthcare costs, human suffering from the sale and consumption of
this product.” In addition, one informant said that residents would not have the appetite for another tax
because “people already have a lot of taxes to pay.” For these reasons, several informants were skeptical
that a tax-based price increase would be an effective means of reducing sugary drink consumption.
Multiple individuals commented that even if a tax were not approved, discussing potential policies to
address sugary drink consumption or putting a tax measure on the ballot would start a conversation about
the controversial topic. According to several informants, such controversy would stir media attention and
public debate that would help to raise awareness of sugary drink consumption as an important health
issue and may help “move the needle” toward eventual policy solutions. Similarly, another informant said,
“I think just raising the issue and the attention it stirs up is a useful thing to reach voters and citizens.” At
the very least, “there would be a conversation across the community about the impact of sugary foods.”
“Sugar-sweetened beverages
are such an easy target
because there’s no
[nutritional] value.”
~ Pediatric obesity expert at UCSF

25The Health and Economic Impacts of Obesity in Alameda County changelabsolutions.org I jsi.com
support for taxing sugary drinks among youth-focused RespondentsOpinions regarding a tax on sugary drinks were mixed among school nurses and youth. Nurses were unsure
whether a tax or other price increase would affect youth’s purchasing habits. One nurse said, “People will
just end up spending more money” and maintain the same levels of consumption. To address consumption
among youth, nurses stressed the importance of directing education or other efforts at adults and
caregivers who are often the primary purchasers in a family.
Youth expressed that individual preference for sugary drinks would prevail in the face of a tax or product
placement strategies. In general, youth had mixed opinions about what would make them drink fewer
sugary drinks, and were split on whether a price increase would make a difference. Some said that people
would still seek out sugary drinks because “if you want it, you will [drink] it so it is up to you.” One noted,
“You have to change the person’s perspective on water and soda. Anybody can say I want to be healthy,
but they are still going to drink it.” Within the larger discussion about obesity and diet, youth largely spoke
about unhealthy drinks as issues of individual choices: “If you don’t want to be fat, you won’t eat that stuff.”
stakeholder support for Promoting water consumption Informants noted the importance of promoting water consumption as an alternative to sugary drink
consumption. Respondents indicated previous media campaigns and specific programs had done this, such
as Potter the Otter and Take Back the Tap. They also suggested policy and infrastructure changes to increase
water consumption, either in tandem with sugary drink reduction policies or as standalone efforts. Both
nurses and youth were supportive of a price change that would make water cheaper than sugary drinks as a
way to encourage water consumption.
Stakeholders had many ideas for institutional or organizational policies and strategies for promoting water
consumption. Table 5 lists all of the institutional or organizational level policies or strategies specific to
promoting water consumption that were mentioned by at least one individual during an interview or focus
group. (Note that while this list overlaps in part with the policy strategies discussed in the Policy Scan
section below, many are novel ideas.)
tAble 5
PolIcIes foR IncReAsIng wAteR consumPtIon mentIoned by ResPondents
PRImARy PoPulAtIon ImPActed
PolIcychildren and/or schools
county employees
county residents
Building permits or new business licenses requiring water accessible onsite (to employees or consumers)
X
Work with water providers in the county (e.g. EMBUD) to improve water supply
X
Work with Brita to distribute water filters to County residents X
Fix sources of poor tap water in the County X
Install water fountains in local parks and neighborhoods X
Lowering price of bottled water (e.g. to less than sugary drinks) X
Maintain or install water fountains in schools X
Moving bottled water to the front of retail stores (e.g. in fridges near cash registers)
X

“I hate to say it, but
something terrible needs
to happen to really capture
the public’s attention as to
why diabetes down the road
is something you need to
worry about.”
~ Public Health Commission Member
26The Health and Economic Impacts of Obesity in Alameda County changelabsolutions.org I jsi.com
stakeholder suggestions for building support for Policy Interventions To accompany any proposed policy or regulatory changes, informants saw the need for education, targeted
approaches, and sensitive messaging to raise public awareness prior to implementation of any policy
changes. Several informants believed that any policy implementation would need to be accompanied by a
Countywide education and health promotion effort to engage with residents about the intent and purpose
of a policy such as a tax. An important component of this education would be raising awareness about the
harmful health and economic effects of sugary drink consumption. Several informants likened a tax on
sugary drinks to taxing tobacco and expressed a belief that tobacco taxes were largely successful because
the health risks associated with smoking were clearly communicated to the public. Informants stated that
county residents needed to understand the health risk that sugary drink consumption poses in a convincing
way through demonstrating its long-term health effects or the amount of healthcare costs spent on related
health conditions such as diabetes or dental disease. Several informants suggested emphasizing the role of
sugary drinks in causing dental caries, which the informants perceived to be more harmful in the short-
term than the threat of obesity. Multiple informants also suggested emphasizing the amount of money
individuals could save by cutting down on sugary drink or fast food consumption as a way to
appeal to consumers.
Many informants also stressed the importance of engaging community members in this
process through education, focus groups, and community forums. Informants believed it was
important to learn what different communities within Alameda County see as the root causes
of obesity and dental caries. They saw a need to conduct further in-depth research on these
topics and sugary drink consumption to ensure that messages or policies are tailored to
address any knowledge gaps, misconceptions, or beliefs held by community members.
Informants perceived tailored messaging to be particularly important for addressing low-
income groups, communities of color, and youth. A couple of informants suggested the use
of peer educators or other “people of the community” that are trusted individuals to deliver
health messages about potential policies. Youth stated that role models, such as celebrities,
athletes, or their own family members, could encourage and motivate their peers to reduce
sugary drink consumption and engage in healthy activities. Multiple individuals pointed out that the word
“tax” should be avoided in messaging to community members, saying, “People don’t like to talk about
taxation…there needs to be a better word than taxation because no one wants to support it,” and “taxation
is a dirty word.”
Lastly, numerous informants discussed the importance of tax revenue being directed to obesity or health-
related programs or initiatives that support parks and recreation, nutrition, and food access. One informant
referred to a recent poll about sugary drink taxes, saying “It has a much bigger chance of passing when it’s
tied to a solution.” Another individual said, “Returning it [tax revenue] to the community would make a lot
of sense and everybody would be on board.” Similarly, members of the Public Health Commission indicated
that tying the revenue to specific causes would allow community members to trust them: “The revenue
generating policy would have to be in such a way that people trust that the money was going towards a
good thing.”

27The Health and Economic Impacts of Obesity in Alameda County changelabsolutions.org I jsi.com
conclusions from Qualitative Research with stakeholders Across key informants and focus group participants, it was clear that Alameda County stakeholders
support strategies to reduce consumption of sugary drinks and other obesogenic foods. Several
individuals also perceived the public to be more aware of the negative health effects of sugary drinks than
in previous years, perhaps due to recent sugary drink related policy efforts in Richmond and El Monte,
California, and New York City, which generated significant media attention. Stakeholders expressed
the need to implement a broad effort towards reducing obesity in Alameda County, particularly among
children. While there have been targeted programs for obesity prevention and reducing sugary drink
consumption in the past, informants perceived the need for wide-reaching policy action that will have a
significant impact on the health of County residents.
Before pursuing any policy or regulatory options, Alameda County should conduct additional research
with a larger group of key informants and stakeholders to engage them in any future planning process. In
particular, the perspectives of the business community will be important to capture, as they are perceived
to be resistant to policy changes towards sugary drinks or other junk foods. The research team made
several attempts to solicit the participation of the members of the business/retail community through
local Chambers of Commerce, as well as the faith community, but these attempts were unsuccessful. A
public opinion poll or survey of county residents, similar to those conducted in other California counties,
may also be useful to the County as they are gauging support for a soda tax or other policy options.

28The Health and Economic Impacts of Obesity in Alameda County changelabsolutions.org I jsi.com
PolIcy scAn And gAPs AnAlysIs
As the preceding sections of this report make clear, obesity and chronic disease are issues that affect a
substantial portion of Alameda County residents, and there is general support for population-based policy
approaches to address these conditions and their environmental causes. In particular, strategies to reduce
the prevalence of sugary drink consumption within the County could have widespread positive impact. This
section focuses on policy (and, to a lesser extent, programmatic) approaches that reflect best practices
and/or have been proposed or implemented elsewhere in the nation.
In order to better understand the current policy landscape and identify promising policy interventions,
we conducted a review and analysis of existing programmatic and policy interventions in Alameda County
that support healthy eating, particularly by impacting the availability, accessibility, and consumption of
sugary drinks. We generally focused on county-level policies, but also conducted reviews for the cities of
Hayward, Oakland, and San Leandro, in order to more deeply comprehend the local policy landscape. Our
policy scan included:
1. Identifying and analyzing existing programs and policies of Alameda County, as well as the cities
of Hayward, Oakland, and San Leandro. This included reviewing: County charter; city and County
municipal codes, zoning codes, resolutions, planning documents; Office of Education/Board of
Education policies; and conducting general web searches for other relevant programs or policies.
Appendix 4 includes a list of the sources reviewed.
2. Comparing our analysis with best practice recommendations from the respected, nonpartisan
Institute of Medicine (IOM)101 and with our own experience working with numerous local jurisdictions.
3. Researching policies that have been proposed or implemented in other localities to identify
promising strategies.
4. Developing recommendations of potential policy strategies based on our analysis and best practices.
Our policy scan and gaps analysis focused on four key areas related to obesity prevention and healthy
eating: (1) public awareness; (2) government property; (3) schools; and (4) community-wide strategies. The
discussion below is organized by these four areas and includes a general overview of policy approaches,
a summary of best practices, our analysis of existing Alameda County policies, and recommendations
for policy strategies to consider. Appendix 5 contains a matrix that summarizes the healthy eating policy
landscape in Alameda County.
Because of the County’s particular interest in sugary drinks, the policy strategies outlined here focus
on healthy eating, and reducing sugary drink availability and consumption in particular. As noted earlier,
some of these strategies have met with success in other jurisdictions; others are untested and therefore
lack concrete data on effectiveness. Some of the policies have potentially broader impact on public health,
and some are more targeted. Some of the policies are widely in use across the nation and it is feasible to
consider them immediately; others are likely long-term goals. No single policy will radically or immediately
improve health; rather, a collection of strategies will create environments that promote health.
A note on the limitations of county Policy When considering the potential policy interventions discussed below, it is important to remember that,
generally speaking, county governments only have jurisdiction over the unincorporated areas of the
county.102 In other words, county ordinances and policies generally apply only to unincorporated areas and
do not apply within city boundaries. That said, county governments have authority over all county-owned
and -leased property (e.g., county buildings within city boundaries) and county agencies have authority
over their operations.

29The Health and Economic Impacts of Obesity in Alameda County changelabsolutions.org I jsi.com
Therefore, policies adopted by Alameda County will often impact only the residents of or visitors to
unincorporated areas. In Alameda County, six unincorporated areas qualify as census designated places:
Ashland, Cherryland, Castro Valley, Fairview, San Lorenzo, and Sunol. With the exception of Sunol, all of
these are located in the west central part of the county. The combined population of these six areas is
132,409 (or about 9 percent of Alameda County’s total population103) but these areas also have some of
the poorest health outcomes in the County. While the reach of county-level policy may be small in terms
of the size of the population impacted, Alameda County’s leadership has the potential to encourage and
influence cities to adopt similar policies.
One option for counties that want to further the reach of their policy intervention is to enter into joint
powers authorities or agreements with other local government entities. These require agreement and
cooperation between local governments, and are often focused on a particular location or topic. For
example, the Alameda County Waste Management Authority was formed by a Joint Exercise of Powers
Agreement between Alameda County, the fourteen cities within the county, and two sanitary districts
in the County.104 In 2012, the Alameda County Waste Management Authority adopted a Reusable Ban
Ordinance that prohibits single-use bags at certain retailers.105 Because all of the cities in Alameda
County, as well as the County itself, are members of the Waste Management Authority and agreed to the
ordinance, the Reusable Bag Ordinance applies throughout the County. While we have not identified a
health-focused joint powers authority in Alameda County that has broad jurisdictional reach, this is an
avenue for adopting more far-reaching policy that the County may want to explore.
Public AwarenessIn a recent Field poll, 75 percent of Californians identified sodas as being linked with risk of overweight
or obesity, but fewer believed that other sugary drinks, like energy or sports drinks, had the same health
effects.106 Public awareness campaigns are classic health education tools that can teach the public about
the risks of sugary drink consumption and encourage people to reduce consumption. These campaigns
can also complement and lay the foundation for policy efforts. Anti-smoking campaigns have paved the
way, using public awareness to reduce harmful behaviors; these have been particularly effective when
paired with supportive policies.107 Early evaluation of sugary drink public awareness campaigns suggests
that they can change attitudes about the risks of sugary drinks.108,109
best PracticesAs communities work toward adopting policies that restrict the availability of sugary drinks, they often
start with public awareness campaigns. In communities like Alameda County that are actively considering
policy interventions, public awareness campaigns can complement and raise support for these policy
efforts. Public awareness campaigns can positively impact health outcomes if they are carefully crafted,
well tested, fully funded, highly targeted, and sustained over time.110 Below are the IOM’s recommended
public awareness strategies for improving healthy eating and reducing sugary drink consumption:
•Use social media marketing campaigns to educate the public about the risks of sugary drinks.
•Support the work of community groups and coalitions to educate the public about the risks of
over-consumption of sugary drinks.111
current Alameda county Programs
soda free summer campaign
Since 2007, the Alameda County Department of Public Health has conducted an annual public awareness
campaign that features media spots, education and promotional materials, and coordination with youth
service organizations. The Soda Free Summer Campaign is designed to educate Alameda County residents
and motivate them to make healthier beverage choices.112
30The Health and Economic Impacts of Obesity in Alameda County changelabsolutions.org I jsi.com
An evaluation of the 2008 Bay Area-wide Soda Free Summer Campaign reported that at least 100,000 Bay
Area residents received the campaign message.113 Of these, 5,000 Bay Area residents pledged to reduce
their soda consumption.114 A sample of those who made the pledge found that nearly half reported drinking
less soda and sports drinks.115 This suggests that the Soda Free Summer Campaign has the potential to both
raise awareness of the health risks associated with sugary drink consumption and actually reduce sugary
drink consumption among interested and motivated individuals. However, as discussed above, there were
varying levels of knowledge and understanding of the program among key informant interviewees and
focus group participants. The findings from the youth focus group in particular, suggest that the Soda Free
Summer Campaign may not be successfully reaching all of its target populations.
HeAl Resolutions
Healthy Eating Active Living (HEAL) Resolutions signal local government support for obesity prevention
and a commitment to adopting policies that promote active living and healthy eating. They are included in
this section because they demonstrate policymaker awareness that obesity is a serious issue that demands
a policy solution. The city councils of Emeryville, Fremont, Hayward, Livermore, San Leandro, and Union
City are among the 162 California cities that have passed HEAL Resolutions.116 The HEAL Resolutions
adopted by these Alameda County cities vary greatly in the level of detail they contain with respect to
healthy eating and sugary drink consumption:
•The Emeryville and Livermore HEAL Resolutions do not specifically address healthy eating or sugary
drinks.
•The Fremont and San Leandro HEAL Resolutions both focus on healthy eating on government
property, including resolving to provide nutritious choices at City events, meetings, facilities,
concessions, and programs.
•Hayward resolved to: (1) set nutrition standards for vending machines in City-owned and -leased
locations; (2) create nutrition guidelines for foods offered at City events, meetings, facilities, programs,
and concessions; and (3) encourage businesses to feature healthy check-out lanes.
•Union City resolved to: (1) set nutrition standards for vending machines in City-owned and -leased
locations; (2) facilitate siting of grocery stores in underserved communities; (3) revise comprehensive
plans and zoning ordinance to increase opportunities for access to healthy foods; and (4) consider an
ordinance limiting fast food outlets near schools.
Among those Alameda County cities that have adopted HEAL Resolutions, there is limited evidence that
these resolutions have led to program or policy interventions.
notable examples from other jurisdictionsThe Policy Matrix in Appendix 5 includes links to other widely cited public awareness campaigns, including
in Howard County, Maryland; Multnomah County, Oregon; and New York City. As noted, these campaigns
are quite common.
strategies to consider Alameda County has a long-standing existing public awareness program in its Soda Free Summer Campaign
that has had some documented success. A next step for Alameda County would be to build on the
success of the Soda Free Summer Campaign and begin to translate that success into healthy eating policy
interventions. As Alameda County transitions to this policy-focused phase, public awareness campaigns
can play an important part in raising public awareness and support for policy efforts. As discussed above,
informants and focus groups participants voiced strong support for utilizing public awareness campaigns to
raise awareness of and support for policy interventions.

31The Health and Economic Impacts of Obesity in Alameda County changelabsolutions.org I jsi.com
Local public health departments and not policymakers generally conduct public awareness campaigns, but
resolutions are a useful tool for policymakers that want to signal awareness of and support for improving
access to healthy foods. Such resolutions can be an interim and/or complementary step in the process
of adopting healthy eating policy. The Alameda County Board of Supervisors could consider adopting
resolutions that signal support for and intention to adopt healthy eating policies. For example, the County
Commissioners of Franklin County, Ohio, recently passed a Healthy Food Systems Resolution, which, among
other objectives, commits to increasing access to healthy foods.117 One of the Public Health Commission
focus group participants suggested a County “Soda Free Month” resolution. Another option is to adopt a
resolution that supports a state-level policy change, such as a tax or excise fee on sugary drinks.
Healthy eating on government Property Government agencies regularly procure (or buy) goods and services for use by employees, students, and
community members. Government departments purchase food (or contract with businesses) to sell to
employees and the public in retail outlets, such as vending machines, cafeterias, and concession stands
on government property. Government agencies (and the community-based organizations with whom they
contract to operate social services) also buy food to provide meals to people in jails, juvenile facilities,
public hospitals, child-care centers, schools, and senior programs.
Depending on the source of the funds used to purchase food, governments generally have discretion over
the type of foods they procure. In fact, government entities exercising “market participant power” (i.e.,
spending their own money to purchase items for government use as a regular market shopper) may face
fewer legal restrictions than they do when exercising their regulatory power. By establishing policies to
improve the nutrition of the food they (or their contractors) buy and serve or sell, government agencies can
improve public health, lower overall costs, and provide leadership for the private sector to do the same. If
their purchasing volume is large enough, they may be able to create greater demand for healthier products
in the broader community and influence what is available in local food retailers.
best Practices Governments can increase access to healthy foods and limit access to sugary drinks on public property by
exercising their “market participant” power — the power to buy and sell goods and services. By adopting
healthy procurement, or healthy purchasing policies, governments can provide healthier foods and
beverages to employees and community members and make a positive impact on community health. The
IOM recommends the following strategies related to government purchasing:
•Establish strong nutrition standards for all foods and beverages purchased with government money.
•Adopt a healthy food and beverage vending and concession policy in all government-owned or
-operated buildings, worksites, and facilities.
•Ensure that government agencies follow the Dietary Guidelines for Americans for the foods and
beverages they provide.
•Make drinking water available in public places and recreation areas.118
Healthy government procurement policies can take many forms. A simple and common form is the
healthy vending policy, which establishes nutrition standards for products sold in vending machines on
government property. Healthy vending policies can also require that healthy items be given preferential
placement in the machine (usually the top few rows) and/or be comparably priced to unhealthy items.
Healthy government procurement policies can also encourage or require healthy foods and beverages be
sold and/or served at internal and external meetings, events, and government-run programs. Some healthy
procurement policies apply only to youth facilities and/or programs, or require only a percentage of foods
and beverages meet nutrition standards. However, the strongest healthy procurement policies will apply to
all foods and beverages purchased with government funds.

32The Health and Economic Impacts of Obesity in Alameda County changelabsolutions.org I jsi.com
current Alameda county Policies
Alameda county nutrition and Physical Activity Policy and guidelines
Alameda County’s Nutrition and Physical Activity Policy and Guidelines were adopted in 2009. The Policy
requires that at least 50 percent of foods and beverages sold in vending machines on County-leased or
-owned property, and served at County meetings and events meet specified nutrition standards. The
portion of the policy concerning vending machines includes the following detailed nutrition requirements
for beverages: no high fructose corn syrup; a limit of 12-ounces and/or 200 total calories; a requirement
that fruit juice drinks contain at least 50 percent juice and no added caloric sweeteners; and low-calorie
limits on beverages with added caloric sweeteners. The policy also requires that the food and beverage
items that meet nutrition standards be placed in vending machines so that “they are easily visible and
distinguishable from non-healthy items.” The guidelines also encourage County employees to bring
healthier foods and beverages to work. The policy does not apply to all foods and beverages purchased
with public funds—it does not apply to county-run concessions or programs, or to public facilities.
notable examples from other jurisdictionsLocal governments across the country have adopted healthy procurement and vending policies. These
policies vary greatly in scope and strength. Some notable examples in California include Monterey
County,119 which prohibits the sale of sugary drinks in most county facilities, and the City of Redding,120
which requires that 100 percent of beverages sold in vending machines at facilities that primarily serve
youth (e.g., recreation centers) and 50 percent of beverages sold in vending machines at other city
facilities must meet nutrition standards that exclude sugary drinks. Boston, Massachusetts, has one of the
strongest beverage procurement policies in the nation: it does not allow any sugary drinks to be sold on
city property, including in vending machines and at concessions.121
strategies to consider
establish stronger nutrition standards for all foods and beverages sold or served on government property.
Alameda County should be commended as an early adopter of a healthy vending and procurement policy.
However, given that the policy has been in place for nearly five years, it is ripe for improvement and
strengthening, as indicated by Public Health Commission Focus Group participants. Specific changes that
would strengthen the policy include:
•Require that 100 percent of food and beverage items sold in vending machines in county-owned and
operated buildings and facilities meet nutrition requirements.
•Extend the nutrition requirements to all food and beverage sales in County-owned and -operated
buildings and facilities (e.g., concession stands, snack bars, cafeterias, etc.).
•Require that 100 percent of food and beverages sold and served at County meetings and events meet
nutrition requirements.
•Extend the nutrition standards to apply to foods and beverages served through County-run and/or
County-funded programs. Alternatively, begin by applying to programs serving youth.
•Adopt strengthened nutrition standards. For example, remove “beverages with added nutritive
sweeteners” from the list of allowed beverages (regardless of calorie content), require fruit juice
beverages contain 100 percent juice, and/or require that snack items in vending machines contain no
saturated fat.
A common barrier in implementing healthy procurement policies is that governments have existing
contracts in place for vending machine or other food and beverage concession services. If this is the case
in Alameda County, it will be necessary to either re-negotiate existing contracts to ensure compliance
with an enhanced policy or to wait until existing contracts end, when enhanced nutrition standards can be
added to the government procurement process.
33The Health and Economic Impacts of Obesity in Alameda County changelabsolutions.org I jsi.com
A strengthened Alameda County healthy purchasing policy will most directly affect county employees,
visitors to County buildings and facilities, and recipients of County services. However, adopting a stronger
policy would send a strong signal of the County’s commitment to reduce obesity and promote healthy
eating. And, if the County’s purchasing power is large enough, a stronger policy has the potential to bring
about broader change as more contractors and vendors develop solutions and source healthier products
that meet the requirements.
Healthy eating in schoolsChildren and adolescents consume a significant portion of their daily caloric intake at school. Among
U.S. children participating in the National School Lunch Program, 31 percent of their daily caloric intake
comes from school lunch and 22 percent of their daily caloric intake comes from school breakfast.122 An
additional 13 to 15 percent of calories come from foods purchased at school outside of the meal program
(so-called “competitive foods” 123).124 While children and adolescents consume the majority of their sugary
drink calories at home, it has been estimated that at least seven percent to 15 percent,125 and potentially as
much as 22 percent,126 of their sugary drink calories are consumed at school. Comprehensive policies that
remove or restrict the availability and/or serving size of the full spectrum of sugary drinks in schools are an
effective method for lowering children’s and adolescents’ sugary drink consumption.127,128
Federal law establishes nutrition standards for school meals and other foods sold on school campuses in
districts that participate in the National School Lunch Program.129 California law further restricts sales of
sugary drinks in public schools, with varying levels of restriction depending on grade level.130 The federal
rules on allowable beverages recently changed,131 and California is expected to revise the Education Code
and/or Department of Education regulations in response.132 Based on our best estimation of how to integrate
the new federal rules and current California law, starting in the 2014-2015 School Year, the only beverages
California schools will be allowed to sell to students during the school day will be: water; fruit or vegetable
juice drinks with at least 50 percent juice and no added sweetener; unflavored, one percent milk; flavored
and unflavored nonfat milk; and calorie-free and low-calorie beverages (in high schools only).133 Starting in
the 2014-2015 School Year, federal law will also place grade-level based serving size limits on milk, juice,
and calorie-free and low-calorie beverages.134 All other beverages may be sold 30 minutes or more after the
school day ends, although elementary school sales are limited to fundraising purposes only.135
Since 2006, all school districts that participate in the National School Lunch Program have been required
by federal law to develop and adopt a Local School Wellness Policy.136 School wellness policies must include
nutrition guidelines for all foods and beverages available on school campuses.137 In order to fulfill this
requirement, school districts can choose to simply refer to or restate the California and federal competitive
foods nutrition standards in their Local Wellness Policies. However, school districts can choose to go
beyond these basic requirements and adopt stronger rules on foods and beverages, either as part of the
local school wellness policy or as a stand-alone policy. These stronger rules can further limit the beverages
sold as competitive foods during the school day. They can also provide limits where the California and
federal rules do not apply, including classroom celebrations and school events and fundraising.
The federal 2010 Healthy, Hunger-Free Kids Act included two important changes that impact school food
policy. First, it required the USDA to develop new guidelines for competitive foods in schools.138 Second, it
added new requirements for school wellness policies, and school districts will have to revise their existing
wellness policies to comply.139 In June 2013, the USDA released an Interim Final Rule on competitive foods,
Smart Snacks in Schools, which school districts must implement by July 1, 2014.140 The USDA released
new proposed rules on school wellness policies in February 2014 and a final rule is expected in late 2014.141
In order to comply with these changes, school districts will have to adopt revised wellness policies. Many
school districts started reviewing their existing school wellness policies during the 2011—2012 school year,
and all districts should plan to have a revised policy in place by the start of the 2015—2016 school year.

34The Health and Economic Impacts of Obesity in Alameda County changelabsolutions.org I jsi.com
best Practices The IOM recommends the following strategies related to foods and beverages in schools:
•Develop district wellness policies and actively regulate the nutritional standards of food served
and sold in schools.
•Prohibit access to sugary drinks in schools.
•Provide a range of beverage options in schools, including water and competitively priced healthy
beverages.142
Federal and state law set minimum standards, which school districts can build upon and strengthen.
School district policies that limit access to sugary drinks on school grounds are a popular method for
reducing children’s access to sugary drinks. Because such policies target sugary drink access where
children spend a large portion of the day, they directly address the link between sugary drinks and
childhood obesity. The strongest school wellness and nutrition policies address healthy eating in general
and sugary drinks in particular in the following key areas: (1) school foods, and particularly competitive
foods; (2) vending machines; (3) fundraising, events, and celebrations; (4) food marketing on school
campuses; and (5) drinking water access.
current Alameda county Policies
Alameda county office of education, student wellness Policy
The Alameda County Office of Education (ACOE) serves students who: are under the protection or
authority of the juvenile court system; have special needs related to independent study; are pregnant or
parenting; are in substance abuse recovery; or have been expelled or suspended from traditional local
school districts.143 ACOE’s Student Wellness Policy states that it will provide students with “food that
promotes good health and meets or exceeds government nutrition standards.” It also requires that “food
and beverages sold during extracurricular activities, and/or in vending machines should meet or exceed
government nutritional standards.” ACOE’s Student Wellness Policy does not include detailed nutritional
requirements for foods or beverages; it merely states a commitment to comply with state and federal law.
ACOE’s Student Wellness Policy also does not address marketing, fundraising and celebrations, or drinking
water access.
Hayward unified school district, wellness Policy and Administrative Regulations on wellness
The Hayward Unified School District (HUSD) limits the beverages available to be sold during the school
day to water, 50 to 100 percent juice, and milk (flavored allowed). The HUSD Wellness Policy allows other
beverages to be sold before and after schools (the exact times vary by grade level). Healthy fundraising
and celebrations are encouraged in HUSD’s Wellness Policy. HUSD policy does not expressly address
vending machines, food marketing, or drinking water access.
oakland unified school district, wellness Policy and Associated nutrition Administrative Regulations
The Oakland Unified School District (OUSD) limits the beverages available to be sold in during the school
day to water, 100 percent juice, organic soy milk, and nonfat and one percent milk (flavored allowed).
In addition, only foods and beverages that meet the nutrition standards laid out in OUSD’s Wellness
Policy can be served or sold in vending machines, at school-sponsored activities, for fundraising, and
at celebrations. OUSD does not allow marketing on school grounds of food and beverage items that do
not meet the nutrition standards of the Wellness Policy. OUSD’s Wellness Policy Nutrition Administrative
Regulations detail the District’s vending machine rules. The District maintains authority over the vending
program, including negotiating and entering into vending contracts, selecting products to be sold, and
setting hours of vending machine operation. However, individual school principals can decide whether to
have a vending machine installed at the school site. OUSD’s policies do not address drinking water access.

35The Health and Economic Impacts of Obesity in Alameda County changelabsolutions.org I jsi.com
san leandro unified school district, student wellness Policy and Associated nutrition Administrative Regulations
The San Leandro Unified School District (SLUSD) limits the beverages available to be sold in elementary
schools during the school day to water, milk, and 50 to 100 percent juice, but allows middle and high
schools to also sell electrolyte replacement beverages with up to 42 grams of sugar per 20 ounces (as is
currently allowed under California law). While only beverages that meet nutrition standards can be sold for
fundraising during the school day, SLUSD allows sale of beverages that do not meet standards outside of
the school day in middle and junior high schools, including in vending machines. SLUSD prohibits marketing
of “non-nutritious foods and beverages.” SLUSD’s policies do not address drinking water access.
notable examples from other jurisdictions Because new rules on local wellness policies are pending from the USDA, most existing policies, including
model policies, are outdated. OUSD’s Wellness Policy is often held up as an example of a strong policy,
particularly in the areas of healthy eating and sugary drinks, and OUSD has already started the process
of revising and updating its policy. We expect that model wellness policies, such as the ones from the
California School Board Association144 and the National Alliance for Nutrition and Activity,145 will be updated
after the USDA releases new rules.
strategies to consider The County of Alameda does not have authority over individual school districts. However, the County can
work with local school districts, including the ACOE, to revise and strengthen their school wellness policies,
and encourage the inclusion of sugary drink-related policy elements that go well beyond the state and
federal regulations.146
further restrict availability of sugary drinks on school grounds
As noted above, federal and California law restrict the availability of sugary drinks in all public schools,
with varying levels of restriction dependent on grade level. Alameda County can work with the ACOE and
other school districts within the county to adopt stronger restrictions on the availability of sugary drinks on
school grounds. Specific policy elements might include:
•Further restrict the types of beverages that are allowed to be sold during the school day (once the new
standards go into effect for the 2014-2015 school year, this would include not allowing flavored milk or
low-calorie drinks).
•Further restrict serving sizes of milk and/or juice (serving size limits will go into effect for the 2014-
2015 school year).
•Extend restrictions beyond the school day. Options include extending to include the time that
after-school programs and activities are taking place, or to all times, including school events, like
performances, dances, and athletic events.
•Limit or disallow food-based celebrations and/or fundraisers. If food-based celebrations and/
or fundraisers are allowed, require that foods and beverages sold or served meet the nutritional
requirements of the wellness policy.
Restrict food and beverage marketing on school grounds
While it is legally difficult to prohibit most forms of marketing (because commercial speech is protected by
the First Amendment), school districts have relatively broad authority to control commercial messaging
on their campuses. Three potential approaches to a school-based marketing policy are to: (1) ban all
advertising on campus; (2) ban the advertising of all foods and beverages on campus; or (3) ban the
advertising of those foods and beverages that the district does not allow to be sold on campus. Strong
school-based marketing policies that are consistent with a district’s health and nutrition curriculum can
support district efforts to teach students how to make informed choices about nutrition, physical activity,
and health.

36The Health and Economic Impacts of Obesity in Alameda County changelabsolutions.org I jsi.com
Increase access to fresh drinking water on school grounds
One way to decrease consumption of sugary drinks is to make it easier to access and consume palatable,
healthier alternatives. Fresh drinking water is an important alternative to sugary drinks. Federal147 and
California148 law require that school districts provide access to free, fresh drinking water during meal times
in the food service areas of the schools. School districts should consider what policy changes are needed to
improve students’ access to water throughout the school day. Specific policy elements might include:
•Commit to conducting a water audit and improve water infrastructure, including repairing water
fountains and/or purchasing and installing water filling stations.
•Providing cups and containers of water throughout the school campus and throughout the school day,
and particularly when students are engaging in physical activity.
•Allow students to keep personal water bottles with them at all times.
community-wide PoliciesWhile existing policies address sugary drinks in schools and on government property in Alameda County,
these policies have limited reach even if they are strengthened because they generally impact only students
and persons on government property. Most sugary drink consumption occurs outside of the school and
government property setting. For example, on a typical weekday, 55 to 70 percent of all sugary drink
calories consumed by children and adolescents are consumed at home, while between seven149 and 22150
percent are consumed in school settings.151 Policies that increase access to healthy foods and reduce the
availability of sugary drinks throughout the entire community will have the greatest impact on consumption.
It is unlikely that any jurisdiction will at this point seriously consider regulating the actual use or
consumption of sugary drinks in public generally (unlike tobacco, for instance, which has harmful
secondhand effects that have led many communities to prohibit use in public spaces and multi-unit
housing). Therefore, policies that address the sales and marketing of sugary drinks are the most
promising community-wide policies that have the best chance to change social norms around sugary
drink consumption. Because the First Amendment protects corporate advertising it is difficult to regulate
marketing directly. Instead, most jurisdictions have focused on policies to regulate how and where sugary
drinks are sold, often as part of a larger effort to improve access to healthy foods.
In Alameda County, as in the rest of the United States, children and families struggle to eat a nutritious diet,
in part because of limited access to healthy foods. As previously discussed, in Alameda County, there are
nearly five times as many fast food restaurants and convenience stores as grocery stores and other produce
vendors.152 Less than half of children ages 2 to 11 and less than a quarter of youth ages 12 to 17 in Alameda
County eat the recommended number of servings of fruits and vegetables each day.153
While most food retail outlets sell sugary drinks and other unhealthy foods that contribute to obesity,
supermarkets, particularly large chain stores, are more likely to offer healthful items, like fresh fruits and
vegetables, and often at lower cost.154 People are more likely to eat healthy food if they live closer to grocery
stores and other retailers that sell healthy foods.155 Living near convenience stores is linked to higher rates
of obesity and diabetes.156 Adolescents who live closer to food retailers are more likely to purchase and
consume sugary drinks on a daily basis.157 This association holds true for a variety of retailers, including
convenience stores, grocery stores, and restaurants (including fast food restaurants).158
While living near any food retailer is associated with increased sugary drink consumption, research shows
variations by retailer type in the association between residential proximity to food retailers and the
prevalence obesity and overweight. Adolescents who live in neighborhoods with more chain supermarkets
tend to have a lower body mass index and are less likely to be overweight, but adolescents who live in
neighborhoods with more convenience stores tend to have higher a body mass index and are more likely to
be overweight.159 Low-income, African-American, and Hispanic neighborhoods have fewer chain supermarkets
than middle-income and white neighborhoods160 but more convenience stores and small grocery stores.161
37The Health and Economic Impacts of Obesity in Alameda County changelabsolutions.org I jsi.com
Policies that improve access to staple foods (usually defined as lean dairy products and proteins, and
whole grains) and fresh produce can not only increase consumption of these healthy foods, but also
decrease the prevalence and consumption of junk food, including sugary drinks.
best PracticesAccess to healthy foods is vital to overall community health. Local governments can use incentives and
economic development to encourage businesses that offer healthy foods, such as supermarkets, to open
stores in underserved areas. Collaboration between food retailers, banks and lenders, and community
groups can help develop the resources necessary for these projects. Placing restrictions on unhealthy
foods and beverages is another way to promote healthy eating habits. Regulating the foods and beverages
that retailers stock and sell can both limit consumption of unhealthy foods and beverages and increase
access to and consumption of healthy options. Restrictions on unhealthy foods and beverages promote
healthy eating habits and increase the likelihood that at least some healthy food options are offered.
Improving access to healthy foods is also closely related to transportation and land use policies, as
reducing the distance that people must travel to access healthy and affordable food greatly increases the
likelihood that they will eat healthily.
Below are the IOM’s recommended strategies to promote healthy food access and restrict unhealthy foods:
•Encourage or require food retailers to sell healthy food and beverage options.
•Encourage healthy food retailers such as supermarkets, grocery stores, and farmers’ markets and
limit unhealthy food venues such as fast food restaurants and convenience stores.
•Create incentives such as streamlined permitting processes, favorable zoning strategies, flexible
financing or tax credits, grants or loans, and small business and economic development programs to
attract healthy food retailers to underserved communities.
•Work with retailers, the banking and real estate sectors, philanthropic organizations, and nonprofit
and community groups to develop private funding to support healthy food retail in underserved
communities.
•Regulate food served in restaurants to reduce the number of calories served to children.
•Expand the number of affordable healthy options available, through strategies such as portion
size limits, nutrition standards for restaurant children’s meals, and healthy restaurant certification
programs.
•Make a range of beverage options, including competitively priced healthy beverages, available in
retailers and other community settings.
•Introduce specific excise taxes on sugary drinks and earmark revenue for obesity prevention efforts.
•Introduce pricing incentives to make healthier beverages more affordable and competitive with sugary
drinks.162
As the above list demonstrates, local governments have a wide range of policy options for creating
healthier food environments, but most of these strategies are not widely utilized yet. Our review focused
on the following: restaurants, food retailers, mobile vending, zoning restrictions, sugary drink taxes, and
sugary drink portion size restrictions. We chose to focus on these because they represent policy areas in
which local governments have already adopted policies or programs, and/or public health experts have
identified them as having high potential for positively impacting health.

38The Health and Economic Impacts of Obesity in Alameda County changelabsolutions.org I jsi.com
current Alameda county Programs and PoliciesBecause there are so many potential policy and programmatic approaches to improve food access, and
because these strategies are in different stages of development, it is not surprising that there is an eclectic
mix of activity in Alameda County. This mix mirrors the variety of strategies being implemented across the
United States, as policymakers and public health professionals work to determine the best approach to a
difficult and multi-faceted public health issue.
Alameda county Healthy Retailer demonstration Project
The Alameda County Health Department will award $220,000 in fiscal year 2013-2014 and $200,000
in fiscal year 2014-2015 to community benefit organizations to design and implement Healthy Retailer
Demonstration Projects in Hayward, Ashland/Cherryland, East and West Oakland, and Livermore.163
The projects will aim to increase healthy food and beverage options and decrease unhealthy options,
particularly alcohol and tobacco. Projects are also tasked with determining which models and approaches
are most likely to be replicable. Although not a policy intervention, this project has the potential to lay the
groundwork for a comprehensive Countywide program and eventual accompanying policy.
mobile vending Regulation
The Alameda County Code does not address mobile food vending specifically. The Alameda County
Environmental Health Department is the local enforcement agency for the California Retail Food Code
and issues “Permits to Operate” mobile food units. The Environmental Health Department has existing
“Regulations Specific to Mobile Food Facility Permitting;” these regulations are undergoing revisions
and are not currently available publicly. However, once these revised regulations are available we can
supplement this report with any relevant information.
Some municipalities in Alameda County have adopted ordinances addressing mobile vending. Hayward
Municipal Code section 6-2.01 bars the sale of foods from “hand carts” within city limits. San Leandro
Municipal Code section 4-5-535 prohibits mobile vending of food within 2 blocks or 600 feet of an
established business selling the same type of food. These regulations are not explicitly focused on nutrition
or public health, and Hayward and San Leandro do not appear to further regulate mobile food vending—
either by restricting the sale of unhealthy foods and beverages or encouraging the sale of healthy foods by
mobile vendors.
Three different chapters in the Oakland Municipal Code regulate mobile food vending. While all three
prohibit operation within a certain distance of public schools or parks, as noted above, school nurses
and youth focus group participants reported easy access to sugary drinks and other unhealthy foods
sold by mobile vendors near schools. The current code sections each apply only to specific geographic
areas within the city and do not create consistent regulation. Oakland Municipal Code Chapter 5.49
establishes a “Pushcart Food Vending Pilot Program” that allows food sales in a specific geographic area
(generally the Fruitvale neighborhood). The pushcarts are not allowed to operate within 200 feet of a
school or public park. Oakland Municipal Code Chapter 5.51 establishes a “Food Vending Group Site Pilot
Program” that allows foods sales from groups of food trucks in certain locations in the city. These group
sites are not allowed to locate within 100 feet of a public school, park, or city-owned facility or property,
although exceptions can be made if the school or city approves. Oakland Municipal Code Chapter 8.09
allows “Vehicular Food Vending” on private property in a specific geographic area (generally the Fruitvale
neighborhood). These vehicular food vendors on private property may not locate within 500 feet of a public
park or school. Like Hayward and San Leandro, Oakland also does not regulate the types of food sold by
mobile vendors—either by restricting the sale of unhealthy foods and beverages or encouraging the sale of
healthy foods.

39The Health and Economic Impacts of Obesity in Alameda County changelabsolutions.org I jsi.com
Hayward 2040 general Plan Administrative draft
A city’s General Plan is a guiding document that informs all future policymaking in a city, and state law
requires general plans to be updated periodically. The City of Hayward is in the process of updating its
general plan and hopes to adopt a new general plan by June 2014. The Administrative Draft released
September 30, 2013, includes goals and policies that aim to increase healthy food options and reduce
unhealthy options. Policy HQL-3.8 in the Administrative Draft calls for the City to create regulations to limit
new liquor stores and fast food restaurants near schools and in areas that already have a high concentration
of those retailers. Policy HQL-3.3 in the Administrative Draft calls for the city to adopt incentives and
programs to increase healthy food options in existing small grocery and convenience stores, with a focus on
underserved areas and around schools.
notable examples from other jurisdictionsHealthy retail is an area ripe for policy intervention. While public health policy experts have identified a wide
range of program and policy options, only a few have been successfully adopted or implemented to date.
zoning to create Healthier food environments
A number of communities across the country have adopted zoning regulations that restrict fast food
restaurants and mobile vendors from operating near schools and or parks. Communities have taken varied
approaches to these restrictions. Detroit prohibits fast food restaurants within 500 feet of any school.164
The City of Arden Hills, Minnesota, prohibits fast food restaurants within 400 feet of any public, private, and
parochial school; church; public recreation area; or any residentially zoned property.165 Seattle has banned
mobile food vendors within 200 feet of public parks and 1,000 feet of schools, 166 while Los Angeles bans
vendors on streets within 500 feet of schools.167 (As noted above, location-based restrictions on mobile
vendors also exist in Oakland.)
Some communities have also adopted bans (or strict number limits) on fast food, drive-thru, and chain
restaurants.168 While some cities cite a desire to preserve their unique character, others point to a need to
prevent further concentration of retailers with many unhealthy food options. For example, in 2008, the Los
Angeles City Council passed a one-year moratorium on new fast food restaurants in South Los Angeles, an
area already saturated with unhealthy food options.169 In 2010, the City Council amended the General Plan
to permanently restrict new fast food restaurants from locating within one-half mile of existing fast food
restaurants in South Los Angeles.170 Similarly, the Land Use Element of the Seaside General Plan calls for
restrictions on new businesses of types that are already over-represented in the city, including liquor stores,
convenience stores, fast food restaurants, and mini-markets.171
Healthy Retailer certification and licensing
Many cities across the United States have robust programs that work directly with small stores, providing
technical and financial assistance to help them to stock healthy foods. These programs have been very
successful but have limited reach and typically require enormous human and financial resources, and have
not been successfully scaled throughout an entire community.
A few communities have taken a more proactive approach to incentivize or require small stores to stock
healthy foods. Healthy retailer certification programs have been implemented in a number of communities
across the United States, including Sonoma County, California.172 These certification programs offer
incentives and recognition to businesses that voluntarily make a binding commitment to adhere to certain
performance standards, including stocking produce and staple foods.
A stronger approach is a requirement that stores that sell food carry at least a minimum amount of produce
or staple foods; there are various legal mechanisms to effectuate this type of requirement, including zoning
and business licensing. The City of Minneapolis is the only city in the United States that has adopted a
licensing law to improve the food environment; its “Staple Foods Ordinance” requires all food retailers in
the city to obtain a special license and stock produce.173 The Minneapolis system has met some success

40The Health and Economic Impacts of Obesity in Alameda County changelabsolutions.org I jsi.com
and some barriers, but the lessons learned could help future efforts for healthy food retailer licensing.
In particular, Minneapolis has found that store owners often do not meet stocking requirements without
strong programmatic support.174
The California counties of Santa Clara175 and San Francisco176 have established nutrition standards for
kids’ meals served with toys. These comprehensive standards include limits on beverages served with the
meals. To date, no community has established strict nutrition standards for all children’s meals.
sugary drink Portion size limits
In 2012, the New York City Board of Health adopted a policy to prohibit sales of single-serving beverages
greater than 16 ounces in retail outlets within the board’s jurisdiction. A coalition of industry trade groups,
including the American Beverage Association, sued to challenge the law. In March 2013, on the day before
the regulation was scheduled to take effect, a New York trial court struck down the restriction, ruling that
the Board of Health exceeded its authority by adopting the regulation and that certain exemptions (for
some types of establishments and beverages) rendered the law “arbitrary and capricious.” New York City
has appealed the court’s ruling. Regardless of the appeal’s outcome, the issues cited by the trial court can
all be addressed in future laws restricting portion sizes of sugary drinks, in order to make these laws less
susceptible to legal challenge.177
Also in 2012, the mayor of Cambridge, Massachusetts proposed a portion size limit on sugary drinks sold
in the city’s restaurants. The city’s Community Health Committee is studying the proposal and whether to
include it as part of broader efforts to reduce childhood obesity.178 A similar law that would restrict portion
sizes for sugary drinks, and also prohibit sugary drinks from being sold as part of a children’s meal, has
been recently introduced in the Hawaii State Senate and is pending at the time this report was written.179
taxes on sugary drinks
Over the past five years, dozens of state legislatures and some local governments have considered sugary
drink tax proposals.180 A number of recent failed local tax measures have garnered significant attention.
In November 2012, voters in the California cities of El Monte and Richmond rejected proposals to impose a
penny-per-ounce fee on sugary drink sales.181 While voters in both cities rejected the tax, they did approve
accompanying ballot measures that advised the city to use tax revenue for obesity prevention programs
(however, these accompanying measures had no effect since the actual tax measures failed). In November
2013, voters in Telluride, Colorado also rejected a penny-per-ounce tax on sugary drink sales.182 The funds
raised by the Telluride tax would have gone to fund afterschool programs, physical activity programs for
youth, and community gardening projects. Policy makers in San Francisco,183 Berkeley,184 and Seattle185
have already announced their intent to put forth sugary drink tax measures in 2014.
Of all the sugary drink strategies that have been considered, sugary drink taxes have been the subject of
the most research and publication, all of which is widely available. Sugary drink taxes are considered a
potentially positive strategy not only to reduce consumption (if the price of sugary drinks increases as a
result) but also to raise revenue that can be dedicated for obesity prevention and treatment programs.
strategies to consider This section discusses many different strategies that could improve the food environment in Alameda
County, each with certain advantages and drawbacks. These policies are not listed in a specific order; a
description of each is provided to help guide future consideration.
establish healthy mobile vending permits
Mobile food vendors (e.g., food trucks and hand carts) often sell unhealthy items, including sugary drinks.
However, mobile food vendors have the potential to increase access to healthy foods (especially fresh
produce) in underserved neighborhoods. Local governments can adopt or revise existing permitting policy
to facilitate healthy mobile vending, particularly in areas without a grocery store or near schools.

41The Health and Economic Impacts of Obesity in Alameda County changelabsolutions.org I jsi.com
By creating a permitting system, the city can impose specific conditions on permitted vendors including what
kinds of foods can be sold, and where. New York City’s “Green Cart” ordinance was established in 2008 to
implement a permitting system to bring produce vendors to underserved areas.186 As of August 2013, there is
a waiting list for permits (only 1,000 were authorized), and this policy could be a model for Alameda County.
establish a healthy small food retailer certification program
Through a certification program, local governments can provide incentives for businesses that voluntarily
agree to increase the number of healthy foods for sale, decrease the number of unhealthy offerings, and
proactively market the healthier choices. A certification program requires participating businesses to enter
into a binding agreement. Certification programs often include incentives, which must be meaningful enough
to prompt businesses to meet the requirements. Although financial incentives, such as a tax credit, are often
the most meaningful for a business, there are many other types of nonmonetary incentives that can be
offered, including zoning incentives, streamlined permitting or licensing processes, or technical assistance.
A certification program requiring a binding agreement by the participating store can be an effective
strategy to improve healthy food access in small stores, even though not a policy. As noted earlier, most
communities that are working on healthy food access have used a programmatic approach, working directly
with selected stores, and there is scant policy work being done in this area yet. A certification program
may be an effective vehicle for scaling programmatic work and developing a community policy. ChangeLab
Solutions has developed a thorough toolkit explaining healthy retailer certification, including model
agreements, in Health on the Shelf: A Guide to Healthy Small Food Retailer Certification Programs, available
at: www.changelabsolutions.org/publications/health-on-the-shelf.
create a healthy food retailer licensing ordinance
Unlike a certification program, a healthy food retailer licensing ordinance is a policy that would require
all stores that sell food to stock a certain amount of staple foods and produce. Rather than voluntary
participation, under a licensing ordinance all food retailers would be required to obtain a license from the
county and meet operational standards set by the county. Because this is a mandatory policy, all stores in
all neighborhoods would be affected, and improvement of the food retail environment would not depend on
voluntary participation by businesses.
Using business licensing in this manner is common throughout California for tobacco control; approximately
140 California cities and counties require tobacco retailers to obtain a license and meet performance
standards established by the government.187 In the tobacco control context, licensing has proven enormously
successful in ensuring that retailers are responsible and do not sell tobacco to minors. Alameda County
could employ the same hallmarks of a successful regulatory licensing system (e.g., a mandatory license
requirement with strong performance standards, charging retailers a licensing fee, and vigorously enforcing
the license conditions) to increase the amount of healthy food sold; however, this is a novel approach and
requires dedicated human resources and substantial foundational work. As noted above, Minneapolis has
found that retailers need strong and consistent support to meet healthy food stocking requirements.
Restrict sales of sugary drinks and other unhealthy foods through zoning
Another option is to regulate the location of businesses that sell sugary drinks. Such restrictions on the
location of businesses are typically adopted within the municipal zoning code, which generally dictates
what types of businesses can operate in a community, and where. (Note that business licensing can also
be used to restrict the location of specific businesses, but historically this has been done through zoning.)
Zoning regulations are primarily tools to shape a community over time, and changes in zoning law typically
“grandfather” in existing businesses and apply only to new businesses. Therefore, zoning may be a more
appropriate approach for communities planning new development or with few retailers already selling
sugary drinks. In areas that are already developed or that have a high number of existing retailers selling
sugary drinks, a zoning approach may have a delayed impact.
42The Health and Economic Impacts of Obesity in Alameda County changelabsolutions.org I jsi.com
As noted above, local governments can and do use zoning to prevent certain types of food retailers, including
fast food, drive-thru, and chain restaurants from operating within their limits. Other local governments
restrict certain types of food retailers (most commonly, fast food restaurants and mobile vendors) from
operating near schools and parks. Finally, another option, not yet adopted anywhere, is to prohibit retailers
from selling sugary drinks if they are located near schools, parks, or other places youth frequent.
Zoning strategies that focus on the areas around schools and parks are particularly useful for targeting
childhood obesity. Two-thirds of urban secondary schools are within walking distance of at least one fast
food restaurant.188 Students’ easy access to fast food undermines schools’ efforts to provide nutritious food
and a healthy school environment. A long-term zoning strategy that attempts to reduce unhealthy food
options can help maintain a healthy environment around schools.
establish a healthy restaurant certification program
As with food retailers, Alameda County can offer incentives for restaurants that are willing to meet healthy
nutrition standards for meals, including children’s meals. Some healthy restaurant criteria (such as the
nutrition standards) could be mandatory, and some (such as not offering toys with unhealthy meals) could
be optional for participating restaurants. By meeting the required criteria (and entering into a binding
agreement with the County to continue meeting the criteria), a restaurant could be eligible for certification
as a “healthy restaurant” and incentives offered by the County. As with the “healthy food retailer”
certification program discussed above, the incentives need to be meaningful enough to entice restaurants
to participate.
establish nutrition standards for children’s meals
The County can address restaurant meals intended for children independently if it does not want to establish
a program to set voluntary or mandatory nutrition standards for all restaurant menu items. Under this policy,
the County could require any meal sold as a “children’s meal” to meet specified nutrition standards.
Meals marketed to children usually include a beverage, and the default beverage is most often an sugary
drink. Through a policy, the County could either (1) require that the default beverage offered with a
children’s meal is water, or (2) prohibit sugary drinks from being sold as part of a children’s meal at all. Even
if an sugary drink could be purchased independently for full price, decoupling sugary drinks and children’s
meals could significantly lower youth sugary drink consumption.
Another strategy that has recently garnered much national attention and media coverage is a policy
that establishes nutritional standards for children’s meals that include a toy giveaway. A vast majority of
children’s meals at fast food restaurants fail to meet expert nutrition standards for children’s meals.189 Fast
food restaurants often use toys as a way to entice children, and requiring meals that include a toy (either
for free or for a nominal cost) to meet nutritional guidelines could result in either fewer children demanding
fast food meals, or improved nutritional quality for meals children consume at fast food restaurants.
Impose a business license tax on businesses that sell sugary drinks
As noted earlier, there has been an enormous amount of research and discussion around taxes on sugary
drinks as a public health strategy. California law already imposes a sales tax (i.e., a tax paid by a consumer
at the time of purchase) on carbonated beverages and beverages sold in vending machines, which includes
some sugary drinks.190 As a public heath strategy, however, an excise tax on the privilege of selling sugary
drinks is viewed as the type of policy that may reduce consumption by increasing the shelf price of sugary
drinks.191,192,193,194,195 Even so, the effect of a tax on the actual price of sugary drinks, and the resulting effect
on purchases by price-sensitive populations is unknown and subject to many variables.196
43The Health and Economic Impacts of Obesity in Alameda County changelabsolutions.org I jsi.com
A recent study by researchers at the University of California, San Francisco sought to estimate the health
benefits of reduced sugary drink consumption that would result from a penny-per-ounce excise tax in
California on sugary drinks over a ten-year period. The researchers focused on those populations with the
highest rates of sugary drink consumption and diabetes, including Mexican-American, African-American,
and low-income populations. The study found that in hypothesizing a moderate 10 to 20 percent reduction
in sugary drink consumption, rates of incident diabetes in California would be reduced by 1.8 to 3.4 percent
and rates of heart disease by one-half to one percent over the next decade. Incidence rates would be even
further reduced among specific at-risk populations. In addition, prevention of diabetes and heart disease
resulting from reduced consumption could save California upwards of $1.7 billion in health care costs.
However, there are several unknown factors that would affect the impact of a tax, including the degree
to which consumers may substitute other foods or beverages (caloric or non-caloric) for sugary drinks in
their diets.197
Local governments in California can impose a specific type of excise tax know as a business license tax on
businesses that sell sugary drinks. For specific information on the procedures for adopting the tax, please
refer to ChangeLab Solutions’ detailed legal memo on this subject, available at: www.changelabsolutions.
org/publications/CA-local-ssb-taxes.
It is important to note that all local taxes in California must be approved by the electorate at a regularly
scheduled election, and that state law imposes specific timing requirements for proposing a tax. For
example, under state law a tax must be approved for the ballot at least 88 days prior to the election,
and many counties impose additional timing requirements.198 Thus, a tax policy and campaign must be
prepared well in advance of the election. It is also important to reiterate that a tax approved by Alameda
County voters would apply only in the unincorporated areas of the County.
The amount of the tax could be calculated various ways. Most business license taxes are based on gross
receipts, but the tax could also be imposed per ounce or based on another metric. While there is some
evidence that a strong excise tax will increase price and reduce consumption, it is certain that a tax would
raise revenue. If the tax proceeds are earmarked for obesity prevention, oral health, and other public
health initiatives in the city, including many of the policies discussed in this report, it will be a victory for
public health.
While all stakeholders mentioned the importance of earmarking tax proceeds, whether to do so is a
difficult decision under California law. If the proceeds are earmarked, the tax is known as a “special
tax” and requires approval by two-thirds of the voters, whereas a tax that is not earmarked is known as
a “general tax” and requires approval by a majority of voters. While there are some alternative hybrid
approaches available (such as the “Measure A/Measure B” approach discussed in the legal memo linked
above), the question whether to pursue a special or general tax is a threshold decision requiring a balance
of public health effectiveness and political reality. If the County decides to pursue a tax, it can also benefit
from the lessons learned by other communities that have proposed a sugary drink tax in recent years,
both within California and across the nation.

44The Health and Economic Impacts of Obesity in Alameda County changelabsolutions.org I jsi.com
conclusIon
Alameda County has long been a leader in recognizing the need to address the social and environmental
determinants of health through policy. The County can become an even more effective proponent of
healthy living by developing additional prevention-oriented policies and programs that target the health
and economic impacts of obesity and obesity related disease.
This report describes the extent of the obesity epidemic in the county, offers perspectives from a diverse
group of stakeholders, and identifies a number of healthy eating policy options for the County to consider
as it works to further address the obesity epidemic and sugary drink consumption in particular. While the
County has already implemented some policies and programs that promote healthy eating, the County
should leverage and strengthen these efforts to create a wide-reaching strategy to address obesity.
Working closely with the community, local leaders, and other stakeholders, the County can decide which
policies can help achieve its goals and meet the needs of County residents.
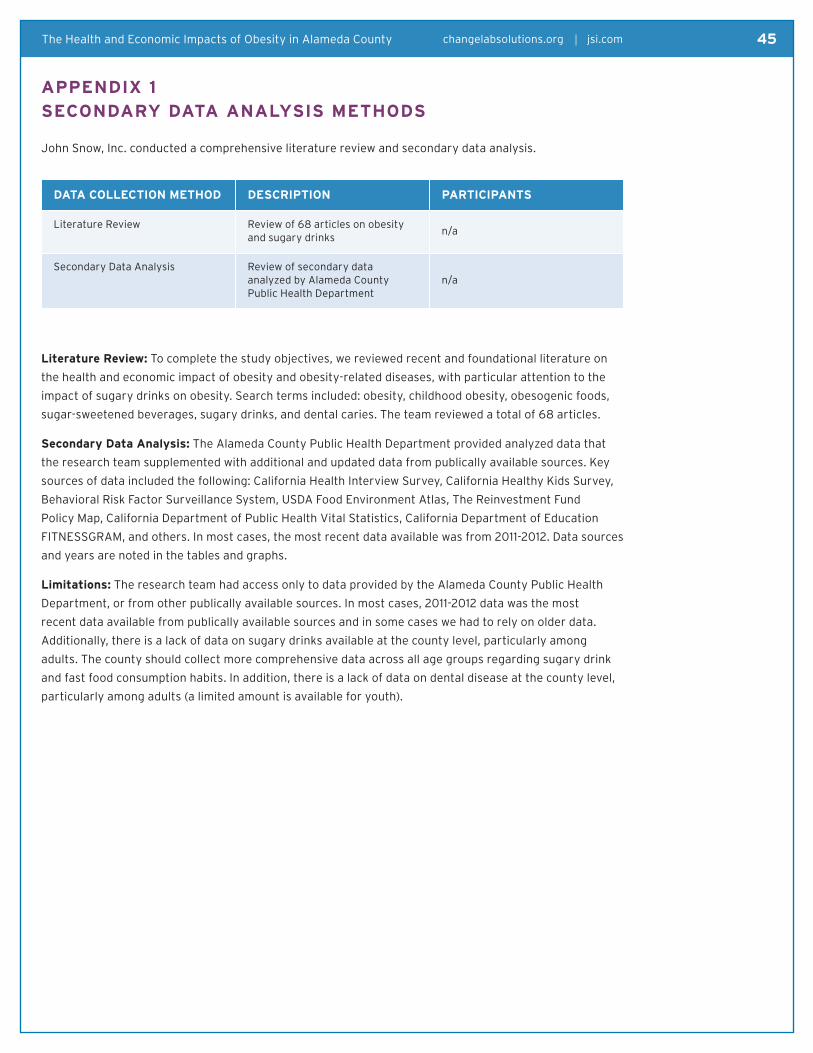
45The Health and Economic Impacts of Obesity in Alameda County changelabsolutions.org I jsi.com
APPendIx 1
secondARy dAtA AnAlysIs metHods
John Snow, Inc. conducted a comprehensive literature review and secondary data analysis.
dAtA collectIon metHod descRIPtIon PARtIcIPAnts
Literature Review Review of 68 articles on obesity and sugary drinks
n/a
Secondary Data Analysis Review of secondary data analyzed by Alameda County Public Health Department
n/a
literature Review: To complete the study objectives, we reviewed recent and foundational literature on
the health and economic impact of obesity and obesity-related diseases, with particular attention to the
impact of sugary drinks on obesity. Search terms included: obesity, childhood obesity, obesogenic foods,
sugar-sweetened beverages, sugary drinks, and dental caries. The team reviewed a total of 68 articles.
secondary data Analysis: The Alameda County Public Health Department provided analyzed data that
the research team supplemented with additional and updated data from publically available sources. Key
sources of data included the following: California Health Interview Survey, California Healthy Kids Survey,
Behavioral Risk Factor Surveillance System, USDA Food Environment Atlas, The Reinvestment Fund
Policy Map, California Department of Public Health Vital Statistics, California Department of Education
FITNESSGRAM, and others. In most cases, the most recent data available was from 2011-2012. Data sources
and years are noted in the tables and graphs.
limitations: The research team had access only to data provided by the Alameda County Public Health
Department, or from other publically available sources. In most cases, 2011-2012 data was the most
recent data available from publically available sources and in some cases we had to rely on older data.
Additionally, there is a lack of data on sugary drinks available at the county level, particularly among
adults. The county should collect more comprehensive data across all age groups regarding sugary drink
and fast food consumption habits. In addition, there is a lack of data on dental disease at the county level,
particularly among adults (a limited amount is available for youth).
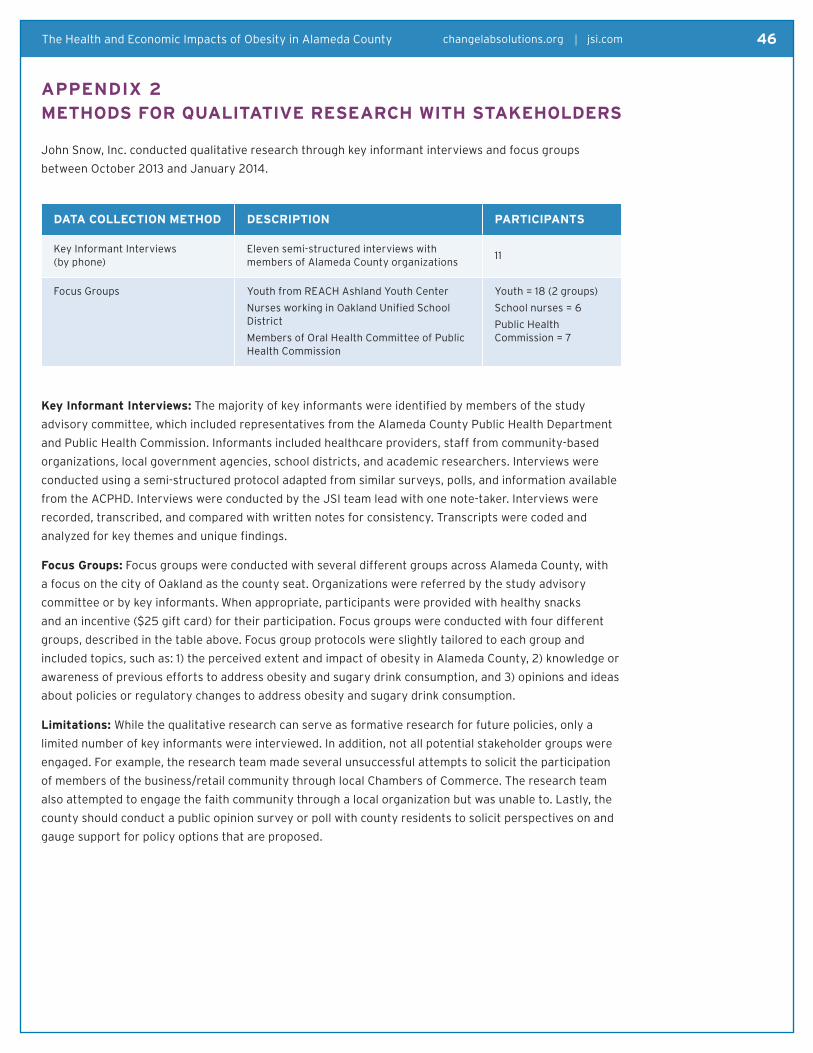
46The Health and Economic Impacts of Obesity in Alameda County changelabsolutions.org I jsi.com
APPendIx 2
metHods foR QuAlItAtIve ReseARcH wItH stAkeHoldeRs
John Snow, Inc. conducted qualitative research through key informant interviews and focus groups
between October 2013 and January 2014.
dAtA collectIon metHod descRIPtIon PARtIcIPAnts
Key Informant Interviews (by phone)
Eleven semi-structured interviews with members of Alameda County organizations
11
Focus Groups Youth from REACH Ashland Youth Center
Nurses working in Oakland Unified School District
Members of Oral Health Committee of Public Health Commission
Youth = 18 (2 groups)
School nurses = 6
Public Health Commission = 7
key Informant Interviews: The majority of key informants were identified by members of the study
advisory committee, which included representatives from the Alameda County Public Health Department
and Public Health Commission. Informants included healthcare providers, staff from community-based
organizations, local government agencies, school districts, and academic researchers. Interviews were
conducted using a semi-structured protocol adapted from similar surveys, polls, and information available
from the ACPHD. Interviews were conducted by the JSI team lead with one note-taker. Interviews were
recorded, transcribed, and compared with written notes for consistency. Transcripts were coded and
analyzed for key themes and unique findings.
focus groups: Focus groups were conducted with several different groups across Alameda County, with
a focus on the city of Oakland as the county seat. Organizations were referred by the study advisory
committee or by key informants. When appropriate, participants were provided with healthy snacks
and an incentive ($25 gift card) for their participation. Focus groups were conducted with four different
groups, described in the table above. Focus group protocols were slightly tailored to each group and
included topics, such as: 1) the perceived extent and impact of obesity in Alameda County, 2) knowledge or
awareness of previous efforts to address obesity and sugary drink consumption, and 3) opinions and ideas
about policies or regulatory changes to address obesity and sugary drink consumption.
limitations: While the qualitative research can serve as formative research for future policies, only a
limited number of key informants were interviewed. In addition, not all potential stakeholder groups were
engaged. For example, the research team made several unsuccessful attempts to solicit the participation
of members of the business/retail community through local Chambers of Commerce. The research team
also attempted to engage the faith community through a local organization but was unable to. Lastly, the
county should conduct a public opinion survey or poll with county residents to solicit perspectives on and
gauge support for policy options that are proposed.

47The Health and Economic Impacts of Obesity in Alameda County changelabsolutions.org I jsi.com
APPendIx 3
key InfoRmAnts InteRvIewed
John Snow, Inc. conducted semi-structured interviews with the following key informants between October
2013 and January 2014.
Wilma Chan
Alameda County Board of Supervisors, District 3
Keith Carson
Alameda County Board of Supervisors, District 5
Alex Briscoe
Director, Alameda County Health Care Services Agency and Commissioner of First 5 Alameda County
Dr. Muntu Davis
Deputy Health Officer and Director of Communicable Disease Control and Prevention and Public
Health Emergency Preparedness, Alameda County Public Health Department
Mark Friedman
CEO of First 5 Alameda County and El Cerrito City Council member
David Kittams, MD FAAP
Kiwi Pediatrics, Berkeley
Susan Fisher-Owens, MD, MPH
Assistant Clinical Professor of Pediatrics, University of California San Francisco
Esperanza Pallana
Council Director, Oakland Food Policy Council
Sabrina Wu
Project Director, HOPE Collaborative
Barbara Parker, RN, PHN
Health Services Coordinator, Oakland Unified School District
Kristine Madsen, MD, MPH
Assistant Professor, Joint Medical Program and Public Health Nutrition, University of California
Berkeley School of Public Health
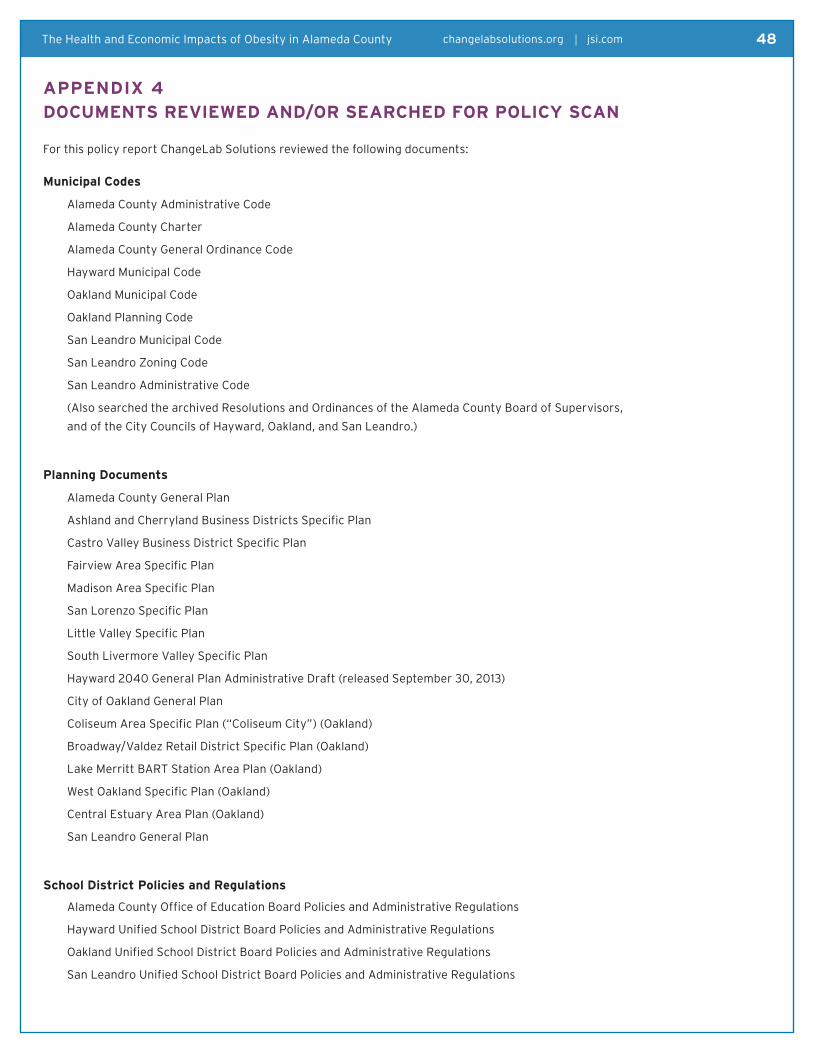
48The Health and Economic Impacts of Obesity in Alameda County changelabsolutions.org I jsi.com
APPendIx 4
documents RevIewed And/oR seARcHed foR PolIcy scAn
For this policy report ChangeLab Solutions reviewed the following documents:
municipal codes
Alameda County Administrative Code
Alameda County Charter
Alameda County General Ordinance Code
Hayward Municipal Code
Oakland Municipal Code
Oakland Planning Code
San Leandro Municipal Code
San Leandro Zoning Code
San Leandro Administrative Code
(Also searched the archived Resolutions and Ordinances of the Alameda County Board of Supervisors,
and of the City Councils of Hayward, Oakland, and San Leandro.)
Planning documents
Alameda County General Plan
Ashland and Cherryland Business Districts Specific Plan
Castro Valley Business District Specific Plan
Fairview Area Specific Plan
Madison Area Specific Plan
San Lorenzo Specific Plan
Little Valley Specific Plan
South Livermore Valley Specific Plan
Hayward 2040 General Plan Administrative Draft (released September 30, 2013)
City of Oakland General Plan
Coliseum Area Specific Plan (“Coliseum City”) (Oakland)
Broadway/Valdez Retail District Specific Plan (Oakland)
Lake Merritt BART Station Area Plan (Oakland)
West Oakland Specific Plan (Oakland)
Central Estuary Area Plan (Oakland)
San Leandro General Plan
school district Policies and Regulations
Alameda County Office of Education Board Policies and Administrative Regulations
Hayward Unified School District Board Policies and Administrative Regulations
Oakland Unified School District Board Policies and Administrative Regulations
San Leandro Unified School District Board Policies and Administrative Regulations
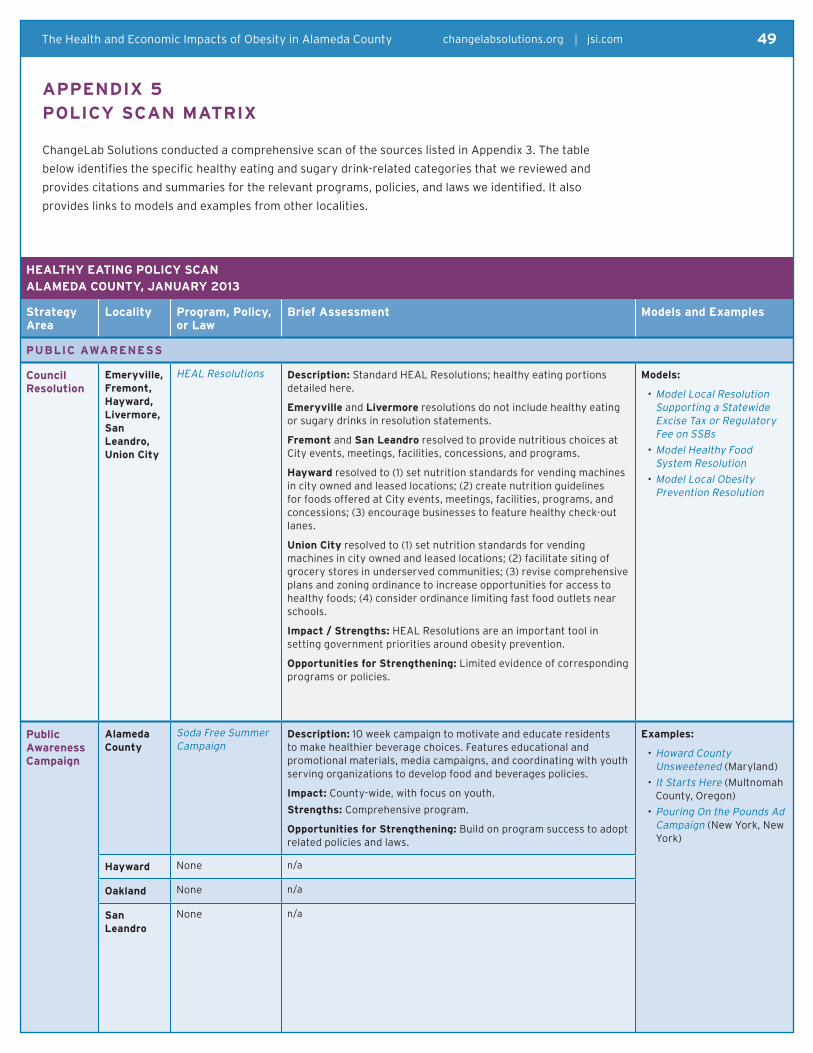
49The Health and Economic Impacts of Obesity in Alameda County changelabsolutions.org I jsi.com
APPendIx 5
PolIcy scAn mAtRIx
ChangeLab Solutions conducted a comprehensive scan of the sources listed in Appendix 3. The table
below identifies the specific healthy eating and sugary drink-related categories that we reviewed and
provides citations and summaries for the relevant programs, policies, and laws we identified. It also
provides links to models and examples from other localities.
HeAltHy eAtIng PolIcy scAn
AlAmedA county, jAnuARy 2013
strategy Area
locality Program, Policy, or law
brief Assessment models and examples
PublIc AwAReness
council Resolution
emeryville, fremont, Hayward, livermore, san leandro, union city
HEAL Resolutions description: Standard HEAL Resolutions; healthy eating portions detailed here.
emeryville and livermore resolutions do not include healthy eating or sugary drinks in resolution statements.
fremont and san leandro resolved to provide nutritious choices at City events, meetings, facilities, concessions, and programs.
Hayward resolved to (1) set nutrition standards for vending machines in city owned and leased locations; (2) create nutrition guidelines for foods offered at City events, meetings, facilities, programs, and concessions; (3) encourage businesses to feature healthy check-out lanes.
union city resolved to (1) set nutrition standards for vending machines in city owned and leased locations; (2) facilitate siting of grocery stores in underserved communities; (3) revise comprehensive plans and zoning ordinance to increase opportunities for access to healthy foods; (4) consider ordinance limiting fast food outlets near schools.
Impact / strengths: HEAL Resolutions are an important tool in setting government priorities around obesity prevention.
opportunities for strengthening: Limited evidence of corresponding programs or policies.
models:
•Model Local Resolution Supporting a Statewide Excise Tax or Regulatory Fee on SSBs
•Model Healthy Food System Resolution
•Model Local Obesity Prevention Resolution
Public Awareness campaign
Alameda county
Soda Free Summer Campaign
description: 10 week campaign to motivate and educate residents to make healthier beverage choices. Features educational and promotional materials, media campaigns, and coordinating with youth serving organizations to develop food and beverages policies.
Impact: County-wide, with focus on youth.
strengths: Comprehensive program.
opportunities for strengthening: Build on program success to adopt related policies and laws.
examples:
•Howard County Unsweetened (Maryland)
• It Starts Here (Multnomah County, Oregon)
•Pouring On the Pounds Ad Campaign (New York, New York)
Hayward None n/a
oakland None n/a
san leandro
None n/a
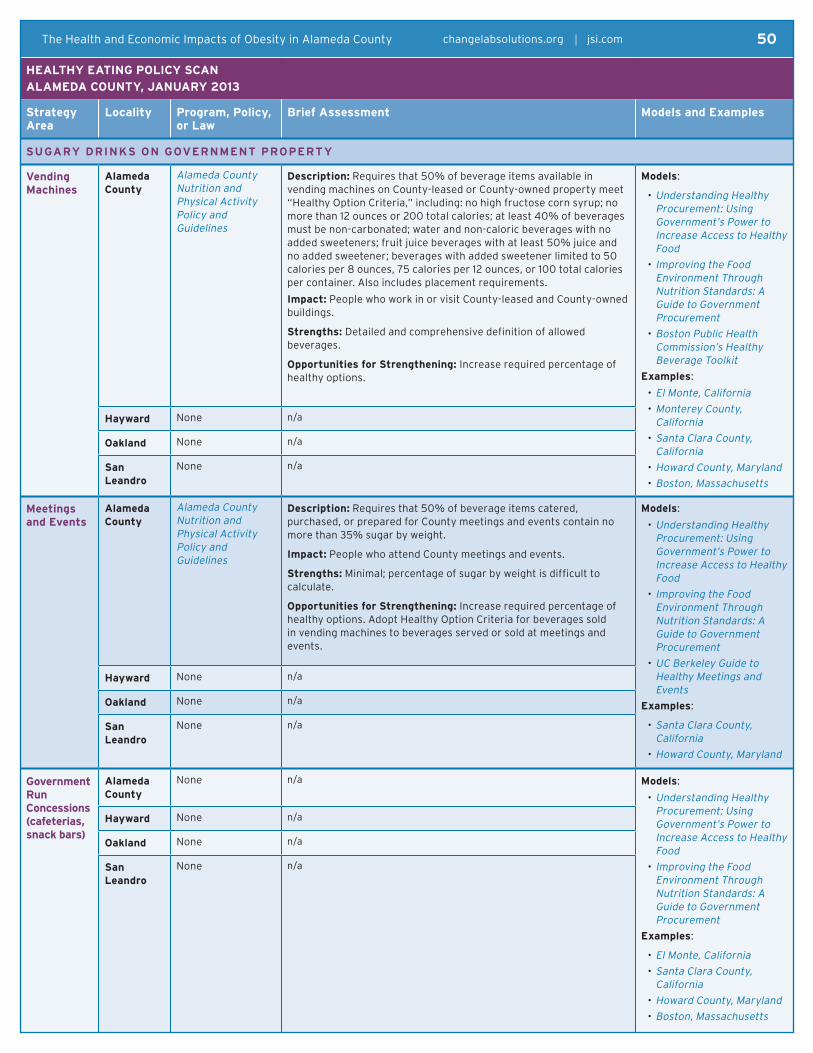
50The Health and Economic Impacts of Obesity in Alameda County changelabsolutions.org I jsi.com
HeAltHy eAtIng PolIcy scAn
AlAmedA county, jAnuARy 2013
strategy Area
locality Program, Policy, or law
brief Assessment models and examples
sugARy dRInks on goveRnment PRoPeRty
vending machines
Alameda county
Alameda County Nutrition and Physical Activity Policy and Guidelines
description: Requires that 50% of beverage items available in vending machines on County-leased or County-owned property meet “Healthy Option Criteria,” including: no high fructose corn syrup; no more than 12 ounces or 200 total calories; at least 40% of beverages must be non-carbonated; water and non-caloric beverages with no added sweeteners; fruit juice beverages with at least 50% juice and no added sweetener; beverages with added sweetener limited to 50 calories per 8 ounces, 75 calories per 12 ounces, or 100 total calories per container. Also includes placement requirements.
Impact: People who work in or visit County-leased and County-owned buildings.
strengths: Detailed and comprehensive definition of allowed beverages.
opportunities for strengthening: Increase required percentage of healthy options.
models:
•Understanding Healthy Procurement: Using Government’s Power to Increase Access to Healthy Food
• Improving the Food Environment Through Nutrition Standards: A Guide to Government Procurement
•Boston Public Health Commission’s Healthy Beverage Toolkit
examples:
•El Monte, California
•Monterey County, California
•Santa Clara County, California
•Howard County, Maryland
•Boston, Massachusetts
Hayward None n/a
oakland None n/a
san leandro
None n/a
meetings and events
Alameda county
Alameda County Nutrition and Physical Activity Policy and Guidelines
description: Requires that 50% of beverage items catered, purchased, or prepared for County meetings and events contain no more than 35% sugar by weight.
Impact: People who attend County meetings and events.
strengths: Minimal; percentage of sugar by weight is difficult to calculate.
opportunities for strengthening: Increase required percentage of healthy options. Adopt Healthy Option Criteria for beverages sold in vending machines to beverages served or sold at meetings and events.
models:
•Understanding Healthy Procurement: Using Government’s Power to Increase Access to Healthy Food
• Improving the Food Environment Through Nutrition Standards: A Guide to Government Procurement
•UC Berkeley Guide to Healthy Meetings and Events
examples:
•Santa Clara County, California
•Howard County, Maryland
Hayward None n/a
oakland None n/a
san leandro
None n/a
government Run concessions (cafeterias, snack bars)
Alameda county
None n/a models:
•Understanding Healthy Procurement: Using Government’s Power to Increase Access to Healthy Food
• Improving the Food Environment Through Nutrition Standards: A Guide to Government Procurement
examples:
•El Monte, California
•Santa Clara County, California
•Howard County, Maryland
•Boston, Massachusetts
Hayward None n/a
oakland None n/a
san leandro
None n/a

51The Health and Economic Impacts of Obesity in Alameda County changelabsolutions.org I jsi.com
HeAltHy eAtIng PolIcy scAn
AlAmedA county, jAnuARy 2013
strategy Area
locality Program, Policy, or law
brief Assessment models and examples
youth Programs (child care, after school, summer camp)
Alameda county
None n/a models:
•Understanding Healthy Procurement: Using Government’s Power to Increase Access to Healthy Food
• Improving the Food Environment Through Nutrition Standards: A Guide to Government Procurement
examples:
•El Monte, California
Hayward None n/a
oakland None n/a
san leandro
None n/a
worksite wellness
Alameda county
Alameda County Nutrition and Physical Activity Policy and Guidelines
description: Employee Guidelines portion encourages employees to bring healthful foods to work including water and 100% juice, and to show appreciation and celebrate with non-food items.
Impact: County employees.
strengths: Good statement of aspirations for employee wellness. Very strong given corresponding portions of policy on vending machines and meetings and events.
opportunities for strengthening: See above regarding strengthening policy on vending machines and meetings and events.
models:
•California Fit Business Kit!
examples:
•San Mateo County, California
Hayward None n/a
oakland None n/a
san leandro
None n/a
Public facilities (hospital, jails, etc.)
Alameda county
None n/a models:
•Understanding Healthy Procurement: Using Government’s Power to Increase Access to Healthy Food
• Improving the Food Environment Through Nutrition Standards: A Guide to Government Procurement
examples:
•Santa Clara County, California
Hayward None n/a
oakland None n/a
san leandro
None n/a
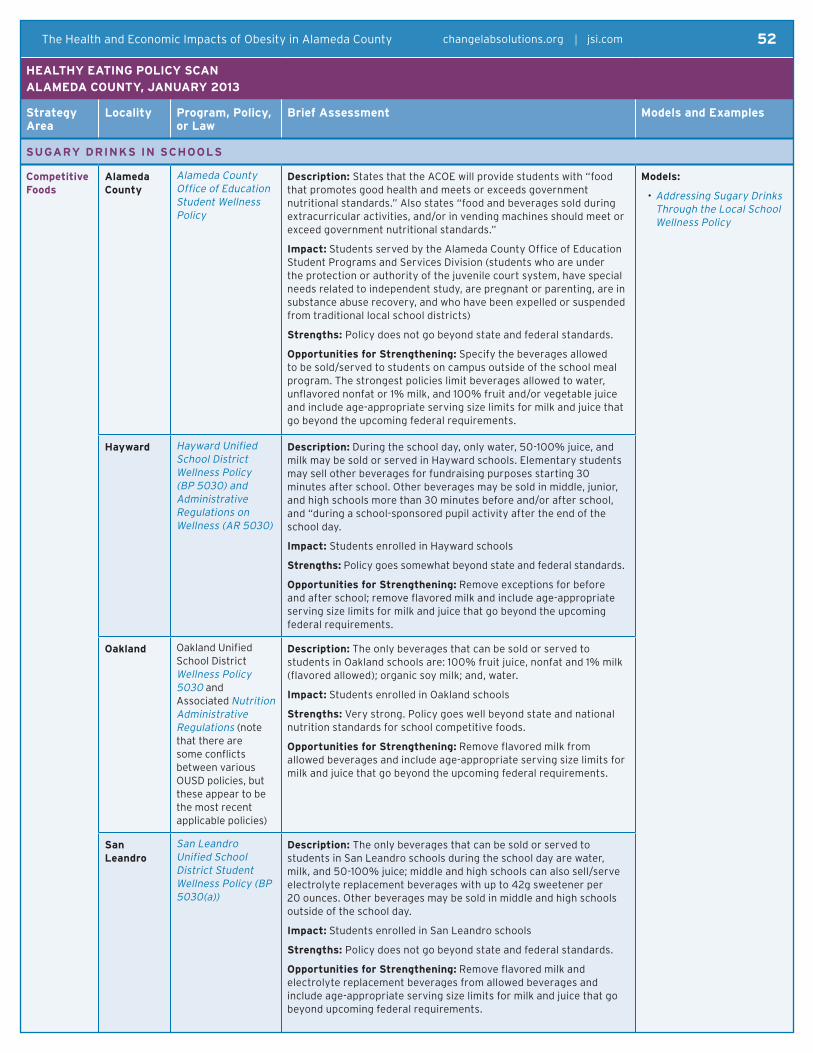
52The Health and Economic Impacts of Obesity in Alameda County changelabsolutions.org I jsi.com
HeAltHy eAtIng PolIcy scAn
AlAmedA county, jAnuARy 2013
strategy Area
locality Program, Policy, or law
brief Assessment models and examples
sugARy dRInks In scHools
competitive foods
Alameda county
Alameda County Office of Education Student Wellness Policy
description: States that the ACOE will provide students with “food that promotes good health and meets or exceeds government nutritional standards.” Also states “food and beverages sold during extracurricular activities, and/or in vending machines should meet or exceed government nutritional standards.”
Impact: Students served by the Alameda County Office of Education Student Programs and Services Division (students who are under the protection or authority of the juvenile court system, have special needs related to independent study, are pregnant or parenting, are in substance abuse recovery, and who have been expelled or suspended from traditional local school districts)
strengths: Policy does not go beyond state and federal standards.
opportunities for strengthening: Specify the beverages allowed to be sold/served to students on campus outside of the school meal program. The strongest policies limit beverages allowed to water, unflavored nonfat or 1% milk, and 100% fruit and/or vegetable juice and include age-appropriate serving size limits for milk and juice that go beyond the upcoming federal requirements.
models:
•Addressing Sugary Drinks Through the Local School Wellness Policy
Hayward Hayward Unified School District Wellness Policy (BP 5030) and Administrative Regulations on Wellness (AR 5030)
description: During the school day, only water, 50-100% juice, and milk may be sold or served in Hayward schools. Elementary students may sell other beverages for fundraising purposes starting 30 minutes after school. Other beverages may be sold in middle, junior, and high schools more than 30 minutes before and/or after school, and “during a school-sponsored pupil activity after the end of the school day.
Impact: Students enrolled in Hayward schools
strengths: Policy goes somewhat beyond state and federal standards.
opportunities for strengthening: Remove exceptions for before and after school; remove flavored milk and include age-appropriate serving size limits for milk and juice that go beyond the upcoming federal requirements.
oakland Oakland Unified School District Wellness Policy 5030 and Associated Nutrition Administrative Regulations (note that there are some conflicts between various OUSD policies, but these appear to be the most recent applicable policies)
description: The only beverages that can be sold or served to students in Oakland schools are: 100% fruit juice, nonfat and 1% milk (flavored allowed); organic soy milk; and, water.
Impact: Students enrolled in Oakland schools
strengths: Very strong. Policy goes well beyond state and national nutrition standards for school competitive foods.
opportunities for strengthening: Remove flavored milk from allowed beverages and include age-appropriate serving size limits for milk and juice that go beyond the upcoming federal requirements.
san leandro
San Leandro Unified School District Student Wellness Policy (BP 5030(a))
description: The only beverages that can be sold or served to students in San Leandro schools during the school day are water, milk, and 50-100% juice; middle and high schools can also sell/serve electrolyte replacement beverages with up to 42g sweetener per 20 ounces. Other beverages may be sold in middle and high schools outside of the school day.
Impact: Students enrolled in San Leandro schools
strengths: Policy does not go beyond state and federal standards.
opportunities for strengthening: Remove flavored milk and electrolyte replacement beverages from allowed beverages and include age-appropriate serving size limits for milk and juice that go beyond upcoming federal requirements.

53The Health and Economic Impacts of Obesity in Alameda County changelabsolutions.org I jsi.com
HeAltHy eAtIng PolIcy scAn
AlAmedA county, jAnuARy 2013
strategy Area
locality Program, Policy, or law
brief Assessment models and examples
vending machines
Alameda county
Alameda County Office of Education Student Wellness Policy
description: States that “food and beverages... sold in vending machines should meet or exceed governmental nutrition standards.”
Impact: Students served by the Alameda County Office of Education Student Programs and Services Division
strengths: Policy does not go beyond state and federal standards.
opportunities for strengthening: Limit beverages allowed to be sold on campus at all venues, including vending machines, to water, unflavored nonfat or 1% milk, and 100% fruit and/or vegetable juice and include age-appropriate serving size limits for milk and juice.
models:
•District Policy Establishing a Healthy Vending Program
Hayward None n/a
oakland Oakland Unified School District Wellness Policy 5030 and Associated Nutrition Administrative Regulations (note that there are some conflicts between various OUSD policies, but these appear to be the most recent applicable policies)
description: The only beverages that can be sold or served to students in the Oakland Unified School District, including in vending machines, are: 100% fruit juice, nonfat and 1% milk (flavored allowed); organic soy milk; and, water.
OUSD’s Wellness Policy Nutrition Administrative Regulations detail the district’s vending machine rules. The District maintains authority over the vending program, including negotiating and entering into vending contracts, selecting products to be sold, and setting hours of vending machine operation. However, individual school principals can decide whether to have a vending machine installed at the school site.
Impact: Students enrolled in Oakland schools
strengths: Very strong; Policy goes well beyond state and national nutrition standards for school competitive foods.
opportunities for strengthening: Remove flavored milk from allowed beverages for all campus venues, including vending machines, and include age-appropriate serving size limits for milk and juice that go beyond the upcoming federal requirements.
san leandro
San Leandro Unified School District Student Wellness Policy (BP 5030(a))
description: The only beverages that can sold or served to students in San Leandro schools during the school day, including in vending machines, are: water, milk, 50-100% juice. Other beverages may be sold in vending machines in middle and high schools outside of the school day.
Impact: Students enrolled in San Leandro schools
strengths: Policy does not go beyond state and federal standards.
opportunities for strengthening: Remove flavored milk and electrolyte replacement beverages from allowed beverages for all campus venues, including vending machines, and include age-appropriate serving size limits for milk and juice that go beyond upcoming federal requirements.
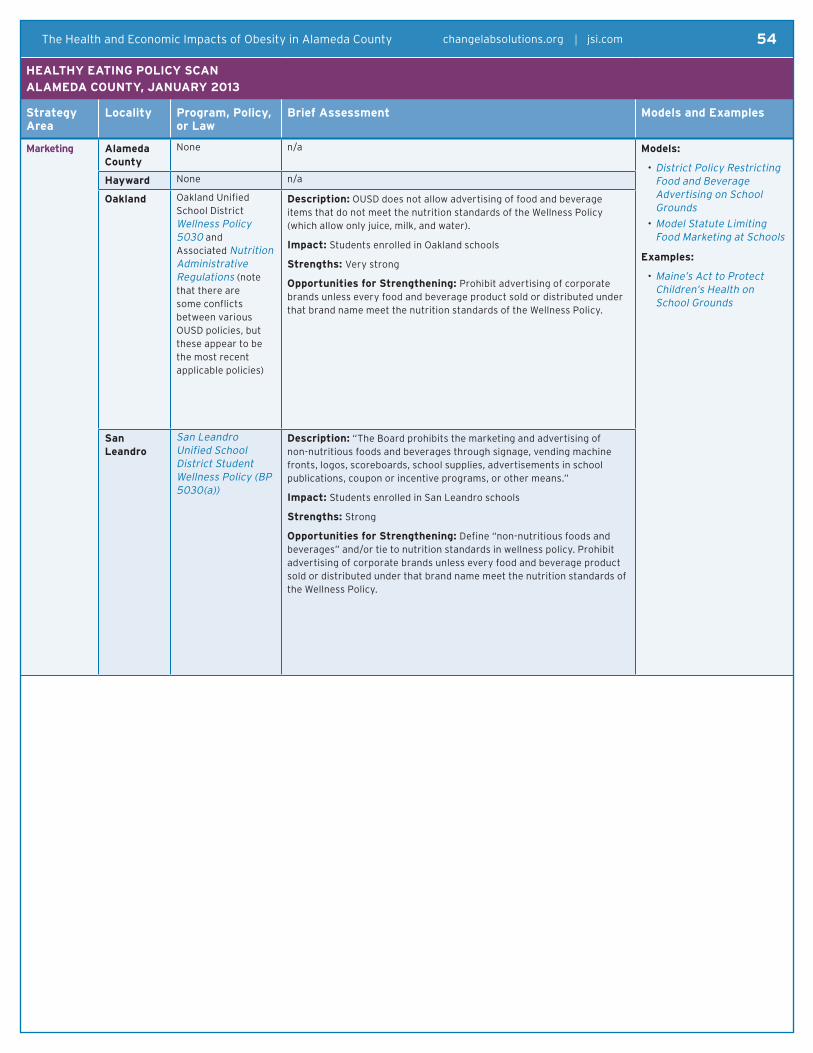
54The Health and Economic Impacts of Obesity in Alameda County changelabsolutions.org I jsi.com
HeAltHy eAtIng PolIcy scAn
AlAmedA county, jAnuARy 2013
strategy Area
locality Program, Policy, or law
brief Assessment models and examples
marketing Alameda county
None n/a models:
•District Policy Restricting Food and Beverage Advertising on School Grounds
•Model Statute Limiting Food Marketing at Schools
examples:
•Maine’s Act to Protect Children’s Health on School Grounds
Hayward None n/a
oakland Oakland Unified School District Wellness Policy 5030 and Associated Nutrition Administrative Regulations (note that there are some conflicts between various OUSD policies, but these appear to be the most recent applicable policies)
description: OUSD does not allow advertising of food and beverage items that do not meet the nutrition standards of the Wellness Policy (which allow only juice, milk, and water).
Impact: Students enrolled in Oakland schools
strengths: Very strong
opportunities for strengthening: Prohibit advertising of corporate brands unless every food and beverage product sold or distributed under that brand name meet the nutrition standards of the Wellness Policy.
san leandro
San Leandro Unified School District Student Wellness Policy (BP 5030(a))
description: “The Board prohibits the marketing and advertising of non-nutritious foods and beverages through signage, vending machine fronts, logos, scoreboards, school supplies, advertisements in school publications, coupon or incentive programs, or other means.”
Impact: Students enrolled in San Leandro schools
strengths: Strong
opportunities for strengthening: Define “non-nutritious foods and beverages” and/or tie to nutrition standards in wellness policy. Prohibit advertising of corporate brands unless every food and beverage product sold or distributed under that brand name meet the nutrition standards of the Wellness Policy.
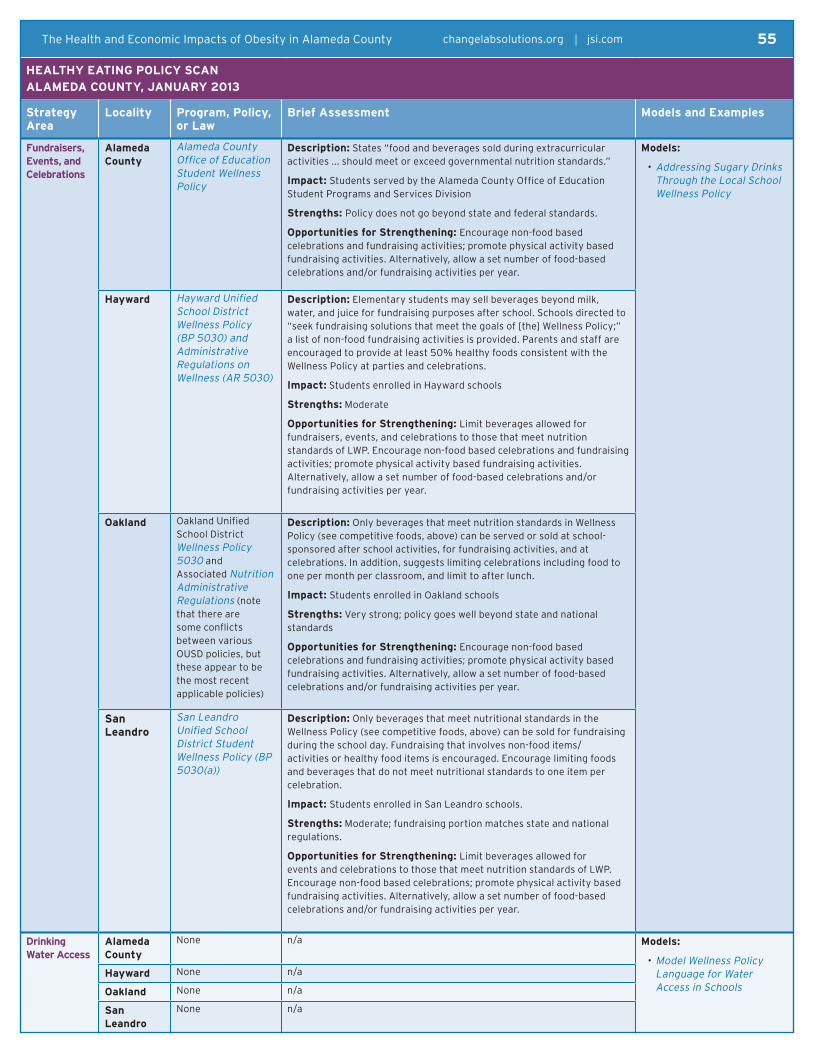
55The Health and Economic Impacts of Obesity in Alameda County changelabsolutions.org I jsi.com
HeAltHy eAtIng PolIcy scAn
AlAmedA county, jAnuARy 2013
strategy Area
locality Program, Policy, or law
brief Assessment models and examples
fundraisers, events, and celebrations
Alameda county
Alameda County Office of Education Student Wellness Policy
description: States “food and beverages sold during extracurricular activities ... should meet or exceed governmental nutrition standards.”
Impact: Students served by the Alameda County Office of Education Student Programs and Services Division
strengths: Policy does not go beyond state and federal standards.
opportunities for strengthening: Encourage non-food based celebrations and fundraising activities; promote physical activity based fundraising activities. Alternatively, allow a set number of food-based celebrations and/or fundraising activities per year.
models:
•Addressing Sugary Drinks Through the Local School Wellness Policy
Hayward Hayward Unified School District Wellness Policy (BP 5030) and Administrative Regulations on Wellness (AR 5030)
description: Elementary students may sell beverages beyond milk, water, and juice for fundraising purposes after school. Schools directed to “seek fundraising solutions that meet the goals of [the] Wellness Policy;” a list of non-food fundraising activities is provided. Parents and staff are encouraged to provide at least 50% healthy foods consistent with the Wellness Policy at parties and celebrations.
Impact: Students enrolled in Hayward schools
strengths: Moderate
opportunities for strengthening: Limit beverages allowed for fundraisers, events, and celebrations to those that meet nutrition standards of LWP. Encourage non-food based celebrations and fundraising activities; promote physical activity based fundraising activities. Alternatively, allow a set number of food-based celebrations and/or fundraising activities per year.
oakland Oakland Unified School District Wellness Policy 5030 and Associated Nutrition Administrative Regulations (note that there are some conflicts between various OUSD policies, but these appear to be the most recent applicable policies)
description: Only beverages that meet nutrition standards in Wellness Policy (see competitive foods, above) can be served or sold at school-sponsored after school activities, for fundraising activities, and at celebrations. In addition, suggests limiting celebrations including food to one per month per classroom, and limit to after lunch.
Impact: Students enrolled in Oakland schools
strengths: Very strong; policy goes well beyond state and national standards
opportunities for strengthening: Encourage non-food based celebrations and fundraising activities; promote physical activity based fundraising activities. Alternatively, allow a set number of food-based celebrations and/or fundraising activities per year.
san leandro
San Leandro Unified School District Student Wellness Policy (BP 5030(a))
description: Only beverages that meet nutritional standards in the Wellness Policy (see competitive foods, above) can be sold for fundraising during the school day. Fundraising that involves non-food items/activities or healthy food items is encouraged. Encourage limiting foods and beverages that do not meet nutritional standards to one item per celebration.
Impact: Students enrolled in San Leandro schools.
strengths: Moderate; fundraising portion matches state and national regulations.
opportunities for strengthening: Limit beverages allowed for events and celebrations to those that meet nutrition standards of LWP. Encourage non-food based celebrations; promote physical activity based fundraising activities. Alternatively, allow a set number of food-based celebrations and/or fundraising activities per year.
drinking water Access
Alameda county
None n/a models:
•Model Wellness Policy Language for Water Access in Schools
Hayward None n/a
oakland None n/a
san leandro
None n/a
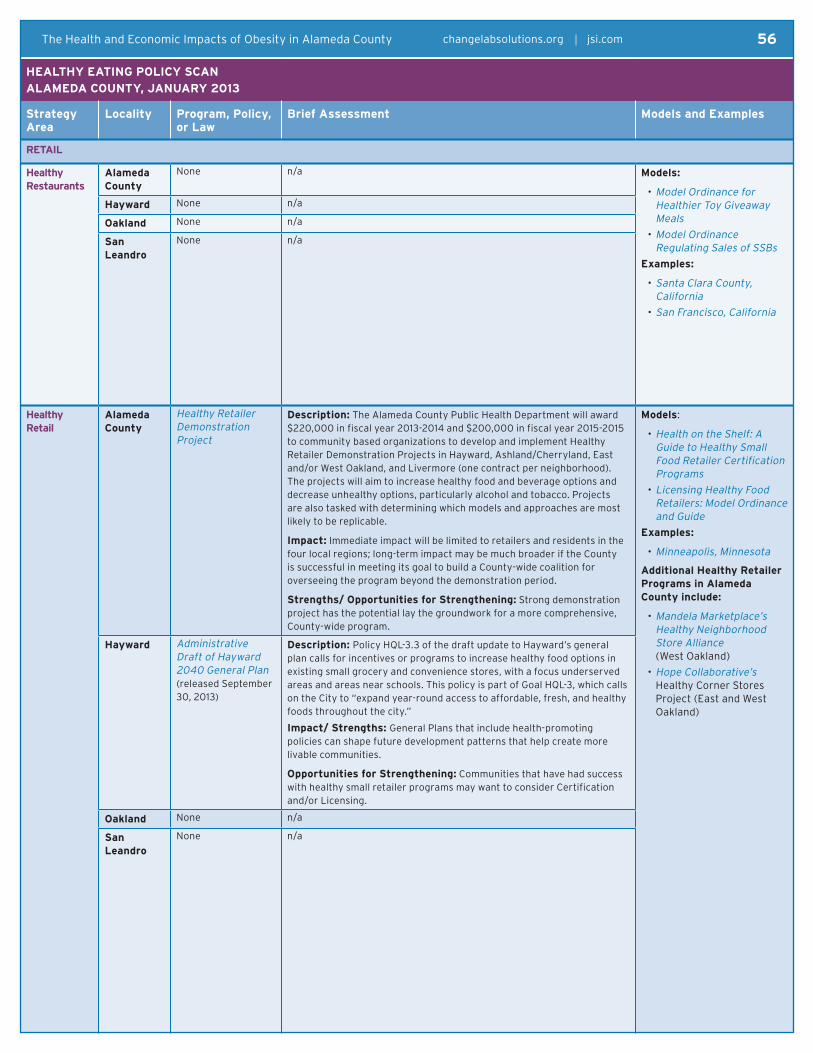
56The Health and Economic Impacts of Obesity in Alameda County changelabsolutions.org I jsi.com
HeAltHy eAtIng PolIcy scAn
AlAmedA county, jAnuARy 2013
strategy Area
locality Program, Policy, or law
brief Assessment models and examples
RetAIl
Healthy Restaurants
Alameda county
None n/a models:
•Model Ordinance for Healthier Toy Giveaway Meals
•Model Ordinance Regulating Sales of SSBs
examples:
•Santa Clara County, California
•San Francisco, California
Hayward None n/a
oakland None n/a
san leandro
None n/a
Healthy Retail
Alameda county
Healthy Retailer Demonstration Project
description: The Alameda County Public Health Department will award $220,000 in fiscal year 2013-2014 and $200,000 in fiscal year 2015-2015 to community based organizations to develop and implement Healthy Retailer Demonstration Projects in Hayward, Ashland/Cherryland, East and/or West Oakland, and Livermore (one contract per neighborhood). The projects will aim to increase healthy food and beverage options and decrease unhealthy options, particularly alcohol and tobacco. Projects are also tasked with determining which models and approaches are most likely to be replicable.
Impact: Immediate impact will be limited to retailers and residents in the four local regions; long-term impact may be much broader if the County is successful in meeting its goal to build a County-wide coalition for overseeing the program beyond the demonstration period.
strengths/ opportunities for strengthening: Strong demonstration project has the potential lay the groundwork for a more comprehensive, County-wide program.
models:
•Health on the Shelf: A Guide to Healthy Small Food Retailer Certification Programs
•Licensing Healthy Food Retailers: Model Ordinance and Guide
examples:
•Minneapolis, Minnesota
Additional Healthy Retailer Programs in Alameda county include:
•Mandela Marketplace’s Healthy Neighborhood Store Alliance (West Oakland)
•Hope Collaborative’s Healthy Corner Stores Project (East and West Oakland)
Hayward Administrative Draft of Hayward 2040 General Plan (released September 30, 2013)
description: Policy HQL-3.3 of the draft update to Hayward’s general plan calls for incentives or programs to increase healthy food options in existing small grocery and convenience stores, with a focus underserved areas and areas near schools. This policy is part of Goal HQL-3, which calls on the City to “expand year-round access to affordable, fresh, and healthy foods throughout the city.”
Impact/ strengths: General Plans that include health-promoting policies can shape future development patterns that help create more livable communities.
opportunities for strengthening: Communities that have had success with healthy small retailer programs may want to consider Certification and/or Licensing.
oakland None n/a
san leandro
None n/a
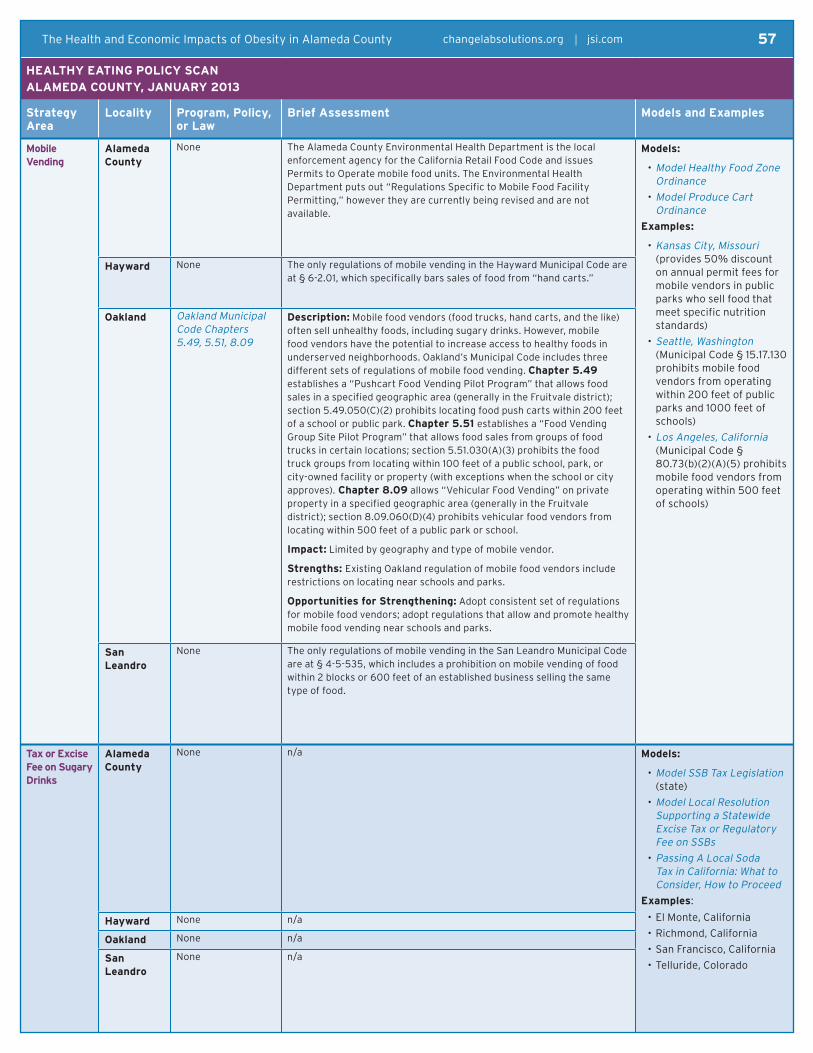
57The Health and Economic Impacts of Obesity in Alameda County changelabsolutions.org I jsi.com
HeAltHy eAtIng PolIcy scAn
AlAmedA county, jAnuARy 2013
strategy Area
locality Program, Policy, or law
brief Assessment models and examples
mobile vending
Alameda county
None The Alameda County Environmental Health Department is the local enforcement agency for the California Retail Food Code and issues Permits to Operate mobile food units. The Environmental Health Department puts out “Regulations Specific to Mobile Food Facility Permitting,” however they are currently being revised and are not available.
models:
•Model Healthy Food Zone Ordinance
•Model Produce Cart Ordinance
examples:
•Kansas City, Missouri (provides 50% discount on annual permit fees for mobile vendors in public parks who sell food that meet specific nutrition standards)
•Seattle, Washington (Municipal Code § 15.17.130 prohibits mobile food vendors from operating within 200 feet of public parks and 1000 feet of schools)
•Los Angeles, California (Municipal Code § 80.73(b)(2)(A)(5) prohibits mobile food vendors from operating within 500 feet of schools)
Hayward None The only regulations of mobile vending in the Hayward Municipal Code are at § 6-2.01, which specifically bars sales of food from “hand carts.”
oakland Oakland Municipal Code Chapters 5.49, 5.51, 8.09
description: Mobile food vendors (food trucks, hand carts, and the like) often sell unhealthy foods, including sugary drinks. However, mobile food vendors have the potential to increase access to healthy foods in underserved neighborhoods. Oakland’s Municipal Code includes three different sets of regulations of mobile food vending. chapter 5.49 establishes a “Pushcart Food Vending Pilot Program” that allows food sales in a specified geographic area (generally in the Fruitvale district); section 5.49.050(C)(2) prohibits locating food push carts within 200 feet of a school or public park. chapter 5.51 establishes a “Food Vending Group Site Pilot Program” that allows food sales from groups of food trucks in certain locations; section 5.51.030(A)(3) prohibits the food truck groups from locating within 100 feet of a public school, park, or city-owned facility or property (with exceptions when the school or city approves). chapter 8.09 allows “Vehicular Food Vending” on private property in a specified geographic area (generally in the Fruitvale district); section 8.09.060(D)(4) prohibits vehicular food vendors from locating within 500 feet of a public park or school.
Impact: Limited by geography and type of mobile vendor.
strengths: Existing Oakland regulation of mobile food vendors include restrictions on locating near schools and parks.
opportunities for strengthening: Adopt consistent set of regulations for mobile food vendors; adopt regulations that allow and promote healthy mobile food vending near schools and parks.
san leandro
None The only regulations of mobile vending in the San Leandro Municipal Code are at § 4-5-535, which includes a prohibition on mobile vending of food within 2 blocks or 600 feet of an established business selling the same type of food.
tax or excise fee on sugary drinks
Alameda county
None n/a models:
•Model SSB Tax Legislation (state)
•Model Local Resolution Supporting a Statewide Excise Tax or Regulatory Fee on SSBs
•Passing A Local Soda Tax in California: What to Consider, How to Proceed
examples:
•El Monte, California
•Richmond, California
•San Francisco, California
•Telluride, Colorado
Hayward None n/a
oakland None n/a
san leandro
None n/a
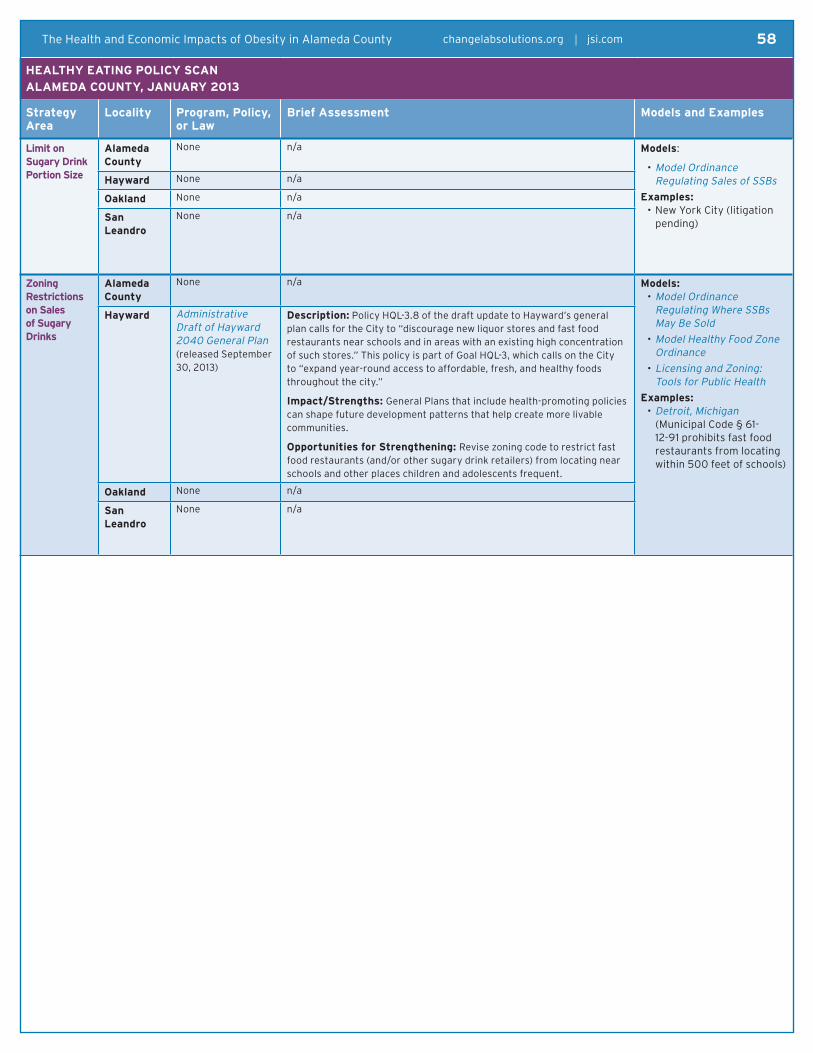
58The Health and Economic Impacts of Obesity in Alameda County changelabsolutions.org I jsi.com
HeAltHy eAtIng PolIcy scAn
AlAmedA county, jAnuARy 2013
strategy Area
locality Program, Policy, or law
brief Assessment models and examples
limit on sugary drink Portion size
Alameda county
None n/a models:
•Model Ordinance Regulating Sales of SSBs
examples: •New York City (litigation
pending)
Hayward None n/a
oakland None n/a
san leandro
None n/a
zoning Restrictions on sales of sugary drinks
Alameda county
None n/a models:•Model Ordinance
Regulating Where SSBs May Be Sold
•Model Healthy Food Zone Ordinance
•Licensing and Zoning: Tools for Public Health
examples:•Detroit, Michigan
(Municipal Code § 61-12-91 prohibits fast food restaurants from locating within 500 feet of schools)
Hayward Administrative Draft of Hayward 2040 General Plan (released September 30, 2013)
description: Policy HQL-3.8 of the draft update to Hayward’s general plan calls for the City to “discourage new liquor stores and fast food restaurants near schools and in areas with an existing high concentration of such stores.” This policy is part of Goal HQL-3, which calls on the City to “expand year-round access to affordable, fresh, and healthy foods throughout the city.”
Impact/strengths: General Plans that include health-promoting policies can shape future development patterns that help create more livable communities.
opportunities for strengthening: Revise zoning code to restrict fast food restaurants (and/or other sugary drink retailers) from locating near schools and other places children and adolescents frequent.
oakland None n/a
san leandro
None n/a
59The Health and Economic Impacts of Obesity in Alameda County changelabsolutions.org I jsi.com
endnotes1 California Health Interview Survey. CHIS 2011-2012 Public Use Files. Los Angeles, CA: UCLA Center for Health Policy
Research. (Hereinafter, “CHIS 2011-2012.”) Available at: http://ask.chis.ucla.edu/ 2 Babey SH, Wolstein J, Diamant AL, et al. A Patchwork of Progress: Changes in Overweight and Obesity among California
5th, 7th, and 9th graders, 2005-2010. 2011. Los Angeles, CA: UCLA Center for Health Policy Research, November 2011. (Hereinafter, “A Patchwork of Progress.”) Available at: www.publichealthadvocacy.org/research/patchworkdocs/OFT percent20brief_final.pdf
3 Alameda County Public Health Department. Data from the Community Assessment, Planning, Education, and Evaluation (CAPE) Unit. June 2013. (Hereinafter, “CAPE Data, June 2013.”)
4 Kidsdata.org. “Hospital Discharges, by Primary Diagnosis, Alameda County, 2008-2012.” Last visited March 7, 2014. http://kidsdata.org/topic/290/hospitaldischarges-diagnosis/table#fmt=237&loc=127&tf=16,37,46,64,67&ch=573,717,574,575,576,577,578,579,580,581,582
5 Cawley J and Meyerhoefer C. “The Medical Care Costs of Obesity: an Instrumental Variables Approach.” Journal of Health Economics 31(1): 219-230, 2012, p.18-19. Available at: www.nber.org/papers/w16467
6 Chenoweth & Associates, Inc. The Economic Costs of Overweight, Obesity, and Physical Inactivity among California Adults – 2006. New Bern, NC: July 2009, p.4-5. Available at: www.publichealthadvocacy.org/PDFs/Costofobesity_BRIEF.pdf
7 County of Alameda. County of Alameda Final Budget 2013-2014. Available at: www.acgov.org/government/documents/budgets/2013-14FinalBudgetCitizensGuide.pdf.
8 Schneider JE, Decker CS, Weintraub JM, et al. The Public Burden of Liquid Candy: The Costs of Sugared Beverages to San Francisco. August 2009, p. 7. Available at: www.sfphes.org/component/jdownloads/finish/5-food/4-the-public-burden-of-liquid-candy-the-costs-of-sugared-beverages-to-san-francisco/0?Itemid=62
9 Harrington S. “The Role of Sugar-Sweetened Beverage Consumption in Adolescent Obesity: a Review of the Literature.” The Journal of School Nursing 24(1): 3-12, 2008. Available at: www.ncbi.nlm.nih.gov/pubmed/18220450
10 Marshall TA, Eichenberger-Gilmore JM, Broffitt B, et al. “Dental Caries and Childhood Obesity: Roles of Diet and Socioeconomic Status.” Community Dentistry and Oral Epidemiology 35(6): 449-458, 2007.
11 California Health Interview Survey. CHIS 2003, 2005, 2007, 2009, & 2011-12 Public Use Files. Los Angeles, CA: UCLA Center for Health Policy Research. Available at: http://ask.chis.ucla.edu [Data analyzed by Alameda County Public Health Department, CAPE Unit]
12 Alameda County Department of Public Health, Office of Dental Health. More Than a Toothache: Untreated Dental Disease in Our School Children. 2006, p.6. Available at: www.acphd.org/media/53546/toothache.pdf
13 California Center for Health Advocacy. Searching for Healthy Food: The Food Landscape in California Cities and Counties. January 2007. (Hereinafter, “Searching for Healthy Food.”) Available at www.publichealthadvocacy.org/searchingforhealthyfood.html
14 The Reinvestment Fund. The Reinvestment Fund Policy Map, 2010. Accessed January 24, 2014. www.policymap.com15 Ogden CL, et al. “Prevalence of Childhood and Adult Obesity in the United States, 2011-2012.” Journal of the American
Medical Association, 311(8):806-814, 2014. (Note that the CDC defines weight categories by Body Mass Index: BMI less that 18.49 is underweight, 18.5-24.99 is normal weight, 25-29.99 is overweight, and BMI greater than 30 is obese.)
16 Centers for Disease Control and Prevention. “Childhood Obesity Facts.” Last updated January 7, 2014. www.cdc.gov/obesity/data/childhood.html
17 Centers for Disease Control and Prevention. “Adult Obesity Facts.” Last updated August 16, 2013. www.cdc.gov/obesity/data/adult.html
18 CHIS 2011-2012, supra note 1. 19 Id.20 Babey SH, Wolstein J, Diamant AL, et al. A Patchwork of Progress: Changes in Overweight and Obesity among California
5th, 7th, and 9th graders, 2005-2010. 2011. Los Angeles, CA: UCLA Center for Health Policy Research, November 2011. (Hereinafter, “A Patchwork of Progress.”) Available at: www.publichealthadvocacy.org/research/patchworkdocs/OFT percent20brief_final.pdf
21 For a discussion of the costs of obesity nation-wide, see Wang YC, McPherson K, Marsh T, et al. “Health and Economic Burden of the Projected Obesity Trends in the USA and the UK.” The Lancet 378(9793): 815-825, 2011.
22 United States Department of Agriculture and U.S. Department of Health and Human Services. Dietary Guidelines for Americans, 2010 (7th ed.). Washington, DC: U.S. Government Printing Office, December 2010. Available at: www.cnpp.usda.gov/Publications/DietaryGuidelines/2010/PolicyDoc/PolicyDoc.pdf
23 CHIS 2011-2012, supra note 1.24 California Health Interview Survey. CHIS 2007 & 2009 Public Use Files. Los Angeles, CA: UCLA Center for Health Policy
Research. Available at: http://ask.chis.ucla.edu/25 The estimate of the prevalence of obesity at the Census tract level was done by small area estimation. These estimates
were based on the California CHIS 2011-12 obesity prevalence estimates by race/ethnicity, and were applied directly to the Census tracts using the population proportions by race/ethnicity at the Census tract level. This is based on the assumption that the obesity prevalence estimates by race/ethnicity at the state level also apply at the small area (census tract level).
26 Alameda County Public Health Department. Data from the Community Assessment, Planning, Education, and Evaluation (CAPE) Unit. January 2014. (Hereinafter, “CAPE Data, January 2014.”)
27 California Department of Education. Physical Fitness Testing Data, 2011-2012. Available at: www.cde.ca.gov/ta/tg/pf/pftresearch.asp

60The Health and Economic Impacts of Obesity in Alameda County changelabsolutions.org I jsi.com
28 California Department of Education. Physical Fitness Testing Research Files, 2012-2013. Available at: www.cde.ca.gov/ta/tg/pf/pftresearch.asp
29 California Health Interview Survey. CHIS 2005 & 2011-2012 Public Use Files. Los Angeles, CA: UCLA Center for Health Policy Research. Available at: http://ask.chis.ucla.edu/
30 Masters RK, Reither EN, Powers DA, et al. “The Impact of Obesity on US Mortality Levels: The Importance of Age and Cohort Factors in Population Estimates.” American Journal of Public Health, 103(10): 1895-1901, October 2013.
31 Centers for Disease Control and Prevention. Deaths: Final Data for 2010. National Vital Statistics Reports. May 8, 2013. Available at: www.cdc.gov/nchs/data/nvsr/nvsr61/nvsr61_04.pdf
32 Fontaine KR, Redden DT, Wang C, Westfall AO, Allison DB. “Years of Life Lost Due to Obesity.” Journal of the American Medical Association, 289(2): 187-193, January 2003.
33 Chang S, Pollack LM, and Colditz GA. “Life Years Lost Associated with Obesity-Related Diseases for U.S. Non-Smoking Adults.” PLOS ONE, 8(6): e66550, June 2013.
34 CAPE Data, June 2013, supra note 3.35 Id. 36 Kidsdata.org, supra note 4. 37 Marshall TA, Eichenberger-Gilmore JM, Broffitt B, et al., supra note 10. 38 Marshall TA, Levy SM, Broffitt B, et al. “Dental Caries and Beverage Consumption in Young Children.” Pediatrics
112(3):e184-e191, 2003. Available at: http://pediatrics.aappublications.org/content/112/3/e184.short39 Id.40 See Holt K and Barzel R. Oral Health and Learning: When Children’s Health Suffers, So Does Their Ability to Learn (3rd ed.).
Washington, DC: National Maternal and Child Oral Health Reseource Center, 2013. Available at: www.mchoralhealth.org/PDFs/learningfactsheet.pdf
41 California Health Interview Survey. CHIS 2007 Public Use Files. Los Angeles, CA: UCLA Center for Health Policy Research. Available at: http://ask.chis.ucla.edu/
42 More Than a Toothache, supra note 12 at 6. 43 Cawley J and Meyerhoefer C, supra note 5. 44 Finkelstein EA., Trogdon JG, Cohen JW, et al. “Annual Medical Spending Attributable to Obesity: Payer-and Service-Specific
Estimates.” Health Affairs 28(5): 822-831, 2009. Available at: http://content.healthaffairs.org/content/28/5/w822.short 45 Wang YC, et al., supra note 21, at 821. 46 Harvard School of Public Health. “Obesity Prevention Source: Economic Costs.”Accessed January 24, 2014.
www.hsph.harvard.edu/obesity-prevention-source/obesity-consequences/economic/ 47 Finkelstein et al., supra note 44, at 826. 48 Cawley J and Meyerhoefer C, supra note 5.49 Stagnitti MN. Statistical Brief #247: Trends in Health Care Expenditure by Body Mass Index (BMI) Category for Adults in the
US Civilian Noninstitutionalized Population, 2001 and 2006. Rockville, MD: Agency for Healthcare Research and Quality, July 2009. Available at: http://meps.ahrq.gov/mepsweb/data_files/publications/st247/stat247.shtml
50 Trogdon JG, Finkelstein EA, Hylands T, et al. “Indirect costs of obesity: a review of the current literature.” Obesity Reviews, 9: 489-500, 2008.
51 Neovius K, Johansson K, Kark M, and Neovius M. “Obesity and sick leave: a systematic review.” Obesity Reviews 10: 17-27, 2008.
52 Finkelstein EA, DiBonaventura MD, Burgess SM, and Hale BC. “The Costs of Obesity in the Workplace.” Journal of Occupational and Environmental Medicine, 52(10): 971-976, 2010.
53 Cawley J, Rizzo JA, Haas K. “The Association of Diabetes With Job Absenteeism Costs Among Obese and Morbidly Obese Workers.” Journal of Occupational and Environmental Medicine, 50(5): 527-534, 2008.
54 Cawley J, Rizzo JA, Haas K. “Occupation-specific absenteeism costs related with obesity and morbid obesity.” Journal of Occupational and Environmental Medicine, 49(12):1317-1324, 2007.
55 Trasande L and Chatterjee S. “The Impact of Obesity on Health Service Utilization and Costs in Childhood.” Obesity, 17(9): 1749-1754, September 2009.
56 Chenowerth & Associates, Inc., supra note 6 at 4.57 As defined by the CDC, physical inactivity is engaging in less than 30 minutes of moderate physical activity on most days.58 Chenowerth & Associates, Inc., supra note 6 at 5.59 County of Alameda Final Budget 2013-2014, supra note 7.60 Cawley J and Meyerhoefer C, supra note 5.61 See, id.62 Geier AB, et al. “The Relationship Between Relative Weight and School Attendance Among Elementary Schoolchildren.”
Obesity, 15(8): 2157-2161, 2007.63 California Department of Finance. “District and Charter School Local Control Funding Formula Modeling Estimates.” Last
accessed February 24, 2014. www.dof.ca.gov/reports_and_periodicals/district_estimate/documents/LCFF_Funding_Estimates.pdf
64 Pourat N and Nicholson G. Unaffordable Dental Care is Linked to Frequent School Absences. Los Angeles, CA: UCLA Center for Health Policy Research, 2009. Available at: http://healthpolicy.ucla.edu/publications/Documents/PDF/Unaffordable%20Dental%20Care%20Is%20Linked%20to%20Frequent%20School%20Absences.pdf
http://www.dof.ca.gov/reports_and_periodicals/district_estimate/documents/LCFF_Funding_Estimates.pdf
61The Health and Economic Impacts of Obesity in Alameda County changelabsolutions.org I jsi.com
65 Healthy Eating Research recently convened a panel of nutrition experts to develop healthy beverage consumption guidelines for children and adults. These age-based guidelines can also be useful for evidence-based policymaking. See Healthy Eating Research. Recommendations for Healthier Beverages. Princeton, NJ: Robert Wood Johnson Foundation, March 2013. Available at: www.rwjf.org/content/dam/farm/reports/issue_briefs/2013/rwjf404852.
66 Id.67 Betheen ER, Kitt BK, Carroll MD, et al. Consumption of Added Sugar among U.S. Children and Adolescents, 2005-2008:
NCHS Data Brief no 87. Hyattsville, MD: National Center for Health Statistics. February 2012, p. 87. Available at: www.cdc.gov/nchs/data/databriefs/db87.htm
68 Schneider JE, et al., supra note 8 at 7. 69 Harrington S, supra note 9. 70 Hu FB. “Resolved: there is sufficient scientific evidence that decreasing sugar-sweetened beverage consumption will
reduce the prevalence of obesity and obesity-related diseases.” Obesity Reviews 14(8): 606-19, 2013. Available at: http://onlinelibrary.wiley.com/doi/10.1111/obr.12040/abstract
71 Vartanian LR, Schwartz MB, Brownell KD. “Effects of Soft Drink Consumption on Nutrition and Health: A Systematic Review and Meta-Analysis.” American Journal of Public Health, 7(4):667–675, 2007. Available at: https://mywebspace.wisc.edu/chooperl/integrative/2012%20fall/effects%20of%20soft%20drink%20consumption.pdf
72 Malik VS, Schulze MB, Hu FB. “Intake of Sugar-Sweetened Beverages and Weight Gain: a Systematic Review.” American Journal of Public Health, 84:274-88, 2006. Available at: www.ncbi.nlm.nih.gov/pmc/articles/PMC3210834/
73 Marshall et al, supra note 38.74 Chaloupka FJ, Powell LM, Chriqui JF. Sugar-Sweetened Beverage Taxes and Public Health. Princeton, NJ: Robert Wood
Johnson Foundation, Healthy Eating Research, July 2009. Available at: www.rwjf.org/en/research-publications/find-rwjf-research/2009/07/sugar-sweetened-beverage-taxes-and-public-health.html
75 Chen L et al. “Reduction in Consumption of Sugar-Sweetened Beverages Is Associated with Weight Loss: the PREMIER Trial.” American Journal of Clinical Nutrition, 89(5): 1299-1306, 2009. Available at: http://ajcn.nutrition.org/content/89/5/1299.full.pdf+html. See also Woodward-Lopez G, Kao J, and Ritchie L. “To What Extent Have Sweetened Beverages Contributed to the Obesity Epidemic?” Public Health Nutrition, 14(3): 499-509, 503-504, 2010. Available at: http://journals.cambridge.org/action/displayAbstract?fromPage=online&aid=8093645
76 Ebbeling CB, et al. “Effects of Decreasing Sugar-Sweetened Beverage Consumption on Body Weight in Adolescents: A Randomized, Controlled Pilot Study.” Pediatrics, 117(3): 673-680, 677, 2006. Available at: www.pediatricsdigest.mobi/content/117/3/673.full.pdf+html
77 Warner ML, et al. “Soda Consumption and Overweight Status of 2-Year-Old Mexican-American Children in California.” Obesity, 14(11): 1966-1974, 1971, 2006. Available at: http://onlinelibrary.wiley.com/doi/10.1038/oby.2006.230/full
78 Saad L. Nearly Half of Americans Drink Soda Daily. Gallup. Published July 23, 2012. Available at: www.gallup.com/poll/156116/Nearly-Half-Americans-Drink-Soda-Daily.aspx?version=print
79 Mendes E. Regular Soda Popular With Young, Nonwhite, Low-Income. Gallup. Published August 15, 2013. Available at: www.gallup.com/poll/163997/regular-soda-popular-young-nonwhite-low-income.aspx?version=print
80 Han E and Powell LM. “Consumption Patterns of Sugar-Sweetened Beverages in the United States.” Academy of Nutrition and Dietetics, 113:43-53, 2013, p.43.
81 Babey SH, Wolstein J and Goldstein H. Still Bubbling Over: California Adolescents Drinking More Soda and Other Sugar-Sweetened Beverages. Los Angeles, CA: UCLA Center for Health Policy Research and California Center for Public Health Advocacy, 2013. Available at: www.publichealthadvocacy.org/stillbubblingover.html
82 Babey SH, Jones M, Yu H, Goldstein H. Bubbling Over: Soda Consumption and its Link to Obesity in California. Los Angeles, CA: UCLA Center for Health Policy Research and California Center for Public Health Advocacy, 2009. Available at: www.publichealthadvocacy.org/PDFs/Bubbling_PolicyBrief.pdf
83 DiCamillo M and Field M. Release #2345: Most Californians See a Direct Linkage Between Obesity and Sugary Sodas. Field Research Corporation. February 14, 2013. Available at: http://field.com/fieldpollonline/subscribers/Rls2345.pdf
84 Davis B and Carpenter C. “Proximity of Fast-Food Restaurants to Schools and Adolescent Obesity.” American Journal of Public Health, 99(3):505-10, 2009. Available at: www.ncbi.nlm.nih.gov/pubmed/19106421
85 Designed for Disease: The Link Between Local Food Environments and Obesity and Diabetes. California Center for Public Health Advocacy, PolicyLink, and the UCLA Center for Health Policy Research, April 2008. (Hereinafter, “Designed for Disease.”)
86 U.S. Department of Agriculture, Economic Research Service. Food Environment Atlas. Last updated December 5, 2013. (Hereinafter, “Food Environment Atlas.”) Available at: www.ers.usda.gov/data-products/food-environment-atlas.aspx. The USDA defines “low access” as “being far from a supermarket, supercenter, or large grocery store (“supermarket” for short). A census tract is considered to have low access if a significant number or share of individuals in the tract is far from a supermarket.” The numbers cited reflect the percentage of people in a county living more than 1 mile from a supermarket or large grocery store if in an urban area, or more than 10 miles from a supermarket or large grocery store if in a rural area.
87 Policy Link and The Food Trust. “The Grocery Gap: Who Has Access to Healthy Food and Why It Matters.” 2010. Available at: www.policylink.org/atf/cf/%7B97C6D565-BB43-406D-A6D5-ECA3BBF35AF0%7D/FINALGroceryGap.pdf
88 Alameda County Public Health Department. Life and Death from Unnatural Causes: Food Access and Liquor Stores. 2008, p. 99. Available at: www.acphd.org/data-reports/reports-by-topic/social-and-health-equity/life-and-death-from-unnatural-causes.aspx
89 Food Environment Atlas, supra note 86. 90 Searching for Healthy Food, supra note 13.91 Food Environment Atlas, supra note 86.
62The Health and Economic Impacts of Obesity in Alameda County changelabsolutions.org I jsi.com
92 The Reinvestment Fund. Limited Supermarket Access (LSA) Analysis Mapping Tool. Accessed January 24, 2014. www.trfund.com/limited-supermarket-access-lsa-analysis-mapping-tool/
93 The Reinvestment Fund, supra note 14. 94 The Reinvestment Fund. A Summary of Searching for Markets: The Geography of Inequitable Access to Healthy
& Affordable Food in the United States. 2012. Available at: www.trfund.com/wp-content/uploads/2013/07/SearchingForMarketsSummary.pdf
95 Food Environment Atlas, supra note 86. 96 CHIS 2011-2012, supra note 18.97 California Health Interview Survey. CHIS 2003, 2005, 2007, 2009, & 2011-12 Public Use Files. Los Angeles, CA: UCLA Center
for Health Policy Research. Available at: http://ask.chis.ucla.edu. Limitations of CHIS data on sugary drink consumption include changes in question wording (e.g. whether or not soda was combined with other sweetened beverages) between years and small sample size for county-level data. In 2003-2007, both children and adolescents were asked a single question about consumption that combined soda and other sweetened beverages (“sweetened fruit drinks, sports, or energy drinks”). During 2009 and 2011-12, this question was split into two separate questions (one asking about soda consumption and the other asking about other sweetened beverage consumption) for adolescents only.
98 Bubbling Over, supra note 82, at 3.99 Bay Area Nutrition and Physical Activity Collaborative. Getting the Soda Free Message: The Bay Area Reduces Soda
Consumption Following Soda Free Summer Campaign. April 2009. (Hereinafter “BANPAC 2009.”) Available at: www.banpac.org/sugar_savvy_curr/banpac_soda_free_report_12_10_09.pdf
100 Bay Area Nutrition and Physical Activity Collaborative. Rethinking Our Drink: Results of the Soda-Free Summer Campaign in Santa Clara County. 2010. Available at: www.banpac.org/sugar_savvy_curr/2011/sfs_issue_brief_summer_2010.pdf
101 Institute of Medicine. Accelerating Progress in Obesity Prevention: Solving the Weight of the Nation. Washington, DC: National Academies Press, 2012. Available at: www.iom.edu/Reports/2012/Accelerating-Progress-in-Obesity-Prevention.aspx
102 Cal. Const. Art. XI, § 7. See also, Stirling v. Board of Supervisors of Los Angeles County, et al., 48 Cal.App.3d 184 (1975).103 United States Census Bureau. State & County QuickFacts. Accessed January 24, 2014. http://quickfacts.census.gov/qfd/
index.html104 Alameda County Waste Management Authority & Alameda County Source Reduction and Recycling Board. Who We Are:
About Stop Waste. Accessed January 24, 2014. www.stopwaste.org/home/index.asp?page=2 105 Alameda County Waste Management Authority. Reusable Bag Ordinance: Ordinance Overview. Accessed January 24, 2014.
http://reusablebagsac.org/overview.html 106 DiCamillo M and Field M. Release #2345: Most Californians See a Direct Linkage Between Obesity and Sugary Sodas. Field
Research Corporation. February 14, 2013. Available at: http://field.com/fieldpollonline/subscribers/Rls2345.pdf 107 Levy DT, Chaloupka F and Gitchell J. “The Effects of Tobacco Control Policies on Smoking Rates: A Tobacco Control
Scorecard.” Journal of Public Health Management and Practice, 10: 338–353, 343, 2004. 108 See, e.g., Testing the Effectiveness of PSAs Aimed at Reducing SSB Consumption, PowerPoint presented by Amy Jordan to
the Rudd Center for Food Policy and Obesity, November 13, 2012. Available at: www.yaleruddcenter.org/resources/upload/docs/seminar/2012-fall/slides/Jordan.pdf
109 For a discussion of elements of an effective obesity prevention campaign, see Evans WD, Christoffel KK, Necheles JW, et al. “Social Marketing as a Childhood Obesity Prevention Strategy.” Obesity, 18(S1): S23-S26, 2010. Available at: http://onlinelibrary.wiley.com/doi/10.1038/oby.2009.428/full
110 Wakefield MA, Loken B and Hornik RC. “Use of Mass Media Campaigns to Change Health Behaviour.” The Lancet 376(9748):1261-1271, 2010. Available at: www.thelancet.com/journals/lancet/article/PIIS0140-6736(10)60809-4/abstract
111 Institute of Medicine, supra note 101.112 Alameda County Public Health Department, Soda Free Summer Campaign. About Us. Accessed January 24, 2014.
www.sodafreesummer.org/about.php113 BANPAC 2009, supra note 99.114 Id. 115 Id. 116 Healthy Eating Active Living Cities Campaign. HEAL Cities. Accessed January 24, 2014. http://healcitiescampaign.org/
cities.html 117 County Commission of Franklin County, Ohio. Resolution No. 0809-13, October 22, 2013. Available at: http://crms.
franklincountyohio.gov/RMSWeb/pdfs/Resolutions/r_000006534/resolution-published.pdf 118 Institute of Medicine, supra note 101.119 Monterey County Board of Supervisors. County of Monterey ‘Healthy’ Vending Machine Policy, 2009. Available at:
http://000sweb.co.monterey.ca.us/admin/Healthy%20Vending%20Machine%20Policy.pdf 120 City of Redding, Community Services Advisory Commission. Consideration of Adoption of Nutritional Standards for
Vending and Concessions at Parks and Recreational Facilities Policy, 2010. Available at: http://media.redding.com/media/static/03-04-2010_rpt_nutritionpolicy.pdf
121 Boston Public Health Commission. Healthy Beverage Toolkit. N.d. Available at: www.bphc.org/whatwedo/healthy-eating-active-living/healthy-beverages/Documents/HealthyBeverageToolkitFinal.pdf
122 Mancino L, Todd JE, Guthrie J, et al. How Food Away From Home Affects Children’s Diet Quality. Economic Research Service Report No. 104. United States Department of Agriculture, October 2010, p.4. Available at: www.ers.usda.gov/media/136261/err104_3_.pdf

63The Health and Economic Impacts of Obesity in Alameda County changelabsolutions.org I jsi.com
123 Foods sold outside of school meal programs are often referred to as “competitive foods.” Competitive foods include beverages sold individually in the cafeteria to students, as well as through other venues on campus like snack bars and vending machines.
124 Mancino L, et al., supra note 122. 125 Wang YC, Bleich SN and Gortmaker SL. “Increasing Calorie Contribution from Sugar-Sweetened Beverages and 100 percent
Fruit Juice Among US Children and Adolescents, 1988–2004.” Pediatrics, 121: e1604–1614, e1609-e1610, 2008. Available at: http://pediatrics.aappublications.org/content/121/6/e1604.short
126 Briefel RR, Wilson A and Gleason PM. “Consumption of Low- Nutrient, Energy-Dense Foods and Beverages at School, Home, and Other Locations among School Lunch Participating and Nonparticipants.” Journal of the American Dietetic Association, 109(Supp.2): S79–90, 2009. Available at: www.rwjf.org/en/research-publications/find-rwjf-research/2009/02/improving-child-nutrition-policy/consumption-of-low-nutrient--energy-dense-foods-and-beverages-at.html
127 Levy DT, Friend KB and Wang YC. “A Review of the Literature on Policies Directed at the Youth Consumption of Sugar Sweetened Beverages.” Advances in Nutrition: An International Review Journal, 2(2): 182S–200S, 183S, 194S–195S, 2011. Available at: http://advances.nutrition.org/content/2/2/182S.full.pdf+html
128 Healthy Eating Research and Bridging the Gap. Influence of Competitive Food and Beverage Policies on Children’s Diets and Childhood Obesity. 2012, p. 6–7. Available at: www.healthyeatingresearch.org/images/stories/her_research_briefs/RRCompFoods7-2012.pdf
129 7 CFR 210 (2014). 130 See Cal. Educ. Code § 49430 et seq. 131 National School Lunch and School Breakfast Program: Nutrition Standards for All Foods Sold in School as Required by
the Healthy, Hunger-Free Kids Act of 2010, 78 Fed. Reg. 39068 (Interim Final Rule, June 28, 2013) (to be codified at 7 CFR 210.11).
132 Walter C. “USDA Releases Smart Snacks in School: The California Impact.” Public Health Institute Blogs, June 28, 2013. Available at: www.phi.org/news-events/496/usda-releases-smartsnacks-in-school-the-california-impact
133 For a more detailed discussion of beverages allowed under an integrated federal and California framework, see CA4Health and ChangeLab Solutions. Addressing Sugary Drinks through the Local School Wellness Policy, 2013. Available at: www.changelabsolutions.org/publications/SSBs-school-wellness
134 National School Lunch and School Breakfast Program: Nutrition Standards for All Foods Sold in School as Required by the Healthy, Hunger-Free Kids Act of 2010, 78 Fed. Reg. 39068 (Interim Final Rule, June 28, 2013) (to be codified at 7 CFR 210.11).
135 Id.136 Child Nutrition and Special Supplemental Nutrition Program for Women, Infants and Children (WIC) Reauthorization Act,
Pub.L. No. 108–205, § 204, 118 Stat. 729, 780 (2004).137 42 U.S.C. 1758b(2) (2014). 138 Healthy, Hunger-Free Kids Act of 2010, Pub. L. No. 111–296, § 208, 124 Stat. 3183, 3221–3222 (2010) (codified at 42 U.S.C.
1779).139 Healthy, Hunger-Free Kids Act of 2010, Pub. L. No. 111-296, § 204, 124 Stat. 3183, 3216 (2010) (codified at 42 U.S.C. 1758b).140 National School Lunch and School Breakfast Program: Nutrition Standards for All Foods Sold in School as Required by
the Healthy, Hunger-Free Kids Act of 2010, 78 Fed. Reg. 39068 (Interim Final Rule, June 28, 2013) (to be codified at 7 CFR 210.11).
141 USDA Food and Nutrition Service. Local Process: How to Develop, Implement, and Evaluate a Wellness Policy. Last updated July 20, 2013. Available at: http://teamnutrition.usda.gov/healthy/wellnesspolicy_process.html
142 Institute of Medicine, supra note 101.143 Alameda County Office of Education. Student Programs and Services. Accessed January 24, 2014. Available at:
www.acoe.org/acoe/StudentPrograms 144 California School Boards Association. CSBA Sample, Board Policy, Students, Student Wellness (BP 5030(a). Revised July
2011. Available at: www.csba.org/GovernanceAndPolicyResources/ConditionsOfChildren/StudentPhysicalHealthWellness/StudentWellnessPolicy.aspx
145 National Alliance for Nutrition and Activity. Model School Wellness Policies. March 2005. Available at: www.schoolwellnesspolicies.org/
146 For example sugary drink related policy elements, see CA4Health and ChangeLab Solutions. Addressing Sugary Drinks through the Local School Wellness Policy, 2013. Available at: www.changelabsolutions.org/publications/SSBs-school-wellness
147 Federal law requires that schools provide free drinking water during meal service. See Healthy, Hunger Free Kids Act of 2010, Pub. L. No. 111-296, § 203, 124 Stat. 3183, 3216 (2010) (codified at 42 U.S.C. § 1758(a)).
148 Cal. Educ. Code § 38086 (2014).149 Wang YC et al., supra note 125.150 Briefel RR, Wilson A and Gleason PM. “Consumption of Low- Nutrient, Energy-Dense Foods and Beverages at School, Home,
and Other Locations among School Lunch Participating and Nonparticipants.” Journal of the American Dietetic Association, 109(Supp.2): S79–90, 2009. Available at: www.rwjf.org/en/research-publications/find-rwjf-research/2009/02/improving-child-nutrition-policy/consumption-of-low-nutrient--energy-dense-foods-and-beverages-at.html
151 Wang YC et al., supra note 125.152 Searching for Healthy Food, supra note 13.153 Kidsdata.org, supra note 4.

64The Health and Economic Impacts of Obesity in Alameda County changelabsolutions.org I jsi.com
154 Powell LM, Auld MC, Chaloupka, et al. “Associations Between Access to Food Stores and Adolescent Body Mass Index.” American Journal of Preventive Medicine 33(4S): S301-S307, S301, S306, 2007. Available at: www.impacteen.org/journal_pub/pub_PDFs/AJPM_Supplement_2007/AJPM2007_S301_powell.pdf
155 Morland K, Wing S, and Diez-Roux A. “The Contextual Effect of the Local Food Environment on Residents’ Diets: The Atherosclerosis Risk in Communities Study.” American Journal of Public Health 92(11): 1761–1767, 2002. Available at: http://ajph.aphapublications.org/doi/pdf/10.2105/AJPH.92.11.1761
156 Designed for Disease, supra note 85. 157 Hearst MO, Pasch KE and Laska MN. “Urban v. Suburban Perceptions of the Neighborhood Food Environment As Correlates
of Adolescent Food Purchasing.” Public Health Nutrition, 15(2): 299-306, 303, 2011. Available at: http://journals.cambridge.org/download.php?file= percent2FPHN percent2FPHN15_02 percent2FS1368980011002114a.pdf&code=ad28a70ee5f5be9f50aadfcbedad50cd
158 Laska MN, Hearst MO, Forsyth A, et al. “Neighborhood Food Environments: Are they Associated with Adolescent Dietary Intake, Food Purchases and Weight Status?” Public Health Nutrition, 13(11): 1757-1763, 2010. Available at: www.ncbi.nlm.nih.gov/pmc/articles/PMC3119051/
159 Powell et al., supra note 154. See also Davis B and Carpenter C. “Proximity of Fast-Food Restaurants to Schools and Adolescent Obesity.” American Journal of Public Health 99(3): 505-510, 2009 (finding that middle school and high school students with a fast food restaurant within a half mile of school were more likely to be overweight or obese); Howard PH, Fitzpatrick M, and Fulfrost B. “Proximity of Food Retailers to Schools and Rates of Overweight Ninth Grade Students: An Ecological Study in California.” BMC Public Health 11(1): 68-75, 2011 (finding a significant association between increased rate of overweight ninth grade students who go to school within a 10 minute walk of a convenience store; but finding no significant association with fast food restaurants or supermarkets); Liu GC et al. “Green Neighborhoods: Food Retail and Childhood Overweight: Differences by Population Density.” Health Promotion 21(4): 317-325, 2007 (finding an increased risk for overweight for those living farther from the nearest large brand name supermarket). But see Wang MC et al. “Socioeconomic and Food-Related Physical Characteristics of the Neighborhood Environment Are Associated with Body Mass Index.” Journal of Epidemiology and Community Health, 61(6): 491-498, 2007. Available at: www.ncbi.nlm.nih.gov/pmc/articles/PMC2465719/pdf/491.pdf
160 Powell LM, Slater S, Mirtcheva D, et al. “Food Store Availability and Neighborhood Characteristics in the United States.” Preventive Medicine 44(3): 189-195, 2007. Available at: www.geog.ubc.ca/courses/geob370/students/class10/ddchan/www/images/docs/Powell.pdf
161 Moore LV and Diez Roux AV. “Association of Neighborhood Characteristics with the Location and Type of Food Stores.” American Journal of Public Health, 96(2): 325-331, 2006. Available at: http://ajph.aphapublications.org/doi/pdf/10.2105/AJPH.2004.058040
162 Institute of Medicine, supra note 101.163 County of Alameda, RFP No. 900044 for Healthy Retailer Program Development, n.d. Available at: www.acgov.org/gsa_
app/gsa/purchasing/bid_content/contractingdetail.jsp?BID_ID=1431 164 Detroit, Mich., Municipal Code § 61-12-91 (2013).165 Arden Hills, Minn., Municipal Code § 1325.04(1)(A) (2013).166 Seattle, Wash., Municipal Code § 15.17.130 (2013).167 L.A., Cal., Municipal Code § 80.73(b)(2)(A)(5) (2013).168 For a list of examples, see www.healcitiescampaign.org/healthy_zone.html 169 Los Angeles, Cal., Ordinance 180103 (July 29, 2008). Available at: http://cityplanning.lacity.org/Code_Studies/Misc/
FastFoodInterim.pdf 170 Los Angeles City Council General Plan Amendment, (File No. 10-1843, Adopted 12/10/2010). Available at: http://clkrep.lacity.
org/onlinedocs/2010/10-1843_ca_12-08-10.pdf 171 City of Seaside, Planning Department, Seaside General Plan, at LU-36 (August 5, 2004 ). Available at: www.ci.seaside.ca.us/
ftp/PDF/Seaside_GP.pdf 172 See Sonoma County Department of Public Health. Sonoma County Healthy Food Outlet Project. N.d. Available at:
www.igrowsonoma.org/documents/Sonoma percent20County percent20Healthy percent20Food percent20Outlet percent20Project.pdf
173 Minneapolis, Minn., Code of Ordinances, Chapter 203. 2013. Available at: http://library.municode.com/index.aspx?clientId=11490&stateId=23&stateName=minnesota
174 For a discussion of the lessons learned from the Minneapolis Staple Foods ordinance, please refer to the Minneapolis Department of Health and Family Support, Minneapolis Healthy Corner Store Program. Making Produce More Visible, Affordable and Attractive, February 2012. www.health.state.mn.us/divs/oshii/docs/Mpls_Healthy_Corner_Store.pdf
175 Santa Clara, Cal., Code of Ordinances, Health & Welfare Division A18, Chapter 22. 2010. Available at: http://library.municode.com/HTML /13790/level3/TITAGEAD _DIVA 18HEWE _CHXXIITOOTINREFO.html
176 San Francisco, Cal., Health Code, Article 8, §§ 471.1–471.9. 2010. www.sfbos.org/ftp/uploadedfiles/bdsupvrs/ordinances10/o0290-10.pdf
177 New York Statewide Coalition of Hispanic Chambers of Commerce v. The New York City Dept. of Health and Mental Hygiene, No. 653584/12 (Supreme Court of New York, New York County, March 11, 2013).
178 “Big Soda Ban Proposed by Mayor of Cambridge, Mass.” CBS News, June 19, 2012. Available at: www.cbsnews.com/news/big-soda-ban-proposed-by-mayor-of-cambridge-mass/
179 S.B. 2693 (Haw. 2014).180 California Center for Public Health Advocacy’s Kick the Can Project tracks current and recent healthy beverage campaigns
on its website at www.kickthecan.info/whats-happening-campaign-list#cities.
65The Health and Economic Impacts of Obesity in Alameda County changelabsolutions.org I jsi.com
181 Allen S. “Soda Taxes Loses Big in California.” Los Angeles Times, Nov. 7, 2012. Available at: http://latimesblogs.latimes.com/lanow/2012/11/soda-taxes-lose-big-in-california.html
182 Coffman K. “Telluride, Colorado Voters Reject Tax on Sugary Drinks.” Reuters, Nov. 6, 2013. Available at: www.reuters.com/article/2013/11/06/us-usa-telluride-drinks-idUSBRE9A508Q20131106
183 Roberts C. “Supervisors United Behind Proposed Soda –Tax Measure.” San Francisco Examiner, Nov. 19, 2013. Available at: www.sfexaminer.com/sanfrancisco/supervisors-unite-behind-proposed-soda-tax-measure/Content?oid=2629989
184 Lance Knobel. “Will Berkeley Be First in Nation to Impose Soda Tax?” Berkeleyside, Feb. 12, 2014. Available at: www.berkeleyside.com/2014/02/12/will-berkeley-be-first-in-nation-to-impose-sugar-tax/
185 Sheldon L. “Mayor McGinn Proposes Soda Tax for Seattle.” kirotv.com, Sept. 27, 2013. Available at: www.kirotv.com/news/news/mayor-mcginn-proposes-soda-tax-seattle/nZ9Tk/
186 The New York City Department of Health and Mental Hygiene. NYC Green Carts. Accessed January 24, 2014. Available at: www.nyc.gov/html/doh/html/living/greencarts.shtml
187 American Lung Association, California. State of Tobacco Control 2014—California Local Grades. 2014, p.11. Available at: www.lung.org/associations/states/california/assets/pdfs/sotc-2014/sotc-2014-california-tobacco.pdf
188 Zenk SN and Powell LM. “US Secondary Schools and Food Outlets.” Health & Place, 14: 336–346, 2007. Available at: www.ncbi.nlm.nih.gov/pubmed/17881277
189 Harris JL, Schwartz MB, Munsell CR, et al. Fast Food F.A.C.T.S (Food Advertising to Children and Teens Score) 2013: Measuring Progress in Nutrition and Marketing to Children and Teens. Yale Rudd Center for Food Policy & Obesity, 2013. Available at: www.fastfoodmarketing.org/
190 Cal. Rev. & Tax Code §§ 6051, 6201, 6051.3, 6201.3, 6051.7, 6201.7, 6201.5, 6051.2, 6201.2, 6359 (2013).191 Pomeranz JL. “Advanced Policy Options to Regulate Sugar-Sweetened Beverages to Support Public Health.” Journal
of Public Health Policy, 33(1): 75-88, 80-81, 2011. See also, Fletcher JM, Frisvold D and Tefft N. “Taxing Soft Drinks and Restricting Access to Vending Machines to Curb Child Obesity.” Health Affairs, 29(5): 1059-1066, 1061, 2010.
192 Powell LM, Chriqui J and Chaloupka FJ. “Associations between State-Level Soda Taxes and Adolescent Body Mass Index.” Journal of Adolescent Health, 45(3): S57-S63, 2009. Available at: www.ncbi.nlm.nih.gov/pmc/articles/PMC2864626/
193 Powell LM and Chaloupka FJ. “Food Prices and Obesity: Evidence and Policy Implications for Taxes and Subsidies.” Milbank Quarterly 87(1): 229-257, 2009. Available at: www.ncbi.nlm.nih.gov/pmc/articles/PMC2879182/
194 Brownell KD, Farley T, Willet WC, et al. “The Public Health and Economic Benefits of Taxing Sugar-Sweetened Beverages.” New England Journal of Medicine, 361(16): 1599-1605, 2009. Available at: www.ncbi.nlm.nih.gov/pmc/articles/PMC3140416/
195 Brownell KD and Freiden TR. “Ounces of Prevention—the Public Policy Case for Taxes on Sugared Beverages.” New England Journal of Medicine, 360(18): 1805-1808, 2009. Available at: http://yaleruddcenter.org/resources/upload/docs/what/industry/SodaTaxNEJMApr09.pdf
196 Finkelstein EA, Chen Z, Nonnemaker J, et al. “Impact of Targeted Beverage Taxes on Higher- and Lower-Income Households.” Archives of Internal Medicine, 170(22): 2028-2034, 2032-2033, 2010. Available at: http://archinte.jamanetwork.com/article.aspx?articleid=776479
197 Mekonnen TA, et al. “Health Benefits of Reducing Sugar-Sweetened Beverage Intake in High Risk Populations of California: Results from the Cardiovascular Disease (CVD) Policy Model.” PLOS ONE, 8(12): e81723, 2013. Available at: www.plosone.org/article/info percent3Adoi percent2F10.1371 percent2Fjournal.pone.0081723#pone-0081723-g003
198 Cal. Elections Code § 9222 (2014).