The Healing Economy: An Economic Development Framework …
25
Cleveland State University Cleveland State University EngagedScholarship@CSU EngagedScholarship@CSU Urban Publications Maxine Goodman Levin College of Urban Affairs 1-18-2018 The Healing Economy: An Economic Development Framework for The Healing Economy: An Economic Development Framework for Cleveland Cleveland Richey Piiparinen Cleveland State University, [email protected] Jim Russell Valdis Krebs Follow this and additional works at: https://engagedscholarship.csuohio.edu/urban_facpub Part of the Urban Studies and Planning Commons How does access to this work benefit you? Let us know! How does access to this work benefit you? Let us know! Repository Citation Repository Citation Piiparinen, Richey; Russell, Jim; and Krebs, Valdis, "The Healing Economy: An Economic Development Framework for Cleveland" (2018). Urban Publications. 0 1 2 3 1518. https://engagedscholarship.csuohio.edu/urban_facpub/1518 This Report is brought to you for free and open access by the Maxine Goodman Levin College of Urban Affairs at EngagedScholarship@CSU. It has been accepted for inclusion in Urban Publications by an authorized administrator of EngagedScholarship@CSU. For more information, please contact [email protected].
Transcript of The Healing Economy: An Economic Development Framework …

Cleveland State University Cleveland State University
EngagedScholarship@CSU EngagedScholarship@CSU
Urban Publications Maxine Goodman Levin College of Urban Affairs
1-18-2018
The Healing Economy: An Economic Development Framework for The Healing Economy: An Economic Development Framework for
Cleveland Cleveland
Richey Piiparinen Cleveland State University, [email protected]
Jim Russell
Valdis Krebs
Follow this and additional works at: https://engagedscholarship.csuohio.edu/urban_facpub
Part of the Urban Studies and Planning Commons
How does access to this work benefit you? Let us know! How does access to this work benefit you? Let us know!
Repository Citation Repository Citation Piiparinen, Richey; Russell, Jim; and Krebs, Valdis, "The Healing Economy: An Economic Development Framework for Cleveland" (2018). Urban Publications. 0 1 2 3 1518. https://engagedscholarship.csuohio.edu/urban_facpub/1518
This Report is brought to you for free and open access by the Maxine Goodman Levin College of Urban Affairs at EngagedScholarship@CSU. It has been accepted for inclusion in Urban Publications by an authorized administrator of EngagedScholarship@CSU. For more information, please contact [email protected].

THE HEALING ECONOMY
AN ECONOMIC
DEVELOPMENT
FRAMEWORK
FOR CLEVELAND
By Richey Piiparinen, Jim Russell, and Valdis KrebsTHE CENTER FOR POPULATION DYNAMICS AT THE MAXINE GOODMAN LEVIN COLLEGE OF URBAN AFFAIRS AT CLEVELAND STATE UNIVERSITY AND ORGNET, LLC
A report commissioned by BioEnterprise and the Health Tech Corridor

MAXINE GOODMAN LEVIN COLLEGE OF URBAN AFFAIRS

EXECUTIVE SUMMARY
3
CLEVELAND’S HEALTHCARE CLUSTER
4
FROM METAL TO MEDICAL
7
WHEN SMOKESTACKS CHASE: THE IMPORTANCE OF R&D
9
WHERE THE PUCK IS GOING
13
INNOVATION THROUGH DISPARITY
17
TABLE OF CONTENTS

MAXINE GOODMAN LEVIN COLLEGE OF URBAN AFFAIRS
2

MAXINE GOODMAN LEVIN COLLEGE OF URBAN AFFAIRS
Executive Summary
• The Cleveland metro has the densest health science labor mar-
ket in the nation, with 14.5% of the region’s workforce em-
ployed in high-skilled healthcare delivery. Cleveland is ahead
of Philadelphia (14.1%) and Boston (14.1%).
• Since 2002, healthcare and social assistance jobs in Cuyahoga
County increased from approximately 104,500 to 131,700,
with the aggregate income from those jobs growing from an
inflation-adjusted $4.8 billion to $6.9 billion in 2016.
• A significant amount of Cuyahoga County’s healthcare jobs are
clustered in Cleveland’s Health Tech Corridor. In 2003, 26.4%
of all healthcare and social assistance jobs in Cuyahoga County
were in the Health Tech Corridor, increasing to 36.2% by 2015.
• Total employment in the Health Tech Corridor increased from
approximately 41,200 in 2002 to 75,000 in 2015—a gain of
82%. Also, about 1 out of every 20 jobs in Cuyahoga County
were in the Health Tech Corridor in 2002, increasing to 1 out
of 10 by 2015.
• Much of the year-over-year job growth in the region is happen-
ing in the Health Tech Corridor. From 2014 to 2015, 25% of
all job growth in the Cleveland metro occurred in the Health
Tech Corridor, whereas 39% of Cuyahoga County’s job growth
happened in the corridor.
• The job growth in the Health Tech Corridor is associated with
increased real estate valuations. Inflation-adjusted assessed
values for all property types in the corridor went from $3.85
billion in 2009 to $4.72 billion in 2015—a gain of 23%.
• The clustering of healthcare services in Cleveland—termed a
“knowledge cluster” in the current analysis—relates to the fact
healthcare has become tradable, or exportable. Cleveland not
only brings patients into the region, but delivers services na-
tionally and internationally.
• While Cleveland excels as a “knowledge cluster” in healthcare,
the region performs less well as a “knowledge hub,” described
as the region’s ability to produce life science research. Cleve-
land ranked 22nd nationally in R&D funding from the National
Institute of Health (NIH) in 2016.
• The current analysis suggests state- and local-level policies
should supplement seeding “downstream” innovation that
facilitates start-up formation and technology transfer with the
funding of “upstream” innovation that attracts “star scientists,”
particularly in frontier fields.
• In delineating frontier fields, the analysis borrows from the Four
Sector Theory of economic development, which illustrates how
a given nation’s or region’s economy evolves from primary (ag-
riculture), to secondary (industrial), to tertiary (services), to
quaternary (information). Today, Cleveland is still economically
restructuring from a secondary to tertiary economy. Yet many
regions are in the midst of a second economic restructuring
from secondary/tertiary to quaternary, in which economic value
is the data capital derived from a good or service, rather than
the good for service itself. This data capital is the “oil” for the
next-wave of innovation, principally in the fields of artificial in-
telligence (AI) and machine learning.
• The analysis speculates on a potential “long game” for Cleve-
land in terms of developing an R&D hub in a frontier field, look-
ing specifically at healthcare analytics. Due to regional assets,
Cleveland can be a global node in population health research,
in effect developing a data capital and AI/machine learning
ecosystem that creates leading knowledge in the social deter-
minants of health and reduction of health disparities.
• A systematic, Cleveland-based intervention to reduce health
disparities can be exported globally, igniting a tradable health-
care model that goes beyond selling services outside the re-
gion. This is a new type of economic development model oper-
ating as a global-local feedback loop. Here, the global export is
the health of the local community.
3

MAXINE GOODMAN LEVIN COLLEGE OF URBAN AFFAIRS
In 1985, Rabbi Daniel Jeremy Silver delivered a sermon called
“What’s Wrong with Cleveland.”1 Part of what was wrong was
there was little magical about the birth of the region, but rather it
came as a “matter of historical accident.” Cleveland’s geography
enabled its rise as an industrial power: it was on a lake and a river,
and in between a region of iron ore to the north and coal to the
south. These raw materials met in Cleveland to make steel. Steel-
making evolved to include off-shoot industries like metallurgy,
machining, and automobiles, with manufacturing employment to-
taling over 356,000 in the region by 1969. That year, Cleveland’s
per capita income ranked 11th out of the nation’s largest cities,
one spot ahead of Boston.2
But the benefits of serendipity don’t last forever. The region lost
over 114,000 manufacturing jobs by 1985, the year of Silver’s
speech. The sector employed only 22% of the workforce, whereas
the service sector comprised 27% of the regional labor market3.
But as manufacturing declined so did Cleveland’s income rank-
ings, dropping to 17th by 1985. Meanwhile, Boston ranked 5th.
What happened? The Industrial Revolution wasn’t so revolution-
ary anymore. “The Steel Age is over and so is the age of the as-
Cleveland’s Healthcare Cluster
sembly-line factories that used our machine tools,” Rabbi Silver
continued, indicating the economic future is one of “electronics
and robotics, and these are not the goods in which we specialize.”
Cleveland did not, however, fall behind in one area: healthcare.
“Our hospitals have been well-financed,” the rabbi explained.
“Medical research has been promoted. Such research was valu-
able and non-controversial, and the results of this continuing in-
vestment are clear. The medical field has been the one bright spot
in an otherwise gloomy economic picture.”
The importance of the healthcare industry to the region is obvious
today. The current analysis measured the largest concentration of
health science workers4 for the nation’s top 50 metropolitan labor
markets. Over fourteen percent (14.5%) of Greater Clevelanders5
are employed in health sciences, ranking first ahead of Boston
(14.1%) and Philadelphia (14.1%). Translating these figures to a
statistic known as a location quotient (LQ)—a higher LQ equates to
a greater concentration of a given industry relative to the nation—
Cleveland again leads with an LQ of 1.11, ahead of Philadelphia
(1.08) and Boston (1.07) (See Figure 1, page 6). The majority of
Greater Cleveland’s health science jobs are in Cuyahoga County.
0100,000200,000300,000400,000500,000600,000700,000
196919711973197519771979198119831985198719891991199319951997199920012003200520072009201120132015
Jobs in Cleveland Metro in Services and Manufacturing. 1969 to 2015. Source: BEA.
Manufacturing Services
Jobs in Cleveland Metro in Services and Manufacturing, 1969 to 2015Source: BEA
1 Rabbi Daniel Jeremy Silver, “What’s Wrong with Cleveland” sermon, 1985.2 Bureau of Economic Analysis3 Bureau of Economic Analysis4 Health Science workers comprise occupations in the Health Sciences Sectors in the 6-digit NAICS code.5 “Greater Cleveland,” or the Cleveland metropolitan area, is defined as the five-county region comprised of
Cuyahoga, Lake, Lorain, Geauga, and Medina counties.
1969 1971 1973 1975 1977 1979 1981 1983 1985 1987 1989 1991 1993 1995 1997 1999 2001 2003 2005 2007 2009 2011 2013 2015
700,000600,000500,000400,000300,000200,000100,000
0
4

MAXINE GOODMAN LEVIN COLLEGE OF URBAN AFFAIRS
Seventy-six percent of health science workers in the Cleveland
metropolitan area are employed in the core county.6 Comparing
Cuyahoga County’s health science LQ with the core counties of
the top 50 labor markets is also revealing: Cuyahoga County is
second with an LQ of 1.42, trailing only Philadelphia County (See
Figure 2). The clustering of healthcare in Cuyahoga County has
coincided with enlarging economic impacts. Between 2002 and
2016, healthcare and social assistance jobs in the county in-
creased from approximately 104,500 to 131,700, with the aggre-
gate income from those jobs growing from an inflation-adjusted
$4.822 billion to $6.892 billion (See Figure 3).
A last slice of the data examines to what extent life science em-
ployment is clustering within Cuyahoga County itself. Answering
the analysis measured total employment and healthcare employ-
ment within the Health Tech Corridor (HTC), a 1,600 acre area
which houses the city of Cleveland’s “eds and meds” institutions,
namely Cleveland State University, Case Western Reserve Univer-
sity, the Cleveland Clinic, and University Hospitals (See Map 1 for
geographic reference). Total employment in the HTC increased
from about 41,200 in 2002 to 75,000 in 2015—a gain of 82%
(compared to minus 2.2% for Cuyahoga County).7 Also, 5.9% of
all jobs in Cuyahoga County were within the boundaries of the
HTC in 2002, increasing to 10.9% by 2015 (See Figure 4). Ex-
amining year-over-year growth from 2014 to 2015, 24.7% of all
job growth in the Cleveland metro occurred in the HTC. Those
concentrations were even higher for Cuyahoga County (39%) and
the City of Cleveland (57.3%) (See Figure 5). The clustering of
healthcare employment is what’s driving this change: 36.2% of
healthcare and social assistance jobs in the county were in the
HTC in 2015, up from 26.4% in 2003 (See Figure 6).
The coring of life science work has corresponded with significant
real estate appreciation within the corridor’s boundaries, with an
increase in valuations of nearly $900 million since 2009. Spe-
cifically, inflation-adjusted assessed values for all property types
in the HTC went from $3.849 billion to $4.723 billion—a gain of
23% (See Figure 7). Compare this to an 11% decline in Cleve-
land and a 12% decline in Cuyahoga County, and the influence
the region’s anchor institutions have on real estate appreciation
is apparent.
Why is this coring occurring? Is Cleveland just sicker than other
regions nationally, translating to a higher demand for healthcare
and thus a greater supply of doctors, nurses and other workers?
Or is an industry cluster developing locally, one fed by Cleveland’s
global notoriety as a premier healthcare destination? The remain-
der of this paper will shed light on these questions. In doing so,
a regional economic development framework will be articulated
to facilitate Cleveland’s ongoing economic restructuring from the
Steel to Information Age, with the life sciences the vehicle for this
transformation.
6 Quarterly Census of Employment and Wages (QCEW), 2006, 2016.7 LODES, 2002, 2015.
Map 1: Cleveland Metro, Cuyahoga County, and Health Tech Corridor
5

MAXINE GOODMAN LEVIN COLLEGE OF URBAN AFFAIRS
$873,479,100
-$3,011,014,900
-$13,880,304,800
HTC Cleveland Cuyahoga
Figure 7: Inflation-Adjusted Assessed Value Change All Property Types 2009 -2015. Source: Cuyahoga County Auditor
26.4%
36.2%
5%10%15%20%25%30%35%40%45%
0
10,000
20,000
30,000
40,000
50,000
2003 2004 2005 2006 2007 2008 2009 2010 2011 2012 2013 2014 2015
Figure 6: Health Care Jobs in HTC and Concentration of County Healthcare Jobs in HTC. Source: LODES
Health Care and Social Assistance in HTC Percentage of County in HTC
57.3%
39.0%
24.7%
City of Cleveland
Cuyahoga County
Cleveland Metro
Figure 5: Percent of Year-Over-Year Job Growth Occurring in HTC, 2014-2015. Source: LODES
City of Cleveland Cuyahoga County Cleveland Metro
5.9%
10.9%
4%5%6%7%8%9%10%11%12%13%14%
0
10,000
20,000
30,000
40,000
50,000
60,000
70,000
80,000
2002 2003 2004 2005 2006 2007 2008 2009 2010 2011 2012 2013 2014 2015
Figure 4: Total Jobs in HTC and Concentration of County Jobs in HTC. Source: LODES
Total Primary Jobs HTC Percentage in HTC
$1,000
$2,000
$3,000
$4,000
$5,000
$6,000
$7,000
$8,000
$9,000
0
20,000
40,000
60,000
80,000
100,000
120,000
140,000
2002 2004 2006 2008 2010 2012 2014 2016
Tota
l Inc
ome,
in B
illio
ns
Tota
l Job
s
Figure 3: Total Jobs and Total Income in Cuyahoga County in Health Care Sector. Source: QCEW
Total Jobs Total Income
2
6
Source: Quarterly Census of Employment and Wages, 2016 Q2
Figure 2: County Rankings by Health Science LQ
1.42
0.2
0.4
0.6
0.8
1.0
1.2
1.4
1.6
1.8
SNF
DE
NC
HA
RG
HLV
SN
OS
RO
CSE
ASN
JO
RL
RC
HV
BN
WD
CA
US
AT
LBU
FR
SBD
AL
HO
ULA
XTA
MSN
DSL
CPO
RLO
USA
CPH
XC
HI
BAL
GR
DM
IA KC
BIR
MIN
OK
CH
RT
STL
JAX
CO
LSA
NM
EM IND
MLK
TUC
NSH CIN
PRO
PIT
DE
TN
YC
BOS
CL
EPH
I
Source: Quarterly Census of Employment and Wages, 2016 Q 2Source: Quarterly Census of Employment and Wages, 2016 Q2
Figure 6: Health Care Jobs in HTC and Concentration of County Healthcare Jobs in HTCSource: LODES
Figure 7: Inflation-Adjusted Assessed Value Change All Property Types 2009-2015Source: Cuyahoga County Auditor
Figure 1: Metro Rankings by Health Science LQ
Figure 2: County Rankings by Health Science LQ
Figure 3: Total Jobs and Total Income in Cuyahoga County in Health Care SectorSource: LODES
Figure 4: Total Jobs in HTC and Concentration of County Jobs in HTCSource: LODES
Figure 5: Percent of Year-Over-Year Job Growth Occurring in HTC 2014-2015Source: LODES
MAXINE GOODMAN LEVIN COLLEGE OF URBAN AFFAIRS
Globally-renowned cities have tradable, or exportable, economies.
Detroit and cars is one iconic example. Here, a good is produced,
then exported, with imported profits benefiting the exporting re-
gion. Professional services like healthcare, education, and legal
have long been viewed as being an outcome of an export econo-
my (e.g., the factory worker needs a doctor), rather than exports
in and of themselves. “The conventional view of the service-pro-
ducing sector,” explained the Cleveland Fed in 1986, “was that it
grew only as a result of healthy manufacturing, and did not gener-
ate wealth for the area.”8
This view of service provision is outdated. High-
er education is increasingly traded on the glob-
al market, with nearly 1 million international
students attending American universities and
colleges, up from 650,000 in 1998.9 These
students contributed $36 billion annually to
the nation’s economy,10 and there’s room for
growth: international students comprise only
5% of U.S. enrollment, compared with 20%
in Australia.11 Locally, the nearly 5,500 inter-
national students in Greater Cleveland paid
over $137 million in tuition between 2008 and
2012, with another $58 million in living costs.12
The healthcare industry is mirroring higher ed-
ucation with services increasingly being trans-
acted out of the local market. In a recent analy-
sis co-authored by Harvard economist Michael
Porter called “Cleveland Clinic: Transformation
and Growth, 2015,” it was found nearly 30%
of the patients the Clinic served were not from
Greater Cleveland, with 13% from outside Ohio.13 Approximate-
ly 2% of all patients the Clinic receives on its main campus ar-
rive from outside the U.S., with estimates of international patient
spending totaling between $3,800 and $6,000 per visit.14 This is
From Metal to Medical
outside money coming into Cleveland, employing not only health-
care workers but workers in the local economy. In all, it’s the same
formula that built Cleveland into an early 20th century power-
house, yet instead of exporting metal, the region exports medical.
The tradability of Cleveland’s healthcare industry goes beyond
gaining market share by bringing patients into Cleveland. There’s
also the strategy of geographic expansion. The Cleveland Clin-
ic is growing its reach by developing a vast consultancy industry
through its affiliate and alliance network, particularly in well-ac-
8 Federal Reserve Bank of Cleveland, Annual Report, “Common Bonds, Divergent Paths: An Economic Perspective of Four Cities,” 1986.9 Marber, P. “Trump Doesn’t Realize that America’s Greatest Export is Higher Education.” Quartz. May 2017.10 ICEF Monitor. “More than One Million International Students in the US.” November 2016.11 Ross, J. and Hare, J. “Foreign Students Bring $20 Billion to Australia,” Inside Higher Ed. (November 2016).12 Ruiz, N. “The Geography of Foreign Students in U.S. Higher Education: Origins and Destinations.” Brookings Report (May 2014).13 Porter, M, Teisberg, E. 2015. “Cleveland Clinic: Transformation and Growth: 2015.” Harvard Business School.14 Patients Beyond Borders. “Medical Tourism Statistics & Facts.” October 2, 2017.
cessed fields of global renown: cardiovascular and orthopedic
services (See Image 1). Partnering hospitals, such as MedStar
Heart Institute in D.C., gain a competitive edge, access to exper-
tise, and research opportunities by partnering with the Cleveland
Clinic, while the Clinic can extend institutional “brands across the
Image 1: Geographic Expansion of Cleveland ClinicSource: Cleveland Clinic
2
7

MAXINE GOODMAN LEVIN COLLEGE OF URBAN AFFAIRS
15 Packer-Tursman, J. “One network to rule them all: The future of Mayo, Cleveland Clinic hospital affiliates.” Healthcare Dive. July, 2014. 16 Snowbeck, C. “Mayo Clinic in race for Florida patients.” Star Tribune. May, 2016.17 Knowledge@Wharton. “Cleveland Clinic’s Delos M. Cosgrove: ‘We are in Abu Dhabi to Help a Country Shape its Healthcare Delivery System’.” March, 2011.18 Masterson, L. “Cleveland Clinic involved in deal to open China hospital.” Healthcare Dive. August, 2017.19 Personal interview. Feb., 2017.20 Katzman, I. “8 Lessons from the Care Path: Insights on a Leading Cleveland Clinic Value Initiative.” Consult QD. July, 2015.21 Keehan, S. et al. 2017. National Health Expenditure Projections, 2016–25: Price Increases, Aging Push Sector To 20 Percent Of Economy. Health Affairs, 36, p. 26-36.22 Chatterji, A. “The Bad News for Local Job Markets.” The New York Times. October, 2013. 23 Coutre, L. “University Hospitals at 150.” Crain’s Cleveland. May, 2016.
U.S. — and attract national employer contracts — without bearing
costs associated with actual acquisitions.”15
Another strategy of geographic expansion is to go beyond part-
nering and actually operating a facility in another region of the
country. “You’re beginning to see people leapfrogging outside
of their immediate service areas,” explains a Standard & Poor’s
analyst.16 “[There’s] this whole sense that people need to get big-
ger, and want to put their stake in the ground in more places,
because they want a bigger funnel back to the mothership.” The
piece explains the thought behind establishing the Cleveland Clin-
ic Florida in Weston, a full-service hospital just west of Ft. Lauder-
dale, with the rationale being to go where the aging population is
growing in order to provide care where it is not only needed, but
where customers have the means to pay.
This geographic expansion strategy extends to internation-
al outposts, like the newly-opened Cleveland Clinic Abu Dhabi.
Cleveland Clinic CEO Toby Cosgrove described the genesis of in-
ternational expansion, noting that after 9/11 the patient flow to
Cleveland from the Middle East slowed.17 “So we began to think,
perhaps we should go where our patients were,” he said. The
Clinic’s latest addition to its international network will be in Lon-
don, with construction of a 205-bed specialty clinic overlooking
the Buckingham Palace. Other international outposts are current-
ly in the works, including one in Shanghai.18
What’s beginning to occur in the healthcare industry—with Cleve-
land a main player—is it’s scaling, with the nation’s top medical
centers integrating less-resourced and -renowned facilities into
their respective systems, or building new systems in high-de-
mand, affluent areas. Dubbed the “Healthcare Hunger Games”
by one local expert19—referencing the likelihood the nation will
be served by a few hospital brands in the future—the mechanism
behind the movement is about efficacy and cost, or about the
industry being able to deliver a better product more efficiently and
affordably. Here, healthcare is following the path that other sec-
tors, such as agriculture and manufacturing, laid before it. Think
Ford’s assembly line revolution reducing the cost of a car. Except
in this case the product includes things like knee replacements,
and the assembly line—using the Cleveland Clinic’s own terminol-
ogy—is called a “care path.”20
This push to efficiency isn’t going away. It is estimated healthcare
will comprise nearly 20% of the national GDP in the near future,21
up from 17% over the last few years (see Figure 8). By contrast,
the remainder of the world’s economies spend less than 10% of
GDP on healthcare costs. Simply put, innovation in healthcare is
needed, and it’s increasingly in the national interest to incentive
efficiency gains via scaling, in effect creating an industry environ-
ment “of winners and losers observed in other industrial sectors,
as top…hospitals become larger and absorb most of the increase
in…patients from across the nation,” notes former White House
economist Aaron Chatterji.22
Echoing that sentiment is CEO of Cleveland-based University Hos-
pitals Thomas Zenty, who in discussing UH’s strategy of creating
a “super-regional system” that has expanded the geographic foot-
print beyond their main campus, noted the need of “building to
scale, which is important to reduce cost.”23
Image 2: Source: Cleveland Clinic
8

MAXINE GOODMAN LEVIN COLLEGE OF URBAN AFFAIRS
“I think you’re going to have to begin to understand that you’ve
got to consolidate the healthcare delivery system,” reaffirms the
Cleveland Clinic’s Cosgrove. “And if you look at every other in-
dustry in the United States, you’ve seen consolidation of those
industries for efficiency.”24
So, can Pittsburgh and steel, Detroit and cars, Silicon Valley and
tech, become Cleveland and health? It’s an open, if admittedly
aspirational, question. At the very least, the tradability of health-
care services in Cleveland has played a role in the creation of a
life science cluster locally, and it’s a cluster of increasing national
importance. Yet a strategy to leverage this “healing” economy is
needed. This involves strategizing within industries that both feed
it (research and development), and flow from it (health informa-
tion technology and healthcare analytics).
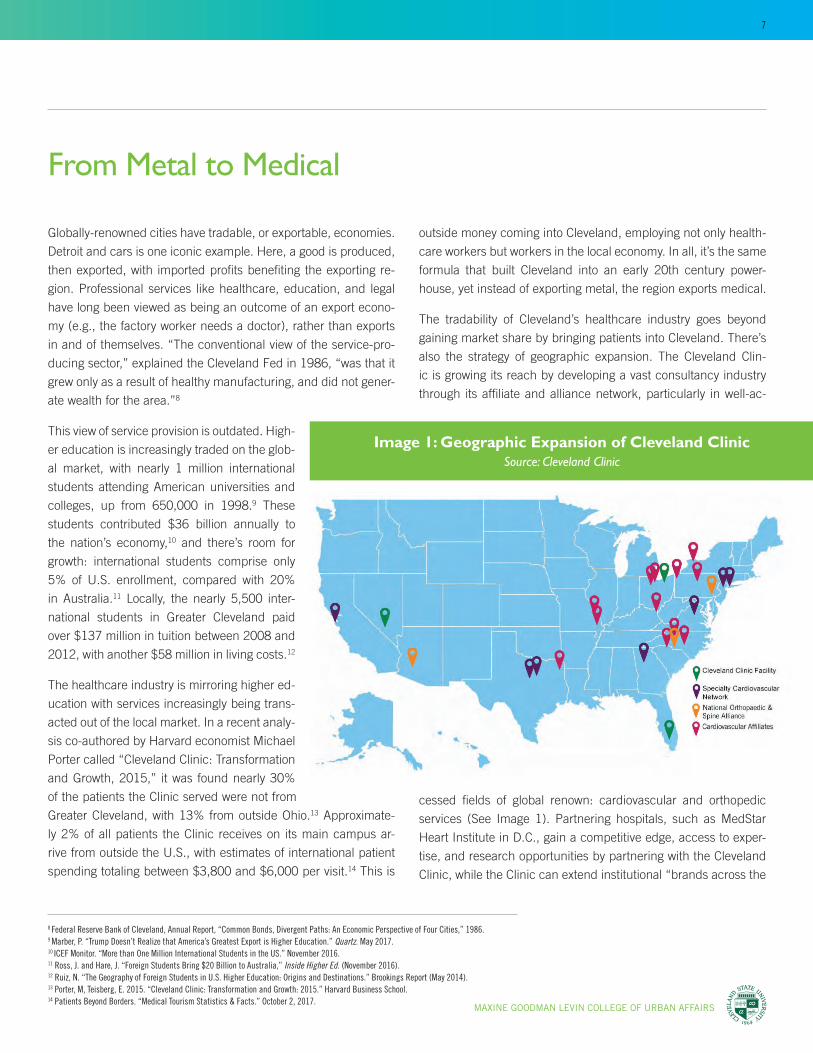
In 2016, institutions in the City of Cleveland received about $284
million dollars in R&D funding from the National Institute of Health
(see figure 9). The vast majority of that funding went to University
Hospital’s Case Western Reserve University School of Medicine,
which ranked twenty-seventh among American medical schools
in NIH funding; and the Cleveland Clinic Lerner College of Med-
icine, which ranked forty-fifth (see Figure 10). Combined, those
institutions drove Cleveland’s 22nd-place ranking out of the some
900 cities that received NIH funding in 2016. Boston ranked first,
totaling over $1.85 billion in funding.
While Cleveland performed well nationally, a case can be made
that the region is punching below its weight in R&D funding.
When Smokestacks Chase: The Importance of R&D
6
8
10
12
14
16
18
1995 1996 1997 1998 1999 2000 2001 2002 2003 2004 2005 2006 2007 2008 2009 2010 2011 2012 2013
% o
f GD
P
Figure 8: Health Expenditure, total (% of GDP). Source: World Health Organization Global Health Expenditure Database
United States World
Figure 8: Health Expenditure, total (% of GDP)
Source: World Health Organization Global Health Expenditure Database
Recall the counties of Cuyahoga (Cleveland), Philadelphia, and
Boston all ranked tops in the concentration of health science
workers, yet Cleveland is far behind those cities in medical re-
search funding, indicative of a local divide between the practice of
healthcare, termed a “knowledge cluster,” and the production of
healthcare research, termed a “knowledge hub.”
Unpacking the distinction further, knowledge clusters are groups
of organizations that are production-oriented and have the
organizational capability to drive innovations and create new
industries.25 Such clusters are the “downstream” effect of knowl-
edge. Conversely, knowledge hubs are the “upstream” driver of
innovation, described as nodes in networks of knowledge produc-
24 Bloomberg Markets, “Toby Cosgrove on Obamacare, Drug Prices, Tom Price.” (aired December 8, 2016). 25 Hans-Dieter Evers, “Knowledge Hubs and Knowledge Clusters: Designing a Knowledge Architecture for
Development,” ZEF Working Paper Series, no. 27 (2008).
9
1995 1996 1997 1998 1999 2000 2001 2002 2003 2004 2005 2006 2007 2008 2009 2010 2011 2012 2013
MAXINE GOODMAN LEVIN COLLEGE OF URBAN AFFAIRS
tion, knowledge sharing, and knowledge application.26 Developing
a knowledge hub in Cleveland is paramount to the region’s eco-
nomic viability.
The goal of economic development is prosperity, commonly mea-
sured by income per capita. A landmark Cleveland Fed study ex-
amined 75 years’ worth of state-level data and found three factors
predicted gains in per capita income: concentration of a popu-
lation that’s college educated, the industry mix of a region, and
levels of innovation.27 Importantly, each factor is influenced by a
city’s R&D intensity. A recent New York Fed paper noted that an
area’s concentration of R&D funding was strongly correlated with
the amount of college graduates in a region, whereas the number
of graduates local colleges produce was not.28 Why?
R&D, via innovation, influences the region’s industry mix, cultivat-
ing high-skill industries that demand knowledge workers, subse-
quently expressed as increased educational attainment rates and
income growth. Put another way, if there’s no new economy jobs,
college graduates leave, along with their salary. As such, R&D
matters, a lot. The issue now turns to how R&D manifests into
regional economic development.
A 2015 analysis “Killing the Golden Goose? The changing nature
of corporate research, 1980-2007,” Duke Economist Ashish Aro-
ra detailed how private industry has become less willing to main-
tain R&D capacity in-house.29 That’s because shareholders place
less value on scientific capability, and more emphasis on short-
term profit. Innovation thus shifted elsewhere, with academic in-BOSTON
NEW YORK
SEATTLE
PHILADELPHIA
BALTIMORE
LA JOLLA
LOS ANGELES
SAN FRANCISCO
CHICAGO
PITTSBURGH
HOUSTON
ANN ARBOR
DURHAM
CHAPEL HILL
SAINT LOUIS
STANFORD
NEW HAVEN
ATLANTA
NASHVILLE
CAMBRIDGE
MADISON
CLEVELAND
MINNEAPOLIS
BIRMINGHAM
COLUMBUS
Figure 9: City Rankings of Total NIH Funding. Source: Star Metrics
Figure 9: City Rankings of Total NIH FundingSource: Star Metrics
Figure 10: National Rankings of Cleveland-Based Medical Schools per NIH FundingSource: Blue Ridge Institute for Medical Research
27313126303030282623231922211416
454346485050515356534957
87
2001 2002 2003 2004 2005 2006 2007 2008 2009 2010 2011 2012 2013 2014 2015 2016
Figure 10: National Rankings of Clevland-Based Medical Schools per NIH Funding. Source: Blue Ridge Institute for Medical Research.
UH-Case Western Reserve University Cleveland Clinic Lerner Research Inst.
26 Ibid27 Cleveland Federal Reserve Bank of Cleveland, “Altered States: A Perspective on 75 Years of State Income Growth” (annual report. 2015).28 J. Abel and R. Deitz, “Do Colleges and Universities Increase Their Region’s Human Capital?” Journal of Economic Geography 12 (2012): p. 667-691.29 A. Arora, S. Belenzon, and A. Patacconi, “Killing the Golden Goose? The Changing Nature of Corporate Research, 1980-2007,”
NBER Working Paper Series, Paper 20902 (2105).
$284 MILLION
1.85 BILLION $
10
MAXINE GOODMAN LEVIN COLLEGE OF URBAN AFFAIRS
stitutions performing an estimated 75% of the nation’s basic and
applied research.30 Given R&D’s well-documented influence on
economic growth, the importance of academia is inarguable. The
issue has been explaining to politicians and purse-string holders
alike how exactly knowledge production impacts progress, partic-
ularly within those areas where it’s taking place.
The first impact is direct. “[A]lthough science is complicated, it
is not magic. It is productive work. Scientific endeavors employ
people,” notes one scholar.31 For every one employee in direct
research, there are 3.2 jobs created in the regional economy, and
whereas every dollar in research funding meant an additional
$2.90 in the local economy.32 So, the $284 million dollars Cleve-
land gained in NIH funding last year had an $816.5 million dollar
impact, a figure approximate to the value of the Cleveland Cava-
liers.
A second impact is through start-up formation, as R&D is the seed
corn of innovation. In fact, today’s “holy grail” of economic de-
velopment is job creation—as opposed to “smokestack chasing,”
or job attraction via subsidies given to companies—and this is
increasingly in the purview of academic institutions via the com-
mercialization of knowledge, or “technology transfer.”
Start-up formation, though, is associated with a third impact of
regional knowledge production, one less understood and dis-
cussed: the attraction of high-tech firms. Here, “smokestacks”
chase the city instead of the city chasing “smokestacks,” if only
because high-tech firms want to be in earshot of those institu-
tions where the best “upstream” knowledge is produced. “We find
that scientific capability continues to be important for innovation
but that large firms face lower incentives to develop significant
new products and processes internally, and have reduced their
investments in science,” concludes Ashish Aurora, the author of
“Killing the Golden Goose.” “[T]hey rely upon startups to develop
new inventions…[S]uch startups themselves rely…upon univer-
sity research.”
Pittsburgh is illustrative of a Rust Belt city the “smokestacks” are
chasing, and associated metrics are telling: the region ranks sixth
30 T. Ross, “The Real Value of Higher Education,” Raleigh (NC) News and Observer, March 2015.31 B. Weinberg et al., “Science Funding and Short-Term Economic Activity,” Science, 344 (2014): p. 41-43.32 Ibid33 Bureau of Economic Analysis, 1985, 2015.34 J. Copeland, “What is Artificial Intelligence?” AlanTuring.net, May 2000.35 C. Thompson, “Uber Would Like to Buy Your Robotics Department.” New York Times, September 11, 2015.
out of the top 40 metros in per capita income gains since 1985,
just after Seattle.33 As Cleveland doubled down on manufacturing
R&D in the 70s and 80s, Pittsburgh built an emergent knowledge
infrastructure at Carnegie Mellon University (CMU) in comput-
er science and robotics. Today, that R&D groundwork has blos-
somed, placing the region as a node in the world’s fastest-evolving
industries, particularly artificial intelligence (AI), or “the science of
making computers do things that require intelligence when done
by humans.”34
A brief, if necessarily simplified, look at the evolution of Pitts-
burgh’s robotics industry can elucidate. In 1979, CMU founded
its Robotic Institute: a site of basic research that tackled funda-
mental questions in the still-nascent field. By 1995, the region
had amassed enough knowledge capital to extend the line of
inquiry from basic to applied, at which point CMU opened the
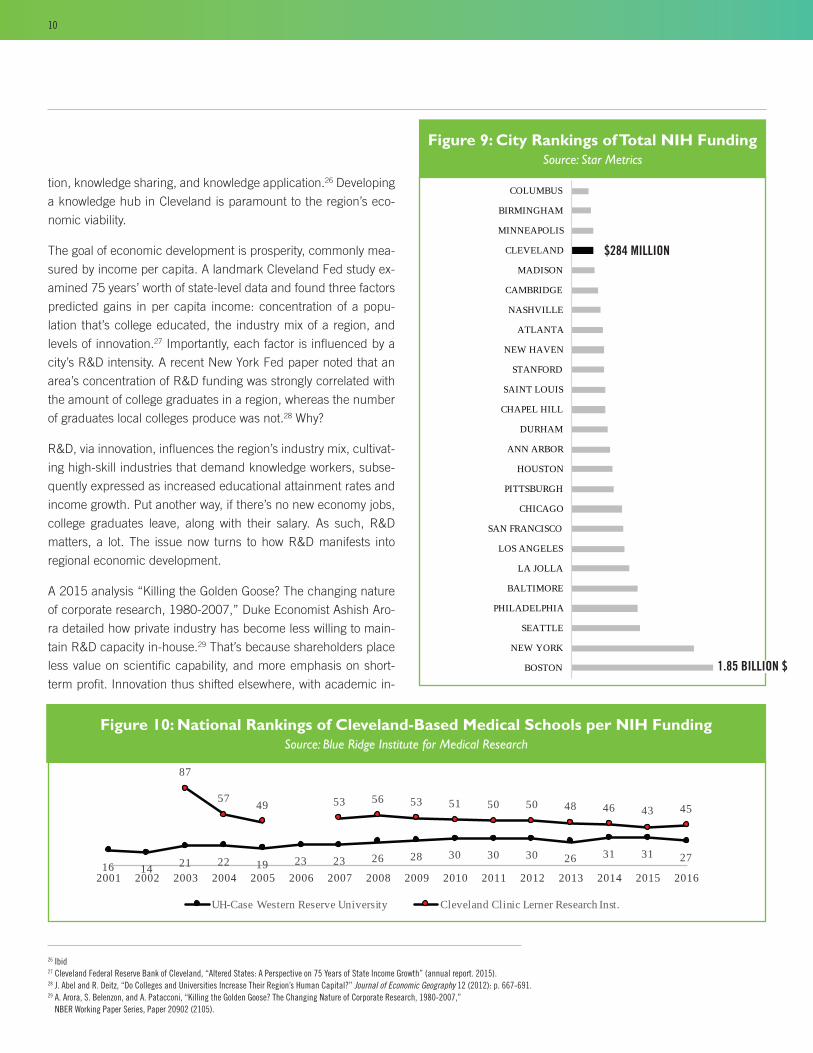
industry-backed National Robotics Engineering Center. A useful
concept called the Technology Readiness Level (TRL), developed
by NASA to gauge the maturity of a given field of science, is help-
ful in explaining the relationship between the basic and applied
arms of CMU’s robotic research. At Level 1, an area is so new that
no one understands its basic principles. At Level 9, technology
is ready to be used in commercial products. “In effect,” notes a
recent New York Times magazine piece, “Carnegie Mellon used
the NASA scale to carve up its robotics research. The Robotics
Institute would handle research from Levels 1 to 3 or 4, while
the center would take technology from there and move it to 7.”35
It was after Level 7, then, that “smokestacks” begin chasing.
Image 3: Technology Readiness Level
11

MAXINE GOODMAN LEVIN COLLEGE OF URBAN AFFAIRS
In 2015 the tech firm Uber—in its race to operationalize auton-
omous vehicles—established an R&D center in Pittsburgh, the
Uber Advanced Technologies Group, in partnership with CMU’s
National Robotics Engineering Center. More recently, some of
Uber’s top engineers—who were poached from CMU’s robotics
center—created Argo AI: a start-up that Ford recently invested
$1 billion in their commitment to have autonomous vehicles on
the road by 2021.36 Not to be outdone is Intel, which was re-
cently propelled to the forefront of autonomous vehicle technology
with its $15 billion-dollar purchase of Jerusalem-based Mobileye
which, in turn, has partnered with Pittsburgh-based Delphi, who
itself purchased a Carnegie Mellon University spin-out company,
Ottomatika, in 2015.37
In all, the knowledge hub Pittsburgh built decades back paid off,
with a cluster of high-tech firms evolving. “Since 2011, artificial
intelligence has become a mainstream industry in its own right...,”
explained Andrew Moore, the dean of CMU’s School of Computer
Science. “Suddenly, Pittsburgh finds itself as one of only five sig-
nificant cities in the world with massive capital around this. We’re
up there with the Bay Area, Boston, Zurich and Beijing.”38
Cleveland’s position as a clinical care cluster is undeniable. Health
professionals come to Cleveland to learn care and patients come
to receive it. Yet America’s most productive knowledge economies
aren’t only “hands on” but “eyes up,” the latter tied to the extent a
region is engaged in “blue sky” research. Cleveland has the basic
infrastructure from which to build a knowledge hub as evidenced
by its top 25 ranking in NIH funding since 2009 (see Figure 11).
But approaching the likes of Boston and Philadelphia will require
a cohesive, far-reaching strategy, one largely aimed at targeting
and endowing researchers, ideally in emergent fields. This would
in part entail methodically supplementing publicly-funded “down-
stream” innovation (start-up formation and tech transfer) with in-
vesting in “upstream” innovation (funding R&D).
Texas, for example, has recently invested $250 million in attract-
ing the top cancer researchers to its universities. “It is part of a
strategy to make Texas a clear leader in studying cancer,” with the
goal not only to attack one of humanity’s most devastating diseas-
es, but also bolster the state’s economy. In some respects, this is
nothing new: the poaching of star scientists. “What is new,” said
C. Michael Cassidy, president and chief executive officer of the
Georgia Research Alliance, “is doing it as a broad economic-de-
velopment strategy.”39
This strategy basically involves the funding of R&D as a requisite
front-end investment, with the end product a regional ecosystem
that acts as a “black hole” for talent and capital. In the nascent
days of biotech, for instance, it was found those regions with star
scientists in the field emerged as industry cluster winners, if only
because “knowledge…at least when it is new, is embodied in par-
ticular individuals; [and so] it cannot diffuse rapidly.”40
That said, there’s considerable uncertainty as to what areas of
R&D Cleveland should focus on. That is, biotech, pharmaceuti-
cals, medical devices, and other product-oriented fields are well
situated in other locales, making a play on such areas ill-advised
from a strategic standpoint. “Pursuing a traditional tradable model
in devices, drugs, and products might be too costly and too late,”
explains one local industry insider. “We must set new models, a
new future.”41 Which brings to mind a quote by the hockey great
Wayne Gretzky, who said: “I skate to where the puck is going to
be, not where it has been.”
Figure 11: City of Cleveland Ranking by NIH Funding, 2009-2016Source: Blue Ridge Institute for Medical Research
23 24 23 23 23 24 24 23
2009 2010 2011 2012 2013 2014 2015 2016
Figure 11: City of Cleveland Ranking by NIH Funding, 2009 -2016. Source: Blue Ridge Institute for Medical Research.
36 A. Auperlee, “Pittsburgh Self-Driving Car Startup Argo to be Based in Strip District.” Pittsburgh Tribune, February 23, 201737 Associated Press. “Intel Drops $15B on Mobileye in Race for a Driverless Future.” March, 2017.38 T. Schooley, “Pittsburgh Lauded as One of World’s Great Robotics Centers,” Pittsburgh Business Times, January 12, 2016.39 P. Basken, “Boom in Academic Poaching Is Fueled by Visions of Economic Development,” Chronicle of Higher Education, July 23, 2015.40 L. Zucker, and R. Darby, “Entrepreneurs, Star Scientists, and Biotechnology,” NBER Working Paper Series (1998).41 Personal interview, Request of anonymity, May 2016.
12

MAXINE GOODMAN LEVIN COLLEGE OF URBAN AFFAIRS
Having a long view forward means having a long view back. A na-
tion’s—and region’s—economy can be divided into four sectors,42
with the proportion of employment in each tied to where it’s at
on its continuum of economic restructuring. There is the primary
sector, which is resource-extraction based and associated with
pre-industrialization (See Image 4). America’s agrarian economy,
for instance, employed upwards of 70% of people before the In-
dustrial Revolution. That revolution produced the goods-produc-
ing secondary sector, which itself employed upwards of 40% of
Americans at its peak. Then came the tertiary sector, or the area
of service provision that employs the bulk of the U.S today. This is
where most of the healthcare industry fits. Lastly is the quaternary
sector: a breakoff of the tertiary sector devoted to knowledge pro-
duction, aka the “information economy.” At the most basic level
analysis, then, the quaternary sector is where the puck is going.
But there’s more to it than that, because the puck is now going
faster into places it has never before been, all due to the fact that
technology has gotten so good. Specifically, data used to be a
byproduct of the tertiary service sector: you bought a t-shirt and
the credit card company recorded the transaction, you went to
the doctor and the insurance company recorded the transaction,
Where the Puck is Going
Image 4: The Four Sectors of the Ecomony
and so on. With advances in data collection, storage, and analysis,
however, the data of the transaction itself is the source of much of
the added value in the world.
Explains Peter Sondergaard, senior V.P. of the insight analyst firm
Gartner Research: “Information is the oil of the 21st century, and
analytics is the combustion engine.” 43
“The most important…technology of our era is artificial intelli-
gence, particularly machine learning,” echoes MIT’s Erik Bryn-
jolfsson and Andrew McAfee, noting artificial intelligence (AI) will
change the way we live and the forms our cities take, not unlike
how the combustion engine gave “rise to cars, trucks, airplanes,
chain saws, and lawnmowers, along with big-box retailers, shop-
ping centers, cross-docking warehouses, new supply chains, and,
when you think about it, suburbs.”44
Cities that have economically restructured beyond the secondary
economy—or the production of a good for consumption’s sake—
and beyond the tertiary economy—or the provision of service for
service’s sake—and into the quaternary economy—or the mining
of data capital from a good or a service for innovation’s sake—are
the ones that will be tomorrow’s economic powerhouses.
Why AI and why now? One reason is that the basic science of AI
is maturing, meaning the technology itself is readying for launch.
With that, AI has changed the rules of the game, particularly how
information is processed and knowledge is made. Simply, the old
way involved programming computers with codified knowledge, or
knowledge that can be broken down into steps. Yet this codified
approach had “a fundamental weakness” notes Brynjolfsson and
McAfee, because much of the knowledge people have is tacit,
meaning that we can’t fully explain it.45 The fact we know more
than we can tell not only limits how humans learn, it has also
restricted the ability of machines to learn, which has limited the
activities machines could perform.
42 The four sector model is a revision to the original Three-Sector Theory developed by theorists Allan Fisher, Colin Clark, and Jean Fourastié.43 Gartner Press Release. “Gartner Says Worldwide Enterprise IT Spending to Reach $2.7 Trillion in 2012.” October 17, 2011. 44 E. Brynjolfsson, A. McAfee, “The Business of Artificial Intelligence.” Harvard Business Review. July 2017.45 Ibid.
13

MAXINE GOODMAN LEVIN COLLEGE OF URBAN AFFAIRS
But things have changed. “Machine Learning represents a funda-
mentally different approach to creating software,” explains Bryn-
jolfsson and McAfee. “The machine learns from examples, rath-
er than being explicitly programmed for a particular outcome.”46
Think of machine learning, then, as a machine that can learn,
absent some constraints of human input.
Now, which industries have seen the largest advances in digitiza-
tion and are most primed for adding value? According to a 2015
McKinsey report, the most digitized industries include information
technology, media, and finance, while areas of “medium digitiza-
tion” include advanced manufacturing, wholesale trade, and retail
trade. The laggard sectors of digitization are hospitality, construc-
tion, and—you guessed it—health care.47
In the case of healthcare, why is that? Insight can be found in
the “cost disease theory” developed by William Baumol, an NYU
economist. Historically, hospital productivity has grown more
slowly than the overall economy, which helps explain why the na-
tion’s health care costs have taken up ever-larger shares of overall
spending. This lack of productivity is associated with the low-lev-
els of digitization in the sector. As to why, the cost disease theory
“asserts that productivity growth in health care is inherently low
for the same reason it is in education: Productivity-enhancing
technologies cannot easily replace human doctors or teachers.”48
In contrast with, say, manufacturing, there are far fewer machines
that can step in and outperform doctors and other healthcare pro-
fessionals, given that these industries are flush with tacit knowl-
edge, (e.g., you don’t learn to be a heart surgeon or nurse by read-
ing a manual, but by observing a great heart surgeon or skilled
nurse).
Nonetheless, there are various ways hospital systems can “trim
fat.” The Cleveland Clinic’s “care path,” assembly-line strategy is
an example that achieves efficiency gains via coordinated care.
Consider it a service-based, process approach, one the Clinic aims
to scale. Yet the biggest gains in healthcare productivity will arise
from technology, despite the longstanding difficulties in digitizing
the sector. This is occurring in component parts, beginning with
the process of digitizing health information via electronic medical
records. Here, Cleveland has a toehold with Explorys, a Cleveland
Clinic spin-off purchased by IBM. Their software is now used in
over 400 hospitals, encompassing a data set of fifty million lives.
That data, aka “big data,” is raw material for IBM’s supercom-
puter Watson of Jeopardy fame. IBM Watson creator John Kelly
explained the cognitive-computing49—Watson had no “inherent
intelligence” to start with and was essentially “a child.” “But as
it’s given data and given outcomes, it learns,” Kelly continued,
“which is dramatically different than all computing systems in the
past, which really learned nothing. And as it interacts with hu-
mans, it gets even smarter. And it never forgets.”50
This brings us to the other component in the digitization of health-
care for productivity sake: making knowledge out of information,
largely through the feeding of data into algorithmically-construct-
ed learning machines.
To recap: the means to the end is productivity in healthcare, with
the end better health care for people at lower cost. To get there
requires better data via health information technology, which fuels
better knowledge via artificial intelligence. Where does Cleveland
fit into this productivity-big data-artificial intelligence landscape?
Mapping this can inform where the region should invest when it
comes to developing its R&D capacity.
Generally, there are a few basic areas in play, starting with the
two components just discussed: health information technology
and artificial intelligence. To find what areas of the nation are
consolidating life science-related R&D funding in these fields, the
current analysis ranks cities by the frequency of grants received
46 Ibid. 47 J. Manyika, et al., “Digital America: A Tale of the Haves and Have-Mores,” McKinsey Global Institute Report, (2015).48 A. Frakt, “Obamacare’s Big Gamble on Hospital Productivity,” New York Times, May 25, 2015.49 The basic differences between AI and cloud computing are that in an artificial intelligence system, the system would have told the doctor
which course of action to take; whereas in cognitive computing, the system provides information to help the doctor decide.50 CBS News, “Artificial Intelligence Positioned to be a Game-Changer,” 60 Minutes, (aired October 9, 2016).
14

MAXINE GOODMAN LEVIN COLLEGE OF URBAN AFFAIRS
51 “Big data” is a common term that’s the proxy for modern large-scale data sets, or the digitization part of health IT. “Algorithms” is a common term used to analyze these data sets, or the basic science component of AI/machine learning.
52 N. Leigh and B. Kraft, “Emerging Robotic Regions in the United States: Insights for Regional Economic Evolution.” Regional Studies (2017), doi : 10.1080/00343404.2016.1269158
53 Ibid.
from Department of Health and Human Services (HHS) using two
search terms: “big data” and “algorithms.”51 Between 2008 and
2016, there were approximately 32,000 “big data”/“algorithm”
projects funded by HHS, representing only 4.5% of the agency’s
grants during that period. In other words, the lack of digitization
in healthcare services is also prevalent in the field of healthcare
research. Which locales are filling the void? Boston was 1st with
2,500 projects funded, and neighboring Cambridge was 14th.
Also accumulating knowledge capital in healthcare analytics were:
New York City, Los Angeles, Seattle, La Jolla, Baltimore, Phila-
delphia, Pittsburgh, and the Bay Area, particularly San Francisco
and Stanford. Cleveland garnered 289 grants, tying the Mayo Clin-
ic-based Rochester, MN for 27th nationally (see Figure 12).
Determining the likelihood of Cleveland moving up these rankings
entails inferring why the likes of Boston, Pittsburgh, and the Bay
Area are there in the first place. Recall the case of Pittsburgh. In
the late 1970s the region invested in a research infrastructure
centered on robotics. Boston’s and the Bay Area’s infrastructure
predates that, with the advent of computer science arising in the
1950s. Hence, the cities accumulating computer science capi-
tal in healthcare are places that have amassed industry-agnostic
capital over the last half century, which—in the case of Cleve-
land—means running a race where the opponents have a vast
head start. To that end, investing in Cleveland to become a com-
puter science hub in health—or any sector for that matter—isn’t
necessarily strategic, given the computer science R&D cemented
elsewhere. This doesn’t mean Cleveland has no strategic play in
healthcare analytics. It just means the region must pinpoint where
exactly its assets fit in the quickly-evolving field.
In terms of assets, Cleveland has historically been a place of do-
ing, or of taking basic knowledge and applying it. For example,
a recent study called “Emerging robotic regions in the United
States: insights for regional economic evolution” categorized the
Figure 12: City Ranking of “Big Data”/ “Algorithm” Projects Funded by Department of Health and Human Services, 2008 to 2016
Source: Star Metrics via Federal Reporter
289
0 500 1000 1500 2000 2500
BostonNew York
Los AngelesSeattle
La Jolla, CABaltimore
PhiladelphiaPittsburgh
StanfordSan Francisco
HoustonChicago
Ann ArborCambridge
Durham, NCSt. Louis
Chapel HillNashvilleMadison
AtlantaNew Haven, CT
PortlandSalt Lake City
MinneapolisBerkeley
Irvine, CACleveland
Rochester, MNColumbus
Rochester, NY
Figure 12: City Ranking of “Big Data”/”Algorithm” Projects Funded by Department of Health and Human Services, 2008 to 2016. Source: Star
Metrics via Federal Reporter.
nation’s robotics industry between those region’s that research
and design (i.e., knowledge hubs), and those regions that retrofit
and deploy robots (i.e., knowledge cluster).50 Expectedly, Pitts-
burgh’s place was as a robotics hub, described as “an analyti-
cally dominant environment in robotics…where researchers are
developing a novel AI algorithm or neural network architecture.”
By contrast, Cleveland—which the study found had the 2nd most
jobs in the robotics sector nationally—was a cluster, described as
a region that’s “integrating robots into a production system on the
shop floor.”53
Is that good or bad? In terms of employment, it’s good for Cleve-
land, as the region has ten times the employees in robotics as
Pittsburgh. In terms of value add, however, it’s less ideal. Return-
ing to the analogy of where the puck is going, Pittsburgh’s place in
robotics is in the knowledge-producing quaternary sector, which
15

MAXINE GOODMAN LEVIN COLLEGE OF URBAN AFFAIRS
has upward trajectory. Cleveland’s place is in the goods-produc-
ing secondary sector, which has a declining trajectory. Combine
this with the fact that centers of knowledge production act as a
magnet for new economy firms, the advantages between the cities
are clear.
The differences in the regions’ robotic sectors largely play out in
the healthcare sector: Cleveland excels in healthcare service pro-
vision, while Pittsburgh leads in life science R&D. Yet there is an
inter-medium in healthcare that historically gets short shrift called
“translational research,” described as a “bench-to-bedside” pro-
cess which entails “translating research into practice…[or] ensur-
ing that new treatments and research knowledge actually reach
the patients or populations for whom they are intended and are
implemented correctly.”54 It’s arguably here that Cleveland excels
from an R&D capacity standpoint, as evidenced by the city’s 18th-
place ranking in “translational research” projects funded from
HHS—just ahead of Duke University-based Durham, NC (see Fig-
ure 13). The question becomes: Is translational research an area
the region should strategically invest? The short answer is “yes.”
But the short answer isn’t enough.
In 2011, IBM’s Watson began a stint as a medical student at the
Cleveland Clinic Lerner College of Medicine of Case Western Re-
serve University.55 While describing how Watson learns is beyond
the scope of this paper, it’s enough to say that Watson trained like
any medical student. Watson reads medical studies and pours
over patient notes, medical images, and electronic medical re-
cords, with several IBM-acquired health IT firms, including Ex-
plorys, feeding it data on 300 million patient lives. The endgame
is to make Watson a very smart assistant to aid in diagnosis and
treatment, yet this assistant would have the information of mil-
lions of experts in numerous fields, and its knowledge would be
current. The amount of medical data doctors can use to impact
care will double every 73 days by 2020. “By allowing Watson to
crunch and cross-reference data and patient information,” notes
the Cleveland Clinic’s Toby Cosgrove, “human doctors will have
1194
0 1000 2000 3000 4000 5000
New York
Boston
Philadelphia
Baltimore
Los Angeles
Houston
Chicago
San Francisco
Seattle
La Jolla, CA
Pittsburgh
Ann Arbor
Chapel Hill
Nashville
Atlanta
St. Louis
New Haven, CT
Cleveland
Durham, NC
Birmingham
Stanford
Aurora, CO
Madison
Rochester, MN
Portland
Minneapolis
Rochester, NY
Iowa City
Charleston, SC
Figure 13: City Ranking of “Translational Research” Projects Funded by Department of Health and Human Services, 2008 to 2016.
Source: Star Metrics via Federal Reporter.
Figure 13: City Ranking of “Translational Research” Projects Funded by Department of Health and Human Services, 2008 to 2016
Source: Star Metrics via Federal Reporter
more time to spend with patients – talking to them, listening to
them, understanding them.” This freeing of time will lead to an
industry that is not only more productive, but also “less robotic
and more human,” explains Cosgrove.56
54 E. Wehling. Principles of Translational Science in Medicine: From Bench to Bedside. (Cambridge, UK: Cambridge University Press, 2009).55 S. Lohr, “I.B.M.’s Watson Goes to Medical School.” New York Times. October 30, 2012.56 T. Cosgrove, “A Computer that Allows Doctors to be More Human.” Consult QD, July 2016.
16

MAXINE GOODMAN LEVIN COLLEGE OF URBAN AFFAIRS
Progress on this front is slow, however. In the recent MIT Technol-
ogy Review piece “A Reality Check for IBM’s AI Ambitions,”57 the
author explains that the current problem holding Watson and oth-
er AI systems back is that certain types of data are needed for ma-
chines to learn. But healthcare data commonly doesn’t exist in the
right format. “Health care has been an embarrassingly late adopt-
er of technology,” affirms Manish Kohli, a physician and health-
care informatics expert. The solution lies in close partnerships
with large health-care organizations, “or getting Watson inside a
wide range of medical centers…which are positioned to provide
the critical data needed to shape AI’s future in medicine.”58
Enter the recent announcement of a 5-year agreement between
the Cleveland Clinic and IBM aimed at expanding the Clinic’s IT
capabilities. It effectively embeds IBM into the hospital so as to
create a health IT process that plugs the data gap. The agreement
is a two-way street: data scientists will translate their needs to
healthcare professionals regarding the data needed, while health-
care professionals will translate the tacit knowledge they have to
enliven that data. Importantly, just like Cleveland deploys the in-
dustrial robots Pittsburgh designs on the shop floor, it’s in the pro-
cess of translating the basic science of AI in its hospital settings.
What do these developments mean for the future of Cleveland’s
economy? Finding the answer entails examining the extent health
IT work in Cleveland produces knowledge or facilitates a service.
That is, is the health IT landscape in Cleveland tertiary (“puck
been”) or quaternary (“puck going”)? And if it’s the former how do
we leverage it into the latter?
Innovation Through DisparityHeadlines abound that this or that city is the “next Silicon Valley,”
with the stories invariably discussing the number of start-ups or
tech jobs a geography is producing. But tech in itself is less an
industry than a tool deployed in other industries to better a good
or service. Think tech in journalism that makes online what was
once in print. Here, the “new economy” isn’t new, rather just de-
creasing the cost of pretty old work. That frequently happens in
healthcare, as tech is being used to better healthcare services.
That’s not unwelcome. Better healthcare services means healthier
people and less waste for the populace. It’s also advantageous for
a given hospital system: a better product means a better brand
and thus wider customer base.
Recall, though, that it’s not the good or service that provides the
value add, but the data capital derived from that good or service.
For example, people think of Uber as a taxi business, but its driv-
ers are actually data collectors of road conditions, with that data
then used to feed its autonomous vehicle research in Pittsburgh.
IBM, too, is no longer a firm that makes business machines and
then services them. It’s an aspiring data capital company that
makes “data plays” in given industries, including health. One big
data play is in Cleveland, and while that has created the potential
for a health IT cluster locally—with hundreds of healthcare ana-
lytics jobs in the offing—the data mined here is being “pipelined”
to the world-class research hub that’s Cambridge: home of IBM
Watson Health. In other words, the knowledge produced in Cam-
bridge is off the backs of services rendered in Cleveland.
Cleveland can do better. It must find a way to keep the added
value of the data mined “in house” so as to evolve from a largely
secondary and tertiary economy to quaternary one. The main way
to do this is leverage the fact that Cleveland is a node in a net-
work of cities advancing one of the most important fields in the
world: healthcare analytics, with the goal to grow a R&D hub off its
healthcare and health IT clusters. To get there means strategizing
around assets like translational research, but doing so in a field
capable of rendering first mover advantages. The field proposed
in the current analysis—which is by no means exhaustive—is the
artificial intelligence (AI) of population health, particularly the AI
of disparities.
57 D. Freedman, “A Reality Check for IBM’s AI Ambitions.” MIT Technology Review (June, 2017).58 Ibid.
17
MAXINE GOODMAN LEVIN COLLEGE OF URBAN AFFAIRS
Why healthcare disparities? A nation’s and region’s gross domes-
tic product (GDP) is a function of two forms of capital: intangible
capital (as measured by knowledge creation and human potential)
and tangible capital (as measured by physical infrastructure and
equipment, inventories, and natural resources). By the 1970s, the
stock of America’s intangible capital overtook tangible capital as
the main driver of GDP growth.59 Intangible capital itself is created
two ways: (1) investments in knowledge production via education
and R&D and (2) investments geared to people’s physical state,
or one’s health. Peoples’ physical state, though, has been over-
looked as a determinant of productivity, despite research showing
that increased life expectancy has a pronounced positive effect
on economic development, even relative to education.60 In fact,
estimates project that the effects of chronic diseases will cost the
U.S. $794 billion per year in lost productivity between 2016 and
2030,61 whereas premature death due to health inequalities will
cost another $309.3 billion.62 These figures are staggering (over
$1 trillion lost annually), yet efforts to fix the issue—particularly
through the lens of economic development—have been limited.
Put another way: economic development jargon has continually
harped on the notion of “brain gain” and “brain drain,” e.g., what
can cities do to attract and retain talent—yet little thinking has
been on “brain waste,” particularly related to the limited capacity
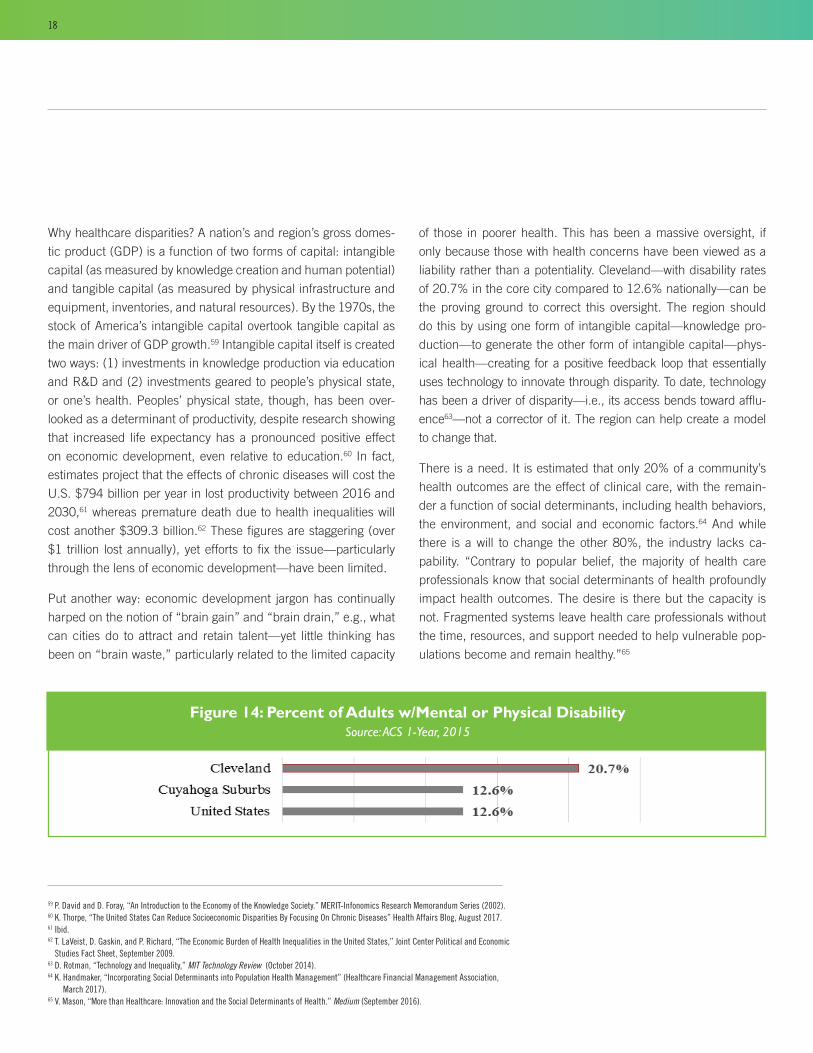
of those in poorer health. This has been a massive oversight, if
only because those with health concerns have been viewed as a
liability rather than a potentiality. Cleveland—with disability rates
of 20.7% in the core city compared to 12.6% nationally—can be
the proving ground to correct this oversight. The region should
do this by using one form of intangible capital—knowledge pro-
duction—to generate the other form of intangible capital—phys-
ical health—creating for a positive feedback loop that essentially
uses technology to innovate through disparity. To date, technology
has been a driver of disparity—i.e., its access bends toward afflu-
ence63—not a corrector of it. The region can help create a model
to change that.
There is a need. It is estimated that only 20% of a community’s
health outcomes are the effect of clinical care, with the remain-
der a function of social determinants, including health behaviors,
the environment, and social and economic factors.64 And while
there is a will to change the other 80%, the industry lacks ca-
pability. “Contrary to popular belief, the majority of health care
professionals know that social determinants of health profoundly
impact health outcomes. The desire is there but the capacity is
not. Fragmented systems leave health care professionals without
the time, resources, and support needed to help vulnerable pop-
ulations become and remain healthy.”65
Figure 14: Percent of Adults w/Mental or Physical DisabilitySource: ACS 1-Year, 2015
2
59 P. David and D. Foray, “An Introduction to the Economy of the Knowledge Society.” MERIT-Infonomics Research Memorandum Series (2002).60 K. Thorpe, “The United States Can Reduce Socioeconomic Disparities By Focusing On Chronic Diseases” Health Affairs Blog, August 2017.61 Ibid.62 T. LaVeist, D. Gaskin, and P. Richard, “The Economic Burden of Health Inequalities in the United States,” Joint Center Political and Economic
Studies Fact Sheet, September 2009.63 D. Rotman, “Technology and Inequality,” MIT Technology Review (October 2014).64 K. Handmaker, “Incorporating Social Determinants into Population Health Management” (Healthcare Financial Management Association,
March 2017).65 V. Mason, “More than Healthcare: Innovation and the Social Determinants of Health.” Medium (September 2016).
18

MAXINE GOODMAN LEVIN COLLEGE OF URBAN AFFAIRS
How can Cleveland lead the way to fill this void? The first step is
collective awareness, or knowing the unique position Cleveland is
in regarding thought leadership in the field of health disparities.
That’s because Cleveland has healthcare institutions and medi-
cal schools—University Hospitals, Case Western Reserve Univer-
sity, the Cleveland Clinic, Cleveland State University’s Center for
Innovation in Health Professionals, and MetroHealth Hospital—
neighboring communities where health disparities are rampant.
Life expectancies in the neighborhoods of Glenville and St. Clair
Superior, for instance, are ten to twelve years less than nearby
suburbs.66 Again, this landscape is one of potentiality not liability,
as services rendered to neighborhood residents are a source of
data capital that can be used to create knowledge.
Developing strategies to build this knowledge will follow this ini-
tial step. This involves two tasks: understanding the data archi-
tecture that comprises the “other 80% of health” i.e., the social
determinants. The other involves the
development of algorithms that evolve
as information is fed into them. That
is, the context feeds the algorithms in
order that the algorithms inform the
context. The goal here is not so much
preventative medicine via a change in
individual behavior, rather a systemic
change in population health that pre-
vents disparities by predicting them in
advance of their occurring.
Importantly, once that process is in
place, it can be exported as a service
to produce productivity in communi-
ties worldwide. “Interestingly, health-
care is a unique industry which can
provide both tradable and nontrad-
able output,” explains one industry
insider, “therefore creating a potential
positive feedback loop that can pro-
vide sustainable growth to a region in
terms of economic development. Cleveland is well positioned to
become the model of a hybrid tradable and nontradable health-
care industry, particularly in modern products such as knowledge,
services, and intelligence that have higher premiums compared to
pharmaceuticals and devices, which inevitably faces commoditi-
zation and potential cycle decline.”67
“Now, ‘health’ might not be our best industry. We have an in-
dustry to treat the sick - it is disease, not health management,”
notes the insider, explaining that the region’s health export model
is centered on diagnosis and treatment. “What we miss is to add
technology to our model to make it expandable and to focus and
develop the ‘health’ part of healthcare — here comes commit-
ment to eliminate health disparity.”
If successful, Cleveland can move up the knowledge hierarchy
with the likes of Cambridge and Pittsburgh by entering the quater-
66 See: https://societyhealth.vcu.edu/work/the-projects/mapping-life-expectancy.html67 Personal Interview. Request anonymity, May 2016.
Image 5. Physical Health Complaints in City of ClevelandSource: CD 500 Cities Program
2
19

MAXINE GOODMAN LEVIN COLLEGE OF URBAN AFFAIRS
nary sector of the world economy. Here, services rendered world-
wide create a flow of data capital that’s “pipelined” back into the
region so as to deepen the knowledge base. Then, smokestacks
will be chasing Cleveland instead of Cleveland chasing smoke-
stacks.
The alternative, of course, is to do what we have been doing.
Building buildings, chasing yesterdays. But then we will be asking
the same question—“What’s wrong with Cleveland?”—thirty years
hence as Rabbi Silver did some thirty years back. Yet the fix then
is still the fix now. “The future of Cleveland rests first on a revived
economy,” observed Rabbi Silver. “A revived economy depends
upon bright people and new ideas. People do not get ideas out of
the air. Ideas begin in our schools, universities and laboratories…
The future for Cleveland cannot be bought cheaply.”68
Image 6: Courtesy of Healthy Cleveland
68 Rabbi Daniel Jeremy Silver, “What’s Wrong with Cleveland” (sermon, 1985).
20

MAXINE GOODMAN LEVIN COLLEGE OF URBAN AFFAIRS
21

CSU is an AA/EO institution. ©2018 University Marketing 180205