THE H TEAM - Hydrogen Student Design Contest the hydrogen plant. The H Team opted to use the ... for...
37
THE H TEAM 2007-2008 Hydrogen Design Contest: Hydrogen Applications for Airports Wayne State University, Detroit, Michigan, Team 2 Edwards, Donald Elder, Roxane Gupta, Reema Lascu, Dan Singh, Amandeep Winston, Mark Faculty Advisor: Dr. Monier B. Botros, PhD, P.E.
-
Upload
trinhquynh -
Category
Documents
-
view
218 -
download
1
Transcript of THE H TEAM - Hydrogen Student Design Contest the hydrogen plant. The H Team opted to use the ... for...

THE H TEAM
2007-2008 Hydrogen Design Contest:
Hydrogen Applications for Airports
Wayne State University, Detroit, Michigan, Team 2
Edwards, Donald
Elder, Roxane
Gupta, Reema
Lascu, Dan
Singh, Amandeep
Winston, Mark
Faculty Advisor: Dr. Monier B. Botros, PhD, P.E.
The H-Team
Wayne State University
College of Engineering
i
Executive Summary
The Columbia Metropolitan Airport (CAE) in South Carolina faces several challenges in airport
operations and the surrounding environment as air travel increases. The H Team focused on
implementing hydrogen technologies to control issues such as noise pollution, air and water
quality, and energy efficiency, while spending less than $3 million. The H Team’s design
followed codes and standards to ensure the safety and security of the hydrogen plant to the
airport. The proposed design is realistic and available for installation by January 2009. The
objective is to secure the environment while simultaneously enhancing the quality of the airport
operations.
The H Team from Wayne State University in Detroit, Michigan, is proposing to utilize a fuel cell
system that delivers about 250 kW of power, provides hot water at 110ºF, and supplies 12.94 kg
of gaseous hydrogen per day. This amount of hydrogen that is generated in an electrolyzer, is
used to fuel three modified 2008 Chevrolet Silverado vehicles that can replace three of the
airport service vehicles.
The H Team’s system consists of a DFC300®MA
TM fuel cell system from FuelCell Energy,
which has a molten carbonate fuel cell (MCFC), a steam-methane reformer, and a direct current
(DC) to alternative current (AC) inverter. The South Carolina Electric and Gas Company
(SCE&G) provides the natural gas utilized by the fuel cell system. Additionally, a heat
exchanger will employ the exhaust from the fuel cell system to heat the utility water for the
airport use. The electrolyzer is connected to a compressor, three-bank storage vessel system, and
a dispenser, respectively, to supply hydrogen gas to the airport vehicles at 5,000 PSI.
The overall system efficiency is calculated to be 62.5%. The cost of the system including all the
components, installation, and infrastructure costs is estimated to be about $2.86 million. In the
end, the airport will save about $113,400 per year. The fuel cell system provides a 42%
reduction in carbon dioxide emissions for the 250 kW replaced.
The H Team designed this plant to ensure the safety of the airport and all its patrons. Alarm
systems are on all components to alert maintenance and control personnel instantly of potential
problems. Panic buttons exist for automatic system shut down in case of extreme emergency
situations. Surveillance cameras and key-card access help prevent any potential terrorist attacks
on the hydrogen plant.
The H Team opted to use the current CAE tour and information center, in addition to other
marketing forms, to enhance public awareness about hydrogen. The hydrogen internal
combustion engine (HICE) vehicles will be a focal point of the tour, along with emphasis on the
fuel cell stack, heated water, and electricity production. Pamphlets and presentations on LCD
televisions are also part of the overall H Team marketing strategy. This report presents the
proposed design incorporating the technical design, safety analysis, cost analysis, environmental
analysis, and energy efficiency.

The H-Team
Wayne State University
College of Engineering
ii
Contents
Executive Summary .................................................................................................................... i Contents ..................................................................................................................................... ii
List of Tables ............................................................................................................................ iii List of Figures ........................................................................................................................... iii
List of Acronyms ...................................................................................................................... iv 1.0 Technical Design .................................................................................................................1
1.1 Site and Building Plan ..................................................................................................1 1.2 Mechanical Design .......................................................................................................3
1.2.1 Fuel Cell System .................................................................................................5 1.2.1.1 Steam Methane Reformation .................................................................5
1.2.1.2 Fuel Cell and Heat Exchanger Description .............................................6 1.2.2 Deionizer Water System (DI) ..............................................................................7
1.2.3 Electrolyzer .........................................................................................................7 1.2.4 Compressor .........................................................................................................7
1.2.5 Storage ................................................................................................................8 1.2.6 Dispenser ............................................................................................................8 1.2.7 Hydrogen Internal Combustion Engine (ICE) Vehicles .......................................9
1.3 Electrical System ..........................................................................................................9 2.0 Safety Analysis .................................................................................................................. 12
2.1 System Process Safety ................................................................................................ 12 2.2 Significant Failure Modes ........................................................................................... 14
3.0 Cost Analysis ..................................................................................................................... 15 3.1 Capital Costs .............................................................................................................. 15
3.2 Building and Installation Costs ................................................................................... 16 3.3 Operational Costs ....................................................................................................... 16
3.4 Cost Savings ............................................................................................................... 17 4.0 Environmental Analysis ..................................................................................................... 19
4.1 Fuel Cell System......................................................................................................... 19 4.2 Co-Generation ............................................................................................................ 20
4.3 Hydrogen ICE ............................................................................................................ 20 4.4 Energy Balance........................................................................................................... 21
5.0 Marketing and Educational Plans ....................................................................................... 23 5.1 Guided Tours .............................................................................................................. 23
5.2 Educational Materials ................................................................................................. 23 5.3 Visual Ads .................................................................................................................. 23
6.0 References ......................................................................................................................... 26 Appendix

The H-Team
Wayne State University
College of Engineering
iii
List of Tables
Table 1.1: Component summary .................................................................................................3 Table 1.2: Major Standards and Codes for Design Components
2 .................................................3
Table 1.3: Specifications for fuel cell options2 ............................................................................5
Table 1.4: Storage Vessel Specifications.....................................................................................8
Table 1.5: Existing Columbia Metropolitan Airport End-Use Electrical Loads.......................... 11 Table 1.6: New Electrical Loads ............................................................................................... 11
Table 1.7: Hydrogen Electrical Power Supply........................................................................... 11 Table 2.1: Major Failure Modes ................................................................................................ 14
Table 3.1: Complete cost breakdown for the H Team design..................................................... 15 Table 3.2: Infrastructure costs .................................................................................................. 16
Table 3.3: Summary of Operating Costs for the Hydrogen System............................................ 17 Table 3.4: Current Cost of Electricity and Gas .......................................................................... 17
Table 3.5: Cost Savings for Implementing the Hydrogen Power Plant ...................................... 18 Table 4.1: Emissions reduced by the proposed designed ........................................................... 19
Table 4.2: CAE vs. fuel cell system emission reduction ............................................................ 20 Table 4.3: Emissions comparison of gasoline vs hydrogen vehicles
18 ........................................ 21
Table 4.5: SMR heat requirements ............................................................................................ 22
List of Figures
Figure 1.1: Airport Aerial View with Plant Location1 ................................................................1
Figure 1.2: Floor Plan of Equipment Building ............................................................................2 Figure 1.3: Hydrogen Plant Schematic........................................................................................4
Figure 1.4: Electrical System Block Diagram ............................................................................9 Figure 3.1: Monthly Utility Charges for the Hydrogen Power Plant .......................................... 16
Figure 4.1: Emissions comparison of Columbia Metropolitan Airport ...................................... 20 and fuel cell system (FCS) ........................................................................................................ 20
Figure 4.2: GSE Emission Comparison18
.................................................................................. 21 Figure 4.3: Energy Balance for the hydrogen plant
2, 5, 6 ............................................................ 22

The H-Team
Wayne State University
College of Engineering
iv
List of Acronyms
AC Alternating Current HICE Hydrogen Internal Combustion
Engine ADG Anaerobic Digester Gas
ASME American Society of Mechanical
Engineers
Hz Hertz
ICE Internal Combustion Engine
ASTM American Society of Testing and
Materials
kg Kilogram
KVA Kilovolt Amperes
ATS Automotive Transfer Switch kW Kilowatt
BOP Balance of Plant kWh Kilowatt hour
BTU British Thermal Unit LCD Liquid Crystal Display
CAE Columbia Metropolitan Airport MCFC Molten Carbonate Fuel Cell
CARB California Air Resources Board N2 Nitrogen
CCR California Code of Regulations NFPA National Fire Protection Association
CH4 Methane NG Natural Gas
CO Carbon Monoxide NOx Nitric Oxide
CO2 Carbon Dioxide PAFC Phosphoric Acid Fuel Cell
CSA Canadian Standards Association PSA Pressure Swing Adsorption
dBA Decibels (Acoustic) PSI Pounds per square Inch
DC Direct Current SCE&G South Carolina Electric & Gas
Company DFC Direct Fuel Cell
DI Deionizer scfm Standard Cubic Feet per Minute
FC Fuel Cell SMR Steam Methane Reformer
FCS Fuel Cell System SO Sulfur Oxide
FMEA Failure and Safety Modes Analysis SOFC Solid Oxide Fuel Cell
GGE Gallons of Gasoline Equivalent UL Underwriters Laboratories
GSE Ground Support Equipment UPS Uninterrupted Power Supply
H2 Hydrogen VA Volt Amperes
H2O Water VAC Volts Alternating Current
HC Hydrocarbon WGS Water Gas Shift
HDS Hydrodesulphurization WSU Wayne State University

The H-Team
Wayne State University
College of Engineering
1
1.0 Technical Design
The H Team has designed a system that will supply 250 kW of electrical power and 12.94 kg H2
per day to Columbia Metropolitan Airport. A molten carbonate fuel cell system (MCFC) is
utilized to reform methane internally to produce hydrogen to generate electricity. An
electrolyzer will produce hydrogen, which will be compressed and stored at 6,000 PSI. Three
gasoline internal combustion engine (ICE) vehicles will be converted to hydrogen ICE vehicles
and will use the hydrogen produced by the electrolyzer as fuel. The fuel cell system and
hydrogen production equipment will be housed in a building on the Columbia Metropolitan
Airport grounds. Details of the technical design are described in the following sections.
1.1 Site and Building Plan
The components for the H Team’s design will be located in a building on the airport property.
The building will serve to protect the equipment from the weather and increase security of the
site. Figure 1.1 below shows the top view plan for the location of the new building. The
hydrogen plant is located 300 feet (ft) west of the airport main terminal building and has an area
of 2,500 ft2.
Figure 1.1: Airport Aerial View with Plant Location
1
Figure 1.2 shows the layout of the equipment in the building. The brick building will have three
entrances with two of the doors constructed of reinforced steel. The third entrance is a garage
door, which allows entrance to the building for Hi-Los and other large maintenance vehicles. All
entrances have keypad locks to increase security of the building.
The building has venting spaces located around the perimeter of the building near the ceiling,
which prevents a buildup of natural gas or hydrogen in case of a leak. Adequate space is
provided near all equipment to allow for maintenance access. The dispenser is located outside
the building and close to the hydrogen storage. Safety posts located around the dispenser and the
safety wall located to the left of the dispenser provide protection from accidental collision.

The H-Team
Wayne State University
College of Engineering
2
Figure 1.2: Floor Plan of Equipment Building

The H-Team
Wayne State University
College of Engineering
3
Hydrogen System Component Summary
Component Inputs Conditions Outputs Conditions
FuelCell Energy
DFC300MA Fuel Cell
System
Natural
Gas
638 kW, 39 scfm Electricity 3-phase, 300 kW,
480 VAC
Water 545 L/hr Exhaust 371oC, 1793.3
kg/hr
Electricity 70 kW for 72 hour
start up
Noise 72 dBA at 3.05 m
Heat Exchanger Exhaust 371
oC, 1793.3 kg/hr Water 43
oC, 3648 kg/hr
Water 10oC, 3648 kg/hr
Hogen 6m
Electrolyzer
Water 5.50 L/hr Hydrogen 99.9999% purity,
6 Nm3/hr, 218 PSI
Electricity 40.8 kW
Compressor and
Dispenser Hydrogen 218 PSI Hydrogen 6000 PSI
Hydrogen ICE Trucks Hydrogen 10.5 kg, 5,000 PSI Mileage 15.2 to 27
miles/GGE
Table 1.1: Component summary
Table 1.1 summarizes the technical specifications of major components shown in Figure 1.2.
Table 1.2 lists some of the significant standards and codes for the major components. Upon
installation, the fuel cell system will be in compliance with UL 1741 (Standard for Power
Conversion Systems) and NFPA 853 (Standard for Installation of Fuel Cell Power plants).
Components Safety Codes and Standards
Electrolyzer NFPA 69 and EN 1127-1
Compressor NFPA 50A
Piping system ASME piping design codes
Storage Vessels NFPA 86C
Fuel Cell System CSA-FC1, UL 1741, CARB 07 (CCR 94200-94214).
Table 1.2: Major Standards and Codes for Design Components2
1.2 Mechanical Design
Figure 1.3 shows the process flow for the H Team’s hydrogen plant. Natural gas (NG) and water
acquired from the pipelines enters the water purification and steam-methane reformer (SMR)
unit. Hydrogen is produced in the SMR is sent to the fuel cell. The fuel cell takes in air along
with the hydrogen, and produces direct current (DC) electricity. The DC electricity goes to a
DC-to-AC inverter which outputs alternating current (AC) power of 300 kW at 480 VAC.

The H-Team
Wayne State University
College of Engineering
4
Figure 1.3: Hydrogen Plant Schematic

The H-Team
Wayne State University
College of Engineering
5
Approximately 250 kW of the power produced is sent to the airport’s electrical grid. The fuel
cell also produces high temperature exhaust, which is utilized in a heat exchanger to heat the
utility cold water. The cooled exhaust is then vented to the atmosphere, and the hot water is sent
to the airport.
The some of the remaining power from the fuel cell system (41 kW) is used by an electrolyzer,
which produces hydrogen at a rate of 12.94 kg/day. The hydrogen is compressed and stored.
Finally, a dispenser provides the compressed hydrogen to two hydrogen ICE vehicles. The
system requires 72 hours to start up and will operate continuously after that period. The
following sections explain the design in detail.
1.2.1 Fuel Cell System
One of the H Team’s objectives is to provide at least 250 kW of clean power to the airport. The
DFC300MA™ fuel cell system manufactured by FuelCell Energy2 meets the H Team’s
specifications and is commercially available. The system comprises three components: a steam
methane reformer (SMR), molten carbonate fuel cell (MCFC), and a DC to AC converter. A net
power of 300 kW, 3-phase at 480 VAC is produced by the system. The following sections provide
an explanation of the system specifications and principles. The system specifications are
presented in Table 1.3. Note that the listed efficiency does not include co-generation with the
heat exchanger. Sections 1.2.1.1, 1.2.1.2, and 1.3 discuss the system in detail.
Specifications FuelCell Energy DFC300MA
Fuel Cell Stack MCFC
Reformer Steam-Methane
Input Natural Gas
Power Output 300 kW
Natural Gas (NG) Used 638 kW, 39 scfm
Hydrogen Produced/Used 5.36 kg/hr
NG to Electricity Efficiency 0.47
Exhaust Gas 1,793.3 kg/hr
Exhaust Temperature 644K
Noise (dBA) 72 at 3.05 m
Cost ($)/kW 3,600
Total Cost ($) 1,080,000
Table 1.3: Specifications for fuel cell options2
1.2.1.1 Steam Methane Reformation
Steam methane reforming is a process of producing hydrogen utilizing methane and steam. The
first step of generating hydrogen in the SMR involves a chemical reaction between methane
(CH4) and steam (H2O). The ideal chemical equation for this reaction is shown in equation 1.1:
4 2 2CH H O CO 3H . 1.1

The H-Team
Wayne State University
College of Engineering
6
The products of this reaction are carbon monoxide (CO), hydrogen (H2), and in practice, a small
amount of unreacted steam and methane. This step produces the majority of the hydrogen. The
CO produced during this reaction goes through a secondary reaction called the water gas shift to
eliminate its emission with the exhaust. The chemical reaction is shown in equation 1.2:
2 2 2H O CO H CO 1.2
This reaction produces an additional amount of H2 and carbon dioxide (CO2).
In a small-scale reformer, similar to the one used in the fuel cell system, natural gas is treated to
remove sulfur compounds in order to prevent poisoning of the catalyst in the fuel cell system.
This treatment process takes place in a hydrodesulphurization (HDS) pre-heater where the gas is
heated to about 475oC (730 degree Kelvin).
The water is pumped into a steam boiler and is preheated for the SMR reaction. The steam and
the purified methane streams proceed to the SMR, which is heated by a gas burner. A typical
SMR process uses 73% of the preheated methane. Hydrogen, carbon monoxide, and excess
methane and steam gases exit the reformer at a temperature of 1073 K. The effluent stream
flows back through the HDS pre-heater in a heat exchanger and a reformer cooler, where the
stream is cooled down to 722 K.
The cooled gas then enters the water gas shift chamber where it undergoes the second chemical
reaction. The stream then moves to the condenser where the excess water is removed. Finally,
the remaining hydrogen, methane, and carbon dioxide undergo pressure swing adsorption (PSA)
and hydrogen purification in order to isolate the hydrogen. The gases extracted from the
hydrogen stream are recycled for use as fuel gas during the subsequent set of SMR processes.3
The fuel cell system intakes about 637 kW of natural gas at 39 standard cubic feet per minute
(scfm) and 545 kg/hr of water, and outputs 5.63 kg/hr of hydrogen2. A sizable amount of the
natural gas is used in the pre-heating stage. The DFC300MATM
fuel cell system has the ability to
intake either natural gas or anaerobic digester gas (ADG). The H Team searched for nearby
sources of ADG but discovered that the local wastewater treatment facility does not collect the
gas they produce. If in the future, however, the local wastewater treatment does decide to collect
the ADG, this may prove to be a renewable source for the methane needed in the reformer.
1.2.1.2 Fuel Cell and Heat Exchanger Description
The DFC300MATM
fuel cell system runs on a molten carbonate fuel cell (MCFC). The anode
and cathode half reactions for a MCFC are:
2
2 3 2 22 2 2 2 4H CO H O CO e 1.3
2
2 2 32 4 2O CO e CO 1.4
The catalysts and membranes in a MCFC are resistant to poisoning due to carbon monoxide
intake. In fact, the MCFC reaction uses both oxidized carbon monoxide and carbon dioxide in
the cathode without deactivating or degrading the catalyst. The output of the fuel cell system is
300 kW and 480 VAC, which is equivalent to 375 kVA.
(Anode)
(Cathode)

The H-Team
Wayne State University
College of Engineering
7
The MCFC exhaust contains a significant amount of energy due to its high temperature. This
energy is recovered by attaching a heat exchanger to the fuel cell system exhaust outlet chamber.
This allows the H Team to provide heated utility water to the airport. According to the
manufacturer, the exhaust temperature must be lowered to 250oF (121
oC) for an optimum energy
release of 480,000 BTU/hr (140 kW). The water enters the heat exchanger at about 50oF (10
oC).
With a heat exchanger efficiency of 75%, the exhaust energy is transferred to the utility water,
raising the temperature to 110oF (43
oC), for a water flow rate of 2,737 kg/hr. Utilizing the heat
exchanger will optimize the overall energy efficiency of the system.
1.2.2 Deionizer Water System (DI)
An external deionizer (DI) water system is required to supply purified water to the electrolyzer.
The H Team has selected the ELGA, Purelab Option S7 deionizer, which comprises a three-stage
water purification process4. In the first stage, the water is sent through a pre-treatment cartridge.
The second stage utilizes reverse osmosis cartridges to further purify the water. The last stage
includes the ion exchange cartridges, which de-ionizes the water. The final product is sent to the
electrolyzer to produce hydrogen at a rate of 7 L H20/hr. The power service requirement is
120/240 VAC, 43 VA.
The Option S7 deionizer meets the ASTM Type I standard for water purification to be less than
0.1 micro-Siemens per cm. Furthermore, if the water quality falls below the minimum
specification, a sensor will detect the discrepancy and activate an alarm. In order to maintain
water purity, it is crucial to use non-corrosive piping materials to transport the DI water to the
electrolyzer. Therefore, the H Team selected polypropylene plastic tubing to pipe the DI water.
1.2.3 Electrolyzer
The electrolyzer is used to produce the hydrogen necessary for the hydrogen ICE vehicles. The
Hogen H6m electrolyzer manufactured by Distributed Energy5 is used in the H Team’s design.
The system incorporates polymer exchange membrane (PEM) technology to produce hydrogen.
The PEM electrolysis of water uses electricity to divide water into its elements of hydrogen and
oxygen. This occurs through the passage of an electric current between the anode and the
cathode of the electrolyzer, which are immersed in an electrolyte solution. The two elements are
separated in the electrically charged electrolyte.
The system will use DI water at a rate of 5.5 L H2O/hr. The H6m has a built in 10-gallon DI
water storage tank, which will store excess water produced by the deionizer. Furthermore, the
electrolyzer consumes 40.8 kW of electricity provided by the fuel cell system. The H6m
produces 99.9995% pure hydrogen at a rate of 12.95 kg/day.
1.2.4 Compressor
The compressor is used to raise the pressure of the hydrogen gas allowing it to be dispensed to
the HICE vehicles. The compressor chosen for the H Team’s design is manufactured from RIX
Industries 4VX6. This unit is selected due to its capability to increase the hydrogen pressure
from 218 PSI to 6,000 PSI using only 2 kW of power. The HICE vehicles can store hydrogen up

The H-Team
Wayne State University
College of Engineering
8
to 5,000 PSI. The compressor raises the hydrogen pressure to 6,000 PSI providing a large enough
pressure difference to allow the HICE vehicles to completely fill their storage tanks. The
compressor operates at speeds of 300-1,100 revolutions per minute (RPM) and is a three-stage
design. Furthermore, the compressor requires 30 kW of power to compress gaseous hydrogen at
a maximum flow rate of 65 scfm.
1.2.5 Storage
The storage unit will house a combined 36 kg of hydrogen. The C-31738 storage unit comprises
three stationary ASME seamless pressure vessels manufactured by CP Industries.7 Each vessel
has the capability to store hydrogen at pressures as high as 6,672 PSI. The vessels include a 5
percent notch ultrasonic inspection, a 0.75 inch NGT outlet plug on both ends, and an exterior
coat of primer. Table 1.4 shows additional specifications for the storage vessels:
Specifications
Safety Factor 3 to 1 for dry gas, non-corrosive service
Design temperature -20 °F to +200 °F.
Vessel material SA372 Grade J, Class 70
Size 16" OD x 1.250" MW x 18' 0" Long /406 mm x 31.75 mm x 5.5 m
Design Pressure 6,667 PSIg / 460 bar
Vessel Water Volume 15.8 cu. ft. / 447 liters
Vessel Capacity 5,087 scf H2 @ 6,000 PSIg / 12 kg H2 @ 414 bar
Vessel Weight 4,017 lbs / 1,822 kg
Table 1.4: Storage Vessel Specifications
The three-bank storage unit is implemented to dispense hydrogen to the airport vehicle tanks at a
pressure of 5,000 PSI. The storage unit uses a cascading method to fill the hydrogen effectively.
Each vessel will have pressure sensors to segregate the vessels as high, medium, and low.
During hydrogen dispensing, the pressure differences between each of the vessels and the vehicle
tank will be analyzed by a control panel to determine the appropriate vessel compatible with the
vehicle tank.
1.2.6 Dispenser
The dispenser will distribute hydrogen to the hydrogen ICE vehicles. The H Team’s design uses
the CH350A hydrogen dispenser manufactured by General Hydrogen8. The dispenser has
separate electrical and gas enclosures in order to comply with emerging safety codes and
standards. The system has SAE J2601 fueling communication capabilities. This will allow for
communication between the dispenser and vehicle for information such as vehicle diagnostics.
The system delivers hydrogen at 5,000 or 6,250 PSI, which allows different types of vehicles to
refuel at the station. This will prevent the system from becoming quickly outdated, since
hydrogen technology improves at a rapid rate.

The H-Team
Wayne State University
College of Engineering
9
1.2.7 Hydrogen Internal Combustion Engine (ICE) Vehicles
The purpose of using hydrogen ICE vehicles is to reduce emissions generated by the airport.
Gasoline or diesel ICE vehicles contribute to air pollution at Columbia Metropolitan Airport.
The H Team has decided to have three 2008 Chevrolet Silverado gasoline ICEs converted into
hydrogen ICEs by ETEC Roush Industries9. The trucks will replace three vehicles currently
used at the airport. The converted vehicles will have 6.0 liter supercharged and inter-cooled
engines. Hydrogen fuel will be electronically injected by a custom Engine Control Unit
specifically tuned for hydrogen fuel consumption.
Three aluminum-lined, carbon fiber wrapped hydrogen storage tanks will be located in the bed of
the truck. Their combined storage capacity is 450 liters or 10.5 kg of hydrogen at 5,000 PSI. The
vehicle fuel economy is rated at 15.2 miles per gallons of gas equivalent (GGE) for the SAE
J1634 driving cycle. However, the fuel economy climbs up to 27 miles/GGE at a constant
driving speed of 45 mph9. The H Team has estimated that each vehicle can run on one fill-up for
about two days if the vehicles run for two hours per day.
1.3 Electrical System
The fuel cell system is directly connected to the grid and draws 150 kW, 3-phase, 480 VAC
during the 72 hour startup time. After the first 72 hours, the system provides for its own power
requirements. The fuel cell system produces DC electricity, which is converted to AC power by
an internal three phase inverter. The system outputs AC power at 300 kW, 60 Hz with a process
efficiency of 97%. Figure 1.4 shows the block diagram of the electrical system for power service
and distribution.
Figure 1.4: Electrical System Block Diagram

The H-Team
Wayne State University
College of Engineering
10
Electrical output from the fuel cell system will supply electrical loads to the CAE main terminal,
main lobby, terminal front ticket counter, lighting, and security rooms that run at 3-phase, 480
VAC. These loads require a total power supply of 244 kW and the distribution is shown in Table
1.5. The remaining 56 kW of electricity produced by the fuel cell system power the hydrogen
production and distribution subsystems. The individual power requirements for these subsystems
are shown in Table 1.6.
There are two operating scenarios for the hydrogen power plant. In the first scenario, all
hydrogen production components, such as the electrolyzer and compressor, are powered by the
fuel cell system inverter bus. This system also supplies power to the hydrogen power plant
building and to three airport loads: the main lobby, terminal ticket counter, and security room
east dock.
In second operating scenario, the fuel cell system inverter bus supplies electrical power to the
main lobby, terminal front ticket counter, lighting and ticket counter, security room east dock,
and security room west dock located at CAE. All hydrogen production subsystems (listed in
Table 1.6) are powered by the Columbia Metropolitan Airport electrical grid. Electrical
schematics of both operating scenarios are shown in the Appendix.
The first scenario is recommended by the H Team and is primarily used in the system. However,
the electrolyzer still has the option, via manual switch, to connect to the grid. This will act as a
back-up electrical supply source in case the fuel cell system fails or is shut down for
maintenance. This allows the electrolyzer to continue producing hydrogen for use in the
hydrogen ICE vehicles.
In the event of fuel cell system failure, automatic transfer switches (ATS), will transfer the
electrical load to the grid, providing an uninterrupted power supply (UPS). Circuit breakers are
installed on all circuits for over-current protection. The electrical system will provide safe
disconnect circuits and lockout protection in case of emergencies or for maintenance purposes.
Tables 1.5, 1.6, and 1.7 provide a total accounting of the electrical power service. Parameters
that were not provided by the equipment manufacturers were calculated using the following
formulas:
PF (Power Factor) = True Power (kW) / Apparent Power (kVA) 1.6
I kW 1000 / E 1.73 PF 1.7
kW E I 1.73 PF /1000 1.8

The H-Team
Wayne State University
College of Engineering
11
CAE Load
Description
Existing CAE
Transformer VAC Phases Amps kW
Power
Factor KVA
Main Lobby Square D, 34349-17212-064 480 3 90 64 0.85 75
Terminal Front
Ticket Counter Square D, 34349-17212-065 480 3 90 64 0.85 75
Lighting and
Ticket Counter Square D, 34349-17212-066 480 3 90 64 0.85 75
Security Room
East Dock Square D, 33349-17212-055 480 3 36 26 0.85 30
Security Room
West Dock Square D, 33349-17212-055 480 3 36 26 0.85 30
Table 1.5: Existing Columbia Metropolitan Airport End-Use Electrical Loads
Item Model VAC Phases kW
Power
Factor kVA
Electrolyzer HOGEN, H6m 480 3 40.8 0.85 48
H2 Compressor PDC Ins., PDC-3-
600/3000 480 3 2 0.85 2.35
480 volt feed to a new 25
kVA transformer 480 3 21 0.85 25
DI Water System Elga, Purelab Option S7 120 1 0.037 0.85 0.04
H2 Dispenser General Hydrogen,
CH350A 120 1 2 0.85 2
H2 Storage Tanks CP Industries 120 1 1 0.85 1
Building Lighting GE (12 Fixtures, 2-4' T8
Lamps) 120 1 0.7689 0.85 0.91
2 Building Power Outlets Rated at 15 amperes each 120 1 5 0.85 6
Miscellaneous Pumps 120 1 1.5 0.85 2
Miscellaneous Controls
& Sensors 120 1 1.5 0.85 2
Table 1.6: New Electrical Loads
Item Model VAC Phases Amps kW Power Factor KVA
Power Plant FCE DFC300MA 480 3 425 300 0.85 352.9
Table 1.7: Hydrogen Electrical Power Supply

The H-Team
Wayne State University
College of Engineering
12
2.0 Safety Analysis
Utilizing hydrogen technologies safely at the Columbia Metropolitan Airport will promote
acceptance of a hydrogen economy. Sources of potential danger were carefully analyzed and
controlled to ensure the safety of the surrounding environment and the system itself. These
detection devices include pressure sensors, thermocouples, pH meters, flow meters, H2 gas
detectors, smoke detectors, H2 flame detectors, and surveillance cameras positioned at specific
locations to optimize operations. In the event of an unusual behavior detected in the system,
visual and sound alarms will identify the failure, and the system will shut down.
The subsystems are regularly tested for normal operation conditions, as specified by the various
manufacturers. Maintenance checks will verify system corrosion, damage, wear, and low level
of fluids that could cause a decrease in the system performance. Additionally, periodic oil
changes, catalyst replacements, and resin refills are implemented to maintain equipment quality
and maximize the design life.
2.1 System Process Safety
The system layout is designed to prevent potentially hazardous situations. The following list
displays each process of the system design that has been analyzed to enhance safety and security.
Note that the numbers in brackets after the bullet point corresponds to the three zone
designations in Figure 1.3.
[1] The steam methane reformer within the fuel cell system has a RTD thermocouple to help
measure and control operating temperature. Flow meters at the natural gas inlet and H2 outlet
will initialize both a visual and an audio alarm when hydrogen outlet from the reformer is
less than 5.4 kg H2/hr.
[2] The electrolyzer features a pressure sensor, which will initiate an alarm for pressures
below 11 Bar, and a pH meter. The pH meter monitors impurity levels of water used in the
electrolyzer to prevent the resin death. Fluoride and chloride ions regularly exist in normal
tap water. The presence of these ions leads to the water being slightly acidic. The ions need
to be removed in the deionizer to create pH neutral water into the electrolyzer. If the resin
fails, then the pH meter will read out an acidic pH less than 7. Flow meters will help ensure
constant water flow rate of 5 L/hr, with alarms issuing a warning for lower flows.
[2] The compressor is equipped with a pressure sensor, which initiates an alarm when the
hydrogen pressure is below 5,800 PSI. A hydrogen detector will be installed close to
interconnections, which are high risk leakage areas.
[2] Because the compressor is designed to compress hydrogen to 6,000 PSI, a pressure
greater than 6,000 PSI is not possible. Storage tanks are made of stainless steel for its
compatibility with hydrogen and strength at high pressures. The site of the storage vessels is
determined based on the hydrogen quantity stored. Possible proximity hazards include
danger to electrical, thermal, mechanical devices, and the safety of the public. The storage
tanks will be installed in a well-ventilated area, following the criteria given by the Safety
Standards of NASA:
o 6.1 m (20ft) from stored flammable materials
o 7.6 m (25ft) from open flames, electrical equipment or other sources of ignition

The H-Team
Wayne State University
College of Engineering
13
o 15.2 m (50ft) from ventilation intakes and air conditioning systems
o 15.2 m (50 ft) from other flammable gas storage (NG).
o 7.6 m (25ft) – from concentration of peoples
[3] The dispenser operates using pressure sensors to calculate the pressure difference
between the vehicle tank and the three storage vessel banks. The pressure sensors are located
at the hydrogen inlet to the dispenser and before the dispenser hose. Also, a thermocouple is
positioned at the outlet of the refrigerator inside the dispenser. If the hydrogen temperature
rises above ambient temperature, the dispenser will initiate a visual and audio alarm, and will
shut off. The dispenser will not restart operations until the faulty condition is corrected and a
manual override lever/button is engaged. The dispenser will be protected at the sides and the
four corners by steel pillars to prevent damage in the event of a vehicle careening into it.
[1] A thermocouple is used to monitor water temperature at the heat exchanger outlet, and
will generate a safety message in the monitoring system for a temperature above 125oF
(52oC).
[1, 2,3] Piping systems, valves, and fittings were chosen based on their compatibility with
hydrogen to prevent possible hydrogen embrittlement. The pipes will be installed above
ground to prevent hazardous leakage and buildup of gases underground. The connecting
fittings are of compression type rated for hydrogen usage. Shut off valves, pressure relief
valves in the storage vessels and fuel cell system, and flow regulators are employed in the
design to allow modular connectivity of subsystems, protect the system from overpressure,
and adjust flow. The control valves and pressure sensors located at the inlets and outlets of
certain subsystems are used to stabilize and manage the flow of the various gases involved.
The maintenance crew will carry portable hydrogen detectors.
[2] A filtering system will ensure hydrogen purity. The filtering system will have a
differential pressure sensor to indicate a decrease in the filtering performance and the need of
filter replacement. Shut off valves will be installed before and after the filter to allow safe
and timely filter exchange.
[1] Electrical systems will be installed at a specified distance from the hydrogen systems to
prevent fire or explosion. Electrical devices will be grounded to avoid sparking with
hydrogen, and the inert gas purge boxes will be located around electrical equipment and
connections.
[1, 2,3] The facility building material is noncombustible, to prevent fire spreading to adjacent
buildings or systems. To reduce sabotage risks, the access to the plant is limited to
authorized personnel. Badges will be used for door access. Emergency exits are located
throughout the building in case of hazardous situations. To prevent accidents, work on
hydrogen will be started only after the hydrogen in the system has been purged and diluted
with nitrogen. The system’s control and detection is connected to the airport control system,
and the necessary training is provided to the operator to monitor and keep the plant
continuously safe.
The aforementioned metering and sensor additions to the process components means the system
can autonomously and safely run continuously. The components needed to generate, store,
transport, dispense, and utilize hydrogen and electricity are designed using the current safety
codes and standards for hydrogen applications to minimize any chances of leakage, explosion,
and other hazardous conditions. Finally, the DFC®300MA
TM fuel cell system already contains
methods to regulate itself for continual operation.

The H-Team
Wayne State University
College of Engineering
14
2.2 Significant Failure Modes
The Table 2.1 displays the four most significant major failure modes and ways they are
contained and prevented in the design.
Potential
Failure
Mode
Potential
Effect(s) of
Failure
Potential Cause(s)/
Mechanism(s) of
Failure
Current Controls
- Prevention
Current Controls
- Detection
Dispenser
pressure
lower than
5,000 PSI
Limited
hydrogen
dispensing
Isolation valve or
nozzle damage
Ensure the proper
connection of nozzle,
vehicle tank, and
valves.
Train the operator
Hydrogen detection
sensors, leak
checks prior to
each fill.
Electrolyzer
produces less
than 12.94
kg H2/day
Limited
hydrogen
dispensing
Electrolyzer PEM
degrading
Replace PEM after
3600 operating hours
NFPA 69 and EN
1127-1
Pressure sensors to
detect outlet H2
pressure, alarms
sound when
pressure is below
11 Bar.
Compressor
outputs
pressure
below 5,800
PSI
Hydrogen not
dispensing
Hydrogen or air
leakage from
inlet/outlet pipe,
inlet/outlet valve, or
cylinder
Weekly leak checks.
Oil Changes after
1400 operating hours.
Pressure sensors to
detect outlet H2
pressure, below
5,800 PSI.
Fuel cell
system
outputs less
than 300 kW
electricity
Draw
electricity
from grid for
airport and
electrolyzer
Reformer and fuel
cell catalyst
degradation
Catalyst replacement
cycles of about 3
years, as manufacturer
specifies.
Adheres to the
following codes and
standards: CSA-FC1,
UL 1741, CARB 07
(CCR 94200-94214),
and California Rule
21.
Thermocouples
located inside the
Steam Methane
Reformer, and
Molten Carbonate
Fuel Cell.
Alarm for detection
of temperature
change.
Flow meters for
methane and
hydrogen (135 kg
H2/day).
Table 2.1: Major Failure Modes

The H-Team
Wayne State University
College of Engineering
15
3.0 Cost Analysis
The H Team has $3 million at its disposal to implement a design at the Columbia Metropolitan
Airport. These funds are used to cover the cost of purchasing equipment and installing it at the
build site. Operation and maintenance of the system will also incur costs. These recurring
charges are accounted for separately from the $3 million budget. Table 3.1 shows where the H
Team is spending their funds. The majority of the funds are spent on system equipment. Other
costs include the cost for infrastructure, which covers building costs. Installation costs cover the
charge for installing the equipment at the build site. The following sections will discuss in detail
the cost breakdown for all the sections of the H Team’s design.
System Components Cost
Fuel Cell $1,080,000
Electrolyzer $180,000
Di System $6,000
Heat Exchanger $100,000
Compressor $50,000
Hydrogen Storage $64,300
Hydrogen Dispenser $100,000
ICE Vehicles $483,000
Infrastructure $100,000
Installation $500,000
Marketing $200,000
Total $2,863,300
Table 3.1: Complete cost breakdown for the H Team design.
3.1 Capital Costs
Capital costs comprise the cost of all equipment purchased by the H-Team. The total capital
costs of the design amount to $2,863,300. The fuel cell system provided by FuelCell Energy is
the most expensive component of the entire design and makes up more than half of the
equipment cost. The total cost is $1,080,000 but this amount covers several areas including an
SMR system, the fuel cell, and power inverter. Purchasing this system allows the H Team to
save money since they will not have to buy individual parts.
The H Team is also converting two trucks into hydrogen internal combustion engine vehicles
(ICE). Three 2008 Chevrolet Silverado 1500 series pickup trucks must be purchased. One truck
ranges in price from $38,000 to $41,00010
. The conversion process carried out by ETEC costs
$120,000 per vehicle11
. Assuming that the trucks are purchased for $41,000, the total cost for the
hydrogen ICE vehicles amounts to $483,000.
The H-Team
Wayne State University
College of Engineering
16
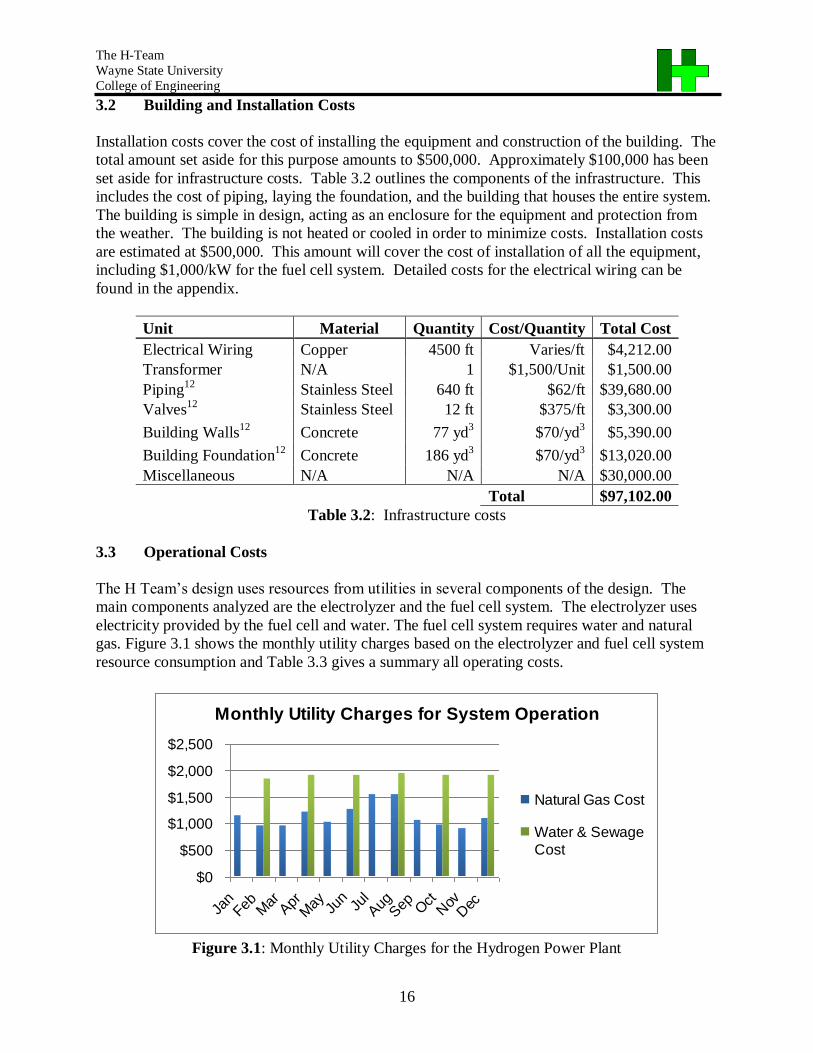
3.2 Building and Installation Costs
Installation costs cover the cost of installing the equipment and construction of the building. The
total amount set aside for this purpose amounts to $500,000. Approximately $100,000 has been
set aside for infrastructure costs. Table 3.2 outlines the components of the infrastructure. This
includes the cost of piping, laying the foundation, and the building that houses the entire system.
The building is simple in design, acting as an enclosure for the equipment and protection from
the weather. The building is not heated or cooled in order to minimize costs. Installation costs
are estimated at $500,000. This amount will cover the cost of installation of all the equipment,
including $1,000/kW for the fuel cell system. Detailed costs for the electrical wiring can be
found in the appendix.
Unit Material Quantity Cost/Quantity Total Cost
Electrical Wiring Copper 4500 ft Varies/ft $4,212.00
Transformer N/A 1 $1,500/Unit $1,500.00
Piping12
Stainless Steel 640 ft $62/ft $39,680.00
Valves12
Stainless Steel 12 ft $375/ft $3,300.00
Building Walls12
Concrete 77 yd3 $70/yd
3 $5,390.00
Building Foundation12
Concrete 186 yd3 $70/yd
3 $13,020.00
Miscellaneous N/A N/A N/A $30,000.00
Total $97,102.00
Table 3.2: Infrastructure costs
3.3 Operational Costs
The H Team’s design uses resources from utilities in several components of the design. The
main components analyzed are the electrolyzer and the fuel cell system. The electrolyzer uses
electricity provided by the fuel cell and water. The fuel cell system requires water and natural
gas. Figure 3.1 shows the monthly utility charges based on the electrolyzer and fuel cell system
resource consumption and Table 3.3 gives a summary all operating costs.
Monthly Utility Charges for System Operation
$0
$500
$1,000
$1,500
$2,000
$2,500
Jan
Feb Mar
Apr
May Ju
nJu
lAug
Sep O
ctNov
Dec
Natural Gas Cost
Water & Sewage
Cost
Figure 3.1: Monthly Utility Charges for the Hydrogen Power Plant

The H-Team
Wayne State University
College of Engineering
17
Average Monthly Cost Yearly Cost 5 Year Cost 10 Year Cost
Natural Gas $1,139.43 $13,673.19 $68,365.95 $136,731.90
Water/Sewage $1,904.94 $11,429.66 $57,148.28 $114,296.56
Total $3,044.37 $25,102.85 $125,514.23 $251,028.46
Table 3.3: Summary of Operating Costs for the Hydrogen System
The fuel cell system operation requires natural gas for the SMR process. Bills provided by
Columbia Metropolitan airport were used to determine the cost of natural gas throughout the
year13
. This information was used to estimate the cost of natural gas used in the fuel cell system.
The electrolyzer and the fuel cell system both require water for operation. Sewage rates are based
on water consumption. Water and sewage rates were acquired from the city of Cayce and used
to determine the operating cost of the system14
. The city of Cayce bills for water and sewage bi-
monthly. The total yearly operation cost for these components amounts to $25,100.
The cost per kWh of electricity was also determined for the hydrogen power plant using equation
3.1
0.125CC 3.412FC O&M
COEH H
, 3.1
where COE is the cost of electricity, CC is the capital cost, FC is the fuel cost, O&M is the
operating and maintenance cost, H is the annual operating hours, and ε is the efficiency15
. The
cost per kW for the H Team’s system is 0.203 $/kWh.
3.4 Cost Savings
Table 3.4 shows the current cost to purchase 225 kW of electricity and provide gasoline for three
vehicles.
Utility Avg. Monthly Cost Yearly Cost 5 Year Cost 10 Year Cost
Purchasing 250 kW $9,999.78 $119,997.31 $599,986.55 $1,199,973.10
Gasoline for 3 Vehicles $1,539.84 $18,478.13 $92,390.65 $184,781.30
Total $11,539.62 $138,475.44 $692,377.20 $1,384,754.40
Table 3.4: Current Cost of Electricity and Gas
Electricity charges were determined using a rate schedule provided by South Carolina Electricity
and Gas (SCE&G), the company that provides electricity to Columbia Metropolitan Airport16
.
The total electricity cost includes the demand and energy charges. If the airport were to purchase
250 kW of power from SCE&G, the cost would be approximately $10,000 per month.
The monthly gasoline expense for three vehicles was determined for a truck with an average fuel
economy of 16 mpg. If the vehicles operated for two hours per day with an average speed of 45
mph, gasoline would cost $1,540 per month when the price per gallon is $3.00. The total cost of
the current infrastructure to produce the equivalent of the hydrogen power plant would be
approximately $11,900 per month.
The H-Team
Wayne State University
College of Engineering
18
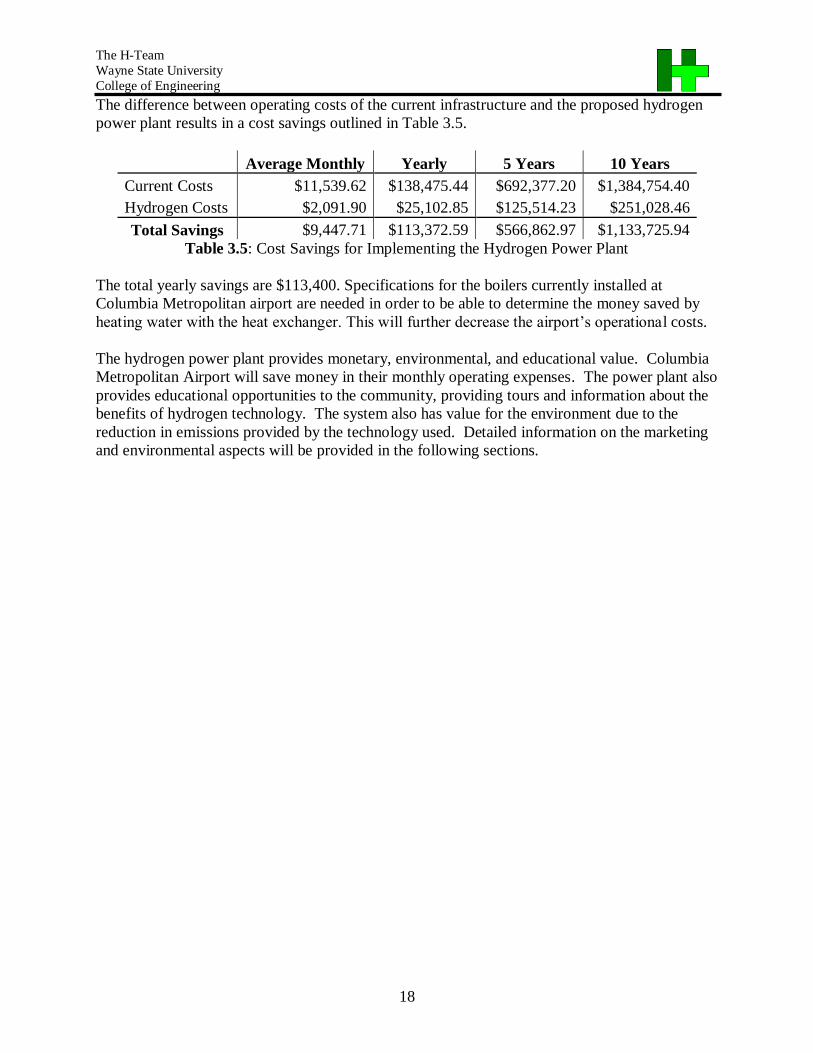
The difference between operating costs of the current infrastructure and the proposed hydrogen
power plant results in a cost savings outlined in Table 3.5.
Average Monthly Yearly 5 Years 10 Years
Current Costs $11,539.62 $138,475.44 $692,377.20 $1,384,754.40
Hydrogen Costs $2,091.90 $25,102.85 $125,514.23 $251,028.46
Total Savings $9,447.71 $113,372.59 $566,862.97 $1,133,725.94
Table 3.5: Cost Savings for Implementing the Hydrogen Power Plant
The total yearly savings are $113,400. Specifications for the boilers currently installed at
Columbia Metropolitan airport are needed in order to be able to determine the money saved by
heating water with the heat exchanger. This will further decrease the airport’s operational costs.
The hydrogen power plant provides monetary, environmental, and educational value. Columbia
Metropolitan Airport will save money in their monthly operating expenses. The power plant also
provides educational opportunities to the community, providing tours and information about the
benefits of hydrogen technology. The system also has value for the environment due to the
reduction in emissions provided by the technology used. Detailed information on the marketing
and environmental aspects will be provided in the following sections.

The H-Team
Wayne State University
College of Engineering
19
4.0 Environmental Analysis
Given the increase in air travel, Columbia Metropolitan Airport is committed to reducing the
emissions produced by its operations by employing hydrogen technologies. The technologies
chosen by the H Team minimize the CAE’s carbon footprint and to improve water quality.
The fuel cell system will reduce the overall airport CO2 emissions, due to electrical power
consumption, by 42% for the 250 kW replaced. The co-generation system will recover the
exhaust thermal energy from the fuel cell system and will heat water to be used at the airport
main terminal. This process will reduce CO2 produced by natural gas combustion to heat water
by 223 tons a year. To reduce the environmental impact with the ground support equipment
(GSE), three vehicles will be retrofitted with hydrogen ICE to reduce emissions. This change
will reduce CO2 emissions by 63 tons/yr for the three vehicles. The reduction of emissions with
the proposed design is presented for each subsystem in Table 4.1 on a daily and yearly basis.
Emissions reduction with proposed design
Proposed Systems
CO2 (kg) NOx (kg) SO2 (kg)
Day Year Day Year Day Year
Fuel Cell
System 2,304.9 841,275.4 15.7 5,728.5 9.5 3,451.2
Co-Generation
(Hot Water) 611 222,859 0.5 175 0.01 1.9
HICE
Vehicles 173.487 63,322.65 0.01 4.2278 NA NA
Total Reduction 3,089.4 1,127,457.0 16.2 5,907.8 9.5 3,453.1
Table 4.1: Emissions reduced by the proposed designed
4.1 Fuel Cell System
The DFC300MA fuel cell system employs an internal natural gas reformer to produce the
hydrogen used in the fuel cell to generate the electricity supplied at the main terminal and the
electrolyzer. Considering the emissions generated by the coal power plants, the fuel cell system
will reduce emissions by 42% for the 250 kW replaced, and by 5% for the entire airport electrical
consumption.
South Carolina Electric and Gas Company (SCE&G) provides electricity and natural gas to
Columbia Metropolitan Airport. The total charges, electrical power consumption, and emission
are tabulated for the year 2006 and can be found in the appendix in Table A.117
.
Table 4.2 and Figure 4.1 show a comparison between yearly emissions using electrical power
provided by SCE&G and electrical power from the proposed fuel cell system for the 250 KW
replaced.

The H-Team
Wayne State University
College of Engineering
20
Proposed Systems
CO2 (kg) NOx (kg) SO2 (kg)
Day Year Day Year Day Year
Power plant emissions to
generate 250 KW16
5,436 1,984,140 16 5,752 9.5 3,452
Fuel Cell System2 3,131 1,142,864 0.1 23.8 0.0 1.2
Reduction (%) 42.4 42.4 99.6 99.6 100 99.97
Table 4.2: CAE vs. fuel cell system emission reduction
Current CAE vs Proposed FCS emissions for the
250 KW replaced
CO2-CAECO2-FCS
NOx-CAE
NOx-FCS
SO2-CAE
SO2-FCS
0.1
1
10
100
1000
10000
100000
1000000
10000000
1
Em
isio
ns
[kg
/year]
CO2-CAE
CO2-FCS
NOx-CAE
NOx-FCS
SO2-CAE
SO2-FCS
Figure 4.1: Emissions comparison of Columbia Metropolitan Airport
and fuel cell system (FCS)
4.2 Co-Generation
The co-generation system employs the MCFC exhaust thermal energy, to heat the water to be
used at the main terminal. This approach will offset part of the natural gas currently consumed
with the water boilers, and with it the emissions produced. The MCFC available exhaust heat is
480,000 Btu/hr (140 kWh), which amounts to 516 ft3/hr of natural gas considering an energy of
930 Btu/ ft3 of natural gas. This system will reduce CO2 by 223,000 kg/yr, NOx by 155 kg/yr and
SO2 by 2 kg/yr.
4.3 Hydrogen ICE
Airport Ground Support Equipment (GSE) at CAE contributes to airport emissions of CO2, NOx,
CO and HC (hydrocarbon). Airport GSE includes pickup trucks, maintenance and fuel trucks,
belt loaders and snow removal equipment. Conversion of gasoline ICEs to hydrogen ICEs for
three pick-up trucks (Chevrolet Silverado 1500, 6.0L,V8) provides a lean-burn strategy to
achieve very low NOx, CO and no CO2 and HC emissions.
The H-Team
Wayne State University
College of Engineering
21
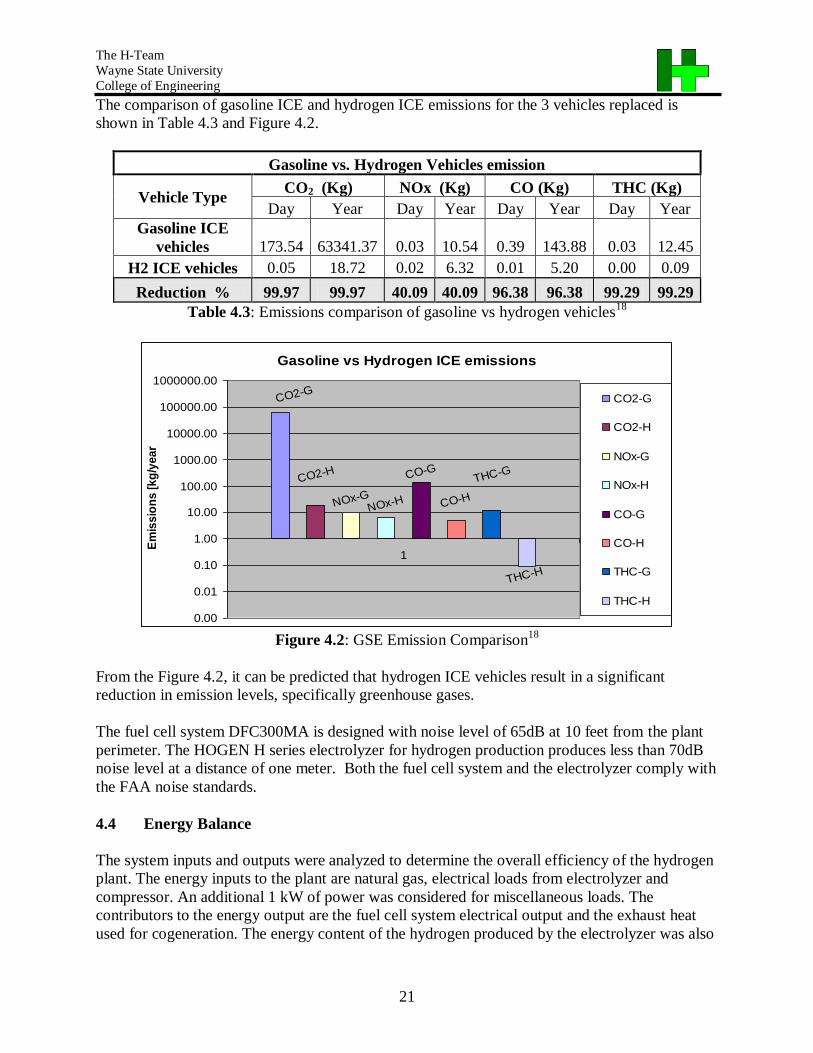
The comparison of gasoline ICE and hydrogen ICE emissions for the 3 vehicles replaced is
shown in Table 4.3 and Figure 4.2.
Gasoline vs. Hydrogen Vehicles emission
Vehicle Type CO2 (Kg) NOx (Kg) CO (Kg) THC (Kg)
Day Year Day Year Day Year Day Year
Gasoline ICE
vehicles 173.54 63341.37 0.03 10.54 0.39 143.88 0.03 12.45
H2 ICE vehicles 0.05 18.72 0.02 6.32 0.01 5.20 0.00 0.09
Reduction % 99.97 99.97 40.09 40.09 96.38 96.38 99.29 99.29
Table 4.3: Emissions comparison of gasoline vs hydrogen vehicles18
Gasoline vs Hydrogen ICE emissions
NOx-H
CO2-G
CO2-H
NOx-G
CO-G
CO-H
THC-G
THC-H
0.00
0.01
0.10
1.00
10.00
100.00
1000.00
10000.00
100000.00
1000000.00
1
Em
iss
ion
s [
kg
/ye
ar]
CO2-G
CO2-H
NOx-G
NOx-H
CO-G
CO-H
THC-G
THC-H
Figure 4.2: GSE Emission Comparison
18
From the Figure 4.2, it can be predicted that hydrogen ICE vehicles result in a significant
reduction in emission levels, specifically greenhouse gases.
The fuel cell system DFC300MA is designed with noise level of 65dB at 10 feet from the plant
perimeter. The HOGEN H series electrolyzer for hydrogen production produces less than 70dB
noise level at a distance of one meter. Both the fuel cell system and the electrolyzer comply with
the FAA noise standards.
4.4 Energy Balance
The system inputs and outputs were analyzed to determine the overall efficiency of the hydrogen
plant. The energy inputs to the plant are natural gas, electrical loads from electrolyzer and
compressor. An additional 1 kW of power was considered for miscellaneous loads. The
contributors to the energy output are the fuel cell system electrical output and the exhaust heat
used for cogeneration. The energy content of the hydrogen produced by the electrolyzer was also

The H-Team
Wayne State University
College of Engineering
22
considered. The following diagram presents the input and output energies for an overall
efficiency of 62.5%.
Overall Effeciency
62.5 %
Fuel Cell Ouput
300 [KW]
Hydrogen produced by
the electrolyzer
21.28 [KW]
Energy recover with
co-generation
105 [KW]
Electrolyzer Load
40.8 [KW]
Compressor Load
2 [KW]
Miscellaneous Loads
1 [KW]
Natural Gas
638 [KW]
Figure 4.3: Energy Balance for the hydrogen plant 2, 5, 6
The H Team performed detailed energy balance calculations for a small scale reformer similar to
the one present in the fuel cell system. The calculations involve determining the energy used
during the chemical reaction as well as the energy used to heat or cool excess materials. Heat
losses out of the reaction chambers are assumed to be negligible in order to simplify calculations.
Equation 4.1 is used to determine the energy and power requirements.
prod reactQ H H 4.1
The H Team determined that in order to produce about 5.69 kg/hr of hydrogen, 15.5 kg/hr of
methane and 60.14 kg/hr of water are required for a typical SMR reaction. Table 4.5 shows the
heat required for each section of the SMR process. Calculations were determined using standard
quantities found in the textbook “Thermodynamics: An Engineering Approach” 19
.
Boiler
HDS
Pre-heater
Steam Methane
Reformer
Reformer
Cooler
Water Gas
Shift Reactor Condenser
Heat
Required 2.878 kJ/s 55.53 kJ/s 80.11 kJ/s -20.34 kJ/s -35.91 kJ/s -10.22 kJ/s
Table 4.5: SMR heat requirements

The H-Team
Wayne State University
College of Engineering
23
5.0 Marketing and Educational Plans
Public acceptance of hydrogen technologies is the goal of the H Team’s marketing and education
plan. Marketing and education programs have been developed to inform the public of the
benefits of implementing hydrogen technologies at the CAE. The marketing plan consists of
three key strategies: guided tours, educational materials, and visual ads.
5.1 Guided Tours
Columbia Metropolitan Airport presently provides tours of the facility. The H Team proposes to
extend the current tour to include the hydrogen plant and the hydrogen ICE vehicles, and an
introductory movie. The movie will describe and show how the hydrogen facility was
constructed, and outline its advantages. After the tour group is shown the video, they will be
brought to the hydrogen plant where the tour guide will show them the equipment and explain
the function of each component. The dispenser will be explained and one of the hydrogen ICE
vehicles will be shown, highlighting the hydrogen tanks located in the truck bed. Finally, the
guide will demonstrate how the vehicle is refueled. At the end of the tour, the patrons will be
guided to a gift shop where they can purchase items, which will further promote hydrogen
technologies.
The goal of this tour is to show the public that hydrogen technology is safe and clean. The guide
will highlight the reduced emissions of the system. Education is an important part of promoting
and fulfilling a hydrogen economy. This program will encourage school field trips to teach
environmental responsibility and showcase hydrogen technologies that lead to a better
environment. The airport will also host an annual hydrogen technology fair. The fair will allow
students to take tours of the facilities, compete in contests and games (for example hydrogen
jeopardy), and take part in a hydrogen science competition where students can display their
research into hydrogen technologies accomplished during the school year.
5.2 Educational Materials
Columbia Metropolitan Airport already has an education center, which the H Team will expand
to include materials on the hydrogen technology implemented at the site. A series of pamphlets
will be created that give detailed information on the major components of the system such as the
fuel cell, electrolyzer, and hydrogen ICE vehicles.
5.3 Visual Ads
The H Team will use several ads to promote awareness of the improvements implemented at the
airport. Posters will be placed throughout the terminals that outline the benefit of using
hydrogen technology and briefly describe the advantages of using the technology at the airport.
The H Team will also purchase four LCD screens to place around the airport terminals. The
screens will repeatedly play an advertisement that describes the hydrogen power plant and its
benefits to the airport and the community.

The H-Team
Wayne State University
College of Engineering
24
Since people frequently use their laptops in the airport terminals, the H Team has decided to
replace the electrical outlet covers at the airport with covers that say hydrogen generated
electricity. When people plug in their laptops, they will immediately see where the electricity is
coming from. Air-brushed signs, saying “H2” in green, will be placed on the sides of the
hydrogen ICE vehicles making them a moving advertisement.
The H-Team will also advertise the hydrogen power plant through the internet and the local
newspaper. Prior to the completion of the power plant, ads will be placed in the local newspaper,
as shown on the next page, and on the airport website to show that state of the art hydrogen
technology is being installed at the airport.
A sample ad is presented on the following page. The ad is meant to peak the interest of the
viewer by showing them that hydrogen technology means the protection of the earth. Aspects of
the design are shown with the intent highlighting the free tour that the reader should take
advantage of.

The H-Team
Wayne State University
College of Engineering
25
H2
Come join the H Team on our
journey to the hydrogen future
at Columbia Metropolitan
Airport.
Experience our new hydrogen
powered 2008 Chevy Silverados
& take a tour of the
revolutionary hydrogen fuel cell
power plant!
PROTECT YOUR FUTURE WITH HYDROGEN!
THE PATH TO HYDROGEN
The H-Team
Wayne State University
College of Engineering
26
6.0 References
1. Live Search Maps. 2007. Microsoft Corporation. 30 Nov. 2007 <http://maps.live.com/>.
2. DFC300MA ™ Standard Powerplant Specification Summary. FuelCell Energy, Inc.,
2006.
3. Myers, Duane B., Brian D. James, John S. Lettow, C.e. Thomas, and Reed C. Kuhn.
"Cost and Performance Comparison of Stationary Hydrogen Fueling Appliances."
Directed Technologies, Inc. Apr. 2002. 10 Nov. 2007
<http://www.directedtechnologies.com/pages/p_fuel_options.html>.
4. PURELAB Option-S 7/15: Operator Manual. Lowell, MA: Vivendi Water Systems Ltd.,
2000.
5. HOGEN Hydrogen Generation System Technical Specifications. Wallingford:
Distributed Energy Systems, 2007.
6. "RIX 4VX Industrial Gas/Air Compressor Oil-Free Gas or Air Compression to 6000
Psig." RIX Industries. Aug. 2000. 30 Nov. 2007
<http://www.rixindustries.com/pdf/4vx.pdf>.
7. Ponist, Mark. "Quote Request." Email to the author. 21 Nov. 2007.
8. "Hydrogen Dispensers." General Hydrogen. 30 Nov. 2007
<http://www.generalhydrogen.com/fueling_dispensers.shtml>.
9. HICEV America US DOE Advanced Vehicle Testing Activity. Electric Transportation
Applications, 2005.
10. "Shop GM Vehicles." General Motors. 30 Nov. 2007
<http://www.gm.com/shop/results.jsp?bodyStyle=11&bodyStyle=12&bodyStyle=04&bo
dyStyle=05&bodyStyle=03&bodyStyle=13&bodyStyle=01&lowPrice=10000&highPrice
=65000&fuel=E85&fuel=HYBRID&fuel=DIESEL&fuel=30MPG&fuel=GAS&>.
11. Morrow, Kevin. "Hydrogen ICE Quote." Email to the author. 06 Nov. 2007.
12. Peters, Max S., Ronald E. West, and Klaus D. Timmerhaus. Plant Design and Economics
for Chemical Engineers. 5th ed. New York: McGraw Hill, 2003.
13. "Frequently Asked Questions." The Hydrogen Education Foundation's Hydrogen Student
Design Contest 2007/2008: Hydrogen Applications for Airports. 2007. Technology
Transition Corporation. 30 Nov. 2007 <http://www.hydrogencontest.com/faq.asp>.
14. "Utilities Department." City of Cayce South Carolina. 30 Nov. 2007
<http://www.cityofcayce-sc.gov/utilities.aspx>.

The H-Team
Wayne State University
College of Engineering
27
15. "Fuel Cell Handbook (Seventh Edition)." National Energy Technology Laboratory. Nov.
2004. EG&G Technical Services. 10 Oct. 2007
<http://www.netl.doe.gov/technologies/coalpower/fuelcells/seca/pubs/FCHandbook7.pdf
>.
16. " Rate 24 Time-of-Use Large General Service (2007)." South Carolina Electric & Gas
Company. 30 Nov. 2007 <http://www.sceg.com/en/commercial-and-
industrial/rates/electric-rates/>.
17. "Electric Power Pollution Calculator." Texas State Energy Conservation Office. 29 Nov.
2007. 29 Nov. 2007 <http://www.infinitepower.org/calc_pollution.htm>.
18. Morrow, Kevin. "Chevrolet Silverado/GMC Sierra HICE Conversion." ETEC. Roush. 17
Nov. 2007 <http://www.etecevs.com/hydrogen_ICE_vehicles/HICE_conversion.php>.
19. Cengel, Yunus A., and Michael A. Boles. Thermodynamics: an Engineering Approach.
4th ed. McGraw-Hill, 2001. 824.
20. Wiring info

The H-Team
Wayne State University
College of Engineering
Appendix - 1
Appendix
The wiring cost breakdown is shown in Tables A.1 and A.2.
Cable Routing Cable Type* Cable Cost/
1000 ft
Design
Length (ft)
Cost/
300ft
From CAE 480volt Buss to
Electrolyzer 3-#2, 1-#4 $ 1,726 300 $ 518
From CAE 480volt Buss to
Electrolyzer Cooling System 3-#4, 1-#4 $ 1,459 300 $ 438
From CAE 480volt Buss to H2
Compressor 3-#4, 1-#4 $ 1,459 300 $ 438
From CAE 480volt Buss to SMR 3-#4/0, 1-#2/0 $ 3,526 300 $ 1,058
From CAE 480volt Buss to a new
25kVA transformer to a new
120/240volt Panel
3-#2, 1-#4 $ 1,726 300 $ 518
From the Inverter Buss to existing
transformer for the Main Lobby 3-#2, 1-#4 $ 1,726 300 $ 518
From the Inverter Buss to existing
transformer for the Terminal Front
Ticket Counter
3-#2, 1-#4 $ 1,726 300 $ 518
From the Inverter Buss to existing
transformer for the Lighting and
Ticket Counter
3-#2, 1-#4 $ 1,726 300 $ 518
From the Inverter Buss to existing
transformer for the Security Room
East Dock
3-#4, 1-#4 $ 1,459 300 $ 438
From the Inverter Buss to existing
transformer for the Security Room
West Dock
3-#4, 1-#4 $ 1,459 300 $ 438
From the Inverter Buss to existing
transformer for the Parking Garage 3-#4, 1-#4 $ 1,459 300 $ 438
From the Inverter Buss to existing
transformer for the Parking Garage 3-#4, 1-#4 $ 1,459 300 $ 438
*Southwire, Quadruplex, 600volt,
Sureseal20
$ 3,304
Table A.1
The H-Team
Wayne State University
College of Engineering
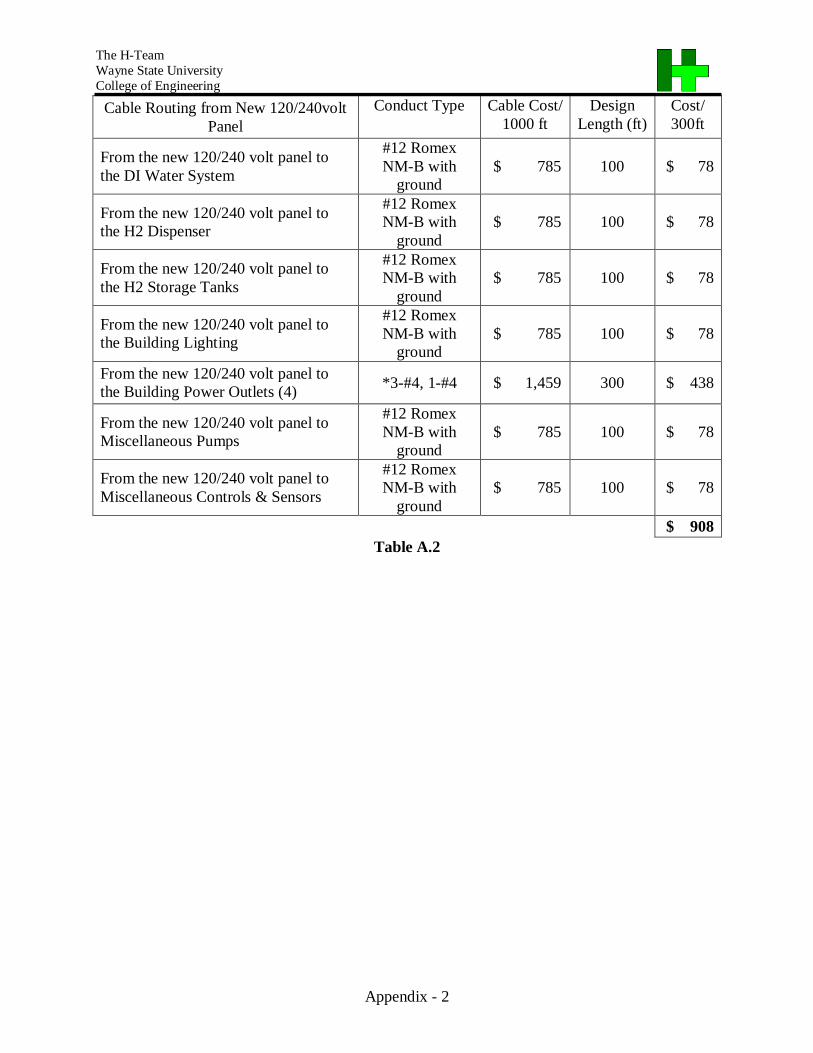
Appendix - 2
Cable Routing from New 120/240volt
Panel
Conduct Type Cable Cost/
1000 ft
Design
Length (ft)
Cost/
300ft
From the new 120/240 volt panel to
the DI Water System
#12 Romex
NM-B with
ground
$ 785 100 $ 78
From the new 120/240 volt panel to
the H2 Dispenser
#12 Romex
NM-B with
ground
$ 785 100 $ 78
From the new 120/240 volt panel to
the H2 Storage Tanks
#12 Romex
NM-B with
ground
$ 785 100 $ 78
From the new 120/240 volt panel to
the Building Lighting
#12 Romex
NM-B with
ground
$ 785 100 $ 78
From the new 120/240 volt panel to
the Building Power Outlets (4) *3-#4, 1-#4 $ 1,459 300 $ 438
From the new 120/240 volt panel to
Miscellaneous Pumps
#12 Romex
NM-B with
ground
$ 785 100 $ 78
From the new 120/240 volt panel to
Miscellaneous Controls & Sensors
#12 Romex
NM-B with
ground
$ 785 100 $ 78
$ 908
Table A.2

The H-Team
Wayne State University
College of Engineering
Appendix - 3
Operating Scenario 1
Shown below, the DC/AC inverter (highlighted in blue) supplies electrical power to the
electrolyzer, two electrolyzer balance of plant loads, and three CAE existing loads. The CAE
480volt buss supplies electrical power (highlighted in red) to a new 25 kVA transformer and
120/240 VAC circuit breaker panel which has 7 loads. The CAE 480volt buss supplies electrical
power to a 4 CAE loads and the SMR system.
Figure A.1
CA
E
48
0V
AC
Bu
ss
, 3P
CA
E
48
0V
AC
Bu
ss
, 3P
480 V
AC
3P
Inve
rter
DC
/AC
480 V
AC
3P
Inve
rter
DC
/AC
CA
E
48
0V
AC
Bu
ss
, 3P
CA
E
48
0V
AC
Bu
ss
, 3P
480 V
AC
3P
Inve
rter
DC
/AC
480 V
AC
3P
Inve
rter
DC
/AC
480 V
AC
3P
Inve
rter
DC
/AC
480 V
AC
3P
Inve
rter
DC
/AC
480 V
AC
3P
Inve
rter
DC
/AC
480 V
AC
3P
Inve
rter
DC
/AC

The H-Team
Wayne State University
College of Engineering
Appendix - 4
Operating Scenario 2
Shown below, the DC-to-AC inverter (highlighted in blue) supplies electrical power to seven
CAE existing loads. The CAE 480volt buss suppliers electrical power (highlighted in red) to a
new 25 kVA transformer and 120/240 VAC circuit breaker panel which has 7 loads, the SMR
system, the electrolyzer, and two electrolyzer balance of plant loads
Figure A.2
CA
E
48
0V
AC
Bu
ss
, 3P
CA
E
48
0V
AC
Bu
ss
, 3P
480
VA
C
3P
Inve
rter
DC
/AC
CA
E
48
0V
AC
Bu
ss
, 3P
CA
E
48
0V
AC
Bu
ss
, 3P
480
VA
C
3P
Inve
rter
DC
/AC
CA
E
48
0V
AC
Bu
ss
, 3P
480
VA
C
3P
Inve
rter
DC
/AC
480
VA
C
3P
Inve
rter
DC
/AC

The H-Team
Wayne State University
College of Engineering
Appendix - 5
The following table shows that for the electrical power consumed, the carbon dioxide (CO2)
emissions are the major contributor to air pollution at Columbia Metropolitan Airport. Emissions
reach peak values during summer months when the electrical power consumption is highest for
the whole year.
CAE Air Pollution
Month
Total Energy Consumption Charges ($)
Total Energy Consumption
(kWh)
Greenhouse Gases (CO2),
lb/month
Nitrogen Oxides (NOx),
lb/month
Sulfur Dioxide (SO2),
lb/month
Jan 48,438 736,670 1,438,717 2,348 8,745
Feb 47,073 715,912 1,398,176 2,282 8,499
Mar 49,231 748,730 1,462,270 2,386 8,888
Apr 48,457 736,960 1,439,283 2,349 8,748
May 57,471 874,052 1,707,024 2,786 10,376
Jun 56,979 866,564 1,692,399 2,762 10,287
Jul 60,871 925,766 1,808,021 2,950 10,990
Aug 58,963 896,742 1,751,337 2,858 10,645
Sep 54,836 833,974 1,628,751 2,658 9,900
Oct 52,351 796,178 1,554,936 2,537 9,451
Nov 50,149 762,701 1,489,555 2,431 9,054
Dec 47,162 717,259 1,400,807 2,286 8,515
Average 52,665 800,959 1,564,273 2,553 9,508
Table A.3: Simulated results of current total electric charges and emission levels17