The Grunfeld Data at 50statmath.wu.ac.at/~zeileis/papers/Kleiber+Zeileis-2010.pdf · 2 The Grunfeld...
16
The Grunfeld Data at 50 Christian Kleiber Universit¨ at Basel Achim Zeileis Universit¨ at Innsbruck Abstract This paper revisits Grunfeld’s well-known investment data, one of the most widely used data sets in all of applied econometrics, on the occasion of their 50th anniver- sary. It presents, apparently for the first time after the publication of the original Chicago Ph.D. thesis, the full data set, points out errors and inconsistencies in several currently available versions, and also revisits a number of empirical studies from the literature of the last five decades. Our findings provide a cautionary tale on the use of widely known data and underline the need for mandatory data and code archives. Keywords : multiple-equation models, panel data, reproducibility. JEL classification : C80, C23, C30. 1. Introduction Yehuda Grunfeld – or rather Gr¨ unfeld, as the signature on the page of his Ph.D. thesis (Grunfeld 1958) pertaining to reproduction rights reveals – was an exceptionally promising applied econometrician in the second half of the 1950s who died in a drowning accident at the age of 30 (Patinkin 1961; Goodman and Grunfeld 1961). His thesis at the University of Chicago, entitled“The Determinants of Corporate Investment”, contains, in an appendix, panel data on a selected set of large US corporations for the period 1935–1954. After his untimely death, these data have been used for illustrating multiple-equation and panel data methodology in research and teaching. In fact, as noted by Greene (2003, p. 329, fn. 39), [a]lthough admittedly not current, these data are unusually cooperative for illustrating the different aspects of estimating systems of regression equations. This paper traces the history of the Grunfeld data over the last five decades and points out errors and inconsistencies in the available variants. It emerges that none of the pre- viously available versions is both complete and correct. An extensive replication exercise reveals that many empirical results are reproducible, at least to a reasonable degree of approximation, once the appropriate version of the data is identified. Our findings provide a cautionary tale on the use of widely known data and would seem to underline the need for wider adoption of data and code archives, an issue that has gained This is a preprint of an article published in German Economic Review, 11(4), 404–417. doi:10.1111/j.1468-0475.2010.00513.x Copyright 2010 The Authors German Economic Review 2010 Verein f¨ ur Socialpolitik and Blackwell Publishing Ltd.
Transcript of The Grunfeld Data at 50statmath.wu.ac.at/~zeileis/papers/Kleiber+Zeileis-2010.pdf · 2 The Grunfeld...
The Grunfeld Data at 50
Christian KleiberUniversitat Basel
Achim ZeileisUniversitat Innsbruck
Abstract
This paper revisits Grunfeld’s well-known investment data, one of the most widelyused data sets in all of applied econometrics, on the occasion of their 50th anniver-sary. It presents, apparently for the first time after the publication of the originalChicago Ph.D. thesis, the full data set, points out errors and inconsistencies in severalcurrently available versions, and also revisits a number of empirical studies from theliterature of the last five decades. Our findings provide a cautionary tale on the useof widely known data and underline the need for mandatory data and code archives.
Keywords: multiple-equation models, panel data, reproducibility.JEL classification: C80, C23, C30.
1. Introduction
Yehuda Grunfeld – or rather Grunfeld, as the signature on the page of his Ph.D. thesis(Grunfeld 1958) pertaining to reproduction rights reveals – was an exceptionally promisingapplied econometrician in the second half of the 1950s who died in a drowning accident atthe age of 30 (Patinkin 1961; Goodman and Grunfeld 1961). His thesis at the University ofChicago, entitled “The Determinants of Corporate Investment”, contains, in an appendix,panel data on a selected set of large US corporations for the period 1935–1954. After hisuntimely death, these data have been used for illustrating multiple-equation and panel datamethodology in research and teaching. In fact, as noted by Greene (2003, p. 329, fn. 39),
[a]lthough admittedly not current, these data are unusually cooperative forillustrating the different aspects of estimating systems of regression equations.
This paper traces the history of the Grunfeld data over the last five decades and pointsout errors and inconsistencies in the available variants. It emerges that none of the pre-viously available versions is both complete and correct. An extensive replication exercisereveals that many empirical results are reproducible, at least to a reasonable degree ofapproximation, once the appropriate version of the data is identified.
Our findings provide a cautionary tale on the use of widely known data and would seem tounderline the need for wider adoption of data and code archives, an issue that has gained
This is a preprint of an article published in German Economic Review, 11(4), 404–417.doi:10.1111/j.1468-0475.2010.00513.x
Copyright © 2010 The AuthorsGerman Economic Review © 2010 Verein fur Socialpolitik and Blackwell Publishing Ltd.
2 The Grunfeld Data at 50
great significance in the wake of McCullough and Vinod (2003). As a result of the substan-tial problems with replicating a single issue of the American Economic Review reportedin that paper, several leading economics journals, among them the American EconomicReview, Econometrica, the Journal of Political Economy, the Review of Economic Studiesand, more recently, the Review of Economics and Statistics, introduced mandatory dataand code archives for all new submissions. Previous investigations into the current status ofreproducibility in economics have uncovered problems with data construction (Antonovicsand Goldberger 2005), model specification and identification issues (McCullough and Vinod2003) and numerical problems (Zeileis and Kleiber 2005). A more disturbing perspectiveis fraud (Todter 2009). Here we consider a hitherto unexplored issue, the effect of widelyused but flawed data. Our attempts at replication described below illustrate the widespreadimpact that bad data can have and underline that data-alone archives will not be able tosolve all ensuing problems, instead mandatory data and code archives are required.
To briefly illustrate the problems with widely used data in the virtual absence of dataarchives, we know of an author who tried to implement a number of diagnostic tests forpanel regressions, namely those of Bera et al. (2001), and was unable to replicate the Beraet al. (2001) numerical illustrations when testing his code. It emerged that his code wascorrect, but that he unknowingly used the wrong version of the Grunfeld data. Specifically,his version was error-free while Bera et al. (2001) used a version containing three errors;once these errors are reintroduced, their computations are reproducible. We provide codefor this in the online supplements to this paper, described in greater detail in Appendix A.In addition, these online complements provide the complete original data set along withpreviously available versions as well as replication files for more than a dozen publications.
2. The story of a data set
What are the Grunfeld data? Our interest was sparked, while working on Kleiber andZeileis (2008), by the fact that there exist two widely used versions, a 10-firm version pop-ularized by Maddala (1977) and a five-firm subset version popularized by Greene (2003)1.Both authors refer to Boot and de Wit (1960) as their source, a paper that provides datafor 10 firms. Interestingly, none of the two versions is error-free, nor does use of the rele-vant subset of the larger data set lead to the same estimates as the smaller one. The factthat both versions are not error-free is known from a suite of TSP benchmarks providedby Cummins (2002); however, there are more errors than previously noted and also a fur-ther widely known version with a different set of errors, on which more below. Perusal ofsome of the references given by Maddala and Greene, among them Grunfeld and Griliches(1960) and Griliches and Wallace (1965), suggested that Boot and de Wit only provide asubset of the original data and that data for at least one further corporation, namely forAmerican Steel Foundries, had been available to Grunfeld. A key reference was Swamy
1 When referring to textbooks with several editions, we either cite the most recent edition or, if thereare substantial differences, the edition that contains the most extensive analysis using the Grunfeld data.In the case of Greene’s text, this is the 5th edition (Greene 2003).
Copyright © 2010 The AuthorsGerman Economic Review © 2010 Verein fur Socialpolitik and Blackwell Publishing Ltd.

Christian Kleiber, Achim Zeileis 3
Table 1: The Grunfeld data.
Variable Descriptionfirm General Motors (GM), US Steel (US), General Electric (GE), Chrysler
(CH), Atlantic Refining (AR), IBM, Union Oil (UO), Westinghouse(WH), Goodyear (GY), Diamond Match (DM), American Steel (AS).
investment Gross investment, defined as additions to plant and equipment plusmaintenance and repairs in millions of dollars deflated by the implicitprice deflator of producers’ durable equipment (base 1947).
value Market value of the firm, defined as the price of common shares atDecember 31 (or, for WH, IBM and CH, the average price of Decem-ber 31 and January 31 of the following year) times the number ofcommon shares outstanding plus price of preferred shares at Decem-ber 31 (or average price of December 31 and January 31 of the followingyear) times number of preferred shares plus total book value of debt atDecember 31 in millions of dollars deflated by the implicit GNP pricedeflator (base 1947).
capital Stock of plant and equipment, defined as the accumulated sum of netadditions to plant and equipment deflated by the implicit price defla-tor for producers’ durable equipment (base 1947) minus depreciationallowance deflated by depreciation expense deflator (10 years movingaverage of wholesale price index of metals and metal products, base1947).
(1970), who claims (p. 320) to use all firms but also claims to have taken the data fromBoot and de Wit (1960), but this is clearly at variance with the fact that the latter paperonly has 10 firms. How many firms were there originally, and what were the reasons forusing the various subsets? Only the original source could shed light on these issues.
Grunfeld’s Ph.D. thesis
Grunfeld’s 1958 thesis reveals that beyond the corporations considered by Boot and de Witthere is indeed only American Steel Foundries, thus he worked with 11 firms in total. Thefull data set is given in the appendix of the thesis (Grunfeld 1958, Appendix, Tables 2–9 and 11–13). Table 1 provides the complete list of firms as well as descriptions of allvariables (taken from Grunfeld 1958, pp. 153–154, and Griliches and Wallace 1965).
However, Grunfeld was mainly concerned with eight corporations, namely AR, US, UO,GY, DM, AS, GM and GE. The selection of these firms is described in Chapter 2 of thethesis and was guided by consistency requirements. The data are analyzed in Chapters 3and 4. The fifth and final chapter performs various robustness checks, among them anextension of the sample period to the years 1955 (for all eight previously considered corpo-
Copyright © 2010 The AuthorsGerman Economic Review © 2010 Verein fur Socialpolitik and Blackwell Publishing Ltd.

4 The Grunfeld Data at 50
rations) and 1956 (for all but GE, for which these data were unavailable) and also to threefurther large corporations. It is here where the remaining firms (WH, IBM, CH) appearfor the first time. Grunfeld also notes (pp. 147–148) that the definition of the variablesis not fully consistent, in that he employs “the ‘best’ methods at [his] disposal” for thethree new firms, namely various corrections developed during the course of the precedingchapters. Also, in measuring the value of the firm he now uses “average stock quotationsof December 31 and January 31 instead of the single quotations of December 31 used forseven of the eight corporations analyzed previously”. This suggests that his measurementsare of varying quality.
Of all these firms, DM and AS are somewhat smaller than the others, one reason fortheir inclusion was to see whether certain hypotheses also hold true for these smallercorporations. The sample period 1935–1954 is a result of the facts that from the year 1935on expenditures on gross investment and on maintenance and repairs were collected by theSecurities and Exchange Commission for all corporations and that Grunfeld’s study wasstarted in 1955 (p. 12). Our version, therefore, presents data on all 11 firms for the longestperiod for which all observations are available, that is, for 1935–1954. For completeness, wealso provide the remaining data for the years 1955 and 1956, where available, in a separatefile.
Early journal publications
The data were published in a journal for the first time by Boot and de Wit (1960), whoprovide, as noted above, data for 10 firms (all but AS). These authors are also responsiblefor the commonly-used ordering of the firms, which is by decreasing mean investment.Interestingly, AS is the second smallest according to this definition; it remains unclear whyit was excluded by Boot and de Wit. This abridged version has been used widely, andmany subsequent authors are under the impression that it represents the full data set. Aprinting glitch in this paper is also responsible for one of the errors that occurs in laterpublications: investment for AR for the year 1953 is correctly given as 91.90, but the first9 is difficult to read and might be taken for an 8.
In the 1960s, subsets of the data are also used by Grunfeld and Griliches (1960), Grilichesand Wallace (1965) and, perhaps most notably, in the course of the development of seem-ingly unrelated regression (SUR) methodology by Zellner (1962) and later by Kmenta andGilbert (1968, 1970). Griliches and Wallace note that “only six of the original eleven firmsare used in th[eir] study, because [they] did not succeed in reproducing and extending theoriginal set of data for the others” (fn. 8, p. 313). The SUR papers employ just two firms,GE and WH.
Textbook publications
In the 1970s, textbook authors begin to use Grunfeld’s data for illustrating multiple equa-tion and panel data models. An early example is Theil (1971) who, following the emergingliterature on SUR methodology, employs the GE as well as the WH data when illustrating
Copyright © 2010 The AuthorsGerman Economic Review © 2010 Verein fur Socialpolitik and Blackwell Publishing Ltd.
Christian Kleiber, Achim Zeileis 5
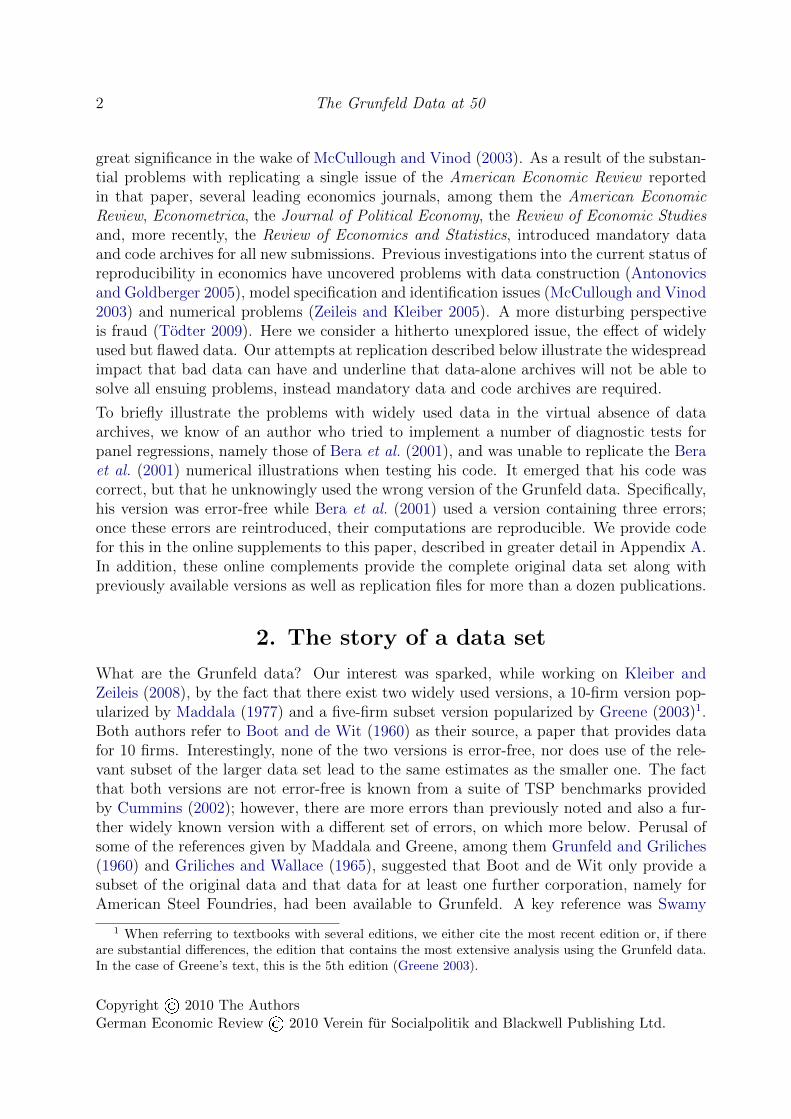
Table 2: Versions of the Grunfeld data.
Source Firms used ErrorsGrunfeld (1958, Tables 2–9, 11–13)
all 11 none (by definition)
Boot and de Wit (1960, Ta-ble 10)
10 (all but AS) none (with printing glitch forinvestar,1953)
Theil (1971, Table 7.1) 2 (GE, WH) noneMaddala (1977, Table 10-4) 10 (all but AS) capitalus,1946 = 232.60,
investar,1953 = 81.90AR mislabeled “Atlantic Rich-field”
Vinod and Ullah (1981, Ta-ble 10.1)
10 (all but AS) see Maddala (1977)
Fomby et al. (1984, p. 167–168) 3 (WH, GE,GM)
none
Griffiths et al. (1993, Ta-ble 17B.1)
10 (all but AS) see Vinod and Ullah (1981), plusinvestus,1952 = 645.2
Baltagi (2002,grunfeld.dat.txt)
10 (all but AS) none
Greene (2003, TableF13-1.txt) 5 (GM, US,GE, CH, WH)
capitalus,1946 = 232.6,investus,1940 = 261.6,investus,1952 = 645.2
Baltagi (2005, Grunfeld.fil) 10 (all but AS) noneGreene (2008, Grunfeld.txt) 10 (all but AS) noneHill et al. (2008, grunfeld.dat) 10 (all but AS) see Griffiths et al. (1993)
SUR and aggregation issues. Maddala (1977) provides further examples of these techniquesbut considers all the firms previously used by Boot and de Wit (1960). However, a fewerrors have crept in there and these were propagated to later versions, for example, thewidely used text by Greene (2003). Specifically, Maddala has investment for the year 1953as 81.90 for AR, while the correct value is 91.90 (the printing glitch mentioned above).Also, capital for the year 1946 is given as 232.6 for US, while the correct value is 132.60.These two errors are mentioned by Cummins (2002). We also note that Maddala usesthe label “Atlantic Richfield” instead of “Atlantic Refining”. Atlantic Richfield Company(ARCO) was formed by the merger of East Coast-based Atlantic Refining and California-based Richfield Petroleum in 1966 (Encyclopedia Britannica 2009). Maddala states (p. 216)that he reproduces data for 10 firms and that “some of these are different from the onesconsidered in the Grunfeld-Griliches paper”, without further explanation (he does not useAS while Grunfeld and Griliches exclude WH, IBM and CH). Interestingly, the error forcapitalus,1946 appears in the printed data but is apparently not used in his computations.
Copyright © 2010 The AuthorsGerman Economic Review © 2010 Verein fur Socialpolitik and Blackwell Publishing Ltd.

6 The Grunfeld Data at 50
selects 2(GE, WH)
select 3(WH, GE, GM)
2 errorsmislabels AR
1 error
2 errors + selects 5(GM, US, GE, CH, WH)
?
select 10(all but AS)
●Grunfeld●Boot, de Wit
●Theil
●Maddala
●Vinod, Ullah
●Fomby, Hill, Johnson
●Griffiths, Hill, Judge●Greene/1st
●Greene/5th ●Baltagi/Econ
●Baltagi/Panel
●Greene/6th ●Kleiber, Zeileis●Hill, Griffiths, Lim
2010
2000
1990
1980
1970
1960
Figure 1: History of the Grunfeld data.
A few years later, Vinod and Ullah (1981), in their monograph on regression methods,also present the 10-firm version which they claim to have taken from Boot and de Wit.However, a closer look reveals that they have the same errors as Maddala. Like Maddala,they also call AR “Atlantic Richfield”.
In the mid-1980s, Fomby et al. (1984, Chapter 8.4) use the Grunfeld data when discussingFGLS/SUR methods. Following Zellner (1962) and Theil (1971), they consider GE andWH for illustration but do not present any empirical results. In the exercises (pp. 167–168),they provide data for three firms (WH, GE, GM), cite Grunfeld (1958) and ask the readerto compute various estimators.
In textbooks, the correct version for the 10-firm data set resurfaces only in the 1990s in thepanel data text by Baltagi (1995). Meanwhile, Greene (1990) opted for a smaller data setcomprising five firms that were taken from Maddala. Fortunately, these did not include thedata for AR hence he did not inherit the error pertaining to that firm; unfortunately, theydid include the data for US with the error mentioned above, namely capitalus,1946 = 232.6.In addition, two further errors for US were introduced there, namely investment for theyear 1940 is given as 261.6 (the correct value is 361.6) and investment for the year 1952 as645.2 (the correct value is 645.5). The former two errors are noted by Cummins (2002),
Copyright © 2010 The AuthorsGerman Economic Review © 2010 Verein fur Socialpolitik and Blackwell Publishing Ltd.

Christian Kleiber, Achim Zeileis 7
the third appears to have gone unnoticed so far.
To muddy the water even further, Griffiths et al. (1993) state that their 10-firm version ofthe Grunfeld data is from “a recent book by Vinod and Ullah” but give no exact reference.They have one additional error compared to Vinod and Ullah, namely investus,1952 = 645.2.Astonishingly, this is one of the errors also introduced by Greene, while the other errorintroduced there – for the same firm! – does not figure here. In our correspondence withProfessors Greene, Griffiths and Hill we have been unable to shed light on this unlikelycoincidence. These errors reappear in the still more recent Hill et al. (2008) text and itsonline supplements.
In the most recent edition of Greene’s text (Greene 2008) there is a further variation on thetheme, in that now a four-firm subset (namely GM, US, GE, and CH) is used for illustratingSUR estimation. The online complements to Greene’s text now provide the (error-free) 10-firm version of the data, which seem to have been taken from Baltagi (2005) as the entriesare physically identical (except for a mal-formatted header line that is comma-separatedinstead of space-separated).
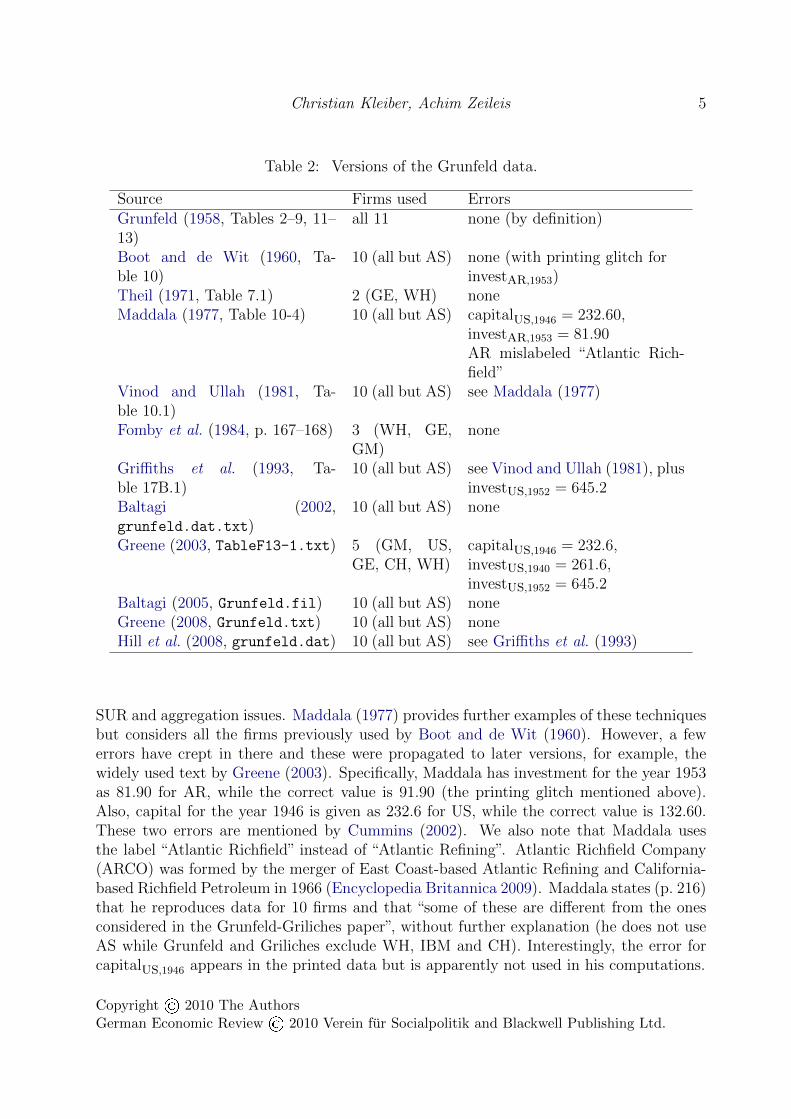
Table 2 provides an overview of the various available versions and the errors containedtherein, all pertaining to either US or AR. Figure 1 visualizes the history of the data set,and Appendix A presents some further details.
3. Replication
The online supplements to this paper provide replication files for selected results from var-ious papers and textbooks as well as for Grunfeld’s thesis. Our collection is by no meansexhaustive. In this section, we confine ourselves to contributions published in leadingeconomics and statistics journals. The papers considered, the relevant subsets of the cor-porations and the methods employed are given in Table 3. The main obstacle to successfulreplication is the identification of the correct – or rather the appropriate damaged – versionof the data. Once this version is identified many results are reproducible, albeit with someeffort. We note in passing that R2s from old papers are not always reproducible althoughOLS estimates often are, perhaps a result of the fact that there are many ways to computeR2 which might give different answers, at least in single-precision computations.
For brevity, we do not comment on the numerous textbook examples. Instead, we referthe interested reader to the online supplements, and, in the case of Greene (2003), to theextensive online discussion and errata for that text. For the most recent edition (Greene2008), we just note that the results using the four-firm subset mentioned above are repro-ducible. Now there is only one example (pertaining to SUR), but several exercises alsomake use of the data.
We now briefly discuss selected results from our replications:
� Grunfeld (1958): Despite dating back half a century, the OLS estimates presentedin Grunfeld’s Ph.D. thesis are almost perfectly reproducible. For 10 out of 11 firms,
Copyright © 2010 The AuthorsGerman Economic Review © 2010 Verein fur Socialpolitik and Blackwell Publishing Ltd.

8 The Grunfeld Data at 50
Table 3: Selected papers using subsets of the Grunfeld data.
Source Firms MethodsGrunfeld and Griliches(1960)
8 (GM, GE, US,AR, UO, DM, GY,AS)
OLS for individual firms andaggregate
Boot and de Wit (1960) 10 (all but AS) OLS for individual firms andaggregate
Zellner (1962) 2 (GE, WH) OLS, SURGriliches and Wallace(1965)
6 (CH, GY, AR,WH, UO, GM)
OLS for individual firms andaggregate
Kmenta and Gilbert (1968) 2 (GE, WH) OLS, SUR, iteratedSUR/ML
Swamy (1970) all 11 random coefficient regressionKoenker and Portnoy(1990)
2 (GE, WH) OLS, SUR, single equationand multivariate M estima-tion
Bera et al. (2001) 5 (GM, US, GE,CH, WH)
diagnostic tests for paneldata regressions
there are occasional but very minor variations concerning the last digit given. Theonly problem is General Motors, for which the coefficients on capital and value aregiven as 0.4 and 0.116 (we take the former to mean 0.400 as all other values arerounded to three digits by Grunfeld), whereas our computations suggest 0.371 and0.119. Also, Grunfeld’s R2 is 0.919 while we obtain 0.921. This R2 for GM is cited byGrunfeld and Griliches (1960) and also reappears in Griliches and Wallace (1965). Inview of the excellent agreement of all other estimates numerical problems are unlikely.Instead, the following observation suggests that the problem is more severe.
� Grunfeld also provides, in Table 10 of his appendix, the aggregate data for his maineight corporations. These differ from the aggregate obtained from the individualdata for the various firms and, regrettably, also lead to estimates that differ fromthose presented in his thesis. The fact that his regression for these aggregate datadiffers from our estimates combined with our earlier observation on problems with theGM regression suggests that copying or typesetting errors are improbable and that,instead, there are differences in the data, be they wrong inputs or unacknowledgeddata revisions. The explanation for these remaining discrepancies is probably lost toantiquity.
� Boot and de Wit (1960): Interestingly, the estimates of Boot and de Wit are repro-ducible, including those for GM. The only notable difference pertains to the standarderror of the coefficient on capital for US, given as 0.045 whereas 0.142 would seem to
Copyright © 2010 The AuthorsGerman Economic Review © 2010 Verein fur Socialpolitik and Blackwell Publishing Ltd.

Christian Kleiber, Achim Zeileis 9
be correct. Also, for the aggregate regression given on p. 10, the standard errors ofthe slopes appear to have been interchanged. Furthermore, Boot and de Wit appearto use an adjusted R2 without degrees-of-freedom adjustment for the total sum ofsquares (TSS), possibly inspired by sources such as Theil (1961).
� Zellner (1962): His OLS estimates are reproducible to no fewer than eight digits.However, his SUR example – the example introducing the widely used SUR estimator!– is not reproducible. Kmenta and Gilbert (1968, p. 1200, fn. 12) maintain that the“slight differences [between their own and Zellner’s estimates]... are presumably dueto errors of rounding”, but this is an unlikely explanation given that Zellner’s OLSestimates are impressively accurate even after 46 years. Instead, a closer look at thecalculations presented on p. 359 suggests that an algebraic error is responsible forthe discrepancies. Specifically, the moment matrices are correct, but the alleged RSSU>U does not correspond to a multivariate linear regression.
� Griliches and Wallace (1965) reproduce Grunfeld’s estimates for six firms, they alsoadd an aggregate relation based on these six firms. This aggregate relation is againnot reproducible, since their subset includes GM this would seem to support ourhypothesis that, for this corporation, Grunfeld used data that differed from thosegiven in his thesis.
� Kmenta and Gilbert (1968) present ML estimates for the SUR model, noting thatthese coincide with iterated SUR estimates (a fact that was proved only severalyears later). Their results are reproducible, but for their SUR and ML estimates thecoefficients and standard errors for capital and value pertaining to Westinghouse areinterchanged.
� Swamy (1970) claims to use all 11 firms but also claims to have taken the datafrom Boot and de Wit (1960), a claim that is at variance with the fact that thelatter paper only has 10 firms. However, Swamy (1971), an extension of his 1968thesis at the University of Wisconsin, reveals that indeed all 11 firms were usedin these computations. Thus Swamy’s 1970 Econometrica paper and 1971 bookare of special interest in that they are the only publications we are aware of thatmake use of the full data set. In view of the rather sparse information given inhis paper, replication of its random coefficient estimates proved far from trivial.Of course, its main contributions and focus are theoretical; the computations onlyillustrate the main findings. Numerical experiments with R and Stata, using raw aswell as demeaned data, resulted in estimates that are quite close to those reportedin Swamy’s paper. Advances in numerical algorithms and almost four decades ofsoftware development would seem to account for the remaining discrepancies.
� Koenker and Portnoy (1990): Table 1 is not fully reproducible due to insufficientnumerical detail, notably the standard errors are unclear. The single-equation L1
and M estimates (their Table 2) are reproducible though.
Copyright © 2010 The AuthorsGerman Economic Review © 2010 Verein fur Socialpolitik and Blackwell Publishing Ltd.

10 The Grunfeld Data at 50
� As mentioned in the introduction, Bera et al. (2001) provide various diagnostic testsfor panel data regressions. Their numerical illustrations are fully reproducible oncethe Greene five-firm version with its three errors is employed.
4. Conclusion
We have reviewed the long and convoluted history of one of the most widely used datasets in all of econometrics. Evaluation of the various versions suggests that a considerableamount of caution is necessary when working with these data, and that differing estimatesmay be traced to versions of varying degrees of reliability. In view of Figure 1, all versionsderived from Maddala are probably best avoided. Also, all versions derived from Boot andde Wit are incomplete.
Given the sparse information regarding computational aspects provided in many of theolder publications, a substantial amount of detective work was often required to reproduceempirical results, not always successfully. Of course it would have been unreasonableto expect perfect reproducibility. However, the rather small number of fully reproducibleworks is sobering: essentially only some (but not all) papers dealing with SUR methodologyusing the GE and WH data and some more recent textbook results are fully replicable.Our results would thus seem to underline the recent requests for mandatory data and codearchives, see, e.g., Anderson et al. (2008), McCullough et al. (2006) and McCullough et al.(2008) and the references therein.
It should also be emphasized why many publications are only reproducible with some effort:several published versions of the Grunfeld data are plagued by transcription errors that werepropagated to estimation results. This is another advantage of electronic data archives,which help to eliminate one source of error that presumably affects a number of worksfrom past decades. Of course such archives did not exist in the early days of econometriccomputing and have only become available as a result of more recent technological advancessuch as the Internet. However, the message is clear: the profession needs to make use ofthese technological advances on a much broader basis; specifically, every journal interestedin publishing reproducible research should adopt mandatory data archives. But our resultssuggest even more than this: Data-alone archives will not help to eliminate problems suchas the non-replicable aggregate regression described above. In addition to the data, codeis necessary to have any hope of reproducibility. Perhaps this aspect is nowadays moreimportant than it used to be given that current methods of inference are inherently morecomplex than OLS and its many variations, the prevalent methodology of the 1950s and1960s. Typically, modern methods cannot be described in all algorithmic detail giventhe scarcity of available journal space. Code archives will ensure that crucial details ofcomplex algorithms and their implementations are available which alone permit successfulreplication.
Also, the Grunfeld data have proven immensely useful for the development of econometricmethodology as well as for the development of econometric software. We refer again to the
Copyright © 2010 The AuthorsGerman Economic Review © 2010 Verein fur Socialpolitik and Blackwell Publishing Ltd.
Christian Kleiber, Achim Zeileis 11
quotation taken from Greene (2003) presented in the introduction, according to which thedata are eminently suitable for illustrating multiple-equation methodology. However, inview of the numerous accidents described in this paper it would appear that the professionneeds to agree on a benchmark version of the Grunfeld data. The full 11-firm versionprovided here would seem to be appropriate. No doubt many further studies in the fieldwill make use of these data. It is hoped that future explorations will be better documentedthan some of those in the past.
Finally, it is also highly unlikely that only the Grunfeld data are plagued by errors of varioustypes. It would be interesting to examine other widely used data sets and estimation resultsbased thereon.
Computational details
Our results were obtained using R 2.10.1 (R Development Core Team 2009) with the pack-ages plm 1.2-3 (Croissant and Millo 2008) and systemfit 1.1-4 (Henningsen and Hamann2007) for estimating panel models and multiple-equation models, respectively. Further-more, the packages lmtest 0.9-26 (Zeileis and Hothorn 2002), MASS 7.3-5 (Venables andRipley 2002), quantreg 4.44 (Koenker 2009), and sandwich 2.2-5 (Zeileis 2004, 2006) wereemployed for some analyses. R itself and all packages used are freely available underthe terms of the General Public License from the Comprehensive R Archive Network athttp://CRAN.R-project.org/. All versions of the data, replication files and associatedR output are available from http://statmath.wu.ac.at/~zeileis/grunfeld/ (see alsoAppendix A). All results were identical on various platforms including Debian GNU/Linux(with a 2.6.29 kernel) and Mac OS X, version 10.5.8.
Copyright © 2010 The AuthorsGerman Economic Review © 2010 Verein fur Socialpolitik and Blackwell Publishing Ltd.

12 The Grunfeld Data at 50
A. Online complements
All electronic resources accompanying this paper are available online at http://statmath.wu.ac.at/~zeileis/grunfeld/.
� Data: We provide a text file Grunfeld.csv (comma-separated values) that containsthe original and complete 11-firm data set from Grunfeld’s Ph.D. thesis (Appendix,Tables 2–9, 11–13). For R users, it is conveniently accessible as data("Grunfeld",
package = "AER") if the package AER, accompanying Kleiber and Zeileis (2008), isinstalled. In addition to the main 11-firm data set, Grunfeld’s aggregate data – hisTable 10, which is inconsistent with the aggregate obtained from the 11-firm data set– are available as Grunfeld-agg.csv. Furthermore, Grunfeld’s additional data foreight firms for the years 1955–1956 are available as Grunfeld-ext.csv.
� Replications: For each publication considered here, an annotated R script is pro-vided along with its output generated with a current version of R and all requiredpackages (as of 2010-01-29). Replication files are provided for: Grunfeld (1958),Grunfeld and Griliches (1960), Boot and de Wit (1960), Zellner (1962), Grilichesand Wallace (1965), Kmenta and Gilbert (1968), Swamy (1970), Theil (1971), Mad-dala (1977), Koenker and Portnoy (1990), Griffiths et al. (1993), Bera et al. (2001),Baltagi (2002), Greene (2003), Baltagi (2005), Greene (2008).
� Further data versions: For textbooks with online electronic versions of the Grun-feld data, we provide a link to the original resource as well as to a local copy obtainedon 2008-12-22. An R script is available that automatically compares these versionsagainst the relevant subsets of the full data set. Textbooks with online electronicversions of the data include: Baltagi (2002), Greene (2003), Baltagi (2005), Greene(2008), Hill et al. (2008).
Copyright © 2010 The AuthorsGerman Economic Review © 2010 Verein fur Socialpolitik and Blackwell Publishing Ltd.

Christian Kleiber, Achim Zeileis 13
References
Anderson RD, Greene WH, McCullough BD, Vinod HD (2008). “The Role of Data/CodeArchives in the Future of Economic Research.” Journal of Economic Methodology, 15,99–119.
Antonovics KL, Goldberger AS (2005). “Does Increasing Women’s Schooling Raise theSchooling of the Next Generation? Comment.” American Economic Review, 95, 1738–1744.
Baltagi BH (1995). Econometric Analysis of Panel Data. John Wiley & Sons, Chichester.
Baltagi BH (2002). Econometrics. 3rd edition. Springer-Verlag. URL http://www.
springer.com/economics?SGWID=0-165-2-107420-0.
Baltagi BH (2005). Econometric Analysis of Panel Data. 3rd edition. John Wiley & Sons,Chichester. URL http://www.wiley.com/legacy/wileychi/baltagi3e/.
Bera AK, Sosa-Escudero W, Yoon M (2001). “Testing for the Error Component Model inthe Presence of Local Misspecification.” Journal of Econometrics, 101, 1–23.
Boot JCG, de Wit GM (1960). “Investment Demand: An Empirical Contribution to theAggregation Problem.” International Economic Review, 1(1), 3–30.
Croissant Y, Millo G (2008). “Panel Data Econometrics in R: The plm Package.” Journalof Statistical Software, 27(2), 1–43. URL http://www.jstatsoft.org/v27/i02/.
Cummins C (2002). “Different Versions of Grunfeld Dataset.” Web Page (accessed 2009-05-18), URL http://www.stanford.edu/~clint/bench/grunfeld.htm.
Encyclopedia Britannica (2009). “Atlantic Richfield Company (ARCO).” Online version(accessed 2009-05-18), URL http://search.eb.com/eb/article-9010104.
Fomby TB, Hill RC, Johnson SR (1984). Advanced Econometric Methods. Springer-Verlag,New York.
Goodman LA, Grunfeld Y (1961). “Some Nonparametric Tests for Comovements BetweenTime Series.” Journal of the American Statistical Association, 56, 11–26.
Greene WH (1990). Econometric Analysis. Macmillan, London/New York.
Greene WH (2003). Econometric Analysis. 5th edition. Prentice Hall, Upper Saddle River,NJ. URL http://pages.stern.nyu.edu/~wgreene/Text/econometricanalysis.htm.
Greene WH (2008). Econometric Analysis. 6th edition. Prentice Hall, Upper Saddle River,NJ. URL http://pages.stern.nyu.edu/~wgreene/Text/econometricanalysis.htm.
Copyright © 2010 The AuthorsGerman Economic Review © 2010 Verein fur Socialpolitik and Blackwell Publishing Ltd.

14 The Grunfeld Data at 50
Griffiths WE, Hill RC, Judge GG (1993). Learning and Practicing Econometrics. JohnWiley & Sons, New York.
Griliches Z, Wallace N (1965). “The Determinants of Investment Revisited.” InternationalEconomic Review, 6(3), 311–329.
Grunfeld Y (1958). The Determinants of Corporate Investment. Ph.D. thesis, Departmentof Economics, University of Chicago.
Grunfeld Y, Griliches Z (1960). “Is Aggregation Necessarily Bad?” The Review of Eco-nomics and Statistics, 42(1), 1–13.
Henningsen A, Hamann JD (2007). “systemfit: A Package for Estimating Systems ofSimultaneous Equations in R.” Journal of Statistical Software, 23(4), 1–40. URL http:
//www.jstatsoft.org/v23/i04/.
Hill RC, Griffiths WE, Lim GC (2008). Principles of Econometrics. 3rd edition. JohnWiley & Sons, New York.
Kleiber C, Zeileis A (2008). Applied Econometrics with R. Springer-Verlag, New York.
Kmenta J, Gilbert RF (1968). “Small-Sample Properties of Alternative Estimators of Seem-ingly Unrelated Regressions.” Journal of the American Statistical Association, 63(324),1180–1200.
Kmenta J, Gilbert RF (1970). “Estimation of Seemingly Unrelated Regressions with Au-toregressive Disturbances.” Journal of the American Statistical Association, 65(329),186–197.
Koenker R (2009). quantreg: Quantile Regression. R package version 4.44, URL http:
//CRAN.R-project.org/package=quantreg.
Koenker R, Portnoy S (1990). “M Estimation of Multivariate Regressions.” Journal of theAmerican Statistical Association, 85(412), 1060–1068.
Maddala GS (1977). Econometrics. McGraw-Hill, New York.
McCullough BD, McGeary KA, Harrison TD (2006). “Lessons from the JMCB Archive.”Journal of Money, Credit and Banking, 38(4), 1093–1107.
McCullough BD, McGeary KA, Harrison TD (2008). “Do Economics Journal ArchivesPromote Replicable Research?” Canadian Journal of Economics, 41(4), 1406–1420.
McCullough BD, Vinod HD (2003). “Verifying the Solution from a Nonlinear Solver: ACase Study.” American Economic Review, 93, 873–892.
Patinkin D (1961). “In Memoriam [Yehuda Grunfeld].” Econometrica, 29(3), 404–405.
Copyright © 2010 The AuthorsGerman Economic Review © 2010 Verein fur Socialpolitik and Blackwell Publishing Ltd.

Christian Kleiber, Achim Zeileis 15
R Development Core Team (2009). R: A Language and Environment for Statistical Com-puting. R Foundation for Statistical Computing, Vienna, Austria. ISBN 3-900051-07-0,URL http://www.R-project.org/.
Swamy PAVB (1970). “Efficient Inference in a Random Coefficient Regression Model.”Econometrica, 38(2), 311–323.
Swamy PAVB (1971). Statistical Inference in Random Coefficient Regression Models.Springer-Verlag, New York.
Theil H (1961). Economic Forecasts and Policy. 2nd edition. North-Holland, Amsterdam.
Theil H (1971). Principles of Econometrics. John Wiley & Sons, New York.
Todter KH (2009). “Benford’s Law as an Indicator of Fraud in Economics.” GermanEconomic Review, 10(3), 339–351.
Venables WN, Ripley BD (2002). Modern Applied Statistics with S. 4th edition. Springer-Verlag, New York.
Vinod HD, Ullah A (1981). Recent Advances in Regression Methods. Marcel Dekker, NewYork.
Zeileis A (2004). “Econometric Computing with HC and HAC Covariance Matrix Estima-tors.” Journal of Statistical Software, 11(10), 1–17. URL http://www.jstatsoft.org/
v11/i10/.
Zeileis A (2006). “Object-Oriented Computation of Sandwich Estimators.” Journal ofStatistical Software, 16(9), 1–16. URL http://www.jstatsoft.org/v16/i09/.
Zeileis A, Hothorn T (2002). “Diagnostic Checking in Regression Relationships.” R News,2(3), 7–10. URL http://CRAN.R-project.org/doc/Rnews/.
Zeileis A, Kleiber C (2005). “Validating Multiple Structural Change Models – A CaseStudy.” Journal of Applied Econometrics, 20, 685–690.
Zellner A (1962). “An Efficient Method of Estimating Seemingly Unrelated Regressionsand Tests for Aggregation Bias.” Journal of the American Statistical Association, 57,348–368.
Copyright © 2010 The AuthorsGerman Economic Review © 2010 Verein fur Socialpolitik and Blackwell Publishing Ltd.

16 The Grunfeld Data at 50
Affiliation:
Christian KleiberFaculty of Business and Economics (WWZ)Universitat BaselPeter Merian-Weg 64002 Basel, SwitzerlandE-mail: [email protected]: http://wwz.unibas.ch/kleiber/
Achim ZeileisInstitute for StatisticsUniversitat InnsbruckUniversitatsstr. 156020 Innsbruck, AustriaE-mail: [email protected]: http://statmath.wu.ac.at/~zeileis/
Copyright © 2010 The AuthorsGerman Economic Review © 2010 Verein fur Socialpolitik and Blackwell Publishing Ltd.