THE GREENHOUSE EFFECT A PRIMER. Chapter 1 What is the Greenhouse Effect?

Report Series HSE 88-001
CONFIDENTIAL
THE GREENHOUSE EFFECT
This document is confidential. Neither the whole nor any part of this document may be disclosed to any third party without the prior written consent of
Shell lnternationale Petroleum Maatschappij B.V., The Hague, the Netherlands.
The copyright of this document is vested in Shell lnternationale Petroleum Maatschappij B.V., The Hague, the Netherlands. All rights reserved. Neither the whole nor any
part of this document may be reproduced, stored in any retrieval system or transmitted in any form or by any means (electronic, mechanical, reprographic, recording or
otherwise) without the prior written consent of the copyright owner.
SHELL INTERNATIONALE PETROLEUM MAATSCHAPPIJ B.V., THE HAGUE Health, Safety and Environment Division (HSE)

Report Series HSE 88-001
CONFIDENTIAL
THE GREENHOUSE EFFECT
This document is confidential. Neither the whole nor any part of this document may be disclosed to any third party without the prior written consent of
Shell lnternationale Petroleum Maatschappij B.V., The Hague, the Netherlands.
The copyright of this document is vested in Shell lnternationale Petroleum Maatschappij B.V., The Hague, the Netherlands. All rights reserved. Neither the whole nor any
part of this document may be reproduced, stored in any retrieval system or transmitted in any form or by any means (electronic, mechanical, reprographic, recording or
otherwise) without the prior written consent of the copyright owner.
SHELL INTERNATIONALE PETROLEUM MAATSCHAPPIJ B.V., THE HAGUE
Health, Safety and Environment Division (HSE)

THE GREENHOUSE EFFECT
Greenhouse effect working group R.P.W.M. Jacobs HSE/35
M.H. Griffiths PL/15 P.E. Bright PAC/3 J.B. Homer SCCU J.A.C.M. van Oudenhoven MFPA/435 J. Waller MFPA/435
Shell Internationale Petroleum Maatschappij B.V. Health, Safety and Environment Division Environmental Affairs The Hague
April 1986 (completion of the study) May 1988 (date of issue in this format)
Prepared for SECC (Shell Environmental Conservation Committee)
CONFIDENTIAL

CONFIDENTIAL
- 1 -
SUMMARY
Man-made carbon dioxide, released into and accumulated in the atmosphere, is believed to warm the earth through the so-called greenhouse effect. The gas acts like the transparent walls of a greenhouse and traps heat in the atmosphere that would normally be radiated back into space. Mainly due to fossil fuel burning and deforestation, the atmospheric C02 concentration has increased some 15% in the present century to a level of about 340 ppm. If this trend continues, the concentration will be doubled by the third quarter of the next century. The most sophisticated geophysical computer models predict that such a doubling could increase the global mean temperature by l.3-3.3•c. The release of other (trace) gases, notably chlorofluorocarbons, methane, ozone and nitrous oxide, which have the same effect, may amplify the warming by predicted factors ranging from 1.5 to 3.s•c.
Mathematical models of the earth's climate indicate that if this warming occurs then it could create significant changes in sea level, ocean currents, precipitation patterns, regional temperature and weather. These changes could be larger than any that have occurred over the last 12,000 years. Such relatively fast and dramatic changes would impact on the human environment, future living standards and food supplies, and could have major social, economic and political consequences.
There is reasonable scientific agreement that increased levels of greenhouse gases would cause a global warming. However, there- is no consensus about the degree of warming and no very good understanding what the specific effects of warming might be. But as long as man continues to release greenhouse gases into the atmosphere, participation in such a global "experiment" is guaranteed. Many scientists believe that a real increase in the global temperature will be detectable towards the end of this century or early next century. In the meanwhile, greater sophistication both in modelling and monitoring will improve the understanding and likely outcomes. However, by the time the global warming becomes detectable it could be too late to take effective countermeasures to reduce the effects or even to stabilise the situation.
The likely time scale of possible change does not necessitate immediate remedial action. However, the potential impacts are sufficiently serious for research to be directed more to the analysis of policy and energy options than to studies of what we will be facing exactly. Anticipation of climatic change is new, preventing undue change is a challenge which requires international cooperation.
With fossil fuel combustion being the major source of a forward looking approach by the energy industry seeking to play its part with governments and others appropriate measures to tackle the problem.
C02 in the atmosphere, is clearly desirable, in the development of

CONFIDENTIAL
- 2 -
CONTENTS
p age
Summary 1
1 . Introduc tion 6
2 . S c i entific data 7 2 . 1 . Introduction 7 2 . 2 . Data on emis s ions o f greenhouse gase s 7 2 . 2 . 1 . Carbon dioxide 7 2 . 2 . 2 . Other greenhouse gas es 8 2 . 3 . The global c arbon cycl e 10 2 . 3 . 1 . Atmosphere - ocean interactions 11 2 . 3 . 2 . Atmosphere - terres trial b iosphere interactions 13 2 . 3 . 3 . Carbon cycl e mode l l ing 1 5
3 . S cenar ios and c l imate model l ing 1 7 3 . 1 . C 0 2 emis s ions and future energy demand 1 7 3 . 2 . Proj ections o f non - C02 greenhouse gas e s 18 3 . 3 . Temperature and c l imatic changes 20 3 . 4 . Detection of the greenhouse e ffec t 2 2
4 . Imp l ications 2 3 4 . 1 . Po tenti al effects of global warming induce d by greenhouse
gase s 4 . 1 . 1 . Ab iotic effects and b i o t i c consequence s 4 . 1 . 2 . S oc i o - economic imp l ications 4 . 1 . 3 . Imp l ications for the energy indus try 4 . 1 . 4 . Imp l ications for Shel l Companie s
5 . Scope for further ac t ion
6 . References
23 2 3 2 5 2 8 2 8
30
32

CONFIDENTIAL
- 3 -
FIGURES page
Fig . 1 . The greenhouse e ffec t . 40
Fig . 2 . C02 emis s ions der ived from long - range proj e c tions and his toric production from fos s il fue l s . 4 1
Fig . 3 . Proj e c ted C02 emi ss ions gene rated with the I IASA Energy Sys tems Programme . 4 2
F ig . 4 . The hypothe tical atmospheric C02 concentrat ions base d on man -made C 0 2 emis s ions and the observed concentrations at Mauna Loa and the South Pole . 4 3
F ig . 5 . The annual mean C02 concentration in the air at different places in the world . 44
Fig . 6 . The global carbon cycle . 45
F ig . 7 . Variat ion of the buffer fac tor of seawater with changing to tal C02 . 46
Fig . 8 . Increas e in atmospheric C02 concentration over the next 150 years . 47
Fig . 9 . Fal l ing energy intens i ty in the USA 48
Fig . 10 . Cumulat ive surface warming due to increase in C02 and o ther gases over the period 1 9 8 0 to 2 0 3 0 . 4 9
Fig . 1 1 . C l imatic e ffects o f a doubl ing o f the pre s ent atmospher i c C 0 2 concentration . 5 0
F ig . 1 2 . Recons truc tion o f surface - air - temperature anomalies for various lati tude bands . 5 1

CONFIDENTIAL
- 4 -
TABLES p age
Table 1 . C02 emis s ions per year by fuel type . 5 2
Tab l e 2 . Carbon produce d ( as C02 ) from s elected energy s ources . 5 2
Table 3 . C02 emi s s i ons p e r region and p e r cap ita i n 1 9 7 5 . 5 3
Table 4 . Es t imates o f the abundance o f trace chemicals i n the glob al atmosphere o f 1 9 80 and 2 0 3 0 . 54
Tab l e 5 . Net primary produc t ivities per given areas ( NPP ) , total areas ( in 19 8 0 ) , total NPP and actual b iomas s per ecosys tem . 5 5
Tab l e 6 . C arbon emi s s ion ( in GtC ) from the combus t ion o f fos s il and b iomas s fuels . 5 6
Table 7 . Shell Group intere s t i n fos s il fuel s i n 1 9 84 . 5 7
Tab l e 8 . Contributi on t o global C 0 2 emi s s ions from fuel s sold by the Shell Group in 1 9 84 . 5 7

- 5 -
APPENDICES
Appendix 1 . The C02/carbonate sys tem in the ocean .
Appendix 2 . Hileman , B . Recent reports on the greenhouse e ffec t . Environ . S c i . Techno! . 1 8 : 45A - 46A , 1 9 84 .
Appendix 3 . Current legis lation and pol ices .
Appendix 4 . Exce rp ts from recent UNEP reports .
Appendix 5 . International organisations and informat ion centres .
Appendix 6 . Ins t i tutes involved in C02/c limate/greenhous e e ffec t research .
Appendix 7 . Re levant pub l i cat ions ( reports and books ) .
Appendix 8 . V is i t to Cl imate Re search Uni t .
CONFIDENTIAL
p age
5 8
6 1
6 3
6 8
7 5
7 8
8 2
8 6
CONFIDENTIAL
- 6 -
1 . I NTRODUCTION
The l i fe - supporting sys tems of the e arth ( such as l ight , energy , mo i s ture , and t emperature ) can be affected by changes in global condi tions . Many of such change s are occurring at present , some of them subtle and many of them caus ed by man . Thes e effects on the l i fe - supporting sys tems c an have a subs tanti al impac t on global hab itab i l i ty . The rate at whi ch many of thes e changes are occurring , espec ially during the pas t few decade s , has been cons iderab l e . A obvious example of thi s i s the r i s ing l evel o f atmospheric c arbon dioxide ( C02 ) . Thi s has been described as a long - t e rm global experiment , the outcome of whi ch is very uncertain .
The global rise in atmospher i c C02 i s wel l documente d . I t i s e s t imated that human act ivities ( e . g . fos s il fue l burning , defores tation) have increased the C02 concentration by about 15% dur ing the past century . More than a century ago i t was already hypo thes ised that an increase in the C02 concentration o f the atmosphere would lead to global warming , i . e . the s o - called " greenhouse effec t " . S everal other gases , having s imilar e ffects , also appear to b e increas ing as a result of human act ivities .
Many sc ient i s ts bel ieve that the maj or e ffec t of increas ing the C02 content of the atmosphere wil l be a gradual warming of the earth ' s surface . Should average global temperatures rise s igni ficantly because of the greenhouse e ffec t and should the earth ' s c l imate change , thi s could have maj or economic and soc ial consequences . However , not everyone agrees with thi s view of po s s ible di s as ter . They po int to the demons trable p o s i t ive e ffects of e l evated C02 c oncentrations , and sugges t a benefit to the biosphere without the generation of a c l imatic catas trophe . Agains t this b acklog of dis agreement sc ient i s ts of both persuas ions have searched for the firs t s igns o f any e ffec ts on a global s cale .
I t i s e s t imated that any c l imati c change re l atable t o C02 would not be detec table before the end o f the century . With the very long t ime s cales involved , it would be tempt ing for s o c i e ty to wai t unt i l then before do ing anything . The po tential imp l ications for the world are , however , s o large that poli cy options need to be c ons idered much earl ier . And the energy indus try nee ds to c ons ider how i t should p lay its par t .
In thi s report the late s t ( 19 8 6 ) s tate of knowle dge i s presented regarding the greenhous e e ffe c t to j udge any counteractive measures . I t descr ibe s the c ons iderable research work be ing carried out world wide ; i t provides information to improve the understanding and i t discus s e s the imp l ications . For thi s reason additional information i s added on legis lation and p o l i c ies (Appendix 3 ) , relevant international organisat ions and information c entres (Appendix 5) and ins t i tutes involved in greenhouse e ffec t research (Appendix 6). Moreover , in addition to the references used , a l i s t of relevant reports and books is added (Appendix 7 ) to provide the intere s ted reader acc e s s to the enormous flow of information relative to the greenhouse e ffe c t .
Re ference s used in thi s section : 2 , 14 , 2 1 , 2 5 , 5 1 , 5 9 .

CONFIDENTIAL
- 7 -
2 . SCIENTI FIC DATA
2 . 1 . Introduc tion
During the las t century the concentration of carbon dioxide increased from an e stimated 2 9 0 ppm in 1 8 6 0 to 340 ppm in 1 9 8 0 . Approximate ly 2 5 % of thi s increase o ccurred during the 1 9 70s . Although the concentration o f C02 in the atmosphere i s relatively small , i t i s important in determining the global c l imate . It permits vis ible and ul traviole t radiation from the sun to pene trate to the ear th ' s surface , but absorbs s ome of the infrared energy that i s radiated back into s pace . The atmo spheric C02 emits thi s energy to both the troposphere and to the earth ' s surface ( see Fig . 1 ) , r e sul t ing in a warming of the surface and the atmosphere in the way the glas s in a· gre enhouse doe s - hence the term greenhouse e ffec t .
The bes t known and mos t abundant greenhouse gas i s carbon dioxide . However , some trace gase s , particularly chlorofluorocarbons (CFC ' s ) , ozone , me thane , and N20 are at leas t as important in changing the radiation energy balance of the e arth - atmosphere sys tem , as , collectively , they might caus e an additional warming e qual to 5 0 - 100% o f the warming due to C02 alone .
I t has been generally accepted that any modi fication in the radiation energy balance of the atmosphere wi ll affect the global c irculat ion patterns . As a cons equence regional c l imatic change s will then occur , which wil l be greater than the average global changes . The mos t promi s ing approach to s tudy the e ffects of increas ing gas concentrations on the atmo sphere , i s to describe and predic t the (future ) global cl imate by complex General C l imate Mode l s (GCM ' s ) . The main factors and proce s s e s used to predict the ear th ' s tempe rature profiles and cl imatic changes are pre s ented in this sect ion . The extent and rate of the change s , base d on scenarios for energy consump t ion and emis s ion of C02 and other trace gase s , will be discus s e d in s e c tion 3 .
2 . 2 . Data on emis s ions o f greenhouse gase s
2 . 2 . 1 . Carbon dioxide
Although C02 is emitted to the atmosphere as a consequence of s everal proce s s e s , e . g . oxidation of humic subs tances and de fores tation , the main c aus e o f increas ing C02 concentrati ons i s cons idered to be fo s s il fue l burning . Only fos s i l fuel burning can be fairly accurate ly quanti fied .
S ince the beginning o f the indus trial and agri cul tural revo lut ions the average annual increase in C02 production has been 3 . 5 % , with total emi s s i ons from
1�id-nineteenth century to 1 9 8 1 be ing 160 GtC ( 1 G tC-1 gigaton o f c arbon - 1 0 g C ) . In 1 8 6 0 the annual emis s i on was approximate ly 0 . 0 9 3 G t C and i n 1 9 8 1 5 . 3 GtC . Ris ing fuel prices i n the 1 9 70 ' s s lackened the C02 produc t ion to yearly increase s of 2 . 2 % per year over the period 1 9 7 3 - 1 9 8 0 ( se e the firs t part o f Fig . 2 ) .
The C02 emit ted into the atmosphere i s very quickly globally dis tributed . Thi s i s mainly due to the fac t that the emis s ions are more o r l e s s evenly d i s tr ibuted over the continents . Moreover , the mixing t ime of the atmosphere wi thin a hemi sphere is only a few weeks and the interchange between the hemispheres t akes 6 - 1 2 months . C02 has a res idence t ime in the atmosphere o f 3 - 4 years , s o i s reasonably well mixed global ly .

CONFIDENTIAL
- 8 -
World C02 emi s s ions based on energy growth rates ( see Table 1 ) show that there has been a s lowing in the upwards growth of emi s s ions s ince 1 9 7 3 . In 19 8 1 , o f the total emi s s ion of 5 . 3 GtC 44% came from o i l , 3 8 % from coal , and 1 7 % from gas .
The production of C02 differs cons iderably from country to country . The larges t quanti ti e s (based on 1 9 7 5 figures ) are produced in the developed countries with a world average of 1 . 2 tonnes C per person ( see Table 3 ) .
During the l as t century the concentration of c arbon dioxide in the atmosphere increased from an e s t imated 2 9 0 ppm in 1 8 6 0 (measurements from ice cores ) to 340 ppm in 1 9 8 0 . More accurate measurements over the last 2 5 years at the Mauna Loa Obs e rvatory , Hawa i i , show an average increase of· 1 . 5 % per year ( see Fig . 4 ) with s e ason - dependent fluctuations . Moreover , there i s a latitudinal difference between ground-level C02 concentrations , re flect ing the location of the main fos s i l fuel C02 s ources in the northern hem isphere ( s ee Fig . 5 ) . The hypothe t ical increase o f the atmospheric C02 concentration based on emi s s ions due to fos s il fuel burning , is al so given in Fig . 4 . I t appears that only a proportion of the emis s ion i s retained in the atmosphere ( i . e . the "airborne fraction " , AF) . The s iz e of AF depends on how the to tal c arbon inventory is partitioned among the oceani c , terres tr ial and atmospheric pools . Over the per iod 1 9 5 9-1974 the AF was 5 6 % , whereas i t was 5 9 % for the per iod 19 7 5 - 19 8 0 . I t i s as sume s that thi s increase of AF might be a caus ed by a reduc tion of the absorption capac i ty of the oceans .
References used in thi s chap ter : 1 , 5 , 18 , 2 0 , 3 0 , 44 , 54 , 6 9 .
2 . 2 . 2 . Other greenhous e gase s
The ear th ' s atmosphere currently contains " trace gas e s " wi th atmo spheric l i fe t imes that vary from much less than an hour to s everal hundred years ( se e Table 4 ) . From a viewpo int of global c l imate e ffec ts , spe c i e s with extremely short l ifet ime s are unl ike ly to play an important direct role . More pers i s tent trace gases , however , may contribute to modi fications of the energy balance o f the earth-atmosphere sys tem and amp l i fy the e s t imated C02 warming . Increas ing concentrations of thes e gase s are directly or indirectly a cons equence o f human act ivit ies . Mos t of the man-made trace gas e s are l i s ted in Table 4 ; the mos t important one s are briefly di scus s e d below .
Nitrogen compounds
Whi l e a number of nitrogen c ontaining compounds are relevant from a c l imatic po int o f view , the mos t important i s N20 . N20 emis s ions result pr imari ly from b iological denitr ification proce s s e s in s o i l and in the o ceans . The global atmospheric concentration o f N20 has r is en from an e s t imated pre - indus trial value o f 2 8 5 ppb to 301 ppb in 1 9 8 0 . Over the 4 - year period 1 9 7 6 - 1 9 8 0 the rate o f increase in N20 concentration was 0 . 2 % per year . Increas ing future global food production will require increas ing use of fer t i l i sers adding further to atmospheric N20 .

CONFIDENTIAL
- 9 -
Methane
Princ ipal sources of atmospheric me thane are enteric fermentation in ruminant animals , anaerob ic decompos i tion of organic matter (e . g . re lease from organic - r i ch s ediments below wate r bodies and rice paddie s ) , biomas s decompos ition , natural gas leakage , quite pos s ibly produc tion b y termites and release of me thane during mineral , o i l , and gas explorati on and gas transmis s ion . The CH4 concentration has approximately doubled in the l ast 3 5 0 years with a greater rate of increase in the las t c entury . The c oncentration increased globally by about 0 . 5 % per year b e tween 1 9 6 5 and 1 9 7 5 and by 1 - 2 % per year between 1 9 7 8 and late 1 9 8 0 . I n 1 9 8 0 the c oncentrati on was about 1 . 6 5 ppm in the northern hemisphere , and about 6 % l ower i n the s outhern hemisphere .
I n the troposphere the CH4 oxidation chain initiated by the reac tion w i th hydroxyl radical (OH ) leads to s ignificant photochemical product i on of CO , H2 and 03 :
CH4 + 402 --+ H20 + CO + H2 + 203 (ne t cycle ) (1 )
The initial reaction of OH with CH4 :
CH4 + OH � CH3 + H20 (2 )
and the reaction of OH wi th CO :
CO + OH --7 C02 + H (3 )
c ontro l s the global des truc t ion of OH , the dominant oxidis ing spec ies in the troposphere . Reaction (2 ) is such a dominant loss mechanism for CH4 that more than 9 0 % of the global de s truc t ion of CH4 o ccurs in the troposphere . S o , CH4 and CO are closely coupled pho tochemically through OH . The dominant s ink of atmospheric CH4 , OH , is thus affected by increased leve ls o f tropospheric CO or of CH4 itself . Therefore , increas ing concentrations o f C O due to fos s i l fuel (incomplete c ombus tion) usage and oxi dation of anthropogenic hydrocarbons in the atmosphere , will reduce the rate at which CH4 i s des troye d .
Chlorofluor ocarbons
Chlorofluorocarbons (CFC ' s ) are entirely a product o f human act ivi ty , be ing pres ent in gas propelled spray cans , refrigeration equipment and insulated p ackaging materials . These chemicals came into maj or use in the 1 9 60 ' s and init ially exhib i ted a rapid growth (10 - 15 % per year ) . The global emi s s ions of the maj or C FC's then dec l ined s omewhat from the mid - 1 9 7 0's through to 1 9 8 2 in part due to a ban on some nones s ential usages (e . g . spray c ans ) of C FC's and to adverse economic conditions . However , the emi s s ions increased s ignificantly s ince 1 9 8 3 . Eas tern block c ountries have apparently never reduced the ir production o f CFC ' s , s o world wide use i s now r i s ing , and i s expected t o grow more because o f the use i n less indus trial i s e d countries . When C FC's are released to the atmosphere , the i r inertne s s to mos t b iological proce s s e s allows them t o b e transported t o the s tratosphere , where they are b roken down by sunl i ght . Liberated chlorine catalyt ical ly des troys ozone .

CONFIDENTIAL
- 1 0 -
Ozone
The c l imatic e ffects of changes in ozone ( 0 3 ) depend very s trongly on whether these changes occur in the troposphere or s tratosphere . There i s s ome observational evidence that northern hemisphere tropospheric ozone has increased by 0 . 8 - 1 . 5% per year s ince about 1 9 6 7 , due to increas e s in combus t ion releases of NOx , C02 , H2 and increased CH4 . In the s outhern hemisphere , given the smaller anthropogenic influences , 03 doe s not change at all .
S tratospher i c ozone i s als o thought to be susceptible to perturb ing influences , including man - made chloro - and chlorofluorocarbons , increas ing CH4 and N20 concentrations and decreas e s in s tratospheric temperature due to increas ing C 02 . The s tratospheric ozone changes large ly depend on the altitude , but concentrations are now about 1 2 . 5% greater at altitudes from 0 to 1 2 km than assumed pre - indus trial concentrations .
A perturbation of the s trato spheric ozone concentrations modulates the so lar and infrared fluxes to the troposphere , and thi s solar e ffec t would tend to warm the surface . On the other hand 03 change s in the lower atmosphere pose potential r i sks to air quality over the surface of the globe .
Re ferences use d in this sect ion : 3 3 , 3 5 , 3 9 , 41 , 43 , 46 , 47 , 49 , 61 , 64 .
2 . 3 . The global carbon cyc le
The carbon cycle ( Fig . 6 ) involves numerous b iological , geological , phys i cal and chemical proce s s es and can roughly be divided into two main cycles , a b iological and a geological one . The geological cycle i s a relatively long- term cycle characte rised by s low process es , i . e . the release of C02 through rock weathering and ultimate pre c ip itat ion as calcium carbonate . S ince man s tarted to burn fos s il fuel the s low proce s s e s have been unbalanced by affecting the maj or reservoir .
The worldwide use o f fos s il fuel in 19 8 1 released about 5 . 3 GtC to the atmosphere as C02 . Thi s figure seems very small compared to those of the amounts of carbon e s t imated to be pres ent as organic and inorganic compounds in the four maj or reservo irs in the carbon cycle , i . e . 700 GtC in the atmosphgre , 2 , 600 GtC in the biosphere , 40 , 000 GtC in the ocean and 6 5 x 10 GtC in the l i thosphere ( i . e . the s o l id part of the ear th ) . However , taking into account a natural and balanced exchange rate of about 100 GtC per year b e tween atmosphere and biosphere and between atmosphere and ocean , fos s i l fuel burnt yearly represents about 5 % o f the natural exchange . About 6 0 % of the C02 or iginating from burnt l i thospheric c arbon i s retained in the atmosphere ; the ocean is the maj or s ink for the res t .
In c ontras t , the biological cycle i s charac terised by very rap id proc e s s e s and i s , in e s s ence , very short and therefore extremely s ignificant . Nearly all C02 c arbon that i s as s imilated ( fixed) by the b iosphere ( i . e . the p l ants ) i s ul t imately , b iodegraded by heterotrophic organisms and sub s equently re turns from the biosphere to the o ther maj or carbon res e rvoirs . The b io logical cycle i s therefore e s s entially c lo s ed . S o lar energy keeps the cyc le going by providing the energy for the c arbon- fixing proces s , i . e . photosynthe s i s .

CONFIDENTIAL
- 11 -
Contrary to the near cons tancy of the fluxe s in the b i ological cycle , one of the mos t important reservo irs there in ( the land b i o ta , i . e . the l iving o rganisms on land , of which the plants represent the maj or b i omas s ) has b een affected s ince man s tarted releas ing carbon dioxide by defores tation and expans ion of arable land .
2 . 3 . 1 Atmosphere - ocean interactions
The res e rvo ir o f the world ' s oceans represents a volume of about 1 . 4xl018
m3
water and hol ds about 40 , 000 GtC ( this i s 'bout 5 7 t imes the total a tmosp�eric c arbon content ) or on average �8 g/m . The content vari e s from 2 2 g/m
3 in cold sur face water to 2 6 g/m in warm surface water and to
29 g/m in the deep - ocean .
The maj ority o f the carbon in the ocean i s pre sent as an inorganic fract ion , i . e . 3 9 , 000 GtC as dissolved inorganic carbon ( DIG or C ) . The DIG i s pre s ent as di s solved components of the c arbon dioxide e quil ibrium sys tem : C02 , b icarbonate and carbonate .
The remaining carbon i s pres ent as an organic fraction , o f which only 1 . 5 % i s fixed in l iving organi sms , and the res t i s dead o rganic material pre sent as di s s olved organic carbon (DOC , about 1000 GtC ) , and particulate organic carbon (POC , about 30 GtC ( see Fig . 6 ) .
The gro s s exchange of C02 between atmosphere and ocean i s very rap id , characterised by a flux of about 100 GtC per year e i ther way . This interac t ion shows the s trong regulation of the atmospheric C02 by the ocean . The natural s i tuat ion i s charac terised by a phys ico - chemical e qui l ibr ium . The princ ipal e ffec t o f adding C02 to the atmo sphere i s the tendency of the ocean to take up the excess in orde r to reach a new e qui l ibrium wi th the atmosphere . Al though the carbon content of the ocean i s much greater than that of the atmosphere , the capac i ty o f the ocean for C02 up take is l imited ( see Appendix 1 ) . The absorption of C02 by the ocean i s buffered by reactions with dis s olved carbonate and b ic arbonate i ons . I n the s urface mixed layer , the "buffer factor " increase s with growing C02 c oncentrations ( se e Fig . 7 ) , and the capac i ty of the ocean to absorb the C02 added to the atmosphere will decreas e . Hence , the fraction of added C02 remaining in the atmosphere will r i s e .
The c apac i ty o f the ocean for C02 uptake i s thus a funct i on o f i ts chemis try ; the rate at whi ch this capac i ty can be brought into p lay i s , howeve r , a func tion o f ocean phys ics . The s tratification o f l ow - and mid - lat i tude oceans is s table and capped by a warm surface layer that i s approximately i n e quil ibrium w i th atmospheric C02 . Mos t o f the deep waters o f the world ' s oceans are formed in winter in the Norwegian and Greenland S eas and in the Wedde ll Sea . Here winter cool ing increase s the dens i ty o f the sur face waters unt i l the s trati fication o f the water column breaks down and the deep s ource regions are renewed . Once forme d , the bottom waters flow t o the s outh. The res idence t ime of deep water in the Atlanti c Ocean has been e s t imated as 2 7 5 years , in the Pac i fic Ocean about 6 00 years and in the Indian Ocean about 3 3 5 years . Thus , al though the abs orp tive capab il i ty o f the ocean i s l arge , i t i s not rapid due to i t s s low c irculation .
The cycl e of o rganic carbon within the ocean i s based o n two main proce s s e s , i . e . product ion and decompos i tion of organic matte r . Fixat ion o f C02 into

CONFIDENTIAL
- 1 2 -
organic t i s sues by the photosynthetic act ivity of phytoplankton occurs only in ocean surface water ( the euphotic z one ) . Thi s i s the zone where l ight energy for photosynthes i s and growth i s not l imite d , s o that the production of organic mater ial i s greater than the breakdown . In the tropics thi s zone is l imited to the upper 100 m of the s ea , while in temperate c l imates i t i s between 2 0 and 5 0 m i n summer and z ero i n winter . In deeper waters , the aphotic z one , there is a net loss o f organic material , s ince breakdown exceeds produc tion .
Organic production and breakdown o f organic material c an c onveniently pres ented as :
produc tion C02 + H20 CH20 + 02 ( 4)
breakdown C02 in (4 ) represents the total dis solved inorganic c arbon content of the water , and CH20 i s organic matter . Oxygen i s produce d in thi s proces s and the removal of C02 concurrently rai ses the pH . Although the total biomas s of the b i ota is low relative to that on land ( see Fig . 6) and the annual produc t ivity i s approximately one half that on land , the turnover ( i . e . amount of carbon f ixed per biomas s uni t ) i s very high . Some 9 0 % of the organic matter formed i s consumed by graz ing organisms w i thin the euphotic zone . The remainder plus the mater ial excreted by graz ing organisms and dead animal s fall through the water column and is subj ect to oxidative decompos ition (breakdown) , whereby C02 is released ( eqn 4 ) . The maj ority i s decomposed i n the upper 1000 m of the water column ; dis solution of CaC03 ( i . e . calcium carbonate , the main constituent of she l l s ) occurs in deeper wate r , stimulated by lowered oxygen concentration and pH due to increas ing C02 leve l s . The dis solved calcium carbonate rais e s the total C02 o f the deep water further and increase s the alkalinity ( see Appendix 1 ) . The maj ority of the C02 therefore remains available in the oceanic cyc le .
Effects of increas ing atmospheric C02 on the C02 concentration in the ocean are difficult to measure . The mos t s ens i t ive measurement to determine this is pC02 ( i . e . the pres sure of C02 gas that would be found in a small volume o f air that had been allowed to reach e quil ibrium wi th a large volume of s e awater ) . From thes e measurements it is clear pC02 in ocean surface water i s r i s ing , with a rate comparable to the atmospheric increas e . Howeve r , as a c onsequence of the oceanic buffering a 10% change in pC02 produces only a 1% change in the oceanic C02 concentration ( see Appendix 1 for de tai l s ) . The oceanic C02 concentration has increased 1 - 2 % over thi s last c entury . This increase w i l l not induce s ignificant changes in primary product i on ( i . e . growth of algae ) , as C02 i s already available in exce s s . Concurrent s l ight decreas e in pH ( attached as 0 . 06 pH units ) will not be measurable e ffect , as the ocean surface pH varies between 8 . 0 and 8 . 3 . Further increase s of the C02 concentration will certainly lead to de tectable e ffects on pH .
I f the increas ing atmospheric C02 c ause s s ignificant changes in the global c l imate , indire c t e ffec ts on primary production can be expecte d . If there were to be local ly increas ing cloudine s s then thi s reduces the s olar energy reaching the ocean and cons e quently also the primary produc tion . Any warming of the upper layers would increase the formation of s table water mas s e s , thereby reduc ing ver tical mixing . The subsequent depletion of nutr ients in the eupho tic z one will cause a decrease in primary production .

CONFIDENTIAL
- 13 -
I f C02 i s added to the ocean surface , the pH decrease s and the tendency for d i s s o lut ion of carbonate minerals ( e . g . calc ite and aragoni te ) , e i ther in bottom s ediments or suspended in the water column , increase s , thereby increas ing both the alkal inity and the total DIC ( se e also Appendix 1 ) . However , CaC03 i s also a maj or cons t i tuent of she l l s o f calcareous o rgani sms and corals . Part icularly in near - shore areas thes e organi sms wil l be exposed to waters rich in C02 and with a low pH . D i s s o luti on o f shel l s and corals and subsequently local but mas s ive deaths of organi sms on a local scale i s therefore not unreal i s t ic . I f dis s olution o f c arbonates o c curs , the alkal ini ty and C02 content increas e and the net e ffec t o f the alkal ini ty increase generates an increas ing capac i ty of the ocean for C02 uptake . This feedback mechanism might have reduc ing e ffects on a r i s ing atmospheric C02 leve l , al though probably not in the short - term , as there are kine t i c l imits and control s on carbonate dis solution .
References used in thi s sect ion : 3 , 6 , 7 , 11 , 2 2 , 3 6 , 42 , 5 6 , 6 0 .
2 . 3 . 2 . Atmosphere - terre s trial bio sphere interactions
The reservo ir of carbon in l iving plant material ( phytomass ) in the land b iota was about 600 GtC in 1 9 8 0 . Compared to thi s , the organic c arbon f ixed in animal s ( zoomas s ) and microorgani sms i s negl igib ly small ( about 8 GtC ) . The to tal carbon retained in s o i l s and in dead o rganic material has been e s timated globally at about 2 000 GtC ( see Fig . 6 ) . The b iosphere can be roughly subdivided horizontally into s ix ecosys tems ( see T able 5) and vert ically into leave s , branches , s temwood , roots , l i tter , young humus and s tab le s o i l c arbon . By far the large s t b iotic res e rvo ir i s e s t imated to be in fores t sys tems , whi ch are also both the mos t act ive and vulnerable part o f the b iota . The expans ion of human populations and changes in l and use in recent c enturies have been accompanied by an almos t continuous decl ine in the area of fore s t ( see Table 5 ) . During the pas t c entury the reduct ion in the mas s of vegetation ( defores tation) and replacement with agricul tural c rops and urban development resul ted in a cons ide rable reduct i on of the carbon s tored in terres tr ial biota . The total net release of carbon from the b iota between 1860 and 1 9 8 0 has been e s timated as 1 8 0 GtC . In r ecent years the rate o f release has dropped s l ightly , as a consequence of ne t accumulation o f carbon in the fore s ts o f North Amer i ca and Europe ( as resul t o f renewed growth o f fores ts and affores tat ion) .
The cycle of carbon between biosphere and atmosphere is in e s s ence a b iological one , based on f ixat ion of C02 by plants with the a i d of s o l ar energy ( i . e . photosynthes is ) and produc t ion of C02 through respiration and decompos i tion ( e qn 4 ) . The driving input of an eco sys tem is the net primary production , the increase in biomas s ( NPP ) :
NPP - G P - R A
( 5 )
where GP i s the gros s production , the total photosynthes is o f the sys tem and R
A i s the resp iration of autotrophs , the green plants . Four , vertically
arranged , components of the biosphere contribute to the NPP , i . e . leave s , branche s , s tems and roo ts . E s t imates o f NPP for the different ecosys tems are given in Table 5 .

CONFIDENTIAL
- 14 -
The net flux o f carbon det e rmined by the balance l iving organisms :
between the atmosphere between gross production
and any e cosys tem is and respiration of all
NEP - GP - ( RA
+ �) ( 6 )
where NEP i s the net ecosys tem produc tion , the net flux o f carbon into or from an ecosys tem and � is the resp iration o f the heterotrophs , . including all animals and decomposers . Thus , R + Ru represent the natural flux of C02 from the terres tr ial ecosys tems to �e a£mosphere . The primary evidence of the importance of the terres tr ial b iota for the C02 content o f the atmosphere is shown by the short - term o s c i l lations o f atmospheric C02 , _
reflecting the s easonal fluctuations in photosynthet ic and respiratory ·
act ivit i e s of l iving organisms .
The NEP tends to be z ero in a s table ecosys tem , but i s p ermanently pos i t ive when human dis turbance is present . Es t imates of the total NPP for all terre s trial ecosys tems vary between 5 0 - 60 GtC per year ; the mean total plant resp iration of all ecosys tems (R
A) is about e qual to NPP; so , about 5 0 % of
GP is needed by the plants for respiration ( RA
) . The heterotrophic resp irat ion (Ru) i s 3 5 - 50 GtC per year . These fluxe s characteri s e the natural and wefl-balanced exchange rate of about 100 GtC per year between terrestrial b io ta and atmosphere .
Human interference ( cutting , burning , shifting of cult ivation and changing of e cosys tems ) has no t only large e ffec ts on the amount of carbon s tored in the ecosys tems ( the reservo i r ) , but also affects the fluxes . There has been a net release of carbon s ince at least 1 8 6 0 . Unti l about 1 9 6 0 , the annual release was gre ater than the release of carbon from fos s il fuels . The total ne t re l eas e from terre s trial ecosys tems s ince 1860 is e s timated to have been 1 8 0 GtC (with a range of e s t imates o f 1 3 5 - 2 2 8 GtC ) . The e s t imated net release of c arbon in 1 9 8 0 was 1 . 8 - 4 . 7 GtC , from 1 95 8 - 1 9 8 0 the release of C was 3 8 - 7 6 GtC . The ranges re flec t the differences among vari ous e s t imates for fores t b iomas s , soil carbon , and agricultural clear ing .
Effects of increas ing atmospheric carbon on terres tr ial b i o ta can be expected to be caused directly by higher C02 concentrat i ons and/or indirec tly by changed environmental conditions due to the h igher C02 concentrations . Among the factors affec ting gros s photosynthe s is , l ight , mo i s ture , avai l ab i l i ty of nutrients (particularly nitrogen and phosphorus ) and C02 are the mos t important .
Mos t information relative to C02 e ffects on plants i s based on data from short - te rm experiments under controlled condi tions . Although cons i derable var iab i l i ty exis ts in responses o f various spec ies , an increas ing growth and rate of photosynthes is i s apparent and the fol lowing tentative general i sat i ons have been made in the l iterature resul t ing mainly from exper iments in glas shouse s:
The respons e s are greater in plants with indeterminate growth cotton , s oybean) than in plants with de terminate growth ( e . g . corn , s orghum , sunflower ) . Plants wi th an indeterminate growth hab i t have an infinite potent ial and are the mos t product ive , whereas the de terminate comp le te the i r l ife cycle by p rimary growth with the product ion
( e . g . maize ,
growth plants
of a

CONFIDENTIAL
- 1 5 -
complete plant .
The r esponse to higher levels o f C02 i s greater in C3 p l ants ( e . g . s oybe an , sunflower , tomato , lettuce , cucumber , velvetleaf , wheat , sugar -beet , potato , rice , trees ) than in C4 plants ( e . g . corn , s orghum , mille t , sugar - cane ) . In C 3 p l ants primary photosynthet ic carbon fixation occurs via the enzyme ribulose diphosphate carboxylase ( RuDP ) and in C4 plants via phospho - enol - pyruvate ( PEP ) . The higher carboxylation e fficiency of C4 p l ants has an advantage in water use e fficiency and therefore in exp l o i t ing arid environments .
The l arge s t response i s in seedl ings ; in o lder plants the response decreases or ceases . Increas ing C02 concentration will therefore probably have the leas t e ffect on growth of p l ants in natural forests ( dominat ing the biotic part of the carbon cycl e ) , where l i ght , water and mineral nutr i tion already l imit the rate o f photosynthes is . Howeve r , recent increases in the growth of some high - alti tude trees (me asured as increas ing r ing width) might be as cribed to increas ing C02 concentrations , al though the discus s ion on the causal relationship i s not ye t ended .
- Water use e fficiency ( ratio of C fixed to water consumed) increases for all species w i th increas ing C02 concentrations , but particularly for C4 plants . Therefore , under conditions of s ignificant water - s tres s , cons iderably greater proportional inc reas es in plant productivity occur .
- Early dep l e t ion of nutrients caus es a shortening of the growing season ( only in C4 plants ) and a s ignificant increase o f the CfN ratio in C 3 plants . A s N - poor plant t i s sue decomposes more s lowly , nutrient cyc l ing rates w i l l then be affected in ecosys tems .
Effects on ecosys tems are de termined by the s tab i l i ty of the sys tem . In s tab le ( c l imax) ecosys tems ( e . g . undi s turbed fore s ts ) in whi ch gro s s photosynthes is i s e quated by total respiration ( NEP � 0 ) , the NEP might become pos i t ive depending on to what extent other fac tors are l imiting ( e . g . nutr i ents ) . In deve loping ecosys tems , the NEP i s permanently pos i t ive and will increase unt i l a new ( s table) e quil ibrium i s reached . Incre as e of NEP will be greater where the supply of nutrients is greate r , e . g . in highly product ive agricultural sys tems . However , here the s torage o f carbon i s only a small frac t ion of the annual production .
References use d in thi s s ection : 5 , 10 , 1 5 , 2 2 , 24 , 2 8 , 3 7 , 4 5 , 6 7 , 6 8 , 6 9 .
2 . 3 . 3 . Carbon cycle modelling
Climate model s are use d to inves ti gate the cl imatic response ( e . g . temperature , precip i tation) to changes of the atmospheric C02 concentration ( in fact the " airborne fraction" , AF). Carbon cycle models ( CCM ' s ) are the main tool for predicting the future C02 levels as a function of the total C02 emi s s ions . To calculate these leve l s all proce s s e s in which C02 i s exchanged have t o be known and quant i fied , i . e . proce s s es i n which C02 i s exchanged , s tored and converted between the atmosphere , terres trial b i osphere and ocean .
CONFIDENTIAL
- 16 -
In the l as t few years CCM ' s have become more soph i s ti cated . There are now several dynamic , proces s - or iented models whi ch repres ent for example accumulation and decay of dead vegetat ion , proces s ing of carbon in soils and humus , and chemis try , phys ics and b iology of the ocean . Published models have been cal ibrated to agree well with the change in atmospher i c C02 concentration observed unti l now . However , no model has been properly vali dated agains t all trends and all data on emi s s ion rates . The mos t important uncertainties are :
Future paths o f energy and C02 emi s s ions . Many o f the early analyses have produced e s timates o f future emi s s ions and c oncentrations from extrapolat ive techniques based on present and pas t emi s s ions . In an attempt to address uncertainties , a s econd generation o f employing s cenario analys i s has arisen , which al so take into future economic and energy developments . However , there are s ti l l of important unce rtainties i n the mode l , e . g . rate o f p opulation the availab i l i ty and cost o f fos s il fuels , e tc . ( see also 3 . 1 . ) .
- D iffus ion rate in the ocean .
s tudies , account
a number growth ,
Mo st models represent some features o f ocean chemis try qui te we l l , but they represent ocean phys ics by s imple vertical diffus ion coeffic ients , s omet imes related to s tratificat ion phenomena . Thes e one - dimens ional vert ical mode ls are viewed with cons iderable s cept i c i sm by phys ical oceanographers .
- Rate of defores tation and land reclamat ion . There i s dis agreement about whe ther s ignificant renewed growth in areas and s timulation of plant growth by increas ing atmospher i c C02 take p lace and counter losses from defores tat ion .
- S timulation of growth by C02 .
some will
Mo s t c arbon cycle models in e s t imating b iotic response have depended · on the s o - called b e ta (�) factor , a measure of how much plant growth increases as a resul t of atmospher i c C02 concentrat ion . The nume r ical value of � i s not known accurately at present , but i s s ti l l o f great importance a s a par ameter representing the response . However , i t has been argued that the use of the P - factor should be replaced by s eparate analyse s of the e ffec ts of changes in the area of fores t and potenti al change s in NPP c aused by both increased atmospher ic C02 and changes in c l imate .
References used in thi s section : 9 , 1 5 , 2 1 , 2 2 , 4 5 .

CONFIDENTIAL
- 17 -
3 . S CENARIOS AND CLIMATE MODELLING
3 . 1 . C02 emis s ions and future energy demand
I t is general ly accepted that the increas ing concentration of C02 in the atmosphere i s primari ly de termined by the combus tion of fos s i l fue l s . In order to e s t imate future quantitie s , it is firs t neces s ary to develop p icture s of the future use o f fos s il fuel s and then to use thes e scenarios , in conj uncti on with carbon cycle models , to calculate the a tmospher ic C02 concentrations .
Unde r s tandably , many pre - 1 9 7 5 s tudies as sumed that future energy growth rates would be e quivalent to the his tor ical average of 4 . 5 % per year . However , i t i s now acknowledged that the " C02 community " should make better us e o f the mos t recent scenarios in which world energy consump tion i s chi efly determined b y economic and s ocio - pol it ical force s . Mos t recent e s t imates from such source s as the US Environmental Protection Agency ( EPA) , the International Ins t i tute for Applied Sys tems Analys i s ( I IASA) , the International Energy Agency (lEA) and the US National Academy o f Sciences show that , based on calculated future C02 emi s s ions , pre - indus trial atmospheric concentrations could double ( i . e . pass 600 ppm) s ome t ime between 2 040 and 2 0 8 0 ( s ee Fig . 8 ) , the range reflecting the uncertainties with regard to future growth and energy deve lopments .
By comb ining e s t imates of energy demand and fuel mix , C02 emis s ions can be e s t imated . In Fig . 2 a number of long range C02 proj ections are pre s ented . E s t imated average annual rates of increase of C02 emi s s ions unti l 2 0 3 0 generally range from 1 to 3 . 5 % . Es t imated annual emi s s ions r ange from 7 to 1 3 G tC in the year 2000 and , with few exceptions , from 10 and 3 0 GtC in 2 0 3 0 . The US Nat i onal Res earch Council (NRC ) forecas t in 1 9 8 3 that the annual increase would be about 1 . 6 % to 2 0 2 5 and about 1% thereafter compared with an average growth over the pas t 120 years of 3 . 5 % . The maj o r reasons for the lower rate are , according to the NRC , an e s t imated s lower growth o f the global economy , further cons ervat ion and a tendency t o s ub s t i tute non- fos s i l fue l s for fos s il fue l s . ( s ee Appendix 2 for a discus s ion of the NRC Report ) .
The energy scenarios deve loped by Group Planning give e s t imates for C02 emi s s i ons in the lower part of the range for a number of reasons . In the first ins tance , global energy intens i ty has been fall ing for many years . Figure 9 shows that in the USA the fall has been continuous s ince the 1 9 2 0's . S ince 1 9 7 3 , two change s have occurred : o i l intens i ty , which had been r i s ing , began to fal l , and the decl ine in energy intens i ty acce l erate d .
Four factors l i e behind the fall in intens i ty : firs tly a shift in developed country economies from heavy indus try to· les s energy - consuming light indus t ri e s and s e rvice s ; s econdly , the introduction of new technologies and proce s s e s which both directly and indirectly , consume l e s s energy ; thirdly , the deve lopment o f products ( cars and refrigerators , for example ) which are more e nergy - e fficient , and finally , consumers have changed the ir behaviour patterns to reduce energy consumption as they have become more aware of the cos t o f energy . While the las t of these i s in s ome s ense revers ible as cos ts decl ine , the firs t three are s tructural and are unl ike ly to be reversed .

CONFIDENTIAL
- 18 -
In the future , as portrayed in the Group scenarios , the intens i ty continues its downward course . Indexed to 1 9 7 3 - 100 , the energy intens i ty in the OEGD countries is e s t imated as 47 (Next Wave ) or 5 7 (Divided World) with a p robable range of 4 5 - 7 5 . The Next Wave scenar io sees a rap id take - up of technology promo ting a more rapid fall in intens i ty . Howeve r , thi s is outwe ighed by s trong economic growth and hence a relatively large increase in energy demand . In D ivided World , on the o ther hand , energy intens i ty decl ines more slowly but economic growth i s also lower so that , overall , energy demand i s les s than in the Next Wave .
The impact of new technology i s much les s in the Les s Developed Countr ies ( LOG ' s ) where the capacity to introduce energy e fficient e quipment and to apply energy conservation i s much les s . In thes e countries , energy intens i t ie s are s till r i s ing although at a lower rate as technology i s trans ferred from the developed world . In p a r t this r i s e i s due to the development proce s s - the introduct ion of the heavy indus tries the countr ies thems elves need and partly there i s the move of energy demanding indus tries from developed to develop ing countries .
The world energy demands in the year 2005 in the two scenarios are , respect ively . New Wave - 209 Mbdoe (mill ion barrels per day o i l e quipment ) and D ivided World . 193 Mbdoe . At the s ame t ime , the probable ranges are 1 7 8 - 2 2 0 Mbdoe and the pos s ible ranges are 1 5 8 - 240 Mbdoe .
While overall energy intens i ty i s an important var iable in e s t imat ing the future production of carbon dioxide , a s econd factor i s the compe t i tion be tween different fuels in the maj or marke ts , in particular , the relative importance of the non- fos s i l fue ls such as hydro and nuclear . The marginal energy s ource s , wind , waves , hydrogen , e tc . , are unl ikely to make sufficient contr ibutions to have any s e rious effect on C02 leve l s , nor i s any large move away from hydrocarbon fue ls in the transport marke t expected and conse quently changes will relate to underboiler fuel s and e lectr icity generation . Coal i s expected to dominate the large indus trial under - bo i ler marke t with gas and electr ici ty becoming the maj or energy s ources at the commercial and domes t ic levels . Coal and nuclear will be the chi e f fuels for e lectricity generat ion . Only in the long term is a shi ft to o ther energy s ource s l ikely to occur . However , as the amount of C02 emitted per uni t of ene rgy differs cons iderably ( see Table 2 ) for the different fos s i l fuels , future emi s s ions not only depend on the global energy consumption but also on the re lat ive p roportions of the fos s il energy s ources ( see Fig . 3 ) .
On the b as i s o f the demand e s t imates from the indivi dual fue l s in each scenari o the C02 emis s ions c an be calculate d . Thes e are g iven in Table 6.
An important s ource of energy often i gnored because o f the difficul ty of measurement , i s the non - commercial energy ( NGE ) : Wood , c rop res i due s , animal and human was te s burned by the poores t members of soci e ty for heating and cooking . The population of the LOG ' s i s approximately 3. 6 b i l l ion , one third o f whom depend on NGE . By 2005 the LOG population will have r i s en to 5 . 3 b i l l i on (UN e s t imate ) and al though NGE cannot r i s e pro rata becaus e of the cons traints on availabi l i ty , none the les s there will be an increase and thi s , based on e s t imates developed by the FAO , i s included in Table 6.
In the next century , the world energy pattern can only be gues sed . A key feature , however , is that becaus e of technological change there will be a

CONFIDENTIAL
- 19 -
wider variety o f energy sources for exploi tation than at present . Howeve r , no s ingle new energy s ource will be able to mee t more than 1 0 % o f the world ' s energy supply and coal will probably be the large s t s ingl e s ource o f hydrocarbon b a s e d energy . In addition to the main scenarios which extend only to the year 2005 , s ome s tudie s have been made within Group Planning on the pos s ible use of energy in the year 2 0 5 0 . Based on s ome hero ic as sump tions not only o f economic factors but als o s o fter i ssues such as indivi dual l ifes tyle s and the role o f government , three proto - scenarios have been developed and from thes e pos s ible C02 emi s s ions can be calculated . These are at the very bottom o f the span o f e s t imates made by other ins t i tutions and range from 10 to 11 . 5 GtC per annum .
in t ime of energy
that large as wind or
There are , of cours e enormous uncertainties at this- dis tance surrounding not only the fuel consumption but als o the spl i t s ources between fos s i l and non fos s i l fuels . I t may be the case increas e s in the direct us e of solar energy , indirect solar such wave energy and in nuclear energy will occur as a result of technological developments .
unforeseen
In the l i ght of the pos s ible e ffects of an increase in greenhouse gas es , i t i s important t o examine the l ikely pol i t ical response s t o expre s s ions o f environmental concern . Awarenes s o f environmental matters i s much s tronger now than it was only a few decades ago . At pres ent , the focus is on acid rain and nuclear energy . While oppo s i t ion to nuclear i s s trong in the USA , Aus tralia and s ome European countries , i t i s pos s ible that percep t ion of a ser ious environmental threat could swing op�n�on away from fos s il fue l combus tion and lead to a revival of interes t in cons e rvation , renewable s ource s and particularly in nuclear energy . Of course , such a movement woul d be s t i l lborn i f there were to be any further accidents o f the Three Mile I s land , Sellafield or Tsj ernobyl type .
The prob lem i s that no obvious global s o lution i s presently conce ivable which would resul t in a maj or reduction in the rate of increase o f atmospheric C02 . A report i ssued b y the US Environmental Pro tection Agency ( EPA) in late 1 9 8 3 ( see Appendix 2 ) concluded that only draconian measures such as a global ban on coal combus t ion could have any s ignificant e ffect . S ince such actions are nei ther economical ly or pol i t ical ly feas ible , individual countries should be urged to s tudy ways o f adapt ing to the inevitable r i s e in temperature . The NRC report refe rred to above , which was pub l i shed at the s ame t ime , i s less p es s imis t ic in that i t b e l i eves that s trategies such as subs tantial taxation o f fos s il fuels might be e ffective .
Re ferences used in thi s s ection : 1 7 , 2 1 G roup Scenar i o s .
3 . 2 . Projections of non- C02 greenhouse gase s
Changes in atmospheric concentrations o f s everal infrared absorbing gases , b e s i de s C02 , resul t from human act ivi t i e s . Proj ections o f future emi s s ions of thes e trace gase s are mos tly at a more primitive s tage than are the C02 proj ections , as they are usual ly based on as sumptions of l inear increase o r exponential growth relative t o development in recent years .
Recently , calculat ions have been applied to proj ect the concentrat ion of each gas species . The following data have been used : - 1 9 8 0 atmospheric concentrations and recent trend data ,

CONFIDENTIAL
- 2 0 -
- nature of sources (man-made , natural , e tc . ) , - proj ected growth in natural as well as man- made sources due to expected
human act ivi ties over the next 50 years , and - atmospher ic l ifet ime s of the species .
The resulting e s t imates for the year 2030 are pres ented in Tab le 4 . I t appears that by 2 0 3 0 atmospher ic CFC ' s may increase by a factor o f 10 , the chlorocarbons by a factor of 3 and the nitrogen compounds and hydrocarbons by 2 0 % and 6 0% , respectively . These e s t imate s were o f course made without taking into account the e ffects of pos s ible counte rmeasures to reduce emi s s ions .
References used in this s ection: 16 , 3 3 , 3 5 , 3 9 , 41 , 43 , 46 , 47 , 4 9 , 5 7 , 6 1 , 64 .
3 . 3 . Temperature and cl imatic changes
The typ ical approach to understanding the re lationship b e tween atmospheric C02 and temperature has been the development of increas ingly complex mode ls of the geophys ical condi t ions that produce global cl imate . S everal types of mathemat ical models have been developed differing in comprehens ivenes s with regard to treatment of the cl imate sys tem components . Individual models can be broadly clas s ified as e i ther thermodynamic ( EBM ' s , energy balance , and RCM ' s , radiative - convect ive models , both accentuat ing the prediction of temperature ) or hydrodynamic (predicting both the temperature and the mot ion fields , and the ir mutual interactions ) models . The l as t catego ry includes the now widely favoured " three dimens ional " General C i rculation Models ( GCM ' s ) . A new model hierarchy i s formed by coup ling a tmo spher ic GCM ' s with different ocean and sea ice models .
The s tandard reference value for comparing alternative models i s �T ( the globally average d temperature increase due to doubled C02 ) . The ra�ge of surface warming s imulated by the groups EBM ' s and RCM ' s for doubled C02 is in remarkable agreement , i . e . 1 . 3 - 3 . 3°C . In comparing resul ts ob tained by EBM ' s the high and low value s are usual ly excluded as the deviat ion i s ascr ibed t o the use of models that require an energy balance for the e arth ' s surface , rather than for the entire earth - atmosphere cl imate sys tem . The main proponent o f the surface energy balance model i s S . I ds o o f the US Water Conservation laboratory . On the bas i s o f emp ir ical obs e rvat ions of cl imatic change in Arizona and measurements o f s olar radiation , he concluded that �T is 0 . 2 5°C , i . e . an order of magnitude les s than that predicted by the oth�r mode l s . Thi s controversy within the mode l l ing community i s fundamental and wil l continue .
The range o f surface warming s imulated by the GCM ' s i s s omewhat larger than that o f the purely thermodynamic mode l s , namely 1 . 3 - 3 . 9°C . For this comparison calculations base d on sea surface temperature/sea ice s imulat ions were excluded from cons ide ration , as thes e show a calculated p re s ent temperature l ower than the presently obs e rved temperature .
None of the above ment ioned computations take the trace gas e ffects into account . The only , very recent , RCM s imulation employ ing the proj ected increase s of all greenhouse gases refers to the period up to the year 2030 , the year characterised by a e s t imated C02 concentration o f about 450 ppm . In that s tudy the relative importance of about 30 gases , including C02 is taken

CONFIDENTIAL
- 21 -
into cons i deration as we ll as coupled perturbations due to chemical - radiative interactions ( see also s ect ion 2 . 2 . 2 . ) . The s imulat ion indicates that by 2 0 3 0 the e ffec ts o f the trace gase s wi ll ampl i fy the C02 surface warming by a factor ranging from 1 . 5 to 3 . 5 ( se e Fig . 1 0 ) .
Howeve r , the warming i s not the entire s tory ; all GCM ' s show an inc rease in the intens i ty of the global hydrological cycle . If the p lanet i s warmer more mo i s ture will evaporate from the oceans , resul ting in a increase of the atmospher ic water concentrati on . The water vapour will also act as a greenhouse gas . In addition , cloud cover might change , as wel l as sea ice and snow cover , al l produc ing e i ther an ampl ificat ion or a reducti on o f the original e ffects (pos i t ive or negative " feedbacks " ) . Although the proce s s of C02 - induced warming i s reasonably well unders tood and s ome o f th� gros s feature s o f the l ikely cl imatic change are reasonably we l l e s tabl ished qual i tatively , the l ikely regional e ffects cannot be modelled with great confi dence at the present t ime . The impact of the expected cl imatic change predicted by these models would be large at a doubled atmospher ic C02 concentration , even larger than any s ince the end of the last ice age about 12 , 000 years ago ( see also Appendix 8 ) : - p re c ip i tab l e water content o f the atmosphere would increase by 5 - 15 % ,
the pre c ip itation rate be ing increased particularly at higher l a t i tudes o f both hemisphere s ,
- s e a - ice cover of the Arc tic would be reduced to a s easonal ice cove r , snow cover would change dependent on lati tude , though extent i s difficul t to predict ,
- ice - cap mas s balance change : a warming of 3°C would induce a 60 - 70 em r i s e o f the global sea level , about hal f o f which would be due to ab lat ion o f the Greenland and Antarctic land ice , the res t to the rmal expans ion of the ocean ; a pos s ible subsequent dis integration of the We s t Antarctic Ice Sheet would result in a worldwide rise in sea level o f S - 6 m ,
- r i s ing sea surface temperature would be highly regional , and - reduced evapo - transpiration of plants would make more water avai l ab le as
runoff and would tend to offset the e ffects of any C02 - induced reduc tions in pre c ip i tation or enhance the e ffects of precip i tation increas e s .
Based on the mode ll ing resul ts , recons truction o f his torical cl imatic conditions and s tudies o f recent warm years and s easons , a markedly different climatic response is expected at different lat i tudes . The rise in the average temperature at the surface would increase from low to high latitudes in the northern hemisphere ( see Fig . 1 ) . There the proj ected increase would be much larger between October and May , than during the summer , thereby reduc ing the ampl i tude o f s easonal temperature variations over northern lands . The model s al so show a large increase in the rates of precip i tation and runoff at high northern latitudes ( see Fig . 10 ) . Thes e change s could have profound e ffects o n the distr ibution of the wor l d ' s wate r resources , and large - scale e ffects o n rain - fed and irrigated agricul ture could be expected : large areas o f Africa , the Middle Eas t , India and a s ubs tantial porti on o f central China would cease to be water deficient areas and become favourable for agr iculture . In contras t , the " food baske t " areas o f North America and the U . S . S . R . would become cons iderably drier .
References us ed in thi s section : 6 , 9 , 1 7 , 2 1 , 2 3 , 2 8 , 40 , 43 , 47 , 4 8 , 5 2 , 5 3 , 5 8 , 6 1 , 6 2 .

CONFIDENTIAL
- 2 2 -
3 . 4 . Detection o f the greenhouse e ffect
The increase in greenhouse gas concentrations from pre - indus trial to the present values might have caused a s ignificant perturbation o f the radiative heating of the cl imate sys tem , resulting in a warming of the global sur face and l ower atmosphere . The induced warming due to the increas e o f the C02 concentration has been computed to be 0 . 8°C in recent RCM ' s and to be twice as l arge in a recent GCM taking into account the increase of the concentration of all ( known) greenhouse gase s .
Such a warming , had i t indeed occurred , should have been detectable . However the s earch for definite evidence on whe ther the cl imate is responding to increas ing concentrations of greenhouse gase s , in the way that mos t models predict , has not yet been succe s s ful . Scientists argue that the warming is delayed through the inertia o f the global sys tem . They expect that the warming wil l not r i s e above the no ise level of natural cl imatic var i ab i l i ty before the end of this century . By then the 6 T may have risen above the natural surface temperature variation ( typ icilly ± 0 . 2 - 0 . 4°C for the northern hemisphere ) . This natural fluctuation in hemispher ic or global mean temperatures , observe d over the last century ( see Fig . 1 2 ) , i s influenced by var i ous climate forcing phenomena , e . g . s olar i rradiance , volcanic ae rosols , and surface radiative properties , thereby making the s ought- for C02 s ignal unclear .
O ther scient i s ts argue that the models overe s t imate the temperature increase due to the increas e of the greenhous e gases . In the ir view mode llers have so far concerned themselves mainly with two climatic feedback proce s s e s , which are cla imed to ampl i fy any C02 warming : the s o - called ice - albedo fee dback and the water vapour feedback . The cr it ics argue that thes e two feedback proce s s e s are currently overe s t imated whi l e others are complete ly neglected , undere s t imated or overestimated ( for example , the carbon dioxide - ocean circulation - upwe l l ing feedback , the C02 - ocean s tab i l i ty -winter down well ing fee dback , the C02 -Arctic sea ice -Artie biomas s feedback , the C02 - rainfall dis tr ibution - trop ical biomas s feedback , the permafros t -me thane release feedback , and the C02 - weathering of s il icate mine rals feedback) . Ove re s t imat ion o f the ice - albedo fee dback i s particularly relevant .
I t i s also argued that the cl imate models have not been cons tructed with ocean surface temperature as the fundamental vari able . Therefore , the inab i l i ty to observe the mode l - calculated C02 warming i s a consequence of a lag due to the rmal inertia of the ocean . In o ther words , the atmosphere cannot warm unti l the oceans do . Other s tudies indicate that the abs orp tion of C02 and heat by the oceans could pos s ib ly delay a greenhouse warming by f ive to twenty years .
Regardless o f the continuing debate , confirmation of any view i s important . I f , as expected , the concentrations of the greenhous e gase s gradually increase in the future , then the l ikel ihood o f ach ieving s tatistical confi rmation increases . Improvements in cl imatic monitoring and mode l l ing and in the h i s toric data - bases , would allow an earl ier detect ion of any greenhous e e ffect wi th greater confidence .
Re ferences used in thi s s ect ion : 4 , 12 , 1 3 , 1 7 , 2 8 , 3 1 , 47 , 5 8 , 6 0 , 6 3 .

CONFIDENTIAL
- 2 3 -
4 . IMPLICATIONS
Although the greenhouse e ffec t has been undetec table up t i l l now , the atmospher i c c oncentrat ions of the greenhouse gase s are s teadi ly increas ing . Whe ther or not thi s will resul t in a s i gnificant global warming and i f s o , when i t will o ccur , i s s ti l l a matter o f debate . However , without the direc t need o f a clear s ignal i t i s use ful t o give cons i derati on to measures to counteract the l ikely e ffec ts . Potential e ffects are ident i fied below as suming a future greenhouse e ffec t irrespect ive o f uncertaint i e s as sociated w i th t iming and s ever i ty o f the impact .
4 . 1 . Po tential e ffects o f global warming induced by gre enhouse gas e s
In thi s section pos s ible e ffects o f increas ing concentrations o f C 0 2 and the other greenhouse gase s are enumerated , as we ll as the e ffects o f a c l imate changed by global warming .
4 . 1 . 1 . Ab iot ic effects and b iotic consequences
I . Oceans
1 . Increased water temperature
2 . Increased vertical s tab i l i ty of water mas s e s
3 . Decreased latitudinal and s eas onal sea ice extent
4 . Temperate decrease and high latitude increase in net prec ip i tation and runoff
5 . Decrease in pH
6 . Ris ing sea level
Increased growth/development rates and me tabolic demands o f all marine spec ie s , i . e . increas ed survival and growth o f natural res ource s , through shi fts o f range s and migration patterns .
In turbulent ( subpolar ) waters increas ed phytoplankton production and increase d fish yields . In s tratified ( subtrop ical ) waters decreased phytoplankton produc t ion �nd decreased fish yields .
Lower intens i ty but greater durat i on of primary production .
Poleward species shifts due to shifts in salinity patterns .
Increas ing tendency o f dis s o lution o f carbonate shells ( e . g . shel lfish ) , c orals and s ediments .
Redis tribu-tion o f nearshore and e s tuarine hab i tats , inc luding adaptation or loss o f natural resources .

CONFIDENTIAL
- 24 -
I I . Agri culture
Of the 2 0 food crops , that feed the world , 16 have a C 3 photosynthet i c pathway . The only exceptions are corn , sorghum , m i l l e t and sugarcane , which have a C4 pathway ( see also chapter 2 . 3 . 2 . ) . Of the world ' s 1 8 mos t noxious weeds , 1 4 have the C 4 pathway .
1 . Increas ing atmospheric C02
2 . Increas ing C02 and specific crops
3 . Increased cloud cover
4 . C l imati c change in general
5 . Decrease in prec ip itation at 40°N and l0°S
6 . Increas e in prec ip i tation between 10° and 2 0°N , north o f S O o N and s outh o f 3 0°S
7 . Lat i tudinal differences in temp erature rise
Increas ing produc t ivity , providing o ther fac tors affecting p l ant growth ( l ight , water , temperature , nutrients ) are not adversely affected ; increas e in yield and harves t index , improved quali ty and accelerated matur i ty . Increase in water use efficiency and a decrease in water requirements , i . e . a greater s tab i l i ty o f produc tion and less crop failure s .
Greater water use e fficiency with C4 plants than with C 3 plants . Growth more s t imulated in C 3 than in C4 plants . Indeterminate plants benefit more than determinate plants . Thus , C 3 plants and indeterminate plants have a higher comp e t i t ive ab i l i ty under opt imal conditions and C4 plants will be less affected by water s tres s . Changes in c rop/weed interactions and relationship s .
Increased quantum yield o f net photosyn thes is , i . e . benefic ial effects o f high C02 on growth when l i ght i s l imite d .
Greater res i lience to environmental s tres s , such as high temperatures and shortage of water . Redi s tribution of spec ies . Impact o f changed weather i s sharp in marginal c limates .
Decreased runoff for irrigation , increase of evaporation , and decrease in y i e l d .
Increase o f runoff , des truct ive floods , and inundation o f low - lying farmland .
Increased length o f growing s eason in temperate z one and far north lat i tudes . Latitudinal differences in water require ments by plants .

I I I . Terres tr ial ecosystems
1 . Increased atmospheric atmospher ic C02
2 . C l imatic change
CONFIDENTIAL
- 2 5 -
Increas ed water use e ffic i ency . Pos i t ive response in seeding s tage . S t imulation o f NEP , c ompetiti on induced change in total phytomass , and succes ive devel opment to a new c l imax vegetation . Shift o f the b io spheric act ion from C02 s ource to C02 s ink .
Alterations o f ecosys tems e special ly in regions with s trong gradients in evapo transp iration . Maj or shi fts in the global d i s tr ibutions o f species .
Re ferences us ed in this section : 2 9 , 3 2 , 34 , 3 7 , 5 5 , 6 5 , 6 7 .
4 . 1 . 2 . Soc io - economic impl icat ions
The changes in c l imate , be ing cons idered here , are at an unaccus tomed dis tance in t ime for future planning , even beyond the l i fe t ime of mo s t o f the pres ent dec i s ion makers but no t beyond intimate ( family) association . The changes may be the greates t in recorded his tory . They could alter the environment in such a way that hab i tab i l i ty would be come more sui table in the one area and less sui table in the o ther area . Adaptation , migration and replacement c ould be called for . All o f thes e ac tions will be c o s tly and uncertain , but could be made acceptable . Of course , all changes wi ll be s low and gradual and , therefore , adap tation and replacement , even migration , need not to be no ticeable agains t the normal trends . Recognition o f any impac ts may be e arly enough for man to be able to antic ipate and to adapt in t ime .
The adap tat ion o f the ecosys tems on e ar th to changes in c l imate , however , will be s l ow . I t would be unreal istic to expect adaptat ion to occur within a few decades . Therefore , change s in ecosys tem s tab i l i ty , di s turbance o f ecosys tem s truc ture and func tion and even local disappearance o f spec ific ecosys tems or hab itat des truc tion coul d occur . Thi s will be fol l owed by an almo s t unpredic table , complex process of adaptat ion o f the ecosys tems to the changed condit i ons to reach a new s tab le s i tuat ion , the s o - called cl imax e co syst em . Qui te c le arly , thi s process of adap tation would become even more c omplex when it is interrupted more frequently or even continuous ly , such as through permanently changing c l imatic c ondi tions . A new s table s ituation c an only be expected to occur after a global settling o f the change in c l imate . The t ime i t then wil l take to reach a new s table s i tuation depends largely on the seriousne s s o f the dis turbance o f the ecosys tems and , thus , on the e ffec t ivenes s o f the programmes to protect the e arth ' s cl imate agains t change .
Changing temperature and pre c ip i tation are the key e lements in c l imat i c change . The main e ffects will be o n the sea leve l and natural ecosys tems . S oc i o - e conomic impl ications will be re lated to agr iculture , fisheries , p e s ts , water supply , e tc . While the greenhous e e ffec t i s a global phenomenon , the consequences and many o f the socio - economic implications will be regional and local wi th large temporal and spatial variations . The

CONFIDENTIAL
- 26 -
following outl ine o f pos s ib i l ities i s therefore incomplete and speculative , but can be a bas is for further c ons ideration and s tudy .
1 . Rise in sea level - More than 3 0% o f the world ' s population l ive within a 5 0 -kil ometre area
adj o ining oceans and s eas , s ome even below sea leve l . Large low - lying areas could be inundated ( e . g . Bangladesh) and might have to be abandoned or protected e ffec t ively .
- Shall ow s eas , lagoons , bays and e s tuaries characterised by extens ive t i dal flats could become p ermanently inundated . Loss of these hab i tats would mean a los s of extremely highly product ive and diverse areas , which serve as a nurs ery for j uveniles of all kinds of animal species and which are rich in food for fish . Effects on natural resource s -dependent on these sys tems , might there fore be dramatic ( e . g . shellfi sh cul ture and fishing , s eaweed harve s t ing , s ome c ommerci al ly important fish ) . There might be a shift in di s tr ibution o f amenities , and as a cons equence local l o s s o f income , though at o ther places new s ources o f revenue might emerge .
2 . Rise in sea temperature Survival and growth o f mar ine spec ie s may increas e in general , though no t in s trat i fied sub tropical waters . However , shifts in ranges and migrat ion patterns could resul t in local losses of food s ources and revenues , and could require operation in o ther ( more dis tant ) fishing grounds .
3 . Ac idificati on o f seawater D i s solution o f CaC03 increases with a decreas ing pH . Par t icularly in shallow coas tal areas , charac ter ised by high concentrat ion of resp iratory C02 and a low pH , dissolution of c arbonate mater ials ( she lls , corals and s ediment ) could be qui te r ap i d and re sult in damage of natural resources and of natural prote c t i on of shore l ines , and dis appearance of comp lete c oral i s lands .
4 . Agriculture - The impact depends on both the amp l itude o f c l imati c changes and
agr iculture ' s vulnerab i l i ty to cl imatic variab i l i ty . Thi s vulnerab i l i ty varies from region t o region and will have great imp lication for import and export patterns of food o f the countr ies dependent on agr icul ture for a l arger part o f the i r earnings s ome will l o s e s ome will gain . Poorer countries would run the greates t risk , the more s o as the ir c apac i ty to adapt would be the smalles t . Mos t farm l abour i s appl ied outdoors and i s therefore e s s ential ly dependent on weather and c l imate . Any subs tantial change there in could nece s s itate adap tation and require new inves tments . Mode l calculations show that a warmer and drier c l imate c ould decreas e y i e l ds o f the thre e great American food crops over the entire grain belt by 5 to 10% , t empering any direc t advantage of C02 enhancement o f photosynthe s i s . Although e s t imates f o r o ther are as are n o t available , any decrease may certainly have an impact on the world food supply and its p r ice . A warming in northern cult ivation , al though promis ing . Thi s would
lat i tude s could make additional land suitable for the qual i ty o f such land for c rops i s not
resul t in local changes in leve ls o f income and

---
CONFIDENTIAL
- 2 7 -
working arrangements .
5 . Area of forest With a growth rate o f the world population o f 1 . 5 % per year the human are a increases s lowly , presently mainly at the expense o f gras s l and and agricul tural land . However , decreas ing yields in c omb inat ion with an inc reas ing human population may require an extens ion o f arab l e land . Thi s would certainly have impl ications for the trop ical ( and temperate ) fore s ts . Based on the mos t pes s imis t ic predictions a dis appearance o f fores t s i s expected dur ing the firs t half of the 2 1 s t century , should human population growth cont inue inde finitely . Such a decrease in area of fores t means a s i gnificant decrease of carbon fixed in the terres tr ial biosphere reservo ir and , consequently , an increas e of atmosphere C02
- The natural trans i tion l ine between dec iduous and needle - leafed trees and the upper tree - l ine will shift to higher latitudes and higher elevat ions . Thus the to tal area sui table for growth of dec i duous trees (mainly temperate and boreal fore s ts ) wi ll increase .
6 . Changing a ir temperature - Local temperature change may nece s s itate l ocal adaptat ion of the
buildings in which people l ive and work , technologies for heating or cool ing , energy s ources for heating and cool ing , new food preparation technologie s , new cul t ivation techniques , e tc . All such adaptations are cos tly and s ome would dras tically change the way people l ive and work .
7 . Water supply - The prospects for water supply ( s ource s , us es , transpor t , s torage and
conservation) are evidently o f importance . Rainfall , snowfall , and evaporation are among the key e l ements in c l imate change . Level o f groundwater or need o f irrigation or drainage would be main de terminants of whether increased rain and s now would be welcome and how cos tly reduced prec ip itation would be .
- Local deve lopment of new s ources of freshwater would be require d . Water s torage and transport , and inhib i tion o f evaporation should rece ive c ont inued attention .
Re ferences us ed in thi s s ec t ion : 14 , 1 5 , 18 , 2 6 , 4 8 , 5 0 , 5 1 .
4 . 1 . 3 . Impl icat i ons for the energy industry
Direct operational consequence s can be expected from a ris ing s e a leve l , impacting o ffshore ins tallations , coas tal fac i l i t ie s and operations ( e . g . platforms , harbours , refineries , depots ) with an uncerta in magnitude . Cos ts o f de fending agains t a s e a level rise wil l depend on the local s i tuation ( level s o f s e curi ty demanded for contingenc ies l ike extreme ocean s torms , flooding , e tc . ) and national policies to compensate indus try for the extra c o s ts incurred .
Coal and the c omb ined fuels o f o il and gas c ontribute roughly equal amounts o f C02 ( see Table 7 ) . Becaus e natural gas produces l e s s C02 per uni t of energy , a swing from coal towards gas would reduce the C02 emi s s ion . Thi s argument h a s been used in individual cho ices of fue ls f o r new power s tations , but s ince almos t 90% o f the world ' s recoverable coal is l ocated in

I ,
CONFIDENTIAL
- 2 8 -
the U . S . S . R . , China and the U . S . , i t i s these countries which would have to be taking such an initiative i f cons ide red feas ible .
An overall reduc tion in fos s il fuel use would o f course reduce C02 production and could be achieved by cons traint on en�rgy consumption , by improved thermal e ffic iency and by replac ing fos s il fuels with e . g . nuclear p ower . But such a course o f action would imply a maj or shift in world energy supply and use .
Energy pol icy i s sues will be difficult to tackle because i t i s the world wide foss il fuel us age that affec ts the level of C02 in the atmosphere , but the mechanisms for develop ing world wide energy pol i cy do not at pres ent exi s t . There is l i ttle incentive for s trong voluntary act ion by individual c ountries when the benefits would be shared with the rest of the world , but the c o s ts would be borne wholly internally . Furthermore , world growth in fo s s i l fuel use is expected to be greates t in develop ing countr ie s , and they are unl ikely to wish to c ons train the i r development programmes .
The energy indus try will c learly need to work out the part i t should p lay in the development of pol icies and programmes to t ackle the whole problem . I t will not b e appropriate t o take the main burden , for the i s sues are ones that ult imately only governments can tackle , and users have an important role . But i t has very s trong interests at s take and much expertise to contr ibute , particularly on energy supp ly and usage . I t also has i ts own reputat ion to c ons ider , there be ing much potential for public anxi e ty and pres sure group activity .
References used in this s ect ion : 2 , 8 , 14 , 3 0 , 5 0 , 5 1 , 6 6 .
4 . 1 . 4 . Implications for She ll Companie s
For the purposes of this discus s ion , i t i s as sumed that the consequence of increas ing l evel s of carbon dioxide are as already set out , name ly , an increase in air temperature , changes in weather patterns , a r i s e in sea leve l o f less than 1 metre and s ome small increas es in agricultural yie lds .
Pos s ible imp l ications include : - Legis lation affe c ting our products and/or proces s e s . - Location of Shell ins tallations . - Changing demand for our products :
o l i quid fuel s o coal o chemicals , p articularly agrochemicals
- Bus ine s s opportunities : o alternat ive fuels o fores try o new var i eties o f plants ( seeds bus ine s s )
While , theoret ically , i t i s pos s ible t o legis late for a reduc t ion i n fo s s il fuel use , i t mus t be the -case that any global reduc tion i s mos t unl ikely . Howeve r , in a paper produced as background information for the late s t set of energy s cenarios , Group Planning fe l t there was a pos s ib i l i ty that an increas ing awarenes s of the greenhouse effec t might change peoples ' attitudes towards non- fo s s i l energy sources , espec ial ly nuclear .

CONFIDENTIAL
- 2 9 -
Fos s i l fuel s which are marketed and used by the Group account for the product ion o f 4 % o f the C02 emi tted worldwide from c ombus t ion . Of thes e emi s s ions , 8 0 % c omes from Group o i l , 1 2 % from Group gas and 8 % from Group c oal ( see Tab l e s 7 and 8 ) .
I t i s thermodynamical ly unfavourable and technic al ly very d i fficul t to remove carbon dioxide from the air o ther than by planting trees . If an international e ffort were mob il ised to do thi s , and the poor response to the Worl d Bank ' s call for such e ffort currently makes i t appear unl ike ly , then there would be s ome c all on c ompanies , including Shel l , with experience in trop ical fore s try .
O f the o ther greenhouse gases , many are chemical s in c ommercial us e which c ould in p r inc iple be replaced or banned ; i t i s difficul t , on the o ther hand to see what c ould be done about o thers such as methane .
There seems l i ttle nee d to c ons ider changes in the location o f She l l ins tal lat ions becaus e o f the s lowne s s o f changes i n s e a leve l in the cho sen t ime - frame . C l imatic change could al ter the re lative wealth o f certain LDC ' s and lead us to examine the pos s ib i l i t ie s o f expanding or contrac t ing our bus ine s s accordingly .
The s e same change s , by altering the patterns o f agr iculture c ould alter up or down the demand for our agri cul tural produc ts b o th chemicals and s e e ds , though i t i s difficul t to forecas t the e ffec t o f the biotechnological revo lut ion on this area - i t might swamp any effect o f increas ing carbon dioxide .

CONFIDENTIAL
- 30 -
5 . S COPE FOR FURTHER ACTION
The exi s t ing large uncertainties surrounding the pos s ible consequences of the increas ing atmospher ic C02 concentration divide thos e who at leas t see sub s tance in the theory , in the following three bas ic c ategories : 1 . Those who b e l i eve there i s no need for short - term action and insufficient
knowledge about how to tackle the problem , so that nothing nee d be done for the moment o ther than to narrow the exi s ting uncertainties ,
2 . Tho s e who bel i eve that the threat i s real , and s e ek to e liminate the problem , and
3 . Those who believe that the threat i s real and unavo i dable , s o that n learning to l ive with c l imati c change n is the only s o lution .
S ome people may , o f cours e , l ie between thes e categories , e . g . thos e who bel ieve the threat i s not c ons iderable and who s eek both to reduce its intens i ty and to adapt to i t .
From thes e groups came a number o f actions and s trate gies which are b e l i eved mos t appropriate . Current ( 19 8 6 ) offic ial , government attitude mainly fit the firs t approach , though there i s a tendency to c arry out analyses that would eventually lead to discus s ion of remedial measure s ( se e also Appendix 3 ) .
First group - Bas i c research and monitoring :
o monitoring o f causal factors : emi s s ion o f greenhouse gases atmospheric c oncentration of these gase s s olar var iations volcanic aerosol change s in area of fore s t
o c l imat i c e ffects : temperature radiation fluxe s pre c ip i table water c ontent c l oud c over sea l evel s e a temperature snow and s e a - ice c over ( remote s ens ing)
- Applied research and development : o agr i cul ture :
r espons e s o f ecosys tems c rop yields phys iology and growth
o water resources
Second group Analys i s o f e conomic and social c o s ts as sociated with c l imate change
- Reduct ion of r e le as e s of greenhouse gases o ther than C02 - Management o f biota :
o free z ing rate of deforestation o free z ing land reclamation o fre e z ing rangeland burning o promotion o f re - jaffores tation

CONFIDENTIAL
- 3 1 -
o fertil i s ation of the ocean surface with phosphorus and nitrogen , thereby increas ing the b iotic fixat ion of C02 ( generating o ther adverse e ffects )
- Removal o f C02 : o deep - sea disposal o f C02 produced at central ised location
( conse quently generating s econdary e ffects ) o re - /affores tation
- Energy research and pol icy : o development o f renewable energy s ources :
s olar energy b i omas s c onvers ion geo thermal energy hydroelectr ic energy ut i l i s at ion of energy contained in was te w ind energy
o rational us e of energy : energy saving new energy carriers
o analys i s of energy sys tems ( energy - economy mode l s ) : open ended versus c losed ended sys tems ( open ended sys tems are tho se which through evo lut ion in the use of end products allow s atis faction o f energy nee ds without increas ing us e of fixed carbon s ources )
- Energy management : o reduc t ion o f fos s i l fue l usage o us age of low - carbon fue l s o us age o f alternat ive energy s ource s
Third group - Adaptation to c l imatic changes through :
o changes in environmental control o migration Adap tation to sea level rise through : o migration o cons truc t ion of (higher ) dikes Adap tation to e ffects on agriculture through : o migration o change o f crops o modification of varieties o al teration o f husbandry
I f the environmental problem deve lops as s ome predict , then the impact would be sufficiently large as to require a pol icy re sponse . Re - direc tion o f research emphas i s towards analys i s o f energy and pol icy options will then require particular attention .
I t should be noted that , when C02 becomes the focus o f c oncerted international action , the develop ing nat ions will be parti cularly affected .
Reference s used in thi s section : 8 , 10 , 14 , 1 9 , 3 0 , 3 8 , 5 1 , 6 6 , 69 .

I ' , , I ' i : 1
i i
CONFIDENTIAL
- 3 2 -
6 . REFERENCES
1 . Ausubel , J . H . ; Nordhaus , W . D . A review o f e s t imates of future carbon dioxide emis s ions . In : Nat ional Research Counc i l , Changing Cl imate , Report o f the Carbon dioxide As ses sment Committee . Nat ional Academy Pres s , Washington , D . C . pp 1 5 3 - 18 5 , 1 9 8 3 .
2 . Baxende l l , P . The changing energy balance in As i a Pac i fi c . Address to the PetroPac i fic ' 84 Congress , Melbourne , Aus tral i a , 8 pp . , 1 9 84 .
3 . Brewer , P . G . Carbon dioxide and the oceans . In : Nat ional Research Counc i l , Changing C l imate , Report o f the Carbon Dioxide As ses sment Committee . Nat ional Academy Pres s , Washington , D . C . pp 1 8 8 - 2 1 5 , 1 9 8 2 .
4 . Broecker , W . S . ; Peteet , D . M . ; Rind , D . Does the ocean - atmosphere sys tem have more than one s table made o f operation? Nature 3 1 5 : 2 1 - 2 5 , 1 9 8 5 .
5 . Brown , S . ; Lugo , A . E . Biomas s o f trop ical fore s ts : a new e s t imate based on fores t volume s . S c i ence 123 : 1 2 9 0 - 1 2 9 3 , 1 9 84 .
6 . Bryan , K . The role o f the ocean in the trans ient c l imate response to increas ing atmospheric C02 . In : Proc . J o int Oceanographic As s embly 1 9 8 2 , Gen . Symp . Hal ifax , pp 43 - 46 , 1 9 8 3 .
7 . Byrne , R . H . ; Acker , J . G . ; Betzer , P . R . ; Fee ly , R . A . ; Cates , M . H . Water c olumn dis s olution o f aragoni te in the Pac ific Ocean . Nature 312 : 3 2 1 - 3 2 6 , 19 84 .
8 . Comp ton , W . D . Alternate fuels - a technology that i s ready . UP Front/Agricultural Engineering 6 6 : 12 - 13 , 19 8 5 .
9 . C r ane , A . J . Pos s ible e ffects o f r1s 1ng C02 on c l imate . P l ant Cell Environ . 8 : 3 7 1 - 3 7 9 , 1 9 8 5 .
1 0 . Dahlman , R . C . ; S train , B . R . ; Rogers , H . H . Res e arch on the response o f vegetation to elevated atmospher i c c arbon dioxide . J . Environ . Qual . 14 : 1 - 8 , 1 9 8 5 .
1 1 . Duplessy , J . - C . ; Shackle ton , N . J . Response o f global deep - water c irculation to earth ' s c l imatic change 1 3 5 , 000 - 10 7 , 000 years ago . Nature 3 16 : 500 - 507 , 19 8 5 .

- 3 3 -
1 2 . El1saes ser , H . W . The c l imatic effec t o f C02 : a different view . Atmospheric Environment 18 : 431 - 434 , 1 9 84 .
1 3 . Fritts , H . C . ; Lough , J . M .
CONFIDENTIAL
An e s t imate o f average annual temperature variations for Nor th Amer ica , 1602 to 1 9 6 1 . C l imati c Change 7 : 203 - 2 24 , 1 9 8 5 .
14 . Golanty , E . The global experiment . Carbon dioxide and ocean temperature . Oceans 17 : 6 6 - 6 9 , 1 9 84 .
1 5 . Goudriaan , J . ; Ke tner , P . A s imulation s tudy for the global carbon cycle , inc luding man ' s impact on the biosphere . C l imatic Change 6 : 16 7 - 192 , 1 9 84 .
16 . Hameed , S . ; Ces s , R . D . Hogan , J . S . Re spons e o f the global c l imate to changes in atmospheric chemical c ompos i t ion due to fos s i l fuel burning . J . Geophys . Re s . 8 5 : 7 5 3 7 - 7 545 , 1 9 8 0 .
17 . Hansen , J ; Johns on , D . ; Lac i s , A . ; Lebede ff , S . ; Lee . P . ; Rind , D . ; Rus s el , G . C l imate impac t o f increas ing atmospheric carbon dioxide . S c ience 2 1 3 : 9 5 7 - 9 6 6 , 19 8 1 .
18 . Hartwig , S . ; Heudorfer , W . ; S chnatz , G . Pos s ib le c l imat ic change by anthropogenic C02 emi s s ion . J . Chem . E . Sympos ium Series , No . 7 8 , T4/15 - T4j3 0 , 1 9 8 2 .
19 . He intzenberg , J . ; Hans s on , H . - C . ; Ogren , J . A . ; Odh , S . -A . Concept and real i s at ion o f an air pol lution monitoring s tation i n the European Arc t i c . Amb io 14 : 15 2 - 15 7 , 1 9 8 5 .
20 . Hileman , B . The greenhouse effect . Environ . S c i . Technol . 16 : 9 0A - 9 3A , 1 9 8 2 .
2 1 . Hileman , B . Recent reports on the greenhouse e ffec t - what are s ome difference s between the EPA and NRC s tudies ? Environ . S c i . Technol . 1 8 : 45A - 46A , 1984 .
2 2 . Hobb ie , J . ; Dungan , J . ; Houghton , R . A . ; Peterson , B . Role o f b i o ta in global C02 balance : the controversy . B i o S cience 34 : 4 9 2 - 49 8 , 1 9 84 .
2 3 . Hoffert , M . I . ; Callegari , A . J . ; Hs iek , C . T . The role o f deep sea heat s torage in the secular r esponse to c l imatic forc ing . J . Geophys . Res . 8 5 : 6 6 6 7 - 6 6 7 9 , 1980 .

CONFIDENTIAL
- 34 -
24 . Houghton , R . A . ; Hobbie , J . E . ; Mel illo , J . M . ; Moore , B . ; Peterson , B . J . ; Shaver , G . R . ; Woodwe l l , G . M . Change s in the c arbon c ontent o f terre s tr ial b io ta and s o i l s between 1 8 6 0 and 1 9 8 0 : a net release of C02 to the atmosphere . Eco l . Monogr . 5 3 : 2 3 5 - 2 6 2 , 1 9 8 3 .
2 5 . Hugil l , J . A . The c arbon dioxide greenhouse effect . KSLA , report AMGR . 80 . 10 5 , 9 pp , 1 9 8 0 .
2 6 . I chimura , S . The impacts o f c l imati c change on human s o c i e ty . In : C arbon dioxide Effects Research and As ses sment Program . Workshop on Environmental and Societal Consequence s of a Pos s ible C02 I nduced C limate Change . U . S . - DOE , Conf - 7 9 04143 , pp 442 - 46 2 , 1 9 8 0 .
2 7 . I dso , S . B . Temperature l imitation by evaporation in hot c l imates and the greenhous e e ffec t s o f water vapour and carbon dioxide . Agr i c . Metero l . 2 7 : 105 - 109 , 1 9 8 2 .
2 8 . I dso , S . B . The s earch for global C02 ect . " Greenhouse Effe c ts " . Environ . Conse rvation 1 2 : 2 9 - 3 5 , 1 9 8 5 .
2 9 . I dso , S . B . ; Brazel , A . J . Ris ing atmo spher ic carbon dioxide c oncentrations may increas e s treamflow . Nature 3 12 : 5 1 - 5 3 , 1 9 84 .
3 0 . Jaske , R . T . Carbon dioxide - the premier environmental challenge of our t ime . Environ . Progres s 2 : 145 - 148 , 1 9 8 3 .
3 1 . Ke llogg , W . W . Feedback mechanisms in the c l imate sys tem affe c t ing future l evels o f carbon dioxide . J . Geophys . Res . 8 8 : 1 26 3 - 1 2 6 9 , 1 9 8 3 .
3 2 . Kendall , A . C . ; Turner , J . C . ; Thomas , S . M . E ffe c ts o f C02 enrichment at different irradiances on growth and yield of wheat . J . Exp . Bot . 3 6 : 2 5 2 - 2 6 0 , 1 9 8 5 .
3 3 . Kerr , R . A . Doub l ing o f a tmospher i c methane supporte d . S cienc e 2 2 6 : 9 5 4 - 955 , 1 9 84 .
3 4 . King , D . A . E s t imating the direct effect o f C02 on soybean yield . J . Environ . Mngt 2 0 : 5 1 - 6 2 , 19 8 5 .

CONFIDENTIAL
- 3 5 -
3 5 . Kondratyev , K . Ya . ; Bunakova , A . M . Fac tors o f the greenhouse e ffect o f the atmosphere and the ir influence on c l imate . In : Will iams , J . ( e d . ) , Carbon Dioxide , Cl imate and Society . Pergamon Pres s , Oxford , pp 2 0 1 - 207 , 19 7 8 .
3 6 . Kratz , G . Mode l l ing the global carbon cycle . In : Hutz inger , 0 . ( ed . ) , The Handbook o f Environmental Chemis try , Vol . 1 , Part D . Springer Verlag , Ber l in , pp 2 9 - 8 1 , 1 9 8 5 .
3 7 . Lal larche , V . C . ; Grayb i l l , D . A . ; Fri tts , H . C . ; Ros e , M . R . Increas ing atmospheric carbon dioxide : tree r ing evidence for growth enhancement in natural vege tat ion . S ci ence 2 2 5 : 1019 - 10 2 1 , 1 9 84 .
3 8 . Laurmann , J . A . The global greenhouse warming problem : setting the priori t ie s . Cl imat ic Change 7 : 2 6 1 - 2 6 5 , 1 9 8 5 .
3 9 . Levine , J . S . ; Rins land , C . P . ; Tennille , G . M . The photochemis try o f me thane and carbon monoxide in the troposphe re in 1 9 5 0 and 1 9 8 5 . Nature 318 : 2 54 - 2 5 7 , 1 9 8 5 .
40 . Manabe , S . ; S touffer , R . J . S ens i t ivi ty of a global cl imate mode l to an increas e of C02 concentration in the atmo sphere . J . Geophys . Re s . 8 5 : 5 5 2 9 - 5 5 54 , 1980 .
41 . Maugh , T . H . What i s the r isk from chlorofluorocarbons ? S c ience 2 2 3 : 105 1 - 1052 , 19 84 .
42 . Mook , W . G . ; Enge lsman , F . M . R . Re t atmosfe r i s che C02 gehal te en de rol van de oceanen . Chemisch Magaz ine , Dec . 1 9 8 3 : 6 6 9 - 6 7 1 , 1 9 8 3 .
4 3 . Nicol i , M . P . Viscont i , G . Impac t of coupled perturbations of atmospheric trace gase s on e arth ' s c l imate and ozone . Pageoph . 1 2 0 : 6 2 6 - 641 , 1 9 8 2 .
44 . Papaud , A . ; Po i s s on , A . Le cyc le du carbone e t s a perturbation par les ac t ivites humaine s : un apercu du probleme . Oceanologica Acta 8 : 1 3 3 - 14 5 , 1 9 8 5 .
4 5 . P earman , G . I . ; Hys on , P . Act ivities of the global biosphere as reflected in atmospher i c C02 records . J . Geophys . Res . 8 5 : 446 8 - 4474 , 1 9 8 0 .

CONFIDENTIAL
- 3 6 -
46 . Ramanathan , V . Greenhouse e ffec t due to chlorofluorocarbons : c l imati c impl ications . S c i ence , 1 9 0 , 50 - 5 2 , 1 9 7 5 .
47 . Ramanathan , V . ; C icerone , R . J . ; S ingh , H . B . ; Kiehl , J . T . Trace gas trends and the i r potenti al role in c l imate change . J . Geophys . Res . 9 0 : 5 547 - 5 5 6 6 , 1 9 8 5 .
48 . Reve ll e , R . Carbon dioxi de and world c l imate S c i . Amer . 247 : 3 3 - 41 , 19 8 2 .
4 9 . Rins land , C . P . ; Levine , J . S . ; Mile s , T . Concentrati on o f methane in the troposphere deduced from 1 9 5 1 infrared s olar spectra . Nature 3 1 8 : 245 - 249 , 1 9 8 5 .
SO . S chell ing , T . C . C l imatic change : imp l icat ions for wel fare and policy . In : Natural Res earch Council , Changing Cl imate , Report of the Carbon Dioxide As sessment Committee . National Academy Pres s , Washington , D . C . pp 449 - 48 2 , 1 9 8 3 .
5 1 . S chell ing , T . C . C l imatic change : impl ications for wel fare and pol icy . Amb io 1 3 : 2 00 - 201 , 1984 .
5 2 . I chles inger , M . E . Cl imate mode l s imulations of C02 - induced c l imatic change . Adv . Geophys ics 2 6 : 141 - 2 3 5 , 19 84 .
5 3 . S emtner , A . J . On modell ing the seasonal thermodynamic cycle o f sea ice in s tudies of c l imatic change . C l imatic Change 6 : 27 - 3 7 , 1984 .
54 . Shackle ton , N . J . ; Hall , M . A . ; Line , J . ; Shuxi , C . Carbon i s o tope data in core V19 - 30 confirm reduced c arbon dioxide concentration in the ice age atmosphere . Nature 3 0 6 : 31 9 - 32 2 , 19 8 3 .
5 5 . Shugart , H . H . ; Emanuel , W . R . Carbon dioxide increase : the impl ications at the ecosys tem l eve l . Plant Cel l Environ . 8 : 3 8 1 - 3 8 6 , 1 9 8 5 .
5 6 . Smith , S . V . Phys ical , chemical and b iological character i s tics o f C02 gas flux across the air -water interface . Plant , Ce l l Environ . 8 : 3 8 7 - 39 8 , 1 9 8 5 .
5 7 . S tauffle r , B . ; Fischer , G . ; Nefte l , A . ; Oeschger , H . Increase o f atmospheric methane recorded in Antarctic ice core . S c i ence 2 2 9 : 1 3 8 6 - 1 3 8 8 , 1 9 8 5 .

CONFIDENTIAL
- 37 -
5 8 . S tewart , T . R . ; Glantz , M . H . Expert j udgment and c limate forecas ting : a me thodological c r i t i que of " c l imate change to the year 2000 " . C l imatic Change 7 : 15 9 - 18 3 , 1 9 8 5 .
5 9 . Tyndal l , J . On the absorption and radiat ion of heat by gase s and vapours , and on the phys ical c onnec tion of radiation , abs o rp tion , and conduc tion . Philosoph . Mag . Ser . 4 : 1 6 9 - 194 and 2 7 3 - 2 8 5 , 18 6 1 .
6 0 . Walke r , J . C . G . ; Hays , P . B . ; Kast ing , J . F . A negative feedback mechanism for the long - term s tab i l i s ation o f earth ' s sur face temperature . J . Geophys . Res . 8 6 : 9 7 7 6 - 9 7 8 2 , 1 9 8 1 .
6 1 . Wang . W . C . ; Yung , Y . L . ; Lac i s , A . A . ; Mo , T . ; Hansen , J . E . Gre enhous e e ffects due to man - made perturbations o f trace gases . S c i ence 194 : 6 8 5 - 690 , 1 9 7 6 .
6 2 . Washington , W . M . ; Meehl , G . A . S eas onal cyc le exper iment on the c l imate sens i t ivity due to a doubl ing of C02 with an atmospheric general c irculation mode l coupled to a s imple mixed - layer ocean model . J . Geophys . Res . 8 9 : 947 5 - 9 5 0 3 , 1984 .
6 3 . We ller , G . ; Baker , D . J . ; Gate s , W . L . ; MacCracken , M . C . ; Manabe , S . ; Vander Haas , T . H . Detection and monitoring o f C02 induced c l imate changes . In : Nat ional Research Counc i l , Changing Cl imate , Report o f the Carbon Dioxide As ses sment Commi ttee . National Academy Pre s s , Washington , D . C . pp 2 9 2 - 3 8 2 , 1 9 8 3 .
64 . Wigley , T . M . L . Carbon dioxide , trace gases and global warming . C l imate Monitor 13 : 1 3 3 - 146 , 1984 .
6 5 . Wigley , T . M . L . ; Jones , P . D . Influences o f p re c ipi tation changes and direct C02 e ffec ts on s treamflow . Nature 3 14 : 149 - 1 5 2 , 1 9 8 5 .
6 6 . Will i ams , R . H . Potential roles for b ioenergy in an energy - e ffic i ent world . Amb io 14 : 20 1 - 2 0 9 , 1 9 8 5 .
6 7 . Wittwe r , A . J . C arbon dioxide levels in the b iosphere : e ffects on p l ant produc t ivity . CRC Grit . Rev . Pl . S c i . 2 : 17 1 - 19 8 , 1 9 8 5 .
6 8 . Woodwe ll , G . M . B i o t ic e ffec t s on the concentration o f atmospheric c arbon dioxide : a . r eview and proj ection . In : Natural Research Counc i l , Changing Cl imate , Report o f the Carbon D ioxide As s e s sment Committee . National Academy Pre s s , Washington , D . C . pp . 2 16 - 241 , 1 9 8 3 .

CONFIDENTIAL
- 3 8 -
6 9 . Woodwe l l , G . M . ; Hobb ie , J . E . ; Houghton , R . A . ; Me l illo , J . M . ; Moore , B . ; Peterson , B . J . ; Shaver , G . R . Global defores tation : contribution to atmospheric c arbon dioxide . S c i ence 2 2 2 : 1081 - 10 8 6 , 1 9 8 3 .

CONFIDENTIAL
- 3 9 -

F igure 1
- 40 -
(1 -Yl l
� Y I
'I I Atmosphere
� Y I I
Ear t h
CONFIDENTIAL
The greenhouse e f fe c t : S0 is t he s olar rad iat ion , I the long-wave length ( infrared ) radiat ion of t he earth ' s sur f ace and Y i s the fract ion abs orbed by t he greenhouse gases in t he atmosphere ( s ource : Mureau , R. Koold ioxyde ( C02 ) en kl imaat . In : Hermans , L . J . F . ; Hof f , A . J . ( e ds ) , Ener g ie een b l ik in de t oekoms t . He t Spectrum , Ut recht , The Nether lands , pp 68-86 , 1 98 2 ) .
The sun ' s energy passes through the a tmosphere , warms the eart h ' s sur face , and is then reradiated int o space a t longer , infrared wavelengths . The balance of incoming and out going radiat ion determines the planet ' s temperat ure . Some a tmospheric gases absorb some of the out going inf rared ( e . g . C02 in a band of 1 4- 1 6 fJm ) , t rapp ing heat in a "greenhouse e f f e c t " .

F igure 2
o b I I I I I I t I I I I I I I I I I I I I I I I ,=:f:-----1900 1 920 1 940 1 980 1 QAO ?nnn .,n.,n .,n'ln -,nAn
YEAR
COz emissions derived from l ong-range project ions and h i s t or ic produc t ion from foss i l fue l s . Da ta un t il 1 980 are ac t ual measurement s ; af ter 1 980 mode l- calculated proj e c t ions ( source : Carbon Diox ide Assessmen t Comm i t tee , Chang ing C l ima te . Nat ional Academy Press , Washington , DC , 1 983 ) .
("') 0 z "rj H 0 � 1-i H �

; ! . I
- 4 2 -
16�----------------------------------------------�
c: 0 ·M U) U)
"M e Q)
1 2
Figure 3
_ l ow ---- h i g h
- - -
- - -
e �
, , ,
, ,
I I ASA
� � , , , , , , ,
., ,' coa l +
, ., 'I* synth .
�
- - - - - -- - -
/ �
- -- ' c rude o i l
� �
_ _ ... _.. __ .. ..
� �
�
,... ,.... ... .. - --- - - - - - rra:t. ura l
9 � 0 � 15 2 S y e a r
CONFIDENTIAL
Proj ected C02 emiss ions generated with the I IASA Energy Sys t ems Programme . For the individual fue ls the emissions are cumulat ive ly present e d for the lower- and h igher-demand cases ( source : Dee ladvies inzake C02 -probl ema t iek , Gezondheidsraad , The Hague , The Net her lands , 1 98 3 ) .
* Shel l s cenar io f igures f or t o t a l emiss ions .

66
F igure 4
- 4 3 -
68 1970 72 7J.. 76
CONFIDENTIAL
Mauna Loa
Pole
1 N0: 712 G 1 C
78 1980 82
The hypothe t ical a tmosphe r ic C02 concent rat ions based on man-made C02 emiss ions with AF= l OO% ( a irborne fract ion ) and the observed concent rat ions a t Mauna Loa and the South Pole with AF=56% ; Na is the amount of carbon present in the atmosphere ( source : Dee ladvies inzake co2 -problema t iek , Gezondhe idsraad , The Hague , The Ne therlands , 1 983 ) .

i i
- 2
F igure 5
� 1 - -..,, ... . .... . -.. c.. ...... .
- 44 -
...,...., ....... ...
I ,.. s. lc. aer-. � ......... .... --.. ....... ... ...
.. ..... '--
CONFIDENTIAL
Dif ference between the annual mean C02 concentrat ion in the a ir a t ground-leve l observed at d if ferent p laces i n the wor l d and at Mauna Loa , Hawa i i , p lot ted as a func t ion of la t itude . The numbers adj acent t o the dat a point s ind i c a t e the observa t ion t ime ( s ource : Papaud , A . ; Pois son , A . , Le cycle du carbon et sa perturbat ion par les ac t ivites humaines : un apercu du prob leme . Oceanolog ica Act a 8 : 1 33- 1 4 5 , 1 9 83 ) .
N . B . The two l ines represent the model s imulat ions a t the alt itudes c orresponding with 7 00 and 900 mbar .

Figure 6
The g loba l c a rbon cyc le . Ma j o r c a r bon reservo i r s ( in G t C ) , and na t u r a l and ( quant i f ied ) anthropogenic f luxes ( in G tC per yea r ) . 1 5 l G t C a l g iga t on o f c a r bon • 1 0 g C .
BI OSPH ERE phyto m a !l!l 600 !loil c a rbon 2000
ATM O S P H ERE 700
n�l �lt!!�a:!rt!!l 1 . 8 - · 4 . 7
LITHOSPH ERE C01'7'1hU:!r/10n 5 . 3 Inorganic C 4 . 8 x 1 O E 7 o rg a nic C 1 . 7 x 1 O E 7
d/1'"/'"u.!u"on 1 00 net dtl'l'"u.51"on 2 . ?.
OCEAN biota 1 7 I n o rg a n ic C 39 x 1 OE.3
1 .03 x 1 OE.3
� \.11
(") 0 z "Tj H 0 � .., H �

I , !
CONFIDENTIAL
- 4 6 -
2.5
2 ./.
1 2 .3 , 9 8 1
� 2.2 1
1 �20 : 17. 0 2 .1 �20: 1 5. 9 � 25: 16.1 p H
1 �25: 1 /. .9 t 2.0 �20: 1 2. 9 8 . /.
�25: 1 1 .9 1 .9 8 .0
1 .B p H 7 . 6 __.._ pp mv
1 .7 200 L. OO 600 8 00 1000 1200 1L.OO 1600 1 BOO 2COO
Figure 7
Var iat ion of the buf fer f ac t or of seawater with chang ing t ot al C02 • Concent rat ions ( at 2 0 ° C ) of t otal d is solved inorganic carbon (DIC -= r C ) and o f Hco; i n seawa t er ( in mM/kg ) are given i n relat ion t o the par t ial pres sure of carbon d ioxide gas ( fC02 in ppmv ) . The c oncentrat ions of d i s s olved C02 ( H2 C03 ) and of CO� are given as d i f f er ence be tween the curves . For a f ew C02 concent rat ions J 20g . the 1 98 1 valu2
5of 340 ppmv
and i t s doub l ing ) the buf fer fac t or s � ( at 20 ° C ) and f ( at 25 ° C ) are g iven . Increas ing C02 leve ls raise the buf fer fac t or , d im in ish the oceans t endency t o absorb C02 ( i . e . prop or t iona l ly le s s increase in oceanic carbon ) and decrease pH ( source : Dee ladvies inzake C02 -prob lemat iek , Gezondhe idsraad , The Hague , The Ne t her lands , 1 9 83 ) .

Figure 8
� c
i u
N 0 u
- 4 7 -
I I
2050 Year
I I
I I
2100
I
I I
1!5 1 9"
I f:l
CONFIDENTIAL
Increase in atmospher ic C02 concentrat ion over the next 1 5 0 years assuming growth rate in emis s ions of 4 , 2 and 0% per year ( r ) f or airborne frac t ions (aU of 0 . 38 , 0 . 55 and 0 . 67 ( source : Liss , P . S . ; Crane , A . J . , Han-made Carbon Diox ide and C l imat ic Change : a Review of Sc ient if ic Prob l ems . Geobooks , Norwich , 1 9 83 ) .
The growth rate of C02 emis s ions f r om 1 9 7 3 t o the early 1 980s f e l l t o below 2% per year and there i s a consensus now that the mos t l ike ly t ime f or a doubl ing of the C02 c oncentrat ion ( i . e . pass ing 600 ppm) l ie s in t he t hir d quarter of the next century .
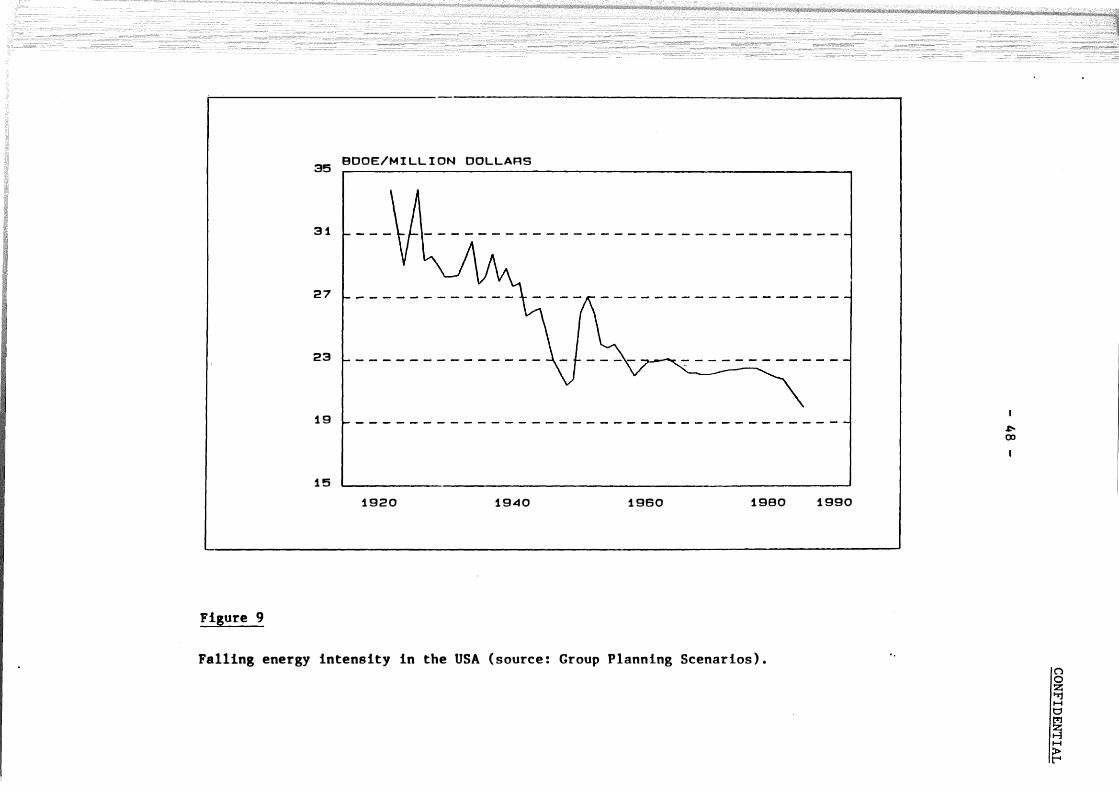
35 B D O E / M I LL I ON D O L L A R S
:3 1
2 7
2 :3
1 9
1 5
1 9 2 0 1 9 4 0 1 96 0 1 9 80
Figure 9
Falling energy intens ity in the USA ( s ource : Group P l ann ing Scenar ios ) .
1 99 0
� 00
(") � � H t:l
g H �

F igure 1 0
- 4 9 -
¥ 2.5 ______ ...,......,.....,...�-1"""""1__,.....,...,..,..,..,.., .... 3.5 :...
3 t> � ;
2.5 � Q • • ..
2 ' t> .r -n
I .S � 0 :t �
CONFIDENTIAL
Mode l le d cumulat ive sur face warming due t o increase in C02 and other gases over the per iod 1 980 t o 2030 ( source : Ramanathan , ·V . e t a l . , Trace gas trends and the ir potent ial role in c l imate change . J . Geophys . Res . 90 : 5547-5 566 , 1 985 ) .

, I I
I I : ! i
CONFIDENTIAL
- so -
90 N
60
30
LU 0 2 0 � < ..J
s
0 � 8 12 16 20 - 25 0 25 50 CHANGE IN TEMPERATURE 1 0EGREES CELSIUS ! CHANGE IN PRECIPITATION 1PEACENi1
F igure 1 1
Model le d c l imat ic e f fe c t s of a doub l ing of the present a tmospher ic C02 concentrat ion . The graphs show the proj ected variat ion by lat itude in temperat ure and precip it at ion . The three curves in e ach group r e f l e c t t h e r ange of pos s ib i l i t ie s ( source : Revel le , R . , Carbon d ioxide and world c l imate . Sci . Amer . 2 4 7 : 33-4 1 , 1 98 2 ) .
75

Figure 1 2
u 0 t= <J
-0.2
1 880 1 900
- 5 1 -
1 920
Northern latitudes (90° N ·23 .ft N )
1 940 YEAR
CONFIDENTIAL
0.2
0
-0.2
0.2
0
1 980
Recons t ruc t i on of surface-a ir-tempera ture anomalies f or var ious lat i t ude bands ( s ource : Hansen , J . e t a l . , C l imat e impact of increas ing a tmosphe r ic
carbon d ioxide . Sc ience 2 1 3 : 95 7 -966 , 1 98 1 ) .

CONFIDENTIA
- 52 -
Table 1 . C02 emiss ions per year by fue l type ( 106
tonnes C/year ) ( s ourc e : Jaske , R . T . , Carbon dioxide - the premier environmental challenge of our t ime . Environ . Progres s 2 : 145 - 148 , 1 9 8 3 )
% increase 1 9 50 1 9 7 5 1 9 8 0
1 9 5 0 - 7 5 1 9 7 5 - 8 0
all fos s i l fue ls 1600 4400 5 000 4 . 46 1 . 8 6 coal and coal products 1100 1600 1 9 5 0 1 . 7 2 2 . 57 o i l and refined products 400 2 200 2 300 2 . 11 1 . 11 gas and gas by -products 100 600 7 5 0 8 . 06 3 . 2 3
Table 2 . Carbon produced ( as C02 ) from selected energy sources ( s ource : Jaske , R . T . , Carbon dioxide - the premier environmental chal lenge of our t ime . Environ . Progres s 2 : 145 - 148 , 19 8 3 )
Fuel source o r type
coal in direct combus tion l i quid fuel from crude o i l natural gas synthet i c l i quids from coal synthet i c l iquids from shale
C02 per fue l energy content ( kg/MJ )
2 3 . 9 1 9 . 7 14 . 1
3 7 - 4 2 4 3 - 6 6

.L CONFIDENTIAL
- 5 3 -
Table 3 . C02 emis s ions per region ( in GtG ) and per capi £3 ( in t C ) in 1 9 7 5 ( GtC - 1 gigaton of carbon - 10 ton o f C - 10 g c arbon - 44/12 GtC02 ) ( source : Deeladvies inz ake C02 - problematiek , Gezondhe i dsraad , The Hague , The Netherlands , 19 8 3 )
region
North Amer ica USSR + E . Europe w . Europe , Japan S . Africa , Aus tral ia I s rael , New Zealand L . and M . Amer ica M . Afr ica + S . E . As ia Middle Eas t + N . Afr ica China + Central As ia World
C02 emi s s ion population (mi l l ions )
1 . 42 6 2 3 7 1 . 2 1 8 3 6 3 1 . 3 9 1 5 6 0
0 . 1 60 319 0 . 16 3 142 2 0 . 05 8 1 3 3 0 . 2 9 6 9 1 2 4 . 7 12 3 946
C02 emis s ions per cap i ta
6 . 01 7 3 . 3 5 5 2 . 4 84
0 . 50 2 0 . 1 1 5 0 . 4 3 6 0 . 3 2 5 1 . 1 9 4

Table 4 . Es t ima tes of the abundance of t race chemical s in the g l obal a tmosphet'e of 1 980 �nd 2030 ( source : ref . 47 )
('humk:al (iruua•
Curbon diolidu NiiiOIJCU
t:OIUflOUUdll
SuUur t:ompoemd»
fully ltudrieuatcd Sll\:dC!I
( :1al01 unuorot:at bomi
Chloe ocarbotlll
Drominulcd unci ioclatcd !�pedes
I I ydrocurbons, CO, I I ,
( ),wnc
Aklchydc11
co, N 10 Ni l ,
Chcntk:al I· or mula
(NO ·I NU1) CS( ) cs, so, I I ,S Cf4 (FI 4) C,F • ( f l l6) sF. CUI:,� ct,. l l) cn, F, c•·u, {�t l(1a:' 1 U:12) ('U,f WI I) CI-' ,CI-' 1( 1 (1:- I I S) f'l1f ,CCIF 1 (f l l 4t C(11fCCII-"1 U: I I J) cu .o cu ,o, ( 'I ICI, en. CI I ,UCI I ,< l c u .en, c,un, C,ll .. CI I , Or Clhf, (l:no �) Cl l , DrCI I 1 Br Cl l ,l Cl l .. C , 1 1. C , l l , t·,u, co I I , o . fl'roposphcrM:) I ICIIO CI I 1CI IO
-------
Uununaell Uoeninaual Suurt:c• Sinl. •
N.A N,A N.A N,A N,A N.A A( 't) N A A A A
A A A A A N(O) A A A A A A A N A A N N N A N, N.A N.A N
N N
0 . S(liV)
·r 'f(OI I) 110.01 .,., 1 ' 'f(OI I) 1'(01 1) I I I S4UV).I S(UV) 11011) S(UV) S(lJV) S(UV) S(UV) 1101 1) T(OI I) '1"(01 1) S(UV) l'(Oitt 1'(01 1) T(OII) '1"(01 1) '1"(01 1) S(UV) T(OII) l"(IIV) 'flO I I) '1'(01 1) T(OI I) '1(0 1 1) '1 (0 1 1) 1"(Sl.,OI I) 'I (UV, SI.,O) 'I'(OI I,UV) 'f(OI I,IJV)
l!teima.h:d Avcmac
ltc•ident:e 'fimc ( r,),
yenn
z 120
0 0 1 0 001 1(1, 1( '1) 0.001 0.001
> SUO > 500 > SOO
4UO 1 10
20 6S
)80 1 110 90
I . S 0.6 0.7
lS · � 0.4 1 0 0.02 O.S 1 . 7
1 10 0.4 0.01 S ·· I O 0. 1 0. 1 0.0) O.J 2 0. 1 - 0.1
0 001 0.001
Year 1 9110 (ilubnl
Avc1 111C Miain1 lt11liu, ppht
JJ9 x au• 100 < I
o os O S2
< O OOS 0 1
< O OS 0 07 0 004 0.001 0001 0 28 0 06 0 Ill o oo.s O O I S O Ol S 0 6 0 01 0 01 O i l 0 01 0 1 4 o oos O.th 001 0 001 0 002 0 002
1 6.SO 0 11 0 06 o os
IJ() S60
• .. (l)l 0.2 0 02
Ycur WlO t•robublc Glubul Avcru1c
Con..:enlnaliou, Pt.b
Oc::�ot ���linualc
"so x t o • J 7 S < I
o os O. S2
< O OOS 0. 1
< 0 0S 0.14 0 02 0 00} 0 06 I I 0.9 1 . 1 0 04 0. 1 4 0 1 7 0 6 0 2 O OJ 0 } 0. 1 I . S 0 01 0 07 0 01 O.OOS 0 002 0 002
2140 0 1 0. 1 o os
l i S 760
l l.S%
0 2 0 02
a•u.�iblc lt anyc
JSO 4SO
o os 0. 1
0 1 0.1
0.1 0.1 1 0 01 ··0 04
0.002 oos 0 04-0. 1
0 9 - l S 0.4 - 1 .9 O. S - 2.0
0.02 · O. l 0.06 0. 1 0 011 0 )
0.6 ·0.7 0 1 · 0. )
0.02 · 0. 1 0.1 · 0.4
0 06 · 0. 1 () l 1.7
o oos 0 02 0 01 -0 2 O.Ol 0 02
0 001 · 0 01 0.00 1 -0 0l
I IISO-JJOO O.ll l.l
0 06 0. 1 6 O t)S 0. 1
90 - 160 S60 1 1 40
lcmarh (ulso tee teal for delail•,
bad o�t a 2.4% int:reaso ower the neal 50 yc11r1 Combuslion und fulilizcr sources Gun:enlraliun nriublc and poo•·ly daar��etcri� Com:enln1tiun variable and poorly char��t:lerizcd Source• amd Minh lar1cly unknown Sourca uudaarKierizcd Give•• I he lhorl lilceimc &he Jlobal presence of SO 1 i11 uucarlaaincd
Alwninu ... ind11111ry • major 10urt:e Alunainum industry a 11111jor 10urcc:
All t:bluroftuurO&:arbon• are uf eaclusiwc maa-nuade urilin. A nunabcr ul reiJulalory actions are pcnt.lina. The RaUurc ol rcaulltlion• and llu:ir dfct:livencllll would arcally llllct:l lhe arowlh or lhcse dacmit:uls over l hc neal 50 years.
IN�ttintml n•&uraal t:hlori11c carrier uf ua:anic oriain A f)()rular rc11clive bul t10IIIoaic solwcnl U»cd for manufu�;turc ur Fl2 ; nuany ICQ)ndllrJ 110urc:cs alw eaisl U��ed i11 11u.mufilt:lure of lluoroarbons; U11111J olhcr •a,rliulions •• well A mujor t:hc:micul inlennaliule (IJiobul prodoction • 10 IH/yr); a)Ossibly lo•ic No111oaic, tarac:ly uea.:oa�lrollcd deare11sina wlwen1 .,OIIIIibly loaic, dcdinina na•rlcll lact:IIUSC or aubslilulion IO Cl l ,CCI J l•o"ibly tolN;. enoderiiiC arowlh due IO lobslilulion IO ( :1 1 JCCI J Mujor nalural bromine carrier t'irc .:alin1Juid.cr t.t.ajor au,olinc addilive for lead tcaavcaaina ; alsiO u rumiallnl Eaclusivcly ur OU:IIIIic oriain A &rend •howina incrcaK over lhc •••• 2 year• hus been idenlilic:t.l Pn:tlominanlly of aulu eah11u�1 oriain No trend haas been idt:lllitied lo dale No lrend has been idcnlilict.l lu d111c No tn:nd hus been idcruiticd to dale
A 1m11ll lrend ar�..:ur• lo cai111 Lui dala •re insulrtt:icnl
Scamt.laarr prudtM.1s ol hydr.-:urbon uaidulion 1980 wncc:ntrauion estimuled f.-om theory
• N. tauhual ; A, anllu upua�cuic; 0, oceaanit:; S, llrulo:it•l.crc; IJV, uluuviulcl Jthululy�is ; T. uopolittlu:rc ; 01 1, bydruayl radit:al n:muwul ; I, iunos1•hcric and ealremc UV and clct:lrun t:atthuc t cmo¥:�1 ; sa .. soil sink . . fl hcsc t:UUt:enll aliUIIII an: iniCifUIN IIVCIIIICII; fur t:hclllicUI» �ilh lif.:liiiH:ll of 10 yean U1 k:J», si111ilit:i1Ul lulitutJiulll lllltlic:nlll Cllll be CIIMXIctJ itt tilt: lrupollflhc:rc ; fat( t·lacmit:als wilh CIII'CIUcly shol"l lifet imes (0 00 1 0 ) rcan) vct lit:al lnulicnhl may ulsu he c.:nt:uuulerc:d.
I Va1 ic� h um 25 l 'ttbv ul lin: �urrut:c lo uhuul 70 tta•bv ut 9 Lm. l'lu: t:UIIt:enll uliun wull in..:rca!iiCtl unifonuly by lhc !lURie IM:H:cnlasc from I he IIOt faat:c lo 9 l m.
\II �
n 0 z "2j H t::'
� H
�
•

-
CONFIDENTIAL
- 5 5 -
Table 5 . Ne t primary produc t ivit ie s (NPP) per given areas , total areas ( in 1 9 8 0 ) , total NPP and ac tual b i omas s per ecosys tem . The mode l calculated changes s ince 1 7 8 0 are presented in brackets . ( s ource : Aj tay , G . L . e t al . , Terres trial primary product ion and phytomas s . In : Bol in , B . e t al . ( e ds ) , The Global Carbon Cyc le , Scope Report No . 1 3 , Wiley , New York , pp 1 2 9 - 1 8 7 , 1 9 7 9 ) .
(NPP ) area NPP b i omas s
gC . m - 2 . - 1
1012
m 2
GtC yr - 1
GtC yr
trop ical fores t 720 3 6 . 1 2 7 . 8 3 24 . 7 ( - 8 % ) ( - 1 8 % )
temperate fores t 510 17 . 0 8 . 7 1 8 6 . 8 ( - 6 % ) ( - 11 % )
gras s land 5 7 0 18 . 8 10 . 7 15 . 1 (+2 5 % ) (+1 9 % )
agricultural land 430 17 . 4 7 . 5 3 . 0 ( +34% ) ( +2 7 % )
human area 100 2 . 0 0 . 2 1 . 4 (+1900% ) (+1200 % )
tundra and s emi - de s ert 70 2 9 . 7 2 . 1 13 . 3 ( - 4 % ) ( + 1% )
to tal 121 . 1 5 7 . 0 5 44 . 3

CONFIDENTIAL
- 5 6 -
Table 6 . Carbon emi s s ions ( in G tC ) from the combus tion o f fos s i l and
fuels ( source : Group Scenario ) .
NEXT WAVE
commerc ial fue ls total o i l coal gas total + NCE*
1 9 8 3 2 . 5 2 2 . 3 6 0 . 7 7 5 . 6 5 6 . 2 8 1 9 8 5 2 . 6 1 2 . 56 0 . 8 3 6 . 00 1 9 9 0 2 . 6 1 2 . 8 3 0 . 8 9 6 . 3 3 1 9 9 5 2 . 6 1 3 . 14 0 . 9 7 6 . 7 2 2 000 2 . 70 3 . 6 2 1 . 07 7 . 3 9 2005 2 . 84 4 . 2 3 1 . 16 8 . 2 3 9 . 3 9
DIVIDED WORLD
commerc ial fue ls total o i l coal gas total + NCE
1 9 8 3 2 . 5 2 2 . 3 6 0 . 7 7 5 . 6 5 6 . 2 8 1 9 8 5 2 . 5 9 2 . 50 0 . 8 1 5 . 90 1 9 9 0 2 . 7 0 2 . 6 6 0 . 8 7 6 . 2 3 1 9 9 5 2 . 8 1 2 . 9 5 0 . 9 2 6 . 6 8 2000 2 . 8 8 3 . 2 8 0 . 9 8 7 . 14 2 00 5 3 . 03 3 . 6 6 1 . 01 7 . 70 8 . 8 7
* Non - Commerc i al Energy (biomas s )

F
CONFIDENTIAL
- 5 7 -
Table 7 . Shell Group interes t in fos s il fuel s in 1 9 84 ( source : 1 9 8 5 information Handbook)
fuel
o i l (mill ion bb l/d)
gas 3
(mill iard m jyr )
coal (mi l l ion t/yr )
world production
5 8 . 2
1 5 6 5
4147
Group % interes t
4 . 5 7 . 7
5 6 3 . 6
3 2 0 . 8
Table 8 . Contr ibution to global C02 emi s s ions from fue l s sold by the She ll Group in 1 9 84 ( s ource : She l l Coal )
carbon emi ss ions ( gigatonne s o f carbon)
fuel total Group world share
o i l 2 . 5 6 ( 40% ) 0 . 2 0 ( 3 . 1% )
gas 0 . 80 ( 12 % ) 0 . 0 3 ( 0 . 5 % )
coal 2 . 46 ( 3 8 % ) 0 . 02 ( 0 . 4% )
NCE* 0 . 6 3 ( 10% ) 0 ( 0 . 0% )
total 6 . 45 ( 100% ) 0 . 2 5 ( 4% )
* NCE - Non - Commerc ial Energy (b iomas s )

CONFIDENTIAL
- 5 8 -
APPENDIX 1
The C02/carbonate sys tem in the ocean
The maj ority o f c arbon present in the ocean i s in the form o f diss olved inor��nic carbon , i . e . 89% as b icarbonate ion (HCO - ) , 10% as carbonate i on ( C03 ) an� 1% as di� s o lved co2 . The thermodynamic
3equil ibrium of all forms
o f 1norgan1c carbon 1n the atmosphere and the oceans i s determined by the following reactions :
co2 ( atmosphere ) � co2 ( di s solved)
co2 ( di s s o lved) + H20 � H2co3;,=:=.' HC03-
+ H+
HC03- � co3
- -+ H+
H3Bo3� H2Bo3-
+ H+
� - + H20 � 0H + H
( 1 )
( 2 )
( 3 )
( 4 )
( 5 )
I n water carbonic ac id largely dissoc iates , while only about 10% of bicarbonate dis soc iates . The chemical equil ibria exert a buffering act ion on the uptake of add i t ional co2 by the ocean . The equil ibrium cons tants of the above react ions are :
H
where [ H pco2
p C02 I [ C02 ]
[ HC03-
] [ H+ ] I [ C02 ]
[ H+ ] I [ HCO 3
concentrations in water Henry ' s l aw cons tant equil ibrium part ial pres sure in the gaseous phas e
( 6 )
( 7 )
( 8 )
The c ons tant H i s dependent on the temperature and K depends on temperature and s al inity .
The concentrati on o f total inorganic dissolved carbon is :
( 9 )
and the alkalinity i s defined as :
A ( 10 )
The a lkal inity ari s e s from the dissolution o f minerals in seawater , principally cal c ium carbonate . The alkal ini ty i s def ined as the amount o f aci d require d to t itrate 1 k g o f seawater to a cons tant P� value ,
corresponding to convers ion o f b icarbonate and c arbonate 1ons to carbonic aci d .

CONFIDENTIAL
- 59 -
An increas ing concentrat ion o f C02 i� seawa ter shif t s equil ibr ium ( 2 ) t o t he r igh t and by an increas ing [ H ] equil ibr ium ( 3 ) t o the le f t . Thus , t he p r inc ipal e f f e c t i s t o consume carbona t e ion :
( 1 1 )
� : deviat ion f r om s t a t ionary s t at e The C02 added t o t he ocean ( i . e . � � C ) i s therefore :
( 1 2 )
As the c oncentrat ion of bicarbonat e i s already very high , a change a s a c onsequence of ( 1 1 ) i s negligibly small and t he relat ive change s in [ H2 C03 ] and [ co;- ] are pract i ca l ly of the same order :
� [ H2 C03 ] � [ co;- 1 = ( 1 3 )
[ H 2 C03 ] [ co;- 1
Equat ions ( 1 2 ) and ( 1 3 ) can be t rans f ormed t o :
6 [ H2 C03 ] A � C �c ,6l:C = = x -- ( 1 4 )
[ H2 C03 ] [ co;- 1 [ co;- 1 l:.C
As already ment ioned above [ co;- ] i s about 1 0% of the L C , so t ha t t he f a c t or � C / [ co;- 1 i s about 1 0 . As there is a s imp le r e la t ionship between the a tmospheric C02 and t he oceanic carbon concentrat ion ( 1 , 6 ) , any change may be presente d by :
L:. pC02 = S .o r::c
pC02 I: C
Th is y ields t he so-calle d evas ion factor :
� = !::> pC02 I pC02
� � C / l: C
( 1 5 )
( 1 6 )
I n case pC02 i s exp l i c i t e ly ident if ied t o p ( C02 p ar t ia l pres sure in t he ocean surf ace layer ) , � i s the evas iog fac t or or the Reve l le f a c t or R , i . e . the "buf fer fac t or" . The f ac t or var ies with temperature and has a nume r ical value of about 1 0 . In essence a 10 % change in pC02 produces only a 1% change in C02 •
If the C02 c on t ent of the a tmosphere and therefore of t he surface ocean increases , [ co;- ] decreases and the va lue of � r ises ( see also Fig . 7 ) . The r e s i s t ance t o c hange subsequen t ly increases , t he ocean absorbs propor t ional ly l e s s C02 , and the a irborne fract ion r ises . This c omp lex

CONFIDENTIAL
- 6 0 -
sy s t em is sens it ive t o the a lka l inity I t ot a l C02 r a t io , and hence pH . Add ing C02 gas t o seawater ( 1 1 ) does not change the alkal inity s ince charge balance is not a l tered ( 1 0 ) ; the dissolut ion or prec ipitat ion of CaC03 , however , doe s . The p r inc ipal f orms of CaC03 in the ocean are calcite and aragonite , which are secreted by calcareous organisms t o form the ir she l ls . Surface seawa ter is supersaturated with respect to both calc it e and aragonite . The solub i l i t y of CaC03 increases with increas ing pressure , decreas ing temperature and increas ing pH ; thus , t he deep ocean is undersaturated and d i s s olut ion of CaC03 occurs there .
If C02 is added t o the surface ocean , the pH decreases and the tendency for CaC03 diss olut ion increases . If this occur s , both the alka linity ( 1 0 ) and the t ot a l C02 ( 9 ) increase . Although this process generates an increase in total C02 , the ne t e f fe c t of the a lka l inity increase would be to enhance the ocean ' s capac ity for C02 upt ake by keep ing the buf fer fact or cons t an t and provid ing co;-- ions ( 1 6 ) .
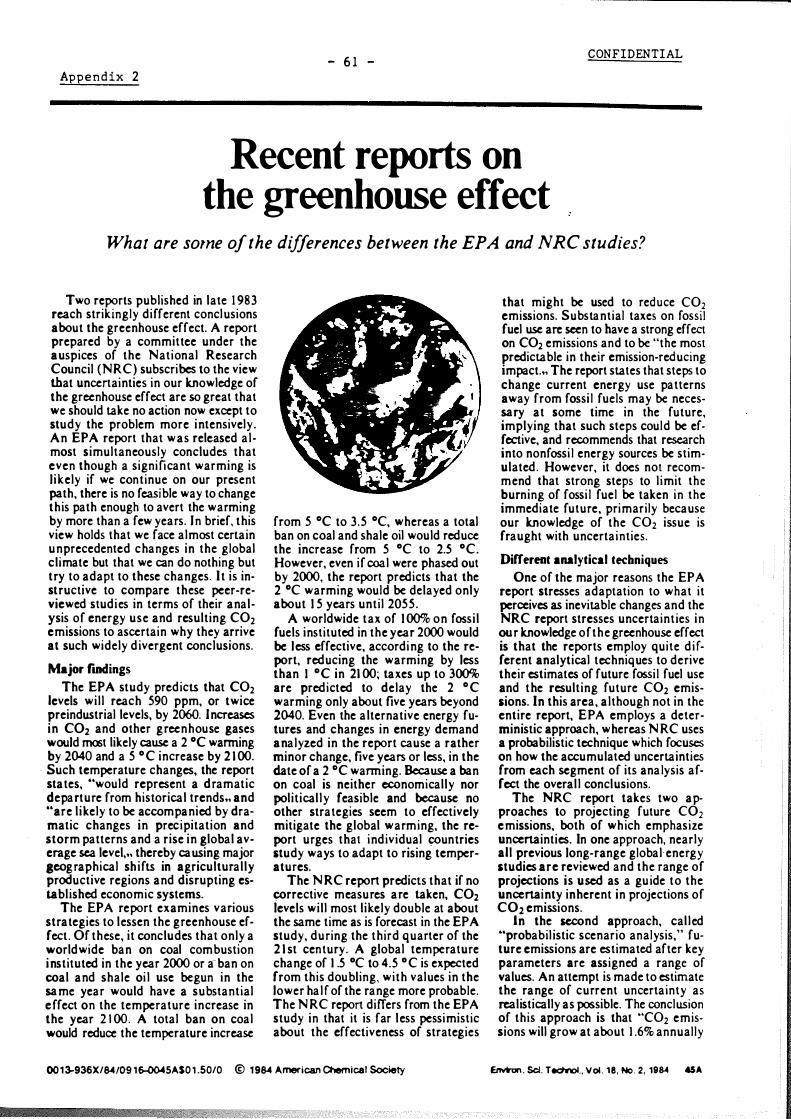
- 6 1 - C ONFIDENTIAL
Appendix 2
Recent reports on the greenhouse effect
What are sorne of the dzfferences between the EPA and NRC studies?
Two reports published in late 1 98 3 reach strikingly different concl usions about the greenhouse effect. A report prepared by a committee under the a uspices of the National Research Council (NRC) subscribes to the view that uncertainties in our knowledge of the greenhouse effect are so great that we should take no action now except to study the problem more intensively . A n EPA report that w a s released a l most simultaneously concludes that even though a signi ficant warming is l ikely if we continue on our present path, there is no feasible way to change this path enough to avert the warming by more than a few years. In brief, this view holds that we face almost certa in u nprecedented c hanges in the global climate but that we can do nothing but try to adapt to these changes. I t is instructive to compare these peer-reviewed studi es in terms of their anal ysis of energy use and resulting C02 emissions to ascertain why they arrive at such widely d ivergent conclusions.
Major fmdings
The EPA study predicts that C02 levels wi l l reach 590 ppm, or twice preindustrial levels, by 2060. Increases i n col and other greenhouse gases would mast likely cause a 2 °C wanning by 2040 and a 5 ° C increase by 2 1 00. Such temperature changes, the report states, ··would represent a d ramatic depa rture from historical trends" and "are l ikely to be accompanied by dramatic changes in precipitation and storm patterns and a rise in global average sea level," thereby ca using major seog raphical shifts in agricultural ly productive regions and disrupting establ ished economic systems.
The EPA report examines various strategies to lessen the greenhouse effect . Of these, it concludes that only a worldwide ban on coal combustion i nstituted in the year 2000 or a ban on coal and shale oi l use begun in the sa me year would have a substantial e ffect on the temperature increase in the year 2 1 00. A total ban on coal would reduce the temperature increase
from 5 °C to 3 . 5 °C, whereas a total ban on coal and shale oil would reduce the increase from 5 °C to 2.5 °C. However, even if coal were phased out by 2000, the report predicts that the 2 °C warming would be delayed only about I 5 years unti l 2055 .
A worldwide tax of I 00% on fossil fuels instituted in the year 2000 would be l ess effective, accordi ng to the report, reducing the warming by less than I °C in 21 00; taxes up to 300% are predicted to delay the 2 ° C warming only about five years beyond 2040. Even the a lternative energy futures and changes in energy demand a na lyzed in the report cause a rather minor change, five years or less, in the date of a 2 °C warming. Because a ban on coal is neither economically nor political l y feasible and because no other strategies seem to effectively mitigate the global warming, the report urges that ind ividual �untries study ways to adapt to rising temperatures.
The N RC report predicts that if no corrective measures are taken, col levels wil l most l ikely double at about the same time as is forecast in the EPA study, d u ring the third quarter of the 2 1 st century. A global temperature change of I .5 °C to 4.5 ° C is expected from this doubling, with values in the lower ha l f of the range more probable. The N RC report differs from the EPA study in that it is far l ess pessimistic about the effectiveness of strategies
00 1 �936X/S./09 16--0045A$0 1 .50/0 @ 1 9S. American Chemical Soctety
that might be used to red uce C02 emissions. Substa ntial taxes on fossil fuel use are seen to have a strong effect on C02 emissions and to be "the most predictable in their emission-reducing impact." The report states that steps to change current energy use patterns away from fossi l fuels may be necessary at some time in the future, implying that such steps could be effective, and recommends that research into nonfossi l energy sources be stimulated . However, it does not recommend that strong steps to l imit the burning of fossi l fuel be taken in the immediate future, primarily because our knowledge of the C02 issue is fraught with uncerta inties.
Different analytical techniques
One of the major reasons the EPA report stresses adaptation to what it perceives as inevitable changes and the NRC report stresses uncertaint ies in our knowledge of the greenhouse effect is that the reports employ quite d i fferent analytical techniques to derive their estimates of future fossi l fuel use and the resulting future C02 emissions. In this area, a lthough not in the entire report, EPA employs a deterministic approach, whereas N RC uses a probabilistic technique which focuses on how the accumulated uncertainties from each segment of its ana lysis affect the overal l conclusions.
The NRC report takes two approaches to projecting future C02 e missions, both of which emphasize uncertainties. In one approach, nearly all previous long-range global energy studies are reviewed and the range of projections is used as a gu ide to the uncertainty inherent in projections of C02 emissions.
In the second approach, cal l ed .. probabil istic scenario analysis," future emissions are estimated after key parameters are assigned a range of values. An attempt is made to estimate the range of current uncerta inty as realistically as possible. The conclusion of this approach is that "C02 emissions will grow at about I .6% annual ly
E.rNiron. Sci. Tec:Mol., Vol. 18, No. 2, 19� .SA

to 202 5 . then slow their growth to s l ight ly under 1 % a nn u a l ly a fter 2025 ." N RC states that i ts est imates a re lower than t hose in many earl ier stud ies for two major reasons: "" First. the expected growth of t he global economy is now thought to be slower than had earl ier been genera l ly assumed." Second, N RC incl udes in the ana lysis incentives to subst i tute other energy sources for fossil fuels as the prices for fossi l fuels rise . Most other stud ies have downplayed the potential importa nce of th is effect .
Both of N RC 's a pproaches produced not a single value but a range of values for future C02 emissions. with higher probabi l i t ies assigned to some values than to others . In neither approach was an effort made to resolve uncerta inties; rather, both approaches recognize that projections of the future become more a nd more uncerta in as the time horizon expa nds.
lnetitable results
The EPA report a lso considers uncertaint ies in some sections, but i n t h e core of t h e report, the a na lysis o f future C02 emissions, it ignores them. The study adopts a set of economic ass umptions to which no ranges of uncerta inty are a t tached , and from these and t he use of a global energy model derives what i s ca l led a reference mid-range basel ine projection or scenario. Various policies i ntended to slow or l imit the rate of C02 rise are then tested against this projection . Because the policies are tested against no other projections, the assumptions embedded in this mid-range projection arc critical in determining the results of the policy ana l ysis .
I f the main elements of EPA's energy analysis are exa mined, i t can be seen that EPA's conclusions follow almost inevitably from its assumptions. First, the agency assumes a rate of economic growth that would be considered h igh by a number of analysts . Gross world product is projected to increase from 6.06 tril lion U .S dollars in 1 97 5 to 1 84 .8 7 tril l ion dollars in 2 1 00, in constant 1 97 5 dollars (a factor of 30 increase) . The average annual rates of increase over the 1 25-year period range from a bout 2.8% per year for the developed regions to over 3% (3 .8% after 2050) for the less developed nations. During this same time period, per capita gross nationa l product (GN P) in A frican countries, for example, grows from an average of S3 7 5 per year to S 1 4 ,000 per year in constant 1 975 dol la rs .
The total energy demand is tied d i rectly to the GNP by what are called
.. A Environ. Sci. Technol. , Vol. 18 . No. 2. 198•
i ncome elasticit ies of demand. These are set at grea ter than or equal to one over the entire world to the year 2 1 00. This means that as incomes go up. energy use goes up proportionately or greater than proportionately, except as it is a ffected by prices and enhanced energy efficiency .
The analysis is set up in such a way that no new technology such as solar or fusion becomes competitive with either coal or nuclear as a source of electric power to the year 2 1 00. Solar and biomass bot h remain minor energy sources . Therefore, except for nuclear power, no economical substitute for fossil fuel emerges over the next 1 20 years. I n contrast, the EPRI Journal concluded recent ly that for just one emergi ng energy technology, photovol taics, .. three approaches now have a better-than-even cha nce of meeting the cost and efficiency thresholds needed for bulk power generation."
Further, the EPA report assumes fixed price elasticities for fossi l fuel demand that are independent of fuel cost. Thus, the economic attractiveness of increasing the efficiency of energy use or substituting other energy forms is assumed to be independent of fossil fuel prices . This assumption becomes particularly important as the rapidly increasing use of fuels exhausts the conventional oil a nd natural gas suppl ies and greater reliance on synthetic fuels from coal and on unconventional gas and oil is required. Many energy analysts believe that these costly forms of fossil fuel may not be economically competitive with other energy options in a number of situations.
A final assumption of the EPA study is that other greenhouse gases such as nitrous oxide, methane, and chlorofl uorocarbons w i l l have a warming effect approximately equal to that of C02. A large uncertainty is associated with this assumption, but it is used nevertheless in evaluating t he effectiveness of various policies such as taxes or bans on various fossi l fuels .. I t assumes that the warming from other greenhouse gases wi l l mitigate the effect of lowering C02 emissions. For example, a 30% decrease in emissions produces only a 1 5% decrease in the expected warming.
Because none of these assumptions is changed in testing the various policies, none but the most stringent and therefore highly infeasible-such as a total ban on coal by the year 2000-substantial ly reduces C02 emissions and the resulting warming. Worldwide taxes of up to I 00% on fossi l fuels reduce emissions 1 0-42% in 2 1 00, but
C ONFIDENT IAL
the maximum est imated temperature red uct ion is onl y 0.7 ° ( . Other projKtions
In the EPA report, a number of other energy scenarios are investi gated, but a l l of them are var iants of the mid-range scenario and none of them are used as baselines from which to assess the effects of d i fferent pol i cies . The other scenarios are ca l led high renewable, high nuclear, h igh electric, low demand, and h igh fossi l . These all u se t he same growth forecast for G N P as is employed in the midrange scenario. The low-demand scenario is the only one that projects a sig n i ficant change in energy demand-24% less in 2050-and comparable reductions in C02 emissions .
The EPA study includes one scenario in which the growth rate in GNP i s lowered somewhat, bu t i t i s decreased only a fter 2050 and onl y for the less developed regions, where it is reduced from 3.8% to 2.8% per year . The scenario projects a temperature rise in 2 1 00 that is only 0. 2 °C lower than it is in the mid-range scenario. From this analysis, EPA concludes in the executive summary that reduced economic growth causes only "minor [i.e., five years or less] changes in the date of a 2 °C warming."
The energy model used by EPA is not intrinsical ly inaccurate or unrea listic. But, the fact that only one run of the model is used to assess the impl i cations of different policies and that this run involves assumptions to which no range of uncerta inty is assigned introduces a certain inevitabi li ty to the conclusions. The N RC report describes this model as ••the only carefully documented, long-run global energy model operating in the United States," but says that i ts size and complexity make "identification of critical parameters or assumptions a formidable task." Unfortunately, the EPA report does not even explain the possible importance of these critical assumptions to the concl usions i t draws, nor does it analytically test the sensitivity of these conclusions to other sets of assumptions made by credible energy analysts and economists .
The EPA study is interesting because it shows that policies which at first glance appear usefu l may not be quick and easy a nswers to the greenhouse problem. It is mislead ing i f it gives the impression that its projections are the only possible or probable ones or that all policies that m ight be inst i tuted to mitigate the greenhouse effect are doomed to fai lure .
- Bette H i leman

CONFIDENTIAL
- 6 3 -
APPENDIX 3
Current ( 19 8 6 ) legi s lation and pol ic ie s
General
Air pollution control today i s only to a l imited extent a local i s sue as i t has become a regional and nat ional matter i n mos t countr i e s . For some countries the main aspect o f air pol lut ion i s only an international one . Thi s holds particularly for the i s sue o f carbon dioxide/cl imat ic change . National governments are , o f course , unl ikely to agree as to the appropr iate response to the C02 problem , if they do not share s imi lar views regarding the s ever i ty and the causes . Therefore , inte rnational forums are us ed as the appropr iate environment for the universe of nat ions to discus s and debate such national and global concerns . All avai lable knowledge can be reg i s te red the re and research can b e coordinated and s t imulated .
I t i s not surpris ing that many countries involved in trans - boundary air p o l lution problems , al so s erious ly fear soc i o - economic and c l imatic consequences of increas ing C02 concentrations . Although currently no legis lation exi s ts with regard to the C02 prob l em , some of thes e countries are develop ing environmental pol ic ies at a national l evel . The USA and The Ne therlands are here taken as examples because o f the ir ac t ivities and init iatives in thi s field .
Uni ted Nations Environment Programme (UNEP)
The is sue o f carbon dioxide and c l imatic change has been on the UNEP agenda for many years . From a relative ly unimportant subj ect i t deve loped into a recurrent i s sue and recently clear l inks were shown to exi s t wi th is sues such as de fore s tation and hazards to the ozone layer posed by chlorofluorocarbons ( CFC ' s ) .
The following i s a short his torical overview o f the main ac tions and recommendations related to the greenhouse e ffect .
During its seventh s e s s ion in May 1 9 7 9 the Governing Counc i l o f UNEP reques ted the Executive D irec tor to bring to the attention of the World Me teorological Organisat ion (WMO ) the will ingnes s o f UNEP to col laborate with WMO and o ther organisat ions concerned with the imp lementation of the cl imate impac t s tudies component of the World Cl imate Programme . This o ffer was accept�d by WMO . Fol lowing recommendat ions by the S c ient i fi c Advis ory Committee o f the World Cl imate Impac t S tudies Programme (WC I SP ) , the Governing Counc i l , in i t s ninth s e s s i on in May 1 9 8 1 , called upon the Execut ive D irector to proceed with implementat ion of the WC ISP in collaboration with partic ipating international organisat ions ( i . e . WMO and the International Counc i l o f S c ient i fic Unions ) .
During the tenth annive rsary o f the UN conference on the Human Environment in May 1 9 8 2 the Governing Counc i l de fined the trends , problems and priorities for ac t ion which should rece ive attenti on by the UN sys tem . With respect to the atmo sphere the following i tems were i denti fied . The se inc lude the cont inuing increase of C02 , other trace gase s and particulates
CONFIDENTIAL
- 64 -
in the atmosphere and pos s ible effec ts o f human act ivi t i e s on weather and cl imate . The following ac tions were given priori ty : - integrated monitoring of atmospheric pollutants and the i r effects - deve lopment and p romotion o f appropriate global , regional and nat ional
programmes - understanding o f fac tors affecting c l imate , including ocean - atmosphere
interact ion
The Counc il reque s ted the Executive Director to cons i der the appropr iate t iming for an as ses sment of the p otenti al s o c io - economic impacts . of increased C02 concentrations in the atmosphere and for the e s tab l ishment of a commit tee to coordinate related research and information exchange . Thi s in the l i ght of the progress made by WHO and ICSU , in cooperation wi th the Food and Agriculture Organisation ( FAO) of the United Nati ons and the Uni ted Nati ons Educati onal , Sc ienti fic and Cultural Organisat ion (UNESCO ) .
At the Mini s terial Conference in June 19 8 2 in S tockholm the UNEP Executive D irector summarised UNEP ' s ten year review o f the S tate o f the World with re spe c t to C02 as fo llows : - Concentrations o f C02 are s lowly and s teadily increas ing , chie fly as a
result o f the increas ing use of fos s il fue ls and fores t clear ing . A world cl imate programme has been init iated by WMO with UNEP ' s par t i c ipation . UNEP has spec ial respons ib i l i t ie s for the as sessment of the impacts of c l imatic change s . No sys temat ic attemp t has ye t been made to addres s the problem of managing the emis s ions of C02 , mos t l ike ly because of the long - term effec t of the ir increas e .
- I t looks as i f any initiative aimed at managing the C02 problem will not be taken in the near future and perhaps taken too late .
At the eleventh sess ion o f the Governing Counc i l in May 1 9 8 3 many de legat ions no ted the importance of the increase in atmospheric C02 , and s everal fel t that the subj ects of rat ional energy use and of new and renewable energy sources should be cons idered wi thin the context o f the C02 cl imate is sue .
C02 re lated excerp ts from the reports p re s ented at the twelfth s e s s i on of the Governing Counc il in May 1984 are given in Appendix 4 .
European Community ( EC )
In December 1 9 7 9 the Counc i l adopted the proposal for a f ive - year ( 19 80 - 1984) indirect - action programme on c l imatology ( 1 ) . The main obj e c t ives were to contribute to a better under s tanding of cl imatic proces ses and variations , and to assess the potential impac t o f c l imatic variations on bas ic resources and the e ffec t of human act ivities on cl imatic variations . Thi s programme f i tted in with the World Me teorological Organisat ion ' s World Cl imate Programme and included the following research areas :

CONFIDENTIAL
- 6 5 -
a ) unders tanding cl imate by recons truction o f pas t c l imate s , b ) development and improvement o f c limate modell ing , and c ) man - c l imate interac t ion s tudies with special emphas i s on the accumulation
of C02 and the e ffects of release o f energy .
In 1 9 8 0 the Commiss ion submi tted a proposal for a Counc i l Dec is ion adop ting a sectorial research and development programme ( indirect act ion) 1 9 8 1 - 1985 ( 2 ) . Sub -programme I I on cl imatology outl ined two research areas , i . e . understanding c l imate and man - c l imate interac tions . The main obj ectives of thi s programme were to e s tabl ish a sc ient i fic bas i s for the imp lementation o f the Community ' s environmental pol icy and to promote long - term bas ic research on important environmental problems .
The pub l ic and senior governmental sc ientists grew more and more concerned about the impl icat ions o f the ris ing C02 content o f the a tmosphere with regard to agricul tural and human s ettlement patterns in the long - term . In the beginning o f 1 9 8 5 thi s concern was cons ide red suff i c iently real to j us t i fy the introduc t i on of s tudie s into p os s ib le alternative energy s trategie s .
In the re search programme for 1 9 8 6 - 1990 the Commiss i on propo s e s in Sub - programme I I on cl imatology and man- environment interaction to concentrate on the i s sues : unders tanding of man ' s influence on cl imate and prediction o f the re sul ting impac ts , with special emphas i s on the incre as ing atmospheric C02 concentration .
At the end o f October 1 9 8 5 a comprehens ive report on environmental cons traints and the ir impl ications for EEC energy pol icy was presented at the p lenary sess ion of the Economic and Soc ial Commi ttee o f the European Communications ( ES C ) . The authors o f this report argue that i f the Community i s to resolve the environmental problems resul ting from energy produc tion and usage , while at the s ame t ime ensuring adequate supp l i e s o f energy for the fas t - growing world population , it mus t adopt a s trategic approach b ased on a common pol icy for energy and the environment . The mos t important task will be to keep environmental pollution ( inc luding C02 ) from the produc t ion , c onvers i on and usage o f energy within acceptable l imits at accep table c o s ts . The ESC unanimous ly dec ided to forward thi s report to the European Commiss ion and the EEC ' s Counc il o f Minis ters ( 3 ) .
1 . OJ C247 o f 18/10/19 7 8 , Bull . EC 12 - 1 9 7 9 , po ints 2 . 1 . 16 1 2 . OJ C2 2 8 o f 08/09/1 9 8 0 , p . 1 3 . Europe Environment , November 12 , 1 9 8 5 - No . 243 , V , 1 - 2 6
Organisat ion for Economic Cooperati on and Development ( OECD )
During i ts work on environmental pol icy , the OECD has e s tablished and adopted a series o f p r inc iples wi th a view to the ir incorporat ion in national legis lation and regulations conce rning the prote c tion o f the environment and also i� inte rnational agreements ( e . g . 1 , 2 , 3 ) . Apart from recommendations wi th regard to long - range trans - boundary air polluti on and reduct ion of environmental impacts from energy p roduction and use , no spe c i al attenti on was paid to the C02 problem .
CONFIDENTIAL
- 6 6 -
1 . Coal and the environment ( Recommendation adopted on 8 th May , 1 9 7 9 - C ( 7 9 ) 1 1 7 )
2 . Mini s terial declaration on future pol ic ies for s c ience and technology , PRESS/A ( 8 1 ) 14 ( 19 8 1 )
3 . Reduct ion o f environmental impacts from energy product i on and use ( Recommendation adopted on 1 2 th October , 1 9 7 6 - C ( 7 6 ) 1 6 2 )
USA
The Energy Secur i ty Act of 1 9 8 0 ( 1 ) , whi l e focused on the deve lopment o f synthet i c fue l s , also called for examination o f s ome o f the environmental consequences of the i r development . One such consequence perce ived by the Congress was the build up o f C02 in the atmosphere , and the National Academy o f S c ience s ( NAS ) and the Office of Sc ience and Technology Policy ( OSTP) of the Executive Office o f the Pre s ident were reque s ted to prepare an asses sment of its imp l ications . In response to a congres s ional mandate , the Carbon Dioxide As ses sment Commit tee ( CDAS ) was formed and pub l i shed a report ( Changing C l imate ) in 1 9 8 3 .
As a result o f a scient ific conference in 1 9 7 7 in Miami Beach , Florida and i t s recommendations , which were followed by the Department o f Energy ( DOE) and o ther federal agencies , including NSF , NOAA , NASA , EPA , USGS , and USDA , more than $ 1 10 mil l i on have been spent on C02 research from 19 7 8 to 1 9 84 .
1 . Pub l ic Law 9 6 - 2 94 , June 30 , 1 9 8 0 ; Title VI I - Ac id Pre c ip i tat ion Program and Carbon D ioxide S tudy ; Sub t i tle B - Carbon Dioxide
The Netherlands
Concern about air pollution in general in The Netherlands has led to local , regional and national abatement pol ic ies in order to improve the air quali ty and the chance o f survival o f nature in remote areas . Over the las t few years concern about the is sue o f carbon dioxide and c l imati c change has cons iderab ly increased and has resul ted in a central pol icy laid down in the indicative mult i -year air programme 1 9 8 5 - 19 8 9 ( IMP - ai r ( 1 ) ) . There in certain facets were based p r imar i ly on advice rece ived from the Health Counc i l ( 2 ) and the Advisory Counc i l for Research on Nature and Environment ( 3 ) . The p o l icy pursues the following princ ipal s trateg ies :
- The government w i l l t ake the necessary measures to promote the awarenes s and knowledge o f the C02 problem and o f trace gases which might influence the global c l imate . At the nat ional level thi s wi l l be elaborated by p roviding and pub l i shing re levant information . However , i t i s recognised that the only e ffective way to tackle the problem i s through international cooperation and exchange of information . As the C02 prob lem rec e ives attention in only a few countries and sc ientific organisat ions , the Dutch government w i l l encourage international organisations such as UNEP , EOSD/IEA and EC , to expand the i r act ivities in thi s field .
- In order to narrow the uncertainties about future c l imatic change s and to define pos s ible measures to reduce the impact , opportunities for s c ient i fic research will be provided in c lose cooperation with the EC

CONFI D ENTIAL
- 6 7 -
pro gramme on c l ima t o l o gy and the Wo rld Cl imat e Programme .
In l ine with the gene ral air p o l lut i on ab atement p o l icy , measur e s to reduce emi s s i ons o f C02 will b e s tudie d . Spe c i al at tent ion will be paid to s t imul a t i on o f ene rgy c ons e rvation , a l t e rna t ive ene r gy s our c e s and reduc t i on of fos s i l fue l us age .
1 . IMP - a i r , Lower Chamb e r 18 605 , S ep temb e r 1 9 84
2 . D e e l advi e s inz ake C02 - p rob lemat iek , Gez ondhe ids raad , Feb ruary 1 9 8 3
3 . Onde r z o ek i n Nede r l and naar de gevo l gen van d e toename van C02 . en ande re spo rengas s en in de atmo s fe e r door mens e l ij ke ac t ivi t e i ten , RMNO , May 1 9 84

Aup end ix 4
CONF I D ENTIAL
- 68 -
UNITED �ATIONS ENVIRONMENT PROGRAMME
Ll'ST OF OOI�Al.l..Y IWaR00S
tre\ICAL SUBSTM«:.f.S MID PROCESSES
OF GLOBAL S 1 GN!Fl c.ANCE
RE?eRT � n£ EXECliTIVE . D 1 RECT.CR
OF ltEP
U�EP RE?Cr<T t-D , 1 ( 1 9 8 4 )
TO THE "11£LfTR SESS 1 00 OF ITS GCNERNI NG COKI l
IRPTC - GENE:YA

:Background
1 6 .
CAR B O N D I O X I D E CONFIDENT IAL
Carbon dioxide (C02) i s a natural trace cons t i tuent of the ear th ' s atmo sphere . The pr esent mean conc entrati on of C02 is around 340 ppm by vo lume . co2 ha s a cri t i cal role in the global heat ba l anc e in tnat it is es s ent ia lly transpar ent to the incoming solar radiati on but abs orbs the infra-red rad iat ion emd t t ed by the earth . This radiat ion trap causes a '-"arming of the lower atmospher e vhich is knowu as the "&r eenhouse effect " .
The glob al nature o f the CO prob l em results largely from the combus tion o f fos s il fuels (oi l , coal and natural gas) �os e consumption has been increasing s t eadily s ince the beg inning of the l as t century . The corresponding rel eas e of co2 has resul t ed in a s igni f icant bui ld-up in the atmo spher e , frac � tr. t �t ed conc entration of le s s than 300 ppm in the mid d l e of the nineteenth century to a pr esent-day value of about 340 ppm . Reduced energy de=and s ince the mid-1 9 70 s bas caused a s li ght reduction in the annual incr ease in fo s s il fuel us e and consequent co2 emi s s ion s .
Glob al impact
S everal unc ertaint ie s surround the co2 is sue and these place cons traints on the a s s es smen t of co2 • s global impact . There ar e al s o deficiencies in our knowl edge of the natural c arbon cycle and its react ion to perturbation by human activiti es . For exampl e , only about hal f o f the co2 discharged from fo s s il fuels over the last two decades c an be found in the atmo sphere . It i s commonly sugg est ed that the oceans act as the main s ink for thi s "mi s s ing " f os s il fuel C02 al though it i s uncertain whether net trans fer to the oceans can account for al l the defi c i t . There is a l s o uncertainty over the magnitude of co2 r el ease ari s ing from man ' s wides c:ale and increas ing forest clearance activi t i e s , vith e s t ima t e s ranging from ins i gnif icant to an amount comparable vith fos s il fuel co2 , ·
al though mos t proj ections indicate that , in the long term, fossil fuel emis s ions vi l l be an order of magni tude l arger than b io spheric: emi s s ions . If the latter is true , the fraction of man-made co2 which remains airborne is lower than pres ent estimates indicat e , sugge s t ing that co2 increa s es will occur more s l owly than currently predicted .
Uncertaint ies al so surround the earth ' s future demand for fos sil fuel s and eon- · sequent co 2 _
rel ea s e . Some recent predict ions e s t imate that atmospheric: co2 concentrations may pas s 600 ppm in the tnird quart er of the next century ; this value represents a doubling of the pr e-indus tr ial concentration . It has al so been forecast that the great est increase in co2 release from fos s il fu el s will arise in the developing countries .
It is general ly accep t ed that future increases in the atmospheric: co2 level vi l l cause a ri s e i n the average global tEmperature . However , there is still debate over the maplitude of thi s vanrlng . Calculations with three-dimens ional , time-dependent models o f t he alobal atmospheric circulation indicate that a doublina o f tbe co2 level vill cause an average zlobal warming of l . S°C - 4 . 5°C vith rreatest increases predicted for the higher latitudes of the northern hemisphere .
thes e increases in temperature may · lead to effects auc:h as altered precipitation and evaporation regimes , vbieh could aff ect agricuiture and the distribution of food resources . Effects on the oceans may al so be significant , &I chanses iD wind circulation would af fect ocean currents , causing the relocation of nutrient-rich areas l eading to the redistribution of marine organisms and the consequent el imination of some commercial f i sher ies . Ocean warming and ice cap melting may raise the aea level by the order of one metre . One recent s tudy considers a zlobal rise of between 144 em and 217 em likely to occur by the year 2100 .

CONFI D ENT IAL
1 7 .
C urrent ly there i s no e�idenc e tha t there ba� b een a �o 2�induced increase in the g l ob al t �pe ratur e . The detect1on of such an e f f e c t 11 made d1f r 1 cu l t by the inherent variab il i ty in cl imat e . In addi t ion , pred i c tions of the time when a g lobal va�ing wi l l be d e t ec t ab l e ar e h i ghly d ependent o n the as sume d r a t e of beat exchange be �•een d i f f e r ent par t s o f the oceans .
Several approache s to control the co2 prob lem have been propo s e d . The "technica l f ixes" Vh i ch involve the c o l lection and dispo s al of co2 are not cons idered to be prac t i cal o r economical . Al t ernative energy sy s t ems wh i ch do not emit co
2 might be developed to reduce the rel i anc e on fo s s il fuel s although such actions are current ly cons idered to be of l imi t ed e f fectivenes s and prohic i tively expens ive . Energy conservation is consider ed to be an �portant means o f reduc ing co
2 emis s ions fram f o s s i l fuels .
RECOMMENDA TIONS
(a ) B � cau s s rep l a c em � n t of fo s s l t fu e l s by a t t� rna ti u e e n e rgy s ourc e s i• p ro bab ly s � i t 1 no t f� a s i b t • • co nomica t ty and p o t i t i ca t t y � p ri o ri t y s hou l d b• giu e n to wor k geared t o t h e de u e t o pm s n t of t o ng - t e rm e nergy o p t i c n s no t bas e d o n combu s t i o n of fo s s i l fu • t s ;
( b ) The a i z e o f r e s er� o ir a and flu: e s i n t h e b i o g e o c he m i ca l cy c t • of car b o n s hou ld b e de t e rm i ned wi t h gre a t e r a c cura c y ;
( c ) Th e m od• t t i ng o f C O -i n4u c e 4 c t ima t • c hang e s s hou ld b • fur t h • r refi n•d t o r e ft e � t � for ·�amp t • � in t e� ac tions of t h e oc ean-a tmo s p h e r e in terfa c • in o r d• r t o . • • tab t 1. s h m o r • a c cura t• ty t h e e i a e and •: t e n t o f pre d1. c t e d • ff• c ts ;
( d ) Re s •arc h a nd de u • t o pm e n t s hou td giu e p r i ori ty t� b e t t e r pr e di c t i o n s of fu tur e fo s s i l fu • t u s • and cor r • sp o nd1. ng co 2 r • l • as • to a tm o a p n� r • ;
( • ) Upda t e d a s s e s sm e n t s o f t h e C0 2 c l ima t e issu• shou ld b• unde r ta ke n io i nt ty b y a v.HO/I CS�/U�EP . CO z s tudy gro�p wi t h an appropria te ly broad i n t e rd1. s c1.p�1. nar� m•mbers�1.P : A • • cond a s s • s s m s n t of th• r o t • of CO z 1. n c t 1.ma t • Var1.a t 1. on s and t h � i r impac t s hou ld b � made i n _ t S S S .

CONFIDENT IAL
UNITED NATIONS ENVIRONMENT PROGRAMME
U ST OF EJNI RCN-afl'AU.. Y DAtaRClJS Qe\I CAL SUBSTM:ES NiiJ PROCESSES
OF GLOBAL S I GNI FI CANCE
SCJ ENTJ FJ C �HS
...
JRPTC - GENEVA
l!.\EP RE?OKT NO . 2 ( 1 9 s t. )

Back.ground
2 3 .
CARBON D I OXIDE
CONFIDENT IAL
C arbon d ioxide (C02 ) is a natural cons � i tuent of the Earth ' s armosphere . It ma k e s up only about three-hundred ths o f one per cent of the atmo sphere , yet play s a crucial r o l e in the p l anet ' s hea t balance . This i s be cau se C02 ab sorb s infra-red: radiation emit ted from the Earth ' s surface , producing a varming o f the lower atmo sphere . Thi s rad iation trap is know as the "greenhous e e f f ect " .
I t i s n� e s t ab l i shed that there ha s be en a s i gn i f i c ant increas e in the atmo s pheri c C02 concentration s ince the beg inning o f the indus trial era . E s t imates of the airborne co2 level in the mid 19th century are in the order of 260-2 80 ppm (NAS 19 83) • . .
Regular moni toring me asurement s from around the wcrld reveal that by 1958 the co2 conceDtration had increased to about 3 15 ppm , wh ile in 1980 the value had risen further to about 338 ppm (Bacas t ow and Ke e l ing , quoted in Smith, 19 82 ) .
The ris e in the atmo sphere co2 level larg ely resu l t s from the combus t ion of f o s s i l fuel s (oil , coal and natura l gas ) whose use has been incr eas ing a t a s teady rate since the beginning of the 1 9 th century . Numerous s tudies have reported that co2 dis charges from fos s i l fuel product ion have increas ed at an annual rate of about 4 . 5 per cent , at le as t until 1973 (e . g . , Rot ty 1 9 8 1 ) . As a result of the o il cr i s i s and subsequent economi c rece s s i on, there has been a s l owing down of this increase to about two per cent . Currently , ab out 5 x 10⁹ tonne s of co2 (t 10 per cent) are emit t ed annual ly from fo s s il fuel combus t ion .
The global carb on · cycl e
The s ignif i cance of atmo spheric C02 accumulation should be exzmined in the context of the global carbon cycl e . Unfortunately , although the princ ipa l sources , s inks and trans fer kine t i c s are we l l e s tabl ished (Bolin et al . 1 9 7 9 ) , there are s till uncertainties in regard to s ever al important de tai l s of the-cycle . For example , a quantity , some what larger than half of the C02 re l eased from fos s i l fue l s over the last two decades , i s found in the atmosphere , ind i cating the presence of a C02 s ink as yet unaccounted for . It i s commonly sug ges ted that the oceans act as the main s ink for this "mi s s in g " fos s i l fuel C02 , al though i t i s f ar from cl ear whether net trans fer t o the oceans c an account for all the def i cit . Uncertainty also exi s ts in the magnitude of C02 release from changes in land use , part icular ly defore s ta t i on . E s timates of the C02 re lea sed f r om thi s s ource range from ins i gnif icaut to an amount. comparable vith fos s il fue l co2 (Ro tty 1980 ; �oodwell , C .M. !! !!· 1 9 8 3 ) . If the latt er is true , the fraction of man-m3de co2 which remains airborne , is lower than present estimates indicate , suggesting that co2 increases will occur s lower than current ly predicted .
Superimpo s ed upon these deficiencies in our under s tanding of the carbon cycle i s the uncertainty surrounding future anergy dem.and s md consequent C02 releas e . tJntil recently , mos t forecas ts of future fossil use were based on the high srovth rates of energy demand in the early 1970s (e . s " 1otty 1978) . Bovever 1 mos t study sroup s have nOY revi sed their predictions of energy de=and downvards (Bif ele � !!· 1981 ; Rotty 19 80) . The se later e s t imates of future co2 release can be used in conj unction wi th current ly accep ted model s of the carbon eycle to produce foreca s t s of future atmo s pheric co2 • The values obtained are dependent on the as� tion employed , but several e s t imates ind i cate that by the year 2025 a tmospheric co2 level s could have r i sen to 450 or even 600 ppm (RD t ty 1980 ; Smi th 1982 ) . A mor e recent s tudy has predicted that atmo spher ic co2 concentrat ions may pas s 600 ppm by the third quarter of the next century . For the year 2000 , the mos t l ikely concentration is 370 ppm (NAS 1983) .

2. � .
CONFI D ENT IAL
Global e f f ect o f increa s ed a�o spheri c C02
I t i s genera lly accepted that future increases in a�osphe ric C02 l eve l s wi l l be accomp ani ed by a r i s e in the ave rage glob a l temperature . There i s , ho�ever , unc ert ai�ty in reg ard to both the magnitude of this var=ing and to when the increase wi l l be d e t e c t ab le . Mo s t s tud ies of this s ubj ect have used climate mode l s t o s t imu l ate the co2-induc ed warming of the Earth . Current ly , the mo s t popu l ar type s are the General C ircu l ation Mode ls (GeMS ) . The se are comp l ex , three-d imensional a tmospheric mode l s vhich are cons i dered to s t imulate average cl imate cond i t ions we l l , out to be l e s s accurate in pre d ictions of regiona l cl imat i c change (NAS 1 9 7 9 ) . The results of mos t rec ent GCM inve s tigations indi cate tha t a doub l ing of the armo spheric co2 concentration from 300 to 600 ppm , if maintained indef ini te ly , wi l l produce an average glooal warming of between l . S and 4 . 5 °C , al though values in the lower half of thi s range are mos t prob ab l e (NAS 1 9 83 ) . I t i s foreca s t that the greatest increases wi ll occur i n the higher lat itude s , espe cial ly in the Northern Hemisphere .
It i s conc eivab le that the cons ensus oo tained between recent GCM s tud i e s may be spurious and could result from the common methodo lo gy emp loyed by such inves ti g at i ons . In thi s re spect , i t is of intere s t to no te that an independent approach , us ing radiation ba lanc e measurement s , oo tained a value of �0 . 26°C for the increase in t�perature due to a d oub ling o f the C02 level (Id s o 1980) . Thi s s tudy has , however , been wide ly cri t i ci ze d f o r s evera l reas ons , particularly f o r ignoring the feedb ack mechanism whe reby grea t er evaporation from the oceans would caus e au increas e iu the mo isture content of the atmo s phere , whi ch in turn re sul t s i n an enhanc ed "greenhous e effect" (Schneider , Kel logg and Ramana than 1 980) .
Resul ts from several GCM inves tigations iudicate that a C02-induced increase in g lob al temperature should a lready be de tec tab le ( e . g . Madden and lamanathan 1980) . Currently , however , there is no generally accepted evidence that such an increase bas taken place . The dete ction of such an effect or "s ignal" is made dif f icult by the "no i s e " aris ing f r om the inherent variab i l ity of c l �te . Th i s probl� is ,exacerbated because attempts to detect such an effect have rel ied on ob s ervations of a sing le variab l e such as me an summer temperatures at a parti cular latitude . It has , therefore , been proposed tha t phys i cal as wel l as s tat is tical evidence should b e sought , such as the r e l at ionship between tropospheric and stratospheric t£mperature s (Madden and lamanathan 1980) . In addi tion , a criti cal examination of GCM s tud ies ( Schles inger 1983) reveal ed that the predicted time vhen a col-induc ed wa�ing vi l l be detectable is highly dependent on the as sumed rate at which heat is exchanged b etween the oceanic mixed layer and the deeper oce an . This uncertainty needs to �e reduced to allow better predictions of the time of firs t detection .
Reg i onal impact of increas ed globa l t empe rature
AD important finding from GCM s tudi es is that regardle s s of the reason for an increa se in g l obal temperature , there are ceneral s �ilar ities in the pat tern of c l �atic change . The regional imp l ications of a g l obal warming may therefore be as sessed by ref erence to the pas t as a guide for future pat terns of cl�atic chang e . Pol len record s from one of the four warm epochs durin& the l ast 2 . 5 million years have been used to recons truct rainfall pat terns for different parts ·of the world (Eellogg 1978) . The f indinss obtaiued have beeu criticized as the records are often poorly dated . the recent pas t , for which instrumental records - are available , is cons idered to be a more useful guide for establi sning po ss ibl e patterns of climatic change . One suCh study (Wigley , Jones aud �el ly 1 9 80) compared cond ition� iu the five varmest year s �etween 1925 and 1 9 7 4
· with the f ive coldest in the p eriod , using data from the high northern latitudes , the reg ion where C02-induc ed chang e s are predi cted to be zreates t . Temperature increas es wer e obtained for mos t reg ions , wi th maximal warming in the continental interiors at high

2 5 . C ONFI DENTIAL
la�i �ud es . E s t ima � i on of �he human and env ir onmen t a l cons e quen c e s o f such c l imat i c chan g e s can o n l y be spe cu l at ive and unc ertain . Adv e r s e e f f e c � s in one part o f �he vor ld may be c omp en s a ted by a bene f i c i al e f f e c t i n ano ther reg ion (�P 1 9 8 1 ) .
A warmin g of �he g l obe vi l l result in changes of �nd s treng�h and e l evat i on ove r the oceans vhi ch may al t er the locati on of areas of up� l l ing and caus e s hi f t s in the d i s
�ribu�ion of marine organisms and �he consequent e l �nat ion o f some commer c i a l f i s h er i e s ( S t ewart 1 9 80) .
A g lob a l varming wi ll al so cause the thermal 2Xp&ns i on of the oceans and the trans f er of i c e and snow from the land to the oceans , re su l t ing in an increase in the sea leve l . It i s not pos s ible to pred ict the precise incr e as e , but a recent s tudy has fore cast that a g l obal varming o f about 3 or 4°C over the next 100 ye ars vil l caus e an increa se in the s ea l evel of abou t one me tre (NAS 1 9 8 3 ) . Another study predicts a g l ob a l ri s e of sea lev e l of be�een 144 em (4 . 8 f t) and 2 17 em (7 ft ) by 2 100 as most l ike l y , a l though a globa l r i s e as low as 56 em (1 . 9 ft) or as high as 345 em ( 1 1 ft) cannot be ruled out (EPA 1 9 8 3 ) .
Control s trategies
It is d i f f i cult to suggest speci f i c actions t o al leviate the co2 prob lem when s o many uncerta int i es surround the i s sue . HOwever , if there i s a consensus that C02 accumulation requires c ontrol , then two �road strategies can be cons i dered . The f ir s t invo lves the use o f technol ogi ca l countermeasures t o collect co2 from the air , o r f r om the f lue gases of pover s tat i ons . A detailed a s s e s sment of such an approach (Albanese and Steinberg 1980) conclud ed that the various technique s avail able vere not practi cal becaus e
of the l arge energy co s t s involved . It mu s t al so be borne in mind that the e%pert i s e for such technique s i s located in the developed countries , yet future energy growth is azpected to b e greate s t in the developing nations .
The second approach to this problem i s a prevent ive s trategy , to reduce co2 r e l e a s E f r om energy produc tion . A pol icy o f dras t ically res tricting the consumption of fo s s i l fue l s i s no t con s idered t o b e practical at the pre s ent t�e , a s other f o rms o f energy could not meet the increased demand (Smith 1982) . Nevertheles s , an axpert group on ene rgy demand and supp ly recommended a "lov-elimate-risk energy pol icy" requiring the development of al ternative energy syst� which do not release co2 to the atmosphere (Bach , P ankrath and Wi l l izms 19 80 ) . The adoption of alternative ener gy .,stems would , however , entai l add itional r i sks wh o s e nature an d magnitude are not always ve l l known . I t would , theref ore , be benef i c i a l to conserve energy from convent ional sources as a me ans to reduce C02 releas e . Studie s from s ev eral countries reveal that l arge saving s in energy wastage can , or already have been , made (Ke llogg and Schware 1981) .
It � t be stre s s ed that any effort to minimize the impact of atmospheric co2 accumula�ion should involve the �provement of world agriculture . In this vay , it wil l be pos s ib le to reduce the vu lnerab ility of agricultural .,st�s to cl�tic change . This is a dualbenef it approach , as the climate wil l f luctuate whether there is co2 ac cumulat ion or no t . An increase in agr icultural res i lience would result from _ tbe prote ction o f soils by improved land management practices and tha development of cult ivars vhich are adapted to a vide range of c l imat ic conditions (Sc!meider and Jach 1980) .

CONFIDENTIAL
- 75 -
APPENDIX 5
Inte rnational organisations and information c enters
S c ient i fi c Committee on Problems of the Environment ( S COPE)
S COPE i s one o f the 10 sci enti f ic committees International Counc i l o f S ci enti fic Uni ons repres entatives o f 34 member countries and 1 5 Committees partic ipate in the work o f S COPE .
e s tab l i shed ( ICSU) .
Uni ons and
by the Current�y , S c i entific
The mandate o f S COPE i s to as semble , review , and ass e s s the information available on man- made environmental changes and the e ffec t s of these changes on man ; to as sess and evaluate the methodologies of measurement of environmental parame ters ; to provide an intel l igence service on current research ; and by the recruitment of the b e s t ava i l able sc i ent ific informat ion and cons truc tive th inking to es tab l i sh i t s e l f as a corpus of informed advice for the benefit o f centres o f fundamental research and of organisat ions and agenc ies operat ionally engaged in s tudies o f the environment .
S COPE ' s proj ect on B iogeochemical Cycles has provided a forum to as sess exi s t ing knowledge on the carbon cycle and to define fields o f ignorance . The resul ts and recommendations o f a s ix day workshop (he l d in 1 9 7 7 at Ratzeburg , FRG and financ ial ly supported by SCOPE , UNEP , the Res earch Counc i l , the Univers i ty of Hamburg and She l l ) , have been l a id down in SCOPE Report 13 , i . e . The Global Carbon Cyc le ( 19 7 9 ) .
Ano ther re levant pub l ication in thi s field i s S COPE Report 16 , i . e . Carbon Cyc le Mode l l ing ( 19 8 1 ) .
The World Cl imate Conference o f 1 9 7 9 , in Geneva ( organised by WMO , UNEP and S COPE - ICSU) resul ted in a World Cl imate Programme (WCP ) . The WCP inc ludes a s tudy of impact analys i s of a changing c l imate . A team of 2 6 authors from 16 countr ies , led by Robert W . Kate s , i s preparing a S COPE report , which wi ll be a prescrip t ive document for the des ign of c l imatic impac t as sessments .
S COPE S ecre tariat 5 1 Boulevard de Montmorency 7 5 0 1 6 Par i s France
World Meteorological Organisation (WMO )
S ince a rap i d shift i n the 1 9 70 ' s from traditional me teoro logy towards a c l imati c focus , WMO concentrates on c l imat i c theme s . The c l imatic system i s seen as an entire whole , involving interact i on between atmosphere , ocean , b io ta , s o i l s , rocks , i c e and human society . WMO ' s convers ion culminated in the Woild C limate Conference o f 1 9 7 9 , in Geneva ( organised by WMO , UNEP and S COPE - ICSU) , whi ch concentrated attent ion on the l inks between s o c i e ty and variable cl imate .
CONFIDENTIAL
- 7 6 -
Out of this conference came a World Cl imate Programme , with four component programme s : - The World C l imate Appl ication Programme (WCAP ) " to as s is t societies to
improve the ir c apabilities to carry out var ious ac tivi ties and to obtain maximum economi c and soc ial bene f i t under different c l imatic c onditions , while maintaining environmental integri ty" .
- The World C l imate Research Programme (WCRP ) " to what extent o f man ' s influence on c l imate " .
- The World C limate Impact S tudies Programme (WC I P ) " the bas i c s tudies should a im at an integration o f c limate , e cological and socio - economic factors which enter into the complex prob lems fac ing s o c i e ty , in particular thos e relating to food , water and energy " .
- The World C l imate Data Programme (WCDP ) " to ensure availab i l i ty of rel iable c l imate data which are acces s ible and exchangeable in an acceptable form and t ime , as required in cl imate research , appl ications and impact s tudie s " .
�0 P . O . Box 5 Geneva 20 Switzerland
Internat ional Carbon Unit ( ICU)
In cooperation with SCOPE(UNEP an Internat ional Carbon Uni t has been e s tab l i shed at the Univers i ty o f Hamburg , aimed at the collection of information on the carbon cycle . The I CU is headed by Prof . Dr . Egon T . Degens . Sub - uni ts are located at the Vrij e Univers iteit of Brus sels ( cartography) , the Univers i ty of S tockholm ( atmospheric sys tems and models ) , the Univer s i ty of Es sen ( s ocio - economic aspec ts ) and in Woods Hol e Mass . ( land b iota) .
Prof . Dr . Egon T . Degens Geologis ch - PalAontologisches Ins ti tut Univers i tA t Hamburg Bunders tras se 55 200 Hamburg 1 3 �G
Global Environmental Research Organisation ( GERO )
I tal ian and Amer ican sc ientists agreed at the end of Oc tober 1 9 8 5 to set up a new internat ional research ins t i tute ( GERO ) on an i s l and in the Venic e lagoon . I t wil l be the first to be dedicated to global , interdis c ipl inary s tudie s of the environment . S tudy themes will cover energy flow through the biosphere , inc luding c l imat i c l inkages between atmosphere and ocean , b iogeochemical cycle s , ranging from ac i d rain , and greenhouse e ffec t to oceanic sediments .
Carbon Dioxide Information Center ( CDIC)
The CDIC supports the US carbon dioxide res earch program and cooperates in information exchange with the international sc ient ific community

CONFIDENTIAL
- 77 -
addre s s ing global atmospheric C02 problems . CDIC i s spons ored by the Department o f Energy ' s ( DOE) Carbon Dioxide Research D ivis ion and is adminis tered by the Information Divis ion at Oak Ridge Nat i onal Laboratory . - CDIC maintains a Bib l iographic Information Sys tem containing ove r 7000
keyworded refe rences . - i t maintains an International Direc tory o f approximately 1 70 0 C02
researchers . - i t pub l i shes CDIC Communications , a b iannual news letter that reports on
many aspec ts o f C02 - related research proj ects , event s , meetings , and pub l icati ons .
core Oak Ridge National Laboratory P . O . Box x Oak Ridge , Tennes see , U . S .
Canada
Environment Canada publishes a quarterly news letter , C02 C l imate Report , that wil l s t imulate as we l l as update C02 information with in the Canadian research community .
Atmospheric Environment Service 4904 Duffer in S treet Downsview , Ontar io M3H ST4 , Canada

- 7 8 -
APPENDIX 6
Ins t i tute s involved in C02/c l imate/greenhouse effec t research
A . U s e of theoret ical c l imate system mode l s
Bri t i sh Meteorological Office Brackne l l , U . K . ( B . J . Mason ; J . G ilchr i s t )
Department of Atmoshperic S c iences Oregon S tate Univers ity , Corval l i s , Oregon , U . S . (W . L . Gates )
Department o f Me teorology Univers i ty of S tockholm , S tockholm , Sweden ( B . Bol in)
Department of Me teorology , U . C . L . A . Lo s Angeles , Cal i fornia , U . S . (Y . Mintz ; A . Arakawa)
Geophys i cal Fluid Dynamics Laboratory NOAA , Prince town , New Jersey , U . S . ( S . Manabe ; K . Bryan ; R . T . Wetherald )
Goddard Space Flight Center Greenbel t , Maryland , U . S . ( M . Hall ion ; Y . Mintz )
National Center for Atmospheric Res earch Boulder , Colorado , U . S . (W . M . Washington ; R . E . D ickinson ; W . W . Kel logg)
B . Recons truction of real cl imatic change of the pas t
1 . Ins trumental record and paleocl imatology
C limate Research Uni t Univers i ty of Eas t Angl ia , Norwich , U . K . ( T . M . L . Wigley ; H . H . Lamb )
I ns t i tute for Environmental S tudies Unive rs i ty o f Wiscons in , Madison , Wiscons in , U . S . ( J . W . Kutzbach ; R . A . Bryson)
Meteorological Ins t i tute Univers i ty of Bonn , Bonn , F . R . G . ( H . Flohn ; S . Nicholson)
CONFI DENTIAL

2 . Ins trumental record
C l imatic Diagnos t i c Center , NOAA Suitland , Maryland , U . S . ( D . G ilman)
CS IRO , Melbourne , Aus tralia ( B . W . P ittork , B . Tucker )
Department of Me teorology
- 7 9 -
M . I . T . , Cambridge , Mas sachuse tts , U . S . ( R . Newe l l )
Department of Me teorology Univers i ty of S tockholm , S tockho lm , Sweden ( S -A . Odh ; J . He intz enberg)
Department of Meteorology Colorado S tate Univers ity , Fort Coll ins , Colorado , U . S . ( E . Re i ter )
CONFIDENTIAL
Environmental Data Service and Air Re source s Laboratory , NOAA S i lver Spring , Maryland , U . S . (J . M . Mi tchell ; J . K . Angell ; K . Korchover )
Nat ional Center for Atmospheric Research , Boulder , Colorado , U . S . (H . van Loon ; R . L . Madden)
3 . Paleocl imato logy
Arctic and Alp ine Ins t i tute Univers i ty of Colorado , Boulder , Colorado , U . S . (J . Ive s ; J . Andrews ; N . Nichols )
Brown Univers i ty Providence , Rhode I s land , U . S . ( J . Imbrie )
Geologis ch - Palaontologishes Ins t i tut Univers i ty of Hamburg , Hamburg , F . R . G . ( E . T . Degens )
Lamont Geological Observatory Columbia Univers i ty , Palisades , New York , U . S . ( G . Kukla )
- 8 0 -
C . S ources and s inks for C02 in the b iosphere
Department of Theoretical Produc tion Ecology Agricul tural Univers ity , Wageningen , The Netherlands (J . Goudriaan)
C SIRO , Canberra , Aus trali a ( G . Pearman)
Duke University ( K . R . Krame r )
Lawrence Livermore Labs C al i fornia , U . S . ( G . B ingham)
Mar ine Biological Laboratory Woods Hole Oceanographic Ins ti tute , Mas s achuse tts , U . S . ( G . M . Woodwel l )
NOAA Re search Labs Boulder , Colorado , U . S . ( B . Bean)
Univers i ty of Nebraska , Lincoln ( S . B . Verma ; N . J . Rosenberg)
D . Biomas s produc tion
Univer s i ty of Ghent , Belgium ( R . Lemeur )
Univer s i ty of Antwerp , Belgium ( I . Impens )
Univer s i ty o f Cal i fornia , Berkely , Cal i fornia , U . S . ( M . Calvin)
U . S . Fores t S ervic e , Rhinelander , Wiscons in , U . S . ( D . Dawson)
E . Crop model ing related to C02 and c l imate change
Crop S imulation Research Unit Mis s i s s ippi S tate College , Miss i s s ipp i , U . S . ( D . N . Baker )
Department of Agr icultural Engineering C l emson Univers i ty , South Carol ina , U . S . (J . Lambert)
CONFIDENTIAL

- 8 1 -
Evapotransp iration Laboratory Kansas S tate Univers i ty , Manhattan , Kans as , U . S . ( E . T . Kanemasu)
Temple , Texas ( G . Arkin)
Univers i ty of Florida (K . Boote )
Univers i ty of Kentucky , Lexington (W . Duncan)
Univers i ty of Nebraska , Lincoln ( J . Norman ; G . Meyer )
Univers i ty of Wiscons in , Madison ( G . Cottam)
U . S . Department of Agriculture (USDA) I thaca , New York , U . S . (T . S inc lair )
USDA Temple , Texas , U . S . (J . T . Ritchie )
U . S . Water Cons e rvation Laboratory U . S . Department o f Agriculture , Phoenix , Arizona , U . S . ( S . B . I ds o )
F . S oc ial and economic consequences o f cl imate change
Arb e i ts gruppe Umwe lt , Gesellschaft , Energie Univers i ty of Es s en , Essen , F . R . G . ( K . Meye r - Ab ich)
Kennedy S choo l o f Government Harvard Univers i ty ( T . C . S che l l ing)
CONFIDENTIAL

- 8 2 -
APPENDIX 7
Relevant publicat ions ( reports and books )
Andersen , N . R . ; Malahoff , A . ( eds ) The Fate of Fos s i l Fuel in the Oceans Plenum Pres s , NY , 1 9 7 7
Bach , W .
CONFIDENTIAL
Our Threatened C l imate : Ways of Averting the C02 Problem through Rat ional Energy Use Kluwer Acad . Publ . , Hingham , MA, 1 9 84
Bach , W . ( ed . ) Carbon Dioxide : Current Views and Developments in Energy/Cl imate Research Kluwer Acad . Publ . , Hingham , MA , 1 9 8 3
Bach , W . ; Pankrath , J . ; Will iams , J . ( eds ) Interactions o f Energy and C l imate Re i de l , Dordrecht , The Netherlands , 1 9 8 0
Barth , M . C . ; Titus , J . G . ( eds ) Greenhouse Effect and Sea Level Rise : A Chal lenge for thi s Generat ion Van Nos trand Re inhold , Florence , KY , 1984
Berger , A . L . ; Nocolis , C . ( eds ) New Perspec t ives in C l imate Mode l l ing E l s evier , Ams terdam , The Ne therlands , 19 84
Bol in , B . Carbon Cycle Modell ing S c ope Report 16 , Wiley , NY , 1981
* Bol in , B . ; Degens , E . T . ; Kempe , S . ; Ketne r , P . ( eds ) The Global Carbon Cycle Scop e Report 1 3 , Wiley , NY , 1979
C arbon Dioxide Ass e s sment Committee Changing C limate National Academy Pres s , Washington , DC , 19 8 3
C l ark , W . C . ( ed . ) C arbon D ioxide Review : 19 8 2 Oxford Univ . Pres s , NY , 19 8 2
Cushing , D . H . C l imate and Fisheries Academic Pres s , NY , 1983

Geophys i c s S tudy Committee (GSC) Energy and Cl imate
- 83 -
National Academy Pre s s , Washington , DC , 1 9 7 7
* HAfele , R . Energy in a Finite World . A Global Sys tems Analys i s Ball inger Publ . Co . , Cambridge , MA , 1 9 8 1
Hill , A . E . Atmosphere - Ocean Dynamics Academic Pres s , NY , 19 8 2
Houghton , J . T . ( ed . ) The Global C l imate C ambri dge Univ . Pres s . , NY, 1 9 84
* I ds o , S . B . Carbon Dioxide : Fr iend or Foe ? IBR Pres s , Tempe , Arizona , 19 8 2
JAger , J . Cl imate and Energy Sys tems : a Review of the i r Interac tions Wiley , NY , 1 9 8 3
Kel logg , W . ; Schware , R .
CONFIDENTIAL
Cl imate Change and Society : Consequence s of Increas ing Atmospheric Carbon Dioxide Aspen Ins ti tute , Boulder , CO , 1 9 8 1
Lemon , E . R . C02 and plants : The Response o f Plants to Ris ing Level s o f Atmo spheric Carbon Dioxide Wes t View Pre s s , Boulde r , CO , 1 9 8 3
* Lis s , P . S . ; Crane , A . J . Man - Made Carbon Dioxide and C l imate Change : A Review o f the Scientific Problems GEO Books , Norwich , England , 1 9 8 3
MacDonald , G . J . ( ed . ) The Long- Te rm Impac ts o f Increas ing Atmospheric Carbon Dioxide Level s Ball inger , Cambridge , Mas s , 1 9 8 2
McBeath , J . H . ; Juday , G . P . ; Wel le r , G . ; Murray , M . ( eds ) The Potential Effects of Carbon Dioxide - Induced Cl imatic Change s in Alaska Univ . o f Alaska , S chool of Agri cul ture and Land Res ources Management Miscellaneous Publicat ion 8 3 - 1 , Fairbanks , AK , 1 9 84
National Res earch Counc i l (NRC ) Carbon D i oxide and Cl imate : a S c i entific As s e s sment National Academy Pres s , Washington , DC , 1 9 7 9

National Research Counc i l Energy i n Trans i tion 1 9 8 5 - 2010
- 84 -
CONFIDENTIAL
Final Report of the Committee on Nuclear and Alternative Energy Sys tems ( CONAES ) W . H . Freeman , S an Frans isco , 1979
National Research Counc i l Carbon Dioxi de and Cl imate : a Second Ass e ssment Report of the C02/Climate Review Pane l , J . Smagor inski , chairman National Academic Press , Washington , DC , 19 8 2
Oerlemans , J . ; Van der Veen , C . J . Ice Sheets and Cl imate Kluwer Acad . Publ . , Hingham , MA, 1 9 84
Organisat ion for Economic Cooperation and Devel opment I Internat ional Energy Aency Workshop on Carbon Dioxide Research and As s e s sment Par i s , OECD/IEA , 1 9 8 1
S e i de l , S . ; Keyes , D . Can we Delay a Greenhouse Warming? U . S . EPA , Washington DC , 19 8 3
Smi th , I . M . Carbon Dioxide from Coal Ut i l ization Technical Information Service , International Energy Agency , Pari s , 1 9 8 2
Smith , I . M . Carbon Dioxide - Emis s ion and Effects Report No . I CT IS/TR1 8 , l EA Coal Re search , London , 1 9 8 2
Sundquist , E . T . ; Broecker , W . S . ( eds ) The Garbon Cycle and Atmospheric C02 : Natural Var iations Archean to Pre s ent Amer ican Geophys ical Union , Washington , DC , 19 8 5
Tucke r , G . B . The C02 - Cl imate Connection Aus tralian Academy of Science , Canberra , 1 9 8 1
UNEP Mee t ing of the Sc i entific Advisory Committee of the World C limate Impact S tudie s Programme Nairob i , 2 3 - 27 February , 1 9 8 1
US - DOE Carbon Dioxide Effects Research and As ses sment Program S e r ie s of Pub l ications by the US Department of Energy , CONF - 7 9 04143 , 1 9 8 0

- 8 5 -
Van Loon , H . ( ed . ) Cl imates o f the Oceans . Vol . 15 , World Survey of C l imatology Elsevier , Ams terdam , The Ne therlands , 1 9 84
WMO/ICSUjUNEP
CONFIDENTIAL
On the asses sment of the role of co2 on c limate variation and the i r impact (based on mee t ing o f experts , V i llach , Aus tr i a , November 1 9 8 0 ) World Meteorological Organization , Geneva , January , 1 9 8 1
World Meteorological Organization (WMO ) World C l imate Conference : extended summaries of papers and dec larations WMO , Geneva , 1 9 7 9
* Books recommended for general reading .

APPENDIX 8
- 8 6 -
V i s i t to Cl imate Res earch Uni t , 2 7 . 11 . 1 9 8 5
Mee ting with Dr . T . G . Wigley , D irector .
CONFIDENTIAL
The CRU made a s tudy o f the greenhouse e ffec t for Shel l in about 19 8 1 on the bas i s o f a grant for £ 10000 . Thi s was subsequently extended for the US DOE and was pub l i shed by them in Augus t 1 9 84 ( I was given a c opy of the report ) .
I found Wigley very much had h i s fee t on the ground and was at great pains to emphas is e the uncertainties that s ti l l exis t in thi s area and the t ime needed before which it wil l be pos s ib l e to reach any very definite conclus ions about the greenhous e e ffe c t . Having said that , he was prepared to s ti ck his neck out and say that there has been a global warming over the last 100 years , that the 0 . 5 degrees ( range 0 . 3 - 0 . 7 ) increase is a re sul t of C02 buil d - up , that we will see a further 1 - 2 degree warming over the next 40 years and that the warming will be greater in higher l at i tudes and more in winter than in summer . Such a rise would be greater than any change in the last 1000 years - at the peak of the las t ice age ( 1 8 000 years ago ) the global mean temperature was 4 degrees lower than at pres ent .
The global mean sea level has risen by some 15cm over the las t 100 years , one third due to expans ion of sea water and one third due to the mel t ing of land ice ( the mel ting of sea ice has no effect on sea l evel ) . A 4 degree warming might resul t in the disappearance of all Atlanti c sea ice in the summe r months . By 2050 , the range of uncertainty of the r i s e in global mean sea l evel i s 2 0 - 120cm .
On a t ime s cale of decades , the role of the oceans as a thermal buffer i s as important as the atmo sphere and we are not capable at present of model ing the ocean or i ts coupl ing with the atmosphere . I t is po s s ible that the ne gative feedback of this coupl ing could wipe out the forecas t rise . The movement of the s ea ice boundary and the deep water formation affect the atmosphere and European cl imate very s ens i t ive ly to the extent that Europe saw a cool ing from 1040 to 1 9 7 0 while the global mean temperature was s tatic or r i s ing . It i s very difficult to model the ice movement which i s mos tly responding to water movements from below .
Whi l e mos t people agree that the warming will b e amp l ified a t higher lati tudes thi s has not been measured because i t has been countered by the cool ing in the N . Atlantic region .
By the turn o f the c entury we will have a much be tter idea of what caus ed pas t changes - our monitoring of the uppe r atmosphere , the oceans and solar output wil l have improved immeasurab ly . For example , only s ince the l ate fifti e s have we had data that will allow the model ing of the atmospher ic behaviour in three dimens ions the data suggests that while the lower atmosphere i s warming , the upper is cool ing .

CONFIDENTIAL
- 8 7 -
Wigley i s very interes ted in the e ffec ts of trace gas es . He bel ieve s that i t i s not real i s t i c t o make pol icy dec is ions aimed a t reduc ing the e ffec t of C02 but that we might reasonab ly do s o for the trace gase s . On a one - dimens ional ( global averaging) bas i s , the overall e ffects of chlorofluorocarbons , ni trous oxide , me thane and ozone are roughly the same as C02 . In a two dimens ional model the effects might be s l ightly l e s s but there i s not enough data to be certain . This i s another area where wi ll be much be tter informed in the next 10 - 15 years .
Water vapour alone has a pos i t ive feedback but there i s great uncertainty about the e ffec t of c louds . These c an be both pos i t ive and negative , trapp ing heat and reflec t ing incoming radiation . Further , the e ffects of the same types of c louds c an be different at diffe rent lat i tude s . Next to the ocean , thi s i s the b i gge s t uncertainty . For example , we are only now beginning to model the phys ics of the pas sage of radiat ion through c louds .
The mos t di fficul t e ffec t of a global warming to predict is that on rainfal l . Dynamic cl imatology i s , after all , a very new s c i ence ! In high lat i tudes ( 60 - 70 degrees , for example ) , rainfal l ought to increase j us t because o f the raised temperature ; we may , after all , b e doub l ing the water vapour content . Mons oon rainfal l ought to incre as e also as should the frequency of trop ical s torms which i s again a temperature dependent phenomenon . I t is much more difficul t to say anything about the mid- latitude drying forecas t by s ome mode l ing and even more so to make s ens ib le c omments on pos s ible change s in equator ial regions .
M . H . Gri ffiths
2 8 th November 1 9 8 5 .