The Greenbrier Companies 2001 Annual Report
40
The Greenbrier Companies 2001 Annual Report
Transcript of The Greenbrier Companies 2001 Annual Report

The Greenbrier Companies2001 Annual Report

C o m p a ny ProfileThe Greenbrier Companies, Inc. (NYSE: GBX) is a leading supplier of inter-
modal and conventional freight cars and services to the railroad industry inNorth America and Europe. Greenbrier operates in two primary businesssegments: manufacturing and leasing & services.
The manufacturing segment operates from eleven repair and wheel serviceshops, as well as three new car facilities in North America and one in Europe.In North America, Greenbrier produces double-stack intermodal railcars,conventional railcars, marine vessels and forged steel products. It alsoperforms railcar refurbishment, wheel service and maintenance activities.In Mexico, these operations are performed under an exclusive joint ventureagreement with Bombardier Transportation. European freight car manufactur-ing operations are centered around the WagonySwidnica facility acquired inSeptember 1998 in the Silesia region of southwestern Poland. In Europe,Greenbrier also manufactures railcars in facilities it does not own, usingsubcontractors directed by the engineering and project management expertiseof its operation in Siegen, Germany acquired in January 2000.
The leasing & services segment owns or manages approximately 42,000railcars and also provides marketing, re-marketing, maintenance, managementand accounting services for both new and used rail equipment, predominantlyin North America. In many cases, Greenbrier combines its leasing and servicescapabilities with those of its manufacturing operations to provide higher valueservices and products to the marketplace.
Operating from a strong base in North America, Greenbrier’s goal is toenhance its leadership position as a manufacturer and developer of innovativerail freight equipment, while continuing to offer complementary services inrailcar leasing, refurbishment, asset management and maintenance.Greenbrier’s plan is to grow its businesses by investing in its core markets inNorth America, selectively broadening its strategic geographic reach throughincreased market penetration in Europe and Mexico, and expanding its servicebusinesses such as freight car repair, wheel service and freight car manage-ment.
2001 Highlights• Increased cash by $64 million to $77 million at August 31, 2001. • Expanded market share in North America, obtaining 24% of total
orders for the nine months ending September 2001 compared with 17% in 2000.
• Earned the North American rail supply industry’s most coveted qualityaward as a TTX Excellent Supplier for the tenth consecutive year, adistinction far surpassing the record of any other railcar builder.
• Increased European revenue to $98 million, a 84% increase over theprior year.
• Continued growth in railcar repair, refurbishment and wheel services.• Increased marine backlog and successfully launched three major ocean
going barges for railcar service to Alaska.• Implemented cost control program achieving over $5 million in reduc-
tions from the previous year.
Selected Financial Data for the last five years is located on page 12.
R e ve n u e s(Dollars in millions)
Net Earnings(Dollars in thousands)

During 2001, the markets and economic conditions in which Greenbrieroperated presented severe challenges. For the North American market, freightcar orders fell to 30% of 1999 levels and deliveries were reduced to 40% of2000 levels. We are also operating in a European market where earnings expec-tations are not being met, although revenue has almost doubled.
Three of our most important objectives at the start of this year were to1) maintain our North American market share for new railcar production, 2) grow our repair, refurbishment and wheel programs, and 3) maintain corpo-rate liquidity. We are pleased with achievements in each of these areas.
Slightly over one half of Greenbrier’s total revenue in 2001 was from new car manufacturing in North America. North American demand for newfreight cars has softened dramatically, driven by the twin forces of railroadconsolidation and economic recession. Greenbrier continued to operate allthree of its North American facilities in 2001, although at reduced levels ofemployment. Several factories operated by competitors have closed in 2001.While we are not immune to this downturn, our strong presence in the inter-modal freight car market and our powerful leasing capabilities have enabled usto maintain factory operations at much higher levels than our competitors. Wecontinue to pursue conventional car markets aggressively and have a strongmarket share in forest products and other specialized equipment.
While the North American industry backlog has declined precipitously,Greenbrier’s share of this backlog increased to above 20% throughout the year. Greenbrier obtaining 24% of total orders for the nine months endingSeptember 2001 compared with 17% in 2000.
Approximately $250 million of Greenbrier’s total revenue during 2001 wasfrom sources other than manufacturing new freight cars in North America.This revenue was derived from manufacturing in Europe, railcar services,marine and forge manufacturing, and railcar leasing.
After two years of operation, Greenbrier’s market share in Europe is over10% in a market that is fragmented and consolidating. We continue to absorblosses in Europe, but revenues have increased to $98 million compared to$53 million in 2000, and cash flow has improved. Production and certificationissues on certain car types in Europe have delayed improvement to the bottomline. We are expecting some improvement in 2002.
In 2001, we continued our commitment to expand repair, refurbishmentand wheel services, achieving double digit growth in revenue, as well asincreased margins in a more difficult economy. Greenbrier operates this busi-ness at eleven locations, strategically positioned throughout North America toprovide service to the major railroads, as well as to our own fleet.
Greenbrier launched three major ocean-going barges during 2001. Two ofthese barges were the final two in a series of three railcar/deck barges forLynden, Inc. for service to the Alaska Railroad. In 2002, we plan to completethree new barges, two being deck barges and one double-hull tank barge. TheCompany continues to look at ways to improve efficiencies and capacity totake advantage of the increased market activity for the marine business in thePacific Northwest.
Let ter to our Shareholders, Employees & Customers :
William A. Furman, President and Chief Executive Officer
Alan James,Chairman of the Board ofDirectors
The Greenbrier Companies 2001 Annual Report

The leasing & services segment owns or manages approximately 42,000railcars for railroads, institutional investors or other leasing companies inNorth America; this is one of the largest non-railroad owned fleets in NorthAmerica. Utilization rates on owned railcars at year-end were 93% — up from90% the previous year. During market slowdowns, leasing offers attractivefinancial and operating options. This allows the Company to maintain produc-tion, preserve margins and increase market share, adding stability to earnings.
Adjusting financially to changing market circumstances, Greenbrier has successfully reduced administrative costs during the past year by over $5 million and expects further reduction during 2002. We ended the year in a strong liquidity position with over $100 million of available credit lines and $77 million in cash. It is important that we maintain sufficient liquidity totake advantage of opportunities, as well as for protection in the presenteconomic climate. In light of these circumstances the Board of Directors hasdeemed it prudent to reduce the quarterly dividend to $0.06 per share downfrom the $0.09 per share in the previous quarters.
During 2001, two of our largest competitors, Trinity Industries, Inc. andThrall Car Manufacturing Company, announced their merger which shouldtake capacity out of the market, and affect the strategic landscape in our indus-try. We are carefully reviewing this development as it relates to our own posi-tion and long-term maximization of shareholder value. At current tradingprices, which are less than book value, we continue to believe our stock isgreatly undervalued.
Despite uncertainties about the coming year, we remain cautiously opti-mistic about the future. Greenbrier has historically performed well in down markets. We are thankful for the ongoing support of our employees,shareholders, customers and suppliers. They continue to be key to our commit-ment to excellence in product quality, competitiveness and service design.
William A. Furman Alan JamesPresident and Chief Chairman of theExecutive Officer Board of Directors
2001 Annual Report The Greenbrier Companies

T h e G r e en b r i e r Co m p an i e s 2 00 1 F o rm 1 0 - K
UNITED STATES SECURITIES AND EXCHANGE COMMISSIONWashington, D.C. 20549-1004
FORM 10-K(X) Annual Report Pursuant to Section 13 or 15(d) of the
Securities Exchange Act of 1934
For the fiscal year ended August 31, 2001or
( ) Transition Report Pursuant to Section 13 or 15(d) of the Securities Exchange Act of 1934
for the transition period from ___________ to ___________
Commission File No. 1-13146
THE GREENBRIER COMPANIES, INC.(Exact name of Registrant as specified in its charter)
Delaware 93-0816972(State of Incorporation) (IRS Employer Identification No.)
One Centerpointe Drive, Suite 200Lake Oswego, Oregon 97035
(Address of principal executive offices)
(503) 684-7000(Registrant’s telephone number, including area code)
Securities registered pursuant to Section 12(b) of the Act:
(Title of Each Class) (Name of Each ExchangeCommon Stock, on which Registered)
par value $0.001 per share New York Stock Exchange
Securities registered pursuant to Section 12(g) of the Act:None
Indicate by check mark whether the Registrant (1) hasfiled all reports required to be filed by Section 13 or15(d) of the Securities Exchange Act of 1934 during thepreceding 12 months (or for such shorter period thatthe Registrant was required to file such reports), and(2) has been subject to such filing requirements forthe past 90 days.
Yes X No
Indicate by check mark if disclosure of delinquentfilers pursuant to Item 405 of Regulation S-K is notcontained herein, and will not be contained, to thebest of Registrant’s knowledge, in definitive proxy orinformation statements incorporated by reference inPart III of this Form 10-K or any amendment to thisForm 10-K. [ X ]
Aggregate market value of the Registrant’s CommonStock held by non-affiliates on October 31, 2001 (basedon the closing price of such shares on such date) wasapproximately $41,000,000.
The number of shares outstanding of the Registrant’sCommon Stock on October 31, 2001 was 14,121,132,par value $0.001 per share.
DOCUMENTS INCORPORATED BY REFERENCEParts of Registrant’s Proxy Statement dated November29, 2001 prepared in connection with the AnnualMeeting of Stockholders to be held on January 8, 2002are incorporated by reference into Parts II and III ofthis Report.

The Greenbrier Companies, Inc.Form 10-K
TABLE OF CONTENTS
PART I PAGEItem 1. BUSINESS 4
Item 2. PROPERTIES 10
Item 3. LEGAL PROCEEDINGS 11
Item 4. SUBMISSION OF MATTERS TO A VOTE OF SECURITY HOLDERS 11
PART IIItem 5. MARKET FOR REGISTRANT’S COMMON EQUITY AND RELATED STOCKHOLDER MATTERS 11
Item 6. SELECTED FINANCIAL DATA 12
Item 7. MANAGEMENT’S DISCUSSION AND ANALYSIS OF FINANCIAL CONDITION AND RESULTS OF OPERATIONS 13
Item 7a. QUANTITATIVE AND QUALITATIVE DISCLOSURES ABOUT MARKET RISK 16
Item 8. FINANCIAL STATEMENTS AND SUPPLEMENTARY DATA 17
2 2001 Form 10-K The Greenbrier Companies

PART I.Forward-Looking StatementsFrom time to time, The Greenbrier Companies, Inc.(“Greenbrier” or the “Company”) or its representa-tives have made or may make forward-lookingstatements within the meaning of the PrivateSecurities Litigation Reform Act of 1995, including,without limitation, statements as to expectations,beliefs and strategies regarding the future. Suchforward-looking statements may be included in, butnot limited to, press releases, oral statements madewith the approval of an authorized executive officeror in various filings made by the Company with theSecurities and Exchange Commission. These forward-looking statements rely on a number of assumptionsconcerning future events and include statementsrelating to:
• financing sources for operations, future expansion,other business development activities, capitalspending and railcar syndication activities;
• improved earnings in Europe;
• improved European railcar market environment;
• increased stockholder value;
• increased competition;
• market slowdown in North America;
• share of new and existing markets;
• increase or decrease in production;
• increased railcar services business;
• ability to obtain adequate certification andlicensing of products;
• availability of European subcontrators; and
• short- and long-term revenue and earnings effectsof the above items.
These forward-looking statements are subject to anumber of uncertainties and other factors outsideGreenbrier’s control. The following are among thefactors, particularly in North America and Europe,that could cause actual results or outcomes to differmaterially from the forward-looking statements:
• a delay or failure of acquisitions, products orservices to compete successfully;
• actual future costs and the availability of materialsand a trained workforce;
• changes in product mix and the mix betweenmanufacturing and leasing & services revenue;
• labor disputes or operating difficulties that mightdisrupt manufacturing operations or the flow of cargo;
• production difficulties and product delivery delays as a result of, among other matters,changing technologies or non-performance ofsubcontractors;
• ability to obtain suitable contracts for the sale orlease of equipment;
• lower-than-anticipated residual values for leasedequipment;
• discovery of defects in railcars resulting inincreased warranty cost or litigation;
• resolution or outcome of pending litigation;
• the ability to consummate expected sales;
• delays in receipt of orders, risks that contractsmay be canceled during their term or not renewedand that customers may not purchase as muchequipment under the contracts as anticipated;
• financial condition of principal customers;
• market acceptance of products;
• competitive factors, including increasedcompetition, introduction of competitive productsand price pressures;
• industry overcapacity or other factors;
• shifts in market demand;
• domestic and global business conditions andgrowth or reduction in the surface transportationindustry;
• domestic and global political, regulatory oreconomic conditions including such matters asterrorism, war or embargoes;
• change in fuel or/and energy prices;
• commodity price fluctuations; and
• economic impacts from currency fluctuations inthe Company’s worldwide operations.
Any forward-looking statements should beconsidered in light of these factors. Greenbrierassumes no obligation to update or revise anyforward-looking statements to reflect actual results,changes in assumptions or changes in other factorsaffecting such forward-looking statements or ifGreenbrier later becomes aware that theseassumptions are not likely to be achieved.
The Greenbrier Companies 2001 Form 10-K 3

4 2001 Form 10-K The Greenbrier Companies
Item 1. BUSINESSIntroductionGreenbrier is a leading supplier of transportationequipment and services to the railroad and relatedindustries. With operations in North America andEurope, the manufacturing segment producesdouble-stack intermodal railcars, conventionalrailcars, marine vessels and industrial forgings, andperforms repair and refurbishment activities for bothintermodal and conventional railcars. In addition tomanufacturing, Greenbrier is engaged in comple-mentary leasing & services activities principally inNorth America. As of August 31, 2001, the lease fleetconsists of approximately 42,000 owned or managedrailcars. Greenbrier believes this fleet is among thelarger non-railroad owned fleets in the United States.
Greenbrier is a Delaware corporation formed in 1981.The Company’s principal executive offices arelocated at One Centerpointe Drive, Lake Oswego,Oregon 97035, and its telephone number is (503) 684-7000.
Products and ServicesGreenbrier operates in two primary businesssegments: the manufacture of railcars and marinevessels and the refurbishment and repair of railcars,and the leasing of railcars and related services.A summary of selected consolidated financialinformation for these two business segments, as well as domestic and foreign operations is set forth in Note 18 of the Notes to Consolidated FinancialStatements. The manufacturing segment operatesfrom 13 facilities in North America, one in Europeand also through a network of subcontractors inEurope.
North American Railcar ProductsIntermodal RailcarsIntermodal transportation is the movement of cargoin standardized containers or trailers. Intermodalcontainers and trailers are generally freely inter-changeable among railcar, truck or ship, making itpossible to move cargo in a single container or trailerfrom a point of origin to its final destination withoutthe repeated loading and unloading of freightrequired by traditional shipping methods. A majorinnovation in intermodal transportation has been the articulated double-stack railcar, which transports
stacked containers on a single platform. Anarticulated railcar is a unit comprised of up to fiveplatforms, each of which is linked by a common setof wheels and axles.
The double-stack railcar provides significantoperating and capital savings over other types ofintermodal railcars. These savings are the result of (i)increased train density (two containers are carriedwithin the same longitudinal space conventionallyused to carry one trailer or container); (ii) a railcarweight reduction per container of approximately50%; (iii) easier terminal handling characteristics;(iv) reduced equipment costs of approximately 30%over the cost of providing the same carrying capacitywith conventional equipment; (v) better ride qualityleading to reduced damage claims; and (vi) increasedfuel efficiency resulting from weight reduction andimproved aerodynamics. Greenbrier is the leadingmanufacturer of double-stack railcars with anestimated cumulative North American market shareof nearly 60%. In 2001, the majority of Greenbrier'sproduction was double-stack railcars.
Greenbrier’s comprehensive line of articulated andnon-articulated double-stack railcars offers varyingload capacities and configurations. Current double-stack products include:
Maxi-Stack® The Maxi-Stack is a series of double-stackrailcars that features the ride-quality and operatingefficiency of articulated stack cars. The Maxi-Stack IVis a three-platform articulated railcar with 53-footwells that can accommodate all current containersizes in all three wells. The Maxi-Stack I is a five-platform railcar with 40-foot wells that can carryeither 20-foot or 40-foot containers in the wells withthe ability to handle any size of container, up to53-feet in length, on the top level. The Maxi-Stack IIIis a five-platform railcar that features the ability tocarry containers up to 48 feet in length in all wellsand up to 53-feet in length on the top level. TheMaxi-Stack AP is a three-platform all-purpose railcarthat is more versatile than other intermodal carsbecause it allows the loading of either trailers ordouble-stack containers on the same platform.
Husky-Stack® The Husky-Stack is a non-articulated(stand-alone) or draw-bar connected series of double-stack railcars with the capability of carrying containers up to 42% heavier than a singleMaxi-Stack platform. The All-Purpose Husky-Stack is a non-articulated version of the Maxi-Stack AP.Husky-Stack 2+2 is a 56-foot railcar that allows thedouble-stack loading of up to four 28-foot containers.Husky-Stack also provides a means to extend double-stack economics to small load segments andterminals.

The Greenbrier Companies 2001 Form 10-K 5
Conventional RailcarsA leading manufacturer of boxcars in North America,Greenbrier produces a wide variety of 100-toncapacity boxcars, which are primarily used in theforest products industry. Greenbrier also producescustom-built, high-capacity boxcars for specialapplications such as automotive parts or canstockmovement. In addition to boxcars, bulkhead flat cars,automotive flat cars, center-partition cars, wasteservice flat cars and various other conventionalrailcar types are manufactured.
Auto-Max® is a fully integrated, two-unit railcardesigned to transport a mix of full-size pickups,automobiles and sport utility vehicles in a tri-levelconfiguration. The adjustable decks in Auto-Max canalso be moved to a bi-level configuration, assuringthe ability to adjust to automobile industry modelchanges.
European Railcar ProductsTank CarsThe European product line includes a comprehen-sive line of pressurized tank cars for liquid petroleumgas (LPG) and ammonia and non-pressurized tankcars for light oil, chemicals and other products.
General Purpose Freight CarsGreenbrier also manufactures a broad range of othertypes of freight cars, including flat cars, coil steelcars, coal cars, and sliding wall cars. In the currentyear production began on a newly designed 10-axlelow-level wagon, referred to as a rolling highwaywagon, used to transport trucks in order to reducehighway congestion and protect the environment.Various tests for regulatory certification are currentlyunderway.
Rail ServicesGreenbrier is actively engaged in the repair andrefurbishment of railcars for third parties, as well asits own lease fleet. Refurbishment and repairfacilities are located in Portland and Springfield,Oregon; Cleburne and San Antonio, Texas; Finley,Washington; Atchison, Kansas; Golden, Colorado; andModesto, California. The Springfield facility has along-term contract with a third-party primarily forthe repair of railcars. Greenbrier believes it is one ofonly a few railcar lessors with its own refurbishingcapabilities. In certain situations, repair orrefurbishment of railcars in the Company’s leasefleet is performed in unaffiliated facilities. Inaddition, Greenbrier operates wheel reconditioningshops in Portland, Oregon; Pine Bluff, Arkansas;Tacoma, Washington; and Sahagun, Mexico.
Greenbrier's involvement on a major, long-termwheel program with Union Pacific Railroad Company(Union Pacific) has provided a substantial baseload of work.
Marine Vessel FabricationThe Portland, Oregon manufacturing facility islocated on a deep water port on the Willamette River.Until 1984, the Company’s predecessor designed andbuilt ocean-going barges and other types of marinevessels for maritime shipping companies. In 1995,Greenbrier re-entered the marine vessel market andexpanded and upgraded the marine facilities, whichinclude the largest side-launch ways on the WestCoast. The upgraded marine facilities also enhancesteel plate burning and fabrication capacity providingflexibility for railcar production. Since 1995, vesselsmanufactured include conventional deck barges,railcar/deck barges, barges for aggregates and otherheavy industrial products and ocean-going dumpbarges.
ForgingSteel forgings weighing up to 100 tons are producedat the Nova Scotia industrial forge facility, one of thelargest in North America. The forge produces customparts for the oil and gas, hydroelectric and otherheavy industries in all parts of the world.
Leasing & ServicesGreenbrier currently manages a fleet of approxi-mately 42,000 railcars, primarily in North America,of which 38% are owned and the remainder aremanaged for institutional investors, railroads andother leasing companies. Management servicesinclude equipment marketing and re-marketing,maintenance management and administration.Greenbrier participates in both the finance and theoperating lease segments of the market. Leasepayments received under the non-cancelable leaseterms of direct finance leases generally coversubstantially all of the equipment cost. The aggregatenon-cancelable rental payments for equipmentplaced under operating leases do not fully amortizethe costs of the leased equipment. As a result, theCompany is subject to the customary risk that it maynot be able to sell or re-lease equipment after theoperating lease term expires. However, the Companybelieves it can effectively manage the risks typicallyassociated with operating leases due to its railcarexpertise and its refurbishing and re-marketingcapabilities. Most of the leases are “full service”leases, whereby Greenbrier is responsible for

6 2001 Form 10-K The Greenbrier Companies
maintenance, taxes and administration. The fleet ismaintained, in part, through Greenbrier’s ownfacilities and engineering and technical staff.
Greenbrier manages the cost of the maintenance andensures cars are available for service under a multi-year maintenance agreement with The BurlingtonNorthern and Santa Fe Railway Company (BNSF);
BNSF maintains ownership of the cars. Much of thepreventative maintenance is performed at Greenbrierrail service facilities.
Assets from the owned lease fleet are periodicallysold to take advantage of market conditions, managerisk and maintain liquidity.
The following table summarizes the lease fleet:
Fleet Profile as of August 31, 2001 (1)
Percent Averageof Owned Age of
Owned Managed Total Units on OwnedUnits Units Units Lease Units (Yrs.)
Railcars Available for Revenue Service 15,900 26,306 42,206 93% 21Railcar Equipment Held for Sale(2) 419 — 419
16,319 26,306 42,625
Lessee Profile:Class I Railroads 11,630 14,407 26,037Non-Class I Railroads 1,735 9,137 10,872Shipping Companies 949 1,971 2,920Leasing Companies 408 564 972Off-lease 1,178 227 1,405
Total Revenue Units 15,900 26,306 42,206
(1) Each platform of an articulated car is treated as a separate unit.(2) Railcar equipment held for sale consists mainly of railcars that will either be sold or refurbished and placed on lease.
A substantial portion of the equipment in the leasefleet has been acquired through an agreemententered into in August 1990 with Southern PacificTransportation Company, which has since mergedwith Union Pacific, to purchase and refurbish and approximately 10,000 railcars over a five-year period.The railcars were refurbished to predeterminedspecifications by Greenbrier or unaffiliated contractshops and placed on predominantly 10-year financeleases with Union Pacific with a purchase optionexercisable upon lease expiration. The company hasreceived notification that Union Pacific intends toexercise this option.
Raw Materials and ComponentsProducts manufactured at Greenbrier facilitiesrequire a supply of raw materials including steel andnumerous specialty components such as brakes,wheels and axles. Approximately 50% of the cost ofeach freight car represents specialty componentspurchased from third-parties. Customers oftenspecify particular components and suppliers of suchcomponents. Although the number of alternativesuppliers of certain specialty components hasdeclined in recent years, there are at least twosuppliers for most such components. Inventory levels are continually monitored to ensure adequatesupport of production. Advance purchases areperiodically made to avoid possible shortages ofmaterial due to capacity limitations of component

The Greenbrier Companies 2001 Form 10-K 7
suppliers and possible price increases. Binding long-term contracts with suppliers are not typicallyentered into as the Company relies on establishedrelationships with major suppliers to ensure theavailability of raw materials and specialty items.Fluctuations in the price of components and rawmaterials have not had a material effect on earningsand are not anticipated to have a material effect inthe foreseeable future.
In Europe, certain railcars are manufactured by sub-contractors. The Company believes that alternativesare available should these subcontractors be unableto perform.
In 2001, approximately 53% of domestic require-ments for steel were purchased from Oregon SteelMills, Inc., approximately 78% of the Company’sCanadian requirements were purchased from AlgomaSteel, Inc., and approximately 24% of the Company’sEuropean requirements were purchased from HutaPokoj. The top ten suppliers for all inventorypurchases accounted for approximately 41% of totalpurchases, of which no supplier accounted for morethan 10%. The Company maintains good relation-ships with its suppliers and has not experienced anysignificant interruptions in recent years in the supplyof raw materials or specialty components. A memberof the Canadian subsidiary’s board of directors servesas chairman of the board of directors of AlgomaSteel, Inc.
Marketing and Product DevelopmentA fully-integrated marketing and sales effort isutilized whereby Greenbrier seeks to leveragerelationships developed in its various manufacturingand leasing & services operations to providecustomers with a diverse range of equipment andfinancing alternatives designed to satisfy acustomer’s unique needs. These custom programsmay involve a combination of railcar products andfinancing, leasing, refurbishing and re-marketingservices, depending on whether the customer isbuying new equipment, refurbishing existingequipment, or seeking to outsource the maintenanceor management of equipment.
Through customer relationships, insights are derivedinto the potential need for new products andservices. Marketing and engineering personnelcollaborate to evaluate opportunities and identify anddevelop new products. Research and developmentcosts incurred for new product development during2001, 2000 and 1999 were $3.4 million, $2.3 million,and $1.1 million.
Customers and BacklogManufacturing and leasing & services customersinclude Class I Railroads, regional and short linerailroads, other leasing companies, shippers, carriersand other transportation companies.
The Company's backlog:
August 31,
2001 2000 1999
New railcarbacklog units(1) 3,700 7,800 4,000
Estimated value(in millions) $ 200 $ 440 $ 271
(1) Each platform of an articulated car is treated as a separate unit.
The backlog is based on customer purchase or leaseorders that the Company believes are firm. Customerorders, however, may be subject to cancellation and other customary industry terms and conditions.Historically, little variation has been experiencedbetween the number of railcars ordered and thenumber of railcars actually sold. The backlog is notnecessarily indicative of future results of operations.Payment for railcars manufactured is typicallyreceived when the cars are completed and acceptedby a third-party customer.
In 2001, sales to the two largest customers, BNSF and TTX Company, accounted for 22.6% and 18.6% of total revenues and 23.8% and 21.9% ofmanufacturing revenues. Revenues from UnionPacific and BNSF accounted for approximately 31.4% and 18.5% of leasing & services revenues.No other customers accounted for more than 10% oftotal manufacturing or leasing & services revenues.

8 2001 Form 10-K The Greenbrier Companies
CompetitionGreenbrier is affected by a variety of competitor sin each of its principal business activities. Thereare currently six major railcar manufacturerscompeting in North America. Two of these producersbuild railcars principally for their own fleets and fourproducers — Trinity Industries, Inc., JohnstownAmerica Corp., National Steel Car, Ltd. and theCompany — compete principally in the generalrailcar market. Some of these producers havesubstantially greater resources than the Company.Two of the Company’s largest competitors, Thrall CarManufacturing Company and Trinity Industries, Inc.have recently completed a merger; the effects of thismerger on the Company are not known at this time.Greenbrier competes on the basis of type of product,reputation for quality, price, reliability of deliveryand customer service and support. Competition inEurope, with 20 to 30 railcar producers, is morefragmented than in North America.
In railcar leasing, principal competitors in NorthAmerica include Bombardier Rail Capital, The CITGroup, First Union Rail, GATX Corporation andGeneral Electric Railcar Services. Greenbrier doesnot currently provide significant leasing services inEurope.
Patents and TrademarksGreenbrier pursues a proactive program forprotection of intellectual property resulting from its research and development efforts. Greenbrier has obtained patent and trademark protection forsignificant intellectual property as it relates to itsmanufacturing business. The Company holds severalUnited States and foreign patents of varying durationand has several patent applications pending.
Environmental MattersThe Company is subject to national, state, provincialand local environmental laws and regulationsconcerning, among other matters, air emissions,wastewater discharge, solid and hazardous wastedisposal and employee health and safety. Greenbriermaintains an active program of environmentalcompliance and believes that its current operations
are in material compliance with all applicablenational, state, provincial and local environmentallaws and regulations. Prior to acquiringmanufacturing facilities, the Company conductsinvestigations to evaluate the environmentalcondition of subject properties and negotiatescontractual terms for allocation of environmentalexposure arising from prior uses. Upon commencingoperations at acquired facilities, the Companyendeavors to implement environmental practices,which are at least as stringent as those mandated byapplicable laws and regulations.
Environmental studies have been conducted ofowned and leased properties that indicate additionalinvestigation and some remediation may benecessary. The Portland, Oregon, manufacturingfacility is located on the Willamette River. TheUnited States Environmental Protection Agency (the EPA) has classified portions of the river bed,including the portion fronting the facility, as afederal “national priority list” or “superfund” site dueto sediment contamination. The Company and morethan 60 other parties have received a “GeneralNotice” of potential liability from the EPA. There isno indication that the Company has contributed tocontamination of the Willamette River bed, althoughuses by prior owners of the property may havecontributed. Nevertheless, this classification of theWillamette River may have an impact on the value of the Company’s investment in the property and hasresulted in the Company initially bearing a portion ofthe cost of an EPA mandated remedial investigation.The cost of the investigation is currently notdeterminable however, some or all of any suchoutlay may be recoverable from responsible parties.The Company may be required to perform periodicmaintenance dredging in order to continue to launchvessels from its launch ways on the river, andclassification as a superfund site could result in somelimitations on future launch activity. The outcome ofsuch actions cannot be estimated. Managementbelieves that the Company’s operations adhere tosound environmental practices, applicable laws andregulations.
RegulationThe Federal Railroad Administration (the FRA) in the United States and Transport Canada in Canadaadminister and enforce laws and regulations relatingto railroad safety. These regulations govern

The Greenbrier Companies 2001 Form 10-K 9
equipment and safety appliance standards for freightcars and other rail equipment used in interstatecommerce. The Association of American Railroads(the AAR) also promulgates a wide variety of rulesand regulations governing the safety and design ofequipment, relationships among railroads withrespect to railcars in interchange and other matters.The AAR also certifies railcar builders andcomponent manufacturers that provide equipmentfor use on North American railroads. The effect ofthese regulations is that the Company must maintainits certifications with the AAR as a railcar builderand component manufacturer, and products sold andleased by the Company in North America must meetAAR, Transport Canada and FRA standards.
In Europe, many countries have deregulated theirrailroads, and the privatization process is underway.However, each country currently has its ownregulatory body with different certificationrequirements. To address cross-border issues, theEuropean Union has proposed international railroutes that would run on a common standard withfew customs restrictions. However, there can be noassurance that such standards will be adopted.
Executive Officers of the CompanyThe following are the executive officers of theCompany.
Alan James, 71, is Chairman of the Board of Directorsof Greenbrier, a position he has held since 1994. Mr. James was President of Greenbrier, or itspredecessor company, from 1974 to 1994.
William A. Furman, 57, is President, Chief ExecutiveOfficer and a director of Greenbrier, positions he has held since 1994. Mr. Furman is also ManagingDirector of TrentonWorks Limited and Chairman ofthe Board of Directors of WagonySwidnica, S.A. Mr. Furman was Chief Executive Officer ofGunderson from 1989 to 2000 and was Vice Presidentof Greenbrier, or its predecessor company, from 1974to 1994. Mr. Furman serves as a director of SchnitzerSteel Industries, Inc., a steel recycling andmanufacturing company.
Robin D. Bisson, 47, has been Senior Vice PresidentMarketing and Sales since 1996 and President ofGreenbrier Railcar, Inc., a subsidiary that engages in railcar leasing, since 1991. Mr. Bisson was VicePresident of Greenbrier Railcar, Inc. from 1987 to1991 and has been Vice President of GreenbrierLeasing Corporation, a subsidiary that engages inrailcar leasing, since 1987.
Larry G. Brady, 62, is Senior Vice President and Chief Financial Officer of the Company. Prior tobecoming Senior Vice President in 1998, he was Vice President and Chief Financial Officer since1994. Mr. Brady has been Senior Vice President ofGreenbrier Leasing Corporation since he joined theCompany in 1991. From 1974 to 1990, he was apartner with Touche Ross & Co. (which subsequentlybecame Deloitte & Touche LLP).
Richard McKay, 56, has been President of GreenbrierEurope since June 2001. Mr. McKay is also Presidentof TrentonWorks, a position he has held since 1996.From 1986 to 1996 he was general manager andmember of the Board of Directors for NavistarCorporation, the former International HarvesterCompany.
A. Daniel O’Neal, Jr., 65, has been a director ofGunderson, Inc. since 1985 and serves as a directorof the Company. From 1973 until 1980, Mr. O’Nealserved as a commissioner of the InterstateCommerce Commission, and from 1977 until 1980served as its Chairman. He is currently a director of Powertech Group, a computer services company.Mr. O’Neal has been Chairman of Washington State’sFreight Mobility Board since being appointed by theGovernor in 1998.
Mark J. Rittenbaum, 44, is Senior Vice President andTreasurer of the Company, a position he has heldsince June 2001. Prior to becoming Senior VicePresident, he has been Vice President and Treasurersince 1994. Mr. Rittenbaum is also Vice President of Greenbrier Leasing Corporation and GreenbrierRailcar, Inc., positions he has held since 1993 and 1994.
Timothy A. Stuckey, 51, has been President ofGunderson Rail Services since 1999 and President ofAutostack Corporation since 1992, prior to which heserved as Executive Vice President of Autostack since1990, and Assistant Vice President of GreenbrierLeasing Corporation since 1987.
Norriss M. Webb, 61, is Executive Vice President andGeneral Counsel of the Company, a position he hasheld since 1994. He is also Vice President, Secretaryand a director of Gunderson, Inc. Mr. Webb was VicePresident of the Company from 1981 to 1994.

10 2001 Form 10-K The Greenbrier Companies
Item 2. PROPERTIESThe Company operates at the following facilities in North America and Europe as of August 31, 2001:
Description Size Location Status
Railcar and marine 75 acres including 774,000 sq. ft. Portland, Oregon Owned manufacturing facility of manufacturing space and a
750-ft. side-launch ways for launching ocean going vessels
Railcar manufacturing and 100 acres with 800,000 sq. ft. Trenton, Nova Scotia Owned forge facility of manufacturing space as well
as a forge facility
Railcar manufacturing facility 88 acres with 676,000 sq. ft. Swidnica, Poland Owned of manufacturing space
Railcar manufacturing and 461,991 sq. ft. of manufacturing Sahagun, Mexico Leased(1)
wheel reconditioning shop space, which includes a 152,245 sq. ft. wheel reconditioning shop
Railcar repair facility 70 acres Cleburne, Texas Leased
Railcar repair facility 40 acres Finley, Washington Leased
Railcar repair facility 18 acres Atchison, Kansas Owned
Railcar repair facility 5.4 acres Springfield, Oregon Leased
Railcar repair facility 2.5 acres Modesto, California Leased
Railcar repair facility 145,800 sq. ft. Golden, Colorado Leased
Wheel reconditioning shop 4.6 acres Tacoma, Washington Leased
Wheel reconditioning shop 20,000 sq. ft. Pine Bluff, Arkansas Leased
Executive offices, railcar 37,000 sq. ft. Lake Oswego, Oregon Leased marketing and leasing activities(1) The property in Sahagun, Mexico, is leased from Bombardier Transportation, Greenbrier’s joint venture partner.
L. Clark Wood, 59, has been President ofManufacturing Operations since 1998, ChiefExecutive Officer and a director of Gunderson, Inc.since 2000 and Chief Executive Officer ofTrentonWorks Limited since 1995. Mr. Wood wasPresident of Gunderson, Inc. from 1990 to 1999 andwas Vice President and Director of Railcar Sales atTrinity Industries, Inc., a railroad freight carmanufacturer, from 1985 to 1990.
Executive officers are elected by the Board ofDirectors. There are no family relationships amongany of the executive officers of the Company. Mr. James, Chairman of the Board of Directors,and Mr. Furman have entered into a Stockholders’Agreement pursuant to which they have agreed,among other things, to vote as directors to elect Mr. Furman as President and Chief Executive Officerof the Company, Mr. James as Chairman, and certainpersons as executive officers and each to vote for theother and for the remaining existing directors inelecting directors of the Company.
EmployeesAs of August 31, 2001, Greenbrier had 2,769 full-timeemployees, consisting of 2,666 employees engaged inrailcar and marine manufacturing, and railcarservices, and 103 employees engaged in leasing &services activities. A total of 607 employees at themanufacturing facility in Trenton, Nova Scotia,Canada are covered by collective bargainingagreements. In addition, 415 employees at themanufacturing facility in Swidnica, Poland are alsocovered by collective bargaining agreements that can be terminated by either party with three monthsnotice. A stock incentive plan and a stock purchaseplan are available for all North American employees.A discretionary bonus program is maintained forsalaried and most hourly employees not covered by collective bargaining agreements. Greenbrierbelieves that its relations with its employees aregenerally good.

The Greenbrier Companies 2001 Form 10-K 11
Marketing, administrative offices and other facilitiesare also leased in various locations throughout NorthAmerica and Europe. Greenbrier believes that itsfacilities are in good condition and that the facilities,together with anticipated capital improvements andadditions, are adequate to meet its operating needsfor the foreseeable future. The need for expansionand upgrading of the railcar manufacturing andrefurbishment facilities is continually evaluated inorder to remain competitive and to take advantage ofmarket opportunities.
Item 3. LEGAL PROCEEDINGSFrom time to time, Greenbrier is involved as adefendant in litigation in the ordinary course ofbusiness, the outcome of which cannot be predictedwith certainty. In addition, litigation has beeninitiated by former shareholders of InteramericanLogistics, Inc. (Interamerican), which was acquired in the fall of 1996. The plaintiffs allege thatGreenbrier violated the agreements pursuant towhich it acquired ownership of Interamerican andseek damages aggregating $4.5 million Canadian.Management believes the claim is without merit andintends to vigorously defend its position.Accordingly, management believes that any ultimateliability resulting from litigation will not materiallyaffect the financial position, results of operations orcash flows of the Company.
Item 4. SUBMISSION OF MATTERS TO A VOTE OF SECURITYHOLDERSNone.
PART IIItem 5. MARKET FOR REGISTRANT’S COMMON EQUITY ANDRELATED STOCKHOLDER MATTERSGreenbrier’s common stock has been traded on theNew York Stock Exchange under the symbol GBXsince July 14, 1994. There were approximately 470 holders of record of common stock as of October 31, 2001. The following table shows thereported high and low sales price of Greenbrier’scommon stock on the New York Stock Exchange.
High Low
2001Fourth quarter $ 9.55 $ 8.30Third quarter $ 9.85 $ 8.15Second quarter $ 10.30 $ 8.13First quarter $ 10.19 $ 8.13
2000Fourth quarter $ 9.25 $ 7.25Third quarter $ 8.44 $ 7.00Second quarter $ 10.63 $ 8.06First quarter $ 11.38 $ 9.69
A quarterly dividend of $0.06 per common share wasdeclared in November 2001, to be paid in December.Cash dividends have been paid quarterly on thecommon stock since December 1994. There is noassurance as to future dividends as they are depend-ent upon future earnings, capital requirements andfinancial condition.
12 2001 Form 10-K The Greenbrier Companies
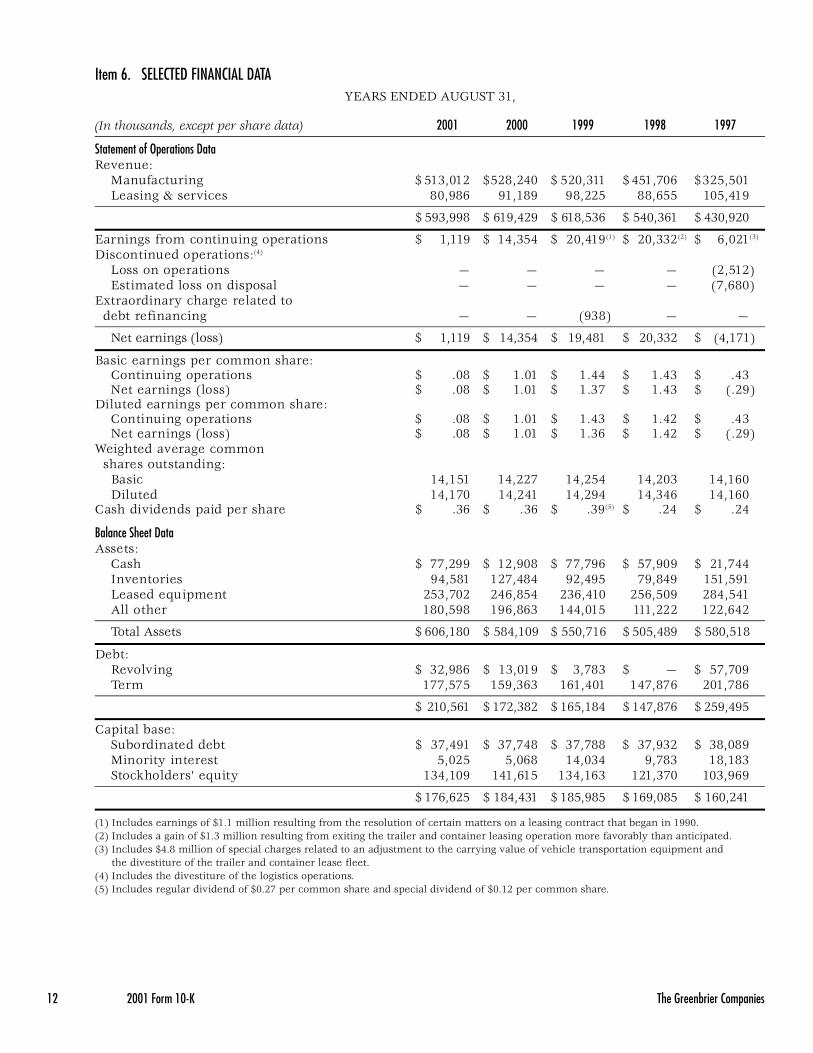
Item 6. SELECTED FINANCIAL DATAYEARS ENDED AUGUST 31,
(In thousands, except per share data) 2001 2000 1999 1998 1997
Statement of Operations DataRevenue:
Manufacturing $ 513,012 $528,240 $ 520,311 $ 451,706 $325,501Leasing & services 80,986 91,189 98,225 88,655 105,419
$ 593,998 $ 619,429 $ 618,536 $ 540,361 $ 430,920
Earnings from continuing operations $ 1,119 $ 14,354 $ 20,419(1) $ 20,332(2) $ 6,021(3)
Discontinued operations:(4)
Loss on operations — — — — (2,512)Estimated loss on disposal — — — — (7,680)
Extraordinary charge related todebt refinancing — — (938) — —
Net earnings (loss) $ 1,119 $ 14,354 $ 19,481 $ 20,332 $ (4,171)
Basic earnings per common share:Continuing operations $ .08 $ 1.01 $ 1.44 $ 1.43 $ .43Net earnings (loss) $ .08 $ 1.01 $ 1.37 $ 1.43 $ (.29)
Diluted earnings per common share:Continuing operations $ .08 $ 1.01 $ 1.43 $ 1.42 $ .43Net earnings (loss) $ .08 $ 1.01 $ 1.36 $ 1.42 $ (.29)
Weighted average commonshares outstanding:
Basic 14,151 14,227 14,254 14,203 14,160Diluted 14,170 14,241 14,294 14,346 14,160
Cash dividends paid per share $ .36 $ .36 $ .39(5) $ .24 $ .24
Balance Sheet DataAssets:
Cash $ 77,299 $ 12,908 $ 77,796 $ 57,909 $ 21,744Inventories 94,581 127,484 92,495 79,849 151,591Leased equipment 253,702 246,854 236,410 256,509 284,541All other 180,598 196,863 144,015 111,222 122,642
Total Assets $ 606,180 $ 584,109 $ 550,716 $ 505,489 $ 580,518
Debt:Revolving $ 32,986 $ 13,019 $ 3,783 $ — $ 57,709Term 177,575 159,363 161,401 147,876 201,786
$ 210,561 $ 172,382 $ 165,184 $ 147,876 $ 259,495
Capital base:Subordinated debt $ 37,491 $ 37,748 $ 37,788 $ 37,932 $ 38,089Minority interest 5,025 5,068 14,034 9,783 18,183Stockholders’ equity 134,109 141,615 134,163 121,370 103,969
$ 176,625 $ 184,431 $ 185,985 $ 169,085 $ 160,241
(1) Includes earnings of $1.1 million resulting from the resolution of certain matters on a leasing contract that began in 1990.(2) Includes a gain of $1.3 million resulting from exiting the trailer and container leasing operation more favorably than anticipated.(3) Includes $4.8 million of special charges related to an adjustment to the carrying value of vehicle transportation equipment and
the divestiture of the trailer and container lease fleet.(4) Includes the divestiture of the logistics operations.(5) Includes regular dividend of $0.27 per common share and special dividend of $0.12 per common share.

The Greenbrier Companies 2001 Form 10-K 13
Item 7. MANAGEMENT’S DISCUSSION AND ANALYSIS OFFINANCIAL CONDITION AND RESULTS OF OPERATIONSGreenbrier currently operates in two primarybusiness segments: manufacturing and leasing &services. The two business segments are operationallyintegrated. With operations in North America andEurope, the manufacturing segment produces double-stack intermodal railcars, conventional railcars,marine vessels and forged steel products andperforms railcar refurbishment and maintenanceactivities. In Europe, the Company also manufacturesnew freight cars through the use of unaffiliatedsubcontractors. The leasing & services segment owns or manages approximately 42,000 railcars forrailroads, institutional investors and other leasingcompanies.
Railcars are generally manufactured under firmorders from third parties, and revenue is recognizedwhen the cars are completed and accepted by thecustomer. From time to time, Greenbrier commits tomanufacture railcars prior to receipt of firm orders tomaintain continuity of manufacturing operations andmay also build railcars for its own lease fleet. Railcarsproduced in a given period may be delivered insubsequent periods, delaying revenue recognition.Revenue does not include sales of new railcars to, orrefurbishment services performed for, the leasing &services segment since intercompany transactions areeliminated in preparing the consolidated financialstatements. The margin generated from such sales orrefurbishment activity is realized by the leasing &services segment over the related life of the asset orupon sale of the equipment.
OverviewTotal revenues were $594.0 million, $619.4 million,and $618.5 million for the years ended 2001, 2000,and 1999. Revenues decreased $25.4 million from2000 to 2001 as a result of a manufacturing productmix with lower unit sales values, competitivepressure on railcar prices, and lower leasing &services revenues, offset somewhat by increasedrevenue in Europe due to an entire year of operationsfrom an acquisition completed in January 2000. The$0.9 million increase from 1999 to 2000 was due toincreased revenues from European manufacturingoperations as a result of an acquisition completed inJanuary 2000, offset by lower leasing & servicesrevenue.
Net earnings for 2001 were $1.1 million, or $.08 perdiluted common share, compared to 2000 netearnings of $14.4 million, or $1.01 per dilutedcommon share, and to 1999 net earnings of $19.5 million, or $1.36 per diluted common share.Earnings for 1999 include $1.1 million from theresolution of certain matters on a leasing contractthat began in 1990 and an after-tax extraordinarycharge of $0.9 million, or $0.07 per diluted commonshare, resulting from refinancing $22.0 million ofnotes payable.
Expansion and AcquisitionsIn January 2000, Greenbrier completed the purchaseof the Freight Wagon Division of DaimlerChrysler Rail Systems located in Siegen, Germany. Theacquired operation provides expertise in the fields ofengineering, design, sales and marketing and projectmanagement. It also includes a comprehensiveportfolio of railcar designs for various countrieswithin the European marketplace, which enhancedproduction at Greenbrier’s Polish manufacturingfacility. Results of the acquired operation, whichinclude the sale of freight cars manufactured byunaffiliated subcontractors, have been included in theaccompanying financial statements from the date of acquisition.
In September 1998, Greenbrier acquired a 60.0%interest in a railcar manufacturer located in Swidnica,Poland. Through a series of subsequent transactions,the ownership interest was increased to 97.5%. Theacquisition was accounted for by the purchasemethod, and operating results are included in theconsolidated financial statements from the date ofacquisition.
Also, in September 1998, Greenbrier entered intoa joint venture with Bombardier Transportation tobuild railroad freight cars at Bombardier’s existingmanufacturing facility in Mexico. Each party holds a50.0% non-controlling interest in the joint venture,and therefore Greenbrier’s investment is beingaccounted for using the equity method. Greenbrier’sshare of operating results is included in operatingresults as equity in earnings of unconsolidatedsubsidiary.
Effective September 1, 1999, Greenbrier acquired thecommon equity of the minority investor’s interest inthe Canadian manufacturing subsidiary.

14 2001 Form 10-K The Greenbrier Companies
Results of Operations
Manufacturing SegmentManufacturing revenues include results from new railcar, marine, forge, refurbishment andmaintenance activities. New railcar delivery andbacklog information disclosed herein includes allfacilities, including the joint venture in Mexico that is accounted for by the equity method.
Manufacturing revenues were $513.0 million, $528.2 million and $520.3 million for the yearsended 2001, 2000, and 1999. Manufacturing revenuesdecreased $15.2 million, or 2.9%, in 2001 from 2000due to a change in product mix to units with a lowersales value and competitive pressure on prices in theNorth American market, partially offset by increasedEuropean revenues resulting from the operationacquired in January 2000. Manufacturing revenuesincreased $7.9 million, or 1.5%, in 2000 from 1999due to an increase in European revenues resultingfrom the newly acquired operation and a shift inproduct mix to units with a relatively higher salesvalue, partially offset by reduced volume due tomarket conditions. Deliveries of new railcars,which are the primary source of revenue, wereapproximately 8,600 in 2001, 8,100 in 2000, and 8,900 in 1999.
As of August 31, 2001, the backlog of new railcars tobe manufactured for sale and lease at all facilities was approximately 3,700 railcars with an estimatedvalue of $200 million compared to 4,600 railcarsvalued at $230 million as of May 31, 2001. Thereduction in backlog is reflective of the overall North American industry decline in demand for new railcars. If market conditions remain soft,utilization of the Company’s manufacturing capacity could be further impacted.
Manufacturing gross margin decreased to 8.3% in2001 from 11.7% in 2000 due primarily to reductionsin selling prices resulting from increased competitionin a softening North American market and productionproblems on certain car types. The effects ofincreased competition on selling prices were also thecause of the decline from 12.3% in 1999 to 11.7% in2000. The factors influencing cost of revenue andgross margin in a given period include order size(which affects economies of plant utilization), productmix, changes in manufacturing costs, product pricingand currency exchange rates.
Leasing & Services SegmentLeasing & services revenues were $81.0 million, $91.2 million and $98.2 million for the years ended2001, 2000 and 1999. The decrease in leasing &service revenue is due to a number of factorsincluding increased pressure on lease rates resultingfrom economic and competitive factors, initiation andcompletion of contracts, sales of equipment from the lease fleet and maturation of the finance leaseportfolio. Leasing & services operating margin as apercentage of revenue was 46.5% in 2001 compared to 48.8% in 2000 and 50.4% in 1999. The utilization ofthe owned lease fleet was 92.6% for 2001, 90.4% for2000 and 97.0% for 1999.
Pre-tax earnings realized on the disposition of leasedequipment amounted to $1.4 million during 2001compared to $4.5 million in 2000 and $5.7 million in 1999. Assets from Greenbrier’s lease fleet areperiodically sold in the normal course of business inorder to take advantage of market conditions, managerisk and maintain liquidity.
Other costsSelling and administrative expense was $49.5 million,$54.2 million and $51.1 million in 2001, 2000 and1999. As a percentage of revenue, selling andadministrative expense was 8.3%, 8.8% and 8.3% in 2001, 2000 and 1999. The $4.7 million decreasefrom 2000 to 2001 is due primarily to cost reductionmeasures including decreases in incentivecompensation, consolidation of facilities, reductionsin work force and other costs, partially offset by anentire year of expenses for the European operationsacquired in January 2000 and increased research anddevelopment costs. The increase of $3.1 million in2000 compared to 1999 is due primarily to theaddition of the European operations and increasedresearch and development costs, partially offset bycost reduction measures.
Interest expense increased $1.1 million, or 5.2%, to$22.3 million for 2001 as compared to $21.2 million in2000 as a result of increased borrowings in Europe tosupport additional production. Interest expenseincreased $2.2 million, or 11.6%, to $21.2 million for2000 as compared to $19.0 million in 1999 as a resultof both increased borrowings and cost of borrowingsto support European operations.
Income tax expense for all periods presentedrepresents an effective tax rate of 42.0% on UnitedStates operations and varying effective tax rates onforeign operations. The consolidated effective tax rateof 79.9% in the current period is a result of Europeanoperating losses for which no tax benefit has beenrecognized. The consolidated effective tax rate for2000 and 1999 was 51.8% and 48.1%.
The Greenbrier Companies 2001 Form 10-K 15
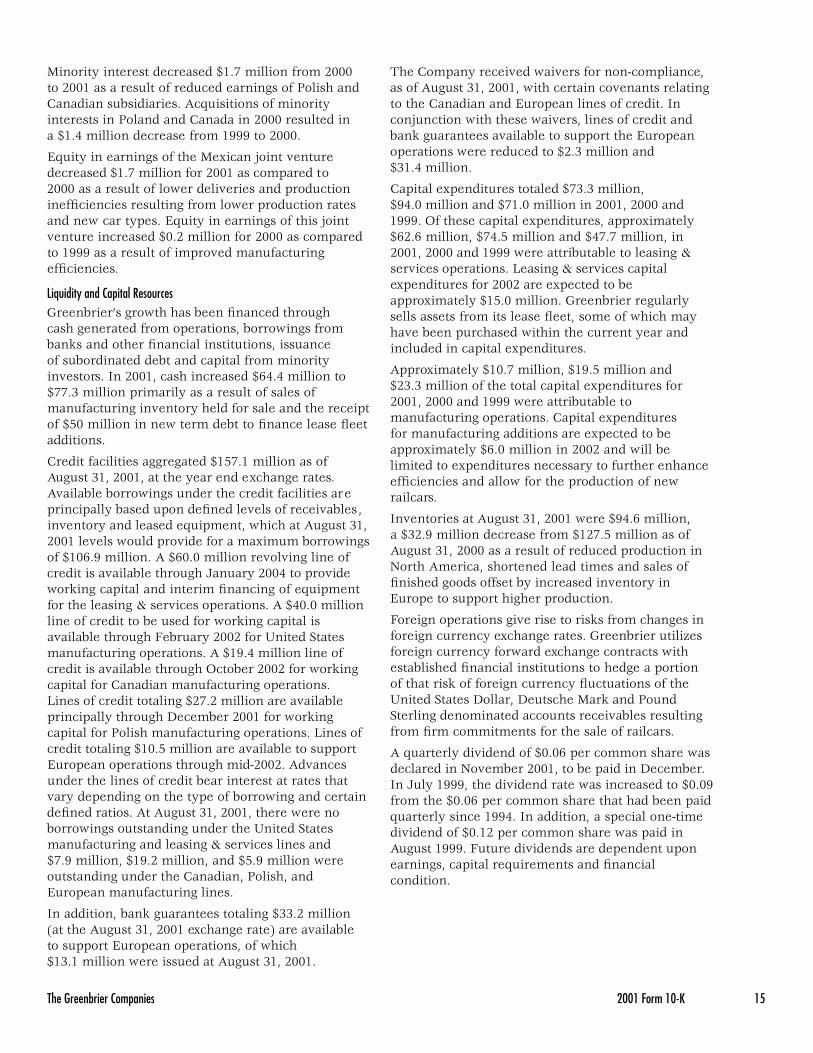
Minority interest decreased $1.7 million from 2000 to 2001 as a result of reduced earnings of Polish andCanadian subsidiaries. Acquisitions of minorityinterests in Poland and Canada in 2000 resulted in a $1.4 million decrease from 1999 to 2000.
Equity in earnings of the Mexican joint venturedecreased $1.7 million for 2001 as compared to2000 as a result of lower deliveries and productioninefficiencies resulting from lower production ratesand new car types. Equity in earnings of this jointventure increased $0.2 million for 2000 as comparedto 1999 as a result of improved manufacturingefficiencies.
Liquidity and Capital ResourcesGreenbrier’s growth has been financed through cash generated from operations, borrowings frombanks and other financial institutions, issuance of subordinated debt and capital from minorityinvestors. In 2001, cash increased $64.4 million to$77.3 million primarily as a result of sales ofmanufacturing inventory held for sale and the receiptof $50 million in new term debt to finance lease fleetadditions.
Credit facilities aggregated $157.1 million as of August 31, 2001, at the year end exchange rates.Available borrowings under the credit facilities areprincipally based upon defined levels of receivables,inventory and leased equipment, which at August 31,2001 levels would provide for a maximum borrowingsof $106.9 million. A $60.0 million revolving line ofcredit is available through January 2004 to provideworking capital and interim financing of equipmentfor the leasing & services operations. A $40.0 millionline of credit to be used for working capital isavailable through February 2002 for United Statesmanufacturing operations. A $19.4 million line ofcredit is available through October 2002 for workingcapital for Canadian manufacturing operations.Lines of credit totaling $27.2 million are availableprincipally through December 2001 for workingcapital for Polish manufacturing operations. Lines ofcredit totaling $10.5 million are available to supportEuropean operations through mid-2002. Advancesunder the lines of credit bear interest at rates thatvary depending on the type of borrowing and certaindefined ratios. At August 31, 2001, there were noborrowings outstanding under the United Statesmanufacturing and leasing & services lines and $7.9 million, $19.2 million, and $5.9 million wereoutstanding under the Canadian, Polish, andEuropean manufacturing lines.
In addition, bank guarantees totaling $33.2 million (at the August 31, 2001 exchange rate) are available to support European operations, of which $13.1 million were issued at August 31, 2001.
The Company received waivers for non-compliance,as of August 31, 2001, with certain covenants relatingto the Canadian and European lines of credit. Inconjunction with these waivers, lines of credit andbank guarantees available to support the Europeanoperations were reduced to $2.3 million and $31.4 million.
Capital expenditures totaled $73.3 million, $94.0 million and $71.0 million in 2001, 2000 and1999. Of these capital expenditures, approximately $62.6 million, $74.5 million and $47.7 million, in2001, 2000 and 1999 were attributable to leasing &services operations. Leasing & services capitalexpenditures for 2002 are expected to beapproximately $15.0 million. Greenbrier regularlysells assets from its lease fleet, some of which mayhave been purchased within the current year andincluded in capital expenditures.
Approximately $10.7 million, $19.5 million and $23.3 million of the total capital expenditures for2001, 2000 and 1999 were attributable tomanufacturing operations. Capital expenditures for manufacturing additions are expected to beapproximately $6.0 million in 2002 and will be limited to expenditures necessary to further enhanceefficiencies and allow for the production of newrailcars.
Inventories at August 31, 2001 were $94.6 million, a $32.9 million decrease from $127.5 million as ofAugust 31, 2000 as a result of reduced production inNorth America, shortened lead times and sales offinished goods offset by increased inventory inEurope to support higher production.
Foreign operations give rise to risks from changes inforeign currency exchange rates. Greenbrier utilizesforeign currency forward exchange contracts withestablished financial institutions to hedge a portion of that risk of foreign currency fluctuations of theUnited States Dollar, Deutsche Mark and PoundSterling denominated accounts receivables resultingfrom firm commitments for the sale of railcars.
A quarterly dividend of $0.06 per common share wasdeclared in November 2001, to be paid in December.In July 1999, the dividend rate was increased to $0.09from the $0.06 per common share that had been paidquarterly since 1994. In addition, a special one-timedividend of $0.12 per common share was paid inAugust 1999. Future dividends are dependent uponearnings, capital requirements and financialcondition.

16 2001 Form 10-K The Greenbrier Companies
Certain loan covenants restrict the transfer of fundsfrom subsidiaries to the parent company in the formof cash dividends, loans, or advances. The restrictednet assets of subsidiaries amounted to $86.2 millionas of August 31, 2001. Consolidated retained earningsof $4.7 million at August 31, 2001 were restricted as to the payment of dividends. Management expectsexisting funds and cash generated from operations,together with borrowings under existing creditfacilities and long term financing, to be sufficient tofund dividends, stock repurchases, working capitalneeds, planned capital expenditures, acquisitions andexpected debt repayments.
In July 2000, Greenbrier’s Board of Directorsauthorized a stock repurchase program under whichthe Company may repurchase up to $5.0 million inshares of its outstanding common stock in open-market transactions, from time to time. As of August 31, 2001, the Company had repurchasedapproximately 106 thousand shares at a purchaseprice totaling $1.0 million.
Prospective Accounting ChangesIn July 2001, the Financial Accounting StandardsBoard (FASB) issued Statement of FinancialAccounting Standards (SFAS) No. 141, BusinessCombinations. The statement discontinues the use of the pooling of interests method of accounting forbusiness combinations. The statement is effective forall business combinations after June 30, 2001. TheCompany has completed an evaluation of the effectsof this statement and does not believe it will have amaterial impact on the consolidated financialstatements.
In July 2001, the FASB issued SFAS No. 142, Goodwilland Other Intangible Assets. The statement willrequire discontinuing the amortization of goodwilland other intangible assets with indefinite usefullives. Instead, these assets will be tested periodicallyfor impairment and written down to their fair marketvalues as necessary. This statement is effective forfiscal years beginning after December 15, 2001. TheCompany is currently evaluating the impact of thisstatement.
In October 2001, the FASB issued SFAS No. 144,Accounting for the Impairment or Disposal of Long-Lived Assets, which is effective for fiscal yearsbeginning after December 15, 2001. SFAS 144addresses accounting and reporting of long-livedassets, except goodwill, that are either held and usedor disposed or through sale or other means. TheCompany is currently evaluating the impact of thisstatement on the consolidated financial statements.
Item 7a. QUANTITATIVE AND QUALITATIVE DISCLOSURES ABOUTMARKET RISKGreenbrier has assessed its exposure to market risk for its variable rate debt and foreign currencyexposures and believes that exposures to such risksare not material. Foreign operations give rise tomarket risks from changes in foreign currencyexchange rates. Greenbrier utilizes foreign currencyforward exchange contracts with established financialinstitutions to hedge a portion of that risk. Althoughforward exchange contracts are entered into tomitigate the impact of currency fluctuations, certainexposure remains that may affect operating results.No provision has been made for credit loss due tocounterparty non-performance.
At August 31, 2001 exchange rates, forward exchangecontracts outstanding for the sales of United StatesDollars totaled $18.5 million, Deutsche Marks totaled$9.4 million and Pounds Sterling totaled $6.5 millionThe fair value of these cash flow hedges at August 31,2001 as compared to the carrying amount resulted inan unrealized pre-tax loss of $.2 million. Thesecontracts mature at various dates through May 2002,any such loss remaining will be recognized alongwith the related transactions.
Interest rate swap agreements are utilized to reducethe impact of changes in interest rates on certaindebt. The net cash amounts paid or received on theagreements are accrued and recognized as anadjustment to interest expense. At August 31, 2001,such agreements had a notional amount of $95.9 million and mature between August 2006 and March 2013.

The Greenbrier Companies 2001 Form 10-K 17
Item 8. FINANCIAL STATEMENTS AND SUPPLEMENTARY DATA
Consolidated Balance SheetsAUGUST 31,
(In thousands, except per share amounts) 2001 2000
AssetsCash and cash equivalents $ 77,299 $ 12,908Accounts and notes receivable 50,555 66,150Inventories 94,581 127,484Investment in direct finance leases 103,576 124,780Equipment on operating leases 150,126 122,074Property, plant and equipment 76,898 77,628Intangible assets 26,450 23,001Other 26,695 30,084
$ 606,180 $584,109
Liabilities and Stockholders’ EquityRevolving notes $ 32,986 $ 13,019Accounts payable and accrued liabilities 135,898 147,792Deferred participation 56,176 54,266Deferred income taxes 26,920 25,238Notes payable 177,575 159,363
Subordinated debt 37,491 37,748
Minority interest 5,025 5,068
Commitments and contingencies (Notes 20 & 21)
Stockholders’ equity:Preferred stock — $0.001 par value; 25,000 shares
authorized; none outstanding — —Common stock — $0.001 par value; 50,000 shares
authorized; 14,121 and 14,227 outstanding atAugust 31, 2001 and 2000 14 14
Additional paid-in capital 49,290 50,249Retained earnings 90,789 94,756Accumulated other comprehensive loss (5,984) (3,404)
134,109 141,615
$ 606,180 $584,109
The accompanying notes are an integral part of these financial statements.

18 2001 Form 10-K The Greenbrier Companies
Consolidated Statements of OperationsYEARS ENDED AUGUST 31,
(In thousands, except per share amounts) 2001 2000 1999
RevenueManufacturing $ 513,012 $528,240 $ 520,311Leasing & services 80,986 91,189 98,225
593,998 619,429 618,536
Cost of revenueManufacturing 470,376 466,348 456,122Leasing & services 43,295 46,711 48,682
513,671 513,059 504,804
Margin 80,327 106,370 113,732
Other CostsSelling and administrative expense 49,547 54,202 51,061Interest expense 22,257 21,165 19,048
71,804 75,367 70,109Earnings before income tax expense,
minority interest and equity in earnings (losses)of unconsolidated subsidiary 8,523 31,003 43,623
Income tax expense (6,806) (16,053) (20,979)
Earnings before minority interest and equityin earnings (losses) of unconsolidated subsidiary 1,717 14,950 22,644
Minority interest 43 (1,650) (3,045)Equity in earnings (losses) of unconsolidated subsidiary (641) 1,054 820
Earnings from continuing operations 1,119 14,354 20,419Extraordinary charge (net of $680 tax benefit) — — (938)
Net earnings $ 1,119 $ 14,354 $ 19,481
Basic earnings per common share:Continuing operations $ .08 $ 1.01 $ 1.44Extraordinary charge — — (.07)
Net earnings $ .08 $ 1.01 $ 1.37
Diluted earnings per common share:Continuing operations $ .08 $ 1.01 $ 1.43Extraordinary charge — — (.07)
Net earnings $ .08 $ 1.01 $ 1.36
Weighted average common shares:Basic 14,151 14,227 14,254Diluted 14,170 14,241 14,294
The accompanying notes are an integral part of these financial statements.

The Greenbrier Companies 2001 Form 10-K 19
Consolidated Statements of Stockholders’ Equity and Comprehensive Income
Accumulated Additional Other Total
(In thousands, except per Common Stock Paid-in Retained Comprehensive Stockholders’share amounts) Shares Amount Capital Earnings Loss Equity
Balance August 31, 1998 14,253 $ 14 $ 50,416 $ 71,612 $ (672) $ 121,370
Net earnings — — — 19,481 — 19,481
Translation adjustment (net of tax effect) — — — — (1,208) (1,208)
Comprehensive income 18,273
Stock options exercised 2 — 29 — — 29
Compensation relating tonon-qualified stock option plan — — 50 — — 50
Cash dividends ($0.39 per share) — — — (5,559) — (5,559)
Balance August 31, 1999 14,255 14 50,495 85,534 (1,880) 134,163
Net earnings — — — 14,354 — 14,354
Translation adjustment (net of tax effect) — — — — (1,524) (1,524)
Comprehensive income 12,830
Purchase of treasury stock (28) — (246) — — (246)
Cash dividends ($0.36 per share) — — — (5,132) — (5,132)
Balance August 31, 2000 14,227 14 50,249 94,756 (3,404) 141,615
Net earnings — — — 1,119 — 1,119
Translation adjustment (net of tax effect) — — — — (123) (123)
Cumulative effect of change in accounting principle (net of tax effect) — — — — 1,077 1,077
Loss on derivative financial instruments recognized in net earnings (net of tax effect) — — — — (1,434) (1,434)
Unrealized loss on derivativefinancial instruments (net of tax effect) — — — — (2,100) (2,100)
Comprehensive loss (1,461)
Purchase of treasury stock (106) — (959) — — (959)
Cash dividends ($0.36 per share) — — — (5,086) — (5,086)
Balance August 31, 2001 14,121 $ 14 $ 49,290 $ 90,789 $ (5,984) $ 134,109
The accompanying notes are an integral part of these financial statements.

20 2001 Form 10-K The Greenbrier Companies
Consolidated Statements of Cash FlowsYEARS ENDED AUGUST 31,
(In thousands) 2001 2000 1999
Cash flows from operating activities:Net earnings $ 1,119 $ 14,354 $ 19,481Adjustments to reconcile net earnings to net cash
provided by (used in) by operating activities:Extraordinary charge — — 938Deferred income taxes 1,682 7,604 6,470Deferred participation 1,910 3,827 5,196Depreciation and amortization 22,396 20,356 16,477Gain on sales of equipment (1,390) (4,527) (5,887)Other (1,891) 2,627 5,879
Decrease (increase) in assets:Accounts and notes receivable 15,595 (18,610) (2,713)Inventories 13,137 (39,249) (3,608)Other 6,976 (1,376) (879)
Decrease in liabilities:Accounts payable and accrued liabilities (18,118) (13,295) (2,961)
Net cash provided by (used in) operating activities 41,416 (28,289) 38,393
Cash flows from investing activities:Acquisitions, net of cash acquired (282) (4,787) (1,702)Principal payments received under direct
finance leases 20,761 18,313 16,729Investment in direct finance leases — (170) (446)Proceeds from sales of equipment 47,515 49,789 39,903Investment in joint venture (4,000) — (10,000)Purchase of property and equipment (73,336) (93,821) (70,531)
Net cash used in investing activities (9,342) (30,676) (26,047)
Cash flows from financing activities:Proceeds from borrowings 70,725 34,052 60,029Repayments of borrowings (32,363) (26,987) (46,958)Dividends (5,086) (5,132) (5,559)Purchase of minority interest — (7,610) —Purchase of treasury stock (959) (246) —Proceeds from exercise of stock options — — 29
Net cash provided by (used in) financing activities 32,317 (5,923) 7,541
Increase (decrease) in cash and cash equivalents 64,391 (64,888) 19,887
Cash and cash equivalents:Beginning of period 12,908 77,796 57,909
End of period $ 77,299 $ 12,908 $ 77,796
Cash paid during the period for:Interest $ 20,884 $ 18,430 $ 16,637Income taxes 7,396 6,291 9,150
The accompanying notes are an integral part of these financial statements.

The Greenbrier Companies 2001 Form 10-K 21
Notes to Consolidated Financial Statements
Note 1 — Nature of OperationsThe Greenbrier Companies, Inc. and Subsidiaries(“Greenbrier” or the “Company”) currently operates intwo primary business segments: manufacturing andleasing & services. The two business segments areoperationally integrated. With operations in NorthAmerica and Europe, the manufacturing segmentproduces double-stack intermodal railcars,conventional railcars, marine vessels and forged steelproducts and performs railcar refurbishment andmaintenance activities. In Europe, the Company also manufactures freight cars through the use ofunaffiliated subcontractors. The leasing & servicessegment owns or manages approximately 42,000railcars for railroads, institutional investors and otherleasing companies.
Note 2 — Summary of Significant Accounting PoliciesPrinciples of consolidation — The financial statements include the accounts of the Company and its majority-owned subsidiaries. All significantintercompany transactions and balances areeliminated upon consolidation. Investments in andadvances to a joint venture in which the Companyhas a 50% ownership interest are accounted for bythe equity method and included in other assets.
Foreign currency translation — Operations outside the United States prepare financial statements incurrencies other than the United States Dollar, theincome statement amounts are translated at averageexchange rates for the year, while the assets andliabilities are translated at year-end exchange rates.Translation adjustments are accumulated as aseparate component of stockholders’ equity andcomprehensive income.
Cash and cash equivalents — Cash is temporarilyinvested primarily in bankers’ acceptances, UnitedStates treasury bills, commercial paper and moneymarket funds. All highly-liquid investments with amaturity of three months or less at the date ofacquisition are considered cash equivalents.
Inventories — Inventories are valued at the lower of cost (first-in, first-out) or market. Work-in-processincludes material, labor and overhead. Assets held forsale or refurbishment consist of railcars, carried atcost, that will either be sold or refurbished and placedon lease.
Equipment on operating leases — Equipment onoperating leases is stated at cost. Depreciation toestimated salvage value is provided on the straight-line method over the estimated useful lives of up totwenty-five years.
Property, plant and equipment — Property, plant andequipment is stated at cost. Depreciation is providedon the straight-line method over estimated usefullives of three to twenty years.
Intangible assets — Loan fees are capitalized andamortized as interest expense over the life of therelated borrowings. Acquired designs and goodwill aregenerally amortized over twelve years using thestraight-line method.
Maintenance and warranty reserves — Maintenancereserves are estimated and provided for over the term of maintenance obligations specified in theunderlying lease agreements. Warranty reserves areestimated and charged to operations.
Income taxes — The liability method is used toaccount for income taxes. Deferred income taxes areprovided for the temporary effects of differences inthe recognition of revenues and expenses for financialstatement and income tax reporting purposes.Valuation allowances reduce deferred tax assets to anamount that will more likely than not be realized.
Minority interest — Minority interest representsunaffiliated investors’ capital investment and interestin the undistributed earnings and losses ofconsolidated entities.
Comprehensive income —Comprehensive incomerepresents net income plus all other changes in netassets from non-owner sources.
Revenue recognition — Revenue from manufacturingoperations is recognized at the time products arecompleted and accepted by unaffiliated customers.Direct finance lease revenue is recognized over thelease term in a manner that produces a constant rateof return on the net investment in the lease. Certaininterim rentals are based on estimated costs.Operating lease revenue is recognized as earnedunder the lease terms. Payments received in advanceare deferred until earned. The Company adopted Staff Accounting Bulletin (SAB) No. 101, RevenueRecognition in Financial Statements effective June 1,2001. The adoption did not have a material effect onthe financial statements.
Forward exchange contracts — Foreign operations giverise to risks from changes in foreign currencyexchange rates. Forward exchange contracts withestablished financial institutions are utilized to hedgea portion of such risk. Realized and unrealized gainsand losses are deferred and recognized in earningsconcurrent with the hedged transaction. Althoughforward exchange contracts are entered into tomitigate the impact of currency fluctuations, certainexposure remains that may affect operating results.

22 2001 Form 10-K The Greenbrier Companies
Interest rate instruments — Interest rate swapagreements are utilized to reduce the impact ofchanges in interest rates on certain debt. The netcash amounts paid or received on the agreements areaccrued and recognized as an adjustment to interestexpense.
Net earnings per share — Basic earnings per commonshare (EPS) excludes the potential dilution that wouldoccur if additional shares were issued upon exerciseof outstanding stock options, while diluted EPS takesthis potential dilution into account.
Stock-based compensation — Compensation expense forstock-based employee compensation continues to bemeasured using the method prescribed by AccountingPrinciples Board (APB) Opinion No. 25, Accountingfor Stock Issued to Employees. If material, pro formadisclosures of net earnings and earnings per commonshare will be made as if the method prescribed byStatement of Financial Accounting Standards (SFAS)No. 123, Accounting for Stock-Based Compensation,had been applied in measuring compensationexpense.
Management estimates — The preparation of financialstatements in conformity with accounting principlesgenerally accepted in the United States requiresmanagement to make estimates and assumptions that affect the amounts reported in the financialstatements and accompanying notes. This includes,among other things, evaluation of the remaining lifeand recoverability of long-lived assets. Actual resultscould differ from those estimates.
Reclassifications — Certain reclassifications have beenmade to prior years’ consolidated financial statementsto conform with the 2001 presentation.
Prospective accounting changes — In July 2001, theFinancial Accounting Standards Board (FASB) issuedSFAS No. 141, Business Combinations. The statementdiscontinues the use of the pooling of interestsmethod of accounting for business combinations. Thestatement is effective for all business combinationsafter June 30, 2001. The Company has completed anevaluation of the effects of this statement and doesnot believe it will have a material impact on theconsolidated financial statements.
In July 2001, the FASB issued SFAS No. 142, Goodwilland Other Intangible Assets. The statement willrequire discontinuing the amortization of goodwilland other intangible assets with indefinite usefullives. Instead, these assets will be tested periodicallyfor impairment and written down to their fair marketvalues as necessary. This statement is effective forfiscal years beginning after December 15, 2001. TheCompany is currently evaluating the impact of thisstatement on the consolidated financial statements.
In October 2001, the FASB issued SFAS No. 144,Accounting for the Impairment or Disposal of Long-Lived Assets, which is effective for fiscal yearsbeginning after December 15, 2001. SFAS 144addresses accounting and reporting of long-livedassets, except goodwill, that are either held and usedor disposed of through sale or other means. TheCompany is currently evaluating the impact of thisstatement on the consolidated financial statements.
Note 3 — AcquisitionsIn January 2000, Greenbrier completed the purchaseof the Freight Wagon Division of DaimlerChrysler RailSystems located in Siegen, Germany. The acquiredoperation provides expertise in the fields ofengineering, design, sales and marketing and projectmanagement. It also includes a comprehensiveportfolio of railcar designs certified for the Europeanmarketplace. Accordingly, a significant portion of theassets acquired are intangibles. The purchase wasinitially funded with a cash payment of $4.3 millionand the assumption of net liabilities of $29.2 million.Results of the acquired operation, which include thesale of freight cars manufactured by unaffiliatedsubcontractors, have been included in theaccompanying financial statements from the date of acquisition. Disclosure of the acquisition on a proforma basis, as if it had taken place onSeptember 1, 1999, has not been provided, as it is not material to the Company’s financial position or results of operations.
On September 30, 1998, Greenbrier acquired a 60.0%interest in a railcar manufacturer located in Swidnica,Poland. Through a series of subsequent transactions,the ownership interest was increased to 97.5%. Thisacquisition was accounted for by the purchasemethod, and operating results are included in theconsolidated financial statements from the date ofacquisition.

The Greenbrier Companies 2001 Form 10-K 23
Effective September 1, 1999, Greenbrier acquired thecommon equity of the minority investor’s interest inthe Canadian manufacturing subsidiary.
On September 1, 1998, Greenbrier entered intoa joint venture agreement with BombardierTransportation (Bombardier) to build railroad freightcars at Bombardier’s existing manufacturing facilityin Sahagun, Mexico. Each party holds a 50.0% non-controlling interest in the joint venture, andtherefore Greenbrier’s investment is being accountedfor using the equity method. Greenbrier’s share ofthe operating results is included as equity inearnings of unconsolidated subsidiary in theConsolidated Statements of Operations.
The excess purchase price over the fair value of netassets acquired in these transactions has beenincluded in intangible assets in the ConsolidatedBalance Sheets and is being amortized on a straight-line basis over 12 years. The above acquisitions werecompleted utilizing operating cash flows, availablelines of credit, and term debt.
Note 4 — Inventories
(In thousands) 2001 2000
Manufacturingsupplies andraw materials $ 21,207 $ 23,071
Work-in-process 37,907 55,227Assets held
for sale orrefurbishment 35,467 49,186
$ 94,581 $127,484
Note 5 — Investment in Direct Finance Leases
(In thousands) 2001 2000
Future minimumreceipts onlease contracts $104,433 $151,879
Maintenance,insuranceand taxes (25,270) (35,671)
Net minimumlease receipts 79,163 116,208
Estimatedresidual values 50,989 51,848
Unearnedfinancecharges (26,576) (43,276)
$103,576 $124,780
Minimum future receipts on the direct finance leasecontracts are as follows:
(In thousands)
Year ending August 31,2002 $ 40,5212003 29,2732004 18,5052005 10,6872006 3,946Thereafter 1,501
$104,433
Note 6 — Equipment on Operating LeasesEquipment on operating leases is reported net ofaccumulated depreciation of $57.5 million and $53.2 million as of August 31, 2001 and 2000.
In addition, certain railcar equipment is leased bythe Company and subleased to customers under non-cancelable operating leases. Aggregate minimumfuture amounts receivable under all non-cancelableoperating leases and subleases are as follows:
(In thousands)
Year ending August 31,2002 $ 12,0362003 9,8842004 7,2142005 5,2852006 3,443Thereafter 1,081
$ 38,943
Certain equipment is also operated under daily,monthly or mileage arrangements. Associatedrevenues amounted to $23.5 million, $25.8 millionand $23.0 million for the years ended August 31,2001, 2000 and 1999.

24 2001 Form 10-K The Greenbrier Companies
Note 7 — Property, Plant and Equipment
(In thousands) 2001 2000
Land andimprovements $9,365 $ 9,326
Machinery andequipment 71,395 63,772
Buildings andimprovements 35,832 31,062
Other 18,963 20,227
135,555 124,387
Accumulateddepreciation (58,657) (46,759)
$ 76,898 $ 77,628
Note 8 – Investment in Unconsolidated SubsidiarySummarized financial data of the Company’smanufacturing joint venture for the years endedAugust 31, 2001 and 2000 is as follows:
(In thousands) 2001 2000
Current assets $ 19,893 $ 25,623Total assets 41,722 44,407Current liabilities 10,469 17,183Equity 31,253 27,224
Revenues $ 51,154 $ 100,313
Net earnings (loss) $ (3,971) $ 5,730
Note 9 — Revolving NotesCredit facilities aggregated $157.1 million as of August31, 2001, at the year end exchange rates. Availableborrowings under the credit facilities are principallybased upon defined levels of receivables, inventoryand leased equipment which at August 31, 2001levels would provide for a maximum borrowings of $106.9 million. A $60.0 million revolving line ofcredit is available through January 2004 to provideworking capital and interim financing of equipmentfor the leasing & services operations. A $40.0 million line of credit to be used for working capital isavailable through February 2002 for United States
manufacturing operations. A $19.4 million line ofcredit is available through October 2002 for workingcapital for Canadian manufacturing operations.Lines of credit totaling $27.2 million are availableprincipally through December 2001 for workingcapital for Polish manufacturing operations. A line of credit totaling $10.5 million is available to supportEuropean operations. Advances under the lines ofcredit bear interest at rates, that vary depending on the type of borrowing and certain defined ratios.At August 31, 2001, there were no borrowingsoutstanding under the United States manufacturingand leasing lines, $7.9 million, $19.2 million and $5.9 million were outstanding under the Canadian,Polish and European operating lines.
In addition, bank guarantees totaling $33.2 million (at the August 31, 2001 exchange rate) are available to support European operations, of which $13.1 million were issued at August 31, 2001.
The Company received waivers for non-compliance,as of August 31, 2001, with certain covenants relatingto the Canadian and European lines of credit. Inconjunction with these waivers, lines of credit andbank guarantees available to support the Europeanoperations were reduced to $2.3 million and $31.4 million.
Note 10 — Accounts Payable and Accrued Liabilities
(In thousands) 2001 2000
Trade payablesand accruedliabilities $ 82,740 $ 90,807
Deferred revenue 17,678 3,538Maintenance
reserves 9,931 10,338Warranty reserves 9,458 9,504Accrued payroll
and relatedliabilities 7,551 18,215
Participation 4,796 2,943Other 3,744 12,447
$135,898 $147,792
Note 11 — Notes Payable
(In thousands) 2001 2000
Equipment notespayable $120,880 $ 98,663
Term loans 55,659 59,337Other 1,036 1,363
$177,575 $159,363

The Greenbrier Companies 2001 Form 10-K 25
Equipment notes payable pertaining to the lease fleetbear interest at fixed rates of 6.5% to 10.8% and aredue in varying installments through March 2013. The weighted average remaining contractual life and weighted average interest rate of the notes as ofAugust 31, 2001 and 2000 were approximately 56 and27 months and 6.0% and 7.3%. The notes arecollateralized by certain lease fleet railcars. InFebruary 1999, Greenbrier issued $30.0 million ofequipment notes payable, and repaid $22.0 million of leasing equipment notes payable. The earlyretirement of this debt resulted in a $0.9 millionextraordinary charge (net of income taxes of $0.7 million) in 1999 for prepayment penalties and the write-off of deferred loan costs.
Term loans for manufacturing operations andacquisitions are due in varying installments throughMarch 2011 and generally are collateralized bycertain property, plant and equipment. As of August 31, 2001, the effective interest rates on theterm loans ranged from 6.6% to 10.1%, except for$1.7 million of borrowings relating to the Polishoperation which bear interest at 16.9%. Interest rateswap agreements are utilized to reduce the impact ofchanges in interest rates on certain debt. At August31, 2001, such agreements had a notional amount of $95.9 million and mature between August 2006 andMarch 2013.
Principal payments on the notes payable are asfollows:
(In thousands)
Year ending August 31,2002 $ 38,5792003 27,1732004 21,6452005 16,3102006 20,675Thereafter 53,193
$177,575
The revolving and operating lines of credit, alongwith certain equipment notes payable, containcovenants with respect to various subsidiaries,the most restrictive of which limit the payment ofdividends or advances by subsidiaries and requirecertain levels of tangible net worth, ratio of debt toequity and debt service coverage. At August 31, 2001,the Company received waivers for non-compliance ofcertain covenants relating to European notes payable.
Note 12 — Subordinated DebtSubordinated notes, amounting to $37.5 million and$37.7 million at August 31, 2001 and 2000, wereissued for railcars purchased as part of an agreementdescribed in Note 21. The notes bear interest at11.0% and 9.0%, with substantially all of theprincipal due ten years from the date of the notes,and are subordinated to all other liabilities of asubsidiary. The agreement includes an option that,under certain conditions, provides for the seller torepurchase the railcars for the original acquisitioncost to the Company at the date the underlyingsubordinated notes are due. The Company hasreceived notice from the seller that the purchaseoptions will be exercised, and amounts due under the subordinated notes will be retired from therepurchase proceeds.
Note 13 – Derivative InstrumentsForeign operations give rise to market risks fromchanges in foreign currency exchange rates.Greenbrier utilizes foreign currency forwardexchange contracts with established financialinstitutions to hedge a portion of that risk. Interestrate swap agreements are utilized to reduce theimpact of changes in interest rates on certain debt.
In accordance with the transition provisions of SFASNo. 133, adopted by Greenbrier on September 1,2000, a cumulative effect of a change in accountingprinciple of $1.1 million (net of tax) was recorded as a component of other comprehensive income.
Forward exchange contracts are entered into to hedgea portion of the risk of foreign currency fluctuationsof United States Dollars, Deutsche Marks and PoundsSterling denominated accounts receivables resultingfrom firm commitments for the sale of railcars. As of August 31, 2001, forward exchange contractsoutstanding for the sales of United States Dollarstotaled $18.5 million, Deutsche Marks totaled $9.4 million and Pounds Sterling totaled $6.5 million at August 31, 2001 exchange rates. The fair value of these cash flow hedges at August 31, 2001 ascompared to the carrying amount resulted in anunrealized pre-tax loss of $.2 million. As thesecontracts mature at various dates through May 2002,any such loss remaining will be recognized alongwith the related transactions.

26 2001 Form 10-K The Greenbrier Companies
At August 31, 2001 exchange rates, interest rate swapagreements had a notional amount of $95.9 millionand mature between August 2006 and March 2013.The fair value of these cash flow hedges at August 31,2001 as compared to the carrying amount resulted inan unrealized pre-tax loss of $3.7 million. As interestexpense on the underlying debt is recognized,amounts corresponding to the interest rate swaps arereclassified from other comprehensive income andcharged or credited to interest expense. At August 31,2001 interest rates, approximately $2.1 million would be reclassified to interest expense in the next 12 months.
Note 14 — Stockholders’ EquityThe Chairman and the Chief Executive Officer, whoare the founding and majority stockholders, haveentered into an agreement whereby they have agreedto vote their shares together to elect each other asdirectors of the Company and with respect to all othermatters put to a vote of the stockholders.
Certain loan covenants restrict the transfer of fundsfrom the subsidiaries to the parent company in theform of cash dividends, loans, or advances. Restrictednet assets of subsidiaries amounted to $86.2 millionas of August 31, 2001. Consolidated retained earningsof $4.7 million at August 31, 2001 were restricted as tothe payment of dividends.
A stock incentive plan was adopted July 1, 1994 (the1994 Plan) that provides for granting compensatoryand non-compensatory options to employees andothers. Outstanding options generally vest at 50.0%two years from grant date with the balance five yearsfrom grant. No further grants will be awarded underthis plan.
On April 6, 1999, the Company adopted the StockIncentive Plan — 2000 (the 2000 Plan), under which1,000,000 shares of common stock are available for issuance with respect to options granted toemployees, non-employee directors and consultantsof the Company. The 2000 Plan authorizes the grantof incentive stock options, non-statutory stock optionsand restricted stock awards, or any combination of
the foregoing. Under the 2000 Plan, the exercise pricefor incentive stock options may not be less than themarket value of the Company’s common stock at thetime the option is granted. Options are exercisable notless than six months or more than 10 years after thedate the option is granted. General awards under the2000 Plan vest at 50.0% two years from the grant date,with the balance vesting five years from grant.
The following table summarizes stock optiontransactions for shares under option and the relatedweighted average option price:
Weighted Average Option
Shares Price
Balance atAugust 31, 1998 646,859 $ 13.62
Granted 642,500 11.37Exercised (1,860) 13.14Canceled (16,534) 14.00
Balance atAugust 31, 1999 1,270,965 12.73
Granted 262,500 8.69Expired (3,000) 16.75Canceled (27,491) 12.59
Balance atAugust 31, 2000 1,502,974 11.75
Granted 283,000 9.19Expired (2,000) 11.75Canceled (46,874) 12.88
Balance atAugust 31, 2001 1,737,100 $ 11.30
Options outstanding at August 31, 2001 haveexercise prices ranging from $8.56 to $17.34 per share and have a remaining average contractual life of 4.32 years. As of August 31, 2001, options topurchase 888,600 shares were exercisable and 454,500shares were available for grant. Options to purchase737,500 and 1,000,000 shares were available for grantat August 31, 2000 and 1999.
As discussed in Note 2, the disclosure-only provisionsof SFAS No. 123 have been adopted. Accordingly, nocompensation cost has been recognized for stockoptions granted with an exercise price equal to thefair value of the underlying stock on the date of grant.Had compensation costs been determined based on

The Greenbrier Companies 2001 Form 10-K 27
the estimated fair value of the options at the date ofgrant, the net earnings and net earnings per share forthe years ended August 31, 2001, 2000 and 1999 wouldnot have differed materially from the amountsreported.
Note 15 — Related Party TransactionsDuring 2001, the Company purchased railcars for$45.7 million from a 50.0%-owned joint venture forsubsequent sale or for its own lease fleet.
Maintenance, management and other fees receivedfrom a related entity under an agreement were$0.1 million, $0.5 million and $0.9 million for theyears ended August 31, 2001, 2000 and 1999.
A member of the board of directors of a Canadiansubsidiary also serves as a director of a company fromwhich the majority of the Canadian subsidiary’s steelrequirements are acquired.
Note 16 — Employee Benefit PlansDefined contribution plans are available tosubstantially all United States employees.Contributions are based on a percentage of employeecontributions and amounted to $1.2 million, $1.1 million and $0.8 million for the years endedAugust 31, 2001, 2000 and 1999.
Defined benefit pension plans are provided forCanadian, German and Polish employees covered bycollective bargaining agreements. The plans providepension benefits based on years of credited service.Contributions to the plan are actuarially determinedand are intended to fund the net periodic pensioncost. The plans’ assets, obligations and pension costare not material to the consolidated financialstatements.
Nonqualified deferred benefit plans exist for certainemployees. Expenses resulting from contributions to the plans, which are based on earnings, were$1.5 million, $1.5 million and $0.9 million for theyears ended August 31, 2001, 2000 and 1999.
Note 17 — Income TaxesComponents of income tax expense are as follows:
(In thousands) 2001 2000 1999
Current:Federal $ 5,080 $ 2,466 $ 5,174State 1,823 1,506 1,092Foreign (1,779) 4,477 8,243
5,124 8,449 14,509Deferred:
Federal 1,605 5,787 6,317State (111) 598 1,617Foreign 188 1,219 (1,464)
1,682 7,604 6,470
$ 6,806 $ 16,053 $ 20,979
Income tax expense is computed at rates differentthan statutory rates. The reconciliation between effective and statutory tax rates on continuing operations is as follows:
2001 2000 1999
Federal statutory rate 35.0% 35.0% 35.0%State income
taxes, net offederal benefit 5.0 4.3 4.0
Impact of foreignlosses 36.0 11.9 7.4
Other 3.9 0.6 1.7
79.9% 51.8% 48.1%

28 2001 Form 10-K The Greenbrier Companies
The tax effects of temporary differences that giverise to significant portions of deferred tax assets anddeferred tax liabilities are as follows:
(In thousands) 2001 2000
Deferred tax assets:Alternative
minimum taxcreditcarryforward $ — $ (4,417)
Deferredparticipation (22,512) (21,775)
Maintenance andwarranty reserves (4,201) (5,553)
Accrued payroll andrelated liabilities (3,164) (3,245)
Deferred revenue (1,821) (872)Inventories and other (4,346) (4,094)SFAS 133 and
translationadjustment (1,985) (186)
(38,029) (40,142)Deferred tax liabilities:
Accelerateddepreciation 64,788 64,925
Other 2,419 2,857
Net deferred taxliability attributableto continuingoperations 29,178 27,640
Net deferred taxliability attributableto discontinuedoperations (2,258) (2,402)
Net deferred taxliability $ 26,920 $ 25,238
United States income taxes have not been providedfor approximately $13.0 million of cumulativeundistributed earnings of several non-United Statessubsidiaries. Greenbrier plans to reinvest theseearnings indefinitely in operations outside the United States.
Note 18– Segment InformationGreenbrier has two reportable segments:manufacturing and leasing & services. Theaccounting policies of the segments are the same as those described in the summary of significantaccounting policies. Performance is evaluated basedon margin, which is presented in the ConsolidatedStatements of Operations. Intersegment sales andtransfers are accounted for as if the sales or transferswere to third parties.
The information in the following tables is deriveddirectly from the segments’ internal financial reports used for corporate management purposes.Unallocated assets primarily consist of cash and short-term investments.
(In thousands) 2001 2000 1999
Revenue:Manufacturing $529,201 $582,543 $548,038Leasing &
services 93,438 116,994 127,630Intersegment
eliminations (28,641) (80,108) (57,132)
$593,998 $619,429 $618,536
Assets:Manufacturing $ 226,211 $232,265 $188,147Leasing &
services 302,764 338,908 284,401Unallocated 77,205 12,936 78,168
$ 606,180 $584,109 $ 550,716
Depreciation andamortization:Manufacturing $ 12,631 $ 9,847 $ 7,794Leasing &
services 9,765 10,509 8,683
$ 22,396 $ 20,356 $ 16,477
Capitalexpenditures:Manufacturing $ 10,761 $ 19,476 $ 23,260Leasing &
services 62,575 74,515 47,717
$ 73,336 $ 93,991 $ 70,977

The Greenbrier Companies 2001 Form 10-K 29
The following table summarizes selected geographicinformation. Eliminations represent sales betweengeographic areas.
(In thousands) 2001 2000 1999
Revenue:United States $381,389 $393,213 $387,735Canada 139,416 239,658 231,767Europe 97,759 53,230 20,183Eliminations (24,566) (66,672) (21,149)
$593,998 $619,429 $618,536
Earnings(1):United States $ 18,264 $ 25,156 $ 33,413Canada (4,727) 15,350 16,280Europe (8,126) (5,299) (6,120)Eliminations 3,112 (4,204) 50
$ 8,523 $ 31,003 $ 43,623
Identifiable assets:United States $ 470,070 $464,276 $469,133Canada 40,163 57,899 64,162Europe 95,947 61,934 17,421
$606,180 $584,109 $550,716
(1) From continuing operations before income tax expense,minority interest and equity in earnings of unconsolidatedsubsidiary
Note 19 — Customer ConcentrationIn 2001, revenue from the two largest customers was22.6% and 18.6% of total revenues. Revenue from thetwo largest customers was 30.1% and 8.9% of totalrevenues for the year ended August 31, 2000 and28.3% and 16.7% of total revenues for the year endedAugust 31, 1999. No other customers accounted formore than 10.0% of total revenues in 2001, 2000 and1999. Two customers had balances that individuallyexceeded 10.0% of accounts receivable and in totalrepresented 32.1% of the consolidated balance atAugust 31, 2001. Two customers had balances thatindividually exceeded 10.0% of accounts receivableand in total represented 40.4% of the consolidatedbalance at August 31, 2000.
Note 20 — Lease CommitmentsLease expense for railcar equipment leased undernon-cancelable leases was $9.7 million, $7.4 millionand $7.3 million, for the years ended August 31, 2001,2000 and 1999. Aggregate minimum future amountspayable under these non-cancelable railcarequipment leases are as follows:
(In thousands)
Year ending August 31,2002 $ 5,8612003 4,6582004 3,1702005 7522006 —Thereafter —
$ 14,441
Operating leases for domestic repair facilities,office space and certain manufacturing and officeequipment expire at various dates throughSeptember 2014. Rental expense for facilities, officespace and equipment was $3.4 million, $2.9 millionand $2.5 million for the years ended August 31, 2001, 2000 and 1999. Aggregate minimum future amountspayable under these non-cancelable operating leasesare as follows:
(In thousands)
Year ending August 31,2002 $ 2,8272003 2,2882004 1,7832005 1,4412006 1,248Thereafter 4,031
$ 13,618
Note 21 — Commitments and ContingenciesIn 1990, an agreement was entered into for thepurchase and refurbishment of over 10,000 usedrailcars. The agreement provides that, under certainconditions, the seller will receive a percentage ofoperating earnings of a subsidiary, as defined.Amounts accrued are referred to as participation andare included in accrued liabilities and deferred

30 2001 Form 10-K The Greenbrier Companies
participation in the Consolidated Balance Sheets.Participation expense related to this and a similar,but smaller agreement was $6.8 million, $9.7 millionand $14.0 million for the years ended August 31,2001, 2000 and 1999. Payment of deferredparticipation is estimated to be $4.7 million in 2002, $10.6 million in 2003, $21.8 million in 2004,$17.1 million in 2005 and $11.7 million in 2006 withthe remaining balance due after 2006.
At the August 31, 2001 exchange rates, forwardexchange contracts outstanding for the sales of theUnited States Dollars totaled $18.5 million, DeutscheMarks totaled $9.4 million and Pounds Sterlingtotaled $6.5 million. The fair value of these cash flow hedges at August 31, 2001 as compared to thecarrying amount resulted in an unrealized pre-taxloss of $.2 million. These contracts mature at variousdates through May 2002; any such loss remainingwill be recognized along with the relatedtransactions.
Environmental studies have been conducted ofowned and leased properties that indicate additionalinvestigation and some remediation may benecessary. The Portland, Oregon, manufacturingfacility is located on the Willamette River. TheUnited States Environmental Protection Agency (the EPA) has classified portions of the river bed,including the portion fronting the facility, as afederal “national priority list” or “superfund” site due to sediment contamination. The Company andmore than 60 other parties have received a “GeneralNotice” of potential liability from the EPA. There isno indication that the Company has contributed tocontamination of the Willamette River bed, althoughuses by prior owners of the property may havecontributed. Nevertheless, this classification of theWillamette River may have an impact on the value ofthe Company’s investment in the property and hasresulted in the Company initially bearing a portion ofthe cost of an EPA mandated remedial investigation.The cost of the investigation is currently notdeterminable however, some or all of any suchoutlay may be recoverable from responsible parties.The Company may be required to perform periodicmaintenance dredging in order to continue to launchvessels from its launch ways on the river, andclassification as a superfund site could result in somelimitations on future launch activity. The outcome ofsuch actions cannot be estimated. Managementbelieves that the Company’s operations adhere tosound environmental practices, applicable laws andregulations.
From time to time, the Company is involved as adefendant in litigation in the ordinary course ofbusiness, the outcome of which cannot be predictedwith certainty. Litigation has been initiated byformer shareholders of Interamerican Logistics, Inc.(Interamerican), which was acquired in the fall of1996. The plaintiffs allege that the Company violatedthe agreements pursuant to which it acquiredownership of Interamerican and seek damagesaggregating $4.5 million Canadian. Managementcontends the claim to be without merit and intendsto vigorously defend its position. Managementbelieves that any ultimate liability resulting fromlitigation will not materially affect the financialposition, results of operations, or cash flows of theCompany.
Employment agreements, which expire August 31,2004, with the Chairman and the Chief ExecutiveOfficer, provide each with a minimum annual salaryand a bonus calculated based on operating results, asdefined. The minimum annual aggregate definedpayment under the agreements is $0.7 million andthe maximum is $2.1 million.
Note 22 – Fair Value of Financial InstrumentsThe estimated fair values of financial instrumentsand the methods and assumptions used to estimatesuch fair values are as follows:
2001
Carrying Estimated(In thousands) Amount Fair Value
Notes payable andsubordinated debt $215,066 $221,156
Deferred participation 56,176 46,138
2000
Carrying Estimated(In thousands) Amount Fair Value
Notes payable andsubordinated debt $ 197,111 $ 174,575
Deferred participation 54,266 42,278
The carrying amount of cash and cash equivalents,accounts and notes receivable, revolving notes,accounts payable, accrued liabilities, foreigncurrency forward contracts and interest rate swaps is a reasonable estimate of fair value of thesefinancial instruments. Estimated rates currentlyavailable to the Company for debt with similar termsand remaining maturities are used to estimate thefair value of notes payable and subordinated debt.The fair value of deferred participation is estimatedby discounting the estimated future cash paymentsusing the Company’s estimated incrementalborrowing rate.

The Greenbrier Companies 2001 Form 10-K 31
Quarterly Results of OperationsUnaudited operating results by quarter for 2001 and 2000 are as follows:
(In thousands, except per share amounts) First Second Third Fourth Total
2001Revenue
Manufacturing $134,779 $135,175 $129,032 $ 114,026 $ 513,012Leasing & services 19,205 21,743 19,317 20,721 80,986
153,984 156,918 148,349 134,747 593,998
Cost of revenueManufacturing 120,364 129,490 116,841 103,681 470,376Leasing & services 10,195 10,983 10,851 11,266 43,295
130,559 140,473 127,692 114,947 513,671
Margin $ 23,425 $ 16,445 $ 20,657 $ 19,800 $ 80,327
Net earnings (loss) $ 2,999 $ 70 $ (1,327) $ (623) $ 1,119
Net earnings (loss) per common share:Basic $ .21 $ .00 $ (.09) $ (.04) $ .08
Diluted $ .21 $ .00 $ (.09) $ (.04) $ .08
2000Revenue
Manufacturing $ 91,749 $149,387 $147,054 $140,050 $528,240Leasing & services 21,253 23,436 24,861 21,639 91,189
113,002 172,823 171,915 161,689 619,429
Cost of revenueManufacturing 80,013 132,070 131,041 123,224 466,348Leasing & services 12,214 12,332 11,817 10,348 46,711
92,227 144,402 142,858 133,572 513,059
Margin $ 20,775 $ 28,421 $ 29,057 $ 28,117 $ 106,370
Net earnings $ 424 $ 4,303 $ 4,241 $ 5,386 $ 14,354
Net earnings per common share:Basic $ .03 $ .30 $ .30 $ .38 $ 1.01
Diluted $ .03 $ .30 $ .30 $ .38 $ 1.01

32 2001 Form 10-K The Greenbrier Companies
Report of ManagementBoard of Directors and StockholdersThe Greenbrier Companies, Inc.
The consolidated financial statements and otherfinancial information of The Greenbrier Companies,Inc. and Subsidiaries in this report were prepared bymanagement, which is responsible for their content.They reflect amounts based upon management’s bestestimates and informed judgments. In management’sopinion, the financial statements present fairly thefinancial position, results of operations and cashflows of the Company in conformity with accountingprinciples generally accepted in the United States ofAmerica.
The Company maintains a system of internal control,which is designed, consistent with reasonable cost, toprovide reasonable assurance that transactions areexecuted as authorized, that they are properlyrecorded to produce reliable financial records, andthat accountability for assets is maintained. Theaccounting controls and procedures are supported by careful selection and training of personnel and acontinuing management commitment to the integrityof the system.
The financial statements have been audited, to theextent required by auditing standards generallyaccepted in the United States of America, by Deloitte & Touche LLP, independent auditors. Inconnection therewith, management has consideredthe recommendations made by the independentauditors in connection with their audit and hasresponded in an appropriate, cost-effective manner.
The Board of Directors has appointed an AuditCommittee composed entirely of directors who are not employees of the Company. The AuditCommittee meets with representatives ofmanagement and the independent auditors, bothseparately and jointly. The Committee reports tothe Board on its activities and findings.
William A. Furman, Larry G. Brady,President, Chief Senior Vice President,Executive Officer Chief Financial Officer
Independent Auditors’ ReportBoard of Directors and StockholdersThe Greenbrier Companies, Inc.
We have audited the accompanying consolidatedbalance sheets of The Greenbrier Companies, Inc.and Subsidiaries as of August 31, 2001 and 2000, andthe related consolidated statements of operations,stockholders’ equity and comprehensive income andcash flows for each of the three years in the periodended August 31, 2001. These financial statementsare the responsibility of the Company’s management.Our responsibility is to express an opinion on thesefinancial statements based on our audits.
We conducted our audits in accordance with auditingstandards generally accepted in the United States ofAmerica. Those standards require that we plan andperform the audit to obtain reasonable assuranceabout whether the financial statements are free ofmaterial misstatement. An audit includes examining,on a test basis, evidence supporting the amounts anddisclosures in the financial statements. An audit alsoincludes assessing the accounting principles usedand significant estimates made by management, aswell as evaluating the overall financial statementpresentation. We believe that our audits provide areasonable basis for our opinion.
In our opinion, such consolidated financialstatements present fairly, in all material respects, thefinancial position of The Greenbrier Companies, Inc.and Subsidiaries as of August 31, 2001 and 2000, andthe results of their operations and their cash flowsfor each of the three years in the period endedAugust 31, 2001, in conformity with accountingprinciples generally accepted in the United States of America.
Portland, OregonNovember 20, 2001

The Greenbrier Companies 2001 Annual Report
Directors & Officers
D i r e c t o r sAlan JamesChairman of the Board of Directors
The Greenbrier Companies
William A. FurmanPresident, Chief Executive Officer
The Greenbrier Companies
Victor G. Atiyeh(1)(2)
Principal
Victor Atiyeh & Co.
Peter K. Nevitt(1)(2)
Former President, Chief Executive Officer
Mitsui Nevitt Capital Corporation
A. Daniel O’Neal, Jr.Director of Powertech Group
C. Bruce WardChairman
Gunderson, Inc.
Benjamin R. Whiteley(1)(2)
Retired Chairman and Chief Executive Officer
Standard Insurance Company
(1) Member of Compensation Committee(2) Member of Audit Committee
O f f i c e r sAlan JamesChairman of the Board of Directors
William A. FurmanPresident, Chief Executive Officer
Robin D. BissonSenior Vice President, Marketing and Sales
William L. BourqueVice President, International Marketing
Larry G. BradySenior Vice President, Chief Financial Officer
Maren C. MalikVice President, Administration
Richard G. McKayPresident, TrentonWorks Limited, President, Greenbrier Europe
Linda M. OlingerCorporate Controller
Thomas P. PeczerskiPresident, WagonySwidnica S.A.
Mark J. RittenbaumSenior Vice President, Treasurer
Thomas J. SassPresident, Gunderson, Inc.
Bernhard SeidenstückerManaging Director, Greenbrier Germany, GmbH
James T. SharpVice President, Marketing
Timothy A. StuckeyPresident, Gunderson Rail Services
Norriss M. WebbExecutive Vice President, General Counsel
L. Clark WoodPresident, Manufacturing Operations

2001 Annual Report The Greenbrier Companies
Transfer A g e n t :First Chicago Trust Company of New York525 Washington Boulevard, 7th FloorJersey City, New Jersey 07303
Greenbrier’s Transfer Agent maintains stockholderrecords, issues stock certificates and distributes divi-dends. Requests concerning these mattersshould be directed to First Chicago Trust Companyof New York.
S t o ckholder Inquiries:Please contact Mark Rittenbaum, Investor Relations(503) 684-7000E-mail: [email protected]
Common Stock :Greenbrier’s common stock has been traded on theNew York Stock Exchange under the symbol GBXsince July 14, 1994. There were approximately 470holders of record of common stock as of October 31,2001. The following table shows the reported highand low sales price of Greenbrier’s common stockon the New York Stock Exchange.
High Low
2001Fourth quarter $ 9.55 $ 8.30Third quarter $ 9.85 $ 8.15Second quarter $ 10.30 $ 8.13First quarter $ 10.19 $ 8.13
2000Fourth quarter $ 9.25 $ 7.25Third quarter $ 8.44 $ 7.00Second quarter $ 10.63 $ 8.06First quarter $ 11.38 $ 9.69
A quarterly dividend of $0.06 per common sharewas declared in November 2001, to be paid inDecember. Cash dividends have been paid quarterlyon the common stock since December 1994. Thereis no assurance as to future dividends as they aredependent upon future earnings, capital require-ments and financial condition.
I nvestor Information
C o r p o rate Offices:The Greenbrier Companies, Inc.One Centerpointe Drive, Suite 200Lake Oswego, Oregon 97035
(503) 684-7000
Company website: www.gbrx.com
Annual Stockholders’ Meeting:January 8, 2002, 2:00 pmBenson Hotel309 SW BroadwayPortland, Oregon
Financial Information:Requests for copies of this annual report and other financial information should be made to:
Investor RelationsThe Greenbrier Companies, Inc.One Centerpointe Drive, Suite 200Lake Oswego, Oregon 97035
E-mail: [email protected]
Legal Counsel:Tonkon Torp LLPPortland, Oregon
Independent Au d i t o r s :Deloitte & Touche LLPPortland, Oregon

L o c a t i o n s◆ HeadquartersLake Oswego, Oregon
▲ Marketing & Sales OfficesChicago, Illinois
Fort Worth, Texas
Lake Oswego, Oregon
London, England
Lowell, Indiana
Mexico City, Mexico
Monroe, Louisiana
Montreal, Quebec
Seattle, Washington
Siegen, Germany
Vancouver, British Columbia
Walnut Creek, California
Warsaw, Poland
Washington, DC
■ Manufacturing FacilitiesPortland, Oregon
Sahagun, Mexico
Swidnica, Poland
Trenton, Nova Scotia
● Repair Facilities & Wheel Services
Atchison, Kansas
Cleburne, Texas
Finley, Washington
Golden, Colorado
Modesto, California
Pine Bluff, Arkansas
Portland, Oregon
Sahagun, Mexico
San Antonio, Texas
Springfield, Oregon
Tacoma, Washington
The Greenbrier Companies 2001 Annual Report

The Greenbrier Companies, Inc.One Centerpointe Drive, Suite 200Lake Oswego, OR 970355 0 3 - 6 8 4 - 7 0 0 0
w w w. g b r x . c o m