The “Greatest” Carry Trade Ever? Understanding Eurozone ...
57
1 The “Greatest” Carry Trade Ever? Understanding Eurozone Bank Risks Viral V. Acharya † Sascha Steffen ‡ November 18, 2012 Abstract This paper argues that the European banking crisis can in part be explained by a “carry trade” behavior of banks. The factor loadings from cross-sectional tests relating bank stock returns to government bond returns suggest that banks have been long peripheral sovereign bonds funded in short-term wholesale markets. Large banks with low Tier 1 ratios and high risk- weighted assets had particularly large exposures. They raised more capital and were more dependent on central banks. The European Central Bank (ECB) has provided liquidity to fund these carry trades at the expense of real sector lending. We discuss alternative motives to hold sovereign debt such as home bias, suasion and redenomination risk. Keywords: Sovereign debt crisis, bank risk, carry trades JEL Classification: G01, G21, G28, G14, G15, F3 We thank Martin Brown, Paul Glaserman, Martin Hellwig, Marco Pagano, Hélène Rey and participants in the 12 th annual FDIC / JFSR conference, 2012 C.R.E.D.I.T. and seminar participants at Leeds, the University of Osnabrueck and University of Mainz for valuable comments and suggestions. † C.V. Starr Professor of Economics, Department of Finance, New York University, Stern School of Business, 44 West 4th St., New York, NY 10012, email: [email protected]. Acharya is also a Research Affiliate of the CEPR and a Research Associate in Corporate Finance at the NBER. Acharya is grateful for financial support from the Center for Global Economy and Business at NYU-Stern. ‡ ESMT European School of Management and Technology, Schlossplatz 1, 10178 Berlin (Germany), email: [email protected].
Transcript of The “Greatest” Carry Trade Ever? Understanding Eurozone ...

1
The “Greatest” Carry Trade Ever? Understanding Eurozone Bank Risks
Viral V. Acharya† Sascha Steffen
‡
November 18, 2012
Abstract
This paper argues that the European banking crisis can in part be explained by a “carry trade”
behavior of banks. The factor loadings from cross-sectional tests relating bank stock returns to
government bond returns suggest that banks have been long peripheral sovereign bonds
funded in short-term wholesale markets. Large banks with low Tier 1 ratios and high risk-
weighted assets had particularly large exposures. They raised more capital and were more
dependent on central banks. The European Central Bank (ECB) has provided liquidity to fund
these carry trades at the expense of real sector lending. We discuss alternative motives to hold
sovereign debt such as home bias, suasion and redenomination risk.
Keywords: Sovereign debt crisis, bank risk, carry trades
JEL Classification: G01, G21, G28, G14, G15, F3
We thank Martin Brown, Paul Glaserman, Martin Hellwig, Marco Pagano, Hélène Rey and participants in the
12th
annual FDIC / JFSR conference, 2012 C.R.E.D.I.T. and seminar participants at Leeds, the University of
Osnabrueck and University of Mainz for valuable comments and suggestions.
†C.V. Starr Professor of Economics, Department of Finance, New York University, Stern School of Business, 44
West 4th St., New York, NY 10012, email: [email protected]. Acharya is also a Research Affiliate of the
CEPR and a Research Associate in Corporate Finance at the NBER. Acharya is grateful for financial support
from the Center for Global Economy and Business at NYU-Stern. ‡ESMT European School of Management and Technology, Schlossplatz 1, 10178 Berlin (Germany), email:
2
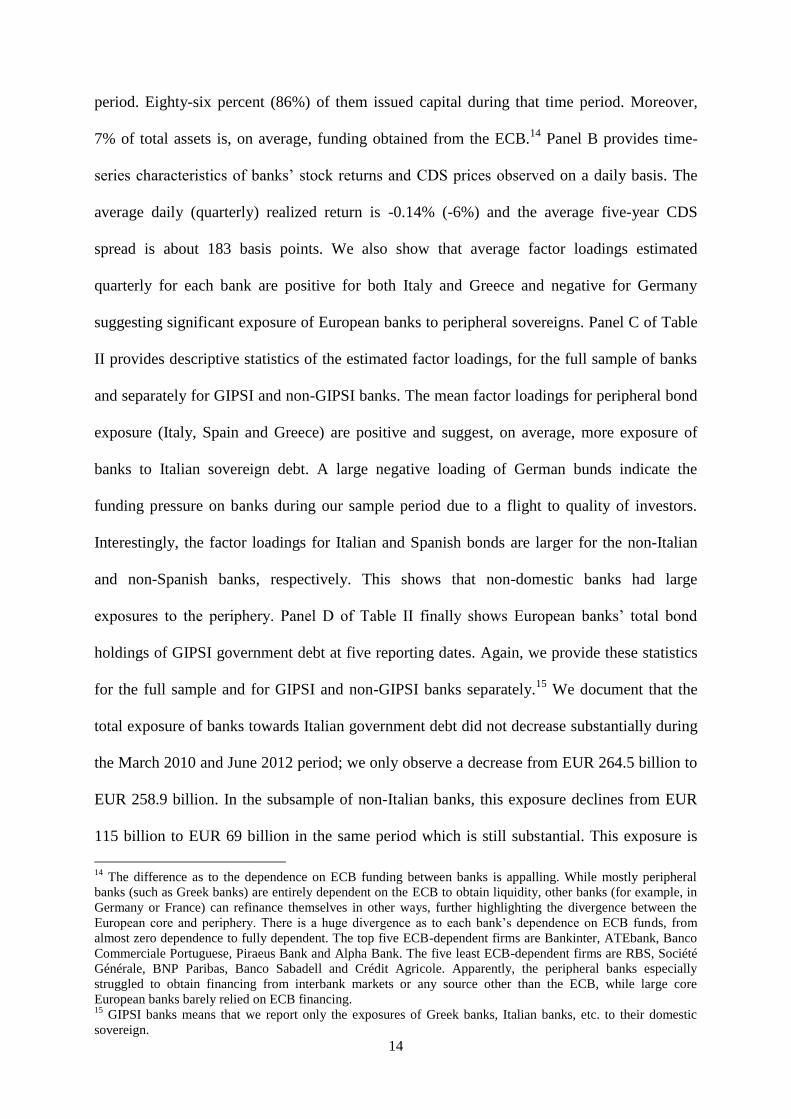
“And of course, the deterioration of the Euro zone situation and particularly the sovereign
crisis in the peripheral economies hit very badly the group. And that’s of course not a
surprise for a group that still had very important short-term funding needs that was mainly
present in strong exposures in peripheral countries. [...] Before 2008, it was the group’s high
rating granting easy access to wholesale funding that led to the situation of October 2008
with short-term funding need of €260 billion outstanding in October 2008, i.e. 43% of total
balance sheet. [...] with very significant acceleration and buildup of the bond portfolio was
amounting at €203 billion at the end of 2008. Mostly carry trades with marginal improvement
of customer access [...] that led to a very significant gearing ratio because the portfolio size
was, at that time, 25 times the group equity.”
(Pierre Mariani, Chairman of the Management Board and CEO, Dexia SA, Earnings
Call, February 23rd, 2012)
The ongoing sovereign debt crisis in Europe has cast doubt on the solvency of European
banks that incurred substantial mark-to-market losses and impairments on their peripheral
(Greece, Ireland, Portugal, Spain and Italy, or GIPSI) sovereign bond holdings. Since the
beginning of 2008, government bond yield spreads between pairs of European countries, for
example, between German bunds and GIPSI bonds, have widened considerably, mirroring the
economic divergence between these countries (Figure 1).1 This divergence has challenged
even the survival of the Eurozone as a whole. Since then, banks have on average lost 70% of
their market value and shed billions of euros of assets in an effort to increase regulatory
capital ratios.
[Figure 1]
We show in this paper that banks’ risks during this period can be understood as reflecting a
“carry trade” behavior. With access to short-term unsecured funding in wholesale markets,
banks appear to have undertaken long peripheral sovereign bond positions. On the upside, the
trade would pocket the “carry”, the spread between the long-term peripheral sovereign bonds
and banks’ short-term funding costs. On the downside, which has materialized, the spreads
1 For almost a decade prior to this, the ten-year sovereign bond yields for these countries hovered around the four
percent benchmark with a small yield spread difference between core and peripheral European countries.

3
between two legs of the trade diverged even further resulting in significant losses for banks
and leading to questions in funding markets about their solvency and liquidity. In essence, this
carry trade reflects a bet that Eurozone countries would converge economically resulting in a
convergence of the spread between its two legs.
Dexia SA (Dexia), a Belgian financial group and one of the largest lenders to public
sector entities, provides a quintessential example of such behavior as it invested heavily in
these carry trades (see the introductory quote). Dexia built up a risky sovereign bond portfolio
of almost a third of the bank’s total balance sheet which was financed almost 50% with short-
term funding. As the quality of the bond portfolio worsened, Dexia was unable to roll over the
financing of its assets and was bailed out in October 2011.
In this paper, we show that Dexia-style behavior has in fact been pervasive among the
Eurozone banks. More generally, we investigate the causes of the European banking crisis
and argue that banks’ substantial share price decline can in part be explained by banks placing
a bet on the survival of the Eurozone, choosing to hold peripheral sovereign bonds and
financing their investments in short-term wholesale markets. While correlations between bond
yields of Germany (or France) and peripheral sovereign bond yields were above 95% in 2005,
these correlations became negative in 2010 when markets started to demand a risk premium
for holding risky sovereign debt and short-term funding markets froze causing a flight into
longer-term core European government bonds. In other words, the banks lost on both sides of
the carry trade. All publicly listed banks that took part in the stress tests by the European
Banking Authority (EBA) are at the core of our analysis. We collect stock price data for these
banks and daily ten-year sovereign bond yields over the January 2005 to March 2012 period
and use the cross-sectional (across banks) and time-series (within bank) patterns in the
correlations between banks’ stock returns and sovereign bond returns to impute the effective
exposure of banks to sovereign debt and show these patterns to be a major determinant in
helping to explain the eventual stock price collapse of European banks.

4
We first perform a series of cross-sectional tests relating banks’ daily stock returns to
“risk factors” in the form of GIPSI bond returns and German bund returns. The factor
loadings should inform us about the banks’ exposure to these securities. We find a significant
positive correlation between banks’ stock returns and GIPSI bond returns and negative
correlations with German bund returns. European banks are thus effectively, on average, long
GIPSI government bonds and their stock returns decline when bond prices depreciate. The
negative loadings on German government bonds (bunds) suggest that banks are “short” long-
term German bunds. If long-term German bund prices appreciate whenever short-term
funding dries up (due to a flight to safety or quality) and banks are exposed to short-term
funding, then it would appear as if banks were “short” long-term German bunds. In other
words, these results suggest that banks were financing long-term peripheral bonds with short-
term debt in a carry trade.
We show a series of tests suggesting that banks were pursuing risks consistent with
these carry trade exposures: (1) we control for home bias of peripheral banks2; (2) we use the
Principal Component Analysis (PCA) to account for the collinearity of bond returns; (3) we
use French bond returns as the funding leg of the carry trade instead of Germany; (4) we use
two-year GIPSI bond yields instead of ten-year bonds as banks earn a higher carry when the
investment is long-dated; (5) we use changes in bank credit default swap (CDS) spreads as
dependent variables instead of stock returns.
In a next step, we show that these exposures relate to actual government bond holdings
of banks and do not simply reflect some other underlying economic exposures and linkages.
We use reported bond holdings by banks as well real sector exposure to firms, households and
real estate and show that actual holdings do explain our factor loadings rather than non-
sovereign holdings (both in the cross-section of banks and in time-series data for a given
2 We find a positive factor loading on the banks’ home country bond return indicating that banks are long in
sovereign bonds of their home country. Banks are usually the largest domestic bond investors (see, for instance,
the evidence in Acharya, Drechsler and Schnabl, 2010 and Gennaioli, Martin and Rossi, 2011).

5
bank). These results confirm that the factor loadings measured using market return data
indeed proxy well for the underlying European banks’ exposure to sovereign debt.
We then explore various motives for banks engaging in carry trades, namely: (1)
implicit bailout guarantees, (2) regulatory capital arbitrage, (3) risk shifting, and (4) European
Central Bank (ECB) funding, which might have made these trades more attractive for banks.
We find that larger banks are significantly more exposed consistent with large banks
exploiting an implicit bailout guarantee from their sovereign. Also, banks with a higher
percentage of short-term leverage relative to total debt have somewhat higher exposure to
GIPSI countries and lose significantly more in terms of market value when German bond
prices appreciate.
Another motive we consider is regulatory capital arbitrage under the current Basel II
regulations which assign a zero risk weight for investments in sovereign debt. The
governments may themselves have had incentives to preserve the zero risk weight to be able
to continue to borrow.3 Undercapitalized banks, that is, banks with low Tier 1 capital ratios,
now have an incentive to shift their portfolios into assets with lower risk weights in an attempt
to increase their regulatory capital ratios (regulatory capital arbitrage). Moreover, riskier
banks might shift into riskier government bonds placing a bet on their own survival (risk
shifting) as this way they shift risk into the states of the world (government defaults) where
they are likely to experience bank runs (as argued by Diamond and Rajan, 2011). We find that
banks with lower core Tier 1 ratios or higher risk-weighted assets have greater exposure to
GIPSI bonds. We find that the effects are usually stronger for Italian and Spanish exposure
because of the impairments banks have already incurred with respect to Greek government
debt.
3 The more entangled the financial sector with the governments, the more costly the government default would
be due to “collateral damage” in the form of bank runs and disruption of inter-bank and repo markets (Broner,
Martin and Ventura, 2010; Bolton and Jeanne, 2011 and Acharya and Rajan, 2011).

6
We document that banks’ current carry trades can predict their future capital offerings
and dependence on funding from central banks. For example, we find that banks with more
carry trade exposure to Greek government debt raise more capital relative to other banks thus
reflecting the impairments they incurred following the private sector involvement and
bailouts. We find that banks with more carry trade exposure depend more on the ECB relative
to other financing sources in the following year. Banks with high exposure to short-term
funding are particularly reliant on ECB financing. Large banks that benefit from implicit
government guarantees are, on the other hand, less likely to obtain ECB funding.
In the final part of the paper, we analyze the time-series of carry trade exposures.
Since the Lehman default, we observe a widening of the spreads between peripheral and
German government bonds. The ECB started its “original” Long-Term Refinancing
Operations (LTRO) in 2009 with three one-year tenders on June 6, 2009, September 30, 2009,
and December 16, 2009.4 We document a jump in the correlation of banks’ stock and Italian
bond returns when the money was injected into the markets, which is consistent with banks
placing a bet on the temporary divergence of government bond yields.5
The ECB started another one-year LTRO on October 27, 2011 responding to
increasing pressure on short-term funding markets. In the subsequent month, the estimated
factor loadings suggest significantly higher exposure towards Italian sovereign debt, in
particular of large and poorly capitalized banks, but in this case with a partial easing of
funding pressure. Interestingly, our findings show that during the final months of our sample
period, highly capitalized banks suffered more from tightening interbank markets suggesting
that banks had very selectively been able to borrow short-term in the interbank or commercial
4 Overall, the ECB lent EUR 614 billion at an interest rate of 1% to European banks at that time.
5 The results from the quarterly regressions support this observation. For instance, the loading on Italian bond
returns doubles in Q2 2009 when the first LTRO took place, which amounted to EUR 442 billion (that is, 72% of
all three operations). Interestingly, the loading on German bunds became more negative suggesting that the ECB
measure did not release existing tension in short-term funding markets for banks. Data on the quarterly flow of
funds into public sector entities (loans and government bonds) obtained from the Deutsche Bundesbank shows
that more than EUR 250 billion have been invested by European banks in the first three quarters of 2009 and
about EUR 30 billion in the first quarter of 2010, after the third one-year LTRO.

7
paper markets. Two three-year LTROs were allotted on December 26, 2011 and February 29,
2012.6 We document a further expansion of the carry trades of larger, poorly capitalized
European banks. Again, particularly banks refinanced with more short-term debt increased
their exposures. These results are particularly strong for non-GIPSI banks, less so for GIPSI
banks emphasizing that moral hazard causes the former to pursue these risks.
In the last part of the paper we document that European banks did not use the funds
provided by the ECB since 2009 to increase lending to firms but rather decreased their loan
relative to their bond portfolio. Using bank balance sheet data we find that the cross-
correlation of the time-series of loans to non-financial firms and government securities is -
0.15 across all European banks over our sample period. Moreover, Italian and Spanish banks
have substantially increased their government securities portfolios consistent with the analysis
of our factor loadings above. At the same time, they have significantly reduced lending to the
real sector.
The paper now proceeds as follows. The next section discusses a case study about the
buildup and subsequent failure of Dexia. Section II describes the data and provides
descriptive statistics. In Section III, we analyze various motives for banks to engage in carry
trades. In Section IV, we analyze the effect of carry trades on future capital raisings and
dependence on ECB funding. In Section V, we explore the role of the ECB in funding the
carry trades. Section VI concludes.
I. Background and Methodology
A. Dexia SA – A Carry Trade Gone Awry
Dexia SA was formed in 1996 through a merger of Crédit Local (France) and Crédit
Communal (Belgium). In October 2011, the Dexia Group was bailed out for a second time
6 Even though there have been some redemptions of ECB funding (and some banks might have replaced short-
term with long-term ECB funding), the lending to euro area credit institutions changed by EUR 335 billion in
December 2011 and EUR 448 billion in the week of the respective LTRO operations according to data released
by the ECB.

8
because of carry trades that went wrong (see the quote of Dexia’s current CEO at the start of
the paper). This section provides a brief overview how the situation unraveled.
Dexia built a proprietary portfolio of mainly bonds amounting to EUR 203 billion at
the end of 2008 (about 32% of its balance sheet).7 These investments were mainly carry-
trades, financed in short term wholesale markets. The bond exposure was mainly to fixed rate
bonds. Dexia hedged the interest rate risk using credit derivatives. Thus, afterwards, the
interest rate risk was mainly floating rate risk and cash flows became sensitive to short term
interest rates. The sovereign debt crisis started in November 2009 when Greece forecasted an
annual budget deficit of 12.7% for 2009. During the following months, Greece, Portugal and
Spain announced first austerity measures to reduce the indebtness of each respective country.
Spain was downgraded by S&P losing its AAA rating in April 2010 and Greece was
downgraded below investment grade. In May 2010, the Eurozone countries and the IMF
agreed to the first EUR 110 billion bailout package for Greece. On May 5th, the ECB
announced that it would have started to accept Greek sovereign bonds as collateral whatever
the rating might be responding to the tensions in the funding market. The European
Commission explicitly addressed its concerns with respect to the large amount of sovereign
debt in Dexia's portfolio and the use of interest rate derivatives which "probably requires
significant collateral for Dexia, which may reduce its eligible collateral base for financing
from the central banks or in the interbank repo market" (EC (2010)). 8
Even though Dexia made considerable progress in reducing its dependence on short-
term wholesale funding and its overall balance sheet, it was poorly capitalized (given the huge
impairments due to the deleveraging process) in summer 20119, i.e. when the crisis became
worse, which contributed to the subsequent run on the bank. Moreover, both Moody's and
7 Holding a large amount of securities given Dexia's funding imbalances was even encouraged by rating
agencies: "Dexia's widely diversified funding base and the liquidity reserve provided by its large securities
portfolio offset its reliance on wholesale capital markets." (S&P Ratings Direct, 22 May 2008). 8 Dexia held a portfolio of GIPSI sovereign bonds amounting to EUR 26.1 billion as of March 31st, 2010
consisting mainly of Italian bonds (EUR 17.6 billion) and Greek government bonds (EUR 3.7 billion). 9 Dexia’s Tier 1 ratio fell to 7.56% at end of 2011 due to losses incurred while Dexia divested its assets.

9
S&P placed Dexia's ratings under review for possible downgrade. As reported by the group,
EUR 22 billion in unsecured short-term funds have been withdrawn between April and June
2011 and their US Dollar position has been impacted first. Consequently, Dexia needed to
rely increasingly on central bank funding which reduced the amount of available collateral for
further repo transactions. Figure 2 shows the pairwise correlation of Dexia’s stock return and
Italian bond returns and its stock return and German bund returns from January 2011
onwards.
[Figure 2]
The graphic (Figure 2.A) shows strikingly how the two legs of the carry trade
diverged when Italian yields surged and German bund yields continued to fall as investors
continued their flight into long-term German government bonds. Dexia lost about EUR 40
billion short-term funding within 6 month in the second half of 2011. An additional EUR 6
billion unsecured short-term funding was withdrawn during the July - September period, and
another EUR 6 billion after Moody's announcement of placing the group's long and short-term
rating under review for possible downgrade on October 3rd, 2011. Moreover, the group lost
commercial deposits of EUR 7 billion in the fourth quarter of 2011. Figure 2.B. shows the 1-
year CDS spread of the banking subsidiary Dexia Crédit Local. The CDS spread increased
within a few weeks after June 2011 from 200bps to 1,000bps reflecting its rise in short-term
funding costs as well as the market expectation of Dexia’s default probability over the next
year. Dexia's derivative positions put even more pressure on short-term funding. Between
June and September 2011, Dexia had to post EUR 15 billion cash collateral due the fall in
interest rates. Figure 2.C shows the stock price decline and the market value loss Dexia
incurred when the carry trade went under.

10
During the rest of this paper, we argue that Dexia’s behavior has been widespread
among European banks.
B. Methodology
Our approach is to infer European banks’ sovereign risk exposure from asset prices as
information about bond holdings is only sporadically available around stress tests. Our basic
regression model is as follows:
Stock Returnit = α + βGIPSI x GIPSIt + βGermany x Germanyt + γ x Stock Indext + εit (1)
The factor loadings (βGIPSI, βGermany) provide us with an estimate of the size and
direction of the exposure to each security. One obvious concern is that there are other
(unobserved) factors that explain banks’ stock returns. For example, changes in expectations
about macroeconomic fundamentals such das employment, growth or productivity in the euro
area that affect the profitability and risk profile of the banks will be reflected in stock prices.
We use two strategies to address this concern. First, we include a proxy for each country’s
stock index (Stock Indext ) which is the residual from the regression of a country’s home index
return on the domestic sovereign and German bond returns.10
The residuals are by definition
orthogonal to the regressors, and more cleanly reflect the effect of changes in macroeconomic
fundamentals in each country. Second, we cluster standard errors at two dimensions, bank and
quarter, to account for (unobserved but time-variant) variation that is both bank specific in
different quarters and that is common across all banks in the same quarter.
Our hypothesis is that carry trades reflect moral hazard of riskier banks. To identify
this, we augment (1) with risk factors (RISK) obtained from bank balance sheets, such as asset
10
We additionally perform several robustness tests using a variety of macroeconomic state variables that directly
measures changes in fundamentals.

11
size, loan-asset ratios, short-term leverage, Tier 1 ratio and risk-weighted assets and estimate
the following cross-sectional regression.
Stock Returnit = α + βGIPSI x GIPSIt + βGermany x Germanyt + ∑ βGIPSIxRISK x GIPSIt x RISKi,t-1
+∑ βGermanyxRISK x Germanyt x RISKi,t-1 + ∑ βRISK x RISKi,t-1 + γ x Stock Indext + εit (2)
βGIPSIxRISK provides us with an estimate of the additional exposure of riskier banks.
Our methodological approach accommodates various alternative explanations as to
why banks hold sovereign debt. For example, our factor loadings could measure exposure of
GIPSI banks to GIPSI sovereign debt (“home bias”). Estimating (2) separately for non-GIPSI
and GIPSI banks helps to address this. Moreover, it is unlikely that there is a feedback effect
from banks to the non-domestic sovereign. Peripheral banks have other incentives to hold
domestic sovereign debt. The government might have asked them to buy their own sovereign
debt in an attempt to lower yields (“(im-) moral suasion hypothesis”). Peripheral banks also
have an advantage to hold debt of their own country in the case of a break-up of the Eurozone
(“redenomination hypothesis”). While it is difficult to distinguish between the suasion and
redenomination hypotheses, our estimates from (2) clearly distinguishe the moral hazard
(carry trade) hypothesis from the alternatives which is the focus of this paper.
II. Data and Descriptive Statistics
A. Data
To identify the effects of banks’ carry trades on stock returns, we construct a dataset using
three major data sources. We collect market information (bank stock prices, bank and
sovereign CDS spreads, and sovereign bond yields) from Bloomberg, information about bond
portfolio holdings from the European Banking Authority (EBA) and annual and quarterly
reports from the banks, and financial information from SNL Financial as well as company

12
reports. We augment the data with information from S&P Credit Portal, investor presentations
and the European Central Bank and Bank of International Settlement (BIS).
We start with all public European banks included in the EBA stress tests. A list of
these banks is included in Appendix II.11
We collect financial information such as size,
leverage and capitalization as well as information about capital offerings from SNL Financial.
In addition, we compute stock returns from daily stock prices. We use ten-year government
bond yields, which are observed on a daily basis during the January, 1 2005 to March 5, 2012
period. Stock and bond prices are collected from Bloomberg.
Information about banks’ actual portfolio holdings of sovereign bonds is obtained
from the European Banking Authority. The EBA took over the responsibilities from the
Committee of European Banking Supervisors (CEBS) on January 1, 2011. They have been
responsible for five stress tests and capitalization exercises that have been conducted in the
European banking market since 2010 to “ensure the orderly functioning and integrity of
financial markets and the stability of the financial system in the EU.”12
The results of the tests
together with detailed information about banks sovereign bond portfolios were published for
the following reporting dates: (1) March 2010, (2) December 2010, (3) September 2011, (4)
December 2011 and (5) June 2012.13
Finally, we collect the euro amount of funding obtained
from the ECB from the quarterly and annual reports from each bank.
B. Descriptive statistics
We provide descriptive statistics for the returns of GIPSI sovereign bonds as well as German
ten-year government bonds in Table I. Panel A of Table I shows the mean daily bond returns.
11
We exclude six banks from our analysis either because of data availability or because the bank is part of a
banking group where the parent owns the vast majority of stocks. There are: Bankia (BKIA), Raiffeisenbank
International AG (RBI), Österreichische Volksbanken AG (VBPS), Caja de Ahorros del Mediterraneo (CAM),
Hypo Real Estate (HRX) and Irish Life and Permanent (IPM). 12
A stress test was already done in 2009, but neither the names nor details about the results were disclosed
except for the information that all institutions were adequately capitalized. 13
The data is publicly available on the website of the EBA (http://www.eba.europa.eu/Home.aspx).

13
Greek government bonds have the highest negative return as well as the highest variance
followed by Portugal and Ireland. All three countries have already been bailed out by the
European Union. Germany and France both have positive daily returns with a small variance.
[Table I]
Table I also contains correlations between the returns in 2005 (Panel B) and 2011/2012 (Panel
C). In 2005, bond returns were almost perfectly correlated, usually above 0.9 both between
the GIPSI countries, but also between GIPSI and core European countries. This demonstrates
that these countries were perceived by investors as being almost identical despite the major
economic differences between them. Greece and German government bond returns, for
example, had a correlation of 0.96. This changed significantly as the sovereign debt crisis
unfolded. In 2011/2012, the correlation between GIPSI and German bond returns became
negative showing the divergence within the Eurozone.
Table II contains descriptive statistics on bank characteristics and stock and bond
returns.
[Table II]
Panel A of Table II reports summary statistics on bank characteristics calculated at the bank
level. Log-Assets is the natural logarithm of total book assets. Book-LVG is measured as total
book assets divided by book value of equity. ST-LVG is short-term debt divided by total debt.
Assets/RWA is book assets divided by risk-weighted assets. Tier 1 is the Tier 1 capital
divided by risk-weighted assets. On average, 33% of the total debt is short-term debt and
banks have a Tier 1 ratio of 9.3%. Capital (Yes/No) is an indicator variable that is 1 if the
sample banks raised common or preferred capital during the January 2007 and February 2012
14
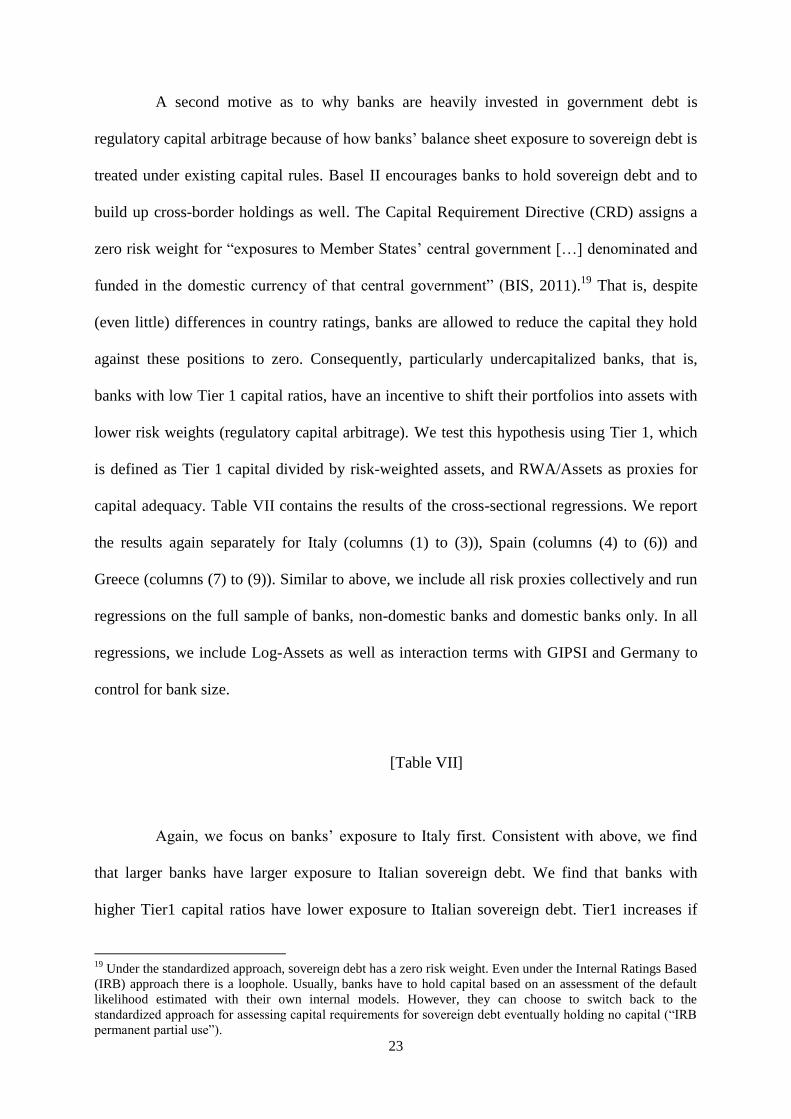
period. Eighty-six percent (86%) of them issued capital during that time period. Moreover,
7% of total assets is, on average, funding obtained from the ECB.14
Panel B provides time-
series characteristics of banks’ stock returns and CDS prices observed on a daily basis. The
average daily (quarterly) realized return is -0.14% (-6%) and the average five-year CDS
spread is about 183 basis points. We also show that average factor loadings estimated
quarterly for each bank are positive for both Italy and Greece and negative for Germany
suggesting significant exposure of European banks to peripheral sovereigns. Panel C of Table
II provides descriptive statistics of the estimated factor loadings, for the full sample of banks
and separately for GIPSI and non-GIPSI banks. The mean factor loadings for peripheral bond
exposure (Italy, Spain and Greece) are positive and suggest, on average, more exposure of
banks to Italian sovereign debt. A large negative loading of German bunds indicate the
funding pressure on banks during our sample period due to a flight to quality of investors.
Interestingly, the factor loadings for Italian and Spanish bonds are larger for the non-Italian
and non-Spanish banks, respectively. This shows that non-domestic banks had large
exposures to the periphery. Panel D of Table II finally shows European banks’ total bond
holdings of GIPSI government debt at five reporting dates. Again, we provide these statistics
for the full sample and for GIPSI and non-GIPSI banks separately.15
We document that the
total exposure of banks towards Italian government debt did not decrease substantially during
the March 2010 and June 2012 period; we only observe a decrease from EUR 264.5 billion to
EUR 258.9 billion. In the subsample of non-Italian banks, this exposure declines from EUR
115 billion to EUR 69 billion in the same period which is still substantial. This exposure is
14
The difference as to the dependence on ECB funding between banks is appalling. While mostly peripheral
banks (such as Greek banks) are entirely dependent on the ECB to obtain liquidity, other banks (for example, in
Germany or France) can refinance themselves in other ways, further highlighting the divergence between the
European core and periphery. There is a huge divergence as to each bank’s dependence on ECB funds, from
almost zero dependence to fully dependent. The top five ECB-dependent firms are Bankinter, ATEbank, Banco
Commerciale Portuguese, Piraeus Bank and Alpha Bank. The five least ECB-dependent firms are RBS, Société
Générale, BNP Paribas, Banco Sabadell and Crédit Agricole. Apparently, the peripheral banks especially
struggled to obtain financing from interbank markets or any source other than the ECB, while large core
European banks barely relied on ECB financing. 15
GIPSI banks means that we report only the exposures of Greek banks, Italian banks, etc. to their domestic
sovereign.

15
also somewhat increasing after December 2011, most likely through additional purchases
from banks financed with (cheap) ECB liquidity. GIPSI banks increased their exposure over
this period.16
For example, Italian banks invested about EUR 37 billion in domestic sovereign
debt between December 2011 and June 2012; Spanish banks increased their exposure to the
Spanish government debt by about EUR 13 billion.
III. Cross-Sectional Analysis of Stock and Bond Returns
To investigate whether the use of carry trades can explain Eurozone bank risks, we estimate
the factor loadings in regressions of banks’ stock returns on government bond returns. The
lack of micro level changes in portfolio holdings of banks gives these tests more power. We
relate the loadings to actual bond portfolio holdings that we can observe once they have been
disclosed in the European stress tests. Moreover, we exploit cross-sectional variations in bank
characteristics to analyze differences in the factor loadings to investigate the moral hazard
(carry trade) motive vis-à-vis the alternatives.
A. “Carry trade” behavior of European banks
In our first set of tests, we regress banks’ daily stock return on the return of ten-year
peripheral government bonds and German bunds. The results are reported in Table III.
[Table III]
Model (1) estimates the correlation between stock and Greek government bond returns. We
find a significant positive correlation between banks’ stock returns and Greek bond returns,
which suggests that banks have, on average, exposure to Greece and stock prices decline
when bond prices decline. The factor loading on German bond returns is negative suggesting
16
Note that Greek banks did not participate in the stress tests or capitalization exercises since September 2011.

16
that banks are “short” long-term German bonds. This is consistent with a “carry trade”
behavior of European banks: they appear to have invested in long-term government bonds
financed in the short-term wholesale market to maximize the carry between both legs of the
trade. The negative factor loading on German bunds reflects a “flight to quality” of investors
who purchase long-term safe (German) government bonds, at the same time reducing the
supply of short-term capital. If long-term bond prices appreciate whenever short-term funding
dries up and banks are exposed to short-term funding, then it appears as if banks were short
long-term bonds. The positive and significant coefficient of Stock Index suggests that
macroeconomic fundamentals are important in explaining bank stock returns. We replace
Greek government bonds with Italian, Spanish, Portuguese and Irish bonds in models (2) to
(5) and include all GIPSI bond returns together in model (6). All results extend to these
models as well. Model (6) in particular suggests that carry trade investments were mostly
undertaken in Greek and Italian long-term government bonds. The factor loadings are both
economically and statistically significant and the R² of the models show that a substantial
proportion of the variation in stock returns is explained by these covariates. In Panel B of
Table III, we report a series of tests that supports the notion of “carry trade” behavior of
European banks.
Banks are usually the largest domestic bond investors. To ensure that our factor
loadings do not reflect a “home bias” in sovereign bond holdings of banks, we include the
home country bond return (Home) of each bank in model (1). Home, as an example, reflects
the amount of Italian government debt that is held by Italian banks. The positive factor
loading on the banks’ home country bond return indicates that banks are long in sovereign
bonds of their home country. The factor loadings of Italian and German bonds do not change
materially suggesting Italian bonds as primary asset class for carry trades. Interestingly, the
factor loadings of Greek bond returns are insignificant. Thus, it is important to differentiate
between the motives of non-peripheral banks to hold peripheral sovereign debt and of

17
peripheral banks to hold domestic debt and explore the dynamics of this relationship. Our
empirical approach carefully accounts for these dynamics both in the cross-section and in the
time-series.
We include a variety of other macroeconomic state variables to control for changes in
macroeconomic fundamentals that could drive both stock and sovereign bond prices, namely:
(i) We follow the empirical literature and use the VSTOXX index, the European counterpart
to the VIX index for the S&P 500, VSTOXX is the change in the VSTOXX Index for the
European stock market; (ii) Term Structure is the slope of the term structure of interest rates
measured as the difference between the yield on a ten-year euro area government bond and
the one-month Euribor; (iii) Bond Default Spread is the difference between the yield on ten-
year German BBB bonds and yields on ten-year German government debt; (iv) 1 month
EURIBOR is the level of the short-term risk-free interest rate measured as the one-month
Euribor; (v) ∆European Economic Sentiment is the monthly change in the economic
sentiment indicator obtained from opinion surveys conducted by the European Central Bank;
(vi) ∆Level of Industrial Production is the monthly change in the level of industrial
production; (vii) ∆European Consumer Price Index is the change in inflation measured as the
monthly change in the European Consumer Price Index. Model (2) reports the results. Most
importantly, the factor loadings do not change including these variables.
Bond markets, particularly the sovereign debt market, are characterized by a high
degree of collinearity. PCA offers a way to construct different linear combinations of the
factor returns that are uncorrelated with each other using the covariance matrix of the returns.
As the covariance matrix is symmetric, it has linearly independent eigenvectors corresponding
to the number of positive eigenvalues. The eigenvectors are called principal components and
are ranked according to the eigenvalue. The first principal component (PC1) is thus the linear
combination of GIPSI bond returns with the highest eigenvalue. It is the component that
explains the largest part of the variation in GIPSI bond returns. Instead of using the GIPSI

18
returns as independent variables, we regress the banks’ stock return on PC1 and Germany. We
find a positive and significant relationship between PC1 and stock returns, which is consistent
with the carry trade behavior of banks.
In model (3), we substitute French for German government bonds and find a negative
and significant coefficient, which is smaller in magnitude compared to the factor loadings of
German bunds. This is reflecting the increasing divergence of yields between French and
German government debt that started in 2011. The coefficients of Greece and Italy are even
stronger.
If banks undertake carry trades, these are most profitable if investments are as long-
dated and funding as short-term as possible. We would thus expect lower exposures of banks
to, say, two-year GIPSI sovereign bonds. Model (4) substitutes two-year GIPSI government
bonds for ten-year bonds used in all previous models. The coefficient of Greece is reduced by
a factor of 6 and the coefficient of Italy is reduced by at least half, consistent with the carry
trade behavior of banks. Note that lower factor loadings on the two-year GIPSI government
bonds do not reflect a shorter duration of two-year vis-à-vis ten-year bonds. In fact, factor
loadings should be larger if caused by differences in duration. To see this, suppose that the
following simple relationships of banks’ stock returns (R) and government bond returns (IR)
hold: , and
Substituting these relationships
shows that betas should actually be higher in the case of two-year sovereign bonds.
Carry trade exposure should also be reflected in CDS spreads as an important proxy
for bank risk and bank funding costs. We would expect to see that CDS spreads reflect a
widening of the gap between GIPSI bond and German bund yields, either through an increase
in peripheral bond yields or through worsening funding conditions. We test this in models (5)
and (6) and use Δ Log (Bank CDS) as a dependent variable, which is the change in the natural
logarithm of daily bank CDS spreads. As reported in column (5), the coefficient of Greek
bond returns is negative and significant, whereby, if Greek bond prices fall, banks experience,

19
on average, an increase in their CDS spreads. Moreover, if German bund prices appreciate,
banks’ funding costs also rise, ceteris paribus, pointing to their exposure to short-term
wholesale markets. The PCA in model (6) shows a similar result.
Overall, and across our various tests, we find strong evidence indicating that European
banks were betting on the convergence of yields in the Eurozone in the form of carry trades.
Yields, however, have diverged even further since the beginning of 2010, which is reflected
in lower stock prices and higher CDS spreads.
.
B. Factor loadings and banks’ direct exposures
Do these exposures relate to actual government bond holdings of banks or simply reflect some
other underlying economic exposures and linkages? To address this important question, we
exploit the data disclosed by the EBA after stress tests and capitalization exercises. Since June
2010, the EBA has disclosed bank level sovereign bond holdings at five reporting days.17
Moreover, we know each banks’ real and financial sector holdings as of 31 Dec 2010. Our
analysis proceeds in two steps: first, we show that our measure of sovereign exposure
explains a significant proportion of the variation of sovereign bond holdings both in the cross-
section of banks as well within banks. Second, we analyze the relative importance of
sovereign relative to real sector exposure in explaining our factors loadings estimated around
the 31 Dec 2010 reporting date. In a first step, we relate the factor loadings estimated for each
bank in the time period 60 days before and 60 days after each reporting date on the sovereign
bond holdings scaled by total assets. To visualize this relationship, we plot the factor loadings
on the sovereign bond holdings for each reporting date and country separately in Figure 3. We
use logs for illustration purposes.
[Figure 3]
17
Note that not all banks participated in all stress tests or the capitalization exercise.

20
The scatterplot shows a positive relationship between factor loadings and portfolio
holdings. We perform cross-sectional (across banks) and time-series (within bank) regressions
of loadings on bond holdings and find a consistent pattern. We report the results in Table IV.
[Table IV]
Models (1) to (4) relate βItaly to banks’ Italian sovereign bond holdings (Italy-
Sov/Assets) while models (5) to (8) focus on Spain (βSpain) and models (9) to (12) on Greece
(βGreece). Models (1), (5) and (9) analyze the full sample of banks, all other models exclude the
banks headquartered in the country that we analyze, for example, Italy in models (2) to (4).
Standard errors are clustered at the bank level. We find that banks with larger reported Italian
bond holdings also have larger factor loadings both in the full sample and in the sample of
non-Italian banks. Model (3) adds indicator variables for each reporting date (omitted group is
March 2010). The negative coefficients suggest that non-Italian banks have reduced their
exposure to Italy since March 2010. Smaller coefficients in December 2011 and June 2012,
however, suggest that they have added Italian sovereign exposure since September 2011. Our
conjecture is that non-Italian banks used funds from the two 3-year LTROs to finance
additional sovereign bond purchases in further carry trades. Model (4) adds bank fixed effects
showing that, also within banks, higher reported Italian sovereign holdings are associated with
larger factor loadings. These results extend to Spain and Greece as well.
In a second step, we use the data on banks’ real sector exposure in each country. One
could argue that our factor loadings reflect cross-border investments of internationally active
banks rather than exposure to sovereign debt. We construct a new variable Italy-Real/Assets
which is the sum of each bank’s exposure to firms, the retail sector (including retail real
estate) and commercial real estate scaled by total assets. Real sector exposures to Spain and

21
Greece are constructed accordingly. Table V reports the results of regressions of our factor
loadings estimated 60 days before and after 31 Dec 2010 on real sector and sovereign
exposure.
[Table V]
Using Italy as an example, models (1) and (2) shows that our factor loadings are
positively related to reported sovereign and real sector exposure in separate regressions.
Model (3) includes both types of exposures and model (4) excludes Italian banks. Particularly
in our sample of non-Italian banks, we find that sovereign holdings explain our factor
loadings while real sector exposures are not significantly related to the latter. Interestingly,
around this reporting date, we do not find a significant relationship between factor loadings
and sovereign holdings among the sample of non-Spanish banks. Moreover, Greek factor
loadings are associated with real-sector exposure of non-Greek banks which is intuitive given,
for example, the exposure of Greek banks to retail and corporate clients through their Greek
subsidiaries. These findings point to interesting differences and dynamics between countries
and over time. They also suggest that Italian sovereign debt is the primary asset class for
banks’ investment in carry trades.
C. Bank risk and leverage
In the next step, we investigate various characteristics of banks with significant
sovereign debt exposure. Particularly risky banks should be more likely to invest in carry
trades (“gambling”). We investigate this hypothesis in Table VI separately for exposure to
Italy (models (1) to (3)), Spain (models (4) to (6)) and to Greece (models (7) to (9)).
[Table VI]

22
We use three proxies for bank risk, namely bank size (Log-Assets), short-term
leverage (ST-LVG) as proxy for risk on the liability side and the size of the loan portfolio
(Loans/Assets) as proxy for risk on the asset side of the balance sheet. In all tests, we use the
one-year lagged bank characteristics to identify the effect of banks’ risk on their carry trade
behavior.18
As in previous tests, standard errors are clustered at the bank and quarter level.
We include all risk proxies collectively and run regressions on the full sample of banks, non-
domestic banks and domestic banks only.
We document in the full sample that larger banks (i.e. banks with more international
focus, more wholesale funding and that are more systemically important) have larger
sovereign exposures to Italy. Also, riskier banks, i.e. banks with more short-term leverage and
loan to asset ratios have more exposure. On the funding side, we find that banks with more
short-term funding have significantly more short-term funding exposure. More importantly,
we find that these results are particularly strong for the sample on non-Italian banks. These
results provide strong support for the carry trade hypothesis but are not consistent with
alternative hypotheses such as home bias or suasion. Larger Italian banks have more exposure
to their own domestic sovereign debt. Interestingly, riskier Italian banks have lower sovereign
exposure suggesting that moral hazard (even though there is some evidence) is not the only
motive of these banks to hold domestic sovereign debt. We document similar results as to
European banks’ exposure to Spanish sovereign debt. Interestingly, we find strong evidence
consistent with carry trade behavior also among the sample of Spanish banks. The results are
a bit muted with respect to exposures to Greek sovereign debt.
D. Capital adequacy
18
ST Debt and Loans/Assets are included in addition to the interaction terms in the respective models as well as
a constant term, but all remain unreported for brevity. Log-Assets is added as a control variable in all models.
23
A second motive as to why banks are heavily invested in government debt is
regulatory capital arbitrage because of how banks’ balance sheet exposure to sovereign debt is
treated under existing capital rules. Basel II encourages banks to hold sovereign debt and to
build up cross-border holdings as well. The Capital Requirement Directive (CRD) assigns a
zero risk weight for “exposures to Member States’ central government […] denominated and
funded in the domestic currency of that central government” (BIS, 2011).19
That is, despite
(even little) differences in country ratings, banks are allowed to reduce the capital they hold
against these positions to zero. Consequently, particularly undercapitalized banks, that is,
banks with low Tier 1 capital ratios, have an incentive to shift their portfolios into assets with
lower risk weights (regulatory capital arbitrage). We test this hypothesis using Tier 1, which
is defined as Tier 1 capital divided by risk-weighted assets, and RWA/Assets as proxies for
capital adequacy. Table VII contains the results of the cross-sectional regressions. We report
the results again separately for Italy (columns (1) to (3)), Spain (columns (4) to (6)) and
Greece (columns (7) to (9)). Similar to above, we include all risk proxies collectively and run
regressions on the full sample of banks, non-domestic banks and domestic banks only. In all
regressions, we include Log-Assets as well as interaction terms with GIPSI and Germany to
control for bank size.
[Table VII]
Again, we focus on banks’ exposure to Italy first. Consistent with above, we find
that larger banks have larger exposure to Italian sovereign debt. We find that banks with
higher Tier1 capital ratios have lower exposure to Italian sovereign debt. Tier1 increases if
19
Under the standardized approach, sovereign debt has a zero risk weight. Even under the Internal Ratings Based
(IRB) approach there is a loophole. Usually, banks have to hold capital based on an assessment of the default
likelihood estimated with their own internal models. However, they can choose to switch back to the
standardized approach for assessing capital requirements for sovereign debt eventually holding no capital (“IRB
permanent partial use”).

24
banks have higher RWA or if they decide to hold more economic capital. For a given amount
of RWA, the negative coefficient implies higher risk-shifting incentives. Moreover, the
positive coefficient on RWA/Assets (unlike the sign on Tier1) suggests that there is a
regulatory arbitrage motive. Only including one of these variables might result in biased
estimates of the coefficients due to confounding effects.20
Moreover, we find that banks high
exposure to short-term funding have significantly more exposure to Italy. Additionally,
European banks with more short-term debt are also more exposed to funding shocks. These
results hold both in the full sample as well as in the subsample of non-Italian banks and
provide strong support for carry trade (moral hazard) behavior of European banks.
Interestingly, we do not find statistically significant evidence that Italian banks are investing
more in domestic sovereign debt if they are more risky (that is, have lower capital ratios or
higher RWA or short-term debt), which is in line with our earlier result from Table VI.
Domestic banks most likely have different motives to invest in own sovereign debt (over and
above the carry trade motive).
The results extend to European banks’ exposure to Spanish government debt.
However, we find strong evidence that even Spanish banks with low Tier 1 capital ratios and
high RWA / Assets invested more in domestic sovereign debt compared to better capitalized
Spanish banks and they also were more exposed to short term funding. In other words, these
results are consistent with carry trade (moral hazard) behavior among Spanish banks. As seen
above, the effects on Greek government bond holdings are (not surprisingly) somewhat
muted.
Overall, our results show that particularly risky and undercapitalized (non domestic)
banks are purchasing more Italian and Spanish (and to a lesser degree) Greece government
debt consistent with carry trade behavior of these banks.
20
In unreported results, we include either Tier 1 or RWA / Assets and find that the coefficient of Tier 1 is less
negative when we do not control for RWA / Assets. This result suggests that the discretionary part of Tier1
capital is more strongly related to the risk-shifting motive. In other words, not controlling for RWA understates
the risk-shifting effect in model.

25
IV. Capital Offerings of European Banks and ECB Funding
As the sovereign debt crisis unfolded, sovereign yields continued to climb and investors fled
to high-quality assets such as German bunds. Interbank market froze and banks’ equity value
dropped substantially. Do banks’ carry trades predict future capital offerings? Did they
become particularly dependent on ECB funds? These is an important question for regulators
in Europe as the carry trade behavior of banks could have led to massive disruptions in the
interbank markets and required regulators to step in with emergency funding. To answer
them, we collect all common and preferred stock issuances of our sample banks over the
January 2007 to February 2012 period on a quarterly basis. 86% of them raised capital during
this period.21
We also collect information about each bank’s liabilities from repurchase
agreements to banks, customers and the ECB from their annual reports over the 2008 – 2010
period.22
We construct two dependent variables. Log-Capital is the natural logarithm of the
amount of common and preferred capital raised. ECB /Assets is the percentage of each bank’s
funding obtained from the ECB in each year divided by total assets of the banks. Both
variables are our main dependent variables. To construct proxies for banks’ carry trade
behavior, we run the quarterly regressions for each bank and calculate the predicted return in
each quarter. The predicted return can be interpreted as the part of the returns that is induced
by carry trades. As additional proxies, we use the estimated vector of factor loadings for
Greece, Italy and Germany. The results are reported in Table VIII.
[Table VIII]
21
We do not differentiate economically between common and preferred stock and add both volumes on a
quarterly basis. 22
We use annual reports as, even though these are stock exchange listed banks, many of the mostly peripheral
banks do not provide quarterly reports (or semi-annual reports) and the few that do are usually not in English and
with very limited information.

26
In models (1) and (2), we first relate Log-Capital and ECB / Assets to the realized return in
the previous quarter. All regressions include Log-Assets as the additional control variable.
Standard errors are clustered at the bank and quarter level. The results suggest that banks with
lower realized returns as well as larger banks raise more capital in the subsequent quarter.23
While realized returns do not (at least statistically) significantly predict ECB dependence, we
find that larger banks depend less on funding from central banks. We find that the lower the
banks’ stock return from carry trades, the higher the capital offering in the following quarter
(model (3)). Predicted returns do not predict ECB dependence. As a third test, we use the
estimated factor loadings, βGreece in columns (5) and (6) and βItaly in columns (7) and (8).
Banks with larger exposure to Greece raised more capital in the next quarter. We do not find
that this result extends to the exposure to Italian bonds suggesting that it is not the exposure in
and of itself, but the impairments and capital loss incurred that consequently prompted banks
to raise capital. During our sample period, banks only impaired their Greek bond holdings
because of the private sector involvement (PSI) when negotiating the bailouts. However, we
find some evidence that banks with larger carry trade exposure to Italy needed to rely more on
ECB funds (model (8)). Consistent with increased funding pressure on banks with larger carry
trade exposures as measured by more negative βGermany, we find that these banks needed to
raise more capital and were more dependent on ECB funding as well.
V. Time-Series of Carry Trade Exposures
A. Building up a portfolio of “cheap” sovereign debt
In the “original” one-year Long-Term Refinancing Operations (LTRO) in 2009, the ECB lent
about EUR 614 billion to European banks at an interest rate of one percent.
23
In unreported tests, we use an indicator variable Capital (Yes/No) which is one if a bank raises capital in a
given quarter and find, consistent with the reported results, that banks that have higher realized and predicted
returns are less likely to raise capital in the subsequent quarter.

27
“The original LTROs, for instance, allowed some banks to go on a buying spree –
using inexpensive ECB funds to snap up higher-yielding assets in a classic ‘carry trade’.
Unfortunately many of those investments appear to have taken the form of government debt
from the region’s weaker nations, strengthening the link between troubled sovereigns and
banks which Europe is trying to desperately break” (Tracy Alloway, FT, October 2011).
Moreover, “the banks pretty much used the last opportunity of getting cheap money
to invest in sovereign debt they thought was even cheaper” (Gary Jenkins, Head of Fixed
Income at Evolution Securities). In other words, banks thought that the divergence in yield
spreads between, for example, German bunds and peripheral bonds at that time compared to
the year preceding the financial crisis was temporary and yields would ultimately converge,
which is the motivation behind the carry trade.
[Figure 4]
Figure 4 shows the average 30-day rolling correlations between the stock return of our sample
banks and Italian bond returns as well as German bunds as two time-series for the January
2005 to February 2012 period (Figure 4.A) and since January 2011 (Figure 4.B). The red lines
indicate the four one-year LTROs of the ECB on June 6, 2009, September 30, 2009,
December 16, 2009 and October 27, 2011 as well as the first three-year LTRO on December
20, 2011. We find a strong increase in correlation between stock and Italian government bond
returns following the capital injections by the ECB in 2009 consistent with banks
substantially building up their Italian bond holdings.24
Figure 4.b strikingly shows how the spread between two legs of the carry trade
diverged resulting in significant losses for banks. In the first half of 2010 and particularly
24
There are some estimates reporting that from the first one-year LTRO in June 2009, which amounted to EUR
442 billion, half was invested in peripheral government debt. Interestingly, German banks are supposed to have
taken up most of this money (about EUR 126 billion) followed by French banks (EUR 85 billion) and Spanish
banks (EUR 53 billion).

28
since April 2011, correlations between stock and peripheral bond returns on the one hand and
core European bonds on the other hand diverged: the correlation between Italian bond and
stock returns kept rising while the correlation between German bond and stock returns
decreased. On average, the banks’ market value decreased because Italian (more generally,
GIPSI) bond yields were rising and because German long-term bond yields were falling.25
On December 7, 2011, the ECB announced two three-year LTROs to be allotted on December
26, 2011 and February 29, 2012. After accounting for redemptions of existing ECB funds, the
LTROs increased lending to credit institutions in the euro area by EUR 783 billion according
to data released by the ECB. The correlations displayed in Figure 4 suggest that banks
increased their exposure to sovereign debt substantially following the LTROs.26
We perform
monthly regressions of banks’ stock returns on our risk factors and stock index returns around
the most recent LTRO events starting in January 2011. We focus on Italian sovereign debt
exposure and exclude all Italian banks. The results are reported in Table IX.
[Table IX]
Consistent with above, we find evidence of increased exposure to Italian sovereign debt
following the fourth one-year LTRO in October 2011 among banks with high RWA / Assets
and financed with more short-term debt. The exposure of large banks increased after the
three-year LTRO in January and February 2012. Particularly poorly capitalized banks, banks
25
We then perform quarterly cross-sectional tests of stock returns on Italian, German and home country bond
returns. We find that during 2009, banks’ stock returns and Italian bond returns were highly positively
correlated. For instance, the loading on Italian bond returns doubles in Q2 2009 when the first LTRO took place,
which amounted to EUR 442 billion (that is, 72% of all three operations). Interestingly, the loading on German
bunds became more negative suggesting that the ECB measures did not release existing tensions in short-term
funding markets for banks. We do not report these findings for reasons of space. 26
A Bundesbank report (Bundesbank (2012)) also shows that banks were increasing their exposure after ECB
liquidity injections by more than EUR 100 billion. While banks were the net seller of sovereign debt in Q1 and
Q3 2011, they purchased again in Q4 2011 after the fourth one-year LTRO. About EUR 130 billion of cash flow
in Q3 and Q4 2011 came from the Eurosystem.

29
with high RWA and banks financed with short-term debt increased their exposure. Note that
these are non-Italian banks increasing their exposure to Italian government debt.27
Interestingly, highly capitalized banks suffered more from tightening interbank markets
suggesting that banks had very selectively been able to borrow short-term in the interbank or
commercial paper market. Overall, our results are consistent with a further expansion of the
carry trades with ECB as funding leg of the carry trade.28
B. Did sovereign debt purchases crowd out lending?
The ECB’s liquidity injections were earmarked to increase lending to the real sector.
Two interesting questions emerge: was the ECB successful in giving banks incentives to lend
and did banks increase lending relative to their investments in sovereign debt?
We collect monthly data from the ECB about banks’ investments in government
securities and lending to non-financial corporations since January 2007. The ECB publishes
data aggregated at the country level for activities within the euro area.29
[Figure 5]
27
Banks may shift into riskier assets to earn carry and boost the remuneration of their employees. Regulators are
concerned with this in the recent LTRO. “Profit from carry trades, where investors borrow money at a low
interest rate to buy higher yielding securities, ‘should not count toward computation of remuneration and bonus
pools’ at banks, under plans being weighed by European Union lawmakers, according to a document obtained by
Bloomberg News” (Bloomberg, May 3rd, 2012). Members of the EU parliament understand they likely funded
carry trades with LTROs. To that end, they are proposing to amend the legislation to implement global capital
and liquidity rules for European banks requiring them to disclose profits from their carry trades to avoid
excessive risk-taking due to remuneration incentives. 28
The German regulator BaFin is investigating how domestic banking institutions are using the loans they
acquired through the ECB’s longer-term refinancing operation, Bloomberg News reported May 11. The regulator
is concerned that an inappropriate use of these loans could potentially lead to the formation of a new bubble.
More than half of the 800 banks that took LTRO money in February were German banks. However, since, for
example, also minimum reserve requirements have been cut from 2% to 1% by the ECB, the demand for
liquidity has reduced and regulators are worried about how banks will invest the excess liquidity from the
LTROs. 29
The countries in our analysis include Austria, Belgium, France, Germany, Greece, Ireland, Italy, Luxembourg,
the Netherlands, Portugal and Spain. Non-EU countries, Sweden and the UK, and Norway, which are officially
outside of the EU, are excluded from the analysis as they only provide information about their banks’
investments within their home country.

30
Figure 5.A displays the time-series of lending and government securities holdings relative to
banks’ total assets across European banks since January 2007. The horizontal lines indicate
the ECB interventions.30
Since 2009, we observe that sovereign debt holdings increased
relative to total assets while lending declined by about 2 percentage points. The cross-
correlation between both time-series is -0.15. There is also a noticeable increase in sovereign
debt holdings following ECB interventions both in 2009 and particularly after the October
2011 capital injection. Figures 5.B and 5.C show these developments for Italy (Figure 5.B)
and Spain (Figure 5.C). The pattern is similar but much more pronounced. Sovereign debt
holdings of the domestic banks have almost doubled since 2009 with the largest increase after
October 2011. At the same time, however, lending declined by 3% (Italy) and 6% (Spain).
The cross-correlation between lending and government securities holdings is -0.6 and -0.9 for
Italian and Spanish banks respectively.
[Table X]
We test this more formally and report the results in Table XI using ECB country-level
data (Panel A) and bank balance sheet data (Panel B). The ECB country-level data is on a
monthly basis and we include the January 2007 to June 2012 period in our analysis. The 2009
LTRO is an indicator variable equal to 1 for the months June 2009 until February 2010
assuming that the effects of the ECB interventions materialize within two months following
the interventions. The Oct 2011/Dec 2011 LTRO is an indicator variable that is 1 for the
months October 2011 to February 2012 and March 2012 LTRO is 1 for the months March to
May 2012. In models (1) to (4), our dependent variable is Loans/Government Securities, that
is, negative signs of the coefficients of our explanatory variables indicate that banks use the
30
The four one-year LTROs of the ECB on June 6, 2009, September 30, 2009, December 16, 2009 and October
27, 2011 as well as the two three-year LTROs on December 20, 2011 and March 1, 2012.

31
ECB liquidity to purchase sovereign debt rather than increase lending to firms. We also
include other control variables. Log-TA is the natural logarithm of the total sum of total assets
across all banks and Log-Banks is the natural logarithm of the number of banks within each
country. Deposits/Assets is total deposits of all banks over total assets. Repos/Assets is the
sum of (secured) repo funding over total assets for all banks. We also include ∆European
Economic Sentiment to control for loan demand by firms. All regressions include time-
controls and country-fixed effects. We find that banks purchased more sovereign debt relative
to their investments in lending after the 2009 LTROs, but we do not find statistically
significant evidence for this following the most recent LTROs across all European banks.
Large banks increase their sovereign holdings relative to lending vis-à-vis small banks. Banks
also do not increase lending following capital offerings (model (2)). Analyzing Italy and
Spain separately as well as the remaining euro countries suggests that this effect extends to all
banks. In models (5) to (7) and (8) to (10) we relate the banks’ investments in Government
Securities (% Total Assets) and Loans (% Total Assets) to the ECB measures, for the full
sample and separately for Italy and Spain as well as the remaining euro countries. The
increase in government securities holdings after the 2009 liquidity injections was pervasive
across European banks. However, Italian and Spanish banks increased their sovereign debt
holdings by 1.1 percentage points following the March 2012 LTRO. Only Italian and Spanish
banks significantly reduced their lending to non-financial corporations following the March
2012 LTRO.
In Panel B of Table XI, we use quarterly balance sheet data and run the same tests.
Note that we cannot distinguish between the 2011 and 2012 LTROs because of the closeness
of the ECB interventions which results in overlapping quarters. The results show similar
patterns as observed using monthly country-level data.

32
Overall, our results suggest that the success of the ECB to channel liquidity into the
real sector was rather limited. Instead, banks used the liquidity to increase their portfolios of
sovereign debt, crowding out lending to the real sector.
VI. Conclusion
During the past two years, increasing economic imbalances between the core of Europe and
the periphery have caused a surge in the yield spread of peripheral countries (such as Greece,
Italy, Ireland, Portugal and Spain) and a flight to German bunds.
Our article argues that European banks have placed bets on the opposite economic
development within the euro area expecting yield spreads between, for example, Italy and
Germany or Spain and Germany to converge. These bets or “carry trades” were designed as
investments in GIPSI government bonds financed with short-term debt. As the sovereign debt
crisis deepened, European banks lost a substantial portion of their market value. In a series of
cross-sectional and time-series tests, we find evidence that these trades have been widespread
among European banks. We carefully discuss alternative explanations of our results. These
are: home bias of domestic banks, (im-) moral suasion or redenomination of assets and
liabilities if the euro area breaks up. While all channels are potentially important, we find
convincing evidence for bank moral hazard. We show that large banks, banks with more
short-term debt as well as undercapitalized banks are more likely to engage in carry trades,
particularly among non-GIPSI banks. These results are most pronounced for banks’ exposure
to Italian sovereign debt. Italian debt is important probably because it is quantitatively huge.
Our paper further documents that these banks were more likely to raise capital and depend on
ECB funding as the crisis unfolded. Moreover, we provide evidence that the ECB’s liquidity
injections were encouraging banks to load up on sovereign debt at the expense of private
sector lending.

33
Our paper has important policy implications. It speaks to the treatment of sovereign
debt in the calculation of regulatory capital that a bank is required to hold. Zero risk weights
imposed by the regulator increase the benefits of carry trades vis-à-vis private sector lending.
More broadly, it questions the role of banks in financing government debt.

34
References (TO BE COMPLETED)
Acharya, V. and Yorulmazer, T. (2007) ‘Too Many to Fail: An Analysis of Time-
Inconsistencies in Bank Closure Policies’, Journal of Financial Intermediation 16, pp.
1–31.
Acharya, V. and Rajan, R.G. (2011) ‘Sovereign Debt, Government Myopia and the Financial
Sector’, working paper, NYU-Stern.
Acharya, V., Afonso, G. and Kovner, A. (2012) ‘How Do Global Banks Scramble For
Liquidity? Evidence from the Asset-Backed-Commercial Paper Freeze in 2007.’
working paper, NYU-Stern.
Acharya, V., Drechsler, I. and Schnabl, P. (2010) ‘A Pyrrhic Victory? – Bank Bailouts and
Sovereign Credit Risk’, working paper, NYU-Stern.
Bolton, P. and Jeanne, O. (2011) ‘Sovereign default and bank fragility in financially
integrated economies’, NBER working paper, 16899.
Broner, F., Martin, A. and Ventura, J. (2010) ‘Sovereign risk and secondary markets’,
American Economic Review 100, pp. 1523–1555.
Diamond, D. and Rajan, R.G. (2011) ‘Fear of Fire Sales and the Credit Freeze’, Quarterly
Journal of Economics, 126(2), pp. 557–591.
EBA, (2010) ‘Aggregate outcome of the 2010 EU wide stress test exercise coordinated by
CEBS in cooperation with the ECB’, available at: http://stress-test.c-
ebs.org/documents/Summaryreport.pdf.
EBA, (2011 a) ‘European Banking Authority: 2011 EU Wide Stress Test Aggregate Report’,
available at: http://stress-test.eba.europa.eu/pdf/EBA_ST_2011_Summary_Report_v6.pdf.
EBA, (2011 b) ‘Capital buffers for addressing market concerns over sovereign exposures’,
available at: http://stress-test.eba.europa.eu/capitalexercise/Methodology%20FINAL.pdf.
Gennaioli, N., Martin, A. and Rossi, S. (2011) Sovereign Defaults, Domestic Banks, and
Financial Institutions, available at: http://crei.cat/people/gennaioli.
Gorton, G. (2009) Slapped in the Face by the Invisible Hand: Banking and the Panic of 2007.
Mimeo.
Gozzi, J.C. and Goetz, M. (2010). Liquidity Shocks, Local Banks, and Economic Activity:
Evidence from the 2007–2009 Crisis. Mimeo.
Huang, R. and Ratnovski, L. (2011) ‘The Dark Side of Bank Wholesale Funding’, Journal of
Financial Intermediation 20, pp. 248–263.

35
Figure 1.A. Pairwise Comparison of Government Bond Yield Spreads: Italy versus
Germany This graphic shows the time series of 10-year government bond yields comparing Italian and German 10-year
government bond yields since January 2005.
Figure 1.B. Pairwise Comparison of Government Bond Yield Spreads: Greece versus
Germany This graphic shows the time series of 10-year government bond yields comparing Greek and German 10-year
government bond yields since January 2005.

36
Figure 1.C. Pairwise Comparison of Government Bond Yield Spreads: Spain versus
Germany This graphic shows the time series of 10-year government bond yields comparing Spanish and German 10-year
government bond yields since January 2005.
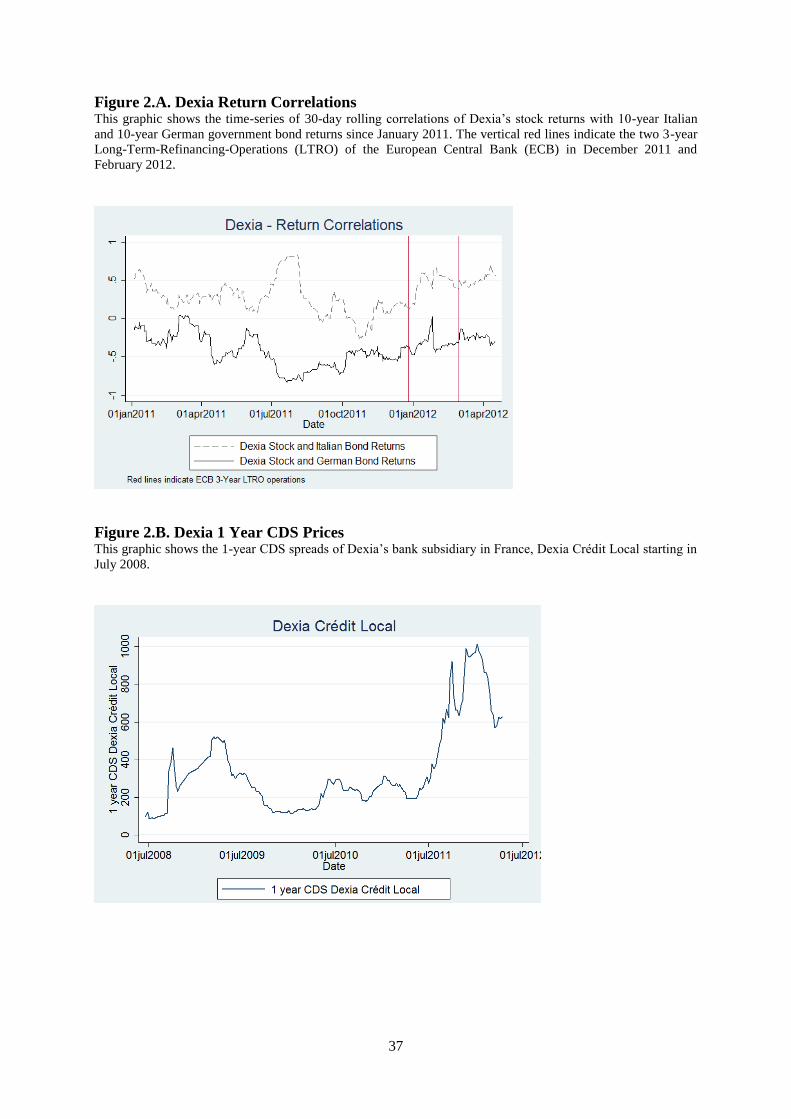
37
Figure 2.A. Dexia Return Correlations This graphic shows the time-series of 30-day rolling correlations of Dexia’s stock returns with 10-year Italian
and 10-year German government bond returns since January 2011. The vertical red lines indicate the two 3-year
Long-Term-Refinancing-Operations (LTRO) of the European Central Bank (ECB) in December 2011 and
February 2012.
Figure 2.B. Dexia 1 Year CDS Prices This graphic shows the 1-year CDS spreads of Dexia’s bank subsidiary in France, Dexia Crédit Local starting in
July 2008.

38
Figure 2.C. Dexia Stock Price Decline since Janurary 2011 This graphic shows Dexia’s stock price performance since January 2011.

39
Figure 3. Factor Loadings and Bond Portfolio Holdings The graph depicts a scatter plot of Log(Beta) estimated from a cross-sectional regression of stock on 10-year Greek and German
government bond returns on Log(Holdings / Assets). Factor loadings are estimated within 60 days before and after the reporting date
of the portfolio holdings.

40
Figure 4.A. Time-Series of Stock and Bond Return Correlations This graphic shows the 30-day rolling correlations between (1) stock returns and 10-year Italian bond returns and
(2) stock returns and 10-year German bond returns for all European banks included in the sample. The red lines
indicate the four 1-year LTROs of the ECB on June 6, 2009, September 30, 2009, December 16, 2009 and
October 27, 2011 as well as the first 3-year LTRO on December 20, 2011.
Figure 4.B. Time-Series of Stock and Bond Return Correlations (since January 1, 2011)

41
Figure 5.A Lending to Non-Financial Corporates vs. Government Securities
Holding by European Banks This graphic shows lending versus government securities holdings by banks in 12 Euro countries using
data provided by the ECB. All data are aggregated to the country level. The countries include: Austria,
Belgium, France, Germany, Greece, Ireland, Italy, Luxembourg, Netherlands, Portugal and Spain. The
red lines indicate the four 1-year LTROs of the ECB on June 6, 2009, September 30, 2009, December
16, 2009 and October 27, 2011 as well as the two 3-year LTRO on December 20, 2011 and March 1,
2012.
Figure 5.B. Lending to Non-Financial Corporates vs. Government Securities
Holding by Italian Banks

42
Figure 5.C. Lending to Non-Financial Corporates vs. Government Securities
Holding by Spanish Banks

43
Table I
Descriptive Statistics on Return Correlations This table contains descriptive statistics (Panel A) and correlations (Panel B) of ten-year sovereign
bond returns of Greece, Italy, Portugal, Spain, Ireland, Germany and France.
Panel A. Descriptive statistics of sovereign bond returns
Country Mean Std. Dev. Variance Min Max
Greece -0.10% 1.76% 0.03% -24.49% 42.54%
Italy -0.01% 0.50% 0.00% -4.46% 7.55%
Portugal -0.03% 1.08% 0.01% -18.68% 15.49%
Spain -0.01% 0.51% 0.00% -3.63% 8.37%
Ireland -0.02% 0.72% 0.01% -7.91% 10.76%
Germany 0.01% 0.39% 0.00% -2.24% 2.52%
Panel B. Sovereign bond return correlations (2005)
Greece Italy Portugal Spain Ireland Germany
Greece 1.00
Italy 0.97 1.00
Portugal 0.65 0.67 1.00
Spain 0.96 0.98 0.65 1.00
Ireland 0.92 0.93 0.64 0.93 1.00
Germany 0.96 0.98 0.66 0.98 0.94 1.00
Panel C. Sovereign bond return correlations (2011/2012)
Greece Italy Portugal Spain Ireland Germany
Greece 1.00
Italy 0.12 1.00
Portugal 0.19 0.22 1.00
Spain 0.13 0.77 0.17 1.00
Ireland 0.26 0.17 0.33 0.23 1.00
Germany -0.13 -0.27 -0.10 -0.19 -0.17 1.00

44
Table II
Descriptive Statistics on Bank Characteristics Panel A descriptive statistics on bank characteristics. Log-Assets is the natural logarithm of total book
assets. ST-LVG is short-term debt divided by total debt. RWA/Assets is book assets divided by risk-
weighted assets. Book-LVG is measured as total book assets divided by book value of equity. Tier 1 is
Tier 1 capital divided by risk-weighted assets. Capital (Yes/No) is a dummy variable equal to 1 if the
bank raised common or preferred capital during the January 2007 to February 2012 period. Log-
Capital is the natural logarithm of the amount of common or preferred capital raised. ECB
Funding/Repo is the euro amount of ECB financing divided by total repos from banks, customers and
the ECB. All bank characteristics are collapsed to the bank level. Panel B of Table III reports time-
series characteristics of stock and bond returns and factor loadings. Realized return is the banks’
equity return. Bank CDS is the five-year CDS spread of European banks. Δ Log (Bank CDS) is the
change in the log of daily CDS spreads. Predicted return is the predicted banks’ equity return.
BetaGreece, BetaItaly, and BetaGermany are factor loadings for Greece, Italian and German government
bond returns. Panel C of Table III reports average bond portfolio holdings in Greek, Italian, Spanish,
Portuguese and Irish government bonds at the time of the three stress tests.
Panel A. Cross-section
Obs Mean Std-Dev Min P50 Max
Log-Assets 51 11.88 1.65 7.82 11.99 14.38
ST-LVG 43 0.33 0.14 0.00 0.31 0.71
RWA / Assets 50 0.52 0.17 0.18 0.55 0.84
Book-LVG 51 21.61 10.09 2.02 18.68 59.22
Tier-1 Ratio 50 9.30 1.65 6.66 9.05 13.97
Capital Issuance Actvity & ECB Funding
Jan 2007 - Feb 2012
Capital (Yes/No) 51 0.86 0.35 0.00 1.00 1.00
Log-Capital 44 14.18 1.64 7.77 14.39 16.81
ECB / Assets 32 0.07 0.07 0.00 0.05 0.22
Panel B. Time-series
Obs Mean Std-Dev Min P50 Max
Daily returns Jan 2006 – Feb 2012
Realized Return (%) 63,105 -0. 14% 4% -100% 0% 55%
Bank CDS (bps) 31,116 183 275 4 104 3,183
Δ Log (Bank CDS) 31,109 0.00 0.06 -0.82 0.00 1.34
Quarterly returns Q1 2008 – Q1 2012
Realized Return (%) 833 -6% 26% -87% -7% 161%
Predicted Return (%) 833 -8% 38% -275% -8% 186%

45
Panel C. Factor loadings
Obs Mean Std-Dev Min P50 Max
Factor loadings
βItaly 833 1.84 2.00 -3.17 1.40 16.42
βSpain 833 1.42 2.13 -9.45 0.95 18.64
βGreece 833 0.98 1.60 -1.89 0.36 15.36
βGermany 833 -2.76 2.13 -20.81 -2.44 5.97
No GIPSI banks
βItaly 765 1.85 2.05 -3.17 1.39 16.42
βSpain 731 1.47 2.24 -9.45 0.97 18.64
βGreece 731 0.94 1.64 -1.89 0.32 15.36
GIPSI banks
βItaly 68 1.75 1.14 -0.11 1.52 4.98
βSpain 102 1.02 0.84 -0.90 0.81 3.56
βGreece 102 1.25 1.32 -0.43 0.81 5.61
Panel D. Sovereign bond holdings
Greece Italy Portugal Spain Ireland
March 2010 94,912 264,500 27,154 174,833 24,878
December 2010 85,558 303,999 30,799 200,283 18,221
September 2011 24,579 267,218 28,723 177,466 17,016
December 2011 19,939 223,208 22,267 137,874 16,327
June 2012 1,818 258,894 25,600 148,422 17,494
Greece Italy Portugal Spain Ireland
No GIPSI banks
March 2010 34,814 115,472 14,776 29,190 18,677
December 2010 28,208 132,803 14,636 41,923 5,017
September 2011 21,832 103,137 13,975 30,039 3,845
December 2011 17,355 69,243 10,390 22,311 3,528
June 2012 1,672 69,344 10,169 20,615 2,961
GIPSI banks
March 2010 56,148 144,856 5,176 143,869 5,322
December 2010 54,447 164,011 10,351 154,793 12,466
September 20111)
NA 156,043 10,972 143,629 12,455
December 20111)
NA 147,746 8,180 111,774 12,109
June 20121)
NA 184,171 10,657 124,385 13,848
1) Greek banks were excluded from stress tests

46
Table III
Banks’ Stock and Sovereign Bond Returns This table contains the results of the cross-sectional analysis of individual banks’ stock returns on
sovereign bond returns over the January 2007 to February 2012 period. Columns (1) to (5) of Panel A
show factor loadings on GIPSI sovereign bond returns individually for Greece, Italy, Spain, Portugal
and Ireland and jointly in column (6). All regressions include ten-year German bond returns
(Germany) as the “funding leg” of the carry trade. Stock Index is the residual from the regression of
the domestic stock market’s daily log returns on daily domestic sovereign bond and German bund
returns. Panel B contains results of various model specifications: Model 1 reports factor loadings of
home country bond returns (Home). Model 2 reports the results controlling for a wide array of state
variables: (1) : ∆VSTOXX is the change in the VSTOXX Index for the European stock market; (2)
Term Structure is the slope of the term structure of interest rates measured as the difference between
the yield on a ten-year euro area government bond and the one-month Euribor; (3) Bond Default
Spread is the difference between the yield on ten-year German BBB bonds and yields on ten-year
German government debt; (4) 1 month EURIBOR is the level of the short-term risk-free interest rate
measured as the one-month Euribor; (5) ∆European Economic Sentiment is the monthly change in the
economic sentiment indicator obtained from opinion surveys conducted by the European Central Bank;
(6) ∆Level of Industrial Production is the monthly change in the level of industrial production; (7)
∆European Consumer Price Index is the change in inflation measured as the monthly change in the
European Consumer Price Index. Model 3 reports the results of a principal component analysis (PC1);
Model 4 uses French bond returns as the funding leg of the carry trade; Model 5 uses two-year GIPSI
government bond returns. Models 6 and 7 report the results of the cross-sectional analyses of bank CDS
spread changes on GIPSI bond returns. The dependent variable is Δ Log (Bank CDS). Standard errors
are clustered at bank and quarter level. t-statistics are given in parentheses. ***,** and * indicate
significance at 1, 5 and 10% levels respectively.
Panel A. Stock and bond return correlations
(1) (2) (3) (4) (5) (6)
Greece Italy Spain Portugal Ireland GIPSI
Greece 0.095***
0.048***
(5.73)
(2.73)
Italy
0.432***
0.261***
(5.12)
(2.93)
Spain
0.427***
0.077
(8.78)
(1.46)
Portugal
0.130***
0.007
(3.05)
(0.57)
Ireland
0.267*** 0.132**
(5.32) (2.49)
Germany -2.460*** -2.563*** -2.611*** -2.500*** -2.517*** -2.558***
(-19.09) (-23.64) (-23.07) (-19.40) (-19.78) (-22.70)
Stock Index 1.359*** 1.363*** 1.367*** 1.373*** 1.371*** 1.354***
(14.98) (15.17) (15.27) (15.02) (15.30) (15.25)
Constant -0.001** -0.001*** -0.001*** -0.001*** -0.001** -0.001***
(-2.56) (-2.94) (-2.64) (-2.75) (-2.58) (-2.73)
Observations 55,206 55,206 55,206 55,206 55,206 55,206
R-squared 0.46 0.46 0.46 0.46 0.46 0.46

47
Panel B. Robustness tests (1) (2) (3) (4) (5) (6) (7)
Home Macro PCA Funding Leg Maturity ∆ Log(Bank CDS)
Greece 0.008 0.052***
0.073*** 0.014*** -0.150***
(0.49) (3.07)
(4.50) (3.82) (-4.77)
Italy 0.217** 0.256***
0.735*** 0.014 -0.161
(2.39) (2.84)
(6.68) (0.29) (-0.93)
Spain 0.029 0.095*
-0.009 -0.043 -0.270*
(0.55) (1.80)
(-0.06) (-0.46) (-1.67)
Portugal -0.005 0.007
-0.007 0.006 -0.117*
(-0.46) (0.62)
(-0.13) (0.41) (-1.94)
Ireland 0.119** 0.135**
0.143** 0.046** -0.203*
(2.42) (2.57)
(1.99) (2.49) (-1.90)
Germany -2.662*** -2.717*** -2.570***
-1.819*** 2.913*** 2.983***
(-23.74) (-21.47) (-21.77)
(-12.97) (6.39) (6.15)
Stock Index 1.365*** 1.419*** 1.357*** 1.355*** 1.270*** -0.745*** -0.755***
(14.94) (16.29) (15.29) (15.22) (19.61) (-7.61) (-7.62)
Home 0.295***
(8.34)
∆VSTOXX
0.088***
(3.91)
Term Structure
0.024
(0.24)
Bond Default Spread
0.014
(0.51)
1 month EURIBOR
0.043
(0.64)
∆European Economic Sentiment
0.037**
(2.38)
∆Level of Industrial Production
0.044*
(1.84)
∆European Consumer Price Index
-0.084
(-0.75)
PC1
0.002***
-0.004***
(8.60)
(-4.70)
France
-2.294***
(-8.21)
Constant -0.001*** -0.002 -0.001*** -0.001*** -0.001** 0.002* 0.003**
(-2.80) (-0.87) (-3.11) (-2.77) (-2.03) (1.80) (2.27)
Observations 55,206 55,005 55,206 55,206 55,086 29,832 29,832
R-squared 0.47 0.46 0.46 0.42 0.43 0.13 0.13

48
Table IV
Factor Loadings and Bank Portfolio Holdings This table contains the results regressing factor loadings (βItaly, βSpain, βGreece) on sovereign bond holdings. Italy-Sov/Assets, Spain-Sov/Assets, Greece-Sov are the ratios of
Italian, Spanish and Greek sovereign debt holdings by European banks over total assets. December 2010, September 2011, December 2011 and June 2012 are indicator variables
for the reporting date of the banks’ sovereign debt holdings. March 2010 is the omitted group. Results for Italy are reported in models (1) to (4), for Spain in models (5) to (8)
and Greece in models (9) to (12). Models (1), (5) and (9) include the full sample of banks, all other models exclude always the banks of the particular country, i.e. Italian banks
(models (2) – (4)), Spanish banks (models (6) – (8)) and Greek banks (models (10) – (12)). Models (4), (8) and (12) further include bank fixed effects. Factor loadings are
estimated 60 days before and 60 days after the reporting date for each bank. Standard errors are clustered at the bank level. t-statistics are given in parentheses. ***,** and *
indicate significance at 1, 5 and 10% levels respectively.
βItaly βSpain βGreece
All Non-Italian Non-Italian Non-Italian All Non-Spanish Non-Spanish Non-Spanish All Non-Greek Non-Greek Non-Greek
(1) (2) (3) (4) (5) (6) (7) (8) (9) (10) (11) (12)
Italy-Sov / Assets 6.881*** 20.769** 17.732*** 37.858***
(5.97) (2.20) (3.15) (2.79)
Spain-Sov / Assets
5.763*** 68.506** 73.182*** 112.711***
(3.12) (2.06) (2.85) (3.12)
Greece-Sov / Assets
2.006*** 2.701* 2.588** -0.693
(4.15) (1.88) (2.21) (-1.64)
December 2010
-0.817*** -1.074***
-0.711*** -0.928***
0.103** 0.039
(-4.72) (-8.22)
(-5.28) (-9.81)
(2.58) (0.91)
September 2011
-1.253*** -1.819***
-0.952*** -1.461***
-0.016 -0.043**
(-7.97) (-9.78)
(-7.65) (-12.64)
(-0.82) (-2.41)
December 2011
-0.871*** -1.356***
-0.753*** -0.997***
-0.043* -0.077***
(-5.46) (-7.73)
(-5.86) (-8.82)
(-1.95) (-3.60)
June 2012
-0.641*** -1.087***
-0.561*** -0.841***
-0.019 -0.065***
(-3.66) (-6.84)
(-4.09) (-7.72)
(-0.89) (-2.95)
Constant 0.535*** 0.483*** 1.249*** 1.746*** 0.485*** 0.425*** 1.057*** 1.431*** 0.121*** 0.114*** 0.108*** 0.194***
(11.11) (8.83) (7.81) (11.81) (12.61) (9.19) (8.77) (14.10) (11.34) (10.86) (6.51) (11.45)
Bank FE No No No Yes No No No Yes No No No Yes
Observations 205 180 180 181 205 184 184 185 211 199 199 200
R-squared 0.10 0.04 0.40 0.62 0.05 0.03 0.35 0.70 0.26 0.06 0.18 0.12

49
Table V
Non-Sovereign Cross-Border Exposure of Banks This table reports the results from cross-sectional regressions of factor loadings (βItaly, βSpain, βGreece) on sovereign bond and real sector holdings of European banks. Italy-
Sov/Assets, Spain-Sov/Assets, Greece-Sov are the ratios of Italian, Spanish and Greek sovereign debt holdings by European banks over total assets. Italy-Real/Assets, Spain-
Real/Assets, Greece-Real are the ratios of Italian, Spanish and Greek real sector exposures by European banks over total assets. Real sector exposure is the sum of each banks’
exposure to the corporate sector, retail sector and commercial real estate sector. All data are from December 2010 (reporting date) and disclosed in the July 2011 stress tests.
Results for Italy are reported in models (1) to (4), for Spain in models (5) to (8) and Greece in models (9) to (12). Three models exclude always the banks of the particular
country, i.e. Italian banks (model (4)), Spanish banks (model (8)) and Greek banks (model (12)). Standard errors are clustered at the bank level. t-statistics are given in
parentheses. ***,** and * indicate significance at 1, 5 and 10% levels respectively.
βItaly βSpain βGreece
All All All Non-Italian All All All Non-Spanish All All All Non-Greek
(1) (2) (3) (4) (5) (6) (7) (8) (9) (10) (11) (12)
Italy-Real / Assets 1.148***
-0.602 4.990
(4.09)
(-0.63) (0.73)
Italy- Sov / Assets
8.565*** 12.091 36.248***
(2.95) (1.52) (2.81)
Spain-Real / Assets
0.657**
-0.808 -3.556
(2.66)
(-1.41) (-0.81)
Spain-Sov / Assets
6.847*** 13.158*** 71.094
(3.53) (3.37) (1.39)
Greece-Real / Assets
1.527***
1.305*** 6.846**
(9.66)
(4.55) (2.40)
Greece-Sov / Assets
3.095*** 0.578 -17.989
(5.78) (1.11) (-1.67)
Constant 0.845*** 0.807*** 0.799*** 0.685*** 0.691*** 0.676*** 0.676*** 0.625*** 0.209*** 0.227*** 0.209*** 0.219***
(6.84) (6.38) (6.20) (5.14) (9.53) (9.36) (9.32) (6.56) (5.69) (6.14) (5.62) (5.54)
Observations 51 51 51 46 51 51 51 45 51 51 51 45
R-squared 0.06 0.08 0.09 0.08 0.07 0.11 0.12 0.05 0.49 0.40 0.49 0.20
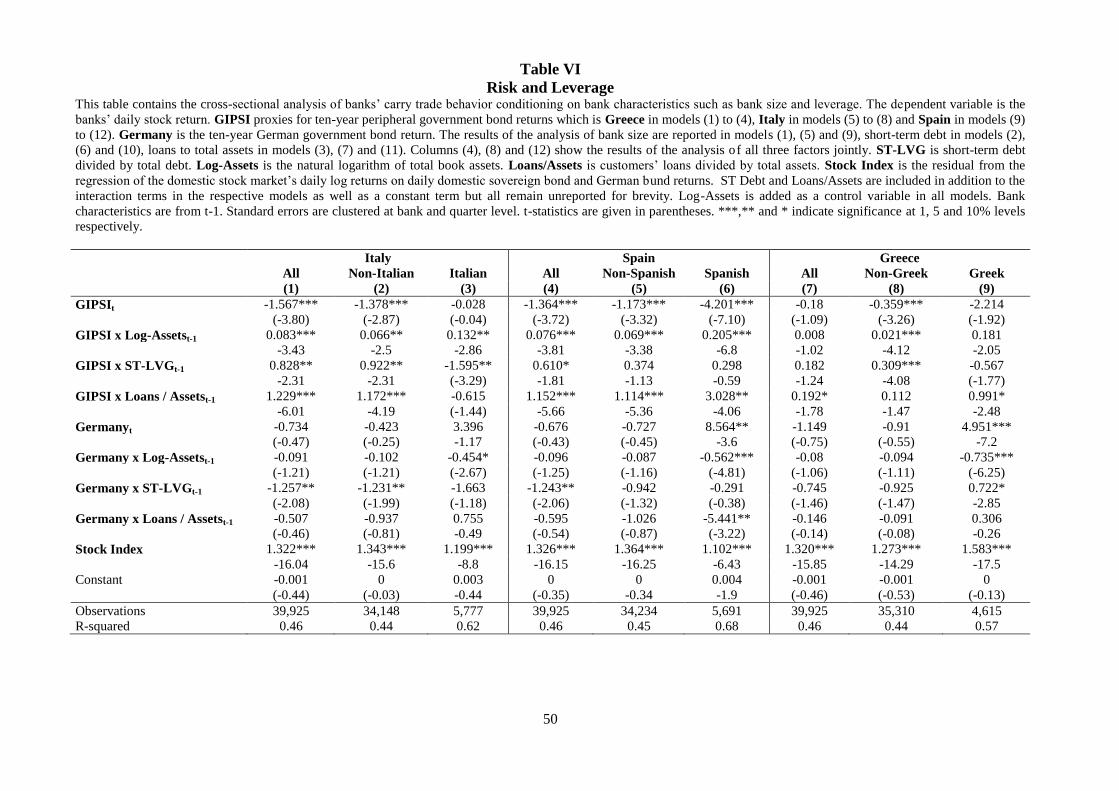
50
Table VI
Risk and Leverage This table contains the cross-sectional analysis of banks’ carry trade behavior conditioning on bank characteristics such as bank size and leverage. The dependent variable is the
banks’ daily stock return. GIPSI proxies for ten-year peripheral government bond returns which is Greece in models (1) to (4), Italy in models (5) to (8) and Spain in models (9)
to (12). Germany is the ten-year German government bond return. The results of the analysis of bank size are reported in models (1), (5) and (9), short-term debt in models (2),
(6) and (10), loans to total assets in models (3), (7) and (11). Columns (4), (8) and (12) show the results of the analysis of all three factors jointly. ST-LVG is short-term debt
divided by total debt. Log-Assets is the natural logarithm of total book assets. Loans/Assets is customers’ loans divided by total assets. Stock Index is the residual from the
regression of the domestic stock market’s daily log returns on daily domestic sovereign bond and German bund returns. ST Debt and Loans/Assets are included in addition to the
interaction terms in the respective models as well as a constant term but all remain unreported for brevity. Log-Assets is added as a control variable in all models. Bank
characteristics are from t-1. Standard errors are clustered at bank and quarter level. t-statistics are given in parentheses. ***,** and * indicate significance at 1, 5 and 10% levels
respectively.
Italy Spain Greece
All Non-Italian Italian All Non-Spanish Spanish All Non-Greek Greek
(1) (2) (3) (4) (5) (6) (7) (8) (9)
GIPSIt -1.567*** -1.378*** -0.028 -1.364*** -1.173*** -4.201*** -0.18 -0.359*** -2.214
(-3.80) (-2.87) (-0.04) (-3.72) (-3.32) (-7.10) (-1.09) (-3.26) (-1.92)
GIPSI x Log-Assetst-1 0.083*** 0.066** 0.132** 0.076*** 0.069*** 0.205*** 0.008 0.021*** 0.181
-3.43 -2.5 -2.86 -3.81 -3.38 -6.8 -1.02 -4.12 -2.05
GIPSI x ST-LVGt-1 0.828** 0.922** -1.595** 0.610* 0.374 0.298 0.182 0.309*** -0.567
-2.31 -2.31 (-3.29) -1.81 -1.13 -0.59 -1.24 -4.08 (-1.77)
GIPSI x Loans / Assetst-1 1.229*** 1.172*** -0.615 1.152*** 1.114*** 3.028** 0.192* 0.112 0.991*
-6.01 -4.19 (-1.44) -5.66 -5.36 -4.06 -1.78 -1.47 -2.48
Germanyt -0.734 -0.423 3.396 -0.676 -0.727 8.564** -1.149 -0.91 4.951***
(-0.47) (-0.25) -1.17 (-0.43) (-0.45) -3.6 (-0.75) (-0.55) -7.2
Germany x Log-Assetst-1 -0.091 -0.102 -0.454* -0.096 -0.087 -0.562*** -0.08 -0.094 -0.735***
(-1.21) (-1.21) (-2.67) (-1.25) (-1.16) (-4.81) (-1.06) (-1.11) (-6.25)
Germany x ST-LVGt-1 -1.257** -1.231** -1.663 -1.243** -0.942 -0.291 -0.745 -0.925 0.722*
(-2.08) (-1.99) (-1.18) (-2.06) (-1.32) (-0.38) (-1.46) (-1.47) -2.85
Germany x Loans / Assetst-1 -0.507 -0.937 0.755 -0.595 -1.026 -5.441** -0.146 -0.091 0.306
(-0.46) (-0.81) -0.49 (-0.54) (-0.87) (-3.22) (-0.14) (-0.08) -0.26
Stock Index 1.322*** 1.343*** 1.199*** 1.326*** 1.364*** 1.102*** 1.320*** 1.273*** 1.583***
-16.04 -15.6 -8.8 -16.15 -16.25 -6.43 -15.85 -14.29 -17.5
Constant -0.001 0 0.003 0 0 0.004 -0.001 -0.001 0
(-0.44) (-0.03) -0.44 (-0.35) -0.34 -1.9 (-0.46) (-0.53) (-0.13)
Observations 39,925 34,148 5,777 39,925 34,234 5,691 39,925 35,310 4,615
R-squared 0.46 0.44 0.62 0.46 0.45 0.68 0.46 0.44 0.57

51
Table VII
Regulatory Capital Ratios This table contains the cross-sectional analysis of banks’ carry trade behavior conditioning on bank capital adequacy. The dependent variable is the banks’ daily stock return.
GIPSI proxies for ten-year peripheral government bond returns which is Italy in models (1) to (3), Spain in models (4) to (6) and Greece in models (7) to (9). Germany is the
ten-year German government bond return. We use the Tier1 ratio in models (1), (4) and (7) and RWA/Assets in models (2), (5) and (8). Models (3), (6) and (9) include both
variables jointly and further include ST Debt. Log-Assets is the natural logarithm of total book assets. Tier1-Ratio is Tier 1 capital divided by risk-weighted assets. RWA/Assets
is risk-weighted assets divided by total assets. ST-LVG is short-term debt divided by total debt. Stock Index is the residual from the regression of the domestic stock market’s
daily log returns on daily domestic sovereign bond and German bund returns. Log-Assets, Tier 1, RWA/Assets and ST Debt are included in addition to the interaction terms in
the respective models as well as a constant term but all remain unreported for brevity. Bank characteristics are from t-1. Standard errors are clustered at the bank and quarter
level. t-statistics are given in parentheses. ***,** and * indicate significance at 1, 5 and 10% levels respectively.
Italy Spain Greece
All Non-Italian Italian All Non-Spanish Spanish All Non-Greek Greek
(1) (2) (3) (4) (5) (6) (7) (8) (9)
GIPSIt -0.576 -0.513 -0.986 -0.849* -0.811* -1.646** -0.260 -0.349** 0.123
(-1.19) (-1.06) (-0.87) (-1.72) (-1.65) (-3.52) (-1.05) (-2.01) (0.08)
GIPSI x Log-Assetst-1 0.073*** 0.065** 0.079 0.081*** 0.081*** 0.180*** 0.014 0.022*** -0.011
(3.05) (2.57) (0.65) (4.06) (4.10) (9.14) (1.47) (3.51) (-0.08)
GIPSIt x Tier 1t-1 -0.053*** -0.057*** 0.117 -0.038 -0.035 -0.104* 0.001 -0.001 0.027
(-3.47) (-3.48) (1.34) (-1.55) (-1.35) (-2.61) (0.15) (-0.11) (1.46)
GIPSIt x RWA / Assetst-1 0.726*** 0.776*** 0.270 0.870*** 0.934*** 1.525** 0.201 0.109 0.353
(3.02) (3.02) (0.42) (4.27) (4.61) (3.21) (1.44) (1.28) (1.19)
GIPSIt x ST-LVGt-1 0.917*** 1.073*** -1.353 0.730** 0.475 -0.142 0.197* 0.290*** -0.565
(2.84) (2.98) (-1.51) (2.15) (1.23) (-0.29) (1.74) (3.16) (-1.28)
Germanyt 0.150 0.078 7.306 0.139 0.392 1.598 0.391 0.624 1.453
(0.09) (0.04) (1.92) (0.08) (0.22) (1.21) (0.25) (0.31) (0.38)
Germany x Log-Assetst-1 -0.129* -0.129 -0.545* -0.132* -0.141* -0.414*** -0.123* -0.141 -0.418
(-1.68) (-1.59) (-2.45) (-1.73) (-1.80) (-5.04) (-1.70) (-1.52) (-0.88)
Germany x Tier 1t-1 -0.053 -0.037 -0.194 -0.047 -0.058 0.228** -0.095** -0.089* -0.132
(-1.10) (-0.73) (-1.94) (-1.03) (-1.28) (3.44) (-2.19) (-1.71) (-1.91)
Germanyt x RWA / Assetst-1 -0.528 -0.778 -1.511 -0.598 -1.101 -0.932 -0.441 -0.427 2.673
(-0.53) (-0.78) (-0.79) (-0.61) (-1.08) (-1.81) (-0.48) (-0.39) (1.73)
Germany x ST-LVGt-1 -1.249** -1.277** -1.119 -1.271** -0.884 -0.496 -0.629 -0.772 0.025
(-2.06) (-2.03) (-0.76) (-2.10) (-1.15) (-0.98) (-1.24) (-1.32) (0.08)
Stock Index 1.321*** 1.342*** 1.204*** 1.326*** 1.364*** 1.097*** 1.322*** 1.276*** 1.586***
(15.90) (15.44) (8.94) (16.03) (16.13) (6.37) (15.77) (14.35) (18.76)
Constant -0.002 -0.002 -0.017** -0.002 -0.000 0.001 -0.003 -0.005*** -0.013
(-1.08) (-0.77) (-2.82) (-0.55) (-0.12) (0.70) (-1.02) (-2.78) (-1.30)
Observations 39,711 33,934 5,777 39,711 34,020 5,691 39,711 35,310 4,401
R-squared 0.46 0.44 0.63 0.46 0.45 0.68 0.46 0.44 0.58

52
Table VIII
Capital Issuances and ECB Funding Table IX contains the results of the analysis whether banks’ carry trade behavior predicts their capital-raising activity and dependence on ECB funds over the time period from
January 2008 to April 2012. The dependent variables are: Log-Capital, the natural logarithm of the amount raised in each quarter, and ECB funding divided by total assets (ECB
/Assets) at the annual reporting date. Realized Returnt-1 is the bank’s equity return, Predicted Returnt-1 is the bank’s predicted return; βGreece,t-1 , βItaly,t-1 , and βGermany,t-1 are
factor loadings for Greek, Italian and German government bond returns measured over the previous quarter. Log-Assets is the natural logarithm of the one-year lagged total
assets. Standard errors are clustered at bank and quarter level. t-statistics are given in parentheses. ***,** and * indicate significance at 1, 5 and 10% levels respectively.
(1) (2) (3) (4) (5) (6) (7) (8)
Log-Capital ECB/Assets Log-Capital ECB/Assets Log-Capital ECB/Assets Log-Capital ECB/Assets
Realized Returnt-1 -2.036*** -0.001
-2.284*** 0.011 -2.232*** 0.031
(-3.60) (-0.02)
(-3.92) (0.19) (-3.70) (0.50)
Predicted Returnt-1
-1.217** -0.047
(-2.57) (-0.95)
βGreece,t-1
0.881*** 0.021
(2.73) (1.12)
βItaly,t-1
0.169 0.029*
(1.11) (1.82)
βGermany,t-1
0.023 -0.023*** -0.307** -0.024***
(0.14) (-2.89) (-2.07) (-2.97)
Log-Assetst-1 0.243*** -0.022*** 0.202** -0.022*** 0.182** -0.030*** 0.155 -0.031***
-3.01 (-3.49) (2.21) (-3.46) (2.10) (-4.28) (1.64) (-4.38)
Constant -1.622* 0.338*** -1.086 0.326*** -1.051 0.374*** -1.379 0.382***
(-1.72) (4.02) (-0.98) (3.83) (-1.03) (4.07) (-1.22) (4.25)
Observations 750 80 699 76 699 76 699 76
R-squared 0.02 0.18 0.01 0.18 0.06 0.28 0.04 0.31

53
Table IX
Time Series of Carry Trades Exposures
This table contains the analysis regressing banks’ daily stock returns on Italian and German government bond returns for the January 2011 to February 2012 period. Italian banks are
excluded. Log-Assets is the natural logarithm of total book assets. Tier 1 is Tier 1 capital divided by risk-weighted assets. RWA/Assets is risk-weighted assets divided by total assets. ST-
LVG is short-term debt divided by total debt Stock Index is the residual from the regression of the domestic stock market’s daily log returns on daily domestic sovereign bond and German
bund returns. Log-Assets, Tier 1, RWA/Assets and ST Debt are included in addition to the interaction terms in the respective models as well as a constant term but all remain unreported for
brevity. Standard errors are clustered at the bank level. t-statistics are given in parentheses. ***,** and * indicate significance at 1, 5 and 10% levels respectively.
(1) (2) (3) (4) (5) (6) (7) (8) (9) (10) (11) (12) (13) (14)
Dependent Variable: Stock Returns
Jan 2011 Feb 2011 March 2011 April 2011 May 2011 June 2011 July 2011 Aug 2011 Sept 2011 Oct 2011 Nov 2011 Dec 2011 Jan 2012 Feb 2012
GIPSIt -4.584*** -5.964*** -1.032 -4.832 -2.275 -4.953 -1.206 0.238 -2.295 0.148 -1.010 -0.597 0.573 -4.810**
(-2.86) (-4.06) (-0.34) (-0.72) (-1.23) (-1.27) (-1.43) (0.53) (-0.82) (0.03) (-1.05) (-0.62) (0.45) (-2.32)
GIPSI x Log-Assetst-1 0.362*** 0.318*** 0.068 0.168 0.141** 0.297* 0.072 0.046** 0.096 0.043 0.046 0.010 0.057 0.273**
(5.33) (4.32) (0.45) (0.71) (2.20) (2.02) (1.67) (2.35) (0.66) (0.19) (1.11) (0.21) (0.79) (2.60)
GIPSIt x Tier 1t-1 -0.026 0.147 0.102 0.319 -0.003 0.035 0.099* -0.091** -0.011 -0.088 -0.030 0.064 -0.098*** -0.076**
(-0.30) (1.48) (0.71) (0.74) (-0.03) (0.28) (1.90) (-2.53) (-0.15) (-0.36) (-0.71) (1.58) (-5.58) (-2.44)
GIPSIt x RWA / Assetst-1 2.560** 2.301*** 0.875 2.567 1.209 2.240 -0.277 0.837*** 2.449* 0.798 0.869* 0.210 0.319 1.492
(2.15) (3.01) (0.47) (0.75) (1.00) (1.30) (-0.53) (3.84) (1.89) (0.34) (1.83) (0.42) (0.45) (1.49)
GIPSIt x ST-LVGt-1 0.799 -0.744 -1.863 -5.345 1.157 2.749 -0.732 0.322 1.389 -0.427 1.244* -0.475 0.661 5.258***
(0.47) (-0.44) (-0.73) (-1.24) (0.89) (1.40) (-1.20) (0.99) (1.18) (-0.12) (1.95) (-0.77) (0.98) (3.46)
Germanyt -1.313 -10.041*** -0.056 -2.047 -1.879 5.379* 0.189 0.622 0.682 -1.695 -5.419 0.057 -2.117 -3.570
(-0.56) (-4.56) (-0.02) (-0.59) (-0.43) (1.76) (0.08) (0.13) (0.15) (-0.57) (-1.56) (0.02) (-0.70) (-0.63)
Germany x Log-Assetst-1 -0.324*** 0.404*** -0.076 -0.010 0.128 -0.263 -0.140 -0.103 -0.209 -0.033 0.076 -0.126 0.093 0.039
(-2.91) (3.70) (-0.49) (-0.08) (0.74) (-1.56) (-1.18) (-0.51) (-0.88) (-0.24) (0.46) (-0.99) (0.61) (0.12)
Germany x Tier 1t-1 0.300** 0.216 -0.051 0.099 -0.064 -0.169* 0.053 -0.097 -0.060 0.110 0.017 0.133 -0.365*** -0.114**
(2.64) (1.47) (-0.48) (0.39) (-0.35) (-1.95) (0.36) (-0.76) (-0.54) (0.97) (0.11) (0.98) (-5.20) (-2.08)
Germanyt x RWA / Assetst-1 -2.222 0.647 -1.883 -2.131 -1.228 -4.501*** -2.369* -0.294 -0.348 -1.691 0.840 -2.946 2.280 -2.118
(-1.68) (0.39) (-0.97) (-1.58) (-0.77) (-3.09) (-1.97) (-0.13) (-0.15) (-0.99) (0.40) (-1.56) (1.51) (-0.85)
Germany x ST-LVGt-1 -0.973 1.713 1.309 -1.402 -1.258 -1.642 -2.654 -0.098 0.124 -3.038 2.976 -4.235** 3.319* 4.495
(-0.36) (0.51) (0.81) (-0.65) (-0.78) (-0.95) (-1.17) (-0.04) (0.05) (-1.57) (1.01) (-2.16) (1.80) (1.59)
Stock Index 1.082*** 1.528*** 1.209*** 1.419*** 1.293*** 1.071*** 1.513*** 1.244*** 1.263*** 2.018*** 1.460*** 1.234*** 1.739*** 2.445***
(10.95) (11.84) (10.63) (7.45) (9.39) (4.58) (3.88) (12.34) (14.00) (7.45) (10.75) (7.22) (8.79) (6.02)
Constant -0.020** -0.011 -0.006 -0.016 -0.016 -0.025* -0.044** -0.003 -0.042** -0.026* 0.020 -0.009 -0.028 -0.006
(-2.57) (-1.65) (-0.58) (-0.62) (-1.15) (-1.95) (-2.25) (-0.16) (-2.67) (-1.77) (1.01) (-0.74) (-1.47) (-0.43)
Observations 561 565 601 483 584 552 585 620 610 548 561 541 512 252 R-squared 0.50 0.36 0.42 0.22 0.23 0.34 0.36 0.46 0.60 0.49 0.43 0.35 0.60 0.65

54
Table X
Do Investments in Government Bonds Crowd Out Lending?
Table XI contains the results of the analysis regarding how lending by banks changes relative to sovereign debt holdings after the ECB interventions over the time period Q1 2008 to Q1 2012. We use
monthly ECB data aggregated to the country level (Panel A) and quarterly bank balance sheet data (Panel B). The dependent variables are: Loans/Government Securities in models (1) to (4),
Government Securities (% Total Assets) in models (5) to (7) and Loans (% Total Assets) in models (8) to (10). The independent variables in Panel A are: 2009 LTROs is an indicator variable equal to
1 for the months June 2009 until February 2010. Oct 2011/Dec 2011 LTRO is an indicator variable that is 1 for the months October 2011 to February 2012 and March 2012 LTRO is 1 for the
months March to May 2012. Log-TA is the natural logarithm of the total sum of total assets across all banks, Log-Banks is the natural logarithms of the number of banks within each country.
Deposits/Assets is the ratio of the sum of total deposits over total assets. Repos/Assets is total repos over total assets. All variables are lagged by one quarter. Capital (Yes/No) is an indicator variable
that is 1 if the bank has raised capital in the previous quarter. ∆European Economic Sentiment is the 12-month change in the European Economic Sentiment Index. Country and year-quarter fixed
effects are included. We use quarterly bank balance sheet characteristics in Panel B, 2011/2012 LTROs is an indicator variable equal to 1 in the fourth quarter of 2011 and first quarter of 2012. Bank
fixed effects and time effects are included in all regressions. Standard errors are robust to heteroscedasticity. t-statistics are given in parentheses. ***,** and * indicate significance at 1, 5 and 10%
levels respectively.
Panel A: ECB country-level data (1) (2) (3) (4) (5) (6) (7) (8) (9) (10)
Loans/Government Securities Government Securities (% Total Assets) Loans (% Total Assets)
Not Italy and Spain Only Italy and Spain Not Italy and Spain Only Italy and Spain Not Italy and Spain Only Italy and Spain
2009 LTROs -0.8080*** -0.8077*** -0.7378*** -0.6911** 0.005*** 0.0049*** 0.0041** -0.0006 -0.0005 0.0008
(-5.39) (-5.39) (-4.22) (-2.16) (5.85) (5.44) (2.58) (-0.48) (-0.32) (0.42)
Oct 2011/Dec 2011 LTRO -0.0720 -0.0856 -0.0793 0.2006 -0.0004 -0.0012 -0.0009 -0.0028 -0.0027 -0.0039
(-0.22) (-0.26) (-0.20) (0.47) (-0.22) (-0.60) (-0.33) (-1.24) (-1.32) (-0.71)
March 2012 LTRO -0.2457 -0.2800 -0.1687 -0.3936 -0.0000 -0.0038 0.0105*** -0.0043 -0.0032 -0.0125**
(-0.52) (-0.59) (-0.30) (-0.73) (-0.01) (-1.28) (4.10) (-1.23) (-1.00) (-2.11)
Log-TA -8.4690*** -8.3727*** -9.1027*** 4.8975 0.0145*** 0.0133** -0.0454** -0.0440*** -0.0353*** -0.0072
(-7.44) (-7.29) (-7.06) (1.27) (2.67) (2.19) (-2.27) (-5.80) (-4.55) (-0.20)
Log-Banks -0.6535*** -0.6217*** -0.7434*** -8.9936 -0.0007 -0.0003 -0.0176 -0.0140*** -0.0150*** -0.2520***
(-4.06) (-3.81) (-4.44) (-0.82) (-0.61) (-0.23) (-0.33) (-8.06) (-8.70) (-2.77)
Deposits/Assets 3.1245*** 3.1286*** 3.0145*** 3.8664*** -0.0063** -0.0029 -0.0228*** 0.0210*** 0.0171*** 0.0304***
(6.05) (6.05) (5.25) (3.10) (-2.16) (-0.95) (-4.48) (7.41) (7.16) (2.87)
Repos/Assets -29.1993* -28.7485* -55.8495** 38.6281 0.0137 -0.0126 -0.1302 0.5372*** 0.1089 0.2958
(-1.96) (-1.92) (-2.43) (1.61) (0.12) (-0.06) (-1.10) (3.90) (0.72) (1.30)
Capital (Yes/No)
-0.1191
0.0021**
-0.0002
(-0.77)
(2.46)
(-0.18)
∆European Economic Sentiment -0.0378*** -0.0383*** -0.0405*** -0.0141** 0.0002*** 0.0002*** 0.0001 -0.0001*** -0.0001*** -0.0001**
(-6.72) (-6.79) (-6.10) (-2.26) (9.93) (9.47) (1.57) (-4.05) (-3.68) (-2.13)
Constant 66.8017*** 65.9581*** 71.6824*** 23.1532 -0.0681* -0.0636 0.5527** 0.5392*** 0.4854*** 1.9810***
(8.16) (7.96) (7.77) (0.42) (-1.65) (-1.38) (2.00) (9.25) (8.15) (4.43)
Country-Fixed Effects Yes Yes Yes Yes Yes Yes Yes Yes Yes Yes
Time Effects Yes Yes Yes Yes Yes Yes Yes Yes Yes Yes
Observations 725 725 593 132 725 593 132 725 593 132 R-squared 0.72 0.72 0.71 0.78 0.84 0.85 0.84 0.98 0.97 0.89

55
Panel B: Bank balance data
(1) (2) (3) (4) (5) (6) (7) (8) (9) (10)
Loans / Government Securities Government Securities (% Total Assets) Loans (% Total Assets)
Not Italy and Spain Only Italy and Spain Not Italy and Spain Only Italy and Spain Not Italy and Spain Only Italy and Spain
2009 LTROs -0.685** -0.623** -0.811*** -0.182 0.013*** 0.015*** 0.005 -0.002 -0.002 -0.005
(-2.47) (-2.24) (-2.80) (-0.26) (3.86) (3.92) (0.76) (-0.96) (-0.64) (-0.89)
2011 / 2012 LTROs 0.305 0.325 0.282 -2.382* -0.006 -0.007 0.019* -0.004 -0.001 -0.013**
(0.62) (0.65) (0.72) (-1.97) (-0.81) (-0.89) (1.88) (-0.67) (-0.15) (-2.01)
Log-TA -0.934 -0.979 0.404 -12.659** 0.014 0.007 0.076** -0.053*** -0.041** -0.137***
(-0.85) (-0.89) (0.49) (-2.27) (0.89) (0.40) (2.05) (-2.81) (-2.06) (-3.02)
Capital (Yes / No)
-0.432
-0.002
-0.000
(-1.53)
(-0.48)
(-0.10)
Constant 17.226 17.779 0.418 162.037** -0.025 0.081 -0.839* 1.218*** 1.046*** 2.352***
(1.32) (1.36) (0.04) (2.41) (-0.13) (0.43) (-1.86) (5.51) (4.50) (4.31)
Bank Fixed Effects Yes Yes Yes Yes Yes Yes Yes Yes Yes Yes
Time Effects Yes Yes Yes Yes Yes Yes Yes Yes Yes Yes
Observations 362 362 291 71 373 292 81 559 439 120
R-squared 0.73 0.73 0.72 0.71 0.90 0.89 0.84 0.98 0.97 0.94

56
Appendix I
Variable Definitions
Variable Definition
Greece, Italy, Spain,
Portugal, Ireland
Daily returns on 10-year government bonds issued by Greece, Italy, Spain, Portugal
and Ireland
GIPSI Daily returns on 10-year government bonds issued by either Greece, Italy, Spain,
Portugal or Ireland
Home Home is the return from the 10-year government bond of the home country the bank
is domiciled in.
PC1 The first principal component (PC1) is the linear combination of GIPSI bond
returns with the highest eigenvalue.
Germany Daily returns on ten-year government bonds issued by Germany.
France Daily returns on ten-year government bonds issued by France.
Log-Assets Log-Assets is the natural logarithm of total book assets.
ST-LVG ST-LVG is short-term debt divided by total debt.
RWA/Assets RWA/Assets is risk-weighted assets divided by total assets.
Book-LVG Book-LVG is measured as total book assets divided by book value of equity.
Loans/Assets Loans/Assets is customers’ loans divided by total assets.
Tier 1 Tier1 is Tier 1 capital divided by risk-weighted assets.
Capital (Yes/No) Capital (Yes/No) is an indicator variable that is 1 if the bank has raised capital in
the current quarter.
Log-Capital Log-Capital is the natural logarithm of the amount raised in that quarter.
ECB Funding/Repo ECB Funding/Repo is the euro amount of ECB financing divided by total repos
from banks, customers and the ECB.
Realized Return (%) Realized Return is the bank’s equity return.
Bank CDS (bps) Bank CDS is the five-year CDS spread of European banks.
∆Log(Bank CDS) Δ Log (Bank CDS) is the change in the log of daily CDS spreads.
Predicted Return Predicted return is the predicted banks’ equity return.
βGreece, βItaly, βSpain Estimated factor loadings from cross-sectional regressions from banks’ stock
returns on ten-year government bond returns from Greece, Italy and Spain.
Macro-State Variables
Stock Index Stock Index is the residual from the regression of the domestic stock market’s daily
log returns on daily domestic sovereign bond and German bund returns.
∆VSTOXX ∆VSTOXX is change in the VSTOXX Index for the European stock market.
Term Structure Term Structure is the slope of the term structure of interest rates measured as the
difference between the yield on a ten-year euro area government bond and the one-
month Euribor.
Bond Default Spread Bond Default Spread is the difference between the yield on ten-year German BBB
bonds and yields on ten-year German government debt.
1 month EURIBOR One-month EURIBOR is level of the short-term risk-free interest rate measured as
the one-month Euribor.
∆European Economic
Sentiment
∆European Economic Sentiment is the monthly change in the economic sentiment
indicator obtained from opinion surveys conducted by the European Central Bank.
∆Level of Production ∆Level of Industrial Production is the monthly change in the level of industrial
production.
∆European Consumer
Price Index
European Consumer Price Index is the change in inflation measured as the monthly
change in the European Consumer Price Index.

57
Appendix II
List of Banks This table provides a list of all public banks included in the EBA stress tests sorted by asset size as of December
31, 2011. We provide the identifier used to match the banks to SNL Financial, Bloomberg and the EBA stress
test data.
Bank SNL ID Bloomberg
Ticker
EBA
ID Country
Total Assets
(EUR Million)
Deutsche Bank AG 113830 DBK DE017 Germany 2,164,103
HSBC Holdings Plc 113876 HSBA GB089 United Kingdom 1,967,796
BNP Paribas SA 3001689 BNP FR013 France 1,965,283
Barclays Plc 114508 BARC GB090 United Kingdom 1,871,469
Royal Bank of Scotland Group Plc 3001937 RBS GB088 United Kingdom 1,803,649
Crédit Agricole SA 4085960 ACA FR014 France 1,723,608
ING Groep N.V. 113837 INGA NL047 Netherlands 1,273,580
Banco Santander SA 113983 SAN ES059 Spain 1,251,525
Société Générale SA 113818 GLE FR016 France 1,181,372
Lloyds Banking Group Plc 4041848 LLO GB091 United Kingdom 1,161,698
UniCredit SpA 4055762 UCG IT041 Italy 926,769
Nordea Bank AB 4108919 NDA SE084 Sweden 716,204
Commerzbank AG 113985 CBK DE018 Germany 661,763
Intesa Sanpaolo SpA 4100801 ISP IT040 Italy 639,221
Banco Bilbao Vizcaya Argentaria, SA 113904 BBVA ES060 Spain 597,688
Danske Bank A/S 4080954 DANSKE DK008 Denmark 460,832
Dexia SA 4024522 DEXB BE004 Belgium 412,759
Bankia 4280116 BKIA ES061 Spain 318,119
KBC Group N.V. 4145062 KBC BE005 Belgium 285,382
Svenska Handelsbanken AB 4144846 SHBA SE086 Sweden 275,514
DNB ASA 4142645 DNB NO051 Norway 274,216
Skandinaviska Enskilda Banken AB 4144847 SEBA SE085 Sweden 265,219
Banca Monte dei Paschi di Siena SpA 4182766 BMPS IT042 Italy 240,702
Erste Group Bank AG 4089743 EBS AT001 Austria 210,006
Swedbank AB 4153551 SWEDA SE087 Sweden 208,464
Bank of Ireland 4041921 BKIR IE038 Ireland 154,880
Raiffeisen Bank International AG 4145042 RBI AT002 Austria 146,985
Allied Irish Banks, Plc 4002079 ALBK IE037 Ireland 136,651
Banco Popolare Società Cooperativa 4183874 BP IT043 Italy 134,127
Landesbank Berlin Holding AG 4087940 BEB2 DE027 Germany 131,175
Banco Popular Español SA 4144838 POP ES064 Spain 130,926
Unione di Banche Italiane SCpA 4238420 UBI IT044 Italy 129,804
National Bank of Greece SA 4048999 ETE GR031 Greece 106,732
Banco Sabadell SA 4151699 SAB ES065 Spain 100,437
Banco Comercial Português SA 4150602 BCP PT054 Portugal 93,482
Espirito Santo Financial Group SA 4050944 ESF PT055 Luxembourg 84,020
EFG Eurobank Ergasias SA 4145113 EUROB GR030 Greece 76,822
Bankinter SA 4144839 BKT ES069 Spain 59,491
Alpha Bank AE 4080963 ALPHA GR032 Greece 59,148
Piraeus Bank SA 4145110 TPEIR GR033 Greece 49,352
Banco BPI SA 4182795 BPI PT056 Portugal 42,956
PKO Bank Polski SA 4182794 PKO PL052 Poland 42,735
Österreichische Volksbanken AG 4155879 VBPS AT003 Austria 41,135
Bank of Cyprus Public Company Limited 4055628 BOCY CY007 Cyprus 37,474
Jyske Bank A/S 4145097 JYSK DK009 Denmark 36,364
Cyprus Popular Bank Public Co. Ltd. 4238370 CPB CY006 Cyprus 33,762
OTP Bank Nyrt 4145030 OTP HU036 Hungary 32,413
Banco Pastor SA 4182796 PAS ES074 Spain 30,376
ATEbank SA 4145105 ATE GR034 Greece 28,818
Sydbank A/S 4145111 SYDN DK010 Denmark 20,649
TT Hellenic Postbank SA 4185792 TT GR035 Greece 16,396
Bank of Valletta Plc 4186075 BOV MT046 Malta 6,623
Nova Kreditna Banka Maribor d.d. 4238383 KBMR SI058 Slovenia 5,816
FHB Jelzalogbank Nyrt 4186091 FHB HU111 Hungary 2,593
Caja de Ahorros del Mediterráneo 4120096 CAM ES083 Spain NA
Hypo Real Estate 4145051 HRX DE023 Germany NA
Irish Life and Permanent 4022210 IPM IE039 Ireland NA