The Greater New Brunswick Hotspoing Reportrwjms.umdnj.edu › departments_institutes ›...
24
The Greater New Brunswick Hotspotng Report Maria B. Pellerano, M.A., M.B.A., M.P.H Eric Jahn, M.D. Alfred F. Tallia, M.D., M.P.H. Rutgers Robert Wood Johnson Medical School Community Health Division, Department of Family Medicine and Community Health Office of the Senior Associate Dean for Community Health with The Greater New Brunswick Hotspotng Team March 2017
Transcript of The Greater New Brunswick Hotspoing Reportrwjms.umdnj.edu › departments_institutes ›...
The Greater New Brunswick
Hotspotting Report
Maria B. Pellerano, M.A., M.B.A., M.P.HEric Jahn, M.D.
Alfred F. Tallia, M.D., M.P.H.
Rutgers Robert Wood Johnson Medical SchoolCommunity Health Division, Department of Family Medicine and Community Health
Office of the Senior Associate Dean for Community Healthwith The Greater New Brunswick Hotspotting Team
March 2017

i
Acknowledgements
The Greater New Brunswick Hotspotting Project Team Members: Rutgers Robert Wood Johnson Medical School Family Medicine and Community Health
Eric Jahn, M.D. Maria B. Pellerano, M.A., M.B.A., M.P.H Alfred F. Tallia, M.D., M.P.H.
Camden Coalition of Healthcare Providers
Stephen Singer, M.C.P. Aaron Truchil, M.S.
Robert Wood Johnson University Hospital RWJBarnabas Health
Camilla Comer‐Carruthers, M.P.H. Michael E. Knecht, FACHE Mariam Merced, M.A.
Saint Peter’s University Hospital Marge Drozd, M.S.N., R.N., APRN‐BC Zachary Taylor, M.Ed., CHES
This project was completed with the generous support of The Nicholson Foundation.
ii
Table of Contents
Acknowledgements .................................................................................................................. i
Executive Summary ................................................................................................................. 1
Background ............................................................................................................................. 2 A National Problem ......................................................................................................................... 2 A Local Problem ............................................................................................................................... 2 The Impact of Socioeconomics ......................................................................................................... 3 The Development of Hotspotting ..................................................................................................... 3 Greater New Brunswick Hotspotting Research Team ....................................................................... 4 Three Hypotheses ............................................................................................................................ 5
Research Design and Methods ................................................................................................. 5 Definitions ....................................................................................................................................... 6
Results and Findings ................................................................................................................ 6 The Two Communities ..................................................................................................................... 6 Patient Characteristics ..................................................................................................................... 7 Hotspots .......................................................................................................................................... 8 High Utilizer Multiple Co‐Morbidities ............................................................................................... 8 Hospital Utilization .......................................................................................................................... 9 Costs and Medicaid Spending ........................................................................................................ 10 Top Diagnoses by Patient Characteristic ......................................................................................... 11 Limitations ..................................................................................................................................... 11
Discussion ............................................................................................................................. 12 Hotspots ........................................................................................................................................ 12 Consistency with Prior Studies ....................................................................................................... 12 Need for Collection of Consistent Reliable Long Term Community Oriented Quality Data .............. 12 Reinforcing RBHS Medicaid Mental Health/Substance Abuse Policy Recommendations ................. 12 Patient Access, Jurisdictional Challenges, and Need for Coordination of Services ........................... 12
Conclusion ............................................................................................................................. 13
References: ........................................................................................................................... 14
Appendix 1 – New Brunswick Health Partners Hotspotting Analysis by the Camden Coalition of Healthcare Providers, July 2015 ......................................................................................... 16
Appendix 2 ‐ Comparison of Camden Coalition Analysis and CSHP High Utilization Studies ... 19
Appendix 3 – Recommendations from the RBHS Working Group on Medicaid High Utilizers . 21
1
The Greater New Brunswick1 Hotspotting Project Report
Executive Summary
During 2012‐2013, of 45,316 total patients (primary patient cohort) from New Brunswick and Franklin Township, N.J. visiting Robert Wood Johnson University Hospital and Saint Peter’s University Hospital, 1,370 patients (3%) were Medicaid ‘High Utilizers.’
High Utilizers visited the Emergency Department (ED) of one or both hospitals five or more times or had three or more hospitalizations during the two years; and the higher the utilization, the more likely the patient visited both hospitals.
Ten percent of Census blocks in New Brunswick and Franklin Township account for almost 30 percent (29.4%) of adult high utilizing Medicaid patients and 37 percent (37.5%) of hospital receipts.
Eight individual buildings / complexes consisting of apartment complexes, skilled nursing, and post‐acute facilities were identified as ‘Hotspots.’
Over the two‐year study period, each Hotspot had hospital receipts totaling over $1 million (range is $1.08 million to $3.85 million), with two post‐acute facility Hotspots having hospital receipts totaling over $3 million each ($3.49 and $3.85 million). The average two‐year cost per patient from all ‘Hotspots’ was $17,997 (range $4,479 to $38,889).
Diagnoses associated with High Utilizers reveal multiple morbidities, including behavioral health diagnoses.
A higher percentage of extreme ED utilizing patients have mental health and substance abuse comorbidities than high inpatient utilizing patients or high ED utilizing patients.
Reducing costs for these high utilizers will require coordination and cooperation across primary care, acute care, and behavioral health hospitals and facilities, and across neighboring county and municipal governmental jurisdictions providing social services.
1 In this project, Greater New Brunswick encompasses the City of New Brunswick (zip codes: 08901 and 08903) and
Franklin Township (zip code: 08873). More detail is provided in the body of the report.
2
Background
A National Problem According to the Organization for Economic Cooperation and Development (OECD), the U.S.
spends more money per capita than any other country on healthcare (Squires and Anderson,
2015). In 2013, the U.S. spent a total of $2.88 trillion on health care equaling $9,115 per person,
which means that health care is responsible for 17.3 percent of the United States Gross Domestic
Product (Peterson‐Kaiser, 2015). The Agency for Healthcare Research and Quality (AHRQ) has
shown that the sickest five percent of U.S. patients account for almost 50% of U.S. health care
costs (Cohen, S.B. and Yu, W. 2012). In addition, AHRQ has shown that the five most expensive
health conditions are heart disease, trauma‐related disorders, cancer, mental disorders, and
chronic obstructive pulmonary disease (COPD) / asthma. In 2012, these conditions accounted
for 32.6% percent of total U.S. health care expenses. (Cohen, 2014).
A Local Problem New Jersey has among the highest rates of avoidable hospital use in the United States particularly
among low‐income populations (Schoen, Radley, Riley, Lippa, Berenson, Dermody, and Shih,
2013). Compared to N.J. residents in high‐income zip codes, residents in low‐income zip codes
are hospitalized two to three times as often for pediatric asthma, adult respiratory disease, and
adult diabetes (Schoen, et al., 2013). The Greater New Brunswick area is no exception. Using
data from 2008‐2010, Rutgers Center for State Health Policy (CSHP) reviewed hospital utilization
patterns for the two New Brunswick based hospitals – Saint Peter’s University Hospital and
Robert Wood Johnson University Hospital. CSHP researchers found that the two hospitals’ overall
catchment area’s avoidable hospitalization and Emergency Department (ED) visit rates are lower
than the state’s average but the avoidable ED visit rate for New Brunswick residents is more than
twice as high as N.J.’s overall rate (Chakravarty, Brownlee, Tong, Pellerano, Howard, Shaw, Chase,
and Crabtree, 2012). More recent data (2011‐2013) reviewed for the two hospitals found
similarly high avoidable ED visit rates (Brownlee, Farnham, Chakravarty, and Zhang, 2016). In
2013, the Rutgers Center for State Health Policy specifically reviewed hospital utilization patterns
in 13 low income communities. The researchers found that the hospitals could lower costs for
patients from the Greater New Brunswick area2 by improving avoidable emergency department
(ED) visits, high ED utilization, and hospital readmissions (Chakravarty, Cantor, Tong, DeLia,
Lontok, & Nova, 2013).
2 The Greater New Brunswick Medicaid ACO area study included by CSHP researchers included New Brunswick (zip
codes 08901 and 08903) and Franklin Township (zip code: 08873). Areas designated as “low income” included at least 5,000 Medicaid beneficiaries.
3
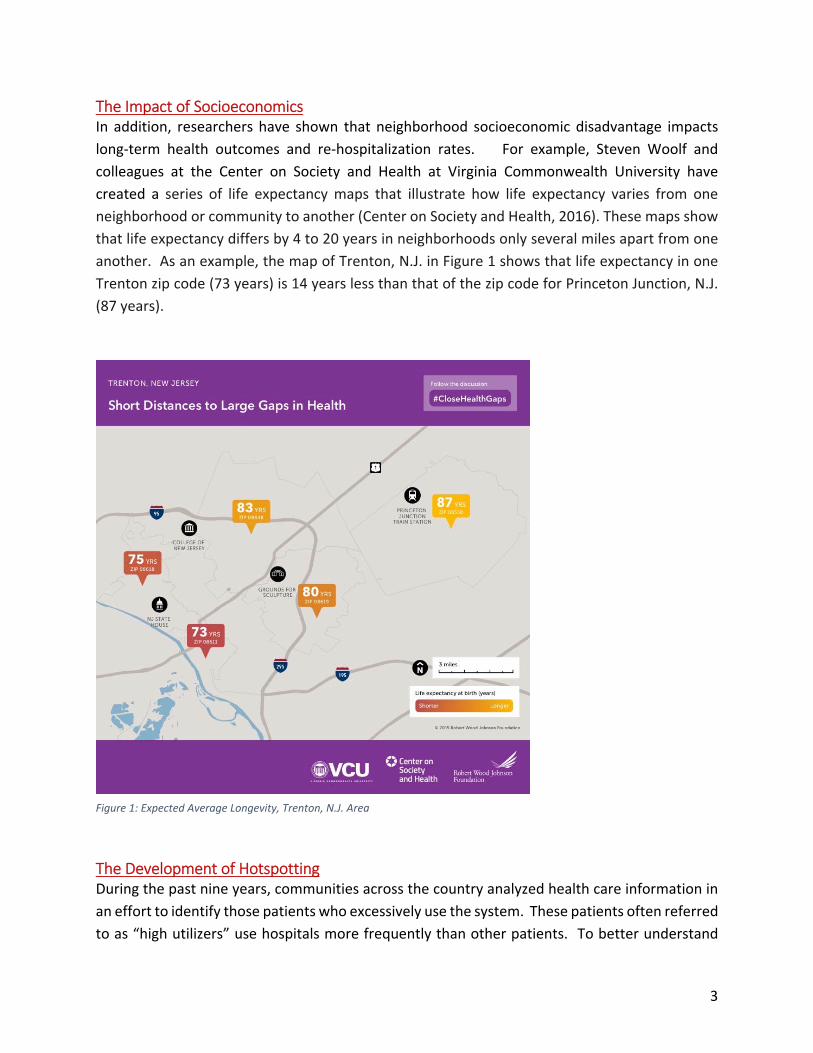
The Impact of Socioeconomics In addition, researchers have shown that neighborhood socioeconomic disadvantage impacts
long‐term health outcomes and re‐hospitalization rates. For example, Steven Woolf and
colleagues at the Center on Society and Health at Virginia Commonwealth University have
created a series of life expectancy maps that illustrate how life expectancy varies from one
neighborhood or community to another (Center on Society and Health, 2016). These maps show
that life expectancy differs by 4 to 20 years in neighborhoods only several miles apart from one
another. As an example, the map of Trenton, N.J. in Figure 1 shows that life expectancy in one
Trenton zip code (73 years) is 14 years less than that of the zip code for Princeton Junction, N.J.
(87 years).
The Development of Hotspotting During the past nine years, communities across the country analyzed health care information in
an effort to identify those patients who excessively use the system. These patients often referred
to as “high utilizers” use hospitals more frequently than other patients. To better understand
Figure 1: Expected Average Longevity, Trenton, N.J. Area
4
what this means at the local level, the Camden Coalition of Healthcare Providers (Camden
Coalition) developed models for identifying high‐utilizing patients in hopes of providing them
with better coordinated medical and social services. This model is referred to as “hotspotting”
and has become a nationally recognized model for addressing the needs of this most challenging
population (Gawande, A., 2011). The goal of hotspotting is to identify patients who utilized the
most hospital‐based care in a given area and understand the characteristics these patients share
to develop programs and interventions that can keep them healthier and out of the hospital. To
date, the Camden Coalition has worked with seven other communities and counties in New
Jersey and in the United States to analyze data and map hotspots3.
Greater New Brunswick Hotspotting Research Team Against this backdrop, the Department of Family Medicine and Community Health at Rutgers
Robert Wood Johnson Medical School, Robert Wood Johnson University Hospital, and Saint
Peter’s University Hospital joined together as the Greater New Brunswick team to take advantage
of a hotspotting opportunity. In 2014, the New Jersey Health Care Quality Institute and the
Camden Coalition of Healthcare Providers received funding from The Nicholson Foundation to
assist five additional N.J. communities with hotspotting. The Greater New Brunswick team
responded to this call and was chosen to work with the Camden Coalition of Healthcare Providers
to develop a hotspotting project for the Greater New Brunswick area. The research team was
led by the Department of Family Medicine and Community Health at Rutgers Robert Wood
Johnson Medical School, and included staff from Robert Wood Johnson University Hospital and
Saint Peter’s University Hospital, and the Camden Coalition of Healthcare Providers (Camden
Coalition). This research team (NB Hotspotting team) wanted to better understand New
Brunswick and Franklin Township, N.J.’s4 hospital utilization patterns. It was expected that data
from the Greater New Brunswick Hotspotting Project would inform New Brunswick Health
Partners’ application to the State to be certified as a Medicaid ACO Demonstration Project5, and
would provide actionable data for modifying existing, or starting new, health‐related services.
3 These include Trenton, N.J., Newark, N.J., North Jersey around Morris County, JFK Medical Center, Atlantic City,
Maine (3 counties), and Howard County, Maryland. 4 This report refers to zip code 08873 as Franklin Township throughout this report. The NB hotspotting team’s
adoption of New Brunswick and Franklin Township is consistent with the work previously done by the Center for State Health Policy (Chakravarty, et al., 2013). 5 New Brunswick Health Partners is a 501(c)3 corporation established by Rutgers to serve the Medicaid population
in collaboration with our local hospital partners. To learn more about New Jersey’s Medicaid ACO demonstration
projects see http://www.nj.gov/humanservices/dmahs/info/aco.html
5
Three Hypotheses Researchers posited three hypotheses at the start of this project:
The location of high utilizers will cluster geographically;
High utilizing patients have at least two or more comorbidities;
High utilizing patients have higher rates of behavioral health issues compared to appropriate hospital utilizers
Research Design and Methods
This study was a retrospective review of hospital claims data for patients residing in New
Brunswick and Franklin Township, N.J. The study was approved by three Institutional Review
Boards:6 Rutgers Biomedical and Health Sciences for Rutgers Robert Wood Johnson Medical
School and Robert Wood Johnson University Hospital; Saint Peter’s University Hospital; and
Cooper University Hospital for Camden Coalition of Healthcare Providers.
Hospital billing data for inpatient and Emergency Department (ED) care were requested from
Robert Wood Johnson University Hospital and Saint Peter’s University Hospital. These routine
administrative datasets containing hospital reimbursement claims include useful data elements
(variables) that are used for internal auditing and research purposes. These data elements
provide demographic, clinical and financial information for patients who have utilized hospital
services. The various data elements from these data sets are a starting point for the information
needed for hotspotting.
In 2015, Robert Wood Johnson University Hospital and Saint Peter’s University Hospital provided
the Camden Coalition of Healthcare Providers (Camden Coalition) with electronic data for all
patients discharged (from the ED and for hospitalization) in 2012 and 2013 with a reported
address within New Brunswick (08901 and 08903 zip codes) and Franklin Township, N.J (08873
zip code) or who were homeless and had no address.
Analysts at Camden Coalition of Healthcare Providers cleaned, standardized and linked the
Robert Wood Johnson University Hospital and Saint Peter’s University Hospital datasets to create
a Greater New Brunswick database. Camden Coalition analysts used probabilistic linkage to
identify records belonging to the same patient. Probabilistic linkage7 allows the researchers to
link individuals across data sets despite no common identifier, a key step for understanding the
6 The three Institutional Review Boards provided the researchers with a waiver of consent to this retrospective study. 7 More information on this statistical procedure may be found at http://healthcarehotspotting.com/wp/data‐
cleaning/probabilistic‐linkage/
6
full number of times a person used the hospitals and whether or not a particular patient accessed
services at both hospitals.
Patient de‐identification was central to the creation of the city‐wide database. Each patient
identified in the dataset was assigned a pseudo‐id and all identifiers were removed (for example
medical record numbers) or converted into less identifiable forms (for example, dates of birth
were turned into age integer). The city‐wide database was used for all analysis conducted by the
Camden Coalition of Healthcare Providers. This analysis sought to understand: 1) the number of
patients accessing hospital‐based care including frequencies and costs associated with utilization;
2) classification of different sub‐populations with different hospital utilization patterns; and 3)
identification of geographic “hotspots” for high hospital utilization. The Camden Coalition of
Healthcare Providers provided a report of its findings (attached as Appendix 1) to the NB
Hotspotting Team. At the conclusion of the analysis, a complete de‐identified dataset was
returned to Robert Wood Johnson Medical School, and individual datasets of each hospital’s own
patient records were returned to Robert Wood Johnson University Hospital and Saint Peter’s
University Hospital.
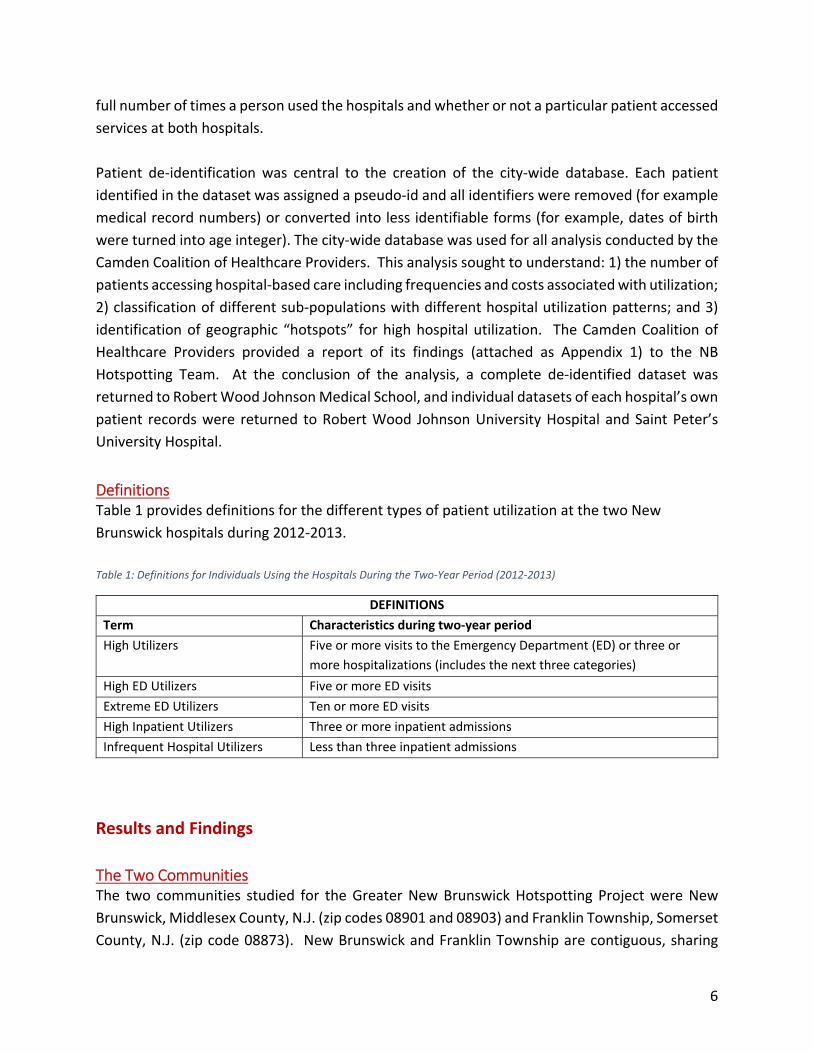
Definitions Table 1 provides definitions for the different types of patient utilization at the two New
Brunswick hospitals during 2012‐2013.
Table 1: Definitions for Individuals Using the Hospitals During the Two‐Year Period (2012‐2013)
DEFINITIONS
Term Characteristics during two‐year period
High Utilizers Five or more visits to the Emergency Department (ED) or three or
more hospitalizations (includes the next three categories)
High ED Utilizers Five or more ED visits
Extreme ED Utilizers Ten or more ED visits
High Inpatient Utilizers Three or more inpatient admissions
Infrequent Hospital Utilizers Less than three inpatient admissions
Results and Findings
The Two Communities The two communities studied for the Greater New Brunswick Hotspotting Project were New
Brunswick, Middlesex County, N.J. (zip codes 08901 and 08903) and Franklin Township, Somerset
County, N.J. (zip code 08873). New Brunswick and Franklin Township are contiguous, sharing
7
several borders along primary roads that lead directly into New Brunswick making it relatively
easy to access the region’s two hospitals, which are in New Brunswick. Even though these two
towns border each other, the demographic make‐up and socio‐economic status of the two towns
differ. See Table 2 for comparative demographic data for New Brunswick and Franklin Township,
N.J.
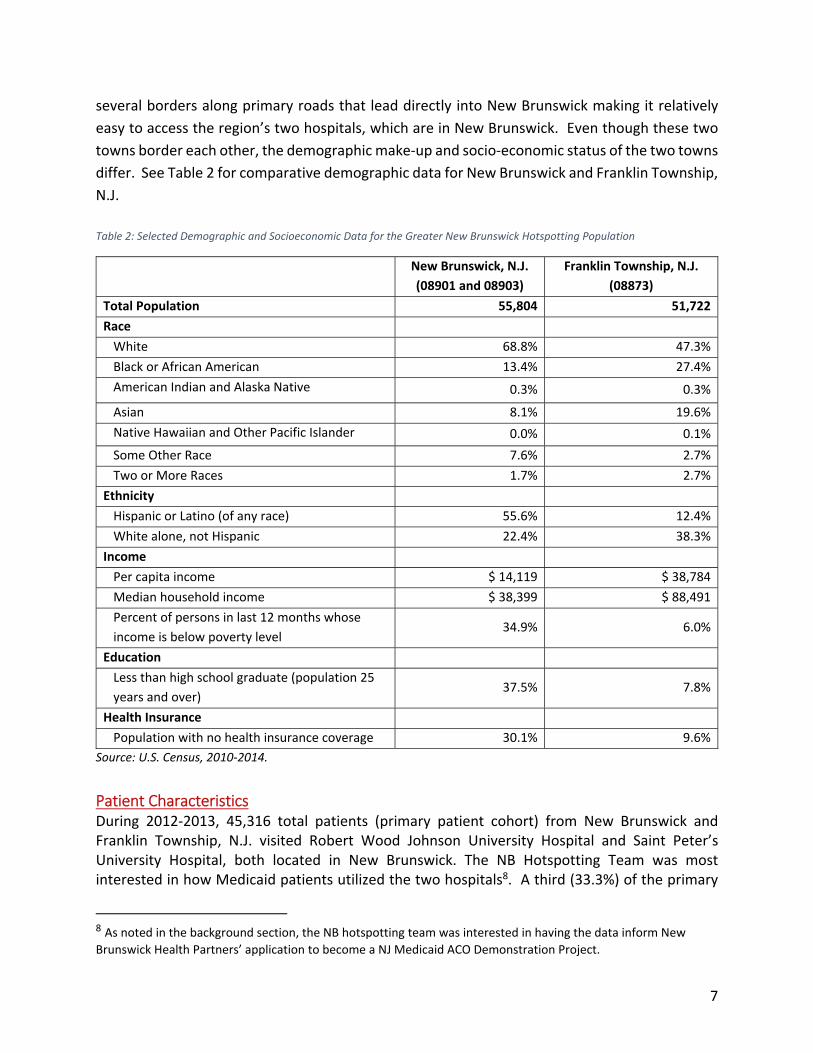
Table 2: Selected Demographic and Socioeconomic Data for the Greater New Brunswick Hotspotting Population
New Brunswick, N.J.
(08901 and 08903)
Franklin Township, N.J.
(08873)
Total Population 55,804 51,722
Race
White 68.8% 47.3%
Black or African American 13.4% 27.4%
American Indian and Alaska Native 0.3% 0.3%
Asian 8.1% 19.6%
Native Hawaiian and Other Pacific Islander 0.0% 0.1%
Some Other Race 7.6% 2.7%
Two or More Races 1.7% 2.7%
Ethnicity
Hispanic or Latino (of any race) 55.6% 12.4%
White alone, not Hispanic 22.4% 38.3%
Income
Per capita income $ 14,119 $ 38,784
Median household income $ 38,399 $ 88,491
Percent of persons in last 12 months whose
income is below poverty level 34.9% 6.0%
Education
Less than high school graduate (population 25
years and over) 37.5% 7.8%
Health Insurance
Population with no health insurance coverage 30.1% 9.6%
Source: U.S. Census, 2010‐2014.
Patient Characteristics During 2012‐2013, 45,316 total patients (primary patient cohort) from New Brunswick and Franklin Township, N.J. visited Robert Wood Johnson University Hospital and Saint Peter’s University Hospital, both located in New Brunswick. The NB Hotspotting Team was most interested in how Medicaid patients utilized the two hospitals8. A third (33.3%) of the primary
8 As noted in the background section, the NB hotspotting team was interested in having the data inform New
Brunswick Health Partners’ application to become a NJ Medicaid ACO Demonstration Project.
8
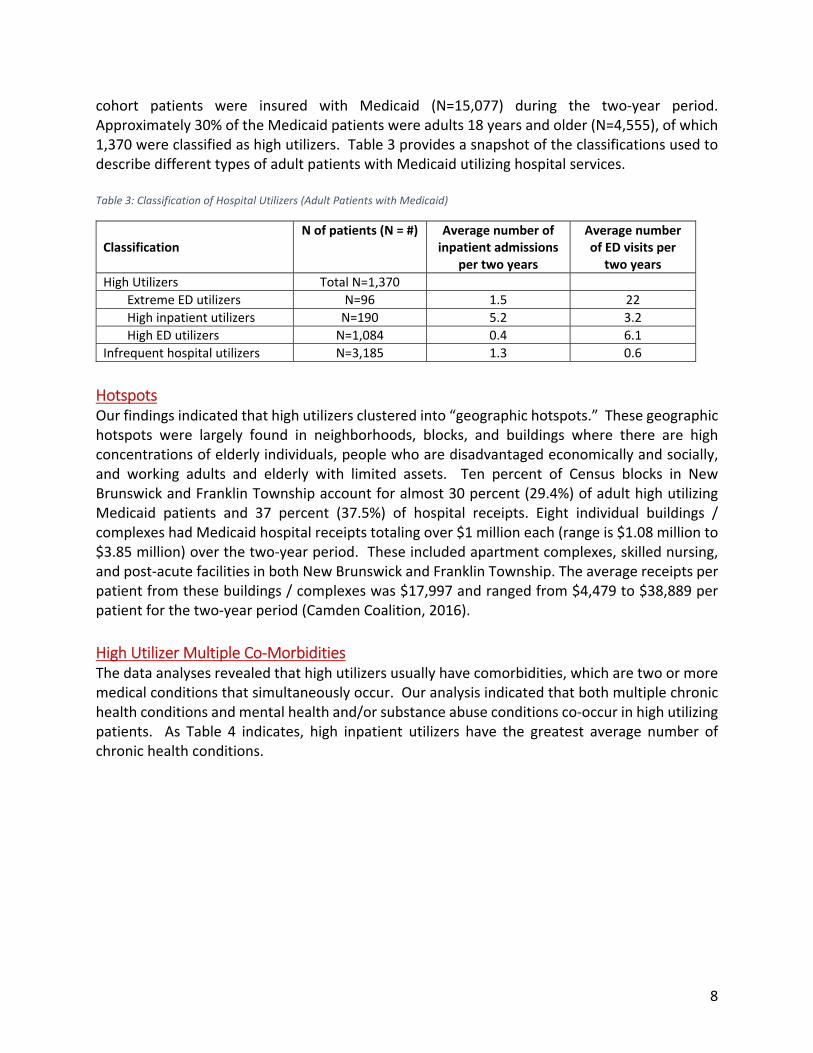
cohort patients were insured with Medicaid (N=15,077) during the two‐year period. Approximately 30% of the Medicaid patients were adults 18 years and older (N=4,555), of which 1,370 were classified as high utilizers. Table 3 provides a snapshot of the classifications used to describe different types of adult patients with Medicaid utilizing hospital services. Table 3: Classification of Hospital Utilizers (Adult Patients with Medicaid)
Classification N of patients (N = #) Average number of
inpatient admissions per two years
Average number of ED visits per
two years
High Utilizers Total N=1,370
Extreme ED utilizers N=96 1.5 22
High inpatient utilizers N=190 5.2 3.2
High ED utilizers N=1,084 0.4 6.1
Infrequent hospital utilizers N=3,185 1.3 0.6
Hotspots Our findings indicated that high utilizers clustered into “geographic hotspots.” These geographic hotspots were largely found in neighborhoods, blocks, and buildings where there are high concentrations of elderly individuals, people who are disadvantaged economically and socially, and working adults and elderly with limited assets. Ten percent of Census blocks in New Brunswick and Franklin Township account for almost 30 percent (29.4%) of adult high utilizing Medicaid patients and 37 percent (37.5%) of hospital receipts. Eight individual buildings / complexes had Medicaid hospital receipts totaling over $1 million each (range is $1.08 million to $3.85 million) over the two‐year period. These included apartment complexes, skilled nursing, and post‐acute facilities in both New Brunswick and Franklin Township. The average receipts per patient from these buildings / complexes was $17,997 and ranged from $4,479 to $38,889 per patient for the two‐year period (Camden Coalition, 2016).
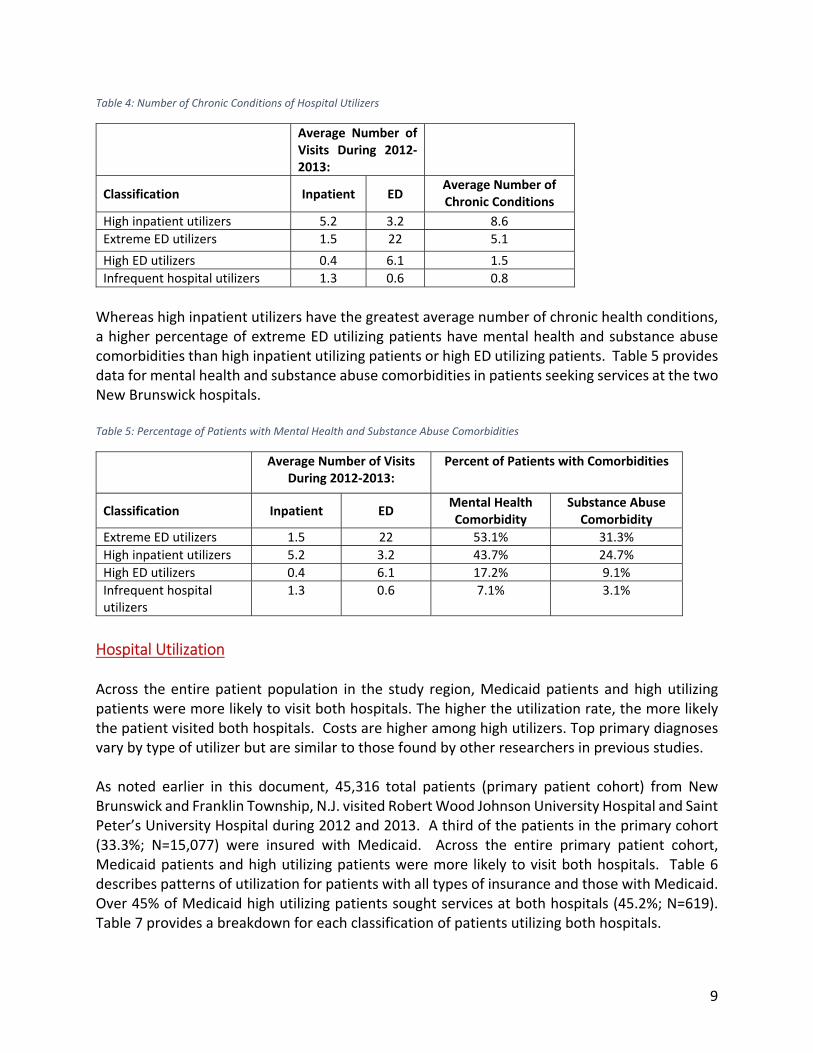
High Utilizer Multiple Co‐Morbidities The data analyses revealed that high utilizers usually have comorbidities, which are two or more medical conditions that simultaneously occur. Our analysis indicated that both multiple chronic health conditions and mental health and/or substance abuse conditions co‐occur in high utilizing patients. As Table 4 indicates, high inpatient utilizers have the greatest average number of chronic health conditions.
9
Table 4: Number of Chronic Conditions of Hospital Utilizers
Average Number of Visits During 2012‐2013:
Classification Inpatient ED Average Number of Chronic Conditions
High inpatient utilizers 5.2 3.2 8.6
Extreme ED utilizers 1.5 22 5.1
High ED utilizers 0.4 6.1 1.5
Infrequent hospital utilizers 1.3 0.6 0.8
Whereas high inpatient utilizers have the greatest average number of chronic health conditions, a higher percentage of extreme ED utilizing patients have mental health and substance abuse comorbidities than high inpatient utilizing patients or high ED utilizing patients. Table 5 provides data for mental health and substance abuse comorbidities in patients seeking services at the two New Brunswick hospitals. Table 5: Percentage of Patients with Mental Health and Substance Abuse Comorbidities
Average Number of Visits During 2012‐2013:
Percent of Patients with Comorbidities
Classification Inpatient ED Mental Health Comorbidity
Substance Abuse Comorbidity
Extreme ED utilizers 1.5 22 53.1% 31.3%
High inpatient utilizers 5.2 3.2 43.7% 24.7%
High ED utilizers 0.4 6.1 17.2% 9.1%
Infrequent hospital utilizers
1.3 0.6 7.1% 3.1%
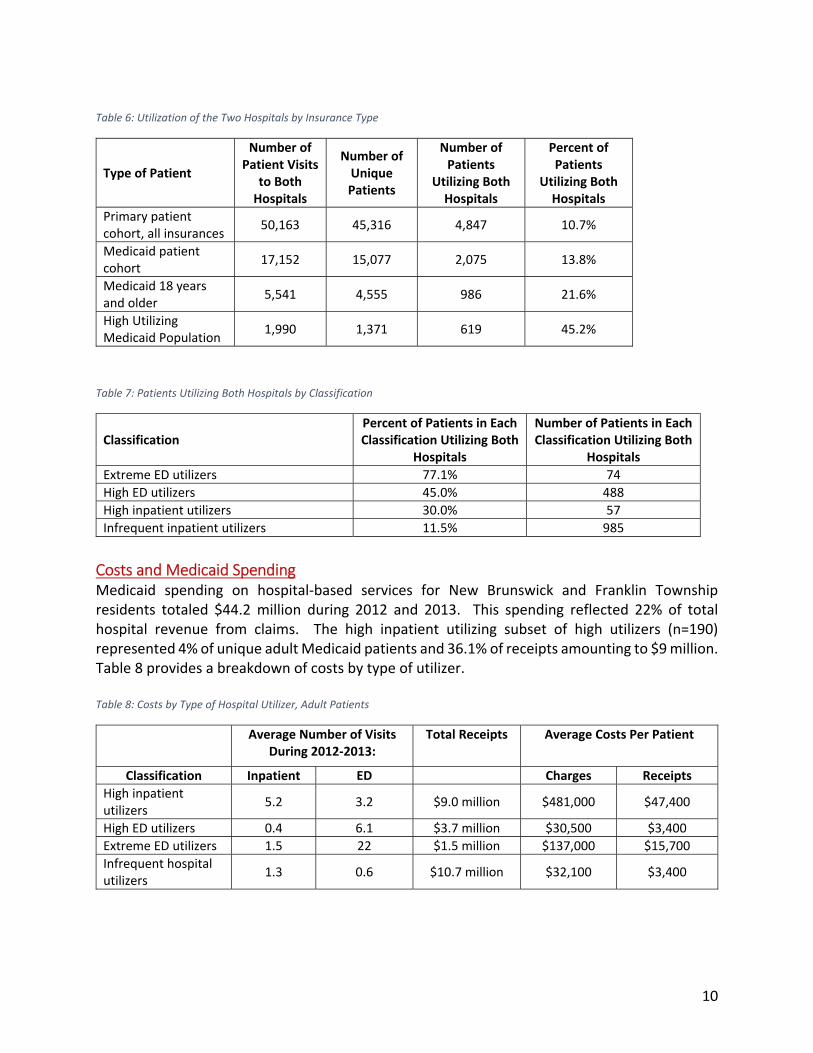
Hospital Utilization Across the entire patient population in the study region, Medicaid patients and high utilizing patients were more likely to visit both hospitals. The higher the utilization rate, the more likely the patient visited both hospitals. Costs are higher among high utilizers. Top primary diagnoses vary by type of utilizer but are similar to those found by other researchers in previous studies. As noted earlier in this document, 45,316 total patients (primary patient cohort) from New Brunswick and Franklin Township, N.J. visited Robert Wood Johnson University Hospital and Saint Peter’s University Hospital during 2012 and 2013. A third of the patients in the primary cohort (33.3%; N=15,077) were insured with Medicaid. Across the entire primary patient cohort, Medicaid patients and high utilizing patients were more likely to visit both hospitals. Table 6 describes patterns of utilization for patients with all types of insurance and those with Medicaid. Over 45% of Medicaid high utilizing patients sought services at both hospitals (45.2%; N=619). Table 7 provides a breakdown for each classification of patients utilizing both hospitals.
10
Table 6: Utilization of the Two Hospitals by Insurance Type
Type of Patient
Number of Patient Visits
to Both Hospitals
Number of Unique Patients
Number of Patients
Utilizing Both Hospitals
Percent of Patients
Utilizing Both Hospitals
Primary patient cohort, all insurances
50,163 45,316 4,847 10.7%
Medicaid patient cohort
17,152 15,077 2,075 13.8%
Medicaid 18 years and older
5,541 4,555 986 21.6%
High Utilizing Medicaid Population
1,990 1,371 619 45.2%
Table 7: Patients Utilizing Both Hospitals by Classification
Classification Percent of Patients in Each Classification Utilizing Both
Hospitals
Number of Patients in Each Classification Utilizing Both
Hospitals
Extreme ED utilizers 77.1% 74
High ED utilizers 45.0% 488
High inpatient utilizers 30.0% 57
Infrequent inpatient utilizers 11.5% 985
Costs and Medicaid Spending Medicaid spending on hospital‐based services for New Brunswick and Franklin Township residents totaled $44.2 million during 2012 and 2013. This spending reflected 22% of total hospital revenue from claims. The high inpatient utilizing subset of high utilizers (n=190) represented 4% of unique adult Medicaid patients and 36.1% of receipts amounting to $9 million. Table 8 provides a breakdown of costs by type of utilizer. Table 8: Costs by Type of Hospital Utilizer, Adult Patients
Average Number of Visits During 2012‐2013:
Total Receipts Average Costs Per Patient
Classification Inpatient ED Charges Receipts
High inpatient utilizers
5.2 3.2 $9.0 million $481,000 $47,400
High ED utilizers 0.4 6.1 $3.7 million $30,500 $3,400
Extreme ED utilizers 1.5 22 $1.5 million $137,000 $15,700
Infrequent hospital utilizers
1.3 0.6 $10.7 million $32,100 $3,400
11
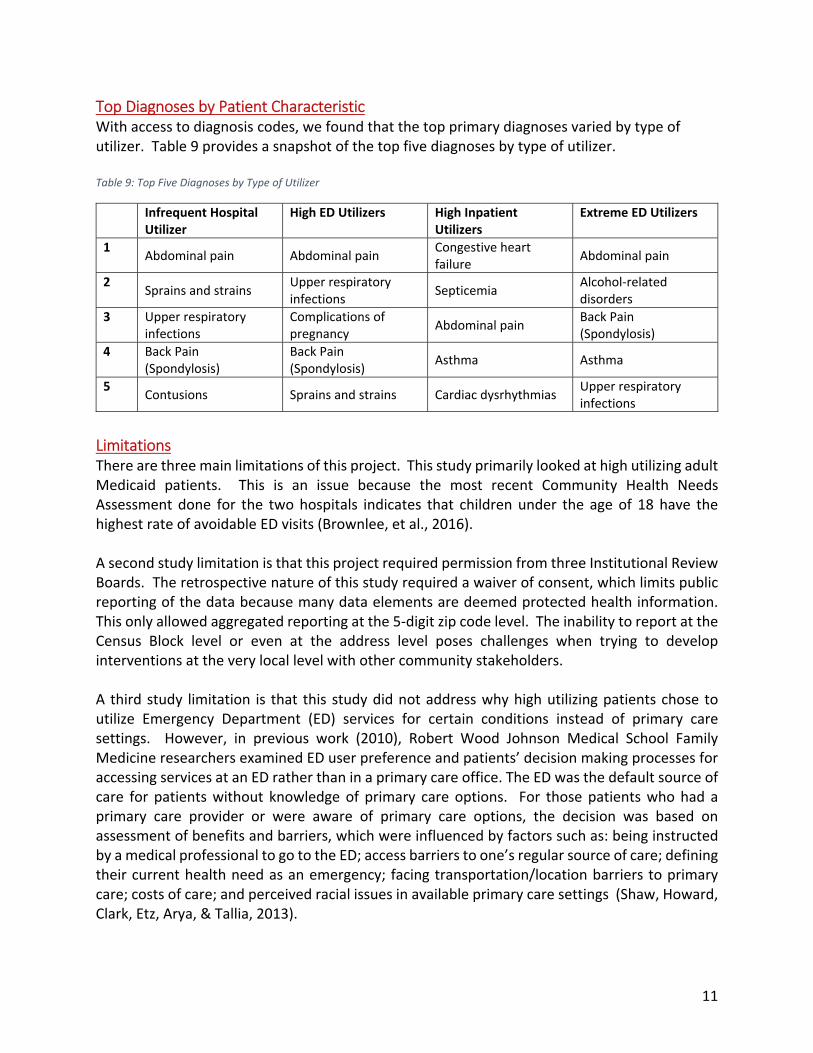
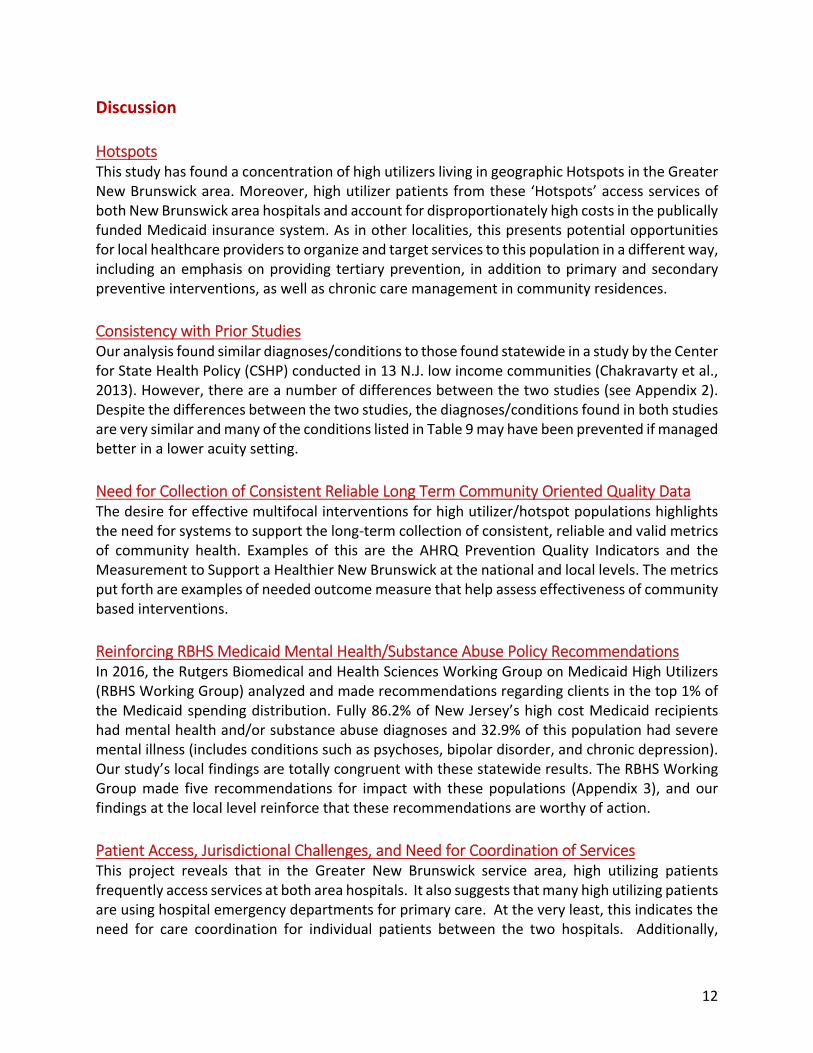
Top Diagnoses by Patient Characteristic With access to diagnosis codes, we found that the top primary diagnoses varied by type of utilizer. Table 9 provides a snapshot of the top five diagnoses by type of utilizer. Table 9: Top Five Diagnoses by Type of Utilizer
Infrequent Hospital Utilizer
High ED Utilizers High Inpatient Utilizers
Extreme ED Utilizers
1 Abdominal pain Abdominal pain
Congestive heart failure
Abdominal pain
2 Sprains and strains
Upper respiratory infections
Septicemia Alcohol‐related disorders
3 Upper respiratory infections
Complications of pregnancy
Abdominal pain Back Pain (Spondylosis)
4 Back Pain (Spondylosis)
Back Pain (Spondylosis)
Asthma Asthma
5 Contusions Sprains and strains Cardiac dysrhythmias
Upper respiratory infections
Limitations There are three main limitations of this project. This study primarily looked at high utilizing adult Medicaid patients. This is an issue because the most recent Community Health Needs Assessment done for the two hospitals indicates that children under the age of 18 have the highest rate of avoidable ED visits (Brownlee, et al., 2016). A second study limitation is that this project required permission from three Institutional Review Boards. The retrospective nature of this study required a waiver of consent, which limits public reporting of the data because many data elements are deemed protected health information. This only allowed aggregated reporting at the 5‐digit zip code level. The inability to report at the Census Block level or even at the address level poses challenges when trying to develop interventions at the very local level with other community stakeholders. A third study limitation is that this study did not address why high utilizing patients chose to utilize Emergency Department (ED) services for certain conditions instead of primary care settings. However, in previous work (2010), Robert Wood Johnson Medical School Family Medicine researchers examined ED user preference and patients’ decision making processes for accessing services at an ED rather than in a primary care office. The ED was the default source of care for patients without knowledge of primary care options. For those patients who had a primary care provider or were aware of primary care options, the decision was based on assessment of benefits and barriers, which were influenced by factors such as: being instructed by a medical professional to go to the ED; access barriers to one’s regular source of care; defining their current health need as an emergency; facing transportation/location barriers to primary care; costs of care; and perceived racial issues in available primary care settings (Shaw, Howard, Clark, Etz, Arya, & Tallia, 2013).
12
Discussion
Hotspots This study has found a concentration of high utilizers living in geographic Hotspots in the Greater New Brunswick area. Moreover, high utilizer patients from these ‘Hotspots’ access services of both New Brunswick area hospitals and account for disproportionately high costs in the publically funded Medicaid insurance system. As in other localities, this presents potential opportunities for local healthcare providers to organize and target services to this population in a different way, including an emphasis on providing tertiary prevention, in addition to primary and secondary preventive interventions, as well as chronic care management in community residences.
Consistency with Prior Studies Our analysis found similar diagnoses/conditions to those found statewide in a study by the Center for State Health Policy (CSHP) conducted in 13 N.J. low income communities (Chakravarty et al., 2013). However, there are a number of differences between the two studies (see Appendix 2). Despite the differences between the two studies, the diagnoses/conditions found in both studies are very similar and many of the conditions listed in Table 9 may have been prevented if managed better in a lower acuity setting.
Need for Collection of Consistent Reliable Long Term Community Oriented Quality Data The desire for effective multifocal interventions for high utilizer/hotspot populations highlights the need for systems to support the long‐term collection of consistent, reliable and valid metrics of community health. Examples of this are the AHRQ Prevention Quality Indicators and the Measurement to Support a Healthier New Brunswick at the national and local levels. The metrics put forth are examples of needed outcome measure that help assess effectiveness of community based interventions.
Reinforcing RBHS Medicaid Mental Health/Substance Abuse Policy Recommendations In 2016, the Rutgers Biomedical and Health Sciences Working Group on Medicaid High Utilizers (RBHS Working Group) analyzed and made recommendations regarding clients in the top 1% of the Medicaid spending distribution. Fully 86.2% of New Jersey’s high cost Medicaid recipients had mental health and/or substance abuse diagnoses and 32.9% of this population had severe mental illness (includes conditions such as psychoses, bipolar disorder, and chronic depression). Our study’s local findings are totally congruent with these statewide results. The RBHS Working Group made five recommendations for impact with these populations (Appendix 3), and our findings at the local level reinforce that these recommendations are worthy of action.
Patient Access, Jurisdictional Challenges, and Need for Coordination of Services This project reveals that in the Greater New Brunswick service area, high utilizing patients frequently access services at both area hospitals. It also suggests that many high utilizing patients are using hospital emergency departments for primary care. At the very least, this indicates the need for care coordination for individual patients between the two hospitals. Additionally,
13
because these patients originate from two separate towns in two separate counties, Middlesex and Somerset, providers and patients often face jurisdictional barriers in providing and obtaining services. For example, mental health services for patients from the two municipal civil divisions are organized as two separate systems of care. For providers and patients, this means services must be coordinated in two different counties. Lack of record sharing makes it difficult for such coordination to occur. Transportation may also be a barrier. For patients who reside in Franklin Township, accessing behavioral health services may mean having to travel more than 12 miles to Somerville, N.J., and transportation barriers also may inhibit the ability of patients to receive local follow‐up services. For the reasons outlined above, new models of service provision are warranted where coordination goes beyond traditional governmental jurisdictions.
Conclusion Findings from this Greater New Brunswick Hotspotting Project study identified community ‘Hotspots’ and suggest the need for better coordination of care across primary care, hospitals, and post‐acute care facilities (assisted living, skilled nursing facilities, and rehabilitation centers) to reduce over‐utilization of expensive hospital resources by high utilizers living in these Hotspots and other parts of the community. The existence of Hotspots in our two communities argues for coordinated targeting of health services for patients in particular geographies in a different way, including possible residentially based preventive and chronic care services. The high percentages of patients with mental health and substance abuse co‐morbidities indicates the need for new solutions for providing convenient, comprehensive physical and behavioral health care, such as the co‐location of physical and mental health services, be it in Hotspot neighborhoods in the community, in primary care sites, or in hospital ED’s. Finally, our findings highlight the need for multiple stakeholders from the healthcare, governmental, and social service sectors to work together to improve health and healthcare access for all patients in the Greater New Brunswick area.
14
References: Brownlee, S., Farnham, J., Chakravarty, S., & Zhang, K. (March 2016). 2016 Community Health Needs Assessment for Saint Peter’s University Hospital & Robert Wood Johnson University Hospital: Findings from the Behavioral Risk Factor & Surveillance System (BRFSS), Hospital Discharge Data, and Key Informant Interviews. New Brunswick, N.J.: Rutgers Center for State Health Policy. Retrieved September 30, 2016 from http://www.rwjuh.edu/Uploads/Public/Documents/New_Brunswick_CHA_REPORT_16.pdf Camden Coalition (2016). New Brunswick Health Partners ACO Initiative Hotspotting Analysis. Camden, N.J.: Camden Coalition of Healthcare Providers, March 2016. Center on Society and Health (2016). Mapping Life Expectancy: Trenton. Retrieved September 27,2016 from http://www.societyhealth.vcu.edu/work/the‐projects/mapstrenton.html . Chakravarty, S., Brownlee, S., Tong, J., Pellerano, M.B., Howard, J., Shaw, E.K., Chase, S., and Crabtree, B.F. (December 2012). A Community Health Needs Assessment for Saint Peter’s University Hospital & Robert Wood Johnson University Hospital: Findings from the Behavioral Risk Factor & Surveillance System (BRFSS), Hospital Discharge Data, A Community Survey, Key Informant Interviews, and Community Member Focus Groups. New Brunswick, N.J.: Rutgers Center for State Health Policy and UMDNJ – Robert Wood Johnson Medical School. Retrieved December 2012 from http://www.rwjuh.edu/uploads/public/documents/main/community_needs/A_Community_Health_Needs_Assessment_full_report.pdf . Chakravarty, S., Cantor, J.C., Tong, J., DeLia, D., Lontok, O., & Nova, J. (March 2013). Hospital Utilization Patterns in 13 Low Income Communities in New Jersey: Opportunities for Better Care and Lower Costs. New Brunswick, N.J.: Rutgers Center for State Health Policy. Retrieved March 2013 from http://www.cshp.rutgers.edu/Downloads/9810.pdf . Chakravarty, S., Cantor, J.C., Walkup, J.T., & Tong, J. (November 2014). Role of Behavioral Health Conditions in Avoidable Hospital Use and Cost. New Brunswick, N.J.: Rutgers Center for State Health Policy. Retrieved December 2014 from http://www.cshp.rutgers.edu/Downloads/10530.pdf . Cohen, S. (October 2014). The Concentration of Health Care Expenditures and Related Expenses for Costly Medical Conditions, 2012. Statistical Brief #455. Agency for Healthcare Research and Quality, Rockville, MD. Retrieved September 27, 2016 from http://www.meps.ahrq.gov/mepsweb/data_files/publications/st455/stat455.pdf
15
Cohen, S. and Yu, W. (January 2012). The Concentration and Persistence in the Level of Health Expenditures over Time: Estimates for the U.S. Population, 2008–2009. Statistical Brief #354. Agency for Healthcare Research and Quality, Rockville, MD. Retrieved from September 27, 2016 at http://www.meps.ahrq.gov/mepsweb/data_files/publications/st354/stat354.shtml Gawande, A. (2011, January 24). The hot spotters: Can we lower medical costs by giving the neediest patients better care? New Yorker. Peterson‐Kaiser. (2015). Peterson‐Kaiser Health System Tracker: Measuring the Performance of the U.S. Health System, December 7, 2015. Retrieved September 22, 2016 from http://www.healthsystemtracker.org RBHS Working Group. (2016). Analysis and Recommendations for Medicaid High Utilizers in New Jersey, January 2016. Newark, N.J.: Office of the Chancellor, Rutgers Biomedical and Health Sciences. Retrieved November 1, 2016 from http://www.cshp.rutgers.edu/Downloads/10890.pdf Schoen, C., Radley, D., Riley, P., Lippa, J., Berenson, J., Dermody, C. and Shih, A. (September 2013) Health Care in the Two Americas. New York: Commonwealth Fund. Squires, D. and Anderson, C. (October 2015). U.S. Health Care from a Global Perspective: Spending, Use of Services, Prices, and Health in 13 Countries. New York: The Commonwealth Fund. Retrieved September 22, 2016 from http://www.commonwealthfund.org/publications/issue‐briefs/2015/oct/us‐health‐care‐from‐a‐global‐perspective . U.S. Census (2010‐2014) “ACS Demographic and Housing Estimates (DP05),” “Selected Economic Characteristics (DP03),” and “Educational Attainment (S1501),” 2010‐2014 American Community Survey 5‐Year Estimates.
16
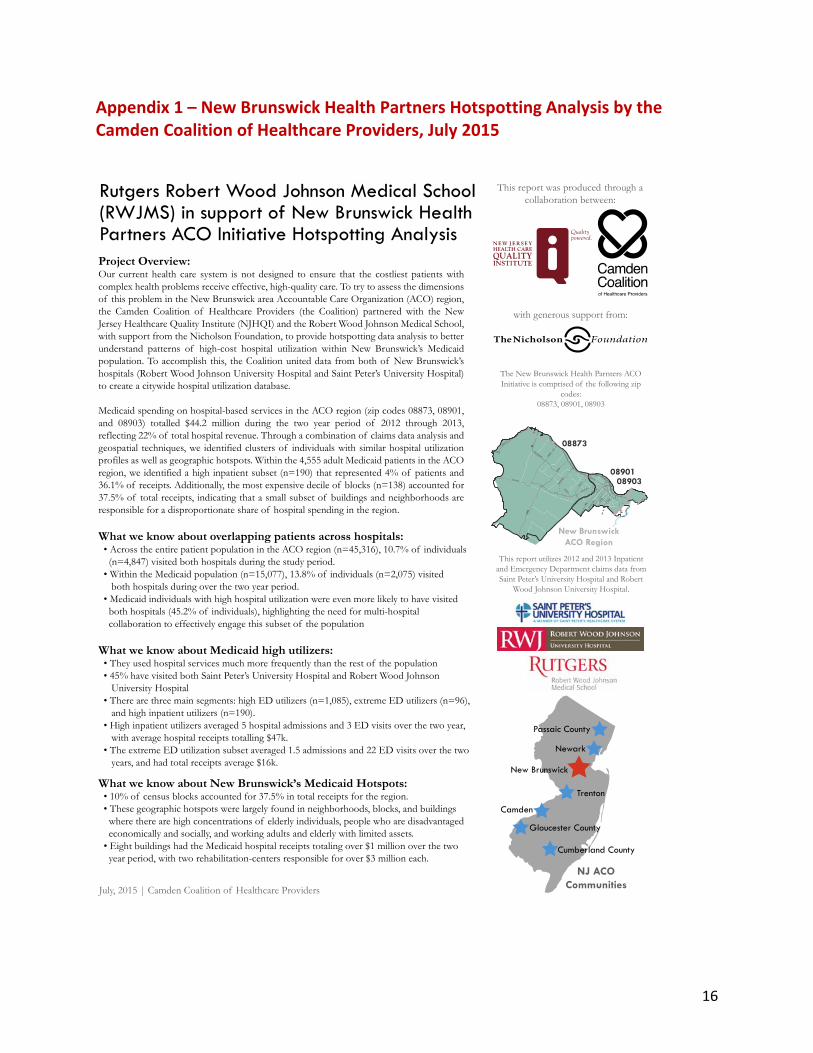
Appendix 1 – New Brunswick Health Partners Hotspotting Analysis by the Camden Coalition of Healthcare Providers, July 2015
Rutgers Robert Wood Johnson Medical School(RWJMS) in support of New Brunswick HealthPartners ACO Initiative Hotspotting AnalysisProject Overview:Our current health care system is not designed to ensure that the costliest patients with complex health problems receive effective, high-quality care. To try to assess the dimensions of this problem in the New Brunswick area Accountable Care Organization (ACO) region, the Camden Coalition of Healthcare Providers (the Coalition) partnered with the New Jersey Healthcare Quality Institute (NJHQI) and the Robert Wood Johnson Medical School, with support from the Nicholson Foundation, to provide hotspotting data analysis to better understand patterns of high-cost hospital utilization within New Brunswick’s Medicaid population. To accomplish this, the Coalition united data from both of New Brunswick’s hospitals (Robert Wood Johnson University Hospital and Saint Peter’s University Hospital) to create a citywide hospital utilization database.
Medicaid spending on hospital-based services in the ACO region (zip codes 08873, 08901, and 08903) totalled $44.2 million during the two year period of 2012 through 2013, reflecting 22% of total hospital revenue. Through a combination of claims data analysis and geospatial techniques, we identified clusters of individuals with similar hospital utilization profiles as well as geographic hotspots. Within the 4,555 adult Medicaid patients in the ACO region, we identified a high inpatient subset (n=190) that represented 4% of patients and 36.1% of receipts. Additionally, the most expensive decile of blocks (n=138) accounted for 37.5% of total receipts, indicating that a small subset of buildings and neighborhoods are responsible for a disproportionate share of hospital spending in the region.
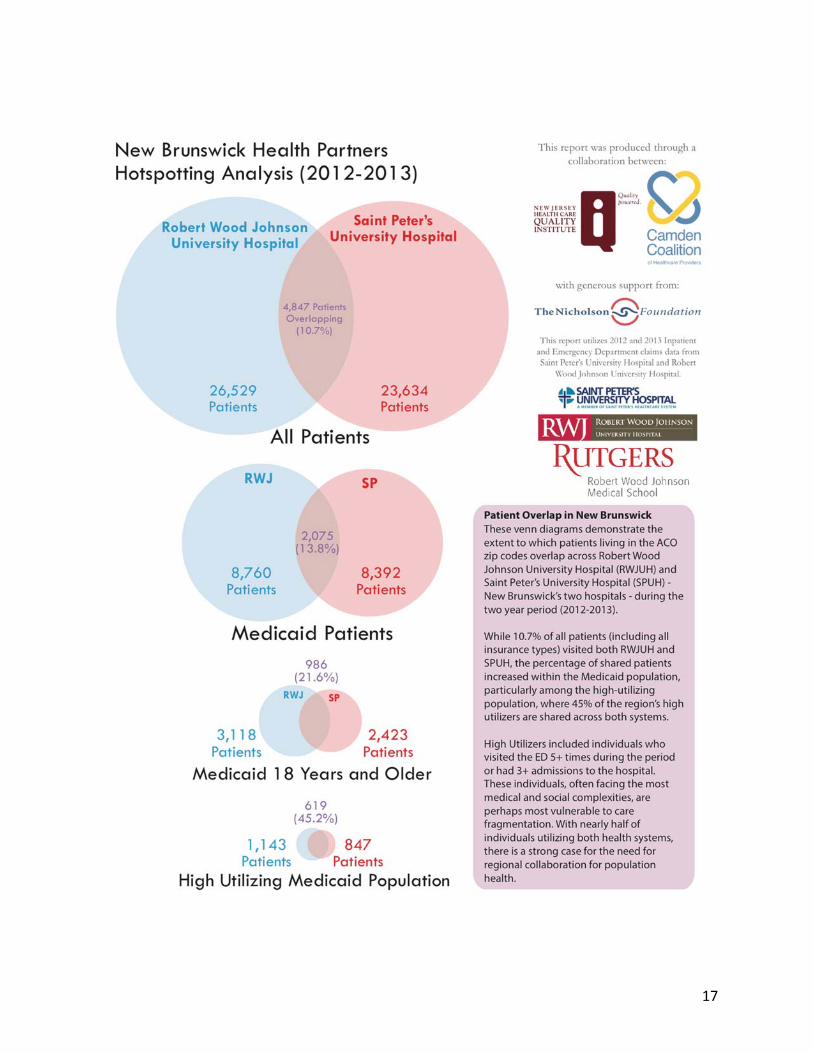
What we know about overlapping patients across hospitals: • Across the entire patient population in the ACO region (n=45,316), 10.7% of individuals (n=4,847) visited both hospitals during the study period. • Within the Medicaid population (n=15,077), 13.8% of individuals (n=2,075) visited both hospitals during over the two year period. • Medicaid individuals with high hospital utilization were even more likely to have visited both hospitals (45.2% of individuals), highlighting the need for multi-hospital collaboration to effectively engage this subset of the population
What we know about Medicaid high utilizers: • They used hospital services much more frequently than the rest of the population • 45% have visited both Saint Peter’s University Hospital and Robert Wood Johnson University Hospital • There are three main segments: high ED utilizers (n=1,085), extreme ED utilizers (n=96), and high inpatient utilizers (n=190). • High inpatient utilizers averaged 5 hospital admissions and 3 ED visits over the two year, with average hospital receipts totalling $47k. • The extreme ED utilization subset averaged 1.5 admissions and 22 ED visits over the two years, and had total receipts average $16k.
What we know about New Brunswick’s Medicaid Hotspots: • 10% of census blocks accounted for 37.5% in total receipts for the region. • These geographic hotspots were largely found in neighborhoods, blocks, and buildings where there are high concentrations of elderly individuals, people who are disadvantaged economically and socially, and working adults and elderly with limited assets. • Eight buildings had the Medicaid hospital receipts totaling over $1 million over the two year period, with two rehabilitation-centers responsible for over $3 million each.
The New Brunswick Health Parnters ACO Initiative is comprised of the following zip
codes:08873, 08901, 08903
This report utilizes 2012 and 2013 Inpatient and Emergency Department claims data from Saint Peter’s University Hospital and Robert
Wood Johnson University Hospital.
with generous support from:
This report was produced through a collaboration between:
NJ ACOCommunitiesJuly, 2015 | Camden Coalition of Healthcare Providers
18East onAmwell
Hamilt on
Demo
tt
Middle
bush
Jersey
Somerse
t
Cedar
Grov
e
Frank
lin
Weston
C anal
Elizabeth
Joyc
e Kilm
er Rems
en
John F
Kenned
y
Ry ders
Berger
Nichol
George
Burnet
New Brunswick
Geor
ges
Manville
18
1
95
287
New BrunswickACO Region
08903
08873
08901
Camden
Newark
Passaic County
Cumberland County
New Brunswick
Gloucester County
Trenton
17

18
19
Appendix 2 ‐ Comparison of Camden Coalition Analysis and CSHP High Utilization Studies As noted in the body of this report, the New Brunswick hotspotting analysis found similar conditions as those found previously by the Center for State Health Policy (CSHP) in a study conducted in 13 N.J. low income communities (Chakravarty et al, 2013). The Greater New Brunswick Hotspotting Project used the same zip codes for New Brunswick and Franklin Township that were used by the CSHP researchers in 2013. There are a number of differences between the two studies, including:
1. Center for State Health Policy (CSHP) researchers looked at New Jersey uniform billing data over the three‐year period of 2008‐2010 and the Camden Coalition of Healthcare Providers’ (Camden Coalition) researchers reviewed claims data provided by each of the two hospitals directly to Camden Coalition for the two‐year period of 2012‐2013;
2. CSHP researchers looked at diagnoses from hospital claims data for hospitals in the 13 low income communities and reported the five most common principal diagnoses for inpatient and ED higher users in all 13 communities;
3. The CSHP researchers looked at all payers. Table 10 shows the top five diagnoses for high ED utilizers and high inpatient utilizers from the Hotspotting analysis and from CSHP 2013 study; and
4. The Camden Coalition defined ED high utilizers as those patients with 5 or more visits to the ED in a two‐year period and high inpatient utilizers as those patients with 3 or more inpatient visits in the two‐year period. CSHP defined ED high utilizers as those patients with 6 or more visits to the ED in a three‐year period and high inpatient utilizers as those patients with 4 or more inpatient visits in the three‐year period.
In spite of the differences between the two studies, the diagnoses found in both studies are very similar. See Table 10 for the top five diagnoses found for high ED utilizers and high inpatient utilizers.
20
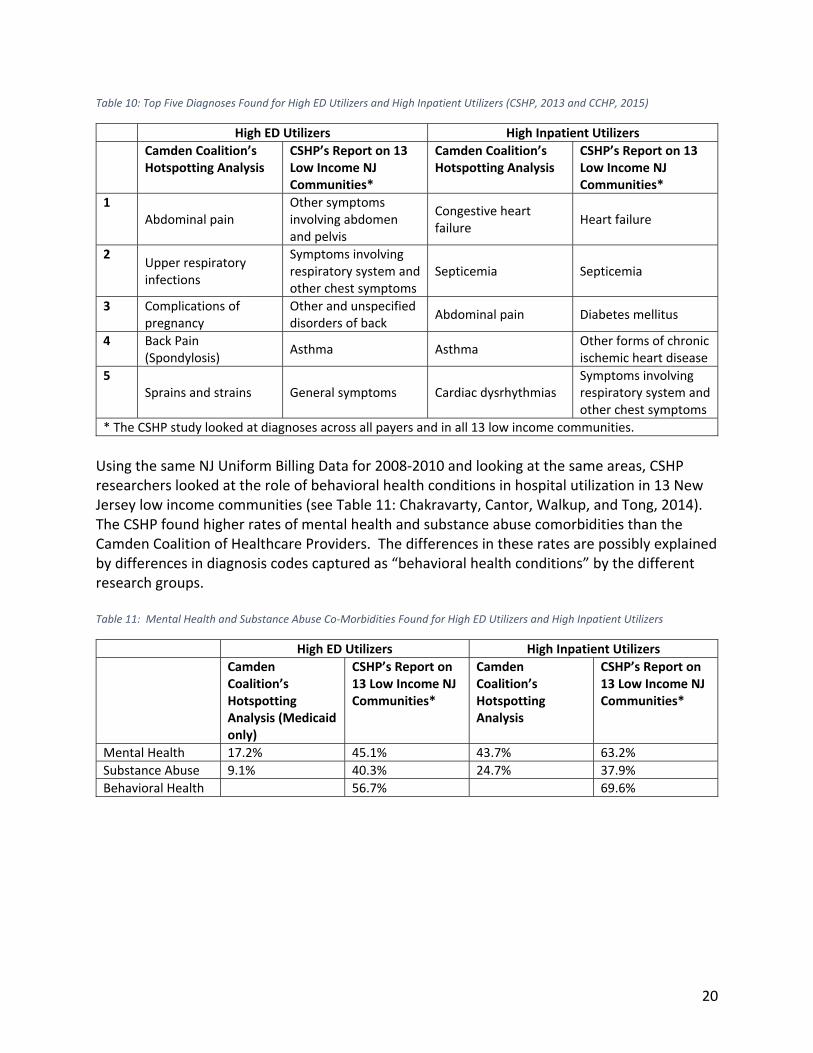
Table 10: Top Five Diagnoses Found for High ED Utilizers and High Inpatient Utilizers (CSHP, 2013 and CCHP, 2015)
High ED Utilizers High Inpatient Utilizers
Camden Coalition’s Hotspotting Analysis
CSHP’s Report on 13 Low Income NJ Communities*
Camden Coalition’s Hotspotting Analysis
CSHP’s Report on 13 Low Income NJ Communities*
1 Abdominal pain
Other symptoms involving abdomen and pelvis
Congestive heart failure
Heart failure
2 Upper respiratory infections
Symptoms involving respiratory system and other chest symptoms
Septicemia Septicemia
3 Complications of pregnancy
Other and unspecified disorders of back
Abdominal pain Diabetes mellitus
4 Back Pain (Spondylosis)
Asthma Asthma Other forms of chronic ischemic heart disease
5 Sprains and strains General symptoms Cardiac dysrhythmias
Symptoms involving respiratory system and other chest symptoms
* The CSHP study looked at diagnoses across all payers and in all 13 low income communities.
Using the same NJ Uniform Billing Data for 2008‐2010 and looking at the same areas, CSHP researchers looked at the role of behavioral health conditions in hospital utilization in 13 New Jersey low income communities (see Table 11: Chakravarty, Cantor, Walkup, and Tong, 2014). The CSHP found higher rates of mental health and substance abuse comorbidities than the Camden Coalition of Healthcare Providers. The differences in these rates are possibly explained by differences in diagnosis codes captured as “behavioral health conditions” by the different research groups. Table 11: Mental Health and Substance Abuse Co‐Morbidities Found for High ED Utilizers and High Inpatient Utilizers
High ED Utilizers High Inpatient Utilizers
Camden Coalition’s Hotspotting Analysis (Medicaid only)
CSHP’s Report on 13 Low Income NJ Communities*
Camden Coalition’s Hotspotting Analysis
CSHP’s Report on 13 Low Income NJ Communities*
Mental Health 17.2% 45.1% 43.7% 63.2%
Substance Abuse 9.1% 40.3% 24.7% 37.9%
Behavioral Health 56.7% 69.6%
21
Appendix 3 – Recommendations from the RBHS Working Group on Medicaid High Utilizers
The RBHS Working Group on Medicaid High Utilizers identified five areas of recommendations and opportunities for impact with these populations. These recommendations are:
1. Integration of Behavioral and Physical Health 2. Identify and Develop Interventions for Populations with Persistently High Costs 3. Expand Opportunities to Coordinate Social Service and Public Health Initiatives with
Medicaid 4. Adopting Best Clinical Practices 5. Strengthening Infrastructure and Accountability