
The Great Divide: West Papuan Demographics Revisited ... · regencies in Papua Barat. They show...
12
The Asia-Pacific Journal | Japan Focus Volume 15 | Issue 2 | Number 1 | Jan 15, 2017 1 The Great Divide: West Papuan Demographics Revisited; Settlers Dominate Coastal Regions but the Highlands Still Overwhelmingly Papuan Jim Elmslie Abstract This paper will reconsider previous work on the demographic transition under way in West Papua (the Indonesian provinces of Papua and Papua Barat) in the light of documents received from the Indonesian Statistics Office (Badan Pusat Statistic BPS) that give an ethnic breakdown across the 29 regencies that comprise Papua province and the eleven regencies in Papua Barat. They show that, while the proportion of Papuan people as a percentage of the entire population continues to decline, this process varies widely between different regencies. While some have a strong majority of non-Papuan people other regencies are still overwhelmingly Papuan. This dichotomy is closely linked with topography – the mountainous interior outside of urban areas having a Papuan majority and the accessible lowlands a non-Papuan majority. The consequences of this dichotomy – a large chunk of West Papua about the size of Great Britain is peopled almost exclusively by Melanesian people, even as some of the coastal regions become non-Papuan majority– is profound. West Papuans of the interior have not only survived Indonesian occupation but have kept their lands and cultures largely intact, which continues to underpin calls for an independent West Papua and conflict with the Indonesian government and its security forces. While coastal regions continue to receive large numbers of non-Papuan migrants resulting in the increasing minoritisation of the Papuan people and their concomitant militarization, marginalization and dispossession. This process is also occurring in the highlands from expansion of the oil/gas sector and mining sector; the proliferation of new regencies (with new bureaucracies) and the continuing development of new roads, all of which alienate traditional land and draw in migrants. Meanwhile the conflict over the political status of West Papua will continue, and indeed grow, as external actors, such as the Pacific countries of Vanuatu and the Solomon Islands, shine a spotlight on the conflict and advocate for the right to self-determination for the West Papuan people. This essay is dedicated to Professor Peter King, who died in Sydney in August 2016. Peter and I cofounded the West Papua Project at the Center for Peace and Conflict Studies at Sydney University in 2000 and was my teacher, mentor and friend for 24 years. The Importance of West Papua to Indonesia The territory of West Papua (the Indonesian provinces of Papua and Papua Barat) makes up about 24% of Indonesia’s total landmass but contains only 1.7% of the nation’s population. It is also Indonesia’s richest region in terms of natural resources with the largest extant tracts of rainforest in south-east Asia; vast oil and gas reserves, and possibly the world’s largest deposits of copper and gold. Indeed Papua’s giant Freeport Mine is the largest economic entity in Indonesia and the country’s largest taxpayer. The economic exploitation of these resources,
Transcript of The Great Divide: West Papuan Demographics Revisited ... · regencies in Papua Barat. They show...
The Asia-Pacific Journal | Japan Focus Volume 15 | Issue 2 | Number 1 | Jan 15, 2017
1
The Great Divide: West Papuan Demographics Revisited;Settlers Dominate Coastal Regions but the Highlands StillOverwhelmingly Papuan
Jim Elmslie
Abstract
This paper will reconsider previous work on thedemographic transition under way in WestPapua (the Indonesian provinces of Papua andPapua Barat) in the light of documents receivedfrom the Indonesian Statistics Office (BadanPusat Statistic BPS) that give an ethnicbreakdown across the 29 regencies thatcomprise Papua province and the elevenregencies in Papua Barat. They show that,while the proportion of Papuan people as apercentage of the entire population continuesto decline, this process varies widely betweendifferent regencies. While some have a strongmajority of non-Papuan people other regenciesare still overwhelmingly Papuan. Thisdichotomy is closely linked with topography –the mountainous interior outside of urban areashaving a Papuan majority and the accessiblelowlands a non-Papuan majority. Theconsequences of this dichotomy – a large chunkof West Papua about the size of Great Britain ispeopled almost exclusively by Melanesianpeople, even as some of the coastal regionsbecome non-Papuan majority– is profound.West Papuans of the interior have not onlysurvived Indonesian occupation but have kepttheir lands and cultures largely intact, whichcontinues to underpin calls for an independentWest Papua and conflict with the Indonesiangovernment and its security forces. Whilecoastal regions continue to receive largenumbers of non-Papuan migrants resulting inthe increasing minoritisation of the Papuanpeople and their concomitant militarization,marginalization and dispossession. This process
is also occurring in the highlands fromexpansion of the oil/gas sector and miningsector; the proliferation of new regencies (withnew bureaucracies) and the continuingdevelopment of new roads, all of which alienatetraditional land and draw in migrants.Meanwhile the conflict over the political statusof West Papua will continue, and indeed grow,as external actors, such as the Pacific countriesof Vanuatu and the Solomon Islands, shine aspotlight on the conflict and advocate for theright to self-determination for the West Papuanpeople.
This essay is dedicated to Professor Peter King,who died in Sydney in August 2016. Peter and Icofounded the West Papua Project at theCenter for Peace and Conflict Studies atSydney University in 2000 and was my teacher,mentor and friend for 24 years.
The Importance of West Papua toIndonesia
The territory of West Papua (the Indonesianprovinces of Papua and Papua Barat) makes upabout 24% of Indonesia’s total landmass butcontains only 1.7% of the nation’s population. Itis also Indonesia’s richest region in terms ofnatural resources with the largest extant tractsof rainforest in south-east Asia; vast oil and gasreserves, and possibly the world’s largestdeposits of copper and gold. Indeed Papua’sgiant Freeport Mine is the largest economicentity in Indonesia and the country’s largesttaxpayer.
The economic exploitation of these resources,
APJ | JF 15 | 2 | 1
2
especially in the establishment of massive oilpalm plantations (millions of hectares areunderway or planned), and the economicopportunities that arise from a fast growinglocal economy has drawn in hundreds ofthousands of migrants from other regions ofIndonesia motivated by self-interest andpreviously by government sponsoredtransmigration programs. The migrants differstarkly from the indigenous (mainly Christian)Melanesian inhabitants of West Papua, beinglight skinned Asians predominantly of theMuslim faith.
West Papua is also symbolically central to theself-conceptualization of the Indonesian stateas an archipelago nation whose motto isBhinneka Tunggal Ika (Unity in Diversity) and itrepresents the final victory of the Indonesiannationalists over the Dutch after 350 years ofbrutal colonial rule. This means that the futureof West Papua, and the movement by Papuannationalists to break away from Indonesia, is afirst order concern for the Indonesiangovernment and military. The demographictransition now underway wherein new migrantshave become the majority in many regencies isone of the underlying drivers of conflict in WestPapua and is fueling the widespread desire forindependence amongst the Papuan people. Thisis resulting in a direct challenge to theauthority and legitimacy of the Indonesian stateand its sovereignty over West Papua.
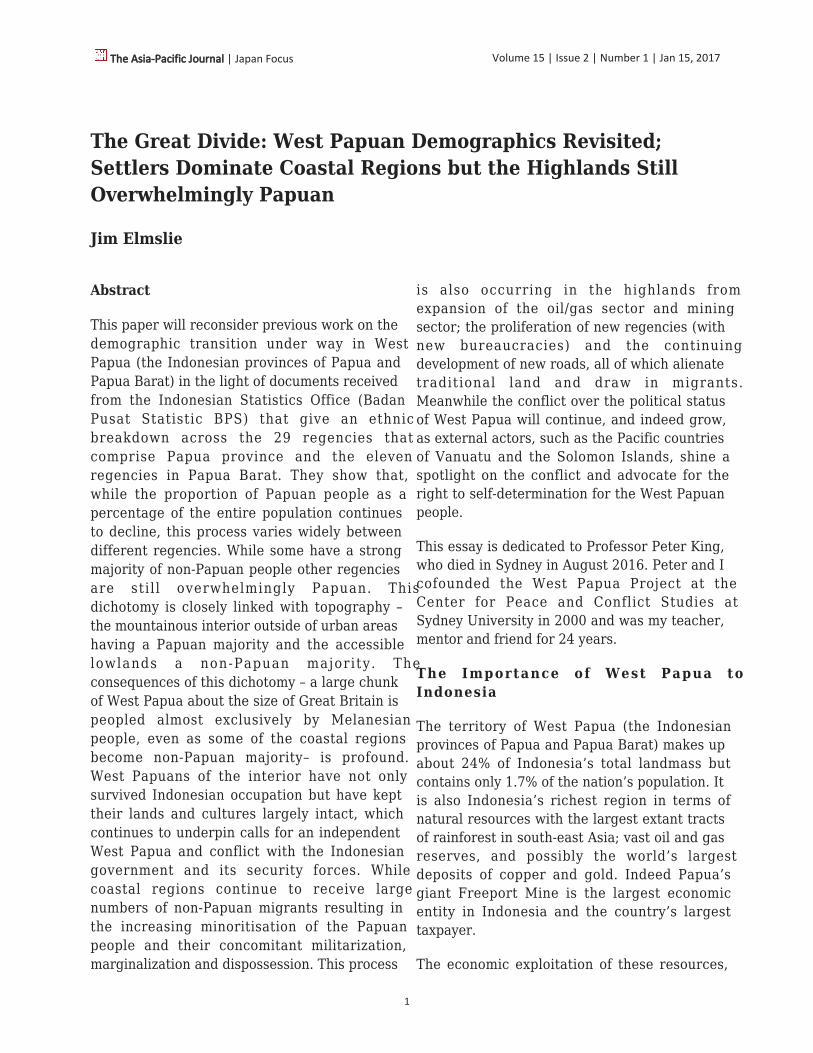
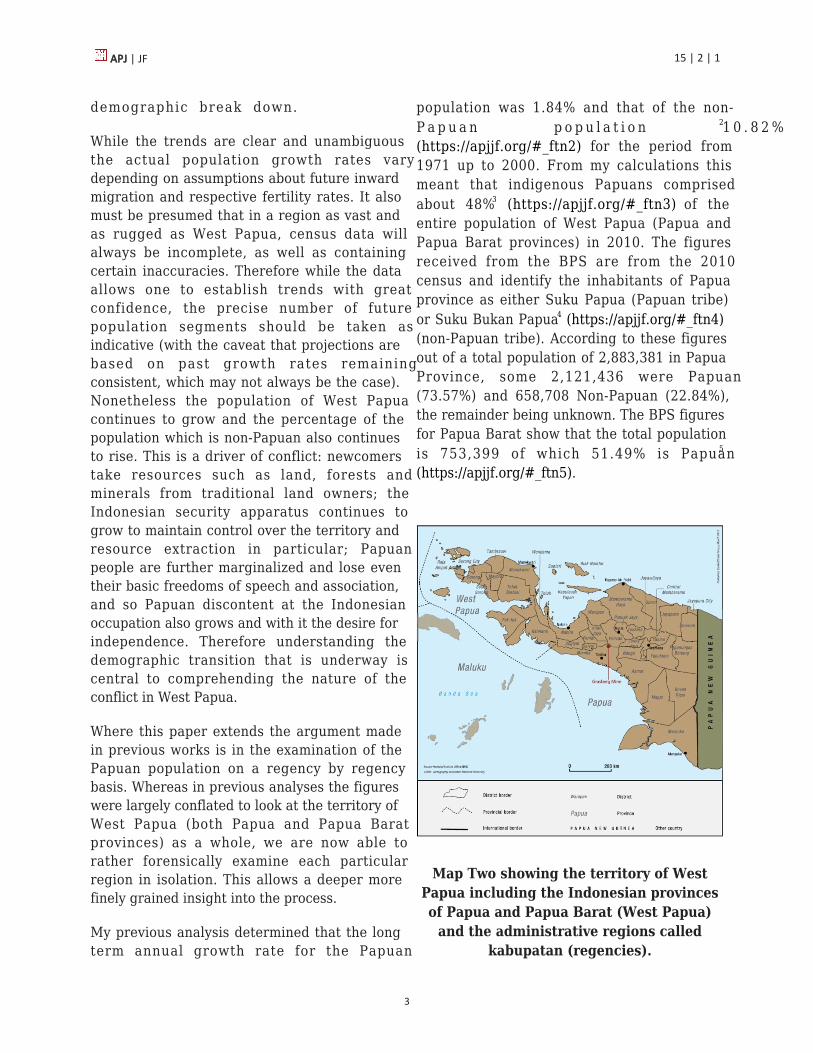
Map One showing the territory of WestPapua (the Indonesian provinces of Papua
and Papua Barat), previously known asIrian Jaya. Note the large chain of
mountain ranges that run through theisland of New Guinea all the way to theBird’s Head region and the flat coastal
plains to the north and south of thishighlands region.
West Papuan Demographic Transition
In a series of papers since 2006 I haveexamined the demographic transition that hastaken place in West Papua following Indonesiantakeover in 1962-63, and especially since thecensus of 1971, which found the totalpopulation of 923,000 as being 96% Papuanand only 4%, or 36,000 people, as non-Papuan1
(https://apjjf.org/#_ftn1). The basis of thisargument is that the non-Papuan sector of thepopulation is growing faster than the Papuansector due to large scale inward migration ofnon-Papuans from other parts of Indonesia andthe vastly substandard living conditions of ethicPapuans, including high infant and maternalmortality rates, that cause a lower overallfertility rate. Due to patchy statisticalinformation the rate of growth of the twopopulation sectors had to be estimated fromdifferent censuses data and then extrapolatedas a pro jec t ion o f a poss ib le fu ture
APJ | JF 15 | 2 | 1
3
demographic break down.
While the trends are clear and unambiguousthe actual population growth rates varydepending on assumptions about future inwardmigration and respective fertility rates. It alsomust be presumed that in a region as vast andas rugged as West Papua, census data willalways be incomplete, as well as containingcertain inaccuracies. Therefore while the dataallows one to establish trends with greatconfidence, the precise number of futurepopulation segments should be taken asindicative (with the caveat that projections arebased on past growth rates remainingconsistent, which may not always be the case).Nonetheless the population of West Papuacontinues to grow and the percentage of thepopulation which is non-Papuan also continuesto rise. This is a driver of conflict: newcomerstake resources such as land, forests andminerals from traditional land owners; theIndonesian security apparatus continues togrow to maintain control over the territory andresource extraction in particular; Papuanpeople are further marginalized and lose eventheir basic freedoms of speech and association,and so Papuan discontent at the Indonesianoccupation also grows and with it the desire forindependence. Therefore understanding thedemographic transition that is underway iscentral to comprehending the nature of theconflict in West Papua.
Where this paper extends the argument madein previous works is in the examination of thePapuan population on a regency by regencybasis. Whereas in previous analyses the figureswere largely conflated to look at the territory ofWest Papua (both Papua and Papua Baratprovinces) as a whole, we are now able torather forensically examine each particularregion in isolation. This allows a deeper morefinely grained insight into the process.
My previous analysis determined that the longterm annual growth rate for the Papuan
population was 1.84% and that of the non-P a p u a n p o p u l a t i o n 1 0 . 8 2 % 2
(https://apjjf.org/#_ftn2) for the period from1971 up to 2000. From my calculations thismeant that indigenous Papuans comprisedabout 48%3 (https://apjjf.org/#_ftn3) of theentire population of West Papua (Papua andPapua Barat provinces) in 2010. The figuresreceived from the BPS are from the 2010census and identify the inhabitants of Papuaprovince as either Suku Papua (Papuan tribe)or Suku Bukan Papua4 (https://apjjf.org/#_ftn4)(non-Papuan tribe). According to these figuresout of a total population of 2,883,381 in PapuaProvince, some 2,121,436 were Papuan(73.57%) and 658,708 Non-Papuan (22.84%),the remainder being unknown. The BPS figuresfor Papua Barat show that the total populationis 753,399 of which 51.49% is Papuan5
(https://apjjf.org/#_ftn5).
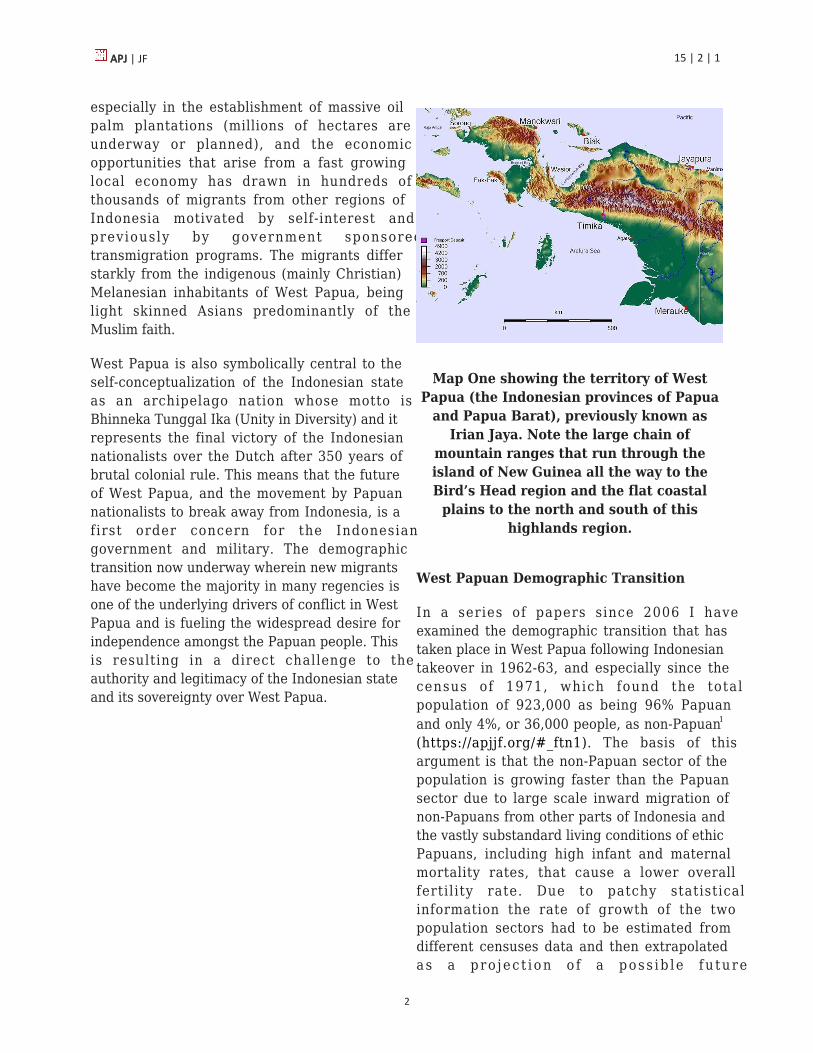
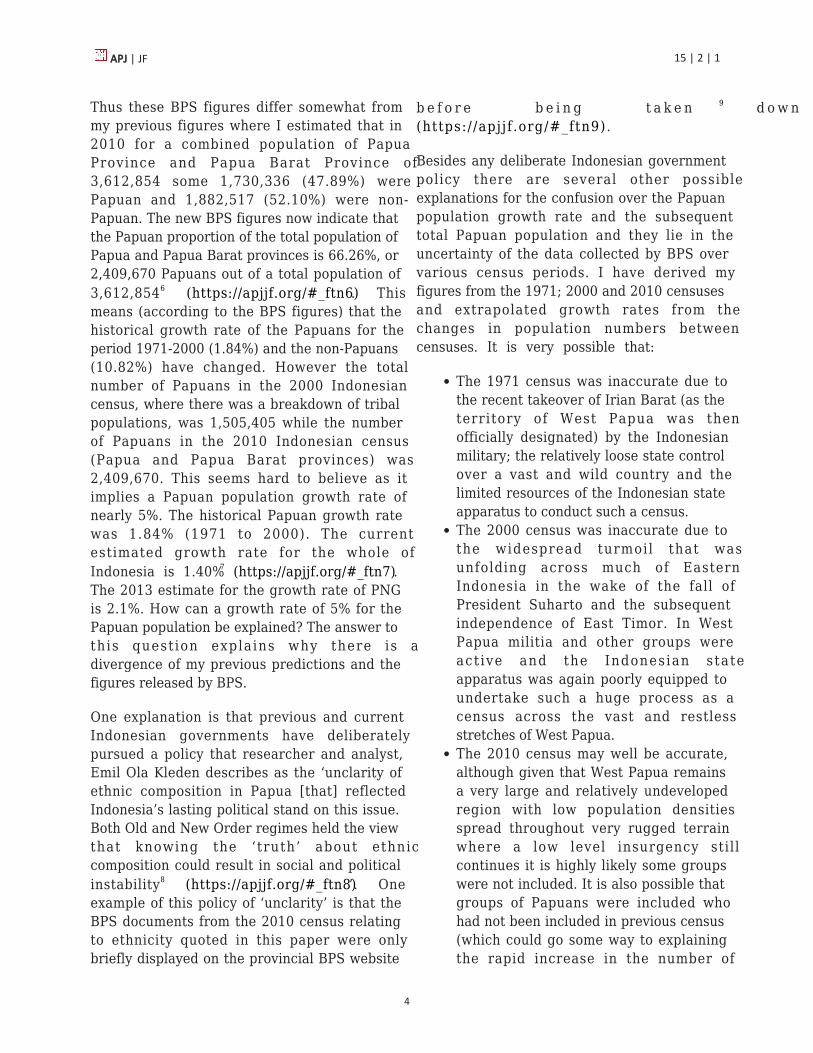
Map Two showing the territory of WestPapua including the Indonesian provincesof Papua and Papua Barat (West Papua)
and the administrative regions calledkabupatan (regencies).
APJ | JF 15 | 2 | 1
4
Thus these BPS figures differ somewhat frommy previous figures where I estimated that in2010 for a combined population of PapuaProvince and Papua Barat Province of3,612,854 some 1,730,336 (47.89%) werePapuan and 1,882,517 (52.10%) were non-Papuan. The new BPS figures now indicate thatthe Papuan proportion of the total population ofPapua and Papua Barat provinces is 66.26%, or2,409,670 Papuans out of a total population of3,612,8546 (https://apjjf.org/#_ftn6). Thismeans (according to the BPS figures) that thehistorical growth rate of the Papuans for theperiod 1971-2000 (1.84%) and the non-Papuans(10.82%) have changed. However the totalnumber of Papuans in the 2000 Indonesiancensus, where there was a breakdown of tribalpopulations, was 1,505,405 while the numberof Papuans in the 2010 Indonesian census(Papua and Papua Barat provinces) was2,409,670. This seems hard to believe as itimplies a Papuan population growth rate ofnearly 5%. The historical Papuan growth ratewas 1.84% (1971 to 2000). The currentestimated growth rate for the whole ofIndonesia is 1.40%7 (https://apjjf.org/#_ftn7).The 2013 estimate for the growth rate of PNGis 2.1%. How can a growth rate of 5% for thePapuan population be explained? The answer tothis question explains why there is adivergence of my previous predictions and thefigures released by BPS.
One explanation is that previous and currentIndonesian governments have deliberatelypursued a policy that researcher and analyst,Emil Ola Kleden describes as the ‘unclarity ofethnic composition in Papua [that] reflectedIndonesia’s lasting political stand on this issue.Both Old and New Order regimes held the viewthat knowing the ‘truth’ about ethniccomposition could result in social and politicalinstability8 (https://apjjf.org/#_ftn8)’. Oneexample of this policy of ‘unclarity’ is that theBPS documents from the 2010 census relatingto ethnicity quoted in this paper were onlybriefly displayed on the provincial BPS website
b e f o r e b e i n g t a k e n d o w n 9
(https://apjjf .org/#_ftn9).
Besides any deliberate Indonesian governmentpolicy there are several other possibleexplanations for the confusion over the Papuanpopulation growth rate and the subsequenttotal Papuan population and they lie in theuncertainty of the data collected by BPS overvarious census periods. I have derived myfigures from the 1971; 2000 and 2010 censusesand extrapolated growth rates from thechanges in population numbers betweencensuses. It is very possible that:
The 1971 census was inaccurate due tothe recent takeover of Irian Barat (as theterritory of West Papua was thenofficially designated) by the Indonesianmilitary; the relatively loose state controlover a vast and wild country and thelimited resources of the Indonesian stateapparatus to conduct such a census.The 2000 census was inaccurate due tothe widespread turmoil that wasunfolding across much of EasternIndonesia in the wake of the fall ofPresident Suharto and the subsequentindependence of East Timor. In WestPapua militia and other groups wereact ive and the Indonesian stateapparatus was again poorly equipped toundertake such a huge process as acensus across the vast and restlessstretches of West Papua.The 2010 census may well be accurate,although given that West Papua remainsa very large and relatively undevelopedregion with low population densitiesspread throughout very rugged terrainwhere a low level insurgency stillcontinues it is highly likely some groupswere not included. It is also possible thatgroups of Papuans were included whohad not been included in previous census(which could go some way to explainingthe rapid increase in the number of

APJ | JF 15 | 2 | 1
5
Papuans).Anecdotally there has been an incentivefor the local regent (bupati) and otherlocal leaders and politicians to inflate thenumber of people in villages and tribes toleverage more resources from theprovincial government – funds allocatedfor health and education services forinstance. This may or may not have hadan effect on census data.
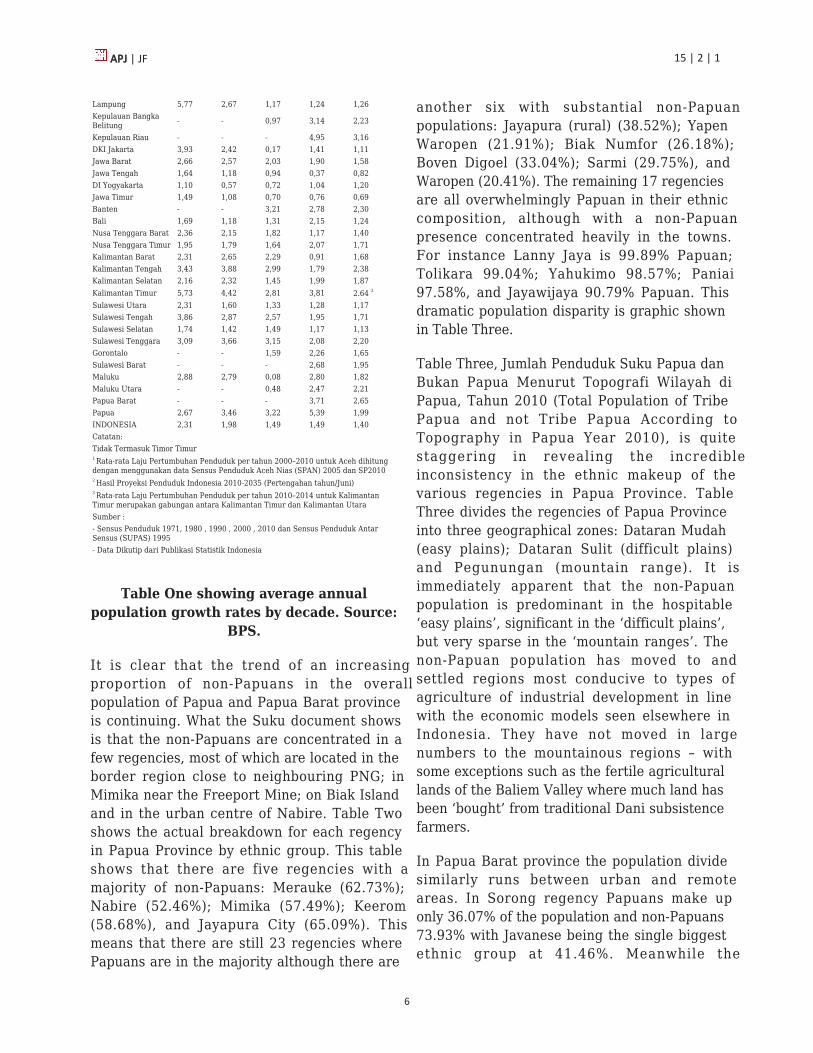
Besides actual difficulties in data collectionthere are also assumptions embodied in thedata that may impact the outcome – eitherintentionally or unintentionally. For instanceTable One shows the average annualpopulation growth rates for Indonesianprovinces going back to 1971 by decade. ForPapua (and previously Irian Jaya Province) thegrowth rates have been 2.31% (1971-1980);3.46% (1980-1990); 3.22% (1990-2000); 5.39%(200-2010) but just 1.99% for 2010-2014. Thislast figure is an estimation as censuses areconducted every ten years. This is counterintuitive as the population growth rate hasbeen growing for four decades in a solid trend,inward migration of non-Papuans into Papuahas been strong in recent years (not least dueto massive development in the oil palm sectorthat has brought in many workers), and therehas been rapid growth in (non-Papuandominated) urban areas.
Together the above points mean that the dataprovided by BPS must be used with a degree ofcaution. It is highly possible that Papuans whomissed out on earlier censuses due to theirisolation were included in subsequent censusesas the strengthening Indonesian stateapparatus and modern communications andtransportation improved the efficiency of BPSfield operatives. It is also quite possible thatthe numbers of Papuan people living in remoteregions have been inflated to secure moregovernment funding (and electoral advantage).
Does this mean that it is impossible to draw
conclusions on the demographic transition thatis underway in West Papua? No. Even if precisenumbers might be elusive trends can clearly beestablished from the BPS data which hold evenwhen the exact numbers of respectivepopulation groups are unclear. By examiningthe data from the 2010 census it is apparentthat:
The percentage of Papuans as aproportion of the total population of thePapua and Papua Barat is falling overtime, primarily due to inward migration.This process is ongoing.In some regions the percentage ofPapuans as a propor t ion o f thepopulation has fallen catastrophically.This is particularly true in most urbancentres such as Jayapura and Sorong,and in the flat coastal areas such asMerauke and Keerom. This process isongoing (see below).That in large areas of the highlands andremote regions of both Papua and PapuaBarat provinces Papuan people still makeup in excess o f 90% of the tota lpopulation.
Figures from the BPS publication, ProfilPenduduk Menurut Suku Hasil SP 2010 diPapua, (Population Profile Result According toTribe in Papua 2010), show that the most of theNon-Papuan population reside in only a few ofPapua’s 28 kabupatens (regencies). Accordingto the Suku document 556,422 Non-Papuans(84.47%) out of the total 658,708 are found injust seven of Papua’s 28 regencies, leaving just102,286 non-Papuans spread out in theremaining 21 regencies.
Laju Pertumbuhan Penduduk menurut Provinsi
ProvinsiLaju Pertumbuhan Penduduk per Tahun
1971-1980 1980-1990 1990-2000 2000-2010 2010-20142
Aceh 2,93 2,72 1,46 2.36 1 2,06Sumatera Utara 2,60 2,06 1,32 1,10 1,39Sumatera Barat 2,21 1,62 0,63 1,34 1,34Riau 3,11 4,30 4,35 3,58 2,64Jambi 4,07 3,40 1,84 2,56 1,85Sumatera Selatan 3,32 3,15 2,39 1,85 1,50Bengkulu 4,39 4,38 2,97 1,67 1,74
APJ | JF 15 | 2 | 1
6
Lampung 5,77 2,67 1,17 1,24 1,26Kepulauan BangkaBelitung - - 0,97 3,14 2,23
Kepulauan Riau - - - 4,95 3,16DKI Jakarta 3,93 2,42 0,17 1,41 1,11Jawa Barat 2,66 2,57 2,03 1,90 1,58Jawa Tengah 1,64 1,18 0,94 0,37 0,82DI Yogyakarta 1,10 0,57 0,72 1,04 1,20Jawa Timur 1,49 1,08 0,70 0,76 0,69Banten - - 3,21 2,78 2,30Bali 1,69 1,18 1,31 2,15 1,24Nusa Tenggara Barat 2,36 2,15 1,82 1,17 1,40Nusa Tenggara Timur 1,95 1,79 1,64 2,07 1,71Kalimantan Barat 2,31 2,65 2,29 0,91 1,68Kalimantan Tengah 3,43 3,88 2,99 1,79 2,38Kalimantan Selatan 2,16 2,32 1,45 1,99 1,87Kalimantan Timur 5,73 4,42 2,81 3,81 2.64 3
Sulawesi Utara 2,31 1,60 1,33 1,28 1,17Sulawesi Tengah 3,86 2,87 2,57 1,95 1,71Sulawesi Selatan 1,74 1,42 1,49 1,17 1,13Sulawesi Tenggara 3,09 3,66 3,15 2,08 2,20Gorontalo - - 1,59 2,26 1,65Sulawesi Barat - - - 2,68 1,95Maluku 2,88 2,79 0,08 2,80 1,82Maluku Utara - - 0,48 2,47 2,21Papua Barat - - - 3,71 2,65Papua 2,67 3,46 3,22 5,39 1,99INDONESIA 2,31 1,98 1,49 1,49 1,40Catatan: Tidak Termasuk Timor Timur1 Rata-rata Laju Pertumbuhan Penduduk per tahun 2000–2010 untuk Aceh dihitungdengan menggunakan data Sensus Penduduk Aceh Nias (SPAN) 2005 dan SP20102 Hasil Proyeksi Penduduk Indonesia 2010-2035 (Pertengahan tahun/Juni)3 Rata-rata Laju Pertumbuhan Penduduk per tahun 2010–2014 untuk KalimantanTimur merupakan gabungan antara Kalimantan Timur dan Kalimantan UtaraSumber : - Sensus Penduduk 1971, 1980 , 1990 , 2000 , 2010 dan Sensus Penduduk AntarSensus (SUPAS) 1995- Data Dikutip dari Publikasi Statistik Indonesia
Table One showing average annualpopulation growth rates by decade. Source:
BPS.
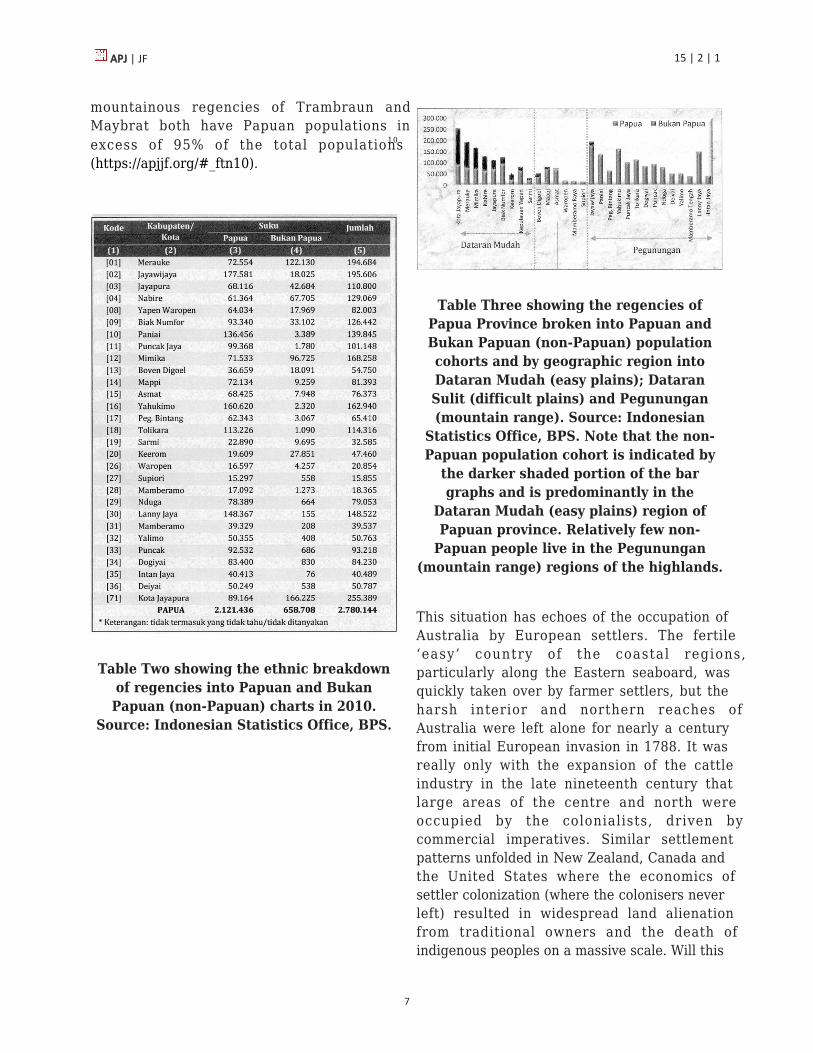
It is clear that the trend of an increasingproportion of non-Papuans in the overallpopulation of Papua and Papua Barat provinceis continuing. What the Suku document showsis that the non-Papuans are concentrated in afew regencies, most of which are located in theborder region close to neighbouring PNG; inMimika near the Freeport Mine; on Biak Islandand in the urban centre of Nabire. Table Twoshows the actual breakdown for each regencyin Papua Province by ethnic group. This tableshows that there are five regencies with amajority of non-Papuans: Merauke (62.73%);Nabire (52.46%); Mimika (57.49%); Keerom(58.68%), and Jayapura City (65.09%). Thismeans that there are still 23 regencies wherePapuans are in the majority although there are
another six with substantial non-Papuanpopulations: Jayapura (rural) (38.52%); YapenWaropen (21.91%); Biak Numfor (26.18%);Boven Digoel (33.04%); Sarmi (29.75%), andWaropen (20.41%). The remaining 17 regenciesare all overwhelmingly Papuan in their ethniccomposition, although with a non-Papuanpresence concentrated heavily in the towns.For instance Lanny Jaya is 99.89% Papuan;Tolikara 99.04%; Yahukimo 98.57%; Paniai97.58%, and Jayawijaya 90.79% Papuan. Thisdramatic population disparity is graphic shownin Table Three.
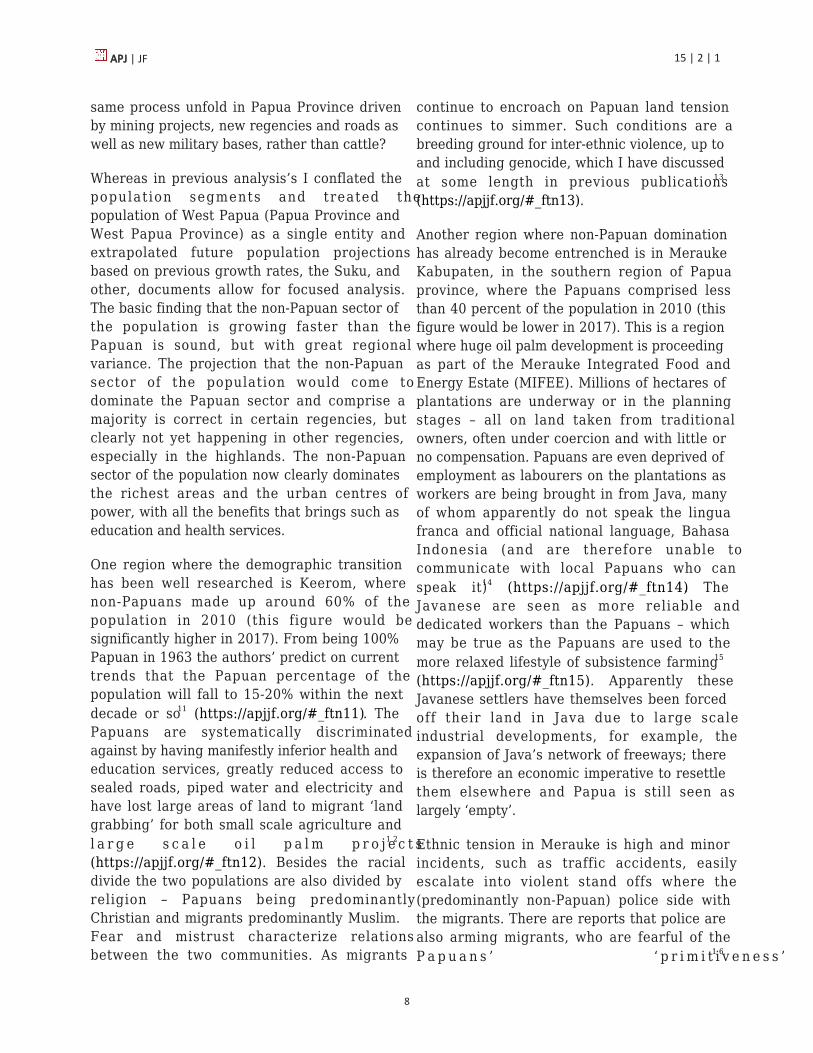
Table Three, Jumlah Penduduk Suku Papua danBukan Papua Menurut Topografi Wilayah diPapua, Tahun 2010 (Total Population of TribePapua and not Tribe Papua According toTopography in Papua Year 2010), is quitestaggering in revealing the incredibleinconsistency in the ethnic makeup of thevarious regencies in Papua Province. TableThree divides the regencies of Papua Provinceinto three geographical zones: Dataran Mudah(easy plains); Dataran Sulit (difficult plains)and Pegunungan (mountain range). It isimmediately apparent that the non-Papuanpopulation is predominant in the hospitable‘easy plains’, significant in the ‘difficult plains’,but very sparse in the ‘mountain ranges’. Thenon-Papuan population has moved to andsettled regions most conducive to types ofagriculture of industrial development in linewith the economic models seen elsewhere inIndonesia. They have not moved in largenumbers to the mountainous regions – withsome exceptions such as the fertile agriculturallands of the Baliem Valley where much land hasbeen ‘bought’ from traditional Dani subsistencefarmers.
In Papua Barat province the population dividesimilarly runs between urban and remoteareas. In Sorong regency Papuans make uponly 36.07% of the population and non-Papuans73.93% with Javanese being the single biggestethnic group at 41.46%. Meanwhile the
APJ | JF 15 | 2 | 1
7
mountainous regencies of Trambraun andMaybrat both have Papuan populations inexcess of 95% of the total populations10
(https://apjjf.org/#_ftn10).
Table Two showing the ethnic breakdownof regencies into Papuan and BukanPapuan (non-Papuan) charts in 2010.
Source: Indonesian Statistics Office, BPS.
Table Three showing the regencies ofPapua Province broken into Papuan andBukan Papuan (non-Papuan) populationcohorts and by geographic region intoDataran Mudah (easy plains); DataranSulit (difficult plains) and Pegunungan(mountain range). Source: Indonesian
Statistics Office, BPS. Note that the non-Papuan population cohort is indicated by
the darker shaded portion of the bargraphs and is predominantly in the
Dataran Mudah (easy plains) region ofPapuan province. Relatively few non-
Papuan people live in the Pegunungan(mountain range) regions of the highlands.
This situation has echoes of the occupation ofAustralia by European settlers. The fertile‘easy’ country of the coastal regions,particularly along the Eastern seaboard, wasquickly taken over by farmer settlers, but theharsh interior and northern reaches ofAustralia were left alone for nearly a centuryfrom initial European invasion in 1788. It wasreally only with the expansion of the cattleindustry in the late nineteenth century thatlarge areas of the centre and north wereoccupied by the colonialists, driven bycommercial imperatives. Similar settlementpatterns unfolded in New Zealand, Canada andthe United States where the economics ofsettler colonization (where the colonisers neverleft) resulted in widespread land alienationfrom traditional owners and the death ofindigenous peoples on a massive scale. Will this
APJ | JF 15 | 2 | 1
8
same process unfold in Papua Province drivenby mining projects, new regencies and roads aswell as new military bases, rather than cattle?
Whereas in previous analysis’s I conflated thepopulation segments and treated thepopulation of West Papua (Papua Province andWest Papua Province) as a single entity andextrapolated future population projectionsbased on previous growth rates, the Suku, andother, documents allow for focused analysis.The basic finding that the non-Papuan sector ofthe population is growing faster than thePapuan is sound, but with great regionalvariance. The projection that the non-Papuansector of the population would come todominate the Papuan sector and comprise amajority is correct in certain regencies, butclearly not yet happening in other regencies,especially in the highlands. The non-Papuansector of the population now clearly dominatesthe richest areas and the urban centres ofpower, with all the benefits that brings such aseducation and health services.
One region where the demographic transitionhas been well researched is Keerom, wherenon-Papuans made up around 60% of thepopulation in 2010 (this figure would besignificantly higher in 2017). From being 100%Papuan in 1963 the authors’ predict on currenttrends that the Papuan percentage of thepopulation will fall to 15-20% within the nextdecade or so11 (https://apjjf.org/#_ftn11). ThePapuans are systematically discriminatedagainst by having manifestly inferior health andeducation services, greatly reduced access tosealed roads, piped water and electricity andhave lost large areas of land to migrant ‘landgrabbing’ for both small scale agriculture andl a r g e s c a l e o i l p a l m p r o j e c t s 1 2
(https://apjjf.org/#_ftn12). Besides the racialdivide the two populations are also divided byreligion – Papuans being predominantlyChristian and migrants predominantly Muslim.Fear and mistrust characterize relationsbetween the two communities. As migrants
continue to encroach on Papuan land tensioncontinues to simmer. Such conditions are abreeding ground for inter-ethnic violence, up toand including genocide, which I have discussedat some length in previous publications13
(https://apjjf.org/#_ftn13).
Another region where non-Papuan dominationhas already become entrenched is in MeraukeKabupaten, in the southern region of Papuaprovince, where the Papuans comprised lessthan 40 percent of the population in 2010 (thisfigure would be lower in 2017). This is a regionwhere huge oil palm development is proceedingas part of the Merauke Integrated Food andEnergy Estate (MIFEE). Millions of hectares ofplantations are underway or in the planningstages – all on land taken from traditionalowners, often under coercion and with little orno compensation. Papuans are even deprived ofemployment as labourers on the plantations asworkers are being brought in from Java, manyof whom apparently do not speak the linguafranca and official national language, BahasaIndonesia (and are therefore unable tocommunicate with local Papuans who canspeak it)14 (https://apjjf.org/#_ftn14). TheJavanese are seen as more reliable anddedicated workers than the Papuans – whichmay be true as the Papuans are used to themore relaxed lifestyle of subsistence farming15
(https://apjjf.org/#_ftn15). Apparently theseJavanese settlers have themselves been forcedoff their land in Java due to large scaleindustrial developments, for example, theexpansion of Java’s network of freeways; thereis therefore an economic imperative to resettlethem elsewhere and Papua is still seen aslargely ‘empty’.
Ethnic tension in Merauke is high and minorincidents, such as traffic accidents, easilyescalate into violent stand offs where the(predominantly non-Papuan) police side withthe migrants. There are reports that police arealso arming migrants, who are fearful of theP a p u a n s ’ ‘ p r i m i t i v e n e s s ’ 1 6
APJ | JF 15 | 2 | 1
9
(https://apjjf.org/#_ftn16) and believe them tobe uncivilized and violent. Further exacerbatedby religious differences this situation is apowder keg contained only by a repressivemilitary and police presence. It is a situationwhere everyday life is one of oppression andmisery for most of the Papuan population whosuffer the indignity of being an occupiedpopulation: having their traditional landsstolen; discrimination in employment; very poorlevels of health and education services and nobasic freedoms of expression and association.Violence meted out to Papuans suspected ofsupporting ‘separatism’ is swift and rangesfrom beatings, incarceration and torture toextrajudicial killings. The police and militaryact with impunity and the legal system iseffectively an arm of the security apparatus.
Concluding Comments
Previously I have predicted that, if the trends ofthe past few decades remained constant, thePapuan sector of the total population of WestPapua would continue to fall until it was a‘small and rapidly dwindling minority’17
(https://apjjf.org/#_ftn17). This paper extendsthat argument and f inds while such aconclusion is correct for some regencies, it isnot for others. Indeed the situation predicted asa possible future for West Papua as a whole –the minoritisation of the Papuan people – isalready a reality in rural areas such as Keeromand Merauke, and urban centres such asJayapura and Sorong.
The fact that only relatively small numbers ofmigrants have moved into the highlandsregions of Papua and Papua Barat means thehighland Papuan groups, such as the Dani andthe Mee, are not in imminent danger ofbecoming a ‘small and rapidly dwindlingminority’, even as their lowland brothers andsisters suffer that fate. Migrants areincreas ingly drawn to the economicadvantages, and relative safety, of the lowlandregions where they can work on oil palm
plantat ions or ‘own’ their own smal lagricultural blocks, as well as works as traders,public servants and participants in the rapideconomic expansion that is underway. Theseopportunities are more limited in the highlandsbut growing as new regencies are created andnew roads and settlements built, and as miningand oil/gas projects proliferate.
While some regions are Papuan dominated andothers migrant dominated, regions such asSarmi, Biak Numfor and Jayapura (rural) stillhave a Papuan majority but are receiving largenumbers of migrants. If these trends continuethey will end up in the same pernicioussituation as the migrant dominated areasdiscussed above where the Papuans becomemarginalised and their future existence is putin peril.
The consequences of these new findings areprofound:
The Papuan people living in regenciessuch as Sorong, Merauke, Jayapura City,Keerom and Mimika are already aminority and are set to become furthermarginalized as non-Papuan migrantscontinue to arrive to work in theagricultural sector and pursue othereconomic opportunities. Non-Papuanmigrants c lash with the Papuanpopulation due to loss of traditionallands; discrimination in employment,health and education services; religioustensions, and by the increasingsuppression and human rights abusesinflicted by Indonesian security forces,especially in response to perceived‘separatist’ activity. This is set tocontinue and grow as more non-Papuanmigrants arrive, fueling ethnic tensionsand laying the ground for violent, evengenocidal, conflict.The Papuan people living in regencies inthe mountainous interior of the countryare still the overwhelming majority. The
APJ | JF 15 | 2 | 1
10
relatively small number of non-Papuanmigrants in these areas are involved intrade, civil service, the constructionindustry and the security forces. Whilenew roads, airports and industrialdevelopments are underway, largenumbers of migrants will only arrivewhen economic opportunities arepresent, such as oil palm or otherplantations (where possible); mines; gasand oil fields are expanded or otherprojects are established. It seems likelythat this will occur, at least in someareas, as the economic imperativedriving development reaches ever furtherinto remote areas. Conflict over suchresource development and the ongoingsecurity response with ‘sweeping’operations and military reprisals seemslikely to continue under currentIndonesian government policies. Thesituation can be described as ongoinginsurgency which is now characterizedby non-violent resistance on the part ofthe Papuans demanding not just theirbasic human rights but also that of self-determination, bolstered by rapidlygrowing internat ional support ,particularly from the small Pacific islandnations such as Vanuatu and theSolomon Islands.Given the above the conflict in PapuaProvince (and West Papua Province) willonly grow short of a fundamental shift inIndonesian policy including: therecognition of traditional land ownershiprights; ceasing militarization and militaryimpunity; respect for the fundamentalhuman rights of free speech andassociation; progressive education,health and employment opportunities,and the emergence o f po l i t i ca lorganisations that adequately reflect theinterests of the Papuan people. At thisstage such policy shifts by the Indonesiangovernment appear unlikely.International support for the basic rights
of the Papuan people is growing rapidlywith a goal of taking the issue to theUnited Nations, having (West) Papua putback on the Schedule of Non-SelfGoverning Territories and, ultimately,having the flawed 1969 Act of FreeChoice, whereby Indonesia gainedsovereignty over the region, revisited.These figures mean that the ‘problem’ ofWest Papua will not be resolved any timesoon by the effective minoritisation of thePapuan people, at least not in thehighlands. On the contrary large portionsof the Papuan people retain their landsand cultures intact and are quite capableof both having an open and honest voteon their integration into Indonesia, and,given the chance, functioning as anindependent nation.
This paper shows how that the process ofsettlement by recent non-Papuan migrants inthe territory of West Papua is far from uniform.On the contrary most of the migrants havesettled in the coastal plains and urban centreswhile the vast highlands regions remainpopulated predominantly by Papuan people.However the highlands regions will beincreasingly attractive to migrants as theIndonesia government pursues aggressiveeconomic development policies includingcreating new regencies (and their concomitantbureaucracies); building roads and developingmineral; oil/gas and forestry resources. Whilethe Indonesian government claims thataccelerated development will help resolvePapuan grievances against Indonesian rule theopposite is likely as the Papuans get left behindin the development process in favour of non-Papuan migrants; they become furthermarginalized within an Asian Muslim society,and their traditional lands are forcibly takenover by government or commercial interests.Therefore it looks likely that the changingdemographic make of West Papua will continueto fuel conflict into the future.
APJ | JF 15 | 2 | 1
11
The author would like to thank SepterManufandu for his insightful comments andassistance with this essay, and Cammi Webb-Gannon and Jason MacLeod, his colleagues atthe West Papua Project, for their ongoingsupport and vital feedback.
Related articles
Cammelia Webb-Gannon, Here:Salvaging Democracy for West Papuansin the Face of Australia-IndonesiaO b s t r u c t i o n(https://apjjf.org/-Camellia-Webb_Gannon/4400)Camellia Webb-Gannon and Jim Elmslie,Here: MSG Headache, West PapuanHeartache? Indonesia's MelanesianF o r a y(https://apjjf.org/2014/12/47/Jim-Elmslie/4225.html)David Adam Stott, Here: Would AnIndependent West Papua Be A FailingS t a t e ?(https://apjjf.org/2011/9/37/David-Adam-Stott/3597/article.html)David Adam Stott, Here: IndonesianColonisation, Resource Plunder and WestP a p u a n G r i e v a n c e s(https://apjjf.org/2011/9/12/David-Adam-Stott/3499/article.html)
Jim Elmslie is Honorary Research Fellow and convener of the West Papua Project, theDepartment for Peace and Conflict Studies at the University of Sydney. His PhD entitled IrianJaya Under the Gun: Indonesian Economic Development versus West Papuan Nationalism,was published by the University of Hawaii Press. Jim has been closely involved with the SepikRiver region of PNG since 1983 as a political economist, tribal art dealer, film consultant andcultural advisor. [email protected] (https://apjjf.org/mailto:[email protected])
Notes1 For instance, West Papua: Genocide, Demographic Change, the Issue of ‘Intent’ and theAustralia-Indonesia Security Treaty, Australia Institute of International Affairs, Adelaide,23/10/06; Not Just a Disaster, Papuan Claims of Genocide Deserve to be taken Seriously,Inside Indonesia Issue 97, July-Sept. 2009; West Papuan Demographic Transition and the2010 Indonesian Census: “Slow Motion Genocide” or Not?, Papua Papers No. 1, CPACS,University of Sydney, September, 2010. More recently with Camellia Webb-Gannon, A SlowMotion Genocide: Indonesian Rule in West Papua, Griffith Journal of Law and Human Dignity,Vol. 1(2), 2013, pp. 142-165.2 See West Papuan Demographic Transition and the 2010 Indonesian Census: “Slow Motion
APJ | JF 15 | 2 | 1
12
genocide” or not? Op. cit.3 Ibid.4 Suku meaning ‘tribe’ and Bukan meaning ‘not’ in Bahasa Indonesia5 Statistics on Ethnic Diversity in the Land of Papua, Indonesia, Aris Ananta; Dwi RetnoWilujeng Wahyu Utami; Nur Budi Handayani, Asia & Pacific Policy Studies, Vol. 3, Issue 3,September 2016, p. 3.6 There is some variance in the figures from the Badan Pusat Staistik of total populations etc.although these are statistically insignificant.7 www.bps.go.id/linkTabelStatis/print/id/1268(http://www.bps.go.id/linkTabelStatis/print/id/1268)8 This quote is from a paper presented by Emil Ola Kleden, ‘Papua, Indonesia and ClimateChange’ for the conference, At The Intersection: Climate Change in the Pacific and ResourceExploitation in West Papua, organized by the West Papua Project at the University of WesternSydney on November 3-4, 2016. Kleden refers to Ananta, A., Evi Nurvidya Arifin, M. SairiHasbullah, Nur Budi Handayani, Agus Pramono, Demography of Indonesia’s Ethnicity,Institute of Southeast Asian Studies, Singapore, 2015, p.10.9
10 Statistics on Ethnic Diversity, op. cit.11 Cypri J. P. Dale and John Djonga, The Papuan Paradox: The Patterns of Social Injustice, theViolations of Right to Development, and the Failure of Affirmative Policies in KabupatenKeerom, Papua, Yayasan Teratai Hati Papua, Arso, Keerom, Papua, and Sunspirit for Justiceand Peace, Flores, NTT, Indonesia, 2011, slide 45.12 Ibid.13 See Jim Elmslie and Cammi Webb-Gannon, A Slow-Motion Genocide: Indonesian Rule inWest Papua, Griffith Journal of Law & Human Dignity, Vol. 1[2] 2013, pp. 142-165.14 Confidential source with firsthand knowledge of conditions in Merauke.15 Personal comment from a Papuan source who related that many Papuan people are unusedto the controlled and repetitive regime of industrial agriculture, and intensely bored fromsuch occupations as security ‘guards’.16 Ibid.17 For instance see, Jim Elmslie, West Papuan Demographic Transition and the 2010Indonesian Census: “Slow Motion Genocide” or not?, Papua Papers No. 1, West PapuaProject, Centre for Peace and Conflict Studies, University of Sydney, 2010, p.4.


