THE GREAT DISMAL SWAMP: MANAGEMENT OF A HYDROLOGIC RESOURCE WITH THE AID OF REMOTE SÉNSING
12
WATER RESOURCES BULLETIN VOL. 13, NO. 1 AMERICAN WATER RESOURCES ASSOCIATION FEBRUARY 1977 THE GREAT DISMAL SWAMP: MANAGEMENT b~ A HYDROLOGIC RESOURCE WITH THE .AID OF REMOTE SEN SING^ Virginia Carter, Mary Keith Garrett, Lurie S h i m , and Patricia Gammon' ABSTRACT: Both color infrared aerial photography and Landsat data are being used to provide information to meet present and future management goals for The Great Dismal Swamp National Wildlife Refuge. High and low altitude color infrared photographs are being used to study the hydrology and map the present vegetation of the swamp. A variety of significant ecologic units have been identified using these photographs. The completed maps will be used to evaluate analyses of Landsat digital data. Once the present data base is compiled, it is hoped that routine analysis of Landsat data can be used fpr updating or to indicate areas where low altitude coverage or ground checking is desirable. The data base will also aid in identifying and evaluating trends that may provide guidelines for wetland management. INTRODUCTION The Great Dismal Swamp is a forested wetland located on the Virginia-North Carolina border on the southern Atlantic coastal plain (figure 1). It is 84,000 hectares in extent and is developed on organic soils ranging in depth from 4 metres in ,ancient drainage channels to less than 0.3 metres along the outer edges. Lake Drummond, approximately 4.0 kilometres (km) in diameter, is almost centrally located within the gently east sloping gradient of the swamp. The origin and present hydrologic regime of the swamp and Lake Drummond are still in dispute because of the complex regional geology and fragmented historical record. The natural trends in vegetative succession in the swamp have been obscured by timber harvesting, numerous fires, and the construction of ditches and dike roads for drainage and transportation. The 161 km of ditches and roads (most constructed since 1925) have effectively modified the natural water patterns, allowing much of the surface-water to be shunted rapidly through the system rather than remaining for several months. Peat continues to accumulate in wet areas, but oxidation and fires in dry areas or during dry 'Paper No. 12345 of the Water Resources Bulletin. Discussions are open until June 1, 1977. Respectively, US. Geological Survey, National Center, Reston, Virginia; Great Dismal Swamp National Wildlife Refuge, USFWS, Suffolk, Virginia; Goddard Space Flight Center, NASA, Greenbelt, Maryland; and Great Dismal Swamp National Wildlife Refuge, USFWS, Suffolk, Virginia. 1
-
Upload
virginia-carter -
Category
Documents
-
view
219 -
download
4
Transcript of THE GREAT DISMAL SWAMP: MANAGEMENT OF A HYDROLOGIC RESOURCE WITH THE AID OF REMOTE SÉNSING
WATER RESOURCES BULLETIN VOL. 13, NO. 1 AMERICAN WATER RESOURCES ASSOCIATION FEBRUARY 1977
THE GREAT DISMAL SWAMP: MANAGEMENT b~ A HYDROLOGIC RESOURCE
WITH THE .AID OF REMOTE SEN SING^ Virginia Carter, Mary Keith Garrett,
Lurie S h i m , and Patricia Gammon'
ABSTRACT: Both color infrared aerial photography and Landsat data are being used to provide information to meet present and future management goals for The Great Dismal Swamp National Wildlife Refuge. High and low altitude color infrared photographs are being used to study the hydrology and map the present vegetation of the swamp. A variety of significant ecologic units have been identified using these photographs. The completed maps will be used to evaluate analyses of Landsat digital data. Once the present data base is compiled, it is hoped that routine analysis of Landsat data can be used fpr updating or to indicate areas where low altitude coverage or ground checking is desirable. The data base will also aid in identifying and evaluating trends that may provide guidelines for wetland management.
INTRODUCTION The Great Dismal Swamp is a forested wetland located on the Virginia-North Carolina
border on the southern Atlantic coastal plain (figure 1). It is 84,000 hectares in extent and is developed on organic soils ranging in depth from 4 metres in ,ancient drainage channels to less than 0.3 metres along the outer edges. Lake Drummond, approximately 4.0 kilometres (km) in diameter, is almost centrally located within the gently east sloping gradient of the swamp. The origin and present hydrologic regime of the swamp and Lake Drummond are still in dispute because of the complex regional geology and fragmented historical record.
The natural trends in vegetative succession in the swamp have been obscured by timber harvesting, numerous fires, and the construction of ditches and dike roads for drainage and transportation. The 161 km of ditches and roads (most constructed since 1925) have effectively modified the natural water patterns, allowing much of the surface-water to be shunted rapidly through the system rather than remaining for several months. Peat continues to accumulate in wet areas, but oxidation and fires in d ry areas or during dry
'Paper No. 12345 of the Water Resources Bulletin. Discussions are open until June 1, 1977. Respectively, US. Geological Survey, National Center, Reston, Virginia; Great Dismal Swamp
National Wildlife Refuge, USFWS, Suffolk, Virginia; Goddard Space Flight Center, NASA, Greenbelt, Maryland; and Great Dismal Swamp National Wildlife Refuge, USFWS, Suffolk, Virginia.
1

2 Carter, Garrett, Shima, and Gammon
Figure 1 . Part of Soil Conservation Service MSS 7 Mosaic Showing the Great Dismal Swamp and Its Relationship to Chesapeake Bay on the North and Albemarle Sound to the South.
The Broken Line Indicates the North Carolina-Virginia Border.

The Great Dismal Swamp 3
periods have decreased the depth of these organic soils. The majority of the timber has been cut or burned within the last 70 years. Recent publications suggest a trend toward a more mesic species composition (Meanley, 1973).
The recently established Great Dismal Swamp National Wildlife Refuge is one of a select few land areas acquired by the U.S. Fish and Wildlife Service without special regard for waterfowl, other migratory birds, or specific wildlife species. Instead, this refuge is charged with the responsibility of preserving and managing the total wetland ecosystem (US . Fish and Wildlife Service, 1974). The single most important element affecting the stability of the swamp environment is the water regime. The refuge manager’s chief priority is therefore to understand this water regime in order to properly conserve available water and to develop a program for manipulation of the surface and ground water in and around the swamp. In addition, the refuge staff must strive to maintain balanced wildlife populations within available habitats and to develop environmental education and public use programs.
The objectives of the Great Dismal Swamp National Wildlife Refuge are identified as follows : 1. Conduct a comprehensive study of the hydrology. 2. Document the present vegetative composition. 3. Evaluate historical and present trends in vegetative succession. 4. Evaluate existing wildlife habitats and determine future habitat needs. 5. Determine management techniques necessary to satisfy habitat needs.
This paper is a progress report on the use of remote sensing data to meet management objectives in the Great Dismal Swamp. Public Law 92-478, the Dismal Swamp Study Act, (1972) served as a catalyst t o bring together eight separate federal agencies and four academic institutions to study the swamp. Since the official termination of the Public Law Study in October 1974, cooperative work between these agencies and institutions has not only continued but greatly expanded. One important outcome of the original study was the documentation of the usefulness of remotely-sensed data for understanding and managing the swamp (Carter, 1974a). Traditional methods of ground sampling are too time-consuming and expensive to effectively identify and map vegetative and hydrologic information. In addition, it is difficult to recognize and evaluate vegetational changes in such a large, complex, and inaccessible area. Remotely sensed data can provide both managers and researchers with a series of information sets for analysis and temporal comparison.
ACQUISITION AND PRELIMINARY ANALYSIS OF IMAGERY
In order to evaluate the potential use of remotely-sensed data in ongoing and future cooperative studies in the swamp, new photography tied to simultaneous ground observations was needed to fully establish the utility and accuracy of color infrared (IR) photographs for boundary determination, hydrology studies, and vegetation mapping. In October of 1974 and March of 1975, NASA/Wallops Flight Center provided complete low-altitude (approximately 1 :24,000 scale) color and color IR photographic coverage of the swamp. In February of 1975, NASAlAMES Flight Center took high resolution color

4 Carter, Garrett, Shima, and Gammon
IR photographs of the entire swamp at scales of 1 :130,000 and 1 :65,000. Simultaneous ground observations and helicopter surveys were conducted for two of these three flights.
Analysis of the new photographs and comparison with previous coverage showed that multi-season color IR photography is invaluable for studies of swamp hydrology and vegetative composition. Swamp boundaries, extent of surface water, and drainage patterns can be identified and delineated from the February 1975 leaves-off photographs. Using the winter photographs supplemented by the low-altitude color IR, we can map evergreen versus deciduous canopy and understory. Using the seasonal data we can also discriminate among several of the more discrete deciduous communities.
The aircraft data were also needed to provide a firm basis for the ongoing computer analysis of Landsat digital data. The repetitive nature of Landsat data makes it ideal for studying and monitoring large complex areas like the Dismal Swamp. The use of these data can be highly cost effective if the accuracy of interpretation meets the needs of resource management. The Landsat satellite utilizes an optical-mechanical multispectral scanner (MSS) to acquire data in four spectral bandwidths (subdivisions of the visible and IR electromagnetic spectrum)’: band 4 - 0.5 to 0.6 jm (green), band 5 - 0.6 to 0.7 pm (red), band 6 - 0.7 to 0.8 pm (near IR), and band 7 - 0.8 to 1.1 p n (near IR). Data over the Dismal Swamp are acquired every 9 days at present. ‘Ihese data are digital when received at the ground receiving station and are available in both digital tape (CCT) or images made with an electron beam recorder and similar to black and white (B/W) or color photographs.
Landsat digital tapes had been previously analyzed using three computer systems designed specifically for analysis of remotely sensed digital data: the General Electric Image-100, (Carter, 197413; Shima, unpublished data, 1974), the LARSYS system (developed by the Laboratory for Applications of Remote Sensing, Purdue University) (Messmore, 1975; Gammon, unpublished data 1975), and the DAMS at NASA/Goddard Space Flight Center (Carter, 1974b). It was clear from this preliminary work that this readily available repetitive information would enhance our ability to look at the seasonal aspects of swamp hydrology and vegetation. We are therefore concentrating part of our effort on delineation and mensuration of swamp vegetation and water-related classes from Landsat digital data.
DATA CATALOGING AND MAPPING METHODS The information on available NASA and USGS aircraft photography and Landsat
imagery has been updated (November 1975). Image centers for NASA photographs from each mission have been plotted on uniform scale maps with accompanying tabular summaries. USGS coverage for 1937, 1938, 1952, 1971, and 1973 has been identified and photomosaics of these data are available for use in the Dismal Swamp Refuge Ofice. Most of the suitable (minimal cloud cover) Landsat images of the swamp have been recorded by image number and six sets of Landsat computer compatible tapes (CCT’s) are available to swamp investigators.
The U.S. Geological Survey 1 :24,000 B/W orthophotoquadrangles (1974) are exceptionally good bases for compilation and display of detailed hydrologic and vegetative information. Orthophotoquadrangles are maps made directly from geometri- cally correct (rectified) B/W photographs with only a minimum of information printed

The Great Dismal Swamp 5
directly on this photographic base. The 1 : 100,000-scale orthophotomosaic (composite of all 16 orthophotoquadrangles covering the swamp) is being used for synoptic presentation of information for the entire swamp.
We are presently proceeding with detailed mapping of the Dismal Swamp vegetation at scales of 1 :100,000 and 1 :24,000. Canopy and understory vegetation are being identified from the seasonal color IR transparencies and compiled by monoscopic transfer methods on the orthophoto bases. These vegetation maps will serve several purposes; they will be available to investigators working within the swamp; they form a data base for planning and comparison with historic and future data; and they form a basis on which to assess the Landsat digital theme extractions discussed in a later section of this paper. The maps are being field-checked as they are produced and it is planned to update them on the basis of continuing work in the swamp.
The historic USGS photographs from 1937, 1938,1952, and 1971 and a 1947 timber inventory map are being used to prepare a series of overlays on the 1975 USGS 1 :24,000-scale orthophotoquadrangle base maps. These overlays depict the location of bums and timber removal as well as the relative dates of these occurrences. Ground sampling can be directed to specific areas and natural successional patterns following these disturbances can be evaluated.
DATA ANALYSIS
Both photography and Landsat imagery are being used for identification of vegetative communities, hydrologic studies, and environmental monitoring. These uses are discussed below.
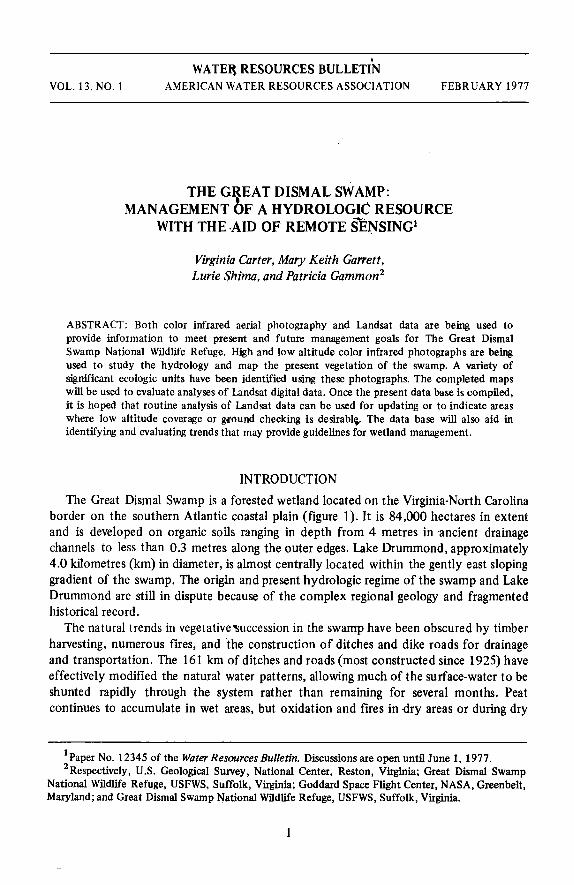
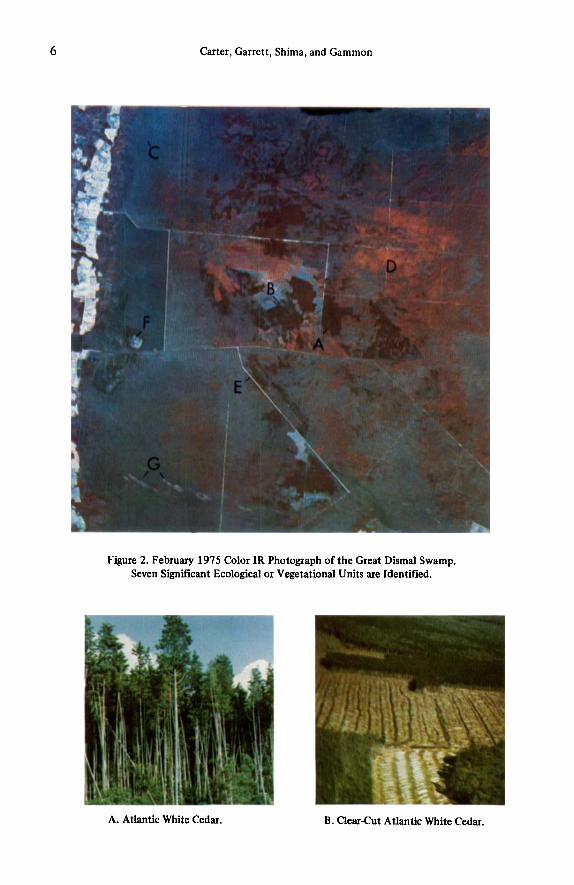
The Dismal Swamp flora, while not unique, includes both individual species and plant communities which are otherwise scattered widely north or south along the coastal plain (Meanley, 1973; Carter, 1974b). Man-made disturbance of this natural vegetation has resulted in a wide diversity of habitats. This diversity supports a variety of bird and mammal species and provides a unique area for research and education. Both high and low-altitude color IR photographs have been used extensively to identify numerous ecological units. These include cypress-gum communities; pure stands of Atlantic white cedar; groves of maple, sweetgum, and yellow poplar; the evergreen shrub-pond pine community; small stands of old loblolly pine; revegetating clear-cut areas and burns; roadside communities; open marsh; and mesic “islands” with characteristic upland vege- tation. Figure 2 shows a part of the February 1975 color IR photograph of the southern half of the swamp. Seven significantly different ecological or vegetational units are identi- fied in the accompanying ground photographs.
Because the swamp vegetation is an excellent indicator of the hydrologic regime, we are correlating the vegetation maps with information being gathered on surface and subsurface water levels. A network of ground water observation wells is presently being installed; their locations are being guided in part by the mapped vegetation communities and areas of standing water as observed in the high-altitude photography and Landsat imagery. A preliminary hydrology study (Lichtler and Walker, 1974) suggested that the shallow aquifer l yhg beneath the swamp may have been partially responsible for the formation of the swamp and may also be one of the factors affecting the present water regime. The ground water well network is being designed for the purposes of 1)
6 Carter, Garrett, Shima, and Gammon
Figure 2. February 1975 Color 1R Photograph of the Great Dismal Swamp. Seven Signifcant Ecological or Vegetational Units are Identified.
A. Atlantic White Cedar. B. Clear-cut Atlantic White Cedar.
The Great Dismal Swamp 7
C. Seasonally Flooded Deciduous Trees. D. Evergreen-Shrub-Pond Pine Association.
E. Ditch and Adjacent Road with Roadside Vegetation Community.
F. Open Marsh G. Mesic “Island.”
8 Carter, Garrett, Shima, and Gammon
investigating the relationship of the underlying aquifer to the swamp water table; 2) determining the effect of the ditches on adjacent ground water levels; and 3) determining what correlation, if any, exists between ground water fluctuations and the distribution of vegetation. These observations will be highly valuable when an extensive hydrologic investigation of the swamp is conducted.
Fire has played an important role in establishing and maintaining vegetative diversity within the swamp. l’he pattern of regeneration after a fue is dependent almost wholly upon the extent of loss of organic soils. An elevated water table during the time of fue can promote the regeneration of Atlantic white cedar. During a low water table, fire will burn deeply into the peat and the evergreen shrub-pond pine community or mixed- deciduous forest may become established. The observation wells mentioned above will provide information on the water regime during the period immediately preceding and following a fue. This information may make it possible to predict and subsequently influence the pattern of regeneration.
A wildfue occurred in the Dismal Swamp in September of 1975, covering 125 acres of cut-over and standing cedar and consuming the surface organic soil to a depth of almost two-thirds of a metre (fgure 3). This relatively small burned area is visible on Landsat imagery from October 1975. Permanent transects are being established in this area and plans are being ma& to attempt to direct regeneration of Atlantic white cedar, carefully evaluating progress as a guideline to future reforestation programs. As a result of this fue, the concept of monitoring swamp events by remote sensing has become a reality (see Future Plans).
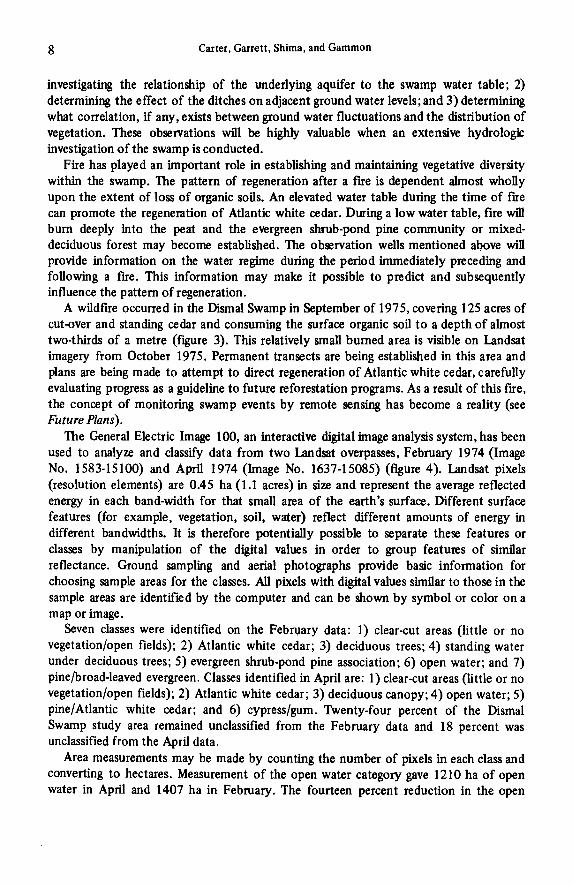
The General Electric Image 100, an interactive digital image analysis system, has been used to analyze and classify data from two Landsat overpasses, February 1974 (Image No. 1583-15100) and April 1974 (Image No. 1637-15085) (figure 4). Landsat pixels (resolution elements) are 0.45 ha (1.1 acres) in size and represent the average reflected energy in each band-width for that small area of the earth’s surface. Different surface features (for example, vegetation, soil, water) reflect different amounts of energy in different bandwidths. It is therefore potentially possible to separate these features or classes by manipulation of the digital values in order to group featum of similar reflectance. Ground sampling and aerial photographs provide basic information for choosing sample areas for the classes. All pixels with digital values similar to those in the sample areas are identified by the computer and can be shown by symbol or color on a map or image.
Seven classes were identified on the February data: 1) clear-cut areas (little or no vegetatiodopen fields); 2) Atlantic white cedar; 3) deciduous trees; 4) standing water under deciduous trees; 5) evergreen shrub-pond pine association; 6) open water; and 7) pinelbroad-leaved evergreen. Classes identified in April are: 1) clear-cut areas (little or no vegetation/open fields); 2) Atlantic white cedar; 3) deciduous canopy; 4) open water; 5) pine/Atlantic white cedar; and 6) cypress/gum. Twenty-four percent of the Dismal Swamp study area remained unclassified from the February data and 18 percent was unclassified from the April data.
Area measurements may be made by counting the number of pixels in each class and converting to hectares. Measurement of the open water category gave 1210 ha of open water in April and 1407 ha in February. The fourteen percent reduction in the open

The Great Dismal Swamp
Figure 3. Aerial and Ground Photographs of Recent (September 1975) Bum in the Great Dismal Swamp
Showing the Size of Burnt Area and the Loss of Peat.
9
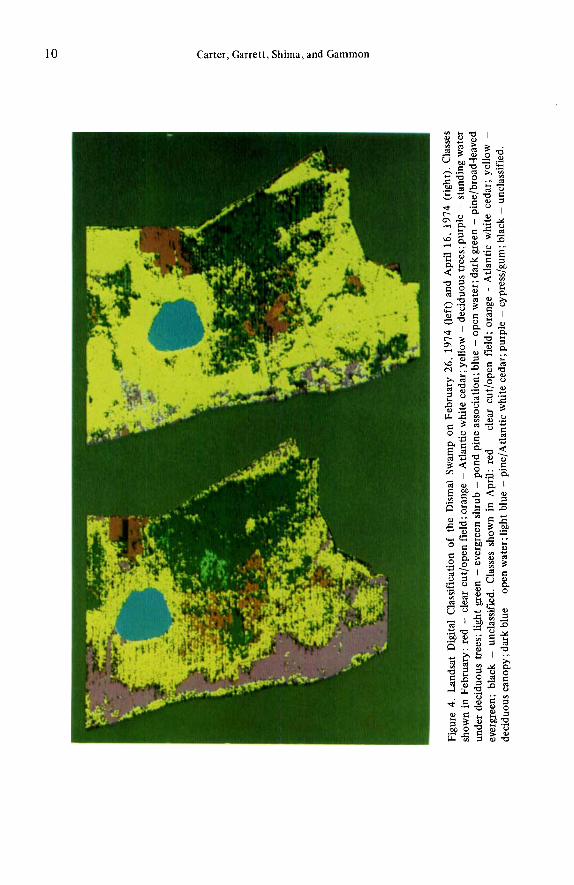
10 Carter, Garrett, Shima, and Gammon
The Great Dismal Swamp 11
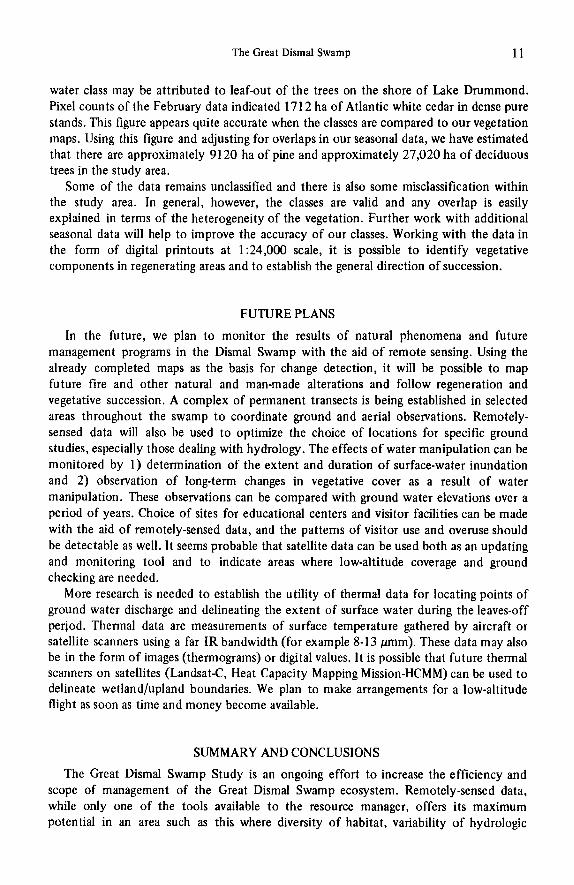
water class may be attributed to leaf-out of the trees on the shore of Lake Drummond. Pixel counts of the February data indicated 1712 ha of Atlantic white cedar in dense pure stands. This figure appears quite accurate when the classes are compared to our vegetation maps. Using this figure and adjusting for overlaps in our seasonal data, we have estimated that there are approximately 91 20 ha of pine and approximately 27,020 ha of deciduous trees in the study area.
Some of the data remains unclassified and there is also some misclassification within the study area. In general, however, the classes are valid and any overlap is easily explained in terms of the heterogeneity of the vegetation. Further work with additional seasonal data will help to improve the accuracy of our classes. Working with the data in the form of digital printouts at 1:24,000 scale, it is possible to identify vegetative components in regenerating areas and to establish the general direction of succession.
FUTURE PLANS
In the future, we plan to monitor the results of natural phenomena and future management programs in the Dismal Swamp with the aid of remote sensing. Using the already completed maps as the basis for change detection, it will be possible to map future fire and other natural and man-made alterations and follow regeneration and vegetative succession. A complex of permanent transects is being established in selected areas throughout the swamp to coordinate ground and aerial Observations. Remotely- sensed data will also be used to optimize the choice of locations for specific ground studies, especially those dealing with hydrology. The effects of water manipulation can be monitored by 1) determination of the extent and duration of surface-water inundation and 2) observation of long-term changes in vegetative cover as a result of water manipulation. These observations can be compared with ground water elevations over a period of years. Choice of sites for educational centers and visitor facilities can be made with the aid of remotely-sensed data, and the patterns of visitor use and overuse should be detectable as well. It seems probable that satellite data can be used both as an updating and monitoring tool and to indicate areas where low-altitude coverage and ground checking are needed.
More research is needed to establish the utility of thermal data for locating points of ground water discharge and delineating the extent of surface water during the leaves-off perjod. Thermal data are measurements of surface temperature gathered by aircraft or satellite scanners using a far IR bandwidth (for example 8-13 pmm). These data may also be in the form of images (thermograms) or digital values. It is possible that future thermal scanners on satellites (Landsat-C, Heat Capacity Mapping Mission-HCMM) can be used to delineate wetland/upland boundaries. We plan to make arrangements for a low-altitude flight as soon as time and money become available.
SUMMARY AND CONCLUSIONS
The Great Dismal Swamp Study is an ongoing effort to increase the efficiency and scope of management of the Great Dismal Swamp ecosystem. Remotely-sensed data, while only one of the tools available to the resource manager, offers its maximum potential in an area such as this where diversity of habitat, variability of hydrologic

12 Carter, Garrett, Shima, and Gammon
regime, and inaccessibility of terrain combine t o form an environment of enormous complexity. To date we have established that both Landsat data and aerial photography are valuable tools for studying the Great Dismal Swamp and helping to meet a variety of management goals. Color IR photographs are presently being used t o compile vegetative and hydrologic information on B/W orthophoto bases. The resulting maps will be used for management, field studies, and for checking the results of Landsat analyses. Once the present data base is completely compiled, routine analysis of Landsat data can be used either as an update tool or to indicate areas where low-altitude coverage or ground checking are desirable. The data base can also be used for the identification and evaluation of hydrologic and vegetative trends that may provide guidelines for water manipulation and swamp management.
LITERATURE CITED
Carter, Virginia, 1974a. The Dismal Swamp - remote sensing applications. I n Secretary of the Interior Study on Great Dismal Swamp and Dismal Swamp Canal, NC-VA Protection and Preservation, Feasibility Study. U.S. 92nd Congress, October 9, 1972, Public Law 92-478, coordinated by US. Bureau of Sport Fisheries and Wildlife, 19 pp.
Carter, Virginia, 1974b. Remote sensing applications to the Dismal Swamp. I n Proceedings on the Great Dismal Swamp Symposium. Old Dominion University, Norfolk, Virginia, March 14, 1974, 34 pp. (in press).
Lichtler, W. F., and Walker, P. N., 1974. Hydrology of the Dismal Swamp, Virginia-North Carolina. U.S. Geological Survey, Richmond, Virginia, open fde, 50 pp.
Meanley, Brooke, 1973. The Great Dismal Swamp. Audubon Naturalist Society of the Central Atlantic States, Inc., 48 pp.
Messmore, J. A., 1975. Mapping forest vegetation with ERTS-1 MSS data and automatic data processing techniques. In 4th Annual Remote Sensing of Earth Resources. (In press).
U.S. Fish and Wildlife Service, 1974. Report to the United States Congress from the Secretary of the Interior regarding Actions Taken and Recommendations Made Pursuant to Public Law 92-478 (Dismal Swamp Study).