
The great COVID-19 divergence - Bruegel
15
Grégory Claeys (gregory. [email protected]) is a Senior Fellow at Bruegel Zsolt Darvas (zsolt. [email protected]) is a Senior Fellow at Bruegel Maria Demertzis (maria. [email protected]) is Deputy Director of Bruegel Guntram Wolff (guntram.wolff@bruegel. org) is Director of Bruegel is Policy Contribution was prepared for and presented at the informal Economic and Financial Affairs Council (ECOFIN) meeting in Lisbon, 21-22 May 2021. e authors are grateful to Monika Grzegorczyk, Lionel Guetta- Jeanrenaud, Mia Hoffmann, Klaas Lenaerts, Ben McWilliams, Tom Schraepen and Pauline Weil for excellent research assistance, and to Mario Mariniello, Simone Tagliapietra, André Sapir and Nicolas Véron for their useful comments. Executive summary The COVID-19 pandemic has led to the biggest global recession since the Second World War. Forecasts show the European Union underperforming economically relative to the United States and China during 2019-2023. Southern European countries have been particu- larly strongly affected. While the ICT sector has benefitted from the COVID-19 crisis, tourism, travel and services have suffered. Business insolvencies have, paradoxically, fallen. While total employment has almost recovered, the young and those with low-level qualifications have suffered employment losses. Inequality could rise. e pandemic may lead to medium to long-term changes in the economy, with more teleworking, possibly higher productivity growth and changed consumer behaviour. Policymakers must act to prevent lasting divergence within the EU and to prevent scarring from the fallout from the pandemic. e first priority is tackling the global health emergency. Second, we warn against premature fiscal tightening and recommend instead additional short-term support from national budgets. Over the medium term, fiscal policymakers will need to gradually move away from supporting companies through subsidies, towards tax incentives for corporate investment. A review of the European fiscal framework is needed to achieve the EU’s green goals more rapidly. e quality of public finances, how policymakers spend resources and the associated reforms are of central importance to prevent scarring. Improving the efficiency of insolvency procedures will be crucial for speedy and effective recovery. Targeted labour market policies for the young and less-qualified are needed. As teleworking becomes a more permanent feature of the EU’s labour markets, it will be crucial to adapt social security and taxation systems in the context of the single market for labour. e EU should resist protectionist calls in the wake of the pandemic. Rigorous competition policy enforcement and an integrated EU market have been beneficial for European convergence and growth. Capital markets have an important role to play in a speedy recovery. Recommended citation Claeys, G., Z. Darvas, M. Demertzis and G. Wolff (2021) 'e great COVID-19 divergence: managing a sustainable and equitable recovery in the European Union', Policy Contribution 11/2021, Bruegel Policy Contribution Issue n˚11/21 | May 2021 The great COVID-19 divergence: managing a sustainable and equitable recovery in the European Union Grégory Claeys, Zsolt Darvas, Maria Demertzis and Guntram Wolff
Transcript of The great COVID-19 divergence - Bruegel

Grégory Claeys (gregory.
[email protected]) is a
Senior Fellow at Bruegel
Zsolt Darvas (zsolt.
[email protected]) is a
Senior Fellow at Bruegel
Maria Demertzis (maria.
Deputy Director of Bruegel
Guntram Wolff
(guntram.wolff@bruegel.
org) is Director of Bruegel
This Policy Contribution was
prepared for and presented
at the informal Economic
and Financial Affairs Council
(ECOFIN) meeting in Lisbon,
21-22 May 2021. The authors
are grateful to Monika
Grzegorczyk, Lionel Guetta-
Jeanrenaud, Mia Hoffmann,
Klaas Lenaerts, Ben
McWilliams, Tom Schraepen
and Pauline Weil for excellent
research assistance, and to
Mario Mariniello, Simone
Tagliapietra, André Sapir and
Nicolas Véron for their useful
comments.
Executive summary
The COVID-19 pandemic has led to the biggest global recession since the Second World
War. Forecasts show the European Union underperforming economically relative to the
United States and China during 2019-2023. Southern European countries have been particu-
larly strongly affected. While the ICT sector has benefitted from the COVID-19 crisis, tourism,
travel and services have suffered. Business insolvencies have, paradoxically, fallen. While
total employment has almost recovered, the young and those with low-level qualifications
have suffered employment losses. Inequality could rise. The pandemic may lead to medium
to long-term changes in the economy, with more teleworking, possibly higher productivity
growth and changed consumer behaviour.
Policymakers must act to prevent lasting divergence within the EU and to prevent
scarring from the fallout from the pandemic. The first priority is tackling the global health
emergency. Second, we warn against premature fiscal tightening and recommend instead
additional short-term support from national budgets. Over the medium term, fiscal
policymakers will need to gradually move away from supporting companies through
subsidies, towards tax incentives for corporate investment. A review of the European fiscal
framework is needed to achieve the EU’s green goals more rapidly. The quality of public
finances, how policymakers spend resources and the associated reforms are of central
importance to prevent scarring. Improving the efficiency of insolvency procedures will be
crucial for speedy and effective recovery. Targeted labour market policies for the young and
less-qualified are needed. As teleworking becomes a more permanent feature of the EU’s
labour markets, it will be crucial to adapt social security and taxation systems in the context
of the single market for labour. The EU should resist protectionist calls in the wake of the
pandemic. Rigorous competition policy enforcement and an integrated EU market have been
beneficial for European convergence and growth. Capital markets have an important role to
play in a speedy recovery.
Recommended citation
Claeys, G., Z. Darvas, M. Demertzis and G. Wolff (2021) 'The great COVID-19 divergence:
managing a sustainable and equitable recovery in the European Union', Policy Contribution
11/2021, Bruegel
Policy Contribution Issue n˚11/21 | May 2021 The great COVID-19 divergence:
managing a sustainable and equitable recovery in the European Union Grégory Claeys, Zsolt Darvas, Maria Demertzis
and Guntram Wolff

2 Policy Contribution | Issue n˚11/21 | May 2021
1 IntroductionThe COVID-19 pandemic has led to the biggest global recession since the Second World War.
Global GDP in 2020 was 6.7 percent lower than had been forecast at the end of 20191. Devel-
oping and advanced countries lost about the same proportion of output relative to forecast
(6.7 percent vs 6.3 percent), yet the annual GDP actual decline was larger in advanced econ-
omies: a 4.7 percent recession in 2020 versus a 2.2 percent recession in 2020 in emerging and
developing countries. Among the big economies, China even grew by 2.3 percent, though its
2020 level of GDP was 3.6 percent lower than pre-COVID-19 forecasts.
According to the International Monetary Fund (IMF, 2021), despite higher-than-usual
growth as the global economy recovers from the COVID-19 shock, world output will still be
about 4 percent lower in 2024 than pre-pandemic projections suggested. In other words, the
global economy looks set to suffer from longer-lasting scarring effects that could permanently
lower the path of output.
Within the European Union, some countries have seen greater GDP losses than others.
Some sectors have been harder hit than others, and there have been different impacts on the
labour market depending on age, gender and education level. We document these differences
in section 2.
Some of the intra-EU divergence may become permanent or at least long-lasting (section
3). For example, GDP forecasts suggest that some countries, such as Italy, will reach their
pre-pandemic GDP level only by 2023 while others, such as Poland, will surpass it already
in 20212. On a sectoral level, the pandemic might lead to a different economy because of
long-lasting behavioural changes.
As the EU emerges from the COVID-19 recession, important policy choices need to be
made to prevent unnecessary long-term damage, facilitate the necessary sectoral realloca-
tion, address the inequality effects of the pandemic and ensure a sustainable recovery. We
analyse these choices in section 4.
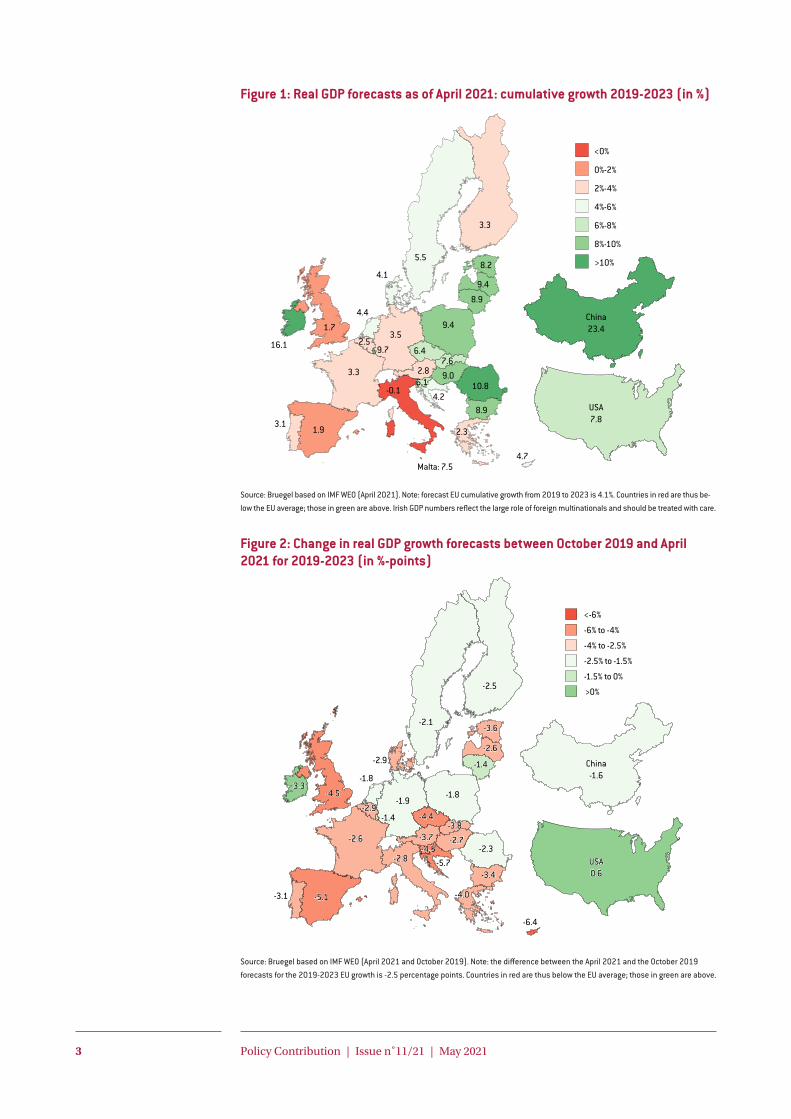
2 EU divergenceAccording to current forecasts, from 2019-2023, the EU economy is set to underperform rela-
tive to that of the United States and China. There will also be divergence within the EU. Figure
1 shows expected cumulative growth over this period, highlighting the economic underper-
formance of large parts of the EU relative to the US and China, and the underperformance of
countries in the Mediterranean and of the United Kingdom.
The pandemic has been one of the main drivers of this underperformance. Figure 2 shows
that growth forecasts for the period 2019-2023 have been strongly revised downward in some
countries in the south of Europe, in the Czech Republic and in the UK during the pandemic,
while forecasts for 2023 for the US and Ireland have actually improved compared to pre-crisis
forecasts.
1 Based on a comparison of the April 2021 and the October 2019 IMF World Economic Outlook forecasts (IMF, 2021).
2 There are different dates for the return to pre-pandemic level of output depending on whether we use annual or
quarterly data. In this Policy Contribution, we mostly rely on the April 2021 IMF forecast of annual data, because
that is available up to 2026, while the May 2021 European Commission forecast is available only up to 2022. For
2021-2022, European Commission forecasts are slightly more optimistic than those of the IMF, yet the Commission
forecasts reflect similar cross-country differences as the IMF forecasts. The Commission also presents quarterly
forecasts. For Italy, the Commission’s quarterly forecast suggests that output will return to its pre-pandemic level
by the end of 2022, yet the Commission’s annual forecast indicates that Italian GDP in 2022 will not yet reach the
annual 2019 value.
3 Policy Contribution | Issue n˚11/21 | May 2021
Figure 1: Real GDP forecasts as of April 2021: cumulative growth 2019-2023 (in %)
Source: Bruegel based on IMF WEO (April 2021). Note: forecast EU cumulative growth from 2019 to 2023 is 4.1%. Countries in red are thus be-low the EU average; those in green are above. Irish GDP numbers reflect the large role of foreign multinationals and should be treated with care.
Figure 2: Change in real GDP growth forecasts between October 2019 and April 2021 for 2019-2023 (in %-points)
Source: Bruegel based on IMF WEO (April 2021 and October 2019). Note: the difference between the April 2021 and the October 2019 forecasts for the 2019-2023 EU growth is -2.5 percentage points. Countries in red are thus below the EU average; those in green are above.
3.3
8.2
9.4
8.9
3.18.9
10.8
9.4
6.47.6
6.19.0
4.2
3.5
9.7
3.3
1.9
-0.1
2.8
2.5
4.4
4.1
1.7
16.1
2.3
4.7
5.5
<0%
0%-2%
2%-4%
4%-6%
6%-8%
8%-10%
>10%
USA7.8
China23.4
Malta: 7.5
-2.5
USA0.6
China-1.6
-3.6
-2.6
-1.4
-1.8
-4.4-3.8
-4.5-2.7
-5.7
-1.9
-1.4
-2.6
-5.1-3.1
-2.8
-3.7
-2.9
-1.8
-2.9
-4.53.3
-4.0
-3.4
-2.3
-6.4
-2.1
<-6
-6<x<-4
-4<x<-2.5
-2.5<x<-1.5
-1.5<x<0
>0-2.5
USA0.6
China-1.6
-3.6
-2.6
-1.4
-1.8
-4.4-3.8
-4.5-2.7
-5.7
-1.9
-1.4
-2.6
-5.1-3.1
-2.8
-3.7
-2.9
-1.8
-2.9
-4.53.3
-4.0
-3.4
-2.3
-6.4
-2.1
<-6%
-6% to -4%
-4% to -2.5%
-2.5% to -1.5%
-1.5% to 0%
>0%

4 Policy Contribution | Issue n˚11/21 | May 2021
Multiple factors can explain this picture. Sapir (2020) suggested that the differential
impact of the pandemic on economic performance can be explained by the strictness of the
lockdowns necessary to contain the pandemic, the size of countries’ tourism sectors and the
overall quality of their governance.
Clear sectoral divergences can be seen, with the tourism sector and the services sector
more broadly particularly affected. Figure 3 shows the stark differences between sectors. It
also shows that most sectors were able to reorganise so that, compared to the first lockdown,
the second lockdown in the fourth quarter of 2020 affected them either much less or not at all.
The most important exceptions are arts and entertainment, trade, travel and accommodation-
related businesses.
Figure 3: Gross value added in selected sectors, EU27, 2019Q1=100
Source: Bruegel based on Eurostat’s ‘Gross value added and income A*10 industry breakdowns [namq_10_a10]’ dataset. Note: chain-linked volumes, seasonally adjusted.
Travel has been particularly hard hit and its future prospects remain unclear. The number
of EU flights remains more than 70 percent down compared to their 2019 levels (Figure 4).
However, strong effects in some sectors have not yet resulted in an increase in corporate
insolvencies. Unlike the Great Financial Crisis, the current ‘great lockdown’ has in fact
been associated with falling numbers of insolvencies (Figure 5). The data suggests that
extraordinary fiscal support measures, both in terms of liquidity and capital (Anderson
et al, 2021), combined with decisions to suspend and relax some insolvency notification
requirements, are the main reasons for the falling rates. The European Systemic Risk Board
(2021) warns of the big threat of a wave of insolvencies (ESRB 2021) as current measures and
support are phased out.
Information and communication
Real estate activities
Public administration, defence,education, health, social work
Financial and insurance activities
Agriculture, forestry, fishing
Construction
Manufacturing
Professional, scientific, technical,administrative activities
Trade, transport, accommodation,food service
Arts, entertainment, recreation,other services
90
95
100
105
2019
Q1
2019
Q2
2019
Q3
2019
Q4
2020
Q1
2020
Q2
2020
Q3
2020
Q4
Less-affected sectors
70
75
80
85
90
95
100
105
2019
Q1
2019
Q2
2019
Q3
2019
Q4
2020
Q1
2020
Q2
2020
Q3
2020
Q4
Strongly affected sectors

5 Policy Contribution | Issue n˚11/21 | May 2021
Figure 4: Commercial air flights in the EU, % change vs same month in 2019
Source: Bruegel based on Eurostat.
Figure 5: Business insolvency filings during the Great Financial Crisis and the COVID-19 crisis (x axis = quarters before/since the start of the recession)
Source: Bruegel based on Banque de France and Insee, UK Insolvency Service, Statistisches Bundesamt and Instituto Nacional de Estadística. Note: Data is indexed to pre-recession quarter = 100. French data seasonally adjusted. No data for Northern Ireland available before 2009Q4.
Other significant intra-EU divergence can be seen in the labour market, with the young
and the less-educated particularly affected (Figures 6, 7 and 8). Generally, highly-educated
people have done well while at the lower end, there have been substantial employment
losses. Moreover, the young have been disproportionally affected compared to older workers.
There have even been increases in employment for those aged 55-65 (Grzegorczyk and Wolff,
2021). Low-qualified women appear to have suffered more than men (probably reflecting that
they work in high-contact services that were strongly affected by lockdowns), while women
aged 25-65 have been doing better in the labour market than men.
-100
-80
-60
-40
-20
0
20
2020
M01
2020
M02
2020
M03
2020
M04
2020
M05
2020
M06
2020
M07
2020
M08
2020
M09
2020
M10
2020
M11
2020
M12
2021
M01
2021
M02
2021
M03
0
50
100
150
200
250
-8 -7 -6 -5 -4 -3 -2 -1 0 1 2 3 4 5 6 7 8
France, Great LockdownFrance, Global Financial CrisisUSA, Great LockdownUSA, Global Financial Crisis
UK, Great LockdownUK, Global financial crisisGermany, Great LockdownGermany, Global Financial Crisis
Spain, Great LockdownSpain, Global Financial Crisis

6 Policy Contribution | Issue n˚11/21 | May 2021
Figure 6: Employment by educational level, 2019Q1=100
Source: Bruegel based on Eurostat’s ‘Employment by sex, occupation and educational attainment level (1 000) [lfsq_egised]’ dataset, and ILO’s ‘Employment by sex, age and education (thousands)’ dataset. Note: values are seasonally adjusted. The EU and US panels have different scales.
Figure 7: EU employment by educational level and gender, 2019Q1=100
Source: Bruegel based on Eurostat’s ‘Employment by sex, occupation and educational attainment level (1 000) [lfsq_egised]’ dataset. Note: seasonally adjusted data.
Figure 8: EU employment by age and gender, 2019Q1=100
Source: Bruegel based on Eurostat’s ‘Employment and activity by sex and age - quarterly data [lfsi_emp_q]’ dataset. Note: seasonally adjusted data.
90
95
100
105
110
2019
Q1
2019
Q2
2019
Q3
2019
Q4
2020
Q1
2020
Q2
2020
Q3
2020
Q4
2021
Q1
65
70
75
80
85
90
95
100
105
2019
Q1
2019
Q2
2019
Q3
2019
Q4
2020
Q1
2020
Q2
2020
Q3
2020
Q4
2021
Q1
European Union United States
TotalHighMidLow
98
100
102
104
106
108
110
112
2019
Q1
2019
Q2
2019
Q3
2019
Q4
2020
Q1
2020
Q2
2020
Q3
2020
Q4
90
92
94
96
98
100
102
2019
Q1
2019
Q2
2019
Q3
2019
Q4
2020
Q1
2020
Q2
2020
Q3
2020
Q4
92
94
96
98
100
102
104
2019
Q1
2019
Q2
2019
Q3
2019
Q4
2020
Q1
2020
Q2
2020
Q3
2020
Q4
High-level education Mid-level education Low-level education
MenWomen
90
92
94
96
98
100
102
104
106From 15 to 24 years
90
92
94
96
98
100
102
104
106From 25 to 54 years
90
92
94
96
98
100
102
104
106From 55 to 64 years
MenWomen
2019
Q1
2019
Q2
2019
Q3
2019
Q4
2020
Q1
2020
Q2
2020
Q3
2020
Q4
2019
Q1
2019
Q2
2019
Q3
2019
Q4
2020
Q1
2020
Q2
2020
Q3
2020
Q4
2019
Q1
2019
Q2
2019
Q3
2019
Q4
2020
Q1
2020
Q2
2020
Q3
2020
Q4
7 Policy Contribution | Issue n˚11/21 | May 2021
Education and age correlate strongly with income and wealth and hence the labour
market effects we have described suggest a widening of income inequalities3. From a survey
of about 90 papers published in 2020-2021 on various aspects of inequality, Stantcheva
(2021) concluded that COVID-19 has exacerbated existing inequalities across income groups,
sectors, regions, gender, and between children from different backgrounds. Almeida et al
(2020) showed that in the absence of a policy response, disposable income inequality would
have increased more.
School and university closures affect the most vulnerable parts of society. A study from
the Organisation for Economic Co-operation and Development (Hanushek and Woessmann,
2020) suggested that students affected by school closures during the pandemic may
experience 3 percent lower lifetime incomes unless catch-up measures are put in place.
This, they estimate, translates into a lower long-term level of output, because of the loss in
productivity, in nations where education closures were most prominent. These numbers are
worse for certain segments of society, in particular the less educated.
3 Will there be structural shifts in our economies?
While the pandemic persists globally, some consumers may remain more cautious and
adopt different behaviour to what was normal pre-pandemic. Given the still-dramatic health
crisis at the global level and the emergence of coronavirus variants, the situation is still very
precarious. Globally, the pandemic is unlikely to be under control in 2022 and the virus may
even become endemic (Phillips, 2021). This suggests that global travel patterns will not return
to pre-pandemic levels soon and systematic screening for new variants will remain a vital
measure to safeguard the local containment of the pandemic (Hellwig et al, 2021). Even with-
in the EU, business travel is likely to remain at lower levels because of increased caution and
because of the greater efficiency of online meetings.
However, there is also some evidence that consumers want to return to old patterns as
soon as the health situation allows. Anecdotal evidence, which could indicate what a post-
COVID-19 economy will look like, is emerging from countries that have almost completed
their vaccine rollouts and have reopened earlier than the EU. One example is Israel, which
has, at the time of writing, fully vaccinated around 60 percent of its total population. In Israel,
credit-card spending has surged since the reopening in early March 2021 in particular of
restaurants, hotels and clothing stores (spending was at first above pre-pandemic levels, and
then settled to about pre-pandemic levels). This suggests that consumer behaviour will tend
to return to normal when permitted (Olai Milhøj et al, 2021).
There are good reasons to believe that long-term productivity growth will increase. Based
on a business survey in the US, the UK and five EU countries (France, Germany, Italy, Spain
and Sweden), Mischke et al (2021) estimated that there is potential for annual productivity
growth to increase by about one percentage point up to 2024.
COVID-19 has forced firms to become more efficient. Firms forced into sudden and
prolonged shutdowns have had to optimise processes, cut down costs and become more effi-
cient. Firms have had to become more innovative and to digitalise and automate as much as
possible. Maqui and Morris (2020) showed that 75 percent of firms surveyed agreed that the
pandemic had helped make their business more efficient and resilient. Nine out 10 firms had
sped up the adoption of digital technology and automation.
The average level of productivity within sectors could mechanically increase as the least
3 See numerical scenarios for income inequality increases in the EU and globally in Darvas (2021).

8 Policy Contribution | Issue n˚11/21 | May 2021
productive firms are forced to exit. This is known as the ‘cleansing effect’. Preliminary evi-
dence provides some support, for example in France, where the average level of productivity
has increased, albeit at a lower level of output (Hadjibeyli et al, 2021).
The prospect of teleworking will allow for greater flexibility, and arguably higher produc-
tivity. Maqui and Morris (2020) also found that 60 percent of surveyed respondents did not
believe that teleworking reduces productivity. Many see advantages arising from greater over-
all flexibility, less commuting time and increased connectivity. Figure 9 shows the potential
for increased teleworking by profession.
Figure 9: ‘Teleworkability’ and actual teleworking in 2018 among employees by broad occupation group, EU
Source: Sostero et al (2020). Note: ‘teleworkability’ = proportion of employees who could telework.
However, the overall net effect on productivity is uncertain. Bloom et al (2020) showed
that the efforts to deal with the pandemic have increased intermediate costs for UK firms.
They estimated that productivity reduced by up to 5 percent by the last quarter of 2020, and
they argued that the current management of the pandemic may cause a reduction of 1 per-
cent by comparison to pre-pandemic levels due to reduced time of senior management and
less R&D.
A shortening of global value chains would increase costs and reduce efficiencies. Certain
parts of production may be repatriated, reducing the length of global value chains, moti-
vated by protectionism and the desire to increase resilience. Either way, this process will see
an increase in overall costs. Arriola et al (2020) estimated that a shortening of value chains
will affect competitiveness adversely and temper productivity (OECD, 2021, found the same
based on model simulations). If and to what extent supply chains will be shortened remains,
however, uncertain.
COVID-19 may have permanently affected market structures. Companies in information
and communication technology have seen increases in their market capitalisations. This
has increased significantly their share in the S&P Index. To the extent that there is increased
concentration, there could be negative productivity effects and negative effects on economic
dynamism (Demertzis and Viegi, 2021).
0
10
20
30
40
50
60
70
80
90
Teleworkability, % of workers
Teleworking in 2018, %
Man
ager
s
Prof
essi
onal
s
Tech
nici
ans
Cler
ical
supp
ort
Serv
ice
& s
ales
Skill
ed a
gric
.,fo
rest
ry, fi
sher
y
Craf
t &re
late
d
Plan
t & m
achi
neop
erat
ors,
and
asse
mbl
ers
Elem
enta
ryoc
cupa
tions

9 Policy Contribution | Issue n˚11/21 | May 2021
4 Policy challenges aheadPolicymakers will face tremendous uncertainty in the next few years. The evolution of the
pandemic remains the biggest risk to the global outlook and policymakers need to prioritise
the health emergency. But beyond the pandemic, behavioural change among individuals,
and new work technologies and organisations may emerge. In addition, policymakers need
to factor into their policy choices major political goals such as reducing greenhouse-gas
emissions.
4.1 Fiscal policy orientationThe EU will reach pre-pandemic output levels later than the US, raising questions about
the size and composition of fiscal support. The difference in growth performance can be
explained by multiple factors, including differences in the management of the pandemic, dif-
ferent sectoral compositions, different market structures and levels of flexibility, and different
fiscal policies. The difference in fiscal support during 2020 and 2021, however, is sizeable (Fig-
ure 10), with the scale of support in the US likely playing a role in its faster economic recovery.
We advise EU policymakers not to remove fiscal support too quickly. On the contrary, we
see a justification for an additional short-term fiscal impulse in order to return to the end-
2019 level of output earlier than currently forecast. If productivity growth is higher in the
coming years thanks to the reorganisation of business processes, then more fiscal stimulus
now should not create medium-term inflationary pressures (current IMF forecasts predict
inflation in the euro area will be below 1.8 percent until 2026, which suggests there is some
slack in the economy), nor should it raise debt sustainability concerns. To boost aggregate
demand, and given the significant distributional consequences of the COVID-19 crisis and
the loss of income in some categories of the population, fiscal support could in part take the
form of targeted support to low-income households with low savings and a high propensity to
consume.
Figure 10: General government primary balance forecasts (in % of GDP)
Source: Bruegel based on May 2021 European Commission forecast. Note: the spending from Next Generation EU grants do not count as deficit of EU countries. The change in the primary balance results from both discretionary fiscal measures as well as automatic stabilisers.
Fiscal policymakers will need to move away gradually from supporting a broad set of com-
panies towards broader demand support. Not only are corporate insolvencies at historically
low levels, but the steady-state economy could look quite different to that of today. To allow
for sectoral reallocation and reorganisation within sectors, not every firm can be kept alive
-14-12-10
-8-6-4-20246
-15
-10
-5
0
5
10
2020 2021 2022
European Union United Kingdom United States
Panel A: primary balance in % of GDP Panel B: change in primary balance (% GDP)
2000
2002
2004
2006
2008
2010
2012
2014
2016
2018
2020
2022
10 Policy Contribution | Issue n˚11/21 | May 2021
forever by state support4. Fiscal policymakers should support the reallocation of productive
factors by incentivising corporate investment and supporting the retraining and re-skilling
of workers. Increasing the tax-deductibility of corporate investment, for example, would
increase corporate investment and production. Fiscal incentives to upgrade digital infrastruc-
tures faster would also boost the recovery.
The fiscal policy framework needs to be reviewed if policymakers want to achieve a rapid
green transition. Beyond necessary increases in the prices of greenhouse gas emissions, the
EU will need to increase public investment in green infrastructure that the private sector
cannot provide5. The EU has been falling behind other advanced economies in terms of
public investment since around 2012 (Figure 11). While Next Generation EU will support
public investment, EU net public investment as a share of GDP in 2022 is expected to remain
well below the UK and US values, according to the May 2021 European Commission forecast.
European fiscal rules tend to deter public investment, because investment is not privileged
in the deficit rules6. While the costs of net public investment are incurred in a specific budget
year, and therefore need to be traded-off against other spending or tax increases in order to
meet fiscal targets, the benefits of such investments accrue over several years or even dec-
ades. It is likely, therefore, that the EU’s fiscal rules have increased the short-term orientation
in member state budgets and thereby reduced public investment. A review of fiscal rules is
warranted with the aim of making them more encouraging to public green investment, for
example with some form of a green golden rule.
The EU’s landmark recovery instrument, Next Generation EU (NGEU), and in particular
the Recovery and Resilience Facility (RRF) regulation, supports a more medium-term
orientation of fiscal policy as national recovery and resilience plans focus on green and
digital transitions7. The RRF aims to address the various divergences between EU countries.
The orientation towards green and digital spending, as well as the medium-term focus of the
programme, while welcome, does not prevent short-term scarring risks in labour markets.
National fiscal support programmes targeted at those most affected remain important to
prevent scarring.
The reform components of the recovery plans are highly important. For example, Italy
plans significant reforms to the judicial system and public administration. Structural weak-
nesses have been a major factor in divergent economic performances (Sapir, 2020), and such
reforms have the potential to reinvigorate business activities.
NGEU can smooth the fiscal consolidation impacts once European fiscal rules are re-acti-
vated. If joint EU borrowing is not treated as national deficit and debt, then it will ease rules-
based fiscal adjustment needs (Darvas and Wolff, 2021; Figure 12 in the annex)8.
4 Anderson et al (2020) discussed the phases of the initial response and the phasing out of measures and their
effects.
5 For instance, this is the case for those enabling investments, such as smart grids and electric vehicles charging
infrastructure, that are necessary to unleash further private investments in renewables and electric mobility.
6 The existing ‘investment clause’ in the EU fiscal framework has a very limited scope, duration and is subject to
strict conditions.
7 Our analysis shows that on average, the green transition accounts for about 45 percent, and the digital transition
about 25 percent of the spending plans of those 14 countries that had submitted their plans by the time of writing
this paper. Note that there is some overlap between green and digital projects (ie some projects are both green and
digital).
8 The May 2021 European Commission forecast does not consider EU borrowing to finance NGEU grants as national
debt and deficit, but NGEU loans to member states are considered as national debt (Box I.2.3 of European
Commission, 2021). This suggests that the same approach might be adopted when EU fiscal rules are re-activated.
However, it is unclear whether expenditures financed by NGEU loans will also be considered as national budget
deficit. If spending financed by such loans does not benefit from special treatment in the EU fiscal framework,
borrower countries will have to reduce their non-NGEU spending to make space for spending financed by NGEU
loans, once the currently suspended fiscal rules are re-activated.

11 Policy Contribution | Issue n˚11/21 | May 2021
Figure 11: Net fixed capital formation of the general government (% GDP)
Source: Bruegel based on May 2021 AMECO. Note: European Union refers to the group of the current 27 member states. The estimated impact of Next Generation EU is incorporated in the forecast for the EU.
Overall, fiscal policymakers need to focus increasingly on how resources are spent to
improve economic performance and prevent scarring as well as on the progressivity of the
taxation system. A short-term fiscal boost on its own is not enough to overcome the identified
regional and structural divergences. Indiscriminate support for all companies may unneces-
sarily delay corporate restructuring. Good governance and administrative capacity are critical
elements that determine the effectiveness of fiscal policies. Progressive tax systems are impor-
tant in tackling income and wealth inequality and should be regularly reviewed.
4.2 Insolvency lawImproving the efficiency of insolvency procedures will be crucial for speedy and effective
recovery. Policymakers need to prepare for the wave of insolvencies that could quickly arrive
once current safeguards are lifted9. The average recovery rate from insolvency procedures in
the EU is 62 cents on the dollar, far below that of the UK (85 ct/$) or the US (81 ct/$) (World
Bank, 2020). The European Banking Authority (2020) suggested that recovery rates in Europe
might be even lower, with estimates ranging from 34 ct/$ for SMEs to 40 ct/$ for large com-
panies. Insolvency procedures in the EU also take on average twice as long as in the UK and
the US, and many frameworks in the EU favour liquidation over restructuring, thus failing to
protect remaining entrepreneurial value.
By reforming insolvency processes, policymakers can tackle critical impediments to eco-
nomic growth in the post-COVID-19 recovery. In general, the focus should be on simplifying
procedures, expanding court capacity and addressing the bureaucratic load. More specifi-
cally, ensuring that existing laws do not punish business failure excessively would strengthen
market selection by facilitating firm exit and entry (Adalet McGowan et al, 2017; Peng et al,
2010). In addition, barriers to corporate restructuring should be reduced, for example by
allowing early restructuring or creating cheaper procedures for smaller companies so they
can avoid liquidation and the ensuing loss of business value.
At EU level, policymakers should ensure the swift transposition into national legislation
9 Claeys et al (2021) provided more detail on insolvencies in the EU and the reform of insolvency regimes.
-0.5%
0.0%
0.5%
1.0%
1.5%
2.0%
1995
1996
1997
1998
1999
2000
2001
2002
2003
2004
2005
2006
2007
2008
2009
2010
2011
2012
2013
2014
2015
2016
2017
2018
2019
2020
2021
2022
European Union
United Kingdom
United States
12 Policy Contribution | Issue n˚11/21 | May 2021
and effective implementation10 of the Restructuring and Second Chance Directive (Direc-
tive (EU) 2019/1023), which aims to increase the coherence of insolvency procedures in EU
countries and would introduce targeted measures to improve their efficiency. This would
benefit the economy by promoting investment, innovation and economic growth, and would
also represent an important step towards a capital markets union, notwithstanding that these
structural changes will take time and are unlikely to have immediate effect. Obviously, the
reform of the insolvency frameworks will take time but it is an important issue to tackle.
4.3 Labour marketsCOVID-19 has had unequal labour market effects, disadvantaging the young and less educat-
ed. The green transition is expected to have divergent labour market effects, calling for target-
ed policies. Empirical research also suggests that skill requirements and education levels are
currently higher for green jobs than they are for non-green jobs (Griffin et al, 2019). Policy-
makers need to create specific programmes to support employment among the less-qualified
and the young, and to provide dedicated training opportunities11. Social policies, and in par-
ticular a strong emphasis on education and life-long learning, will have a crucial role to play
in the coming years to ensure that the benefits of the coming recovery, but also of the green
and digital transitions (which can also have detrimental distributional effects), will be shared
by all European citizens.
As teleworking becomes a more permanent feature of the EU’s labour markets, it will be
crucial to adapt social security and taxation systems in the context of the single market for
labour. Teleworking could be a major driver of productivity in the coming years and could
also be welfare enhancing and greener, for example by allowing workers to commute less. An
important question at the European level is how well social security systems are adapted to
teleworking from other EU countries. Currently, significant obstacles exist, for example when
it comes to health insurance coverage. If the EU wants to reap the benefits of an integrated EU
labour market, it will be necessary to review these approaches.
4.4 Market structuresThe EU should resist protectionist calls in the wake of the pandemic. While during the pan-
demic there have been instances of supply constraints, it would be a mistake to argue that
reliance on purely EU supply chains would have resulted in better outcomes, even in narrow
fields such as medical products. On the contrary, many of the EU’s top companies rely on
diversified global supply chains for cheap and high-quality production. While reviewing vul-
nerabilities and diversifying supplies may be advisable, a generalised protectionist stance will
likely increase prices, reduce production capacity and slow down Europe’s recovery, thereby
contributing to divergence.
Rigorous competition policy enforcement and an integrated EU market have been bene-
ficial for European convergence and growth. During the pandemic, extraordinary state sub-
sidies were provided to companies across the EU. These subsidies were warranted given the
mandatory sanitary measures. However, making state support permanent would undermine
long-term growth performance. While targeted industrial policy measures can have positive
growth effects in specific segments where market failures are particularly important, the EU
will have to find the right balance between exiting the current support measures and ensuring
market-driven growth. European industries became more concentrated already before the
pandemic, a trend that could accelerate during the pandemic. Increased vigilance to identify
market dominance in the digital and other sectors is warranted after COVID-19 to ensure
10 At the time of writing, a number of countries have requested an extension until 2022 for the transposition of the
Directive: Ireland, Italy, Latvia, the Netherlands, Portugal, Poland and Slovakia. Several more are expected to
follow (Belgium, Sweden, Finland). See: https://www.insol-europe.org/tracker-eu-directive-on-restructuring-
and-insolvency.
11 Cameron et al (2020) provided a detailed discussion in the context of the EU Just Transition Fund.

13 Policy Contribution | Issue n˚11/21 | May 2021
more innovation and competition. Finally, as concerns the single market, restrictions on the
free movement of people need to be removed as soon as there are no health-related justifi-
cations for maintaining them (rigorous testing may be necessary in light of the emergence of
variants).
Finally, deep, liquid and integrated capital markets (and in particular a higher use of
equity in corporate funding instead of debt) can help resolve debt overhangs after the pan-
demic and provide new impetus to growth. If insolvencies increase, it will be important to
relieve stressed bank balance sheets rapidly. Capital markets can play a role in this. Re-en-
ergising the EU’s capital markets union would also provide growth impetus by supporting
risk capital. In the short- to medium-term, rigorous stress testing of bank balance sheets is
advisable to detect and resolve obstacles to renewed lending activities.
ReferencesAdalet McGowan, M., D. Andrews and V. Millot (2017) ‘The Walking Dead? Zombie Firms and
Productivity Performance in OECD Countries’, OECD Working paper n° 1372, Éditions OCDE, Paris
Almeida, V., S. Barrios, M. Christl, S. De Poli, A. Tumino and W. van der Wielen (2020) ‘Households’
income and the cushioning effect of fiscal policy measures during the Great Lockdown,’ JRC Working
Papers 2020-06
Arriola, C., P. Kowalski and F. van Tongeren (2020) ‘Localising value chains in the post-COVID world
would add to the economic losses and make domestic economies more vulnerable’, VoxEU.org, 15
November, available at https://voxeu.org/article/localising-value-chains-after-covid-would-add-
economic-losses-and-make-domestic-economies-more-vulnerable
Anderson, J., F. Papadia and N. Véron (2021) ‘COVID-19 credit-support programmes in Europe’s five
largest economies’, Working Paper 03/2021, Bruegel
Anderson, J., S. Tagliapietra and G. Wolff (2020) ‘A framework for a European economic recovery after
Covid 19’, Intereconomics 55(4): 209-215
Bloom, N., P. Bunn, P. Mizen, P. Smietanka and G. Thwaites (2020) ‘The Impact of COVID19 on
Productivity’, NBER Working Paper 28233, National Bureau of Economic Research
Cameron A., G. Claeys, C. Midões and S. Tagliapietra (2020) A Just Transition Fund – How the EU budget
can help with the transition, report for the European Parliament Committee on Budgets
Claeys, G., M. Hoffmann and G. Wolff (2021) ‘Corporate insolvencies during COVID-19: keeping calm
before the storm’, Bruegel Blog, 7 January, available at https://www.bruegel.org/2021/01/corporate-
insolvencies-during-covid-19-keeping-calm-before-the-storm/
Darvas, Z. (2021) ‘The unequal inequality impact of the COVID-19 pandemic’, Working Paper 06/2021,
Bruegel.
Darvas, Zsolt and Guntram Wolff (2021), ‘The EU’s fiscal stance, its recovery fund, and how they relate to
the fiscal rules’, Bruegel Blog, 4 March, available at https://www.bruegel.org/2021/03/the-eus-fiscal-
stance-its-recovery-fund-and-how-they-relate-to-the-fiscal-rules/
Demertzis, M. and N. Viegi (2021) ‘Low interest rates in Europe and the US: one trend, two stories’, Policy
Contribution 07/2021, Bruegel
EBA (2020) Report on benchmarking of national insolvency frameworks across the EU, European Banking
Authority, available at: https://www.eba.europa.eu/eba-publishes-report-benchmarking-national-
insolvency-frameworks-across-eu
14 Policy Contribution | Issue n˚11/21 | May 2021
ESRB (2021) Prevention and management of a large number of corporate insolvencies, European
Systemic Risk Board, April, available at https://www.esrb.europa.eu/pub/pdf/reports/esrb.
report210428_PreventionAndManagementOfALargeNumberOfCorporateInsolvencies~cf33e0285f.
en.pdf
European Commission (2021) ‘Spring 2021 Economic Forecast: Rolling up sleeves’, Institutional Paper
149, available at: https://ec.europa.eu/info/business-economy-euro/economic-performance-and-
forecasts/economic-forecasts/spring-2021-economic-forecast_en
OECD (2021) ‘Global value chains: Efficiency and risks in the context of COVID-19’, OECD Policy
Responses to Coronavirus (COVID-19), OECD Publishing, Paris
Olai Milhøj M., L. Aggerstrøm Hansen and A. Thor Lundberg (2021) ‘How will the economy recover as we
get vaccinated: experiences from Israel’, Danske Bank Global Macro Research Note, 7 May
Griffin, M., E. György, K. Jakšic and F. Siebern-Thomas (2019) ‘Towards a greener future: Employment
and social impacts of climate change policies’, in European Commission, Employment and Social
Developments in Europe 2019: Sustainable growth for all: choices for the future of Social Europe,
Publications Office of the European Union
Grzegorczyk, M. and G. Wolff (2020) ‘The scarring effect of COVID-19: youth unemployment in Europe’,
Bruegel Blog, 28 November, available at https://www.bruegel.org/2020/11/the-scarring-effect-of-
covid-19-youth-unemployment-in-europe/
Hadjibeyli, B., G. Roulleau and A. Bauer (2021) ‘Live and (don’t) let die: The impact of Covid-19 and
public support on French firms’, French Treasury Working Paper 2021-2, April
Hanushek, E. and L. Woessmann (2020) ‘The Economic Impacts of Learning Losses’, OECD Education
Working Papers No. 225, OECD Publishing, Paris
Hellwig, M., V. Priesemann and G. Wolff (2021) ‘Reducing the mobility of SARS-CoV-2 variants to
safeguard containment’, Working Paper 07/2021, Bruegel
IMF (2021) World Economic Outlook, International Monetary Fund, April
Maqui, E. and R. Morris (2020) ‘The long-term effects of the pandemic: insights from a survey of leading
companies’, ECB Economic Bulletin 8/2020, available at https://www.ecb.europa.eu/pub/economic-
bulletin/focus/2021/html/ecb.ebbox202008_06~bad87fcf9b.en.html
Mischke, J., J. Woetzel, S. Smit, J. Manyika, M. Birshan, E. Windhagen, J. Schubert, S. Hieronimus, G.
Dagorret and M. Canal Noguer (2021) Will productivity and growth return after the Covid-19 crisis?
McKinsey Global Institute
Peng, M.W., Y. Yamakawa and S. Lee (2010) ‘Bankruptcy Laws and Entrepreneur– Friendliness’,
Entrepreneurship Theory and Practice 34(3): 517–530
Phillips, N. (2021) ‘The coronavirus is here to stay — here’s what that means’, Nature, 16 February,
available at https://www.nature.com/articles/d41586-021-00396-2
Sapir, A. (2020) ‘Why has COVID-19 hit different European Union economies so differently?’ Policy
Contribution 2020/18, Bruegel
Sostero M., S. Milasi, J. Hurley, E. Fernández-Macías and M. Bisello (2020) Teleworkability and the
COVID-19 crisis: a new digital divide? JRC Technical Report, available at https://ec.europa.eu/jrc/
sites/jrcsh/files/jrc121193.pdf
Stantcheva, S. (2021) ‘Inequalities in the Times of a Pandemic’, mimeo, available at https://www.
economic-policy.org/73rd-economic-policy-panel/inequalities-in-the-times-of-a-pandemic/
World Bank (2020) Doing Business 2020, available at https://www.doingbusiness.org/en/doingbusiness

15 Policy Contribution | Issue n˚11/21 | May 2021
Annex
Figure 12: Structural balance projections with and without NGEU if joint EU borrowing is not treated as national deficit (in % of GDP)
Sources: Bruegel based on European Commission structural balance estimates: Autumn 2020 AMECO dataset for 2010-2022 and May 2016 AMECO dataset for 2003-2009. Notes: For 2023-2026, we assumed 0.5% adjustment per year for Poland and 0.6% adjustment per year for the other five countries, except in 2024-2026 for Germany and in 2025-2026 for the Netherlands and Poland, by when these countries are projected to reach their 2020-2022 Medium-Term Budgetary Objectives (though these objectives could be revised in light of the recent surge in public debt). Annual NGEU grant and loan payments are from Darvas (2020). Only countries that have borrowed from SURE are assumed to borrow from NGEU. SURE = European instrument for temporary Support to mitigate Unemployment Risks in an Emergency. The orange line assumes that spending financed by NGEU grants is exempted from the budget balance, while the blue line as-sumes that NGEU grants and loans are both exempted from the budget balance. The treatment of NGEU spending in European Commission (2021) supports the assumption for NGEU grants, while there is ambiguity for NGEU loans; see footnote 8 on page 10.
Structural balance andNGEU grants and loans
Structural balancewithout NGEU
Structural balance and NGEU grants
-12
-10
-8
-6
-4
-2
0
2Spain
-9
-8
-7
-6
-5
-4
-3
-2
-1
0Poland
-5
-4
-3
-2
-1
0
1
2Netherlands
-8
-7
-6
-5
-4
-3
-2
-1
0Italy
-4-3.5
-3-2.5
-2-1.5
-1-0.5
00.5
11.5
Germany
-7
-6
-5
-4
-3
-2
-1
0France
2000
2002
2004
2006
2008
2010
2012
2014
2016
2018
2020
2022
2024
2026
2000
2002
2004
2006
2008
2010
2012
2014
2016
2018
2020
2022
2024
2026
20
00
20
02
20
04
20
06
20
08
20
10
20
12
20
14
20
16
20
18
20
20
20
22
20
24
20
26
2000
2002
2004
2006
2008
2010
2012
2014
2016
2018
2020
2022
2024
2026
20
00
20
02
20
04
20
06
20
08
20
10
20
12
20
14
20
16
20
18
20
20
20
22
20
24
20
26
2000
2002
2004
2006
2008
2010
2012
2014
2016
2018
2020
2022
2024
2026