The Great Britain Asbestos Survey 1971-2005 - Mortality of ... · Health and Safety Executive The...
62
Health and Safety Executive The Great Britain Asbestos Survey 1971-2005 Mortality of workers listed on the Great Britain Asbestosis or Mesothelioma Registers Prepared by the Health and Safety Laboratory for the Health and Safety Executive 2010 RR805 Research Report
Transcript of The Great Britain Asbestos Survey 1971-2005 - Mortality of ... · Health and Safety Executive The...

Health and Safety Executive
The Great Britain Asbestos Survey 1971-2005 Mortality of workers listed on the Great Britain Asbestosis or Mesothelioma Registers
Prepared by the Health and Safety Laboratory for the Health and Safety Executive 2010
RR805 Research Report

Health and Safety Executive
The Great Britain Asbestos Survey 1971-2005 Mortality of workers listed on the Great Britain Asbestosis or Mesothelioma Registers
Anne-Helen Harding Health and Safety Laboratory Harpur Hill Buxton Derbyshire SK17 9JN
The aim of the report was to describe the frequency of asbestosis and mesothelioma among participants of the GB Asbestos Survey, and to identify factors associated with the risk of death with these diseases.
Among the 98,912 survey participants included in the analysis, there were 15,557 deaths between 1971 and 2005. Altogether 477 asbestosis and 649 mesothelioma deaths were identified on the Asbestosis and Mesothelioma Registers respectively. The underlying cause of death was asbestosis for 116 (24%) of the asbestosis cases, and mesothelioma for 398 (64%) of the mesothelioma cases on the registers.
n The asbestos workers had significantly higher mortality than the GB population; the standardised mortality ratio for all causes of death was 142 (95% CI 139-144).
n The risk of asbestosis or mesothelioma was lower in later birth cohorts. n Asbestosis deaths peaked in the 1980s, while deaths with mesothelioma were higher during the 1990s
and 2000-2005. n The risk of asbestosis and mesothelioma increased with increasing duration of exposure, reaching a
peak at 30-39 years’ exposure. n The highest risk of asbestosis was observed 50 or more years after first occupational exposure to
asbestos, and for mesothelioma 40-59 years after first exposure. n Insulation workers, followed by stripping/removal workers, had the highest risk of asbestosis and
mesothelioma, and manufacturing workers had the lowest risk. ‘Other’ exposed workers had intermediate levels of risk.
The GB Asbestos Survey should continue to monitor the health of the asbestos workers, in order to confirm whether the occurrence of asbestos-related diseases has decreased following the implementation of regulations to control occupational exposure to asbestos.
This report and the work it describes were funded by the Health and Safety Executive (HSE). Its contents, including any opinions and/or conclusions expressed, are those of the author alone and do not necessarily reflect HSE policy.
HSE Books

© Crown copyright 2010
First published 2010
All rights reserved. No part of this publication may be reproduced, stored in a retrieval system, or transmitted in any form or by any means (electronic, mechanical, photocopying, recording or otherwise) without the prior written permission of the copyright owner.
Applications for reproduction should be made in writing to: Licensing Division, Her Majesty’s Stationery Office, St Clements House, 2-16 Colegate, Norwich NR3 1BQ or by e-mail to [email protected]
ACKNOWLEDGEMENTS
I would like to thank the staff at the Health and Safety Laboratory and the Health and Safety Executive who work on the Asbestos Survey and who helped in the preparation of this report. In particular I would like to acknowledge Paul Benson for his work on the Asbestosis and Mesothelioma Registers; and Andy Darnton for his constructive comments during the data analysis and preparation of this report. I would also like to thank the staff at the NHSCR, the occupational physicians, and the asbestos workers for their support.
ii

CONTENTS
EXECUTIVE SUMMARY................................................................................. VII
1 INTRODUCTION......................................................................................... 1
2 METHODS .................................................................................................. 4 2.1 Recruitment ............................................................................................. 4 2.2 Survey Questionnaire .............................................................................. 4 2.3 Study Population ..................................................................................... 4 2.4 Follow-up ................................................................................................. 5 2.5 Case Ascertainment ................................................................................ 5
2.5.1 Underlying cause of death ...................................................................... 5 2.5.2 Asbestosis and Mesothelioma Registers ................................................ 5
2.6 Case Definition ........................................................................................ 6 2.7 Job Classification..................................................................................... 6 2.8 Statistical methods................................................................................... 6
3 RESULTS ................................................................................................... 8 3.1 Descriptive Statistics................................................................................ 8
3.1.1 Number of deaths.................................................................................... 8 3.1.2 Cause of death........................................................................................ 8 3.1.3 Occupation listed on death certificate and survey job classification ....... 9 3.1.4 Distribution of workers, deaths and demographic characteristics ........... 9
3.2 Standardised and Proportional Mortality ratios ...................................... 10 3.3 Age-Period-Cohort Models .................................................................... 27
3.3.1 Asbestosis Register Data...................................................................... 27 3.3.2 Mesothelioma Register Data................................................................. 27
3.4 Poisson Regression Analysis ................................................................ 30 3.4.1 Asbestosis Register Data...................................................................... 30 3.4.2 Mesothelioma Register Data................................................................. 31
4 DISCUSSION............................................................................................ 40 4.1 Strengths and limitations of the study.................................................... 40 4.2 Descriptive Statistics.............................................................................. 41 4.3 Mortality Analysis................................................................................... 42 4.4 Age-Period-Cohort Models .................................................................... 42 4.5 Poisson Regression Analysis ................................................................ 43 4.6 Conclusions ........................................................................................... 44 4.7 Recommendations................................................................................. 44
5 REFERENCES.......................................................................................... 45
iii

LIST OF FIGURES
Figure 1: Asbestos supply and consumption trends (1920-2003 UK), and asbestosis and mesothelioma cases (1970-2005 GB) .............................................................. 3
Figure 8 Relative risks of asbestosis, adjusted for age and sex, estimated by Poisson
Figure 9 Relative risks of mesothelioma, adjusted for age and sex, estimated by
Figure 11 Lexis diagram showing follow-up by age and time since first occupational
Figure 2: Cumulative number of mesothelioma and asbestosis cases, by year of death (1971-2005) ................................................................................................. 11
Figure 3: Cumulative number of mesothelioma and asbestosis deaths ascertained by underlying cause of death only, by year of death (1971-2005) ............................. 11
Figure 4: Venn diagrams showing the overlap between the Asbestos Survey and Register data for (a) asbestosis (1978-2005) and (b) mesothelioma deaths (1971-2005) 12
Figure 5: Venn diagram showing the overlap between lung cancer deaths and deaths with asbestosis or mesothelioma recorded on the death certificate .......... 13
Figure 6 Asbestosis death rates per 100,000 by age and birth cohort ........................ 28 Figure 7 Mesothelioma death rates per 100,000 by age and birth cohort ................... 29
regression.............................................................................................................. 34
Poisson regression ................................................................................................ 38 Figure 10 Time-varying and time-related covariates for the survival analysis ............. 51
exposure to asbestos ............................................................................................ 52
iv

LIST OF TABLES
Table 1: International Classification of Disease Codes ................................................. 5
Table 10 Standardised and proportional mortality ratios for men and women in the
Table 17 Poisson regression analysis: unadjusted and adjusted relative risks of
Table 18 Poisson regression analysis: adjusted relative risks of asbestosis in the final
Table 19 Poisson regression analysis: unadjusted and adjusted relative risks of
Table 20 Poisson regression analysis: adjusted relative risks of mesothelioma in the
Table 2: Underlying cause of death by presence on the Asbestosis Register (1978-2005) or Mesothelioma Register (1971-2005)....................................................... 14
Table 3: Job titles listed on death certificates by the main industry sector recorded in the survey .............................................................................................................. 15
Table 4: Distribution of men, person-years at risk and deaths with asbestosis, by country of residence, period of employment, length of time in the survey, smoking status, and industrial sector (1978-2005) .............................................................. 20
Table 5: Distribution of women, person-years at risk and deaths with asbestosis, by country of residence, period of employment, length of time in the survey, smoking status, and industrial sector (1978-2005) .............................................................. 21
Table 6: Distribution of men, person-years at risk and deaths with mesothelioma, by country of residence, period of employment, length of time in the survey, smoking status, and industrial sector (1971-2005) .............................................................. 22
Table 7: Distribution of women, person-years at risk and deaths with mesothelioma, by country of residence, period of employment, length of time in the survey, smoking status, and industrial sector (1971-2005) .............................................................. 23
Table 8 Standardised and proportional mortality ratios for men and women in the Asbestos Survey (Great Britain) ............................................................................ 24
Table 9 Standardised and proportional mortality ratios for men and women in the Asbestos Survey (England and Wales) ................................................................. 25
Asbestos Survey (Scotland) .................................................................................. 26 Table 13 Age-period-cohort analysis of asbestosis mortality rates (1978-2005)......... 28 Table 16 Age-period-cohort analysis of mesothelioma mortality rates (1971-2005) ... 29
asbestosis (1971-2005) ......................................................................................... 32
multiple regression model (1978-2005) ................................................................. 35
mesothelioma (1971-2005).................................................................................... 36
final multiple regression model (1971-2005) ......................................................... 39
LIST OF APPENDICES
Appendix 1: Statistical Methods ............................................................... 47
v

vi

EXECUTIVE SUMMARY
Objectives
The aim of the report was to describe the frequency of asbestosis and mesothelioma among participants of the GB Asbestos Survey, to compare the mortality of the asbestos workers with that of the GB population on the Asbestosis and Mesothelioma Registers, and to investigate factors associated with mortality among these workers.
Main Findings
� There were 15,557 deaths between 1971 and 2005, among the 98,912 survey participants included in this analysis.
� There were 477 deaths with asbestosis recorded on the death certificate, and 649 deaths with mesothelioma recorded on the death certificate. The underlying cause of death was asbestosis for 116 (24%) of the asbestosis cases, and mesothelioma for 398 (64%) of the mesothelioma cases on the registers.
� The asbestos workers had significantly higher mortality than the GB population; the standardised mortality ratio for all causes of death was 142 (95% CI 139-144).
� Investigation of the effect of birth cohort showed that the risk of asbestosis or mesothelioma was lower in later birth cohorts.
� There was a peak in deaths with asbestosis in the 1980s, while deaths with mesothelioma were higher during the 1990s and 2000-2005.
� The risk of asbestosis and mesothelioma increased with increasing duration of exposure, reaching a peak at 30-39 years’ exposure.
� The highest risk of asbestosis was observed 50 or more years after first occupational exposure to asbestos, and for mesothelioma 40-59 years after first exposure.
� Insulation workers, followed by stripping/removal workers, had the highest risk of asbestosis and mesothelioma, and manufacturing workers had the lowest risk. “Other” exposed workers had intermediate levels of risk.
Recommendations
The GB Asbestos Survey should continue to monitor the health of the asbestos workers, in order to confirm whether the occurrence of asbestos-related diseases has decreased following the implementation of regulations to control occupational exposure to asbestos.
vii

viii
1 INTRODUCTION
The links between asbestos exposure and disease were established during the twentieth century. Asbestosis was first described as an asbestos-related disease in a medical paper in 1924, the association between asbestos exposure and lung cancer was confirmed during the 1950s, and a third asbestos-related disease, mesothelioma, was identified during the 1960s1. Other cancers, including of the larynx, stomach, bladder, kidney, colon, and rectum, and circulatory disease have also been linked with occupational exposure to asbestos2. Of these diseases, to date there is sufficient evidence only for laryngeal and gastrointestinal cancers to be classified as causally related to asbestos exposure3,4.
Although some of the health risks associated with asbestos exposure were emerging early in the twentieth century, the use of asbestos increased. Asbestos has many desirable properties, including strength, durability, flexibility, resistance to corrosion, heat and fire, and it is cheap to mine and process1. This versatility led to widespread use of asbestos in products ranging from asbestos cement, roofing and other construction materials to electrical insulation and ironing boards. Demand for asbestos rose sharply during World War II, and the construction boom following the war continued to fuel demand (Figure 1)5.
Due to the long latent period for asbestos-related disease, the scale of the health problem resulting from the widespread use of asbestos did not become apparent until the late 1960s. Regulations to control occupational exposure to asbestos for those involved in scheduled processes were introduced in 1931 (Asbestos Industry Regulations), and more general regulations setting the quantitative limit for asbestos dust exposure were implemented in 1969 (Asbestos Regulations). Since then, further legislation has prohibited the use of asbestos or new asbestos products and tightened the limits for dust exposure for those still working with asbestos materials.
Figure 1 shows the number of death certificates in Great Britain (GB) with mention of asbestosis or mesothelioma each year, from 1970-2005. The Health and Safety Executive (HSE) have compiled these data for inclusion on the Asbestosis and Mesothelioma Registers, beginning in 19686.
Figure 1 clearly shows a rise in the number of cases occurring each year since the records began, with a particularly steep rise in mesothelioma cases. A lag time in the rise of mesothelioma cases, of approximately 40 years after the rise in national asbestos consumption, is evident.
Since 1971 the Great Britain Asbestos Survey has monitored morbidity and mortality among workers covered by the regulations to control exposure to asbestos at work. Mortality among the asbestos workers has been analysed recently2. In that analysis, asbestosis and mesothelioma were determined by the underlying cause of death, and not by mention of asbestosis or mesothelioma on the death certificate. However participants in the GB Asbestos Survey who have died and have “asbestosis” or “mesothelioma” mentioned on their death certificates will be included on the Asbestosis or Mesothelioma Registers. Consequently, a better estimate of the true burden of these two diseases among the GB asbestos workers will be contained in these data. The objectives of the analysis undertaken for this report were:
� To determine asbestosis and mesothelioma frequency among participants of the GB Asbestos Survey.
1

� To analyse asbestosis and mesothelioma mortality among these asbestos workers, when asbestosis and mesothelioma were ascertained by underlying cause of death or by presence on the Asbestosis or Mesothelioma Registers.
� To investigate factors associated with mortality among these workers.
2

01920 1930 1940 1950 1960 1970 1980 1990 2000 2010
Year
Asbestos (metric tonnes x 1000) .
Apparent consumption Imports Mesothelioma Asbestosis
0
500
1000
1500
2000
2500Number of deaths
20
40
60
80
100
120
140
160
180
Apparent consumption Imports Mesothelioma Asbestosis
0 1920 1930 1940 1950 1960 1970 1980 1990 2000 2010
Year
Asbestos (metric tonnes x 1000) .
Apparent consumption Imports Mesothelioma AsbestosisApparent consumption Imports Mesothelioma AsbestosisAsbestosis
0
500
1000
1500
2000
2500 Number of deaths
20
40
60
80
100
120
140
160
180
Figure 1: Asbestos supply and consumption trends (1920-2003 UK), and asbestosis and mesothelioma cases (1970-2005 GB)
Sources: House of Commons Research Paper 99/815; HSE website 2008; USGS Worldwide Asbestos Supply and Consumption Trends from 1900 through 20037. Note: Apparent Consumption = Imports - Exports ± (Stock Change)
3

2 METHODS
The GB Asbestos Survey was established in 1970 in order to monitor the long-term morbidity and mortality among workers covered by the 1969 Asbestos Regulations. The British Medical Association Research Ethics committee gave approval for the survey.
2.1 RECRUITMENT
Starting in 1971, all employees at factories or other workplaces, which came within the scope of the Asbestos Regulations (AR) were invited to attend a voluntary medical examination, and to complete the survey questionnaire at the time of the examination8. The 1983 Asbestos Licensing Regulations (ALR) required any worker working with asbestos coating or asbestos insulation, whether in its application or removal, to attend a medical examination before starting work with asbestos and at least every two years while still in that work. These workers were also invited to participate in the survey and to complete the questionnaire. Data continued to be collected on those workers who were recruited into the survey under the 1969 AR, and who were not covered by the 1983 ALR. The 1987 Control of Asbestos at Work Regulations (CAWR) superceded the 1969 and 1983 regulations. The CAWR required all workers exposed to asbestos above a defined “action limit” to be medically examined before starting work with asbestos and at least every two years while in that work. All workers attending statutory medical examinations were invited to participate in the Asbestos Survey.
2.2 SURVEY QUESTIONNAIRE
The format of the survey questionnaire remained the same over time, although the details varied slightly. The four sections of the survey questionnaire covered personal identifiers, employment history, current employment details, and smoking history. The early questionnaires asked for a detailed employment history, but later versions only recorded dates and time relating to occupational exposure to asbestos. The early questionnaires recorded job type, but the latest versions also asked for more detailed information about exposure to asbestos, for example, the type of asbestos material worked with, and whether respiratory protective equipment was used. This more detailed information was missing for those attending a pre-employment medical examination. The information collected on smoking history remained unchanged during the survey.
2.3 STUDY POPULATION
The study population comprised all those who attended medical examinations and completed the survey questionnaire between 1971 and 2005. The eligibility criteria for inclusion in the analysis were:
� A minimum age at first examination of 14 years up to 1st September 1972, and 15 years thereafter. The minimum school leaving age was raised from 15 to 16 in 1972.
� A maximum age at first examination of 84 years.
� Valid information on date of birth, date of medical examination, and sex.
� Flagged for cancer and death registrations with the National Health Service Central Register (NHSCR) for workers in England and Wales, or the General Register Office for Scotland (GROS) for workers in Scotland.
4

2.4 FOLLOW-UP
Follow-up for workers participating in the study had two components. A worker’s job details and smoking history were updated if they attended a second or subsequent medical examination. In addition, all workers in the survey were flagged for notification of cancer and death registrations with the NHSCR or GROS2. For the period 1971-2005, 98% of all participants could be traced for follow-up at the NHSCR or GROS.
2.5 CASE ASCERTAINMENT
Two sources of information were used to identify cases of asbestosis and mesothelioma: underlying cause of death from death certificates, and presence on the Asbestosis or Mesothelioma Registers.
2.5.1 Underlying cause of death
As a result of flagging at the NHSCR and GROS, the survey office was notified of the death of any survey participants. Asbestosis and mesothelioma deaths were identified from the underlying cause of death, using the International Classification of Diseases (ICD) cause of death codes listed in Table 1. The ascertainment of deaths from asbestosis was uncomplicated since there was a specific ICD code for it throughout the survey period. Before the 10th revision, there was no specific ICD code for mesothelioma. Consequently, deaths from cancer of the peritoneum and retroperitoneum and from cancer of the pleura were assumed to be cases of mesothelioma.
Deaths occurring during the period 1971-2005, and notified by NHSCR and by GROS before December 2007 were included in the analysis.
Table 1: International Classification of Disease Codes
ICD code ICD-8 ICD-9 ICD-10 (-1978) (1979-2000) (2001-)
Asbestosis 515.2 501 J61 Mesothelioma
MN peritoneum and Retroperitoneum
MN pleura Mesothelioma
158.0-158.9
163.0 -
158.0-158.9
163.0-163.9 - C45.0-C45.9
MN: malignant neoplasm
2.5.2 Asbestosis and Mesothelioma Registers
The HSE maintains two registers of deaths from asbestos related disease in GB6. The Asbestosis Register includes all deaths where “asbestosis” is mentioned on the death certificate, and the Mesothelioma Register includes all deaths where “mesothelioma” is mentioned on the death certificate. Individuals are identified on the basis of the underlying and associated causes of
5

death codes, as well as the strings “meso”, “mesa” and “asb” within the cause of death text descriptions. When a death certificate mentions asbestosis and mesothelioma, the death is included on both registers.
Permission was granted by the ONS Caldicott Guardian to link the Asbestos Survey database with the Asbestosis and Mesothelioma Registers in order to identify survey participants listed on either of the registers. Matching individuals in the survey with those on the registers was undertaken using Microsoft Access software, and was based on matching surname, date of birth and sex. These matches were then checked manually using first name, date of death, underlying cause of death, date of medical examination, and occupation. Data were available from 1971 for the Mesothelioma Register and from 1978 for the Asbestosis Register.
2.6 CASE DEFINITION
For the purpose of the main analysis, death from asbestosis was defined by an underlying cause of death for asbestosis and/or presence on the Asbestosis Register. Similarly, death from mesothelioma was defined by an underlying cause of death for mesothelioma (Table 1) and/or presence on the Mesothelioma Register. It is important to note that these definitions are not mutually exclusive, that is, an individual may be listed on both registers, and so will be counted as an “asbestosis death” and as a “mesothelioma death”. Nor are asbestosis, mesothelioma, and other cause of death categories, such as lung cancer, mutually exclusive. It is also important to note that in this analysis an “asbestosis death” did not necessarily have asbestosis as the underlying cause of death, and similarly for a “mesothelioma death”.
2.7 JOB CLASSIFICATION
Specific information on exposure to asbestos, such as type, intensity, and cumulative amount, was not collected on the questionnaire. Instead the job classification was used as an indicator of occupational exposure. Workers who recorded more than one job type during the course of the survey were allocated to the job they had spent most time working in. If there was a tie, then they were allocated to the job that had been shown to have the higher risk of asbestos related disease in previous analysis2,8.
2.8 STATISTICAL METHODS
Standard methods for analysing cohort studies were used throughout. A more detailed description of the statistical methods employed is given in Appendix 1. Mortality among the asbestos workers was compared with the GB population using Standardised Mortality Ratios (SMR). This ratio indicated whether there was an excess of deaths (SMR > 100) among asbestos workers from a particular cause of death, or whether there were fewer deaths (SMR < 100) than expected among the asbestos workers, when compared with the GB population overall. For all causes of death and for death from lung cancer, the national mortality rates were obtained from the NHSCR (England and Wales) and from the GROS for Scotland. For asbestosis and mesothelioma deaths, the national mortality rates were calculated from the Asbestosis and Mesothelioma Registers. The SMRs were calculated by sex-specific 5-year age and calendar periods. The proportion of current smokers among the asbestos workers was approximately double that in the general population. Consequently at least some of the excess deaths based on SMRs, from for example lung cancer, could be attributable to smoking. Proportional Mortality Ratios (PMR) were also calculated so that confounding by smoking and other factors more common among the asbestos workers than in the general population, could be taken into account to some extent in the population comparison. The SMR and PMR analysis was undertaken using OCMAP software9.
6

Internal Poisson regression analysis was undertaken so that the combined effect of the possible explanatory variables, such as smoking and length of occupational exposure to asbestos, could be investigated. The Poisson regression analysis was based on person-years of follow-up. Follow-up started from the date of entry into the Asbestos Survey, i.e. the date of the first medical examination. Follow-up ended on the earlier of death, emigration from GB, or the end of the study period (31st December 2005). Exploratory analysis prior to the Poisson regression analysis examined the effect of age, period of death, and birth cohort on mortality rates.
For all analyses, “latency” was taken to be the time since first occupational exposure to asbestos. The length of exposure was calculated as the length of time from first occupational exposure to asbestos until the earlier of two years after the date of the last medical examination recorded or the study exit date. Time since last exposure was calculated as the difference between two years after the date of the last medical examination recorded and the study exit date. Two years after the last medical examination was used as the end of occupational exposure to asbestos because an individual could work for up to two years before attending another medical examination. There was missing information in the smoking status, job type and country of residence variables.
7

3 RESULTS
Detailed descriptive statistics of the cohort and a detailed mortality analysis have been reported recently2,10. The database has been updated since these analyses were undertaken. Consequently, the number of individuals and the number of deaths included in the current analysis differ to those reported previously. The analysis and results reported here focus on deaths with asbestosis and deaths with mesothelioma.
3.1 DESCRIPTIVE STATISTICS
Altogether 99,680 men and women completed 209,670 questionnaires during the period 1971 to 2005 inclusive. After exclusions for incomplete data, age outside the range 14/15 to 84 years, or not traced for flagging by the NHSCR or GROS, 98,912 men and women were included in the analysis.
3.1.1 Number of deaths
Overall, there were 15,557 deaths from all causes in the cohort. There were 477 deaths with asbestosis recorded on the death certificate and 649 deaths with mesothelioma recorded on the death certificate. Figure 2 shows the cumulative number of deaths with asbestosis and deaths with mesothelioma. Some deaths will have been counted twice on this graph since there were individuals who were listed on both registers (see section 3.1.2). The mesothelioma cases accumulated more quickly than the asbestosis cases, particularly after 1995. Figure 3 also shows the cumulative number of asbestosis and mesothelioma deaths, but these are the cases ascertained only through underlying cause of death coding. The number of mesothelioma deaths was substantially greater than the asbestosis deaths when underlying cause of death was used for case ascertainment. In both figures, mesothelioma deaths were restricted to those occurring after 1977, so that the cumulative totals would be comparable.
3.1.2 Cause of death
Figure 4 shows the overlap between the deaths recorded on the Asbestosis or Mesothelioma Registers and the asbestosis and mesothelioma deaths determined by underlying cause recorded on the Asbestos Survey database. Figure 4a indicates that the majority of asbestosis deaths (76%) were identified through the Asbestosis Register only. These were deaths where the underlying cause of death was not asbestosis. Figure 4b shows that a smaller proportion of mesothelioma deaths (36%) were identified through the Mesothelioma Register only.
Asbestosis, mesothelioma, and other cause of death categories were not mutually exclusive. Figure 5 demonstrates this for lung cancer. There were 1,877 deaths with an underlying cause of death of lung cancer. Figure 5 shows the overlap between these lung cancer deaths and the deaths with asbestosis or mesothelioma. Of the 1,877 lung cancer deaths, 169 (9%) were on the Asbestosis Register, 18 (1%) were on the Mesothelioma Register, and three (<1%) lung cancer deaths were on both registers. Ninety-one deaths were recorded on both the Asbestosis Register and the Mesothelioma Register.
Table 2 lists the underlying cause of death for the asbestosis and mesothelioma deaths included in the analysis. The deaths are categorised by whether they were on the registers. Approximately a quarter of the deaths on the Asbestosis Register had asbestosis as the underlying cause of death. Half of the deaths on the Asbestosis Register were coded to malignant neoplasms. Of these, the majority were lung cancer (89%). The remaining important underlying cause of death groups for the deaths on the Asbestosis Register were circulatory diseases (8%) and respiratory diseases (excluding asbestosis) (6%). Of the deaths appearing on the Mesothelioma Register,
8

64% had peritoneal cancer, pleural cancer or mesothelioma as the underlying cause of death. The underlying cause of death for a further 24% of deaths was cancer of “ill-defined, secondary or unspecified sites”. Smaller proportions of deaths were due to lung cancer (4%), circulatory diseases (2%), respiratory diseases (excluding asbestosis) (2%), and accidental poisoning (2%). For 60% of deaths listed on both registers, the underlying cause of death was mesothelioma, pleural or peritoneal cancer, and for 21% was cancer of “ill-defined, secondary or unspecified sites”. Only 9% of deaths listed on both registers were due to asbestosis or other respiratory diseases. Nineteen mesothelioma, pleural or peritoneal cancer deaths and 16 asbestosis deaths were not captured on either register.
Examination of trends in the cause of death coding for deaths on the Mesothelioma Register showed a reduction in the coding of deaths to “cancer of ill-defined, secondary and unspecified sites” with the introduction of the specific code for mesothelioma (C45) in ICD-10. In the 5-year periods 1991-1995 and 1996-2000 there were 58 and 57 cancers of ill-defined, secondary and unspecified sites respectively; and in 2001-2005 there was only one recorded for this cause of death. This resulted in a larger proportion of mesothelioma cases being identified through the underlying cause of death code. In the period 2001-2005, 89% of deaths on the Mesothelioma Register had the underlying cause of death code for mesothelioma (C45). In the previous two 5-year time periods, 1991-1995, and 1996-2000, only 48% and 39% respectively of deaths on the Mesothelioma Register were coded to pleural or peritoneal cancers. For the 152 deaths coded to C45 during 2001-2005, 16% were pleural mesotheliomas (C45.0), 18% were peritoneal mesotheliomas (C45.1), 6% were mesotheliomas of other sites (C45.7), and 60% were unspecified mesotheliomas (C45.9).
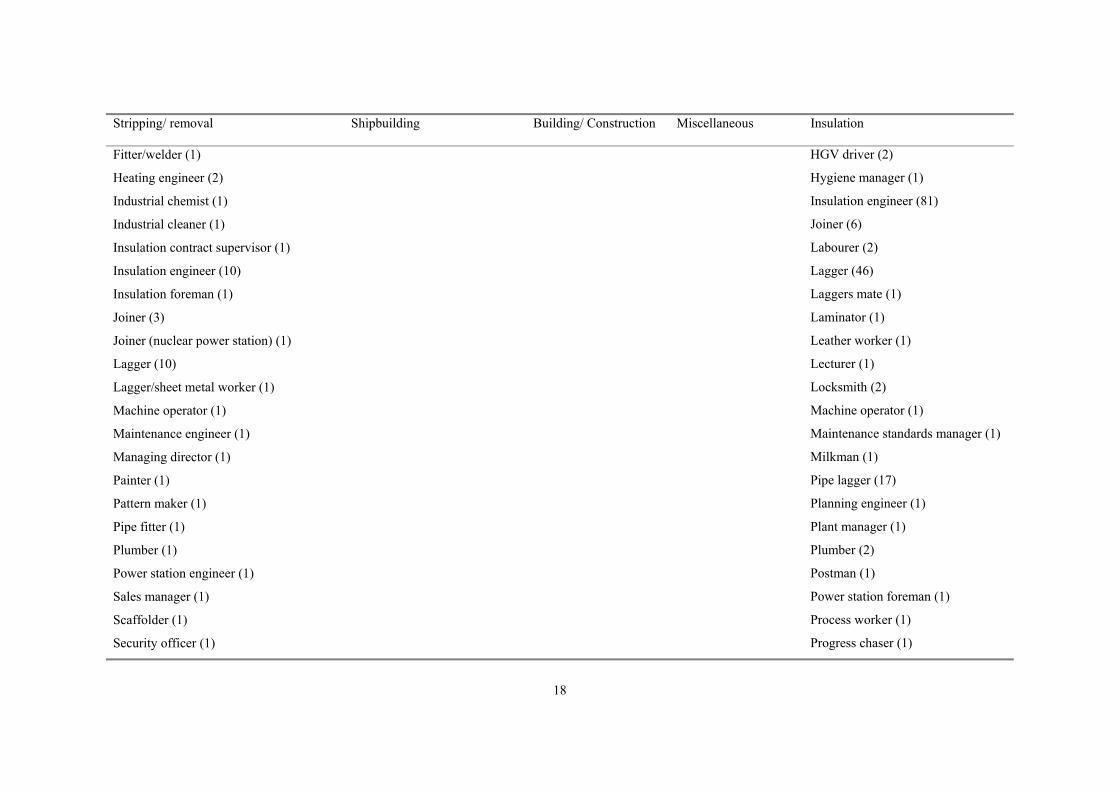
3.1.3 Occupation listed on death certificate and survey job classification
Survey participants were classified into job types and industries using job codes reported at the time of the medical examination. Death certificates record the last job the deceased person had, which may be different to the job the individual had at the time of the survey. The survey job classification and occupations on the death certificates, where available, were cross-tabulated in order to investigate the similarities and differences between them. Table 3 lists the job titles recorded on death certificates by industrial sector the individual had spent most time in during the course of the survey. There were some clear examples where the job title on the death certificate did not imply that the individual had worked in the asbestos industry. For example, occupations including postman, milkman, publican and cameraman were listed on death certificates. For the majority of individuals, the job listed did not exclude the possibility of occupational exposure to asbestos, even when asbestos was not specifically mentioned in the job title.
3.1.4 Distribution of workers, deaths and demographic characteristics
The majority of workers (95%) were based in England and Wales, and the majority of workers (95%) were male. Consequently, to avoid analyses with sparse data, only the tables showing the distribution of characteristics (Table 4 to Table 7) and summary mortality data (Table 8 to Table 10) are presented stratified by country and by sex. For men in England and Wales, the ratio of observed to expected number of asbestosis deaths was similar to that in Scotland (Table 4 and Table 5). However for mesothelioma deaths, the ratio was higher for men in Scotland than for men in England and Wales (Table 6 and Table 7). The proportion of men recruited into the survey before the implementation of the ALR in 1984 (55%) and those recruited after the ALR were implemented was relatively similar, whereas 80% of women entered the survey before 1984. A little over half of workers (57% men, 53% women) completed only one survey questionnaire. The majority of workers were current smokers (55% men, 49% women) or former smokers (20% men, 15% women) at their last recorded medical examination. More
9

3.2
women (36%) than men (25%) were never smokers. The main difference in the job categories, which men and women reported working in, was that 27% of men worked in manufacturing and 54% in stripping/removal, while 64% of women worked in manufacturing and 14% worked in stripping/removal. Approximately 5% of the cohort consisted of insulation workers. For both asbestosis and mesothelioma, the ratio of observed to expected number of deaths for insulation workers was substantially higher than for other jobs.
STANDARDISED AND PROPORTIONAL MORTALITY RATIOS
Standardised mortality ratios (SMR) were calculated by comparing the number of deaths observed in the cohort with the expected number of deaths (see section 2.8 and Appendix 1). Proportional mortality ratios (PMR) were also calculated in order to take some account of confounding by smoking and other related lifestyle variables in the population context. Due to the fact that asbestosis and mesothelioma, as defined for this analysis (section 2.6), were not necessarily the underlying cause of death, the SMRs and PMRs for asbestosis and for mesothelioma were not independent of each other and of the other causes of death (see Figure 5). The SMRs for all causes and lung cancer were included in the tables to give an indication of overall mortality among the asbestos workers.
All cause, lung cancer, asbestosis and mesothelioma mortality were significantly higher among the asbestos workers cohort than in the general population (Table 8 and Table 10). Since there were only two deaths among the female asbestos workers in Scotland, interpretation of the statistics for female deaths in Scotland should be undertaken with caution. All cause mortality was higher among men in Scotland (SMR 157, 95% CI 144-172) and women in England and Wales (SMR 155, 95% CI 145-166) than among men in England and Wales (SMR 140, 95% CI 138-143). Lung cancer mortality was higher for men in Scotland (SMR 250, PMR 155) than for men (SMR 186, PMR 128) and women (SMR 198, PMR 128) in England and Wales
The highest SMRs for asbestosis (SMR 25,398, 95% CI 12,678-45,444) and for mesothelioma (SMR 3,090, 95% CI 1,831-4,883) were observed for women in England and Wales. The SMRs for men in England and Wales and in Scotland were similar, but slightly lower for men in England and Wales (SMR asbestosis 5,032, 95% CI 4,581-5,516; SMR mesothelioma 1,305, 95% CI 1,203-1,414).
10

0 20
0 40
0 60
0 C
umul
ativ
e nu
mbe
r of c
ases
1980 1985 1990 1995 2000 2005 Year of death
Mesothelioma Asbestosis
Figure 2: Cumulative number of mesothelioma and asbestosis cases, by year of death (1971-2005)
0 10
0 20
0 30
0 40
0 C
umul
ativ
e nu
mbe
r of c
ases
1980 1985 1990 1995 2000 2005 Year of death
Mesothelioma Asbestosis
Figure 3: Cumulative number of mesothelioma and asbestosis deaths ascertained by underlying cause of death only, by year of death (1971-2005)
11

Asbestosis 14,678 97 %
361 (2 %)
100 (1 %)
16 (<1 %)
Underlying cause
% of total
Total deaths = 15,155 Asbestosis cases from Asbestosis Register Asbestosis coded by underlying cause 1978-2005
(a) Asbestosis deaths
Mesothelioma 14,908 96 %
232 (2 %)
398 (2 %)
19 (<1%)
Underlying cause
% of total
Total deaths = 15,557 Mesothelioma cases from Mesothelioma Register
Mesothelioma coded by underlying cause 1971-2005
(b) Mesothelioma deaths
Figure 4: Venn diagrams showing the overlap between the Asbestos Survey and Register data for (a) asbestosis (1978-2005) and (b) mesothelioma deaths (1971-2005)
12

Asbestosis 12,820 82%
220 (1 %)
% of total
88 (1 %)
166 1,702 (1 %)
(11 %)
3 (<1 %)
15 MN Lung (<1 %) 543
(3 %)
Mesothelioma
Total deaths = 15,557
Asbestosis Register or underlying cause of death asbestosis Mesothelioma Register or underlying cause of death mesothelioma MN of trachea, bronchus & lung defined by underlying cause of death
Figure 5: Venn diagram showing the overlap between lung cancer deaths and deaths with asbestosis or mesothelioma recorded on the death certificate
13

Table 2: Underlying cause of death by presence on the Asbestosis Register (1978-2005) or Mesothelioma Register (1971-2005)
Underlying cause of death Asbestosis Mesothelioma Asbestosis and Mesothelioma Register Register Mesothelioma or Asbestosis
Registers deaths not on either Register
Certain infectious & parasitic diseases 1 MN lip, oral cavity, & pharynx 1 MN stomach 3 1 3 MN rectum 1 1 MN liver & intrahepatic bile ducts 1 MN retroperitoneum & peritoneum 67 16 7 MN other & ill-defined sites within digestive organs & peritoneum 1 1 MN larynx 1 MN trachea, bronchus & lung 167 22 3 MN pleura 122 28 6 MN mesothelioma (C45) 135 11 6 MN bone, connective & other soft tissue 1 3 MN respiratory & intrathoracic organs 2 MN breast (female) 1 MN prostate 1 MN bladder 1 MN kidney 1 MN ill-defined, secondary & unspecified sites 8 137 19 MN lymphatic & haematopoietic tissue 1 3 Benign neoplasms 1 1 Neoplasms of uncertain behaviour or unspecified nature 2 1 Endocrine, nutritional & metabolic diseases, & immunity disorders 1 Mental disorders 1 Diseases of the circulatory system 52 12 1 Diseases of the respiratory system, excluding asbestosis 25 10 4 Asbestosis 96 4 16 Diseases of the digestive system 4 6 1 Diseases of the musculoskeletal & connective tissue 1 Diseases of the genitourinary system 1 External causes of morbidity & mortality (accidental poisoning) 2 10
14
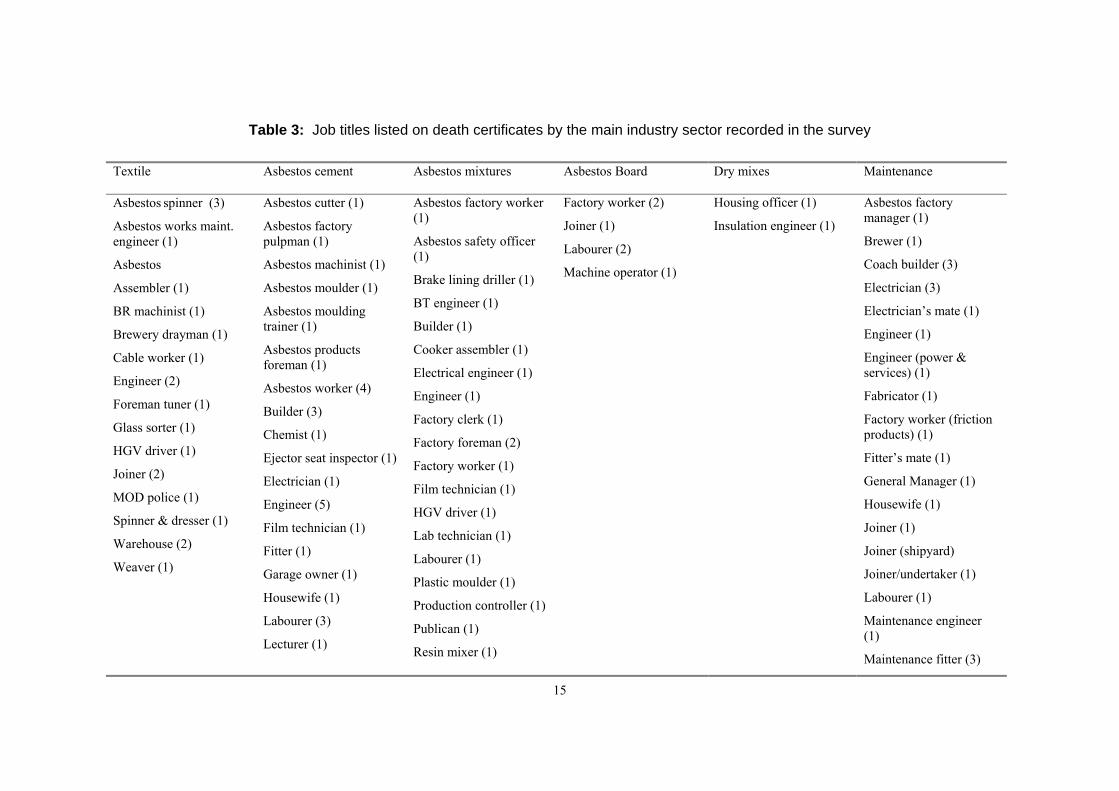
Table 3: Job titles listed on death certificates by the main industry sector recorded in the survey
Textile Asbestos cement Asbestos mixtures Asbestos Board Dry mixes Maintenance
Asbestos spinner (3)
Asbestos works maint. engineer (1)
Asbestos
Assembler (1)
Asbestos cutter (1)
Asbestos factory pulpman (1)
Asbestos machinist (1)
Asbestos moulder (1)
Asbestos factory worker (1)
Asbestos safety officer (1)
Brake lining driller (1)
Factory worker (2)
Joiner (1)
Labourer (2)
Machine operator (1)
Housing officer (1)
Insulation engineer (1)
Asbestos factory manager (1)
Brewer (1)
Coach builder (3)
Electrician (3)
BR machinist (1) Asbestos moulding BT engineer (1) Electrician’s mate (1)
Brewery drayman (1) trainer (1) Builder (1) Engineer (1)
Cable worker (1)
Engineer (2)
Asbestos products foreman (1)
Cooker assembler (1)
Electrical engineer (1) Engineer (power & services) (1)
Foreman tuner (1) Asbestos worker (4) Engineer (1) Fabricator (1)
Glass sorter (1) Builder (3)
Chemist (1) Factory clerk (1)
Factory foreman (2)
Factory worker (friction products) (1)
HGV driver (1) Ejector seat inspector (1) Factory worker (1) Fitter’s mate (1) Joiner (2) Electrician (1) Film technician (1) General Manager (1) MOD police (1) Engineer (5) HGV driver (1) Housewife (1) Spinner & dresser (1) Film technician (1) Lab technician (1) Joiner (1) Warehouse (2) Fitter (1) Labourer (1) Joiner (shipyard) Weaver (1) Garage owner (1) Plastic moulder (1) Joiner/undertaker (1)
Housewife (1) Production controller (1) Labourer (1)
Labourer (3)
Lecturer (1) Publican (1) Maintenance engineer
(1) Resin mixer (1) Maintenance fitter (3)
15

Textile Asbestos cement Asbestos mixtures Asbestos Board Dry mixes Maintenance
Machine operator (1) Technical Sales Rep (1) Mason (Naval Base) (1)
Moulding machinist (2) Tool maker (1) Painter (1)
Packer/driver (1) Vulcaniser press Painter (Naval Base) (1)
Process worker (1) operator/cureman (1) Power station foreman
Production (1)
superintendent (1) Storeman (2)
QA technician (1) Tank filler (1)
Roofer (2) Technical adviser (1)
Steeplejack/builder (1) Technical supervisor (1)
Storeman (1)
Warehouse/driver (1)
BR: British Rail; BT: British Telecom; MOD: Ministry of Defence; QA: quality assurance
16

Table 3: Job titles listed on death certificates by the main industry sector recorded in the survey (continued)
Stripping/ removal Shipbuilding Building/ Construction Miscellaneous Insulation
Asbestos & fibre glass lagger (1) Boiler maker (BR) (1) Boiler erector (1) Boiler scaler (1) Asbestos worker (1)
Asbestos extraction worker (1) Boiler maker (Naval Base) (1) Builder (1) Bench hand (1) Boiler insulator (3)
Asbestos production planner (1) Builder (1) Camera man (1) Tool maker (1) BR coach finisher (2)
Asbestos stripper (1) Electrical engineer (1) Electrical engineer (1) Housewife (1) BR coach fitter (2)
Asbestos stripper/Welder (1) Electrician (2) Insulation engineer (1) Machine operator (1) BR coach inspector (1)
Baling machine assembler (1) Fitter/turner (1) Pattern maker (1) Joiner (1) BR Electrician (1)
Boilermaker/cleaner (1) Joiner (10) Scaffolder (1) BR boiler maker (1) BR fitter (1)
BR coach repairer (1) Labourer (shipyard) (1) School cleaner (1)` Accountant (2) BR instructor (1)
BR engineering foreman (1) Lagging supervisor (1) Radial arm driller (1) Builder (1)
Brick layer (1) Marine surveyor (2) Machinist (1) Ceiling sprayer (1)
BT engineer (1) Painter (1) Coach builder (4)
Cable inspector (1) Pipe lagger (2) Coach driver (1)
Civil servant (2) Quality engineer (MOD) (1) Contracts manager (1)
Community worker (1) Ships joiner (1) Electrician (2)
Company director (2) Ships mason (1) Engineer (3)
Company director (asbestos removal) (1) Shipwright (1) Engineers assistant (1)
Construction worker (1) Suspended ceiling fixer (1) Factory manager (1)
Contracts manager (2) Factory worker (1)
Demolition worker (1) Foreman lagger (2)
Electrician (5) Garage hand (1)
Engineer (2) Harbour master (1)
17
Stripping/ removal Shipbuilding Building/ Construction Miscellaneous Insulation
Fitter/welder (1)
Heating engineer (2)
Industrial chemist (1)
Industrial cleaner (1)
Insulation contract supervisor (1)
Insulation engineer (10)
Insulation foreman (1)
Joiner (3)
Joiner (nuclear power station) (1)
Lagger (10)
Lagger/sheet metal worker (1)
Machine operator (1)
Maintenance engineer (1)
Managing director (1)
Painter (1)
Pattern maker (1)
Pipe fitter (1)
Plumber (1)
Power station engineer (1)
Sales manager (1)
Scaffolder (1)
Security officer (1)
HGV driver (2)
Hygiene manager (1)
Insulation engineer (81)
Joiner (6)
Labourer (2)
Lagger (46)
Laggers mate (1)
Laminator (1)
Leather worker (1)
Lecturer (1)
Locksmith (2)
Machine operator (1)
Maintenance standards manager (1)
Milkman (1)
Pipe lagger (17)
Planning engineer (1)
Plant manager (1)
Plumber (2)
Postman (1)
Power station foreman (1)
Process worker (1)
Progress chaser (1)
18

Stripping/ removal Shipbuilding Building/ Construction Miscellaneous Insulation
Storeman (1)
Taxi driver (1)
Technical assistant (1)
Technical supervisor (Naval dockyards) (1)
Training instructor (1)
Tunnel miner (1)
Welder (2)
Project manager (1)
Publican (1)
Rigger (1)
Sheet metal worker (2)
Shift control engineer (1)
Sterile services assistant (1)
BR: British Rail; BT: British Telecom; MOD: Ministry of Defence; QA: quality assurance
19

Table 4: Distribution of men, person-years at risk and deaths with asbestosis, by country of residence, period of employment, length of time in the survey, smoking
status, and industrial sector (1978-2005)
Number of deaths with asbestosis
Number of workers Person years at risk Observed Expected Country Great Britain 93,963 1,609,291 466 9.3 England & Wales 89,728 1,539,742 456 9.1 Scotland 4,235 69,550 10 0.2 Period of employment Pre-ALR (1984) 51,935 1,136,541 459 8.8 Post-ALR (1984) 42,028 472,750 7 0.4 Length of time in the survey One examination 53,703 843,887 202 4.0 ≥ 2 examinations 40,260 765,404 264 5.2
Smoking status Current smokers 50,134 832,069 297 4.4 Former smokers 18,313 334,702 141 3.2 Never smokers 22,830 389,054 22 1.4 Industrial sector Manufacturing 25,357 559,390 124 5.1 Textiles 2,642 61,679 8 0.4 Asb cement mixt, 3,384 78,109 19 0.7 board & pipe Asb/rubber/resin/ 5,206 112,251 12 0.9 bitumen mixtures
Asb board & 585 13,232 6 0.1 Paper Garments 81 1,680 2 0 Insulation & 197 4,368 3 0 plastering mixes Maintenance 3,801 81,788 13 0.8
Insulation workers 4,991 114,101 177 0.8 Stripping/removal 50,614 696,890 98 1.5 Other 11,971 221,081 63 1.8 Ship building, 1,921 41,750 19 0.5 repair & breaking Building & 1,621 29,080 6 0.2 Construction Miscellaneous 2,837 63,295 6 0.5
20

Table 5: Distribution of women, person-years at risk and deaths with asbestosis, by country of residence, period of employment, length of time in the survey, smoking
status, and industrial sector (1978-2005)
Number of deaths with asbestosis
Number of workers Person years at risk Observed Expected Country Great Britain 4,484 96,100 11 0 England & Wales 4,447 95,678 11 0 Scotland 37 421 0 0 Period of employment Pre-ALR (1984) 3,601 86,648 11 0 Post-ALR (1984) 883 9,452 0 0 Length of time in the survey One examination 2,394 49,375 6 0 ≥ 2 examinations 2,090 46,724 5 0
Smoking status Current smokers 2,102 46,535 6 0 Former smokers 646 13,600 3 0 Never smokers 1,571 32,127 2 0 Industrial sector Manufacturing 2,875 67,905 8 0 Textiles 625 15,326 3 0 Asb cement mixt, 345 8,182 1 0 board & pipe Asb/rubber/resin/ 642 14,480 1 0 bitumen mixtures
Asb board & 32 734 0 0 paper Garments 200 4,722 0 0 Insulation & 9 219 0 0 plastering mixes Maintenance 55 1,222 0 0
Insulation workers 173 4,183 0 0 Stripping/removal 610 6,925 1 0 Other 817 16,954 2 0 Ship building, 6 97 0 0 repair & breaking Building & 12 206 0 0 Construction Miscellaneous 475 11,160 2 0
21

Table 6: Distribution of men, person-years at risk and deaths with mesothelioma, by country of residence, period of employment, length of time in the survey, smoking
status, and industrial sector (1971-2005)
Number of deaths with mesothelioma
Number of workers Person years at risk Observed Expected Country Great Britain 94,403 1,677,102 631 47.4 England & Wales 90,166 1,607,239 601 46.1 Scotland 4,237 69,863 30 1.4 Period of employment Pre-ALR (1984) 52,375 1,204,352 608 43.5 Post-ALR (1984) 42,028 472,750 23 4.0 Length of time in the survey One examination 54,047 871,648 248 21.1 ≥ 2 examinations 40,356 805,454 383 26.3
Smoking status Current smokers 50,455 869,491 312 22.3 Former smokers 18,381 350,889 207 15.6 Never smokers 22,866 400,894 96 7.9 Industrial sector Manufacturing 26,247 632,668 195 25.0 Textiles 2,695 66,549 12 2.0 Asb cement mixt, 3,506 87,301 33 3.1 board & pipe Asb/rubber/resin/ 5,281 118,263 19 4.1 bitumen mixtures
Asb board & 590 19,982 4 0.6 paper Garments 83 1,789 0 0.1 Insulation & 198 4,713 2 0.2 plastering mixes Maintenance 3,857 86,942 33 3.8
Insulation workers 5,039 119,512 143 4.0 Stripping/removal 54,454 780,195 225 13.1 Other 8,504 143,483 68 5.2 Ship building, 1,946 45,062 26 2.1 repair & breaking Building & 1,626 30,386 8 0.9 Construction Miscellaneous 2,874 67,132 8 2.3
22

Table 7: Distribution of women, person-years at risk and deaths with mesothelioma, by country of residence, period of employment, length of time in the survey, smoking
status, and industrial sector (1971-2005)
Number of deaths with mesothelioma
Number of workers Person years at risk Observed Expected Country Great Britain 4,509 103,392 18 0.6 England & Wales 4,472 102,966 18 0.6 Scotland 37 426 0 0 Period of employment Pre-ALR (1984) 3,626 93,940 18 0.6 Post-ALR (1984) 883 9,452 0 0 Length of time in the survey One examination 2,413 52,605 7 0.3 ≥ 2 examinations 2,096 50,786 11 0.3
Smoking status Current smokers 2,120 50,424 9 0.3 Former smokers 649 14,715 3 0.1 Never smokers 1,575 34,216 6 0.2 Industrial sector Manufacturing 3,163 82,060 14 0.5 Textiles 634 16,864 4 0.1 Asb cement mixt, 350 9,182 1 0.1 board & pipe Asb/rubber/resin/ 646 15,219 3 0.1 bitumen mixtures
Asb board & 32 768 0 0 paper Garments 201 4,966 0 0 Insulation & 9 241 0 0 plastering mixes Maintenance 55 1,280 0 0
Insulation workers 173 4,408 0 0 Stripping/removal 972 14,970 4 0 Other 197 1,924 0 0 Ship building, 6 98 0 0 repair & breaking Building & 12 216 0 0 Construction Miscellaneous 480 11,805 2 0.1
23

Table 8 Standardised and proportional mortality ratios for men and women in the Asbestos Survey (Great Britain)
Cause of death Observed Expected Standardised Mortality Proportional Mortality number of number of Ratio (95% CI) Ratio (95% CI)
deaths deaths
Great Britain: Men and Women
All causes 15,557 10,978.3 141.7 (139.5, 143.9) 100
MN lung 1,886 1,004.9 187.7 (179.3, 196.3) 128.3 (123.0, 133.9)
Asbestosis† 477 9.3 5,127.1 (4677, 5609) 3,356.6 (3174, 3550)
Mesothelioma‡ 649 48.0 1,351.7 (1250, 1460) 912.9 (857.2, 972.4)
Great Britain: Men
All causes 14,677 10,411.9 140.9 (138.7-143.2) 100
MN lung 1,802 963.1 187.1 (178.6-196.0) 128.3 (122.8, 134.0)
Asbestosis† 456 9.1 5,032.4 (4581, 5516) 3,289.2 (3105, 3484)
Mesothelioma‡ 631 47.4 1,330.4 (1229, 14384) 885.7 (829.3, 946.0)
Great Britain: Women
All causes 880 566.4 155.4 (145.3-166.0) 100
MN lung 84 41.9 200.6 (160.0-248.4) 129.1 (105.2, 158.4)
Asbestosis† 11 0 25,398 (12678, 45444) 16,364.4 (13043, 20531)
Mesothelioma‡ 18 0.6 3,086.3 (1829, 4878) 1943.1 (1400, 2696)
† Asbestosis cases ascertained through the Register and underlying cause of death, 1978-2005 ‡ Mesothelioma cases ascertained through the Register and underlying cause of death
24

Table 9 Standardised and proportional mortality ratios for men and women in the Asbestos Survey (England and Wales)
Cause of death Observed Expected Standardised Mortality Proportional Mortality number of number of Ratio (95% CI) Ratio (95% CI)
deaths deaths (SMR)
England and Wales: Men and Women
All causes 15,086 10,679.4 141.2 (139.0, 143.5) 100
MN lung 1,825 980.8 186.1 (177.6, 194.8) 127.6 (122.2, 133.2)
Asbestosis† 467 9.1 5,155.8 (4662, 5602) 3,346.8 (3162, 3542)
Mesothelioma‡ 619 46.6 1,327.2 (1225, 1436) 900.0 (843.6, 960.1)
England and Wales: Men
All causes 14,208 10,113.8 140.5 (138.2, 142.8) 100
MN lung 1,742 939 185.7 (176.9, 194.4) 127.7 (122.2, 133.5)
Asbestosis† 456 9.1 5,032.4 (4581, 5516) 3,289.2 (3105, 3484)
Mesothelioma‡ 601 46.1 1,304.9 (1203, 1414) 885.7 (829.3, 946.0)
England and Wales: Women
All causes 878 565.6 155.2 (145.1, 165.9) 100
MN lung 83 41.8 198.5 (158.1, 246.1) 127.9 (104.2, 157.2)
Asbestosis† 11 0 25,398 (12678, 45444) 16,364.4 (13043, 20531)
Mesothelioma‡ 18 0.6 3,089.7 (1831, 4883) 1943.1 (1400, 2696)
† Asbestosis cases ascertained through the Register and underlying cause of death, 1978-2005 ‡ Mesothelioma cases ascertained through the Register and underlying cause of death
25

Table 10 Standardised and proportional mortality ratios for men and women in the Asbestos Survey (Scotland)
Cause of death Observed Expected Standardised Mortality Proportional Mortality number of number of Ratio (95% CI) Ratio (95% CI)
deaths deaths (SMR)
Scotland: Men and Women
All causes 471 298.9 157.6 (143.7, 172.5) 100
MN lung 61 24.1 253.1 (193.6, 325.1) 156.8 (123.9, 198.5)
Asbestosis† 10 0.2 5,716.9 (2741, 10513) 3,885.6 (2675, 5644)
Mesothelioma‡ 30 1.4 2,185.5 (1474, 3120) 1,299.5 (987.2, 1711)
Scotland: Men
All causes 469 298.0 157.4 (143.5, 172.3) 100
MN lung 60 24.0 249.6 (190.5, 321.3) 155.1 (122.3, 196.7)
Asbestosis† 10 0.2 5,734.9 (2750, 10546) 3,890.6 (2679, 5651)
Mesothelioma‡ 30 1.4 2,186.5 (1475, 3121) 1,300.9 (988.3, 1712)
Scotland: Women
All causes 2 0.8 255.9 (31.0, 924.3) 100
MN lung 1 0.1 1,745.2 (43.6, 9724) 466.4 (86.9, 2502.9)
† Asbestosis cases ascertained through the Register and underlying cause of death, 1978-2005 ‡ Mesothelioma cases ascertained through the Register and underlying cause of death
26

3.3 AGE-PERIOD-COHORT MODELS
In this section, age-period-cohort models for asbestosis and mesothelioma mortality are reported. These models investigate change in mortality rates over time and whether there are differences in rates by age, by year of death (period effect), and by year of birth (birth cohort or cohort effect). Age-period-cohort effects were investigated graphically, and using Poisson regression analysis. Age, period and cohort variables were entered into the Poisson regression model according to the hierarchy of models proposed by Clayton & Schifflers11 (see Appendix 1).
3.3.1 Asbestosis Register Data
There were no deaths with asbestosis before the age of 40 years or among those born after 1955. Figure 6 shows cohort specific mortality rates plotted on a logarithmic scale against age at death. Logarithmic scaling accentuates differences at lower rates and plays down differences at higher rates. Mortality rates increased with age, and except for the cohort born before 1920, mortality rates tended to be higher in the earlier birth cohorts than the latest cohort born in the 1950s.
Poisson regression age-period-cohort modelling using 10-year bands, indicated that age, a linear term for trend (drift), and non-linear terms for both period and cohort effects were significant in explaining the mortality rates (see Appendix 1 and Table 11). The model indicated that after adjusting for age and period, there was a steady decline in the relative risk of asbestosis cases in successive birth cohorts. Adjusted for age and period, there was a significant increase in the relative risk of asbestosis during the 1980s compared with the 1970s; the relative risk was 170% higher during the 1980s and 40% higher during the 1990s than during the 1970s.
3.3.2 Mesothelioma Register Data
There were no mesothelioma deaths before the age of 35 years or among those born after 1965. Figure 7 shows the cohort-specific rates by age. The plot clearly shows the increase in mortality with increase in age, and that mortality rates were generally quite stable over time. Mortality rates were a little lower in the 1950s birth cohort than in earlier cohorts. There were negligible differences between those born 1920 to 1949. Among those born before 1920, the mortality rate for 50-59 year olds was lower than in all other cohorts.
Poisson regression age-period-cohort modelling using 10-year bands, showed that age and a linear term for trend (drift) were statistically significant, and a non-linear term for period was marginally significant (Table 12). After adjusting for age and cohort, the relative risk was 77% higher in the 1990s than in the 1970s, and 72% higher in 2000-2005 than in the 1970s.
27

0
1
10
100
1000
<20 20- 30- 40- 50- 60- 70-
Age at death
Rat
e pe
r 100
,000
<1920 1920- 1930- 1940- 1950- 1960- 1970-
Note: Rates are plotted on the log scale
Figure 6 Asbestosis death rates per 100,000 by age and birth cohort
Table 11 Age-period-cohort analysis of asbestosis mortality rates (1978-2005)
Variable Cases Adjusted 95% CI Significance relative risk
Age (10-year bands) 477 1.04 1.02-1.06 <0.001 Birth cohort <0.001
<1920 111 1.00 1920- 210 0.80 0.61-1.05 1930- 119 0.42 0.28-0.63 1940- 33 0.11 0.06-0.21 1950- 4 0.017 0.005-0.06 1960- 0 -1970- 0 -
Period (linear effect) 477 1.05 1.03-1.07 <0.001 Period (non-linear effect) <0.001
1970- 14 1.00 1980- 177 2.73 1.81-4.13 1990- 176 1.43 1.09-1.88
2000- 110 Level dropped due to collinearity
28

0
1
10
100
1000
<20 20- 30- 40- 50- 60- 70-
Age at death
Rat
e pe
r 100
,000
<1920 1920- 1930- 1940- 1950- 1960- 1970-
Note: Rates are plotted on the log scale
Figure 7 Mesothelioma death rates per 100,000 by age and birth cohort
Table 12 Age-period-cohort analysis of mesothelioma mortality rates (1971-2005)
Variable Cases Adjusted 95% CI Significance relative risk
Age (10-year bands) 649 1.06 1.04-1.08 <0.001 Birth cohort (linear effect) 649 0.81 0.70-0.95 0.007 Period (non-linear effect) 0.082
1970- 27 1.00 -1980- 143 1.46 0.95-2.24 1990- 279 1.77 1.11-2.83
2000- 200 1.72 1.00-2.95
29

3.4 POISSON REGRESSION ANALYSIS
In the following section, the results of the Poisson regression analysis are reported. This analysis examined the combined effect of the various factors that may affect mortality, including smoking status, main job type, the number of medical examinations an individual had in the survey, whether an individual joined the survey pre- or post-ALR, and the time-related variables year of first exposure, age at first exposure, duration of exposure, time since last exposure, latent period, and age. The variable ‘number of medical examinations an individual had in the survey’ was used to indicate whether a worker was a short-term or a longer-term asbestos worker. The dependency between the time-related variables meant that they could not all be included in the model simultaneously (see Appendix 1).
3.4.1 Asbestosis Register Data
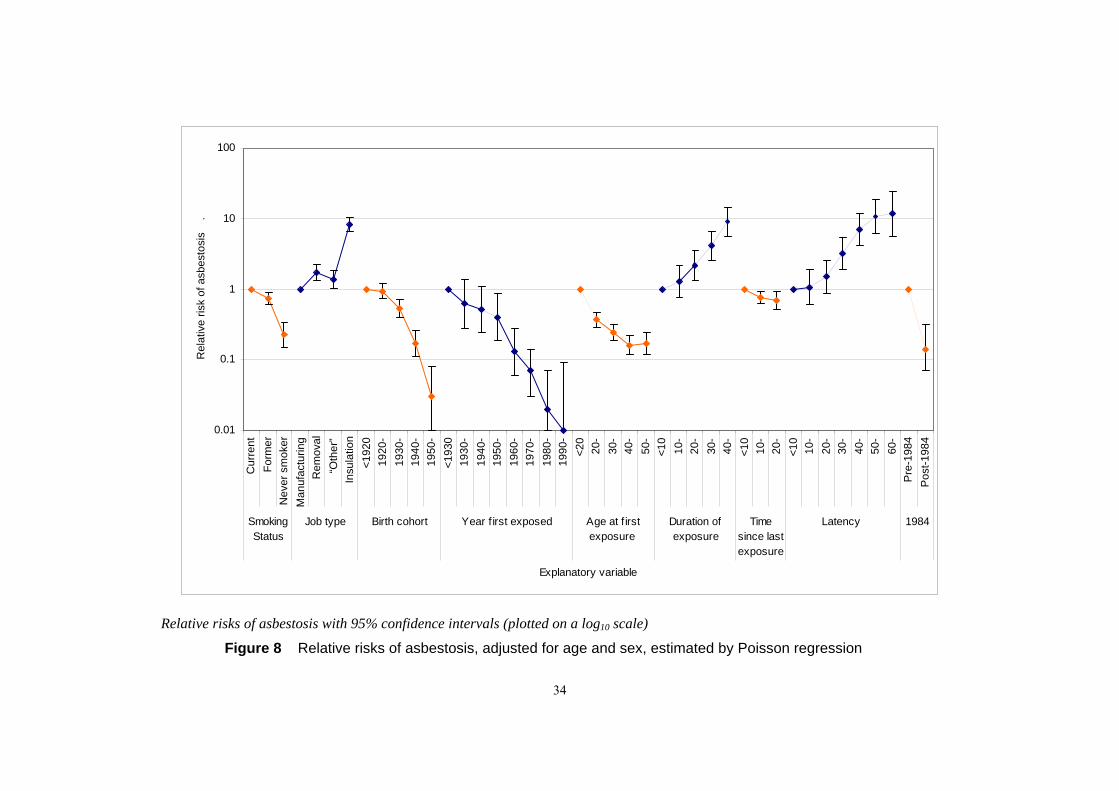
The results for the Poisson regression analysis of asbestosis mortality are given in Table 13 and Table 14, and are illustrated in Figure 8. In unadjusted analysis, all the potential explanatory variables were significantly associated with asbestosis mortality (Table 13). In analysis adjusted for sex and age, the effects on mortality of year of first exposure, duration of exposure, latency, and number of medical examinations attended were attenuated but remained statistically highly significant. The effects of age at first exposure and time since last exposure, and of the former smoker and stripping/removal worker categories were modified in the adjusted analysis.
The relative risk of mortality, adjusted for sex and age, for each of the possible explanatory variables is shown in Figure 9. The relationship between age and mortality was non-linear; consequently linear, quadratic, and cubic terms for age were fitted in these models. There were inverse associations between mortality and year first exposed, age at first exposure, and time since last exposure, while duration of exposure and latency were positively associated with mortality. At 50 years’ latency, the relative risk of asbestosis stopped increasing and levelled off. The relative risk of asbestosis decreased across the smoking status categories from current to former to non-smokers, and the relative risk increased across the job types from manufacturing to ‘other’ and stripping/removal to insulation workers. Workers who first attended a medical examination before the implementation of the ALR had higher mortality than those who first attended post-ALR. Adjusted for sex and age, the number of medical examinations attended, an indicator of time spent in the asbestos industry, was not significantly associated with mortality.
The final multiple regression model, which tested the potential explanatory factors in the model simultaneously, is shown in Table 14. The variables retained in the final model made a statistically significant contribution, with p ≤ 0.05, in the presence of the other variables in the model, and did not affect the coefficients or standard errors of the other variables in the model. The number of medical examinations attended, whether the first medical was pre- or post-ALR, duration of exposure, time since last exposure and latency were not statistically significant in this model; none of these time-varying variables made a significant contribution to the model in the presence of year of first exposure. The variables age, sex, smoking status, main job, birth cohort, and year first exposed were statistically significant in this model. Age at first exposure and period of death were also statistically significant in this model, but were not retained in the final model because their effects were reversed when included in the same model as year first exposed. Year first exposed explained most of the effects of the other time-related variables.
30

3.4.2 Mesothelioma Register Data
The Poisson regression analysis results are summarised in Table 15 and Table 16, and illustrated in Figure 9. All the potential explanatory variables were significantly associated with mesothelioma mortality in unadjusted analysis (Table 15). The relationship between age and mortality was non-linear, so that linear and quadratic terms for age were included in all models adjusted for age. In analysis adjusted for age and sex, smoking status at the last medical examination and time since last exposure were no longer statistically significant, while the associations between mortality and year of first exposure, duration of exposure, latency, the number of medical examinations attended, and whether the first medical was pre- or post-ALR were attenuated but remained statistically significant. The association between mortality and the stripping/removal category of job type was modified in the age and sex adjusted analysis.
The results from the sex and age adjusted analysis are illustrated in Figure 9. The relative risk of mesothelioma mortality increased across the job type categories from manufacturing to ‘other’ exposed and stripping/removal workers to insulation workers. The relative risk of mesothelioma was lower for those first exposed to asbestos after 1960 than for those first exposed before 1960. Age at first exposure was inversely related to mortality, while duration of exposure and latency were positively related to mortality. The relative risk peaked at 40-59 years’ latency and then declined. The relative risk of mortality was lower for individuals who first attended a medical examination post-ALR than for individuals who first attended pre-ALR.
Table 16 gives the results of the final multiple regression model, which included variables that made a statistically significant contribution to explaining mesothelioma mortality in the presence of the other variables in the model. Smoking status, the number of medical exams attended, whether the first medical was pre- or post-ALR, period of death, and time since last exposure were not statistically significant in the final model. Age first exposed and duration of exposure were statistically significant in this model, but their effects were reversed in the presence of the other time related variables; consequently, age first exposed and duration of exposure were not retained in the model. The final model included age, sex, main job, birth cohort, and latency.
31

Table 13 Poisson regression analysis: unadjusted and adjusted relative risks of asbestosis (1971-2005)
Variable Cases Relative 95% CI LR test† Adjusted 95% CI LR test†
Risk (df) Relative (df) Risk‡
Smoking status 140 (2) 1040 (6) Current smoker 303 1.00 1.00 Former smokers 144 1.20 0.98-1.46 0.73 0.60-0.90 Never smoker 24 0.17 0.11-0.25 0.23 0.15-0.34 Job type 372 (3) 1292 (7) Manufacturing 132 1.00 1.00 Stripping/removal 99 0.72 0.55-0.93 1.72 1.32-2.24
“Other” 65 1.32 0.98-1.78 1.37 1.02-1.85 Insulation worker 177 7.34 5.86-9.20 8.22 6.56-10.3 Cohort 955 (6) 1094 (10)
<1920 111 1.00 1.00 1920- 210 0.74 0.59-0.94 0.89 0.71-1.13 1930- 119 0.29 0.23-0.38 0.50 0.38-0.67 1940- 33 0.06 0.04-0.09 0.18 0.12-0.28 1950- 4 0.006 0.002-0.02 0.05 0.02-0.15 1960- 0 - - -1970- 0 - - -
Period 39 (3) 1057 (7) 1970- 14 1.00 1.00 1980- 177 3.63 2.11-6.26 2.88 1.67-4.98 1990- 176 2.43 1.41-4.18 1.48 0.85-2.55 2000- 110 2.24 1.29-3.91 1.04 0.60-1.83
Year of first exposure 1051 (7) 1352 (11) <1930 7 1.00 1.00 1930- 55 0.57 0.26-1.25 0.62 0.28-1.37 1940- 110 0.40 0.19-0.87 0.51 0.24-1.10 1950- 162 0.25 0.12-0.53 0.40 0.19-0.86 1960- 80 0.05 0.03-0.12 0.13 0.06-0.28 1970- 53 0.02 0.008-0.04 0.07 0.03-0.14 1980- 9 0.004 0.001-0.01 0.03 0.01-0.07 1990- 1 0.001 0.0001-0.01 0.01 0.001-0.09
Age at first exposure (years) 99 (4) 1206 (8) <20 188 1.00 1.00 20- 111 0.35 0.27-0.44 0.37 0.29-0.47 30- 81 0.48 0.37-0.62 0.24 0.19-0.32 40- 56 0.61 0.45-0.82 0.16 0.12-0.22 50- 41 1.11 0.79-1.56 0.17 0.12-0.24
Duration of exposure (years) 930 (4) 1198 (8) <10 47 1.00 1.00 10- 90 2.89 2.12-4.29 1.29 0.76-2.18 20- 122 8.72 6.27-12.3 2.17 1.34-3.55 30- 198 25.4 20.0-37.7 4.06 2.51-6.57 40- 20 79.3 0.20-0.58 8.87 5.46-14.4
Time since last exposure (years) 56 (3) 991 (7) <10 249 1.00 1.00 10- 170 1.84 1.51-2.23 0.76 0.62-0.93 20- 58 2.41 1.81-3.21 0.68 0.51-0.92 30- 0 - -
Latency (years) 988 (6) 1235 (10) <10 17 1.00 1.00 10- 39 2.30 1.30-4.06 1.06 0.60-1.88 20- 68 5.90 3.47-10.0 1.49 0.87-2.55 30- 115 20.0 12.0-33.3 3.19 1.90-5.36 40- 143 59.5 36.0-98.3 6.95 4.12-11.7 50- 79 108 64.0-182 10.7 6.13-18.7 60- 16 121 61.4-240 11.6 5.61-23.8
32

Variable Cases Relative 95% CI LR test† Adjusted 95% CI LR test†
Risk (df) Relative (df) Risk‡
Number of medical examinations 13 (1) 980 (5) 1 medical 208 1.00 1.00 ≥ 2 medicals 269 1.40 1.16-1.67 1.07 0.89-1.28
First medical pre- or post-ALR 242 (1) 1030 (5) Pre-ALR 470 1.00 1.00 Post-ALR 7 0.04 0.02-0.08 0.14 0.07-0.31
† Model likelihood ratio chi-squared value and degrees of freedom‡ Adjusted for age attained and sex. Linear, quadratic and cubic terms were fitted for age.
33
0.01
0.1
1
10
100
Cur
rent
Form
erN
ever
sm
oker
Man
ufac
turin
gR
emov
al“O
ther
”In
sula
tion
<192
019
20-
1930
-19
40-
1950
-<1
930
1930
-19
40-
1950
-19
60-
1970
-19
80-
1990
-<2
020
-30
-40
-50
-<1
010
-20
-30
-40
-<1
010
-20
-<1
010
-20
-30
-40
-50
-60
-P
re-1
984
Pos
t-198
4
Smoking Status
Job type Birth cohort Year f irst exposed Age at f irst exposure
Duration of exposure
Time since last exposure
Latency 1984
Explanatory variable
Rel
ativ
e ris
k of
asb
esto
sis
.
Relative risks of asbestosis with 95% confidence intervals (plotted on a log10 scale)
Figure 8 Relative risks of asbestosis, adjusted for age and sex, estimated by Poisson regression
34

Table 14 Poisson regression analysis: adjusted relative risks of asbestosis in the final multiple regression model (1978-2005)
Variable Cases Relative Risk 95% CI Age – linear component 477 4.72 1.40-15.9
quadratic component 0.98 0.95-0.99 cubic component 1.0001 1.00001-1.003
Sex (female) 11 0.45 0.24-0.82 Smoking status Current smoker 303 1.00 Former smokers 144 0.64 0.52-0.78 Never smoker 24 0.24 0.16-0.36 Job type
Manufacturing 132 1.00 Stripping/removal 99 3.02 2.27-4.02
“Other” 65 1.56 1.15-2.10 Insulation worker 177 7.19 5.70-9.07 Cohort
<1920 111 1.00 1920- 210 1.04 0.83-1.37 1930- 119 0.75 0.57-1.08 1940- 33 0.43 0.24-0.64 1950- 4 0.21 0.04-0.32 1960- 0 - -
1970- 0 - -Year of first exposure
<1930 7 1.00 1930- 55 0.52 0.23-1.15 1940- 110 0.39 0.18-0.86 1950- 162 0.32 0.15-0.70 1960- 80 0.13 0.06-0.30 1970- 53 0.07 0.03-0.16 1980- 9 0.03 0.01-0.09 1990- 1 0.02 0.002-0.15
Notes: All variables included in the model simultaneously. Model likelihood ratio statistic 1688 (22 degrees of freedom)
35

Table 15 Poisson regression analysis: unadjusted and adjusted relative risks of mesothelioma (1971-2005)
Variable Cases Relative 95% CI LR test† Adjusted 95% CI LR test†
Risk (df) Relative (df) Risk‡
Smoking status 61 (2) 1030 (5) Current smoker 321 1.00 1.00 Former smokers 210 1.65 1.38-1.96 1.07 0.90-1.28 Never smoker 102 0.67 0.54-0.84 0.88 0.71-1.11 Job type 153 (3) 1213 (6) Manufacturing 214 1.00 1.00 Stripping/removal 200 0.90 0.74-1.09 1.92 1.58-2. 34
“Other” 87 1.09 0.85-1.40 1.13 0.88-1.45 Insulation worker 143 3.66 2.96-4.52 4.03 3.26-4.99 Cohort 1084 (9)
<1920 85 1.00 1.00 1920- 211 0.98 0.76-1.26 1.21 0.94-1.56 1930- 211 0.69 0.53-0.88 1.24 0.94-1.62 1940- 118 0.28 0.21-0.36 1.01 0.73-1.40 1950- 21 0.041 0.03-0.07 0.45 0.26-0.77 1960- 3 0.0090 0.003-0.03 0.33 0.10-1.14 1970- 0 - - - -
Period 24 (3) 1066 (6) 1970- 27 1.00 1.00 1980- 143 1.53 1.02-2.31 1.37 0.90-2.06 1990- 279 2.01 1.35-2.98 1.49 1.00-2.22 2000- 200 2.13 1.42-3.18 1.25 0.84-1.88
Year of first exposure 947 (7) 1352 (10) <1930 3 1.00 1.00 1930- 42 1.03 0.32-3.31 1.08 0.34-3.49 1940- 100 0.87 0.28-2.75 1.02 0.32-3.23 1950- 224 0.82 0.26-2.56 1.17 0.37-3.67 1960- 147 0.24 0.08-0.75 0.49 0.15-1.53 1970- 93 0.07 0.02-0.23 0.23 0.07-0.73 1980- 34 0.04 0.01-0.12 0.19 0.06-0.62 1990- 6 0.02 0.004-0.06 0.12 0.03-0.48
Age at first exposure (years) 121 (4) 1360 (7) <20 255 1.00 1.00 20- 173 0.40 0.33-0.48 0.42 0.35-0.51 30- 98 0.42 0.34-0.54 0.22 0.18-0.28 40- 67 0.54 0.41-0.70 0.16 0.12-0.20 50- 56 1.12 0.84-1.50 0.21 0.15-0.28
Duration of exposure (years) 1110 (4) 1377 (7) <10 50 1.00 1.00 10- 135 1.36 0.91-2.04 0.67 0.45-1.01 20- 194 5.81 4.15-8.14 1.75 1.24-2.47 30- 225 17.9 13.0-24.8 3.70 2.64-5.19 40- 45 40.1 29.1-55.2 6.60 4.65-9.37
Time since last exposure (years) 88 (3) 1061 (6) <10 334 1.00 1.00 10- 225 1.81 1.53-2.15 0.90 0.76-1.08 20- 89 2.75 2.18-3.49 0.99 0.78-1.26 30- 1 3.21 0.45-22.8 0.99 0.14-7.02
Latency (years) 1122 (6) 1377 (9) <10 30 1.00 1.00 10- 48 1.60 0.02-2.53 0.81 0.51-1.28 20- 118 5.80 3.88-8.66 1.73 1.15-2.60 30- 185 18.2 12.4-26.8 3.69 2.47-5.50 40- 187 44.0 30.0-64.8 6.89 4.57-10.4 50- 76 58.9 38.6-89.8 8.87 5.61-14.0 60- 5 21.5 8.34-55.4 3.48 1.32-9.19
36

Variable Cases Relative 95% CI LR test† Adjusted 95% CI LR test†
Risk (df) Relative (df) Risk‡
Number of medical examinations 42 (1) 1070 (4) 1 medical 255 1.00 1.00 ≥ 2 medicals 394 1.67 1.42-1.95 1.30 1.11-1.52
First medical pre-or post-ALR 256 (1) 1106 (4) Pre-ALR 626 1.00 1.00 Post-ALR 23 0.099 0.06-0.15 0.30 0.20-0.46
† Model likelihood ratio chi-squared value and degrees of freedom‡ Adjusted for age attained and se. Linear and quadratic terms were fitted for age.
37

0.01
0.1
1
10
100
Cur
rent
Form
erN
ever
sm
oker
Man
ufac
turin
gR
emov
al“O
ther
”In
sula
tion
<192
019
20-
1930
-19
40-
1950
-19
60-
<193
019
30-
1940
-19
50-
1960
-19
70-
1980
-19
90-
<20
20-
30-
40-
50-
<10
10-
20-
30-
40-
<10
10-
20-
30-
<10
10-
20-
30-
40-
50-
60-
Pre
-198
4P
ost-1
984
Smoking Status
Job type Birth cohort Year f irst exposed Age at f irst exposure
Duration of exposure
Time since last
exposure
Latency 1984
Explanatory variable
Rel
ativ
e ris
k of
mes
othe
liom
a
Relative risks of mesothelioma with 95% confidence intervals (plotted on a log10 scale)
Figure 9 Relative risks of mesothelioma, adjusted for age and sex, estimated by Poisson regression
38

Table 16 Poisson regression analysis: adjusted relative risks of mesothelioma in the final multiple regression model (1971-2005)
Variable Cases Relative Risk 95% CI Age – linear component 649 1.37 1.24-1.51
quadratic component 0.99 0.996-0.998 Sex (female) 18 0.46 0.28-0.73 Job type
Manufacturing 214 1.00 Stripping/removal 200 2.12 1.72-2.61
“Other” 87 1.11 0.87-1.43 Insulation worker 143 3.34 2.69-4.14 Cohort
<1920 85 1.00 1920- 211 0.97 0.75-1.26 1930- 211 0.84 0.63-1.11 1940- 118 0.61 0.43-0.86 1950- 21 0.28 0.16-0.48 1960- 3 0.20 0.06-0.70 1970- 0 - -
Latency (years since first exposure) <10 30 1.00 10- 48 0.87 0.55-1.38 20- 118 2.04 1.35-3.09 30- 185 4.00 2.68-5.98 40- 187 6.58 4.36-9.92 50- 76 8.44 5.33-13.4 60- 5 3.39 1.28-8.97
Notes: All variables included in the model simultaneously. Model likelihood ratio statistic 1522 (18 degrees of freedom)
39

4.1
4 DISCUSSION
This report describes the analysis of deaths with asbestosis or with mesothelioma among workers in the GB Asbestos Survey. The underlying cause of death was not necessarily asbestosis or mesothelioma. In addition, since the case definitions were not mutually exclusive, an individual who had both diseases was included in the analysis of asbestosis mortality and in the analysis of mesothelioma mortality.
The discussion will follow the same order as the results section, and will include sections on the descriptive statistics, the external analysis presenting standardised and proportional mortality ratios, and the internal Poisson regression analysis. It will begin by considering the strengths and limitations of the study.
STRENGTHS AND LIMITATIONS OF THE STUDY
The main strengths and limitations of the asbestos survey were discussed in detail in the previous report on the mortality analysis2, but a brief summary is given here. The survey is one of the largest, longest running and most inclusive surveys of asbestos workers in the world. However, the changing inclusion criteria, which were determined by the regulations in force at the time of recruitment, meant that the population of workers that the survey recruited from changed over time. In addition to this, due to the legislation prohibiting the use of asbestos, the activities and working practices of the workforce and the types of asbestos and asbestos containing materials it was exposed to changed substantially during the course of the survey. Consequently the risk profile of the workers changed over time.
Asbestos-related diseases tend to have a long latent period, generally at least 10 years and in some cases up to 60 years or more. For workers occupationally exposed before the start of the survey and for those recruited during the early part of the survey, there was sufficient follow-up time to estimate mortality from asbestos-related diseases. The length of follow-up was insufficient to confirm whether later regulations to control occupational exposure to asbestos were effective in reducing mortality.
There is evidence that the risk of disease is related to the intensity and type of asbestos which workers are exposed to12-14. The survey has limited information on exposure to asbestos at the level of the individual worker. The date of first occupational exposure to asbestos and the type of job a worker was engaged in gave some indication of asbestos type and exposure intensity. However, these surrogate measures could over- or under-estimate an individual’s exposure.
Confounding, whereby an observed relationship between two variables is partly or wholly explained by another extraneous factor, may arise in any epidemiological study. Confounding may result in the observed relationship being over- or under-estimated, or the direction of the relationship being completely reversed. Confounding therefore needs to be controlled during the analysis. Smoking status was the main extraneous variable measured on the asbestos workers, but other potential confounding factors such as diet15 were not assessed, so that the potential to control for confounding was restricted.
A major strength of the current study is that men and women who were known to have occupational exposure to asbestos and who developed asbestosis or mesothelioma could be identified on the national disease registers. An analysis based only on underlying cause of death coding will underestimate the number of cases, by more than a half in the case of asbestosis. An analysis based on data collected by the Asbestosis or Mesothelioma Registers only would be representative of national trends, but may not be able to capture occupational exposure reliably.
40

4.2
Occupation on the registers is taken from the death certificate and, as noted in this report, this occupation may not reflect exposure to asbestos, which occurred during a previous occupation.
A limitation of the current study is that it was not possible to match all the workers who had died with asbestosis or mesothelioma as the underlying cause of death. Nineteen mesothelioma and 16 asbestosis deaths could not identified on either register. The most likely reason for this was errors in either or both of the database entries, which prevented making a match. It may also have been due to a slower process for including an individual on a register, or these individuals may have been missed by the registers’ ascertainment procedures. However, these 35 cases were included in the analysis. Of greater concern were the individuals who participated in the asbestos survey and were listed on one of the registers, but were not identified by the matching process. It was impossible to estimate how many individuals may have been missed. If a similar number of asbestos workers on the registers, in the region of 20 on each register, could not be matched with the survey database, then any possible bias introduced by this was likely to be relatively small.
Cases of asbestosis and of mesothelioma were ascertained from presence on the Registers or through underlying cause of death. The number of cases therefore represented disease frequency and not necessarily mortality from asbestosis or mesothelioma. For asbestosis, the cases represented disease frequency more closely than mortality since asbestosis is a chronic disease and individuals can live for many years following a diagnosis of asbestosis. Another consequence of this case definition was that the time between first occupational exposure to asbestos and death was unlikely to be the true latency period for asbestosis for many cases. This was highlighted by the fact that men and women on the Asbestosis Register who died from a cause other than asbestosis were significantly younger than those whose underlying cause of death was asbestosis. Nevertheless, the trends observed in this analysis for death with asbestosis were similar to those for asbestosis deaths, ascertained only through underlying cause of death, reported previously2. This issue was not as important for mesothelioma. Currently the prognosis for mesothelioma is very poor, and most people die within a short period of diagnosis16.
DESCRIPTIVE STATISTICS
Among the 98,912 men and women included in this analysis, 15,557 deaths from all causes were registered during the follow-up period 1971-2005. Of these, there were 477 deaths with asbestosis recorded on the death certificate and 649 deaths with mesothelioma recorded. These measures of asbestosis and mesothelioma are proxy measures of disease frequency. Mesothelioma cases accumulated more quickly than asbestosis cases in the study population, but the difference was not as great as in the GB population as a whole (Figure 1 and Figure 2 ). This observation is consistent with previous research which has shown that asbestosis is only associated with occupational exposure to asbestos17; in this cohort of workers exposed to asbestos, the proportion of men and women with asbestosis would be expected to be higher than in the general population. The number of workers dying with asbestosis or mesothelioma showed no sign of declining by 2005 ( Figure 2). Cases arising during the early part of the study were attributable to exposures occurring before the start of the survey in 1971, since the latent period between exposure and disease is generally at least 10 years for asbestosis and mesothelioma.
The majority of asbestosis cases (76%) did not have asbestosis as the underlying cause of death. Lung cancer was the underlying cause of death in over 40% of the asbestosis cases. A larger proportion of mesothelioma cases (64%) were identified by the underlying cause of death, that is a cause of death recorded as pleural cancer, peritoneal cancer, or mesothelioma. From these statistics, it is clear that relying on underlying cause of death for case ascertainment will substantially underestimate the frequency of these two diseases. Comparison of Figure 2 and
41

Figure 3 illustrates how the relative importance of the two diseases alters when case fatality rate is compared with frequency. Research among people exposed to asbestos for at least 20 years has shown that if the health effects of asbestos are ranked in terms of underlying cause of death case fatality rates, mesothelioma is likely to be ranked first, followed by lung cancer, asbestosis, diffuse pleural thickening, and lastly pleural plaques18. If the health effects are ranked in terms of disease frequency, then pleural plaques are likely to be ranked first, followed by asbestosis, diffuse pleural thickening, lung cancer, and finally mesothelioma.
The changing trend in cause of death coding for mesotheliomas with the introduction of ICD-10 in 2001 has resulted in a higher proportion of mesotheliomas being detected through the underlying cause of death code, but it has not resulted in better classification of pleural and peritoneal mesotheliomas. Prior to ICD-10, many mesotheliomas were not identified because they were coded as cancers of ill-defined, secondary and unspecified sites, while there was only one death on the register with this code in the period 2001-2005. However, within the C45 code for mesothelioma, the majority (60%) were coded as unspecified mesotheliomas. This lack of specificity will affect any future research interested in distinguishing between pleural and peritoneal mesotheliomas.
The differences observed in occupation listed on the death certificate and the job at the time of the survey medical examination were not unexpected, given the transient nature of a large portion of the workforce and the changing nature of the asbestos industry. The large majority of occupations listed on the death certificates potentially involved exposure to asbestos. Some of the occupations clearly did not suggest occupational exposure to asbestos, while other occupations listed were not specific enough to exclude the job from being in the asbestos industry. This illustrates the difficulty in attributing occupational exposure in death certificate studies.
4.3 MORTALITY ANALYSIS
The full analysis of the cohort mortality data was reported previously2. All cause and lung cancer mortality were presented in this report to provide an indicator of overall mortality in the cohort: both were significantly greater than in the GB population. Many occupational cohorts have lower all cause mortality than the general population, which is an indicator of the ‘healthy worker effect’. However this was not the case for this cohort. The excess lung cancer mortality reflected at least in part the consistently high percentage of smokers among the asbestos workers. The mortality analysis also indicated that, compared with the GB population, there was a large excess of deaths with asbestosis and of deaths with mesothelioma among the asbestos workers; for an asbestos-exposed occupational cohort, this was not unexpected.
4.4 AGE-PERIOD-COHORT MODELS
The age-period-cohort models gave similar results for asbestosis and for mesothelioma. Mortality increased with age. The non-linear effect of age was not statistically significant suggesting the relationship with age was linear. A significant trend in the mortality rates was observed over time. This trend, due to the identifiability problem in age-period-cohort models (see Appendix 1), cannot be ascribed to period or cohort effects and is generally called “drift”19.
The relative risks of asbestosis and mesothelioma decreased in successive birth cohorts, with negligibly small risks of disease observed in the latest cohorts. These data indicate that the incidence of asbestosis and of mesothelioma has decreased, suggesting reduced exposure in later cohorts. However the long latency of both diseases means that men and women belonging to the later cohorts were still at risk of developing these diseases, and the relationships observed in the current analysis may change in the future.
42

4.5
The relative risks of asbestosis were significantly higher in the 1980s and 1990s compared with the 1970s, and were significantly higher during the 1990s and in 2000-2005 for mesothelioma. This may indicate that 20 or more years earlier men and women were exposed to particularly high levels of asbestos, it may indicate a change in diagnostic or case ascertainment procedures during the 1980s and 1990s, or it may be an artefact of the data since the disease registers were only established in the late 1960s. However, national asbestos consumption reached a peak in 1960 and the Asbestos Regulations, which imposed restrictions on exposure levels, were implemented in 1969. High levels of exposure before the 1970s would be a plausible explanation for the higher risks observed in the 1980s and 1990s.
The age-period-cohort models were somewhat restricted by the length of follow-up time, which meant that there were only four calendar periods in the analysis. Using smaller time bands would have increased the number of intervals and may have provided more insight into trends across time, but using 5-year time bands for cohort and period led to convergence problems when fitting the statistical model.
POISSON REGRESSION ANALYSIS
The Poisson regression analysis showed that many of the trends in the relative risks were similar for deaths with asbestosis and for deaths with mesothelioma. Job type was an important risk factor, with insulation workers and, to a lesser degree, stripping/removal workers, having significantly higher risks of asbestosis and mesothelioma than manufacturing workers. ‘Other’ exposed workers had a similar risk of asbestosis as the removal workers. The type of work the highest risk group, the insulation workers, were involved in is no longer permitted in GB. However the relatively high risk of stripping/removal workers, who currently form the majority of the workforce in the asbestos industry, should continue to be monitored. The reduction in relative risk for those first attending a medical examination after the implementation of the ALR, the inverse relationship between year of first occupational exposure and risk of asbestosis and mesothelioma, and the smaller number of cases in later birth cohorts may be a result of a reduction in occupational exposure to asbestos. However, the smaller number of cases in later birth cohorts will at least in part be a result of the long latency of these diseases. The maximum follow-up after the first occupational exposure to asbestos for men and women born in the 1950s, if they were born in 1950 and were first exposed at age 16 years, was 39 years. The median age at the first medical examination was 33 years (inter-quartile range 25-44 years), so the follow-up time for the majority of survey participants born after 1950 was less than 20 years. A longer follow-up period is required to provide evidence of a true reduction in risk.
There were some notable differences in the pattern of risks associated with asbestosis and mesothelioma. Adjusted for age and sex, smoking status was strongly associated with asbestosis but not with mesothelioma, which is consistent with previous studies18,20.
An important advantage of Poisson regression analysis is the ability to include several potential explanatory variables into the model simultaneously. It is then possible to examine the effect of each explanatory variable in the presence of others, and to determine which are most important in predicting the relative risk. The correlations between the time-related variables ranged between |0.02| and |0.78|, and the high dependency between these variables meant that it was not possible to interpret the effects of each variable if they were all included in one model simultaneously. A strategy of developing a basic model which included non-time-related variables, such as sex, and some time-related variables, such as age and year of first exposure, and then testing the time-varying variables latency, duration of exposure, and time since last exposure in the last steps was used to address the difficulties arising from this collinearity. The regression coefficients of these highly correlated variables were generally attenuated to some
43

degree when included in a model simultaneously, but the nature of the relationships between the retained variables and mortality were not altered.
The relative risks of asbestosis and, to a lesser degree mesothelioma, decreased with time since last occupational exposure, in the analyses adjusted for age and sex. In an Italian study of asbestos cement workers, though there was some evidence of an increase in risk 3-30 years since last exposure21, and in the Wittenoom cohort22, the risk of mesothelioma did not diminish with increasing time since last exposure.
4.6 CONCLUSIONS
The importance of using information other than underlying cause of death codes in order to determine the number of cases of asbestosis and mesothelioma, was highlighted in this analysis. A substantial number of men and women who had asbestosis or mesothelioma were identified on the Asbestosis and Mesothelioma Registers, but did not have an underlying cause of death code for asbestosis or mesothelioma. Since case fatality is higher for mesothelioma than for asbestosis, the proportion of individuals with asbestosis identified only from the register was larger.
It was clear that with the introduction of ICD-10, a larger proportion of mesothelioma cases were identified through the underlying cause of death code for mesothelioma (C45). However the majority of mesotheliomas identified in this way were ‘unspecified’; consequently, for the majority of cases pleural mesotheliomas could not be distinguished from peritoneal mesotheliomas.
There was some evidence that mortality rates were lower in later birth cohorts and among those first occupationally exposed to asbestos in more recent decades. However, due to the long latency of both diseases, a longer follow-up period is required before this can be confirmed.
4.7 RECOMMENDATIONS
The main objective of the GB Asbestos Survey is to monitor the long-term health of GB asbestos workers, and in particular to determine the effectiveness of regulations to control occupational asbestos in reducing the occurrence of asbestos-related disease. This will not be achieved unless the workers are monitored for a sufficiently long time, following the implementation of new regulations. The main recommendation is therefore to continue monitoring the health of licensed asbestos workers in GB.
44

5 REFERENCES
1. Bartrip PW. History of asbestos related disease. Postgrad Med J 2004;80(940):72-6 2. Harding A-H, Frost G. The Asbestos Survey: mortality among asbestos workers 1971-2005.
HSE Research Report: Health & Safety Laboratory, 2007: 125 3. IARC. Overall Evaluations of Carcinogenicity. Lyon, France: International Agency for
Research on Cancer, 1987 4. Committee on Asbestos: Selected Health Effects. Asbestos: Selected Cancers. New York:
National Academies Press, 2006 5. Gore D, Sleator A. Asbestos. London: House of Commons Library, 1999: 36 6. Health & Safety Executive. Compilation of Mesothelioma and Asbestosis Death Statistics:
Health & Safety Executive, 2007 7. Virta R. Worldwide asbestos supply and consumption trends from 1900 through 2003.
Reston, Virginia: US Geological Survey, 2006: 80 8. Hutchings S, Jones J, Hodgson J. Asbestos related diseases. In: Drever F, ed. Occupational
Health: Decennial Supplement. The Registrar General's decennial supplement for England and Wales. London, HMSO, 1995: 127-52
9. Occupational Cohort Mortality Analysis Program. 4.00 (release 01e) version. Pittsburgh: Department of Biostatistics, University of Pittsburgh, 2004
10. Harding A-H, Wegerdt. Asbestos Workers Database: Summary Statistics. HSE Research Report. Buxton: Health & Safety Laboratory, 2006: 45
11. Clayton D, Schifflers E. Models for temporal variation in cancer rates. II: Age-period-cohort models. Stat Med 1987;6(4):469-81
12. Hodgson JT, Darnton A. The quantitative risks of mesothelioma and lung cancer in relation to asbestos exposure. Ann Occup Hyg 2000;44(8):565-601
13. Browne K, Smither WJ. Asbestos-related mesothelioma: factors discriminating between pleural and peritoneal sites. Br J Ind Med 1983;40(2):145-52
14. Jones RN, Diem JE, Hughes JM, Hammad YY, Glindmeyer HW, Weill H. Progression of asbestos effects: a prospective longitudinal study of chest radiographs and lung function. Br J Ind Med 1989;46(2):97-105
15. Bianchi C, Bianchi T. Malignant mesothelioma: global incidence and relationship with asbestos. Ind Health 2007;45(3):379-87
16. Hagemeyer O, Otten H, Kraus T. Asbestos consumption, asbestos exposure and asbestos-related occupational diseases in Germany. Int Arch Occup Environ Health 2006;79(8):613-20
17. World Health Organization. Air Quality Guidelines for Europe. Second edition: World Health Organization, 2001
18. Merchant JA. Human epidemiology: a review of fiber type and characteristics in the development of malignant and nonmalignant disease. Environ Health Perspect 1990;88:287-93
19. Holford TR. Understanding the effects of age, period, and cohort on incidence and mortality rates. Annual Rev Public Health 1991;12:425-57
20. Faust RA. Toxicity Summary for Asbestos. Oak Ridge: Oak Ridge National Laboratory, 1995: 20
21. Magnani C, Ferrante D, Barone-Adesi F, et al. Cancer risk after cessation of asbestos exposure: a cohort study of Italian asbestos cement workers. Occup Environ Med 2008;65(3):164-70
22. Musk AB, de Klerk N, Reid A, et al. Mortality Of Former Crocidolite (Blue Asbestos) Miners And Millers At Wittenoom. Occup Environ Med 2007;65(11):743-749
23. Tsai SP, Wen CP. A review of methodological issues of the standardized mortality ratio (SMR) in occupational cohort studies. Int J Epidemiol 1986;15(1):8-21
45

24. Yang Y, Fu W, Land K. A Methodological Comparison of Age-Period-Cohort Models: The Intrinsic Estimator and Conventional Generalized Linear Models. Sociological Methodology 2004;34(1):75-110
25. McNally RJ, Alexander FE, Staines A, Cartwright RA. A comparison of three methods of analysis for age-period-cohort models with application to incidence data on non-Hodgkin's lymphoma. Int J Epidemiol 1997;26(1):32-46
26. Vandeschrick C. The Lexis Diagram, a misnomer. Demographic Research 2001;4:97-124. 27. Robertson C, Boyle P. Age-period-cohort analysis of chronic disease rates. I: Modelling
approach. Stat Med 1998;17(12):1305-23
46

Appendix 1: Statistical Methods
1.1 CALCULATION OF PERSON YEARS AT RISK
Person years at risk were counted from the date of the first medical examination. Although the time an individual was actually flagged by the NHSCR or GROS lagged behind this, it was not feasible to start the count from the date of flagging.
1.2 CALCULATION OF STANDARDISED MORTALITY RATIOS
The GB rates for asbestosis and for mesothelioma were calculated using the data collected by the Asbestosis and Mesothelioma Registers. For asbestosis, the mortality analysis covered the period 1978 to December 2005, the last year with complete mortality data available. Although the Asbestosis Register was established in 1968, the data for the years before 1978 were not available in electronic format. Consequently the GB rates for asbestosis could not be calculated for this period, and the asbestos workers present on the register before 1978 could not be identified. For mesothelioma the period covered ran from the start of the Asbestos Survey in 1971 to December 2005.
Standardised mortality ratios (SMR) were calculated so that differences in the age structure between the GB population and the cohort of asbestos workers could be taken into account. The SMRs were calculated using OCMAP-plus Ver 4.1 software9. The SMR is a comparison of the number of observed deaths in the survey population with the number of expected deaths if the age-specific death rates for men and women were the same as in the standard population. An SMR of 100 implies that the mortality rate is the same as in the standard population. If there is excess mortality in the survey population compared with the standard population, the SMR is greater than 100. Conversely, if the SMR is less than 100 then compared to the standard population, the survey population has fewer deaths. For all cause and lung cancer mortality, the standard populations used for this analysis were the annual death registrations and estimated mid-year populations for England and Wales, and for Scotland. These data were obtained from the Office for National Statistics (England and Wales) and from the General Register Office for Scotland. The mortality rates by sex, 5-year age groups and 5-year calendar periods, were used to calculate the expected number of deaths. The death rates for England, Wales and Scotland were combined to calculate the SMRs for GB. For deaths with asbestosis and deaths with mesothelioma, the national rates by sex, 5-year age and calendar periods, were calculated from the Asbestosis and Mesothelioma Registers.
SMRs provide a measure of absolute risk. However, an important disadvantage of SMRs is that two or more age-adjusted SMRs cannot be directly compared across different groups or populations, unless the age structure in the two standard populations is very similar or the age-specific mortality rates within each population are similar across the age groups23.
1.3 CALCULATION OF PROPORTIONAL MORTALITY RATIOS
The proportional mortality ratios (PMR) were calculated in order to take into account, at least to some extent, confounding by tobacco smoking and other factors that may have been similar among the asbestos workers but were systematically different to the general population. The percentage of asbestos workers who smoked (approximately 53%) was double that in the GB adult population. Consequently a high SMR could represent an increase in mortality associated with smoking, or with exposure to asbestos, or both.
47

The PMR is calculated as the proportion of deaths due to a specific cause in the survey population compared to the proportion of deaths from that cause in the reference population, standardised for sex, age, and calendar period. The same reference populations were used as in the SMR analysis. A PMR greater than 100 indicates that individuals in the survey population are more likely to die from that specific cause than individuals in the general population, while a PMR less than 100 indicates that they were less likely to die from that specific cause.
The PMR must be interpreted with caution. The PMR for a specific cause of interest is affected by the relative frequency of other causes of death. If overall mortality in a group is low, an observed excess of deaths may be due to a deficit of deaths from all causes or it may represent a real difference. However, an important advantage of PMRs is that they can be used to make comparisons across different groups or populations.
1.4 CONFIDENCE INTERVALS
The 95% confidence intervals are shown for the estimates. The confidence interval represents the range of values, within which the true values of the, for example, SMR or PMR will lie 95% of the time. If the confidence interval for the SMR (PMR) includes 100, then the SMR (PMR) is not statistically significantly different to 100 at the 95% level. The width of the confidence interval gives an indication of the precision of the estimate. The wider the confidence interval, the lower the precision. Small numbers of deaths in a category can result in wide confidence intervals.
1.6 TIME-RELATED VARIABLES
The dependency between the various time-related variables that were investigated in the Poisson regression model is illustrated in Figure 10. The first row in Figure 10 is the basic timeline for an individual in the survey. The starting point is the date of birth (DOB), which is followed by the date of first occupational exposure to asbestos, the date of the first medical examination, the date occupational exposure to asbestos ended, and finally the end of follow-up date (death, emigration or end of study). For men and women starting work in the asbestos industry during the latter part of the survey, the date of the first medical examination will precede the date of first occupational exposure to asbestos. The remaining rows show how the timeline can be apportioned to the time-related variables. The age-period-cohort model (see 1.5 below) illustrates some of the issues surrounding the time-related variables, but there are other groups of variables (such as latency, duration of exposure, and time since last exposure) with similar characteristics.
1.5 AGE-PERIOD-COHORT MODELS
Age-period-cohort models are used to analyse trends in mortality across time19. Age effects represent risks associated with individual age groups, period effects represent differences in mortality that affect all age groups during the calendar period of death, while cohort effects represent differences in mortality associated with individuals born at a particular time24. Visual presentation of mortality rates provides an important insight into age-period-cohort trends. More formal analysis using Poisson regression can be used to examine the trends. The main difficulty in analysing these trends arises from the basic relationship between age, period and cohort:
Period = Cohort + Age
Consequences of this are that it is not possible to distinguish between a linear trend for period and a linear trend for cohort, and there is no unique set of regression estimates when all three
48

factors are included in a model simultaneously19. Clayton & Schifflers11 proposed a hierarchy of models for the analysis of age, period, and cohort effects:
1. Age
2. Age + (linear term for Period or Cohort) Drift
3. a Age + Period + Drift
b Age + Cohort + Drift
4. Age + Period + Cohort + Drift
No additional assumptions are made or constraints applied in order to resolve the non-identifiability problem25. Instead the non-identifiable linear effects of cohort, period or both are termed ‘drift’.
The hierarchy of models were fitted sequentially to the mortality data, and were used to determine the effects of period and cohort. Age, period, and cohort were all defined in terms of 10-year intervals. The same interval was chosen for all three terms to reduce potential bias. Ten-year intervals were used to avoid difficulties with non-convergence, which occurred when shorter 5-year intervals were used. Terms that were not statistically significant were dropped from the final model. Statistical significance was determined by a p-value less than 0.05 for the likelihood ratio test. Separate analyses were undertaken for deaths with asbestosis and deaths with mesothelioma.
1.6 POISSON REGRESSION ANALYSIS
The internal mortality analysis used Poisson regression to investigate the combined effect of potential explanatory variables. These variables included age, sex, smoking status, main job type, year of first exposure, age at first exposure, duration of exposure, time since last exposure, latency, number of medical examinations, and whether the first medical examination was pre- or post-ALR. The variables age, duration of exposure, time since last exposure, and latency were entered into the statistical models as time-varying variables. Time was entered in 10-year intervals, because using 5-year intervals resulted in models that did not converge.
A Lexis diagram is the simplest way of illustrating a time-varying variable. The Lexis diagram is a coordinate system (see Figure 11)26. For age and time since first occupational exposure to asbestos, the Lexis diagram shows years since first exposure on the horizontal axis and age on the vertical axis. The black diagonals delineate oblique bands of latency times. The orange diagonals show how individuals move through the various age-latency categories as study time passes, and how much time each individual contributes to each category. Similar diagrams can be shown for all combinations of the time-varying variables. The Poisson regression analysis is based on these groupings into cells, each of which is assumed to have a constant mortality rate27.
Three sets of regression models are presented in the report. The first shows the unadjusted relationship between mortality and the explanatory variable. The second shows the relationship between mortality and the explanatory variable adjusted for age and sex. The third model built on the age and sex adjusted model, and included all the explanatory variables, which in the presence of the other variables in the model, made a statistically significant contribution to explaining mortality, with p ≤ 0.005. The first variables tested in this model were the time-invariant factors, namely birth cohort, period of death, age at first exposure, year of first
49

exposure, main job, smoking status at the last medical examination, the number of medicals attended, and whether the first medical was pre- or post-ALR. The time-varying variables duration of exposure, time since last exposure, and latency were then tested. Due to high correlations between the time-related variables, the stability of regression coefficients as well as their statistical significance was taken into account when adding new terms into the final model.
Poisson regression assumes that the deaths followed a Poisson distribution. The regression model ‘goodness of fit’ tests confirmed that model assumptions were not violated.
50

DOB … … … … date … … … date… … … … … … … … …date … … … … … …… DOD first of first exposure or
exposed medical ended EOF
Age Year Duration Time since at first first of last exposure exposed exposure exposure
Birth cohort Latent period Period of death
Age
DOB: date of birth; DOD: date of death; EOF: end of follow-up Note: First medical examination may precede the date of first occupational exposure to asbestos
Figure 10 Time-varying and time-related covariates for the survival analysis
51

Latency 20-29 years
Aged 30-39 Key years Individual
died Individual survived
10
50
40
30
20
Age
0 10 20 30 40
Time since first exposure (years)
Figure 11 Lexis diagram showing follow-up by age and time since first occupational exposure to asbestos
Published by the Health and Safety Executive 06/10

Health and Safety Executive
The Great Britain Asbestos Survey 1971-2005 Mortality of workers listed on the Great Britain Asbestosis or Mesothelioma Registers
The aim of the report was to describe the frequency of asbestosis and mesothelioma among participants of the GB Asbestos Survey, and to identify factors associated with the risk of death with these diseases.
Among the 98,912 survey participants included in the analysis, there were 15,557 deaths between 1971 and 2005. Altogether 477 asbestosis and 649 mesothelioma deaths were identified on the Asbestosis and Mesothelioma Registers respectively. The underlying cause of death was asbestosis for 116 (24%) of the asbestosis cases, and mesothelioma for 398 (64%) of the mesothelioma cases on the registers.
n The asbestos workers had significantly higher mortality than the GB population; the standardised mortality ratio for all causes of death was 142 (95% CI 139-144).
n The risk of asbestosis or mesothelioma was lower in later birth cohorts.
n Asbestosis deaths peaked in the 1980s, while deaths with mesothelioma were higher during the 1990s and 2000-2005.
n The risk of asbestosis and mesothelioma increased with increasing duration of exposure, reaching a peak at 30-39 years’ exposure.
n The highest risk of asbestosis was observed 50 or more years after first occupational exposure to asbestos, and for mesothelioma 40-59 years after first exposure.
n Insulation workers, followed by stripping/removal workers, had the highest risk of asbestosis and mesothelioma, and manufacturing workers had the lowest risk. ‘Other’ exposed workers had intermediate levels of risk.
This report and the work it describes were funded by the Health and Safety Executive (HSE). Its contents, including any opinions and/or conclusions expressed, are those of the author alone and do not necessarily reflect HSE policy.
RR805
www.hse.gov.uk