The great Atacama flood of 2001 and its implications for Andean hydrology
20
HYDROLOGICAL PROCESSES Hydrol. Process. 20, 591–610 (2006) Published online 26 August 2005 in Wiley InterScience (www.interscience.wiley.com). DOI: 10.1002/hyp.5926 The great Atacama flood of 2001 and its implications for Andean hydrology John Houston* Av. Las Condes, 10373, Of. 60, Santiago, Chile Abstract: In February 2001, widespread flooding occurred throughout the Atacama Desert of northern Chile and southern Peru. It was particularly severe in the R´ ıo Loa basin, where roads and bridges were disrupted and the town of Calama inundated. The instantaneous peak flow in the R´ ıo Salado, a tributary of the R´ ıo Loa, reached 310 m 3 s 1 , an order of magnitude higher than any previously recorded event. The flood is estimated to have a return period of 100–200 years and is shown to have been caused by intense, long-duration rainfall in the western Cordillera associated with La Ni˜ na. The surface water response is typical of arid areas and highly dependent on antecedent conditions, but is quite different in perennial and ephemeral catchments. Ephemeral flood flows suffer high transmission losses, recharging phreatic aquifers. Perennial rivers have lower runoff coefficients, but baseflow levels remained high after the event for several months due to bank storage rebound and interflow. Extremely high energies of ¾3000 W m 2 were generated by the floods in the Cordillera, becoming less in the Precordillera and downstream. Erosion and sediment transport were consequently highest in the upper and middle reaches of the rivers, with mixed erosion-deposition in the lowest reach. The new insights gained from the interpretation and quantification of this event have important implications for palaeoenvironmental analysis, hazard management, water resource evaluation and the palaeohydrological evolution of the Andes. Copyright 2005 John Wiley & Sons, Ltd. KEY WORDS extreme flood; ENSO; precipitation; runoff; recharge; water resources; Atacama Desert; Andean geomorphology INTRODUCTION The Atacama is perhaps the most intensively hyper-arid desert in the world and has probably been so for much of the last 10–15 million years (Houston and Hartley, 2003). It is surprising, therefore, to find so many of its morphological features, both ancient and modern, are formed by the action of fluvial erosion and deposition (Mortimer, 1980; Naranjo and Paskoff, 1980, 1981). This contradiction is partly due to the position of the Atacama on the west flank of the Andes, which means that several perennial and many ephemeral rivers cross this desert, ultimately sourced from precipitation at high elevation. Deep incision (up to 1200 m) took place over many sections of these rivers during the Pliocene, 1–3 million years ago (age constraint based on a variety of dated volcanics bracketing incision), following base-level revision as a consequence of tectonic uplift (Gregory-Wodzicki, 2000) and sea-level change (Hallam, 1992), as well as fluctuations in climate (Houston and Hartley, 2003). Subsequently, only relatively minor phases of aggradation and incision have taken place (Rech et al., 2001; Latorre et al., 2004), with almost all rivers currently existing as underfits in their channels, i.e. bankfull conditions are met infrequently (Houston, 2002) and rarely exceeded. Such a state, whilst contributing the bulk of all historical data, is deceiving, and extreme hydrological events may still create major impacts to the system, despite appearing rarely or never in the historical record. * Correspondence to: John Houston, Av. Las Condes, 10373, Of. 60, Santiago, Chile. E-mail: [email protected] Received 5 May 2004 Copyright 2005 John Wiley & Sons, Ltd. Accepted 9 February 2005
-
Upload
john-houston -
Category
Documents
-
view
213 -
download
0
Transcript of The great Atacama flood of 2001 and its implications for Andean hydrology

HYDROLOGICAL PROCESSESHydrol. Process. 20, 591–610 (2006)Published online 26 August 2005 in Wiley InterScience (www.interscience.wiley.com). DOI: 10.1002/hyp.5926
The great Atacama flood of 2001 and its implications forAndean hydrology
John Houston*Av. Las Condes, 10373, Of. 60, Santiago, Chile
Abstract:
In February 2001, widespread flooding occurred throughout the Atacama Desert of northern Chile and southern Peru.It was particularly severe in the Rıo Loa basin, where roads and bridges were disrupted and the town of Calamainundated. The instantaneous peak flow in the Rıo Salado, a tributary of the Rıo Loa, reached 310 m3 s�1, an order ofmagnitude higher than any previously recorded event. The flood is estimated to have a return period of 100–200 yearsand is shown to have been caused by intense, long-duration rainfall in the western Cordillera associated with LaNina. The surface water response is typical of arid areas and highly dependent on antecedent conditions, but is quitedifferent in perennial and ephemeral catchments. Ephemeral flood flows suffer high transmission losses, rechargingphreatic aquifers. Perennial rivers have lower runoff coefficients, but baseflow levels remained high after the event forseveral months due to bank storage rebound and interflow. Extremely high energies of ¾3000 W m�2 were generatedby the floods in the Cordillera, becoming less in the Precordillera and downstream. Erosion and sediment transportwere consequently highest in the upper and middle reaches of the rivers, with mixed erosion-deposition in the lowestreach. The new insights gained from the interpretation and quantification of this event have important implications forpalaeoenvironmental analysis, hazard management, water resource evaluation and the palaeohydrological evolution ofthe Andes. Copyright 2005 John Wiley & Sons, Ltd.
KEY WORDS extreme flood; ENSO; precipitation; runoff; recharge; water resources; Atacama Desert; Andeangeomorphology
INTRODUCTION
The Atacama is perhaps the most intensively hyper-arid desert in the world and has probably been so for muchof the last 10–15 million years (Houston and Hartley, 2003). It is surprising, therefore, to find so many of itsmorphological features, both ancient and modern, are formed by the action of fluvial erosion and deposition(Mortimer, 1980; Naranjo and Paskoff, 1980, 1981).
This contradiction is partly due to the position of the Atacama on the west flank of the Andes, which meansthat several perennial and many ephemeral rivers cross this desert, ultimately sourced from precipitation athigh elevation. Deep incision (up to 1200 m) took place over many sections of these rivers during thePliocene, 1–3 million years ago (age constraint based on a variety of dated volcanics bracketing incision),following base-level revision as a consequence of tectonic uplift (Gregory-Wodzicki, 2000) and sea-levelchange (Hallam, 1992), as well as fluctuations in climate (Houston and Hartley, 2003).
Subsequently, only relatively minor phases of aggradation and incision have taken place (Rech et al., 2001;Latorre et al., 2004), with almost all rivers currently existing as underfits in their channels, i.e. bankfullconditions are met infrequently (Houston, 2002) and rarely exceeded. Such a state, whilst contributing thebulk of all historical data, is deceiving, and extreme hydrological events may still create major impacts to thesystem, despite appearing rarely or never in the historical record.
* Correspondence to: John Houston, Av. Las Condes, 10373, Of. 60, Santiago, Chile. E-mail: [email protected]
Received 5 May 2004Copyright 2005 John Wiley & Sons, Ltd. Accepted 9 February 2005
592 J. HOUSTON
This skewed database is exacerbated by the paucity of published analyses of the hydrology of the AtacamaDesert. Some early studies (e.g. Pena, 1970) have been followed by others prepared by the Direccion Generalde Aguas (DGA) (DGA, 1987) and aid agencies (UNDP, 1978; JICA, 1995) as well as several on the isotopicnature of river and groundwater (Aravena and Suzuki, 1990; Aravena, 1995), and there are several unpublishedreports by mining companies on specific aquifers. But, in general, and despite a relatively good monitoringnetwork for this remote area, there has been little synthesis, and few reliable conceptual frameworks exist. Asa result, several focused studies have been undertaken in the absence of context, leading to less than optimalinterpretations and resource evaluation.
In February 2001, widespread flooding occurred throughout the Atacama Desert of northern Chile andsouthern Peru. The flooding was particularly severe in the Rıo Loa basin where several bridges were rupturedand the town of Calama inundated. As far as is known, this is the first recorded historical event in the AtacamaDesert of such magnitude and impact.
Here, this extreme event is described from initiation to dissipation within the Rıo Loa basin, particularlywithin the Salado catchment, and an attempt is made to place it in perspective by examining its return period,cause and impact, as well as the implications for palaeohydrological interpretations, hazard management,water resources and Andean evolution.
THE RIO LOA BASIN
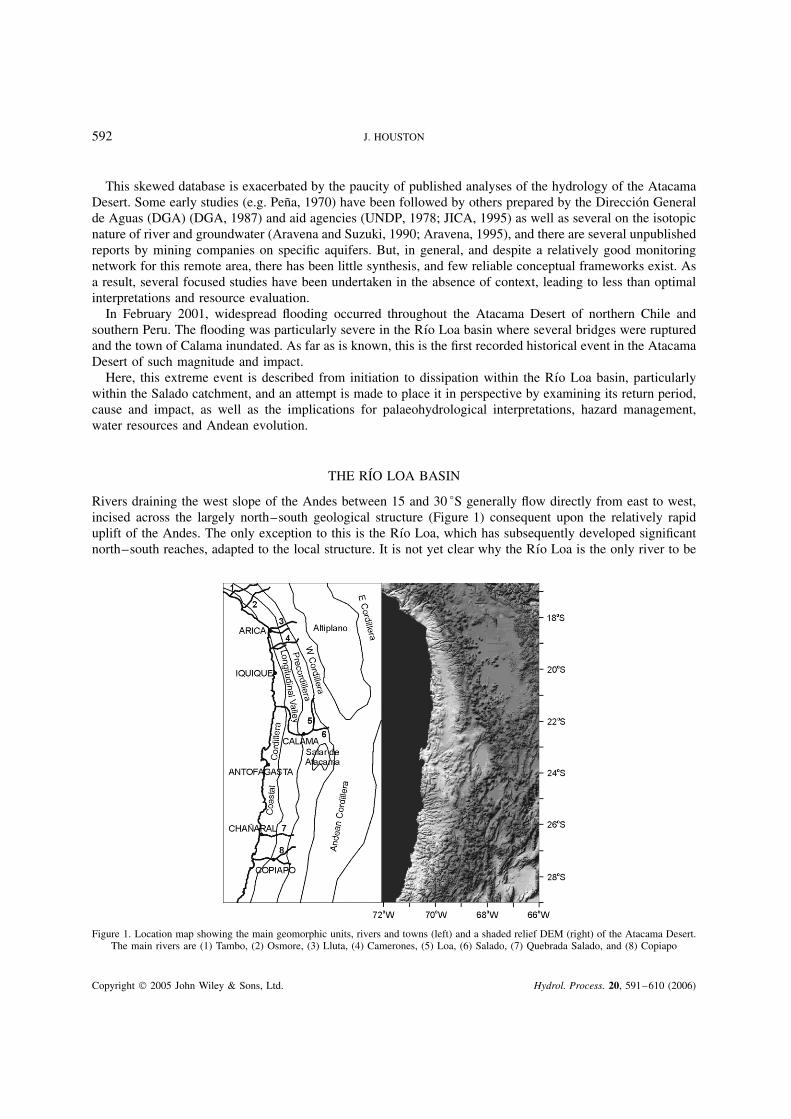
Rivers draining the west slope of the Andes between 15 and 30 °S generally flow directly from east to west,incised across the largely north–south geological structure (Figure 1) consequent upon the relatively rapiduplift of the Andes. The only exception to this is the Rıo Loa, which has subsequently developed significantnorth–south reaches, adapted to the local structure. It is not yet clear why the Rıo Loa is the only river to be
Figure 1. Location map showing the main geomorphic units, rivers and towns (left) and a shaded relief DEM (right) of the Atacama Desert.The main rivers are (1) Tambo, (2) Osmore, (3) Lluta, (4) Camerones, (5) Loa, (6) Salado, (7) Quebrada Salado, and (8) Copiapo
Copyright 2005 John Wiley & Sons, Ltd. Hydrol. Process. 20, 591–610 (2006)

THE GREAT ATACAMA FLOOD OF 2001 593
so adapted, but it does greatly enhance its catchment area, especially in the hydrologically critical area above3000 m above sea level (a.s.l.).
The Rıo Loa is a perennial river that crosses the heart of the Atacama Desert and is sourced throughoutmost of the year by baseflow from a number of basin aquifers in the high Andes, the Precordillera, theCalama Basin and the Pampa Tamarugal (part of the Longitudinal Valley). During the wet summer months ofDecember to March on the Altiplano, multi-peak seasonal floods pass down the river, undergoing transmissionlosses that partly replenish the basin aquifers.
The surface water drainage area of the Rıo Loa is 32 820 km2, although there is significant area(>8000 km2) draining through the subsurface from the Pampa Tamarugal to the north (Figure 2). Unpublishedhydrogeological data suggest that the subsurface flow from the Pampa Tamarugal to the Rıo Loa is currentlyaround 6 ð 106 m3 year�1, but this was probably much greater during the Plio-Pleistocene and would, attimes, have included additional surface water drainage.
The drainage density in the catchment below 3000 m a.s.l. is less than 0Ð1 km km�2, except adjacent tothe main watercourse where densities up to 0Ð2 km km�2 are found due to groundwater discharge that createsside channels which sap upstream, frequently ending in large headcuts up to several hundred metres high withassociated mass slumping. Above 3000 m a.s.l. the drainage densities may reach 0Ð5 km km�2, particularlyon less-permeable Miocene ignimbrites and Palaeozoic to Mesozoic metasediments.
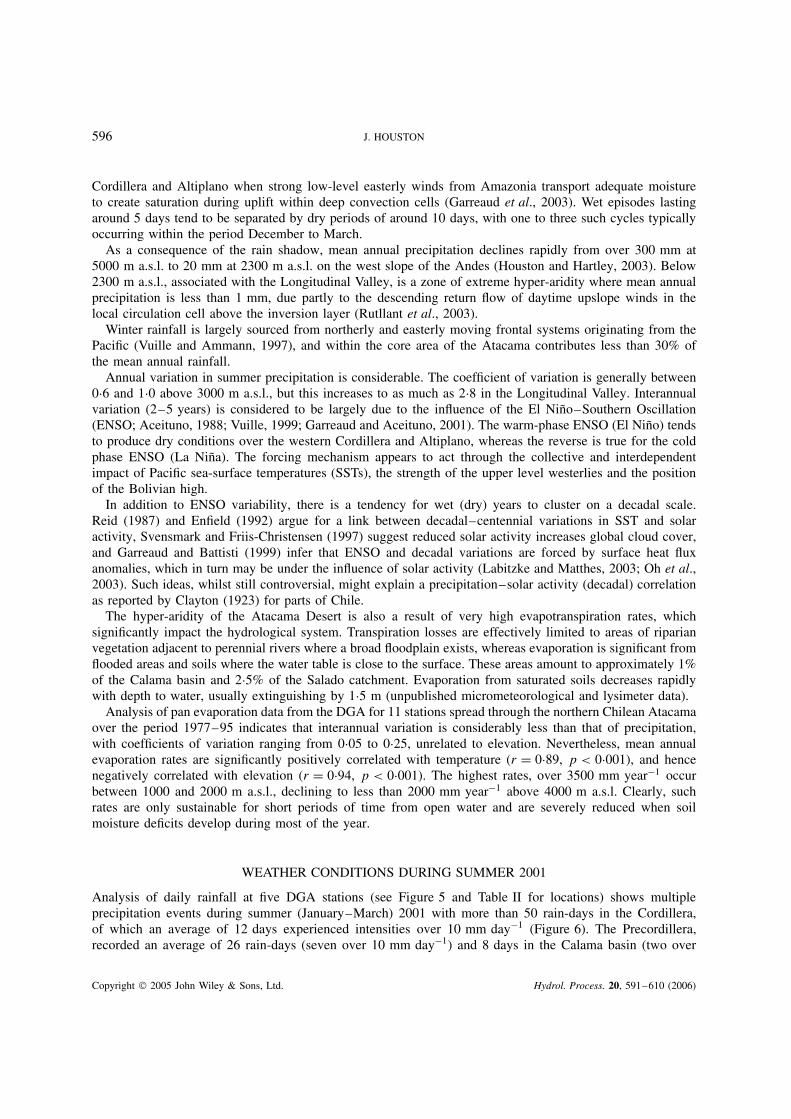
The hypsometric curve (Figure 3) of the basin reveals the dominant geomorphic units that the river crosses.The peaks, indicative of flatter parts of the catchment, are associated with structurally controlled basinscontaining groundwater stored in Neogene and Quaternary sediments and volcanics. Depending on the degreeof connection between the basins and the level of active groundwater storage at any time, such groundwatermay cascade down through the system in the subsurface, as well as provide baseflow to the Rıo Loa.
The profiles of the Rıo Loa and its main perennial tributary, the Rıo Salado (Figure 3), display four majorsegments: a very short coastal segment, followed by two relatively well-graded segments relating to theLongitudinal Valley and Calama basins, and finally complex upper segments associated with the AndeanCordillera. Since rivers only attain smooth concave profiles where they are capable of removing bedrock at arate greater than the uplift rate, the segmented profile is indicative of rapid polycyclic uplift dominating overerosion (incision).
Figure 2. The Rıo Loa catchment showing perennial (solid lines) and ephemeral (dashed lines) drainage. The Pampa Tamarugal (part of theLongitudinal Valley) is now a basin of internal drainage, with some groundwater leakage to the Rıo Loa basin, but 0Ð5–3 Ma would have
contributed additional surface water
Copyright 2005 John Wiley & Sons, Ltd. Hydrol. Process. 20, 591–610 (2006)
594 J. HOUSTON
Figure 3. Morphometry of the Rıo Loa basin showing a hypsometric curve (left) with the principal basins labelled and the river profile(right) showing the knick points due to the principal mountain ranges
THE RIO SALADO SUBCATCHMENTS
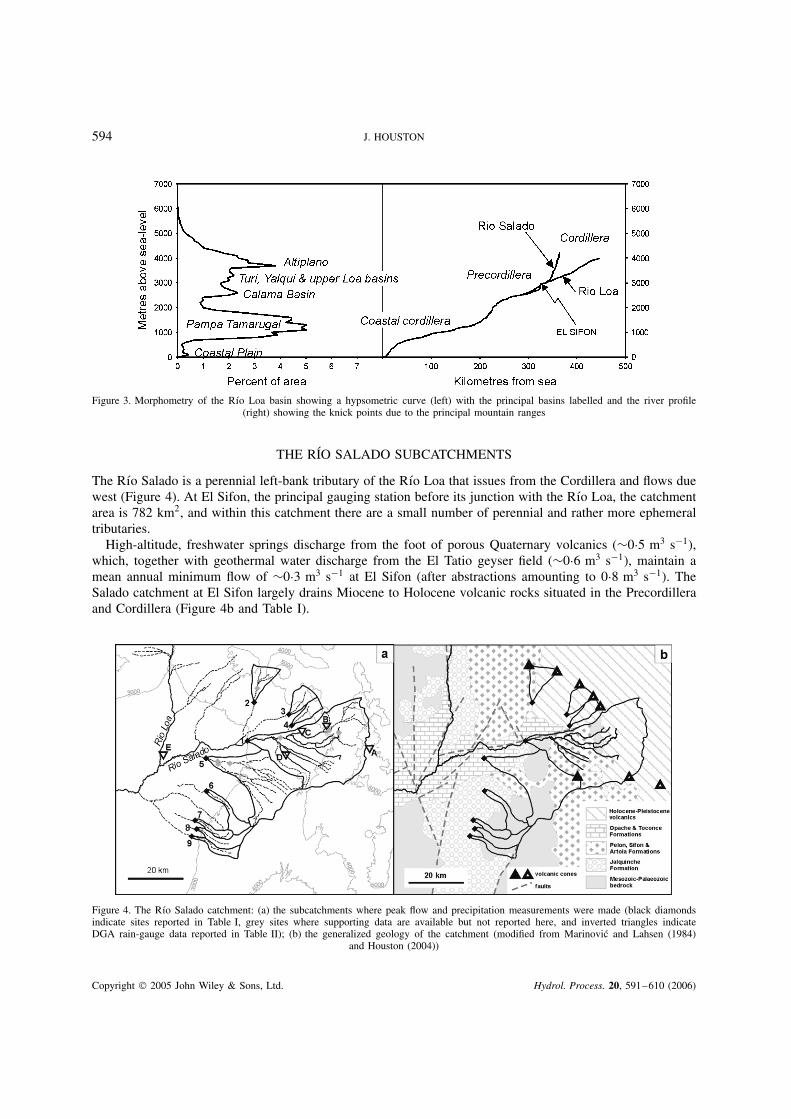
The Rıo Salado is a perennial left-bank tributary of the Rıo Loa that issues from the Cordillera and flows duewest (Figure 4). At El Sifon, the principal gauging station before its junction with the Rıo Loa, the catchmentarea is 782 km2, and within this catchment there are a small number of perennial and rather more ephemeraltributaries.
High-altitude, freshwater springs discharge from the foot of porous Quaternary volcanics (¾0Ð5 m3 s�1),which, together with geothermal water discharge from the El Tatio geyser field (¾0Ð6 m3 s�1), maintain amean annual minimum flow of ¾0Ð3 m3 s�1 at El Sifon (after abstractions amounting to 0Ð8 m3 s�1). TheSalado catchment at El Sifon largely drains Miocene to Holocene volcanic rocks situated in the Precordilleraand Cordillera (Figure 4b and Table I).
Figure 4. The Rıo Salado catchment: (a) the subcatchments where peak flow and precipitation measurements were made (black diamondsindicate sites reported in Table I, grey sites where supporting data are available but not reported here, and inverted triangles indicateDGA rain-gauge data reported in Table II); (b) the generalized geology of the catchment (modified from Marinovic and Lahsen (1984)
and Houston (2004))
Copyright 2005 John Wiley & Sons, Ltd. Hydrol. Process. 20, 591–610 (2006)

THE GREAT ATACAMA FLOOD OF 2001 595
Table I. Morphometric properties of the Salado subcatchments (map nos. refer to Figure 4)
Map no. Catchment UTM N(km)
UTM E(km)
Area(km2)
Min.elevation(m a.s.l.)
Max.elevation(m a.s.l.)
Area-weightedmean
elevation(m a.s.l.)
Basinlength(km)
Basinslope(m/m)
Streamdensity
(km km�2)
Max.streamorder
1 Salado 7535Ð3 567Ð3 781Ð6 2950 5350 3098/3805a 43Ð3 0Ð055 0Ð32 42 Cupo 7549Ð9 569Ð8 68Ð5 3150 3850 3471b 13Ð3 0Ð053 0Ð37 23 Leon 7545Ð5 582Ð8 53Ð3 3350 4700 3997c 12Ð0 0Ð113 0Ð20 14 Amarillo 7541Ð1 583Ð3 42Ð7 3300 4400 3870c 13Ð0 0Ð085 0Ð24 15 Yalqui 7528Ð3 555Ð1 398Ð5 2700 3950 3325b 32Ð7 0Ð038 0Ð40 36 Tuina 7517Ð1 530Ð0 69Ð4 2750 3200 3306b 21Ð3 0Ð021 0Ð17 17 Seca north 7507Ð0 548Ð0 31Ð5 2800 3500 3315b 18Ð7 0Ð037 0Ð53 18 Seca south 7503Ð8 548Ð2 58Ð4 2880 3400 3186b 15Ð3 0Ð033 0Ð22 19 Teca 7501Ð2 547Ð0 38Ð5 2850 3450 3194b 18Ð0 0Ð033 0Ð45 1
a Bimodal hypsometric curve, Precordillera dominant, Cordillera present.b Unimodal hypsometric curve, Precordillera dominant.c Unimodal hypsometric curve, Cordillera dominant.
Two broad types of ephemeral catchment occur: Cupo, Leon and Amarillo, draining the Cordillera withrelatively steep slopes on Quaternary volcanics, and Yalqui, Tuina, Seca and Teca draining the Precordillerawith less steep slopes on a wider variety of geological units.
Phreatic aquifers occur within the Miocene Jalquinche, Opache and Toconce Formations, respectivelycomposed of fluvial continental gravels, sands, gypsiferous silts and clays; fluvial calcareous sandstonesand palustrine limestones; and pyroclastic deposits with intercalated fluvial sands and gravels (May, 1997).The Mesozoic–Palaeozoic basement and the welded ignimbrites of the Miocene Pelon, Sifon and ArtolaFormations (de Silva, 1989), are largely impermeable, frequently causing confinement of underlying aquifers.
The phreatic aquifers are generally in contact with the surface water system, as shown by the continuityof water levels and their similar hydrochemistry (Nazca, 2001a,b). Flow between the surface water andgroundwater systems takes place in both directions, depending on location and stage height. Leakage fromthe rivers takes place where they initially cross an aquifer, particularly during flood periods, and drainagetakes place from the lower sections of the aquifers to the rivers, especially during the dry season, therebymaintaining their perennial nature by baseflow discharge. As a result, the flow profiles of the Rıos Salado andLoa are highly variable throughout their length, varying from less than 0Ð3 m3 s�1 to more than 1Ð2 m3 s�1
during the dry season.
CHARACTERISTICS OF THE REGIONAL CLIMATE
The Atacama Desert owes its hyper-aridity to three principal factors: its zonal location between 15 and 30 °Slies in the sub-tropical high-pressure belt, where descending stable air produced by the Hadley circulationsignificantly reduces convection, and hence precipitation; the proximity of the Andes upwind inhibits moistureadvection from the east, creating a rain shadow; and the cold Peruvian Current, which upwells along the coast,inhibits the moisture capacity of onshore winds, creating a persistent inversion that traps any Pacific moisturebelow 800 m a.s.l.
The boundary between summer-dominated precipitation towards the north and winter-dominated precip-itation towards the south occurs in the central Atacama between 20 and 25 °S. During the austral summer(December–March), the Andes experience rainfall when atmospheric circulation, dependent on the locationand intensity of the Bolivian high, allows the advection of moist air from Amazonia (Fuenzalida and Rut-llant, 1986; Lenters and Cook, 1997; Garreaud, 1999). Wet episodes tend to occur throughout the western
Copyright 2005 John Wiley & Sons, Ltd. Hydrol. Process. 20, 591–610 (2006)
596 J. HOUSTON
Cordillera and Altiplano when strong low-level easterly winds from Amazonia transport adequate moistureto create saturation during uplift within deep convection cells (Garreaud et al., 2003). Wet episodes lastingaround 5 days tend to be separated by dry periods of around 10 days, with one to three such cycles typicallyoccurring within the period December to March.
As a consequence of the rain shadow, mean annual precipitation declines rapidly from over 300 mm at5000 m a.s.l. to 20 mm at 2300 m a.s.l. on the west slope of the Andes (Houston and Hartley, 2003). Below2300 m a.s.l., associated with the Longitudinal Valley, is a zone of extreme hyper-aridity where mean annualprecipitation is less than 1 mm, due partly to the descending return flow of daytime upslope winds in thelocal circulation cell above the inversion layer (Rutllant et al., 2003).
Winter rainfall is largely sourced from northerly and easterly moving frontal systems originating from thePacific (Vuille and Ammann, 1997), and within the core area of the Atacama contributes less than 30% ofthe mean annual rainfall.
Annual variation in summer precipitation is considerable. The coefficient of variation is generally between0Ð6 and 1Ð0 above 3000 m a.s.l., but this increases to as much as 2Ð8 in the Longitudinal Valley. Interannualvariation (2–5 years) is considered to be largely due to the influence of the El Nino–Southern Oscillation(ENSO; Aceituno, 1988; Vuille, 1999; Garreaud and Aceituno, 2001). The warm-phase ENSO (El Nino) tendsto produce dry conditions over the western Cordillera and Altiplano, whereas the reverse is true for the coldphase ENSO (La Nina). The forcing mechanism appears to act through the collective and interdependentimpact of Pacific sea-surface temperatures (SSTs), the strength of the upper level westerlies and the positionof the Bolivian high.
In addition to ENSO variability, there is a tendency for wet (dry) years to cluster on a decadal scale.Reid (1987) and Enfield (1992) argue for a link between decadal–centennial variations in SST and solaractivity, Svensmark and Friis-Christensen (1997) suggest reduced solar activity increases global cloud cover,and Garreaud and Battisti (1999) infer that ENSO and decadal variations are forced by surface heat fluxanomalies, which in turn may be under the influence of solar activity (Labitzke and Matthes, 2003; Oh et al.,2003). Such ideas, whilst still controversial, might explain a precipitation–solar activity (decadal) correlationas reported by Clayton (1923) for parts of Chile.
The hyper-aridity of the Atacama Desert is also a result of very high evapotranspiration rates, whichsignificantly impact the hydrological system. Transpiration losses are effectively limited to areas of riparianvegetation adjacent to perennial rivers where a broad floodplain exists, whereas evaporation is significant fromflooded areas and soils where the water table is close to the surface. These areas amount to approximately 1%of the Calama basin and 2Ð5% of the Salado catchment. Evaporation from saturated soils decreases rapidlywith depth to water, usually extinguishing by 1Ð5 m (unpublished micrometeorological and lysimeter data).
Analysis of pan evaporation data from the DGA for 11 stations spread through the northern Chilean Atacamaover the period 1977–95 indicates that interannual variation is considerably less than that of precipitation,with coefficients of variation ranging from 0Ð05 to 0Ð25, unrelated to elevation. Nevertheless, mean annualevaporation rates are significantly positively correlated with temperature (r D 0Ð89, p < 0Ð001), and hencenegatively correlated with elevation (r D 0Ð94, p < 0Ð001). The highest rates, over 3500 mm year�1 occurbetween 1000 and 2000 m a.s.l., declining to less than 2000 mm year�1 above 4000 m a.s.l. Clearly, suchrates are only sustainable for short periods of time from open water and are severely reduced when soilmoisture deficits develop during most of the year.
WEATHER CONDITIONS DURING SUMMER 2001
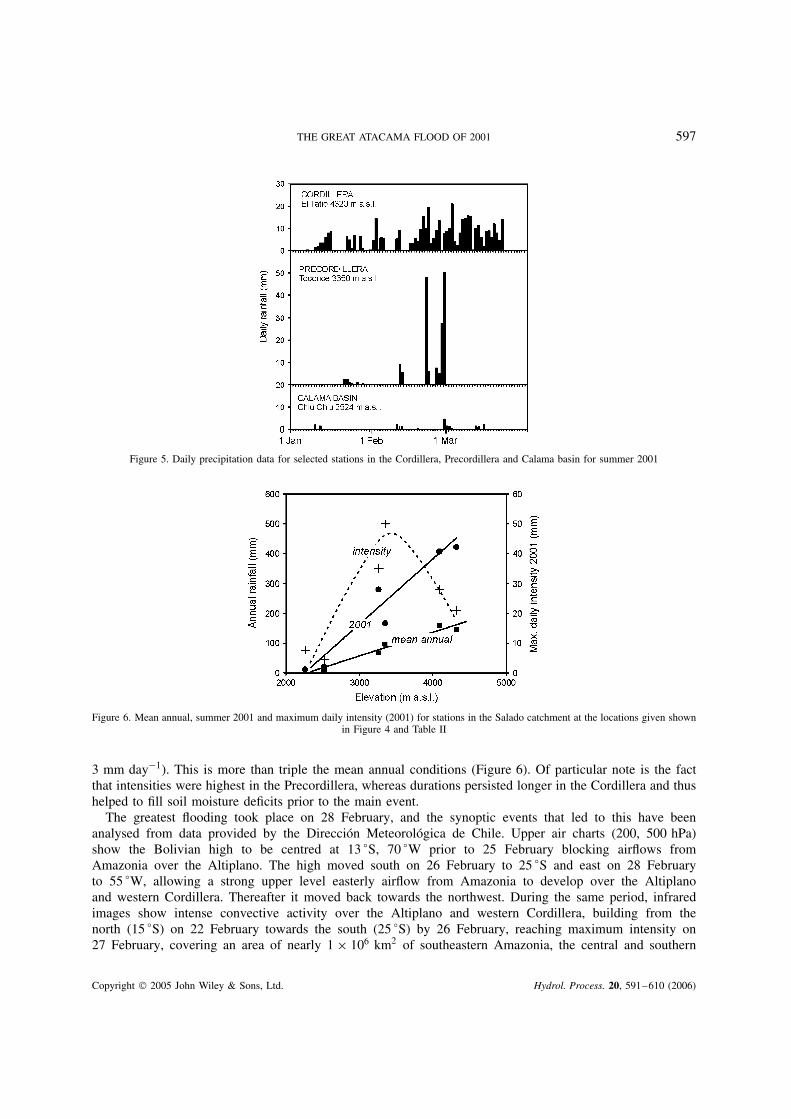
Analysis of daily rainfall at five DGA stations (see Figure 5 and Table II for locations) shows multipleprecipitation events during summer (January–March) 2001 with more than 50 rain-days in the Cordillera,of which an average of 12 days experienced intensities over 10 mm day�1 (Figure 6). The Precordillera,recorded an average of 26 rain-days (seven over 10 mm day�1) and 8 days in the Calama basin (two over
Copyright 2005 John Wiley & Sons, Ltd. Hydrol. Process. 20, 591–610 (2006)
THE GREAT ATACAMA FLOOD OF 2001 597
Figure 5. Daily precipitation data for selected stations in the Cordillera, Precordillera and Calama basin for summer 2001
Figure 6. Mean annual, summer 2001 and maximum daily intensity (2001) for stations in the Salado catchment at the locations given shownin Figure 4 and Table II
3 mm day�1). This is more than triple the mean annual conditions (Figure 6). Of particular note is the factthat intensities were highest in the Precordillera, whereas durations persisted longer in the Cordillera and thushelped to fill soil moisture deficits prior to the main event.
The greatest flooding took place on 28 February, and the synoptic events that led to this have beenanalysed from data provided by the Direccion Meteorologica de Chile. Upper air charts (200, 500 hPa)show the Bolivian high to be centred at 13 °S, 70 °W prior to 25 February blocking airflows fromAmazonia over the Altiplano. The high moved south on 26 February to 25 °S and east on 28 Februaryto 55 °W, allowing a strong upper level easterly airflow from Amazonia to develop over the Altiplanoand western Cordillera. Thereafter it moved back towards the northwest. During the same period, infraredimages show intense convective activity over the Altiplano and western Cordillera, building from thenorth (15 °S) on 22 February towards the south (25 °S) by 26 February, reaching maximum intensity on27 February, covering an area of nearly 1 ð 106 km2 of southeastern Amazonia, the central and southern
Copyright 2005 John Wiley & Sons, Ltd. Hydrol. Process. 20, 591–610 (2006)
598 J. HOUSTON
Table II. Summer 2001 precipitation at stations within the Salado catchment (map references refer to Figure 4)
Mapreference
Station UTM N(km)
UTM W(km)
Elevation(m a.s.l.)
Mean annualrainfall(mm)
Summer 2001rainfall(mm)
Max. dailyrainfall(mm)
A El Tatio 7526Ð2 603Ð0 4320 144 422 21B Linzor 7544Ð7 604Ð8 4096 159 406 28C Toconce 7539Ð2 585Ð9 3350 96 167 50D Caspana 7539Ð1 580Ð7 3260 66 280 35E Chiu Chiu 7530Ð2 536Ð0 2524 4Ð2 20Ð3 4Ð5
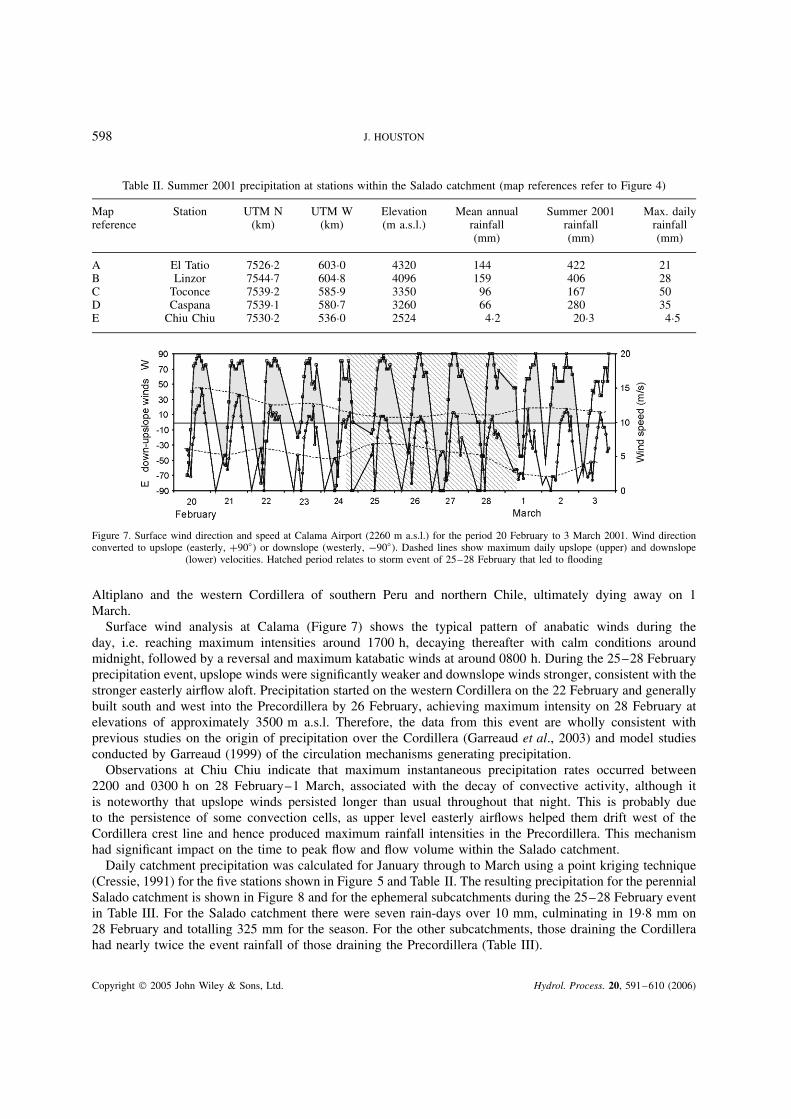
Figure 7. Surface wind direction and speed at Calama Airport (2260 m a.s.l.) for the period 20 February to 3 March 2001. Wind directionconverted to upslope (easterly, C90°) or downslope (westerly, �90°). Dashed lines show maximum daily upslope (upper) and downslope
(lower) velocities. Hatched period relates to storm event of 25–28 February that led to flooding
Altiplano and the western Cordillera of southern Peru and northern Chile, ultimately dying away on 1March.
Surface wind analysis at Calama (Figure 7) shows the typical pattern of anabatic winds during theday, i.e. reaching maximum intensities around 1700 h, decaying thereafter with calm conditions aroundmidnight, followed by a reversal and maximum katabatic winds at around 0800 h. During the 25–28 Februaryprecipitation event, upslope winds were significantly weaker and downslope winds stronger, consistent with thestronger easterly airflow aloft. Precipitation started on the western Cordillera on the 22 February and generallybuilt south and west into the Precordillera by 26 February, achieving maximum intensity on 28 February atelevations of approximately 3500 m a.s.l. Therefore, the data from this event are wholly consistent withprevious studies on the origin of precipitation over the Cordillera (Garreaud et al., 2003) and model studiesconducted by Garreaud (1999) of the circulation mechanisms generating precipitation.
Observations at Chiu Chiu indicate that maximum instantaneous precipitation rates occurred between2200 and 0300 h on 28 February–1 March, associated with the decay of convective activity, although itis noteworthy that upslope winds persisted longer than usual throughout that night. This is probably dueto the persistence of some convection cells, as upper level easterly airflows helped them drift west of theCordillera crest line and hence produced maximum rainfall intensities in the Precordillera. This mechanismhad significant impact on the time to peak flow and flow volume within the Salado catchment.
Daily catchment precipitation was calculated for January through to March using a point kriging technique(Cressie, 1991) for the five stations shown in Figure 5 and Table II. The resulting precipitation for the perennialSalado catchment is shown in Figure 8 and for the ephemeral subcatchments during the 25–28 February eventin Table III. For the Salado catchment there were seven rain-days over 10 mm, culminating in 19Ð8 mm on28 February and totalling 325 mm for the season. For the other subcatchments, those draining the Cordillerahad nearly twice the event rainfall of those draining the Precordillera (Table III).
Copyright 2005 John Wiley & Sons, Ltd. Hydrol. Process. 20, 591–610 (2006)
THE GREAT ATACAMA FLOOD OF 2001 599
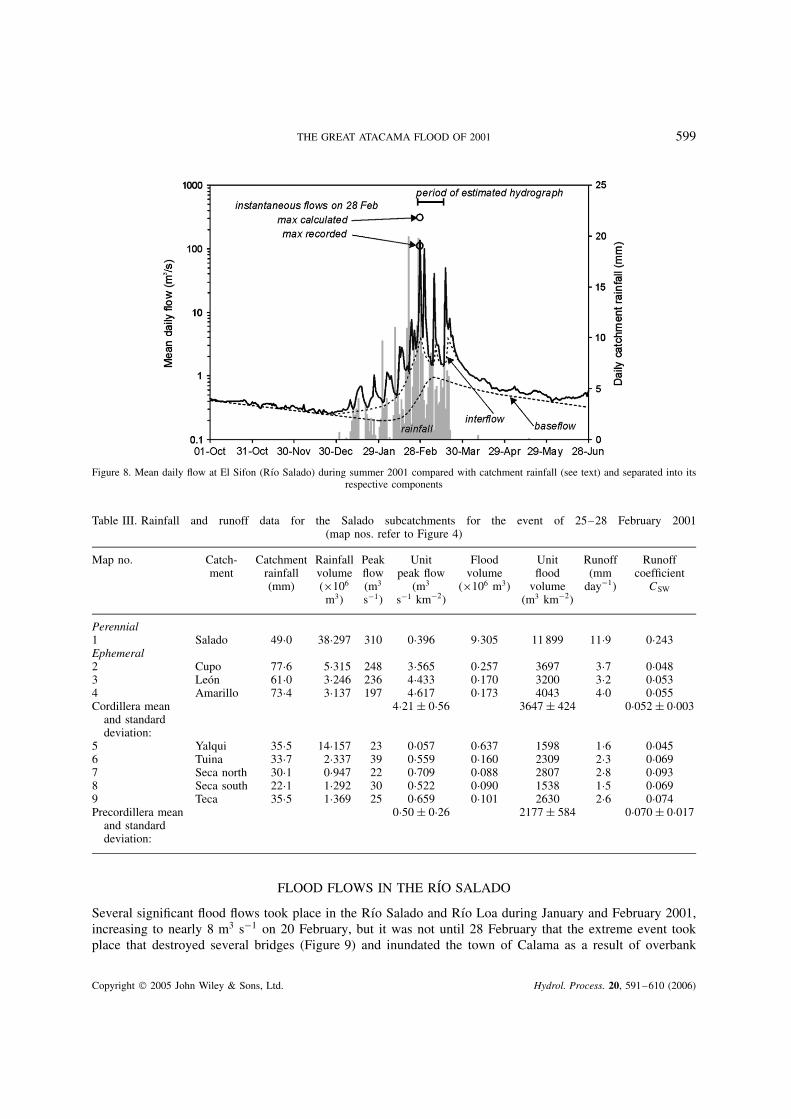
Figure 8. Mean daily flow at El Sifon (Rıo Salado) during summer 2001 compared with catchment rainfall (see text) and separated into itsrespective components
Table III. Rainfall and runoff data for the Salado subcatchments for the event of 25–28 February 2001(map nos. refer to Figure 4)
Map no. Catch-ment
Catchmentrainfall(mm)
Rainfallvolume(ð106
m3)
Peakflow(m3
s�1)
Unitpeak flow
(m3
s�1 km�2)
Floodvolume
(ð106 m3)
Unitflood
volume(m3 km�2)
Runoff(mm
day�1)
Runoffcoefficient
CSW
Perennial1 Salado 49Ð0 38Ð297 310 0Ð396 9Ð305 11 899 11Ð9 0Ð243Ephemeral2 Cupo 77Ð6 5Ð315 248 3Ð565 0Ð257 3697 3Ð7 0Ð0483 Leon 61Ð0 3Ð246 236 4Ð433 0Ð170 3200 3Ð2 0Ð0534 Amarillo 73Ð4 3Ð137 197 4Ð617 0Ð173 4043 4Ð0 0Ð055Cordillera mean
and standarddeviation:
4Ð21 š 0Ð56 3647 š 424 0Ð052 š 0Ð003
5 Yalqui 35Ð5 14Ð157 23 0Ð057 0Ð637 1598 1Ð6 0Ð0456 Tuina 33Ð7 2Ð337 39 0Ð559 0Ð160 2309 2Ð3 0Ð0697 Seca north 30Ð1 0Ð947 22 0Ð709 0Ð088 2807 2Ð8 0Ð0938 Seca south 22Ð1 1Ð292 30 0Ð522 0Ð090 1538 1Ð5 0Ð0699 Teca 35Ð5 1Ð369 25 0Ð659 0Ð101 2630 2Ð6 0Ð074Precordillera mean
and standarddeviation:
0Ð50 š 0Ð26 2177 š 584 0Ð070 š 0Ð017
FLOOD FLOWS IN THE RIO SALADO
Several significant flood flows took place in the Rıo Salado and Rıo Loa during January and February 2001,increasing to nearly 8 m3 s�1 on 20 February, but it was not until 28 February that the extreme event tookplace that destroyed several bridges (Figure 9) and inundated the town of Calama as a result of overbank
Copyright 2005 John Wiley & Sons, Ltd. Hydrol. Process. 20, 591–610 (2006)
600 J. HOUSTON
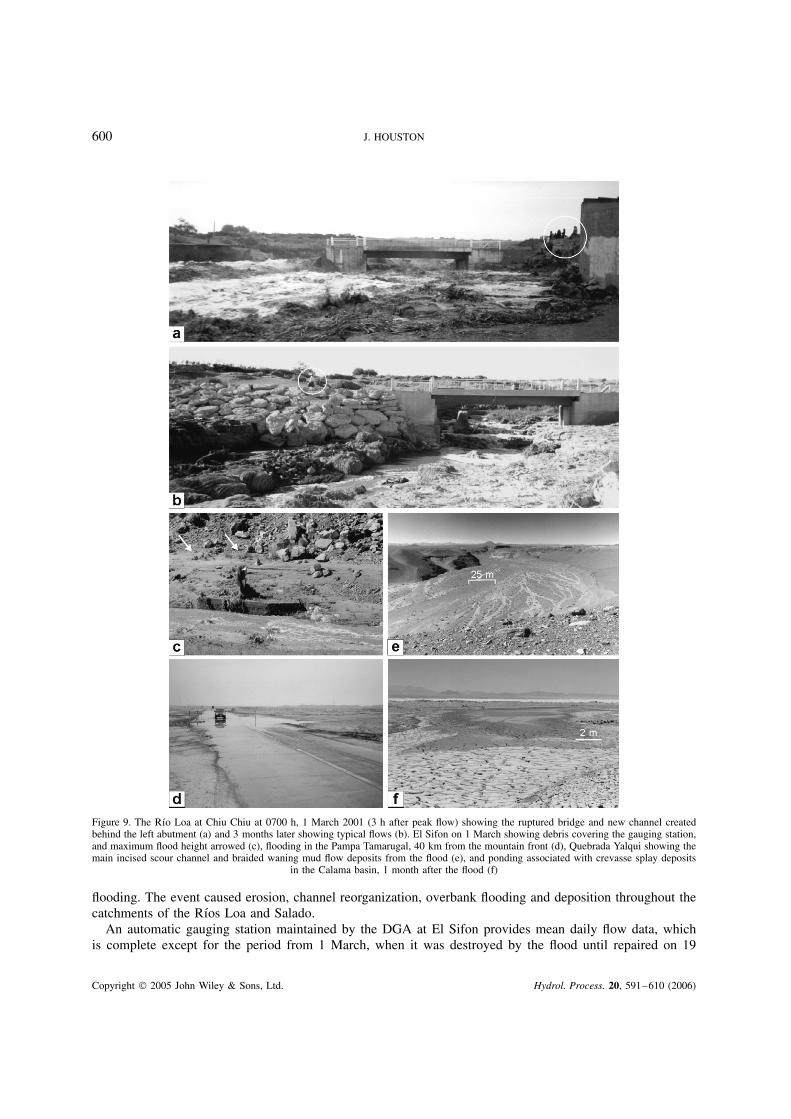
Figure 9. The Rıo Loa at Chiu Chiu at 0700 h, 1 March 2001 (3 h after peak flow) showing the ruptured bridge and new channel createdbehind the left abutment (a) and 3 months later showing typical flows (b). El Sifon on 1 March showing debris covering the gauging station,and maximum flood height arrowed (c), flooding in the Pampa Tamarugal, 40 km from the mountain front (d), Quebrada Yalqui showing themain incised scour channel and braided waning mud flow deposits from the flood (e), and ponding associated with crevasse splay deposits
in the Calama basin, 1 month after the flood (f)
flooding. The event caused erosion, channel reorganization, overbank flooding and deposition throughout thecatchments of the Rıos Loa and Salado.
An automatic gauging station maintained by the DGA at El Sifon provides mean daily flow data, whichis complete except for the period from 1 March, when it was destroyed by the flood until repaired on 19
Copyright 2005 John Wiley & Sons, Ltd. Hydrol. Process. 20, 591–610 (2006)
THE GREAT ATACAMA FLOOD OF 2001 601
March. Missing data were interpolated based on catchment daily rainfall and calibrated against the maximuminstantaneous flow (a) recorded prior to destruction and (b) calculated from surveys of maximum flood levelsand analysed using the slope–area method (Benson, 1968) coupled with the Soil Conservation Service (SCS)unit hydrograph (US SCS, 1972) which have been shown to give reliable results in northern Chile (Houston,2002). The resulting hydrograph shows 10 rainfall events associated with an equivalent number of flow peaksthrough the season (Figure 8). The calculated maximum instantaneous and mean daily flows occurred on 28February with rates of 310 m3 s�1 and 136 m3 s�1 respectively. This compares with typical annual maximummean daily flows of 2–8 m3 s�1 (1978–2000), with the previous highest recorded being 25 m3 s�1 in 1999.
Assuming a simple three-part hydrograph (Horton, 1933; Barnes, 1939), it is possible to separate thecomponents of baseflow, interflow and overland flow (Figure 8) using an automated technique (Rutledge,1998). Based on daily data between 1978 and 2000, the master recession curve for the Rıo Salado at El Sifonhas a baseflow recession constant k of 0Ð997, but for the period October–December 2000 it was 0Ð995, dueto the prior wet year (1999) and consequent higher initial groundwater (baseflow discharge) levels, indicatingnon-linear storage reservoirs.
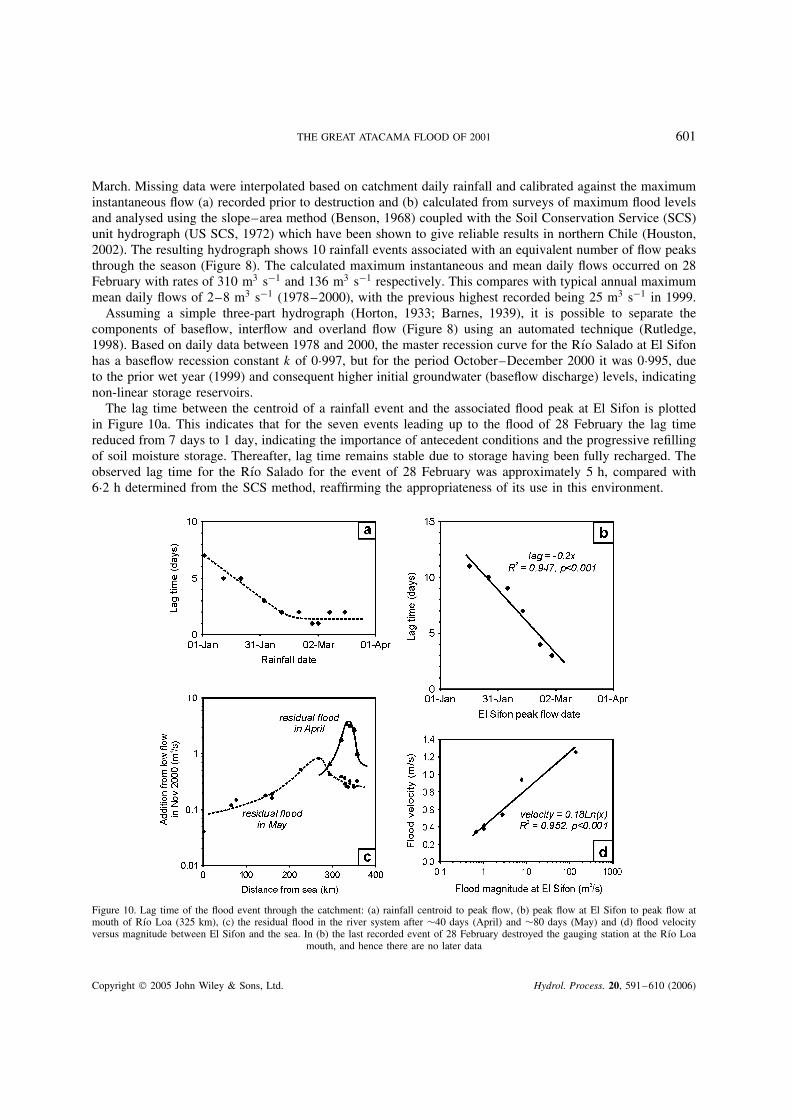
The lag time between the centroid of a rainfall event and the associated flood peak at El Sifon is plottedin Figure 10a. This indicates that for the seven events leading up to the flood of 28 February the lag timereduced from 7 days to 1 day, indicating the importance of antecedent conditions and the progressive refillingof soil moisture storage. Thereafter, lag time remains stable due to storage having been fully recharged. Theobserved lag time for the Rıo Salado for the event of 28 February was approximately 5 h, compared with6Ð2 h determined from the SCS method, reaffirming the appropriateness of its use in this environment.
Figure 10. Lag time of the flood event through the catchment: (a) rainfall centroid to peak flow, (b) peak flow at El Sifon to peak flow atmouth of Rıo Loa (325 km), (c) the residual flood in the river system after ¾40 days (April) and ¾80 days (May) and (d) flood velocityversus magnitude between El Sifon and the sea. In (b) the last recorded event of 28 February destroyed the gauging station at the Rıo Loa
mouth, and hence there are no later data
Copyright 2005 John Wiley & Sons, Ltd. Hydrol. Process. 20, 591–610 (2006)
602 J. HOUSTON
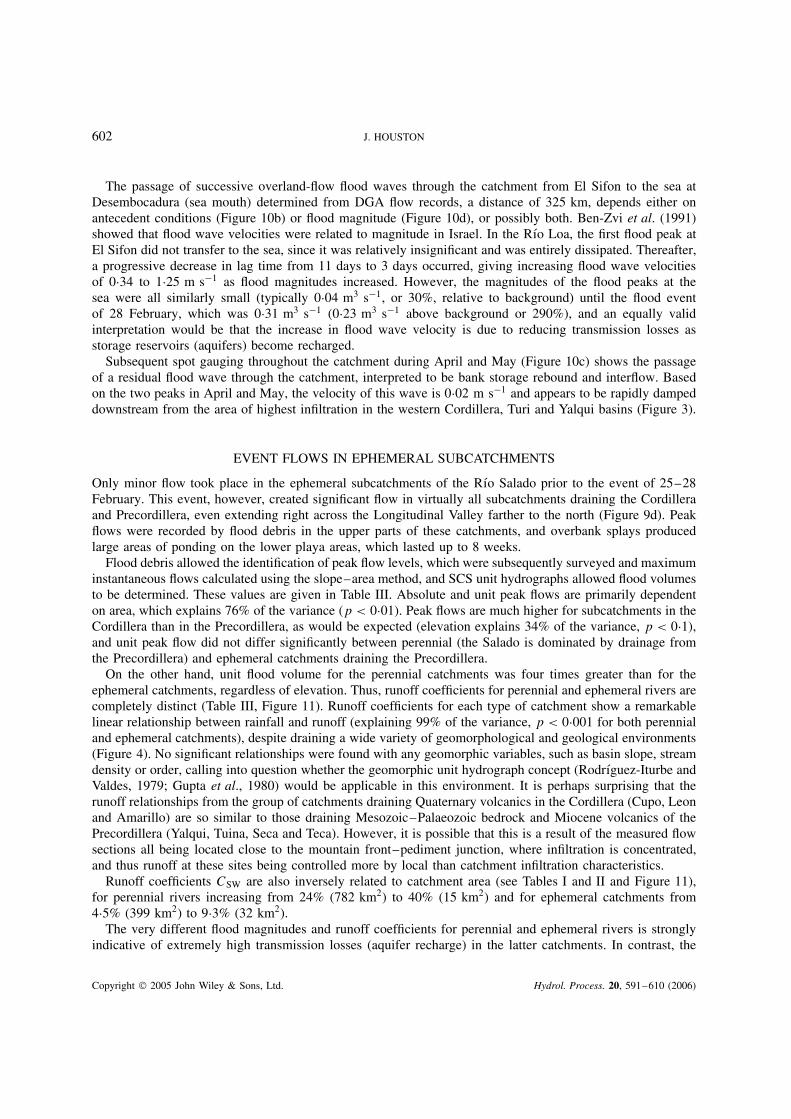
The passage of successive overland-flow flood waves through the catchment from El Sifon to the sea atDesembocadura (sea mouth) determined from DGA flow records, a distance of 325 km, depends either onantecedent conditions (Figure 10b) or flood magnitude (Figure 10d), or possibly both. Ben-Zvi et al. (1991)showed that flood wave velocities were related to magnitude in Israel. In the Rıo Loa, the first flood peak atEl Sifon did not transfer to the sea, since it was relatively insignificant and was entirely dissipated. Thereafter,a progressive decrease in lag time from 11 days to 3 days occurred, giving increasing flood wave velocitiesof 0Ð34 to 1Ð25 m s�1 as flood magnitudes increased. However, the magnitudes of the flood peaks at thesea were all similarly small (typically 0Ð04 m3 s�1, or 30%, relative to background) until the flood eventof 28 February, which was 0Ð31 m3 s�1 (0Ð23 m3 s�1 above background or 290%), and an equally validinterpretation would be that the increase in flood wave velocity is due to reducing transmission losses asstorage reservoirs (aquifers) become recharged.
Subsequent spot gauging throughout the catchment during April and May (Figure 10c) shows the passageof a residual flood wave through the catchment, interpreted to be bank storage rebound and interflow. Basedon the two peaks in April and May, the velocity of this wave is 0Ð02 m s�1 and appears to be rapidly dampeddownstream from the area of highest infiltration in the western Cordillera, Turi and Yalqui basins (Figure 3).
EVENT FLOWS IN EPHEMERAL SUBCATCHMENTS
Only minor flow took place in the ephemeral subcatchments of the Rıo Salado prior to the event of 25–28February. This event, however, created significant flow in virtually all subcatchments draining the Cordilleraand Precordillera, even extending right across the Longitudinal Valley farther to the north (Figure 9d). Peakflows were recorded by flood debris in the upper parts of these catchments, and overbank splays producedlarge areas of ponding on the lower playa areas, which lasted up to 8 weeks.
Flood debris allowed the identification of peak flow levels, which were subsequently surveyed and maximuminstantaneous flows calculated using the slope–area method, and SCS unit hydrographs allowed flood volumesto be determined. These values are given in Table III. Absolute and unit peak flows are primarily dependenton area, which explains 76% of the variance (p < 0Ð01). Peak flows are much higher for subcatchments in theCordillera than in the Precordillera, as would be expected (elevation explains 34% of the variance, p < 0Ð1),and unit peak flow did not differ significantly between perennial (the Salado is dominated by drainage fromthe Precordillera) and ephemeral catchments draining the Precordillera.
On the other hand, unit flood volume for the perennial catchments was four times greater than for theephemeral catchments, regardless of elevation. Thus, runoff coefficients for perennial and ephemeral rivers arecompletely distinct (Table III, Figure 11). Runoff coefficients for each type of catchment show a remarkablelinear relationship between rainfall and runoff (explaining 99% of the variance, p < 0Ð001 for both perennialand ephemeral catchments), despite draining a wide variety of geomorphological and geological environments(Figure 4). No significant relationships were found with any geomorphic variables, such as basin slope, streamdensity or order, calling into question whether the geomorphic unit hydrograph concept (Rodrıguez-Iturbe andValdes, 1979; Gupta et al., 1980) would be applicable in this environment. It is perhaps surprising that therunoff relationships from the group of catchments draining Quaternary volcanics in the Cordillera (Cupo, Leonand Amarillo) are so similar to those draining Mesozoic–Palaeozoic bedrock and Miocene volcanics of thePrecordillera (Yalqui, Tuina, Seca and Teca). However, it is possible that this is a result of the measured flowsections all being located close to the mountain front–pediment junction, where infiltration is concentrated,and thus runoff at these sites being controlled more by local than catchment infiltration characteristics.
Runoff coefficients CSW are also inversely related to catchment area (see Tables I and II and Figure 11),for perennial rivers increasing from 24% (782 km2) to 40% (15 km2) and for ephemeral catchments from4Ð5% (399 km2) to 9Ð3% (32 km2).
The very different flood magnitudes and runoff coefficients for perennial and ephemeral rivers is stronglyindicative of extremely high transmission losses (aquifer recharge) in the latter catchments. In contrast, the
Copyright 2005 John Wiley & Sons, Ltd. Hydrol. Process. 20, 591–610 (2006)

THE GREAT ATACAMA FLOOD OF 2001 603
Figure 11. Runoff volume plotted against rainfall volume for stations in Table III (solid) with additional data not provided herein (open).Figures attached to data points are runoff coefficients
higher magnitudes in perennial rivers may be attributed to their greater incision, which causes them to be inconstant contact with the groundwater phreatic surface, hence allowing perennial discharge and limiting floodflow infiltration capacity in materials that are already partially saturated.
EVALUATION OF THE RETURN PERIOD
Extreme events are notoriously difficult to analyse, especially if records are short and climatic non-stationarityis suspected (Kochel and Baker, 1982; US NRC, 1999). The log Pearson type III (LP3) distribution can,however, provide acceptable fits to hydrological extremes in a wide variety of situations (US WRC, 1981;Lopez et al., 2002) and was used to estimate return periods for rainfall and Rıo Salado flows at El Sifon(Table IV); no data exist to estimate return flows for ephemeral streams.
Table IV. Return periods associated with rainfall and runoff for summer 2001 based on 23 years data (1977–2000)
Rainfall intensity Rain days Runoff>10 mm day�1
Daily Monthly Annual Daily Monthly Annual
El Tatio 8 12 20 65Linzor 11 14 20 60Toconce 70 15 14 8Caspana 45 15 35 25Chiu Chiu n/a 14 20 n/aEl Sifon 120 150 170Mean š SD 34 š 30 14 š 1 22 š 8 40 š 28
Copyright 2005 John Wiley & Sons, Ltd. Hydrol. Process. 20, 591–610 (2006)

604 J. HOUSTON
Daily maximum rainfall return periods vary considerably, suggesting that, although the storm event of25–28 February was widespread throughout the Altiplano and northern Chile, multi-cell convection intensitywas locally variable, partly as a result of invigoration by upslope wind convergence within the topographicamphitheatre of the Turi Basin and partly as a result of internal cell dynamics creating local downbursts withintense precipitation (typically associated with convective decay, as noted above).
Annual return periods are greater than monthly return periods due to the longevity of precipitationthroughout the summer of 2001, and this longevity is unusual, as shown by the high return periods forthe number of rain-days over 10 mm, especially in the Cordillera.
The extreme flood flows at El Sifon on the Rıo Salado during 2001 tend to give equivocal fits to an LP3distribution. The best estimates are given in Table IV, and suggest that the flows had a return period ofbetween 100 and 200 years. Under any circumstances, the non-linearity of the rainfall-runoff process is thusevident.
AQUIFER RECHARGE DUE TO FLOOD WATER INFILTRATION
Phreatic aquifers occur in the Opache and Toconce Formations of the Calama and Turi basins respectively.These aquifers have typical saturated thicknesses from 50 to 100 m, and are in hydraulic contact with theperennial Rıos Salado and Loa. Monitoring wells penetrating these aquifers record the flood event of summer2001 as recharge, initiated immediately after the flood event and peaking around May 2001, some 3 monthslater, as a result of the buffering effect of the groundwater reservoir (Figure 12). The rise in hydrograph iswidespread through the basins, but is of variable magnitude due to aquifer and recharge heterogeneity. Sincethe hydraulic gradient of the phreatic surface is relatively high (0Ð008–0Ð012), it can be assumed that rechargeover large areas distant from the perennial rivers is due to either direct precipitation infiltration or flood flowinfiltration from ephemeral streams.
The volume of recharge can be estimated by making a number of assumptions:
1. The majority of recharge occurs close to the mountain front, where ephemeral rivers discharge onto thepediment surface.
2. Recharge at the mountain front is transmitted through the aquifer.3. The recharge coefficient CGW D �1 � CSW�.4. The measured subcatchments are representative of non-measured areas.
Assumptions 1 and 2 were demonstrated by Houston (2002) to be true for the Pampa Tamarugal in theLongitudinal Valley of northern Chile and are generally accepted as common in arid zones (Simmers, 1997).Assumption 3 is considered reasonable because: (a) all flow downstream of the measurement points (closeto the mountain front) can be conservatively assumed to evaporate, so that (1 � CSW) represents all waterprecipitated over the catchment that did not flow past the measuring point; (b) evaporation losses above themeasuring point are effectively zero, because nearly 90% of the flood in the ephemeral channels occurred in asingle night, whilst cloudy convective conditions prevailed, preventing insolation and lowering temperatures(Garreaud, 2000), and, as a result, (1 � CSW) becomes equivalent to groundwater recharge. Assumption 4 isalso reasonable, given the similarity of catchment response demonstrated previously.
As a result, the total volume of recharge for the two catchments distant from the perennial rivers canbe estimated (Table V). This can be checked by making predictions of the phreatic water level (GWL) risebased on assumed values of specific yield (Sy) for the aquifers and comparing with observed GWL risein the monitoring wells. In both basins it can be seen that the mean observed GWL rise is close to thatpredicted for an Sy of �1Ð0–1Ð5� ð 10�1. Pumping tests on wells in the Turi basin give a range of values forSy of �0Ð3–1Ð2� ð 10�1 and in the Calama basin of �0Ð7–1Ð5� ð 10�1, thereby confirming the validity of theestimates.
Copyright 2005 John Wiley & Sons, Ltd. Hydrol. Process. 20, 591–610 (2006)

THE GREAT ATACAMA FLOOD OF 2001 605
Figure 12. Groundwater response to the flood event. Hydrographs from wells in the Calama and Turi basins (above) show the impact ofrecharge. Map of well locations and generalized aquifer zones for which recharge was calculated (below) giving the observed GWL rise inOctober 2001 as extrapolated from the prior recession. Also shown are contours (100 m interval) on the surface of the phreatic water table
Table V. Recharge estimates due to event of 25–28 February 2001
Basin Groundwater rechargevolume (ð106 m3)
Event rechargecoefficient CGW
Predicted GWL rise based onassumed Sy values (m)
Observed meanGWL rise (m)
Sy D 0Ð05 Sy D 0Ð10 Sy D 0Ð15
Turi 33Ð3 0Ð949 1Ð48 0Ð74 0Ð49 0Ð65Calamaa 31Ð6 0Ð946 0Ð97 0Ð49 0Ð33 0Ð34
a Southeast sector only; see grey area on Figure 12.
CAUSES OF THE FLOOD
The origin of the 2001 flood lies primarily in the weather conditions during summer 2001: (a) extensive rainfallover the western Cordillera over an exceptionally long period and (b) intense rainfall in the Precordillera, and
Copyright 2005 John Wiley & Sons, Ltd. Hydrol. Process. 20, 591–610 (2006)
606 J. HOUSTON
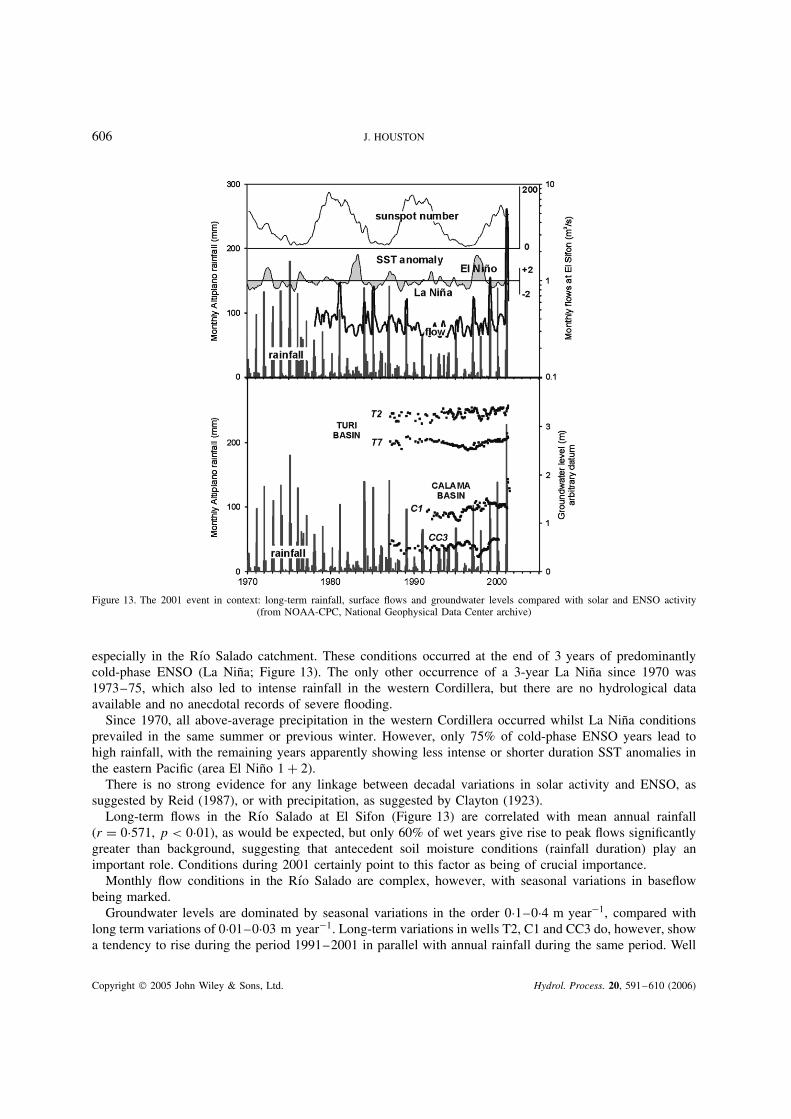
Figure 13. The 2001 event in context: long-term rainfall, surface flows and groundwater levels compared with solar and ENSO activity(from NOAA-CPC, National Geophysical Data Center archive)
especially in the Rıo Salado catchment. These conditions occurred at the end of 3 years of predominantlycold-phase ENSO (La Nina; Figure 13). The only other occurrence of a 3-year La Nina since 1970 was1973–75, which also led to intense rainfall in the western Cordillera, but there are no hydrological dataavailable and no anecdotal records of severe flooding.
Since 1970, all above-average precipitation in the western Cordillera occurred whilst La Nina conditionsprevailed in the same summer or previous winter. However, only 75% of cold-phase ENSO years lead tohigh rainfall, with the remaining years apparently showing less intense or shorter duration SST anomalies inthe eastern Pacific (area El Nino 1 C 2).
There is no strong evidence for any linkage between decadal variations in solar activity and ENSO, assuggested by Reid (1987), or with precipitation, as suggested by Clayton (1923).
Long-term flows in the Rıo Salado at El Sifon (Figure 13) are correlated with mean annual rainfall(r D 0Ð571, p < 0Ð01), as would be expected, but only 60% of wet years give rise to peak flows significantlygreater than background, suggesting that antecedent soil moisture conditions (rainfall duration) play animportant role. Conditions during 2001 certainly point to this factor as being of crucial importance.
Monthly flow conditions in the Rıo Salado are complex, however, with seasonal variations in baseflowbeing marked.
Groundwater levels are dominated by seasonal variations in the order 0Ð1–0Ð4 m year�1, compared withlong term variations of 0Ð01–0Ð03 m year�1. Long-term variations in wells T2, C1 and CC3 do, however, showa tendency to rise during the period 1991–2001 in parallel with annual rainfall during the same period. Well
Copyright 2005 John Wiley & Sons, Ltd. Hydrol. Process. 20, 591–610 (2006)
THE GREAT ATACAMA FLOOD OF 2001 607
T7 suggests that GWLs were still in long-term recession during 1990–96, before responding to the increasedrainfall by the mid–late 1990s. This may indicate that the source of recharge to the aquifer penetrated by T7is distant. All wells responded relatively dramatically to the 2001 event.
Therefore, both surface and groundwater respond to long-term and short-term variations in precipitation;but the relationship is not simple, and the impact of additional controlling factors, such as aquifer compaction,seasonal variations in evaporation and winter snowfall/snowmelt, requires further investigation.
GEOMORPHOLOGICAL IMPACTS OF THE FLOOD
The flood of 28 February generated high energies in the ephemeral channels; a maximum of >5000 W m�2
(mean ¾3000 W m�2) in the Cordillera, and between 100 and 1000 W m�2 in the Precordillera. At El Sifon,on the Rıo Salado, the maximum specific stream power was 425 W m�2. Such high energies necessarilycaused considerable erosion and channel change (Figure 9). In the Turi basin, several new distributary channelsformed on the pediment-playa surfaces with incisions up to 2 m depth and 5 m width, causing widespreaddisruption to gravel roads.
The perennial Rıos Loa and Salado have high-energy, confined floodplains (Nanson and Croke, 1992)throughout considerable sections of their length; but, even where confined by ‘bedrock’, channels changedlocation (Figure 9a), causing considerable damage. In the perennial rivers, extreme levels of suspendedsediment and bedload exacerbated scour and incision; and although erosion dominated the upper and middlereaches, even in the lower reaches bank erosion took place, alternating with aggradation of sand and gravelbars and crevasse splays, with considerable volumes of sediment being evacuated from the catchment. AtDesembocadura, specific stream power was estimated to have declined to less than 5 W m�2.
Overbank flooding and mudflows occurred almost universally in both ephemeral and perennial catchments,creating large areas of standing water within basin playas and in the town of Calama, and ultimately depositinglarge areas (hundreds of square kilometres) and thicknesses (to ¾1 m) of fine-grained sediments. In sectionswhere the channel was not well confined or was braided, incision in part of the channel was balanced byoverbank deposition and the consequent generation of terraces (Figure 9e), which would appear to be typicalfor floods in such environments (Hooke and Mant, 2002).
Based on the known extent of the flood deposits and 15 profiles, Quebrada Tuina is estimated to haveredistributed up to 5 km3 of sediment from the Precordillera to the Calama basin playa (Figure 9f), representing¾70 mm erosion over the catchment (assuming similar densities for eroded and deposited materials, which isnot unreasonable considering the Precordillera catchments have a widespread cover of cohesionless aridisols).
IMPLICATIONS FOR PALAEOENVIRONMENTAL INTERPRETATION, HAZARD MANAGEMENTAND WATER RESOURCES
Flooding in the Atacama Desert is generally associated with El Nino (Glantz, 1996; Vargas et al., 2000;Keefer et al., 2003). However, as Dettinger et al. (2000) suggest, the reality is more complex. Floodingassociated with El Nino is largely a result of endogenous winter precipitation and is limited to the CoastalCordillera, where the impact of extra-tropical depressions is felt. Flooding in the Atacama Desert (including theLongitudinal Valley, Precordillera and Cordillera), on the contrary, is largely due to exogenous precipitationassociated with La Nina, as demonstrated by this study and Houston (2002). Consequently, the interpretationof palaeohydrological events and Quaternary geology need careful assessment of the source of floodwaterbefore correlations with either El Nino or La Nina are inferred.
Similarly, climatically or hydrologically induced hazards in the Atacama Desert require evaluation basedon different circumstances, depending on whether they are El Nino (winter) or La Nina (summer) induced.Extreme El Nino conditions do not lead to debris flows or mud slides in the interior of the Atacama Desert,only in coastal towns such as Antofagasta, whereas extreme La Nina conditions may lead to flooding, erosion
Copyright 2005 John Wiley & Sons, Ltd. Hydrol. Process. 20, 591–610 (2006)

608 J. HOUSTON
and communication difficulties in the interior and coastal towns such as Arica, where exogenous perennialrivers reach the coast. This has important implications for strategic emergency planning, as well as for themanagement of hydraulic structures, such as control and impoundment reservoirs.
With regard to water resources, it is evident that ‘average’ conditions do not exist, and the evaluation andinterpretation of many hydrological studies is flawed as a result. Extreme events, such as the one described,exert a disproportionate impact on the system. Groundwater model simulations, now considered the sine quanon of water resource evaluations in northern Chile, universally use average conditions as input; but, giventhe extreme variability of recharge and the non-linearity of the storage reservoirs, this renders their outputquestionable and their predictions subject to error. Unfortunately, there is rarely an adequate database toevaluate resources properly, especially given the non-stationarity of forcing factors. Nevertheless, a deeperunderstanding of the mechanisms leading to process variability can help to provide more realistic constraintson water resource evaluation.
CONCLUSIONS
In contrast to many arid areas, precipitation over the Altiplano and western Cordillera tends to be spatiallycoherent and has been shown to be at least partially forced by ENSO activity. Nevertheless, local factors, suchas boundary-layer flow convergence caused by the Andean topography and convection cell location/timing,create mesoscale variability that is intensified with decreasing elevation and is amplified by varying catchmentcharacteristics.
At elevations above 2500 m a.s.l., particularly above 4000 m a.s.l., precipitation enters the hydrologicalcycle directly as groundwater recharge (Nazca, 2001a). This cascades down the western slope of the Andesthrough a system of interconnected basin aquifers, as well as generating overland flow during high-intensity-magnitude events.
Return periods for significant flooding and groundwater recharge events tend to group into centennial (the2001 event) and decadal (Houston, 2002) periods. The high energies associated with such floods demonstratetheir catastrophic nature and imply metastable equilibrium (Graf, 1988) and correspondingly long relaxationtimes (Knighton, 1998).
In many respects, Atacama rivers respond in a similar fashion to those in other arid regions: flood magnitudesand peak flows are proportional to catchment area and unit peak flow is dependent on catchment elevationvia rainfall and slope. Furthermore, the magnitude and response time of flooding are strongly controlled byantecedent conditions.
However, in the Atacama Desert there appears to be surprisingly little geological control on runoff processes.Much more important is the distinction between perennial and ephemeral rivers. Ephemeral rivers tend to bemuch less deeply incised, and discharge to pediments and playas associated with basins of complete or partialinternal drainage. They have low runoff coefficients and generate significant groundwater recharge as a resultof high transmission losses. This groundwater is subsequently transmitted through the volcano-sedimentarybasin aquifers, moving under gravity in the subsurface and partly emerging as baseflow in perennial rivers.Perennial rivers are deeply incised, crossing geological structures and discharging to the sea, and have higherrunoff coefficients.
Under current conditions, which have probably persisted since at least the Miocene (Houston and Hartley,2003), water transport and erosion seems to be a two-stage process. In basins dominated by internal drainagethere is flow/erosion from mountain zones and groundwater recharge/deposition in the basins. Cutting acrosssuch basins and the geological structure are deeply incised canyons that have been created partly as a result oftectonically induced headwater erosion, coupled with exogenously generated surface water floods, and theseact as drainage conduits from the Andean basins.
Thus, the analysis of the 2001 flood provides support for the theory of Hoke et al. (2002), that the largequebradas (incised rivers) draining the western Cordillera are groundwater generated, and leads to the concept
Copyright 2005 John Wiley & Sons, Ltd. Hydrol. Process. 20, 591–610 (2006)

THE GREAT ATACAMA FLOOD OF 2001 609
that the intermontane sedimentary basins of the Andes are slowly being dewatered over geological time as aresult of tectonic uplift, base-level revision and mainstream incision by groundwater sapping.
ACKNOWLEDGEMENTS
Nazca S.A. provided the funding for this study. The Direccion Meteorologica and Direccion General de Aguasde Chile provided data.
REFERENCES
Aceituno P. 1988. On the functioning of the southern oscillation in the South American sector, part 1: surface climate. Monthly WeatherReview 116: 505–525.
Aravena R. 1995. Isotope hydrology and geochemistry of northern Chile groundwaters. Bulletin de l’Institut Francais d’Etudes Andines 24:495–503.
Aravena R, Suzuki O. 1990. Isotopic evolution of river water in the northern Chile region. Water Resources Research 26: 2887–2895.Barnes BS. 1939. The structure of discharge recession curves. Transactions, American Geophysical Union 20: 721–725.Benson MA. 1968. Measurement of peak discharge by indirect methods. WMO Publication 225, Technical Note 90.Ben-Zvi A, Massoth S, Schick AP. 1991. Travel time of runoff crests in Israel. Journal of Hydrology 122: 309–320.Clayton HH. 1923. World Weather . MacMillan: New York.Cressie NAC. 1991. Statistics for Spatial Data. Wiley: Chichester.Dettinger MD, Cayan DR, McCabe GJ, Marengo J. 2000. Multiscale streamflow variability associated with El Nino/southern oscillation. In
El Nino and the Southern Oscillation; Multiscale Variability and Global and Regional Impacts , Diaz HF, Markgraf V (eds). CambridgeUniversity Press: Cambridge; 113–148.
De Silva SL. 1989. Geochronology and stratigraphy of the ignimbrites from the 21°300S to 23°300S portion of the central Andes of northernChile. Journal of Volcanology and Geothermal Research 37: 93–131.
DGA. 1987. Balance Hıdrico Nacional . Direccion General de Aguas: Santiago.Enfield DB. 1992. Historical and prehistorical overview of El Nino/southern oscillation. In El Nino: Historical and Paleoclimatic Aspects
of the Southern Oscillation, Diaz HF, Markgraf V (eds). Cambridge University Press: Cambridge; 95–118.Fuenzalida H, Rutllant J. 1986. Estudio sobre el orıgen del vapor de agua que precipita en el invierno altiplanico. Informe Final a DGA,
Universidad de Chile: Santiago.Garreaud RD. 1999. Multiscale analysis of the summertime precipitation over the central Andes. Monthly Weather Review 127: 901–921.Garreaud RD. 2000. Intraseasonal variability of moisture and rainfall over the South American Altiplano. Monthly Weather Review 128:
3337–3346.Garreaud RD, Aceituno P. 2001. Interannual rainfall variability over the South American Altiplano. Journal of Climate 14: 2779–2789.Garreaud RD, Battisti DS. 1999. Interannual (ENSO) and interdecadal (ENSO-like) variability in the Southern Hemisphere tropospheric
circulation. Journal of Climate 12: 2113–2123.Garreaud RD, Vuille M, Clement AC. 2003. The climate of the Altiplano: observed current conditions and mechanisms of past changes.
Palaeogeography, Palaeoclimatology, Palaeoecology 194: 5–22.Glantz MH. 1996. Currents of Change: El Nino’s Impact on Climate and Society . Cambridge University Press: Cambridge.Graf WL. 1988. Fluvial Processes in Dryland Rivers . Blackburn Press: New Jersey.Gregory-Wodzicki KM. 2000. Uplift history of the central and northern Andes: a review. Geological Society of America Bulletin 112:
1091–1105.Gupta VK, Waymire E, Wang CT. 1980. Representation of a unit hydrograph from geomorphology. Water Resources Research 16: 855–862.Hallam A. 1992. Phanerozoic Sea-Level Changes . Columbia University Press: New York.Hoke GD, Jordan TE, Isacks BL. 2002. A groundwater genesis for the giant quebradas of the Atacama Desert, northern Chile. In 5th
International Symposium on Andean Geodynamics, Institute de Recherche Pour le Developpement et Universite Paul Sabatier, Toulouse;307–310.
Hooke J, Mant J. 2002. Morpho-dynamics of ephemeral streams. In Dryland Rivers; Hydrology and Geomorphology of Semi-Arid Channels ,Bull LJ, Kirkby MJ (eds). Wiley: Chichester; 173–204.
Horton RE. 1933. The role of infiltration in the hydrological cycle. Transactions, American Geophysical Union 14: 446–460.Houston J. 2002. Groundwater recharge through an alluvial fan in the Atacama Desert, northern Chile: mechanisms, magnitudes and causes.
Hydrological Processes 16: 3019–3035.Houston J. 2004. High resolution sequence stratigraphy as a tool in hydrogeological exploration in the Atacama Desert. Quarterly Journal
of Engineering Geology and Hydrogeology 37: 7–17.Houston J, Hartley AJ. 2003. The central Andean west-slope rainshadow and its potential contribution to the origin of hyper-aridity in the
Atacama Desert. International Journal of Climatology 23: 1453–1464.JICA. 1995. The Study on the Development of Water Resources in Northern Chile. JICA–PCI–MOP, Direccion General de Aguas: Santiago.Keefer DK, Moseley ME, de France SD. 2003. A 38 000-year record of floods and debris flows in the Ilo region of southern Peru and its
relation to El Nino events and great earthquakes. Palaeogeography, Palaeoclimatology, Palaeoecology 194: 41–77.Knighton D. 1998. Fluvial Forms and Processes . Arnold: London.
Copyright 2005 John Wiley & Sons, Ltd. Hydrol. Process. 20, 591–610 (2006)
610 J. HOUSTON
Kochel RC, Baker VR. 1982. Paleoflood hydrology. Science 215: 353–361.Labitzke K, Matthes K. 2003. Eleven-year solar cycles in the atmosphere: observations, mechanisms and models. The Holocene 13: 311–317.Latorre C, Betancourt JL, Rech JA, Quade J, Holmgren C, Placzek C, Maldonado A, Vuille M, Rylander K. 2004. Late Quaternary history
of the Atacama Desert. in 230 degrees South: Archaeology and Environmental History of the Southern Deserts , Smith M, Hesse P (eds).National Museum of Australia; 73–90.
Lenters JD, Cook KH. 1997. On the origin of the Bolivian high and related circulation features of the South American climate. Journal ofthe Atmospheric Sciences 54: 656–677.
Lopez F, Conesa C, Alonso F. 2002. Floods: magnitudes and frequency in ephemeral streams of the Spanish Mediterranean region. InDryland Rivers; Hydrology and Geomorphology of Semi-Arid Channels , Bull LJ, Kirkby MJ (eds). Wiley: Chichester; 329–350.
Marinovic N, Lahsen A. 1984. Hoja Calama. Carta Geologica de Chile, 1 : 250,000, Servico Nacional de Geologıa y Minerıa: Santiago.May G. 1997. Oligocene to Recent evolution of the Calama basin, northern Chile. PhD thesis, Aberdeen University.Mortimer C. 1980. Drainage evolution in the Atacama Desert of northern Chile. Revista Geologica de Chile 11: 3–28.Nanson GC, Croke JC. 1992. A genetic classification of floodplains. Geomorphology 4: 459–486.Naranjo JA, Paskoff R. 1980. Evolucion geomorfologica del Desierto de Atacama entre los 26° y 33° latitud sur; revision cronologica.
Revista Geologica de Chile 10: 85–89.Naranjo JA, Paskoff R. 1981. Estratigrafıa de los depositos cenozoicas de la region de Chiuchiu–Calama, Desierto de Atacama. Revista
Geologica de Chile 13–14: 79–85.Nazca. 2001a. Hidrologıa y balance hıdrico de Quebrada de Leon. Informe inedito a DGA.Nazca. 2001b. Hidrologıa y balance hıdrico de Pampa Llalqui. Informe inedito a DGA.Oh HS, Ammann CM, Naveau P, Nycha D, Otto-Bliesner BL. 2003. Multi-resolution time series analysis applied to solar irradiance and
climate reconstructions. Journal of Atmospheric and Solar–Terrestrial Physics 65: 191–201.Pena H. 1970. Modelo hidrologico y de CONSTITUCION QUıMICA de la cuenca del Rıo Loa. Tesis del Grado Universidad de Chile:
Santiago.Rech JA, Quade J, Betancourt JL. 2001. Late Quaternary paleohydrology of the central Atacama Desert (Lat 22° –24 °S), Chile. Geological
Society of America Bulletin 114: 334–348.Reid GC. 1987. Influences of solar variability on global sea surface temperatures. Nature 329: 142–143.Rodrıguez-Iturbe I, Valdes JB. 1979. The geomorphic structure of hydrologic response. Water Resources Research 15: 1409–1420.Rutledge AT. 1998. Computer programs for describing the recession of ground-water discharge and for estimating mean ground-water
recharge and discharge from streamflow records. USGS Water Resources Investigations Report 98–4148, Reston, VA.Rutllant J, Fuenzalida H, Aceituno P. 2003. Climate dynamics along the arid northern coast of Chile: the 1997–1998 Diclima experiment.
Journal of Geophysical Research 108: 4538–4542.Simmers I (ed.). 1997. Recharge of Phreatic Aquifers in (Semi-) Arid Areas . Balkema: Rotterdam.Svensmark H, Friis-Christensen E. 1997. Variation of cosmic ray flux and global cloud coverage—a missing link in solar–climate
relationships. Journal of Atmospheric and Solar–Terrestrial Physics 59: 1225–1232.UNDP. 1978. Desarrollo de los recursos de agua en el Norte Grande, Chile. Harza-DGA, Proyecto CHI-69/535, Santiago, Chile.US NRC. 1999. Improving American River Flood Frequency Analysis . National Academy Press: Washington, DC.US SCS. 1972. Hydrology. In SCS National Engineering Handbook , Section 4. Soils Conservation Service: Washington, DC.US WRC. 1981. Guidelines for determining flood frequency. US Geological Survey Bulletin 17B, Reston: VA.Vargas G, Ortleib L, Rutllant J. 2000. Aluviones historicos en Antofagasta y su relacion con eventos El Nino/oscilacion del sur. Revista
Geologica de Chile 27: 157–176.Vuille M. 1999. Atmospheric circulation over the Bolivian Altiplano during dry and wet periods and high and low index phases of the
southern oscillation. International Journal of Climatology 19: 1579–1600.Vuille M, Ammann C. 1997. Regional snowfall patterns in the high, arid Andes. Climate Change 36: 413–423.
Copyright 2005 John Wiley & Sons, Ltd. Hydrol. Process. 20, 591–610 (2006)