The graph of the function repeats itself, so it is known ......5.1 Graphing Sine and Cosine...
14
5.1 Graphing Sine and Cosine Functions (Day 1) A. The Sine Function The values of sin can be transferred to a new view as seen below: The graph/curve is periodic and continuous. The domain is The range is The maximum value is The minimum value is The amplitude (maximum vertical distance above or below the horizontal centre) is The period (the horizontal length of one cycle) is The y-intercept is The graph of the function repeats itself, so it is known as a periodic function. A sine graph is a graph of the function sin y . It is also known as a sinusoidal curve.
Transcript of The graph of the function repeats itself, so it is known ......5.1 Graphing Sine and Cosine...

5.1 Graphing Sine and Cosine Functions (Day 1)
A. The Sine Function
The values of sin can be transferred to a new view as seen below:
The graph/curve is periodic and continuous.
The domain is
The range is
The maximum value is
The minimum value is
The amplitude (maximum vertical distance above or below the horizontal centre) is
The period (the horizontal length of one cycle) is
The y-intercept is
The graph of the function repeats
itself, so it is known as a periodic
function.
A sine graph is a graph of the function
siny . It is also known as a
sinusoidal curve.
-2π -7π/4 -3π/2 -5π/4 -π -3π/4 -π/2 -π/4 π/4 π/2 3π/4 π 5π/4 3π/2 7π/4 2π
-1.5
-1
-0.5
0.5
1
1.5
x
y
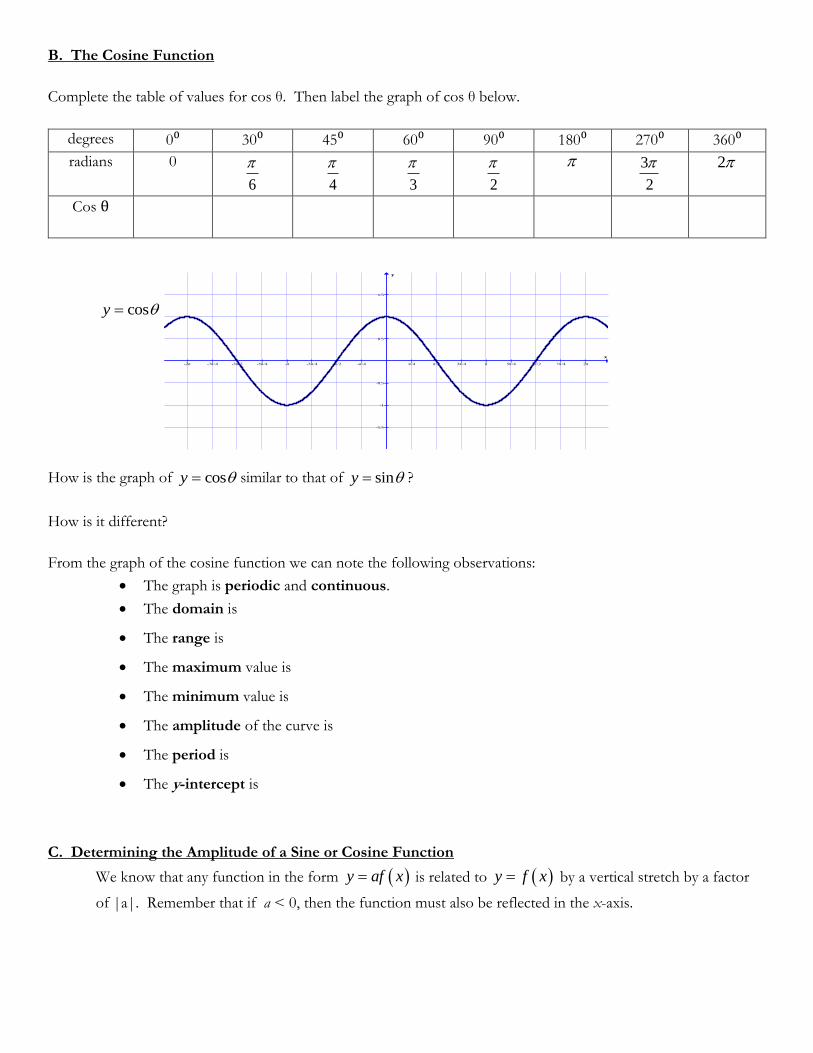
B. The Cosine Function
Complete the table of values for cos θ. Then label the graph of cos θ below.
degrees 0⁰ 30⁰ 45⁰ 60⁰ 90⁰ 180⁰ 270⁰ 360⁰
radians 0
6
4
3
2
3
2
2
Cos θ
cosy
How is the graph of cosy similar to that of siny ?
How is it different?
From the graph of the cosine function we can note the following observations:
The graph is periodic and continuous.
The domain is
The range is
The maximum value is
The minimum value is
The amplitude of the curve is
The period is
The y-intercept is
C. Determining the Amplitude of a Sine or Cosine Function
We know that any function in the form y af x is related to y f x by a vertical stretch by a factor
of |a|. Remember that if a < 0, then the function must also be reflected in the x-axis.
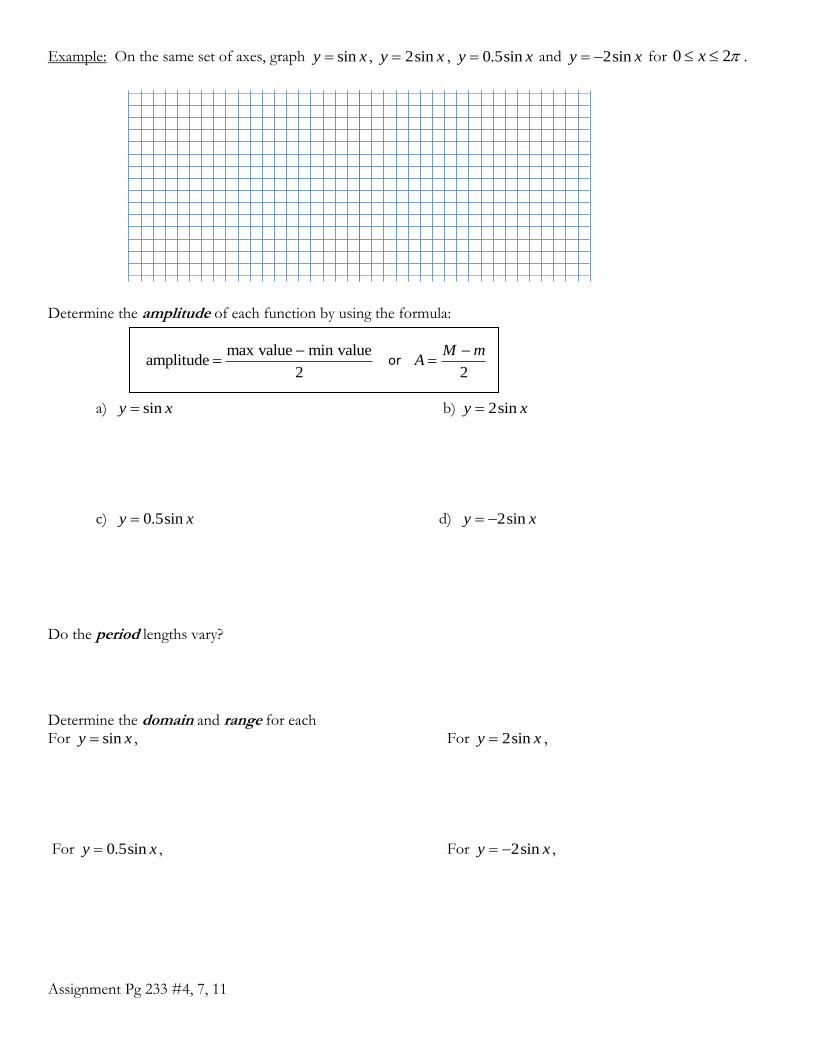
Example: On the same set of axes, graph siny x , 2siny x , 0.5siny x and 2siny x for 0 2x .
Determine the amplitude of each function by using the formula:
max value min valueamplitude
2
or
2
M mA
a) siny x b) 2siny x
c) 0.5siny x d) 2siny x
Do the period lengths vary?
Determine the domain and range for each For siny x , For 2siny x ,
For 0.5siny x , For 2siny x ,
Assignment Pg 233 #4, 7, 11

5.1 Graphing Sine and Cosine Functions (Day 2)
A. The Period of Sine and Cosine Functions
Any function y = f(bx) is related to y = f(x) by a horizontal stretch by a factor of 1
b about the y-axis.
The period of the base function of siny x or cosy x is 2 .
To determine the period of either of these functions when b ≠1 , solve the following compound inequality:
0 2x Begin with the interval of one cycle of y = sin bx or y = cos bx
0 2bx Replace x with b x
2
0 xb
Divide by b
Solving this inequality determines the length of a cycle for the sinusoidal curve (sin or cos), where the start of a
cycle is at 0 and the end is at 2
b
.
The period for siny bx or cosy bx is 2
b
(radians) or
360
b (degrees)
Example 1: Sketch the graph of the function sin 4y x for 0 2x . Determine the period of sin 4y x .
Sketch the graph of y = sin x.
Example 2: Sketch the graph of the function 1
cos3
y x for 0 6x . Determine the period of 1
cos3
y x
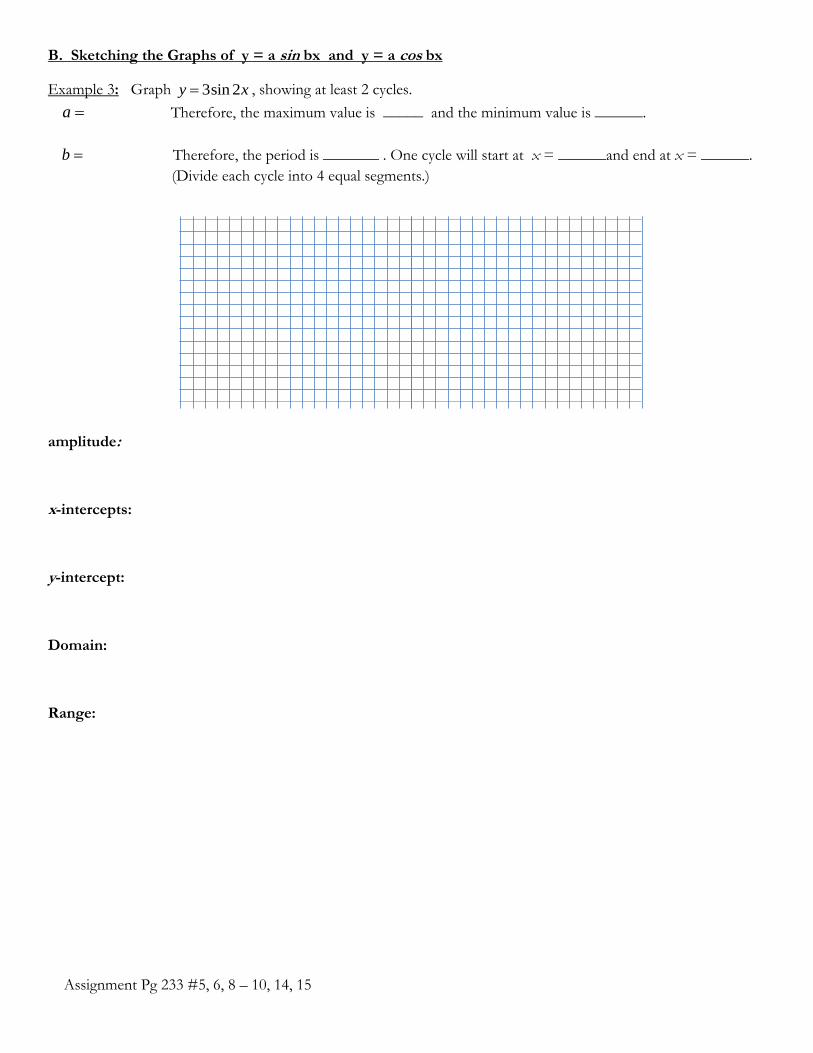
B. Sketching the Graphs of y = a sin bx and y = a cos bx
Example 3: Graph 3sin 2y x , showing at least 2 cycles.
a Therefore, the maximum value is _____ and the minimum value is ______.
b Therefore, the period is _______ . One cycle will start at x = ______and end at x = ______.
(Divide each cycle into 4 equal segments.)
amplitude:
x-intercepts:
y-intercept:
Domain:
Range:
Assignment Pg 233 #5, 6, 8 – 10, 14, 15
2π -2π π -π
4
-4
2π -2π π -π
4
-4
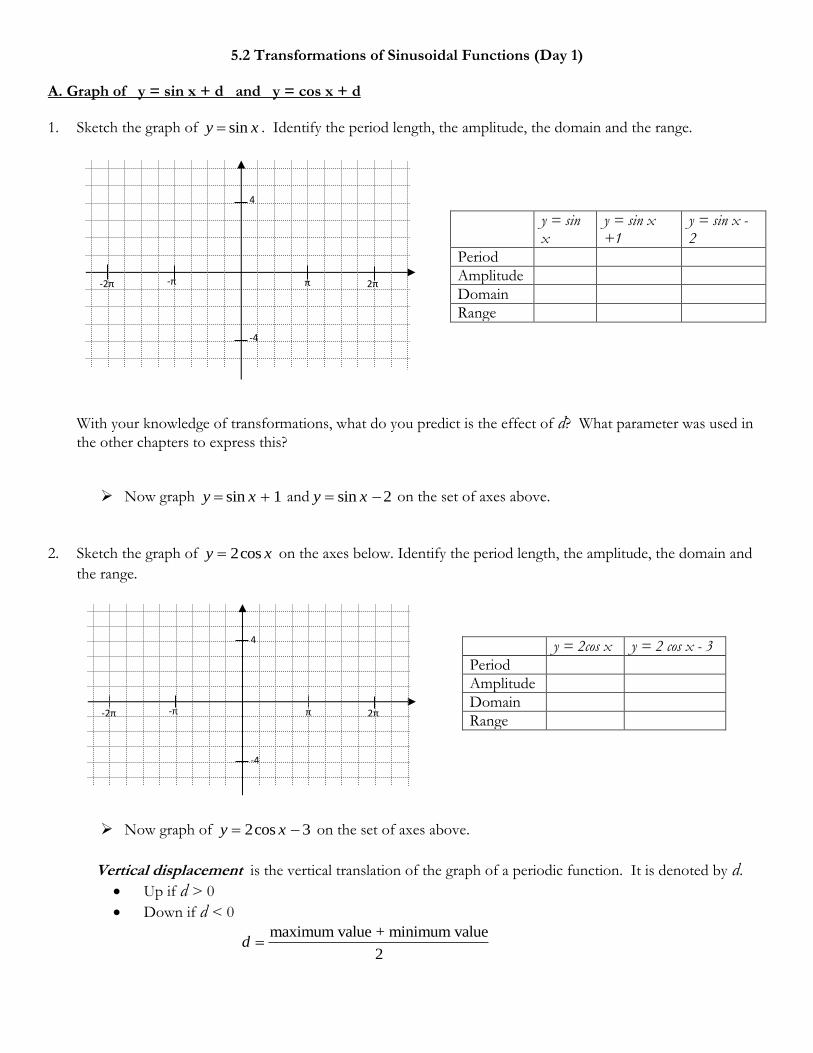
5.2 Transformations of Sinusoidal Functions (Day 1) A. Graph of y = sin x + d and y = cos x + d
1. Sketch the graph of siny x . Identify the period length, the amplitude, the domain and the range.
y = sin x
y = sin x +1
y = sin x - 2
Period
Amplitude
Domain
Range
With your knowledge of transformations, what do you predict is the effect of d? What parameter was used in
the other chapters to express this?
Now graph sin 1y x and sin 2y x on the set of axes above.
2. Sketch the graph of 2cosy x on the axes below. Identify the period length, the amplitude, the domain and
the range.
y = 2cos x y = 2 cos x - 3
Period
Amplitude
Domain
Range
Now graph of 2cos 3y x on the set of axes above.
Vertical displacement is the vertical translation of the graph of a periodic function. It is denoted by d.
Up if d > 0
Down if d < 0
maximum value + minimum value
2d
2π -2π π -π
4
-4
π -π π/2 -
π/2
4
-4
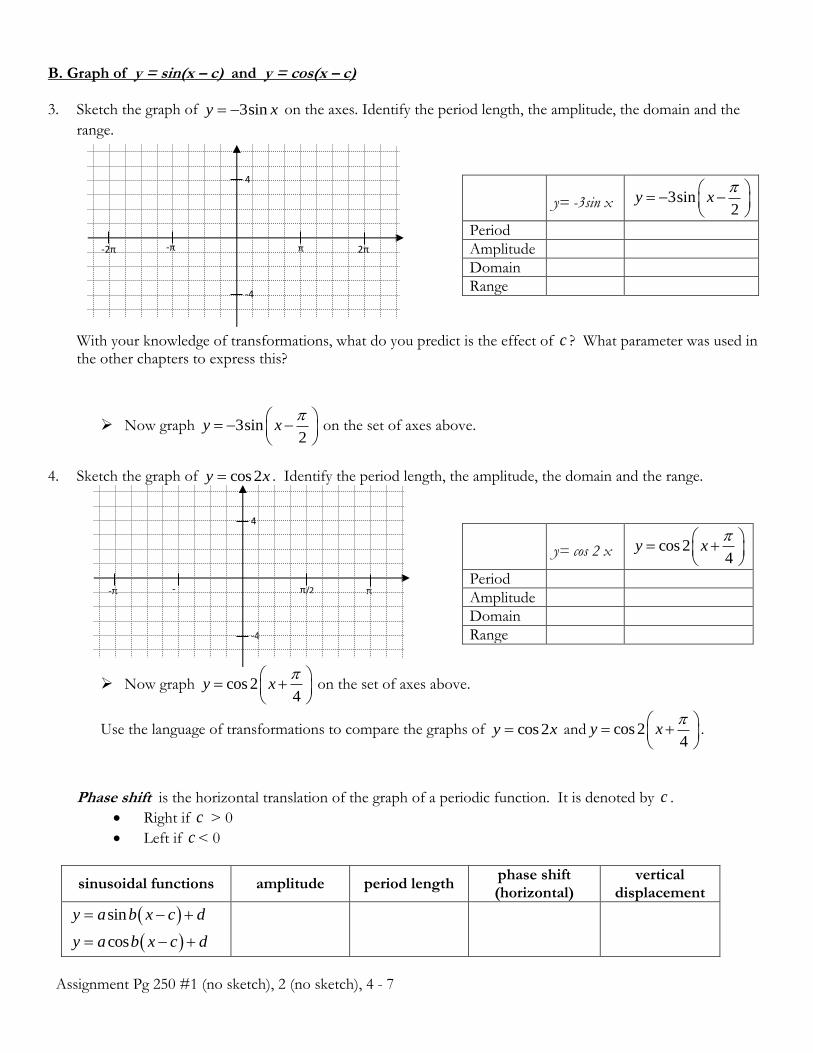
B. Graph of y = sin(x – c) and y = cos(x – c) 3. Sketch the graph of 3siny x on the axes. Identify the period length, the amplitude, the domain and the
range.
y= -3sin x 3sin
2y x
Period
Amplitude
Domain
Range
With your knowledge of transformations, what do you predict is the effect of c ? What parameter was used in the other chapters to express this?
Now graph 3sin2
y x
on the set of axes above.
4. Sketch the graph of cos2y x . Identify the period length, the amplitude, the domain and the range.
y= cos 2 x cos 2
4y x
Period
Amplitude
Domain
Range
Now graph cos 24
y x
on the set of axes above.
Use the language of transformations to compare the graphs of cos2y x and cos 24
y x
.
Phase shift is the horizontal translation of the graph of a periodic function. It is denoted by c .
Right if c > 0
Left if c < 0
sinusoidal functions amplitude period length phase shift (horizontal)
vertical displacement
siny a b x c d
cosy a b x c d
Assignment Pg 250 #1 (no sketch), 2 (no sketch), 4 - 7
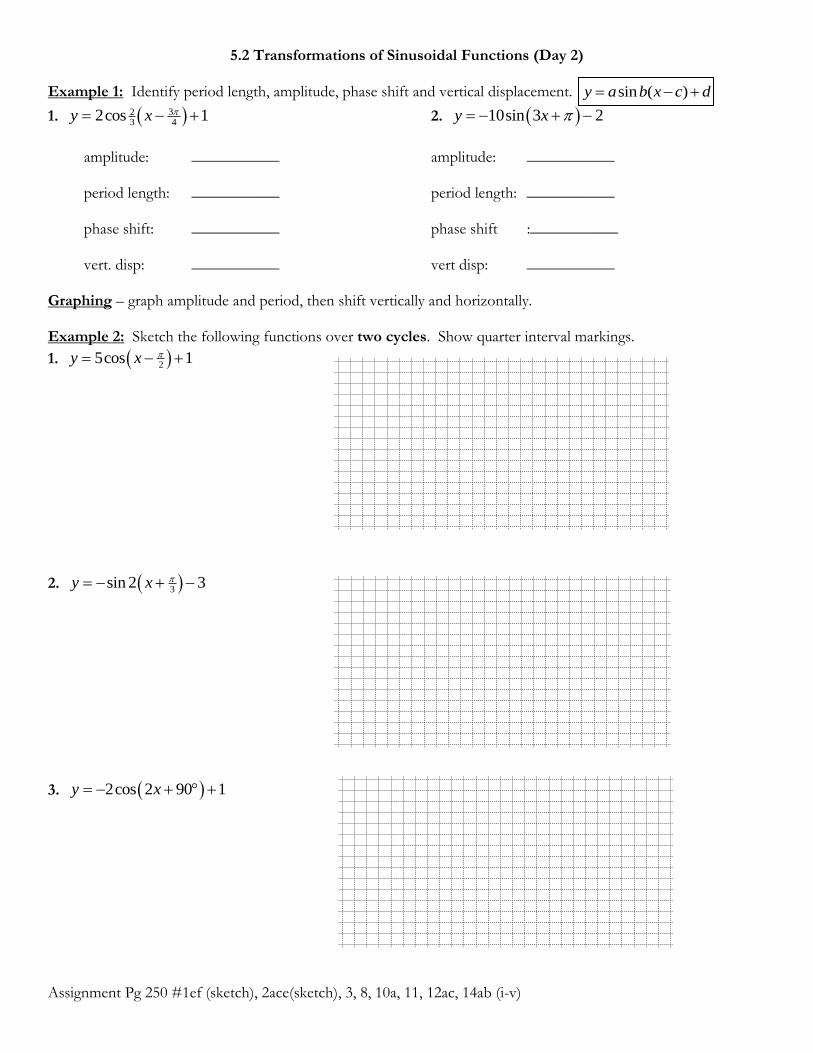
5.2 Transformations of Sinusoidal Functions (Day 2)
Example 1: Identify period length, amplitude, phase shift and vertical displacement. sin ( )y a b x c d
1. 323 4
2cos 1y x 2. 10sin 3 2y x
amplitude: ___________ amplitude: ___________ period length: ___________ period length: ___________ phase shift: ___________ phase shift :___________ vert. disp: ___________ vert disp: ___________
Graphing – graph amplitude and period, then shift vertically and horizontally.
Example 2: Sketch the following functions over two cycles. Show quarter interval markings.
1. 25cos 1y x
2. 3sin 2 3y x
3. 2cos 2 90 1y x
Assignment Pg 250 #1ef (sketch), 2ace(sketch), 3, 8, 10a, 11, 12ac, 14ab (i-v)
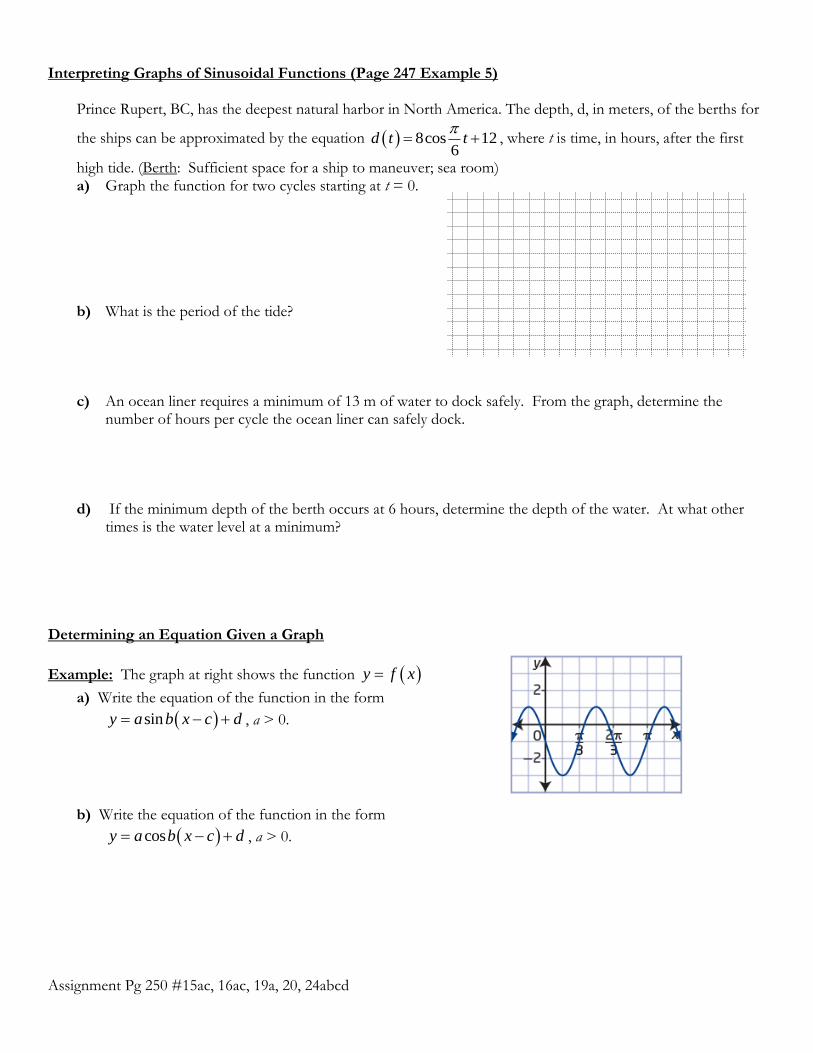
Interpreting Graphs of Sinusoidal Functions (Page 247 Example 5)
Prince Rupert, BC, has the deepest natural harbor in North America. The depth, d, in meters, of the berths for
the ships can be approximated by the equation 8cos 126
d t t
, where t is time, in hours, after the first
high tide. (Berth: Sufficient space for a ship to maneuver; sea room) a) Graph the function for two cycles starting at t = 0. b) What is the period of the tide? c) An ocean liner requires a minimum of 13 m of water to dock safely. From the graph, determine the
number of hours per cycle the ocean liner can safely dock. d) If the minimum depth of the berth occurs at 6 hours, determine the depth of the water. At what other
times is the water level at a minimum?
Determining an Equation Given a Graph
Example: The graph at right shows the function y f x
a) Write the equation of the function in the form
siny a b x c d , a > 0.
b) Write the equation of the function in the form
cosy a b x c d , a > 0.
Assignment Pg 250 #15ac, 16ac, 19a, 20, 24abcd
5.3 TheTangent Function (Day 1)
A tangent line to a curve is a line that touches a curve, or a graph of a function, at a single point.
The value of the tangent of an angle is the slope of the line passing through the origin and the
point on the unit circle cos ,sin . You can think of it as the slope of the terminal arm of angle in
standard position.
If 2 1
2 1
y y yslope
x x x
(change in “y” divided by change in “x”), then the slope of the terminal arm
of an angle in standard position is expressed by sin
tancos
.
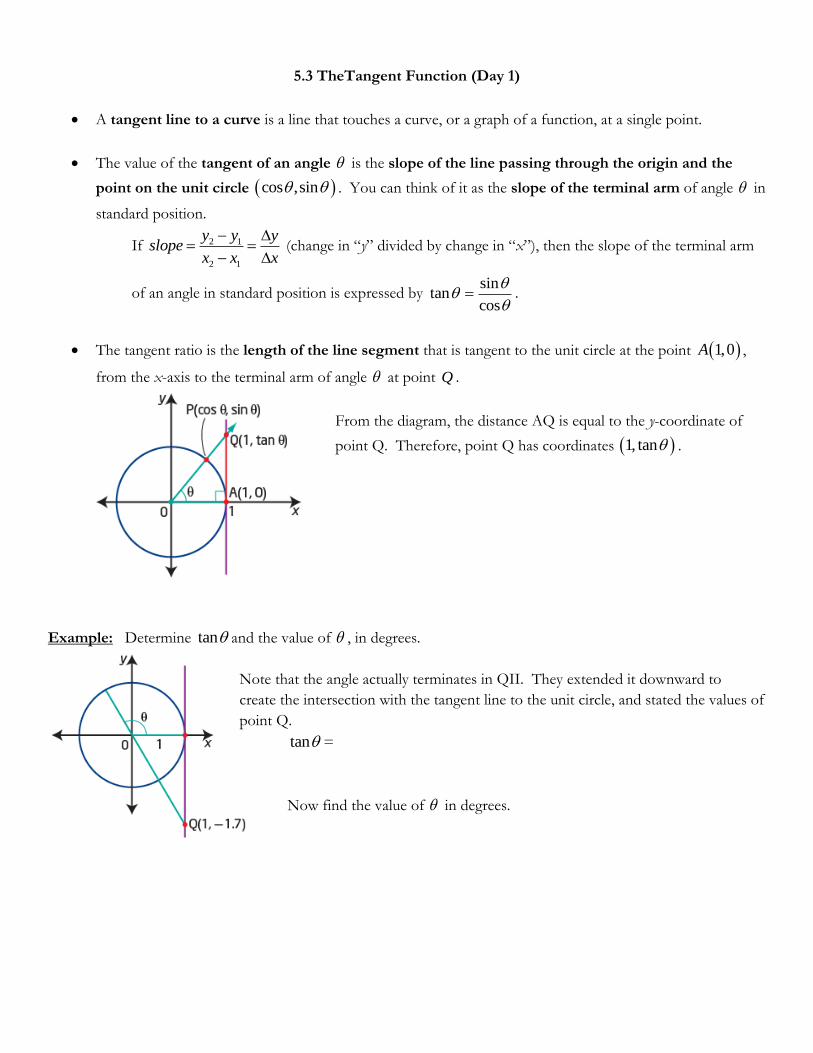
The tangent ratio is the length of the line segment that is tangent to the unit circle at the point 1,0A ,
from the x-axis to the terminal arm of angle at point Q .
From the diagram, the distance AQ is equal to the y-coordinate of
point Q. Therefore, point Q has coordinates 1, tan .
Example: Determine tan and the value of , in degrees.
Note that the angle actually terminates in QII. They extended it downward to
create the intersection with the tangent line to the unit circle, and stated the values of
point Q.
tan =
Now find the value of in degrees.
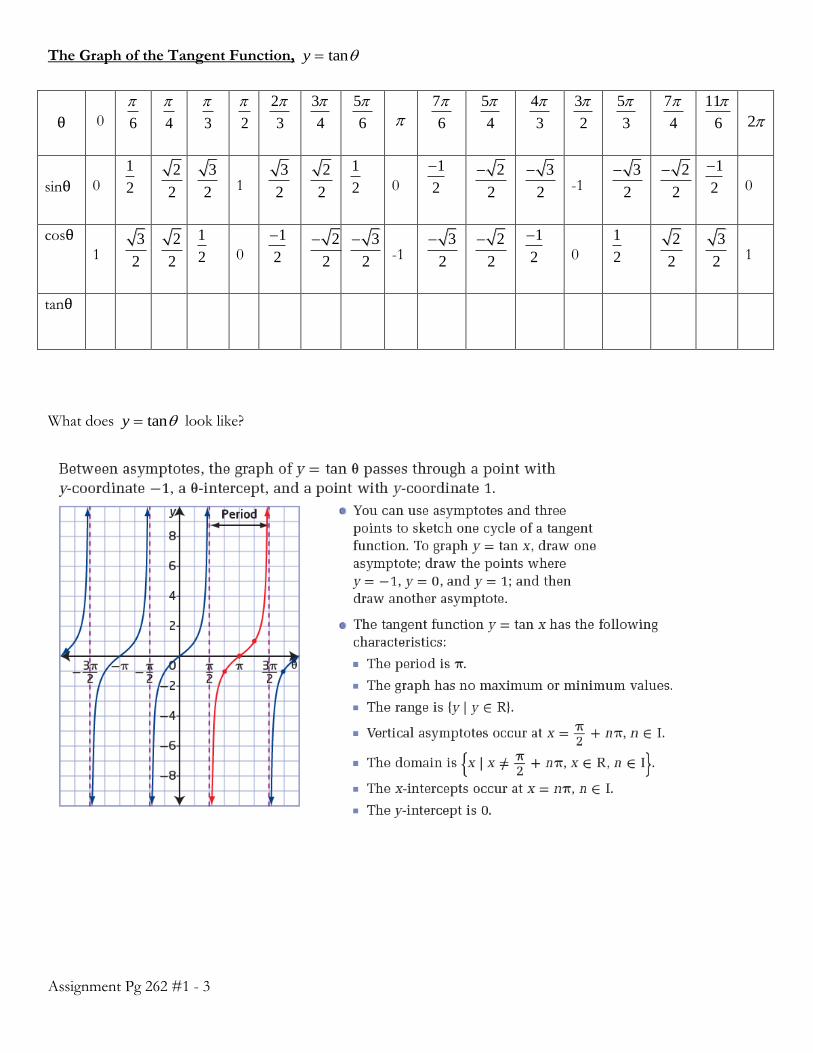
The Graph of the Tangent Function, tany
θ
0 6
4
3
2
2
3
3
4
5
6
7
6
5
4
4
3
3
2
5
3
7
4
11
6
2
sinθ
0
1
2 2
2
3
2
1 3
2
2
2
1
2
0
1
2
2
2
3
2
-1 3
2
2
2
1
2
0
cosθ
1 3
2
2
2
1
2
0
1
2
2
2
3
2
-1 3
2
2
2
1
2
0
1
2 2
2
3
2
1
tanθ
What does tany look like?
Assignment Pg 262 #1 - 3
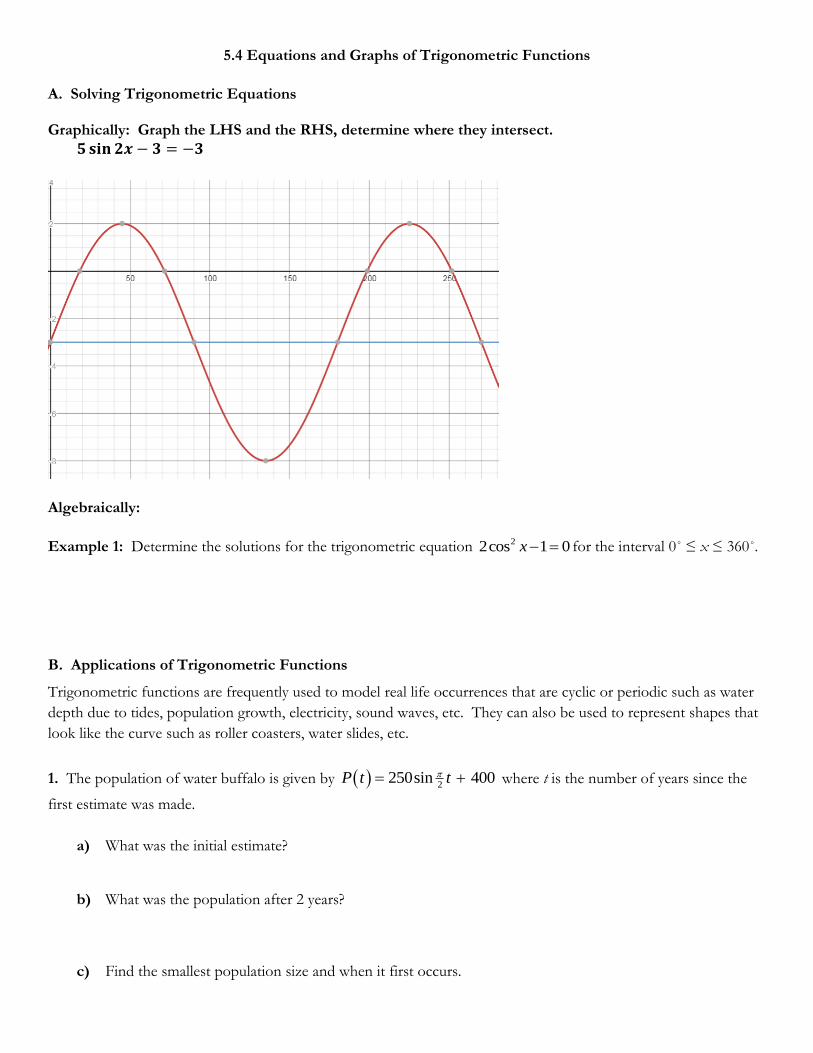
5.4 Equations and Graphs of Trigonometric Functions
A. Solving Trigonometric Equations Graphically: Graph the LHS and the RHS, determine where they intersect.
𝟓 𝐬𝐢𝐧 𝟐𝒙 − 𝟑 = −𝟑
Algebraically:
Example 1: Determine the solutions for the trigonometric equation 22cos 1 0x for the interval 0˚ ≤ x ≤ 360˚.
B. Applications of Trigonometric Functions
Trigonometric functions are frequently used to model real life occurrences that are cyclic or periodic such as water
depth due to tides, population growth, electricity, sound waves, etc. They can also be used to represent shapes that
look like the curve such as roller coasters, water slides, etc.
1. The population of water buffalo is given by 2250sin 400P t t where t is the number of years since the
first estimate was made.
a) What was the initial estimate?
b) What was the population after 2 years?
c) Find the smallest population size and when it first occurs.
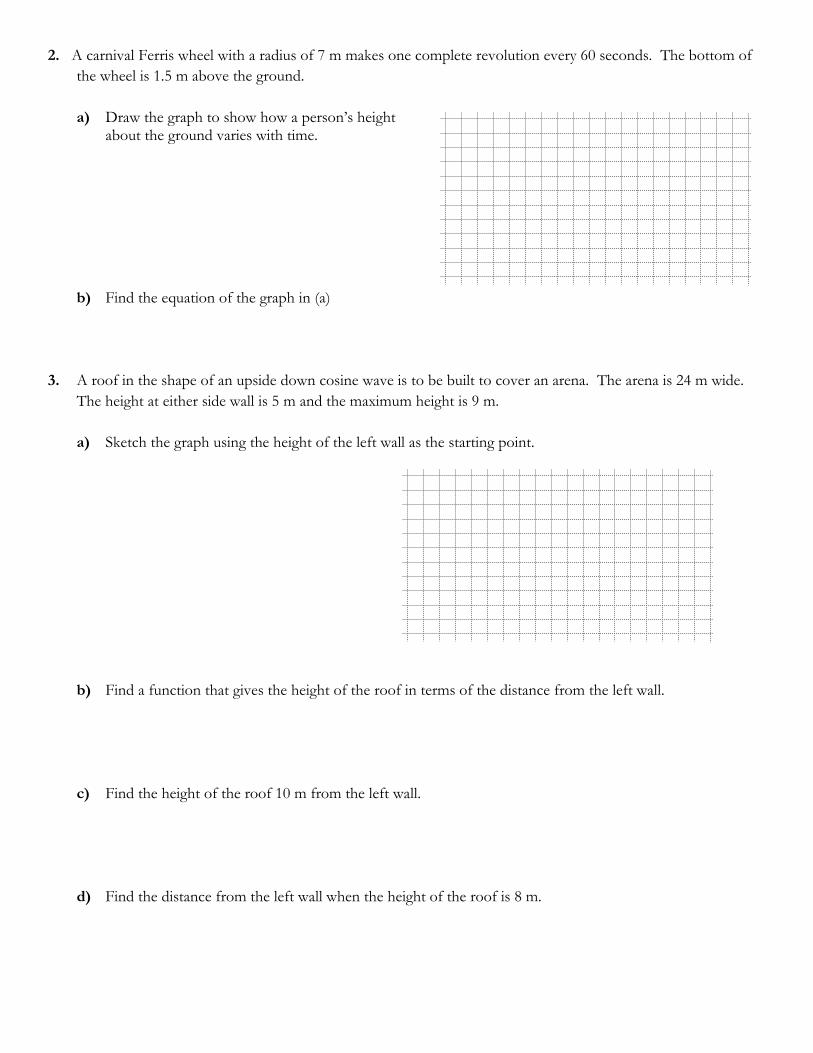
2. A carnival Ferris wheel with a radius of 7 m makes one complete revolution every 60 seconds. The bottom of
the wheel is 1.5 m above the ground.
a) Draw the graph to show how a person’s height about the ground varies with time.
b) Find the equation of the graph in (a)
3. A roof in the shape of an upside down cosine wave is to be built to cover an arena. The arena is 24 m wide.
The height at either side wall is 5 m and the maximum height is 9 m.
a) Sketch the graph using the height of the left wall as the starting point.
b) Find a function that gives the height of the roof in terms of the distance from the left wall.
c) Find the height of the roof 10 m from the left wall.
d) Find the distance from the left wall when the height of the roof is 8 m.
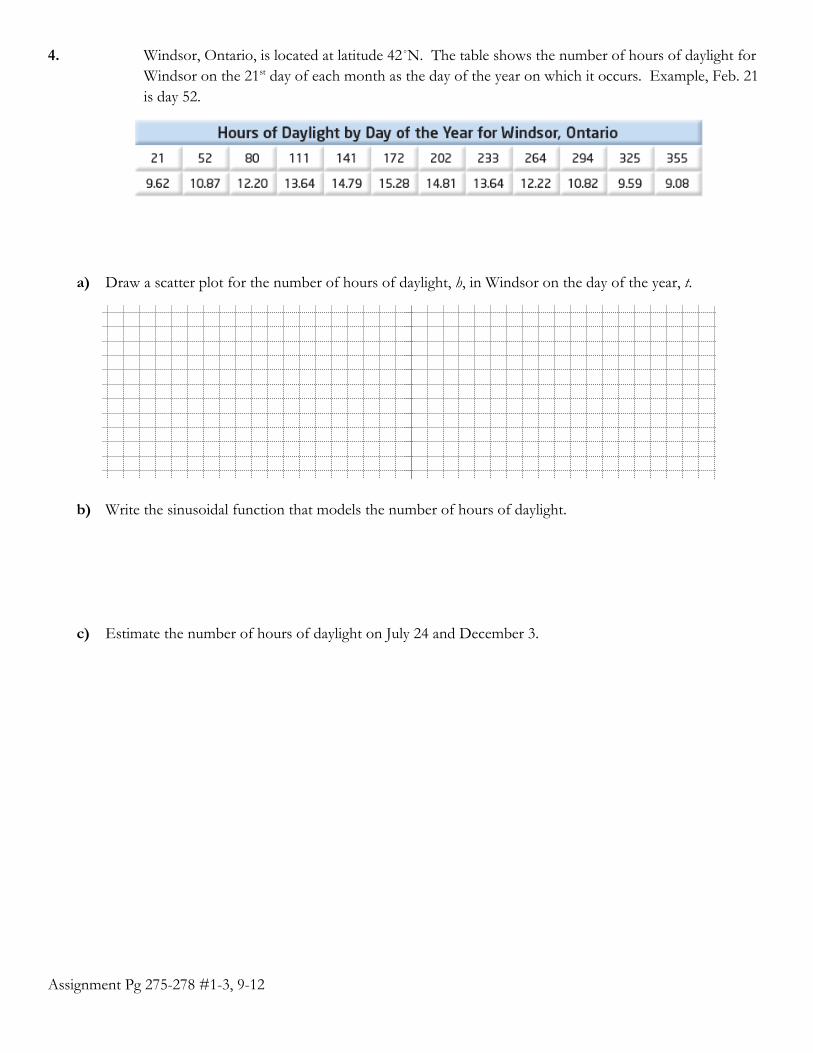
4. Windsor, Ontario, is located at latitude 42˚N. The table shows the number of hours of daylight for
Windsor on the 21st day of each month as the day of the year on which it occurs. Example, Feb. 21
is day 52.
a) Draw a scatter plot for the number of hours of daylight, h, in Windsor on the day of the year, t.
b) Write the sinusoidal function that models the number of hours of daylight.
c) Estimate the number of hours of daylight on July 24 and December 3.
Assignment Pg 275-278 #1-3, 9-12