The GRAPEX Project: A Multi-scale Approach to …...The GRAPEX Project: A Multi-scale Approach to...
27
The GRAPEX Project: A Multi-scale Approach to Water and Energy Exchange in Vineyards
Transcript of The GRAPEX Project: A Multi-scale Approach to …...The GRAPEX Project: A Multi-scale Approach to...
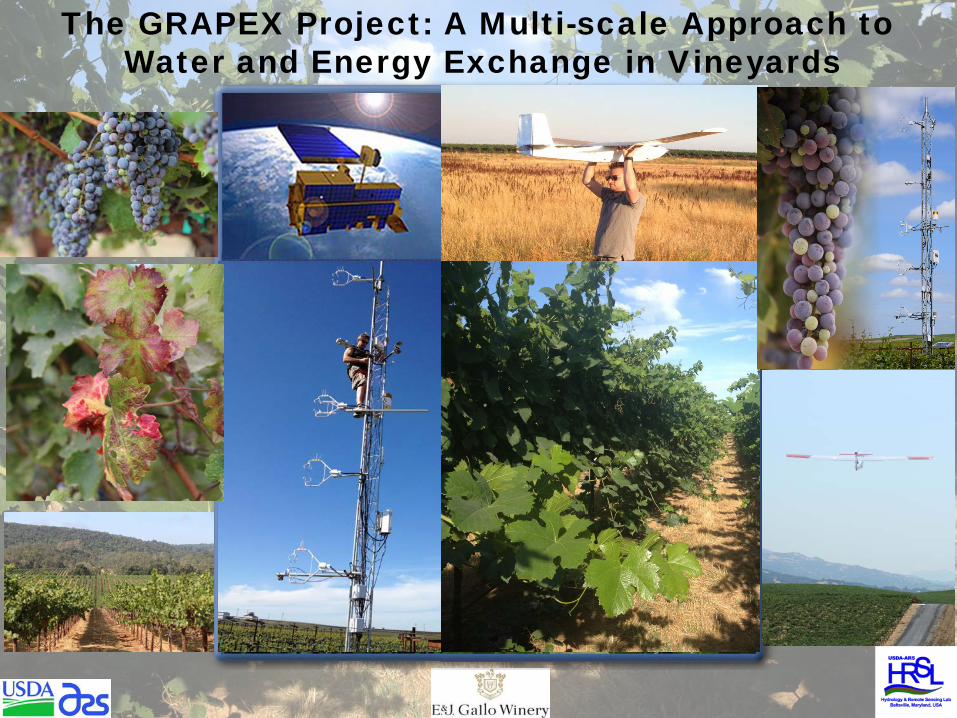
The GRAPEX Project: A Multi-scale Approach to Water and Energy Exchange in Vineyards
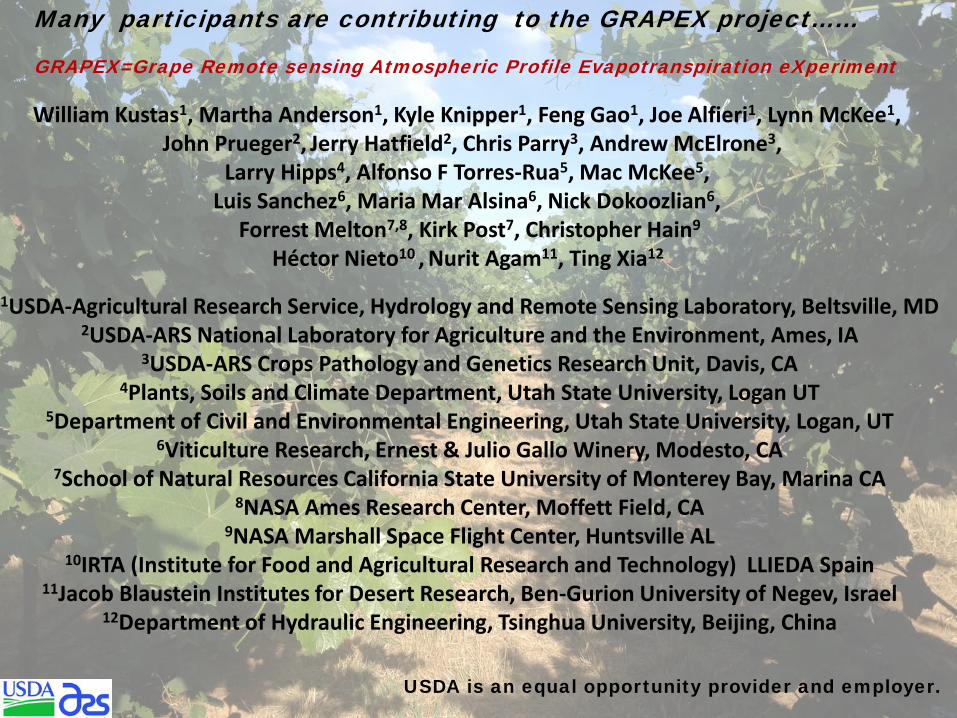
William Kustas1, Martha Anderson1, Kyle Knipper1, Feng Gao1, Joe Alfieri1, Lynn McKee1, John Prueger2, Jerry Hatfield2, Chris Parry3, Andrew McElrone3,
Larry Hipps4, Alfonso F Torres-Rua5, Mac McKee5, Luis Sanchez6, Maria Mar Alsina6, Nick Dokoozlian6,
Forrest Melton7,8, Kirk Post7, Christopher Hain9
Héctor Nieto10 , Nurit Agam11, Ting Xia12
1USDA-Agricultural Research Service, Hydrology and Remote Sensing Laboratory, Beltsville, MD2USDA-ARS National Laboratory for Agriculture and the Environment, Ames, IA
3USDA-ARS Crops Pathology and Genetics Research Unit, Davis, CA4Plants, Soils and Climate Department, Utah State University, Logan UT
5Department of Civil and Environmental Engineering, Utah State University, Logan, UT6Viticulture Research, Ernest & Julio Gallo Winery, Modesto, CA
7School of Natural Resources California State University of Monterey Bay, Marina CA8NASA Ames Research Center, Moffett Field, CA
9NASA Marshall Space Flight Center, Huntsville AL10IRTA (Institute for Food and Agricultural Research and Technology) LLIEDA Spain
11Jacob Blaustein Institutes for Desert Research, Ben-Gurion University of Negev, Israel12Department of Hydraulic Engineering, Tsinghua University, Beijing, China
USDA is an equal opportunity provider and employer.
Many participants are contributing to the GRAPEX project……
GRAPEX=Grape Remote sensing Atmospheric Profile Evapotranspiration eXperiment
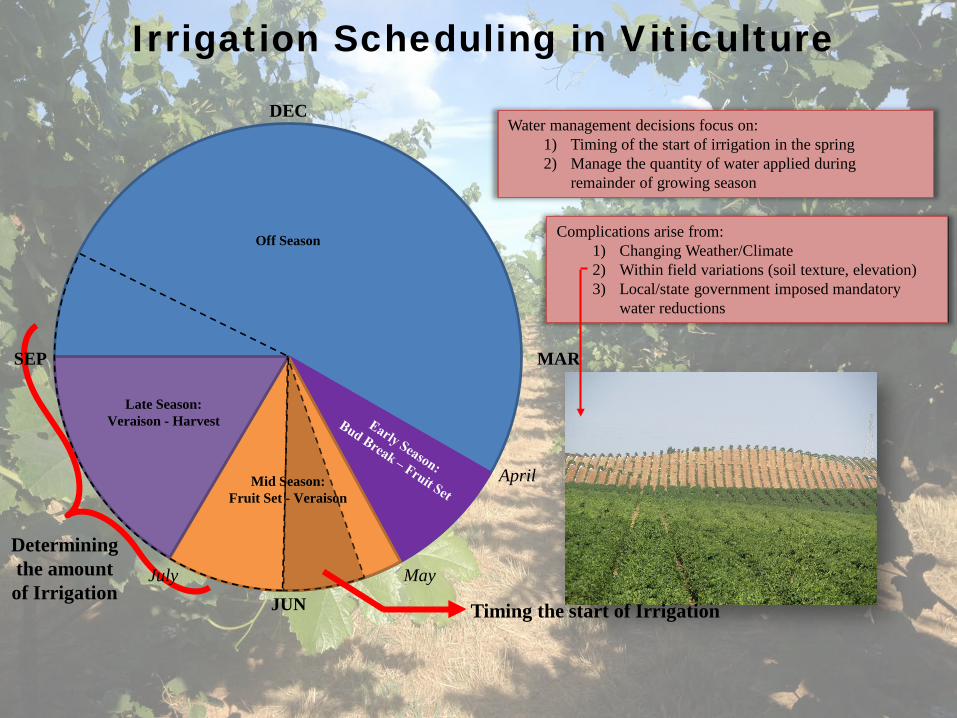
DEC
MAR
JUN
April
May
Late Season:Veraison - Harvest
Off Season
Mid Season:Fruit Set - Veraison
Timing the start of Irrigation
July
SEP
Determining the amount of Irrigation
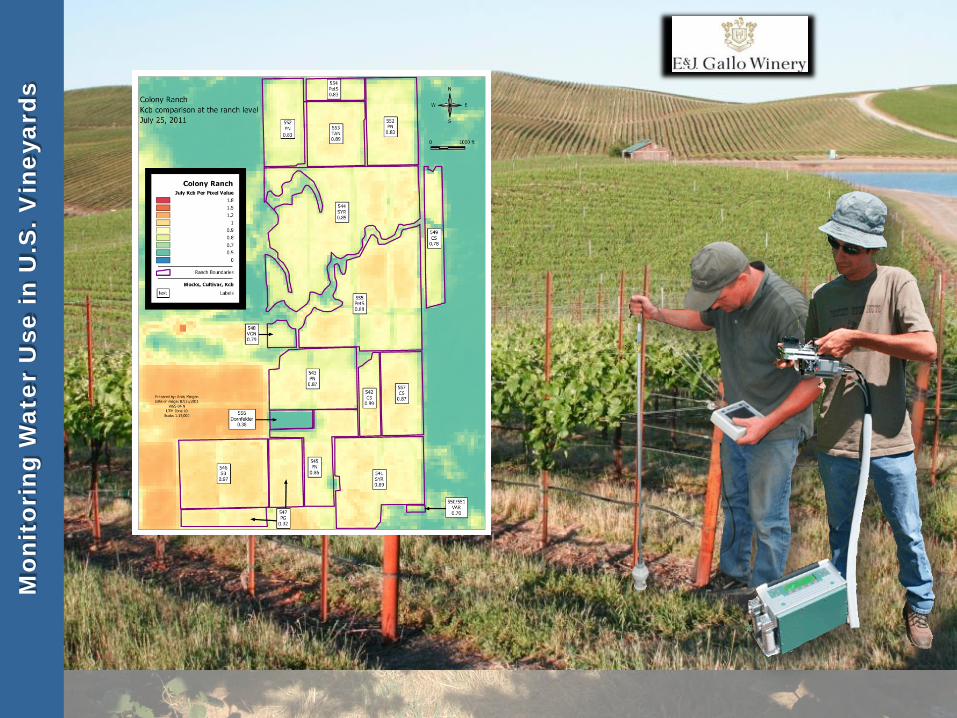
Water management decisions focus on:1) Timing of the start of irrigation in the spring2) Manage the quantity of water applied during
remainder of growing season
Complications arise from:1) Changing Weather/Climate2) Within field variations (soil texture, elevation)3) Local/state government imposed mandatory
water reductions
Irrigation Scheduling in Viticulture
Mon
itor
ing
Wat
er U
se in
U.S
. Vin
eyar
ds
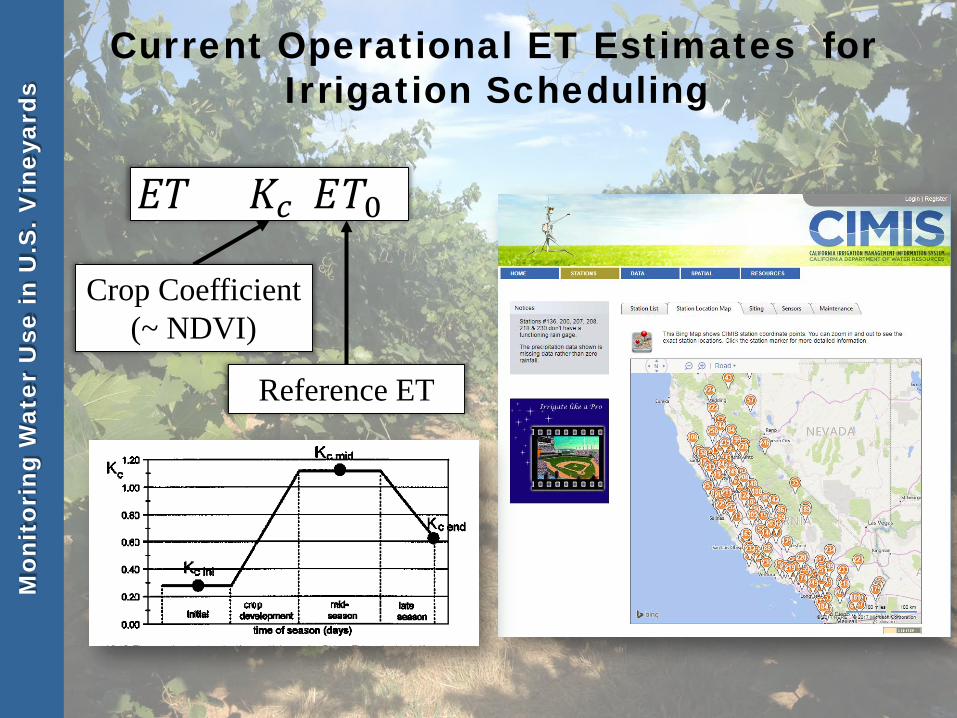
𝐸𝐸𝐸𝐸 = 𝐾𝐾𝑐𝑐(𝐸𝐸𝐸𝐸0)
Crop Coefficient (~ NDVI)
Reference ET
Current Operational ET Estimates forIrrigation Scheduling
Mon
itor
ing
Wat
er U
se in
U.S
. Vin
eyar
ds
ET
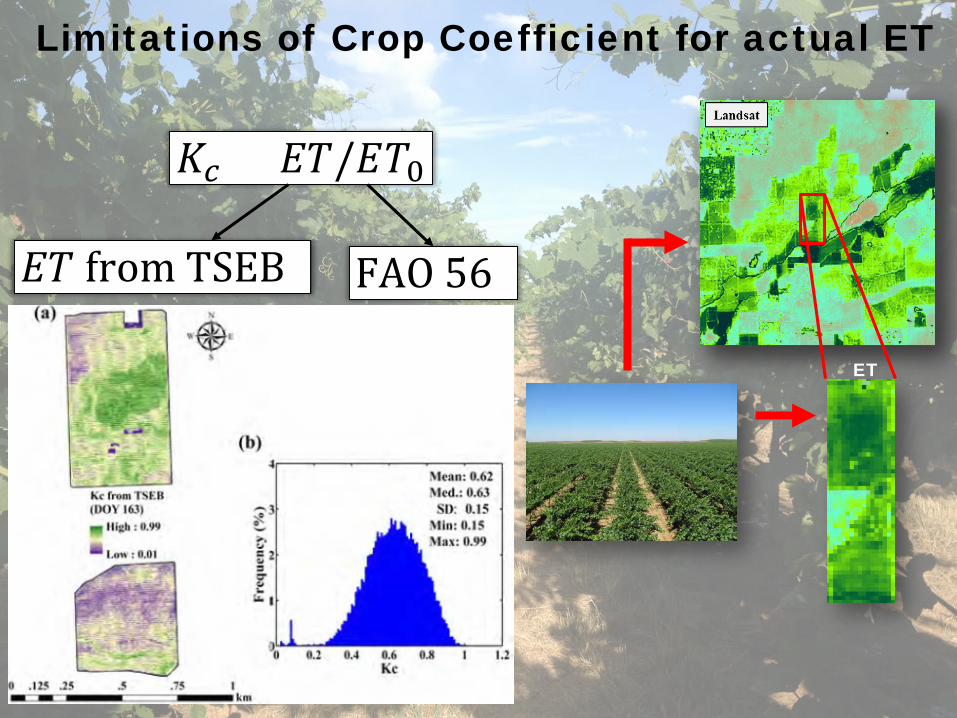
𝐾𝐾𝑐𝑐 = 𝐸𝐸𝐸𝐸/𝐸𝐸𝐸𝐸0
𝐸𝐸𝐸𝐸 from TSEB FAO 56
Limitations of Crop Coefficient for actual ET
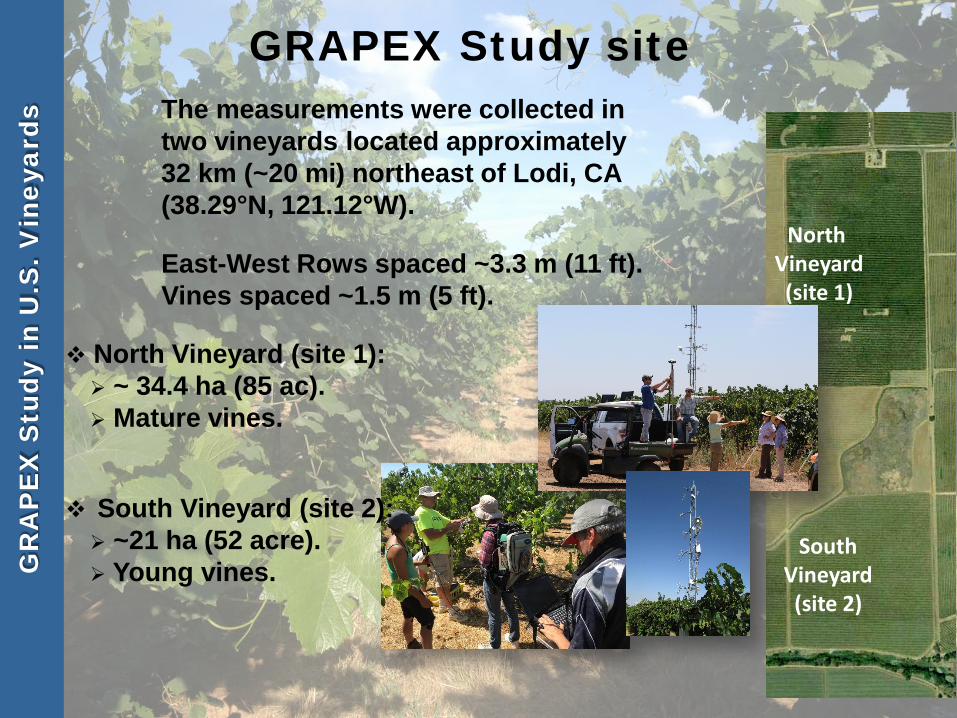
The measurements were collected in two vineyards located approximately 32 km (~20 mi) northeast of Lodi, CA (38.29°N, 121.12°W).
East-West Rows spaced ~3.3 m (11 ft). Vines spaced ~1.5 m (5 ft).
North Vineyard (site 1): ~ 34.4 ha (85 ac). Mature vines.
South Vineyard (site 2): ~21 ha (52 acre). Young vines.
GRAPEX Study siteG
RA
PE
X S
tudy
in U
.S. V
iney
ards
North Vineyard(site 1)
SouthVineyard(site 2)
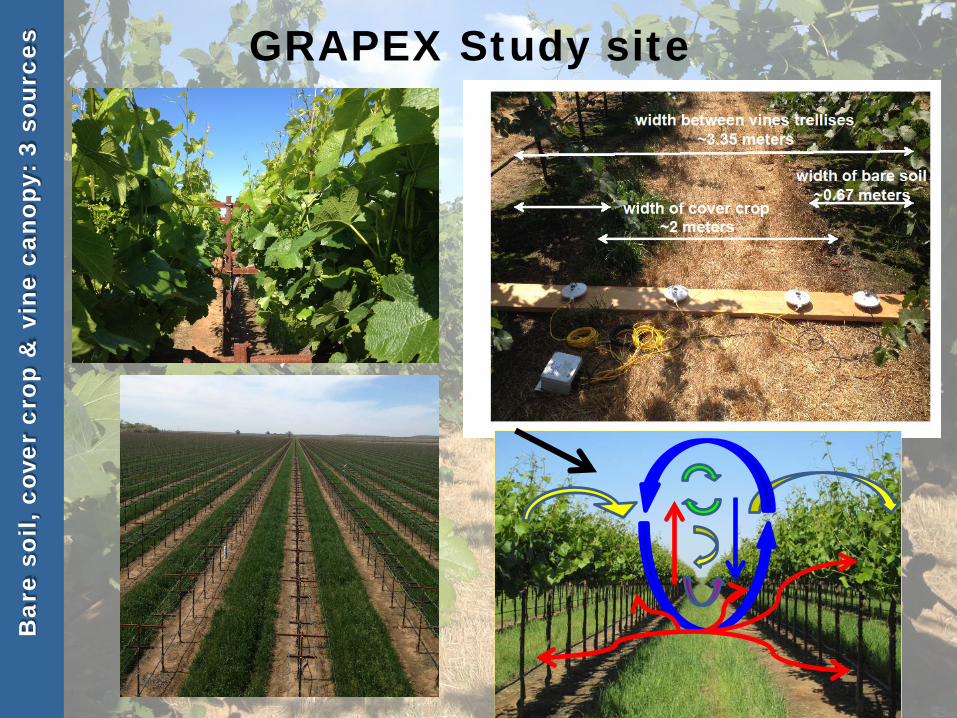
GRAPEX Study siteB
are
soil,
cov
er c
rop
& v
ine
cano
py: 3
sou
rces
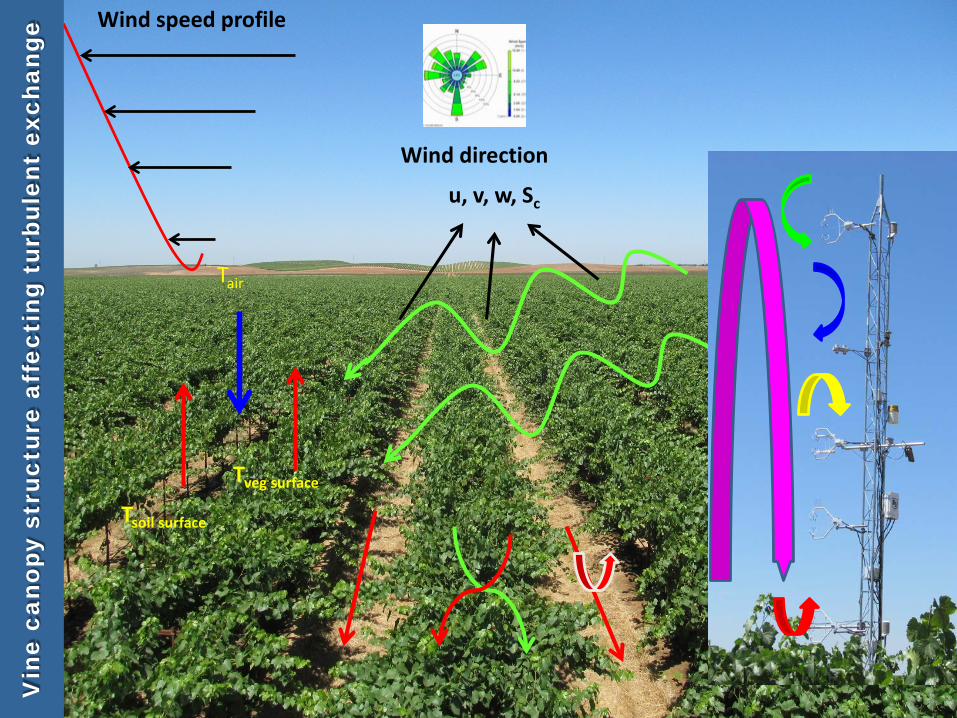
Tsoil surface
Wind speed profile
Wind direction
u, v, w, Sc
Tair
Tveg surface
Vin
e ca
nopy
str
uctu
re a
ffec
ting
tur
bule
nt e
xcha
nge
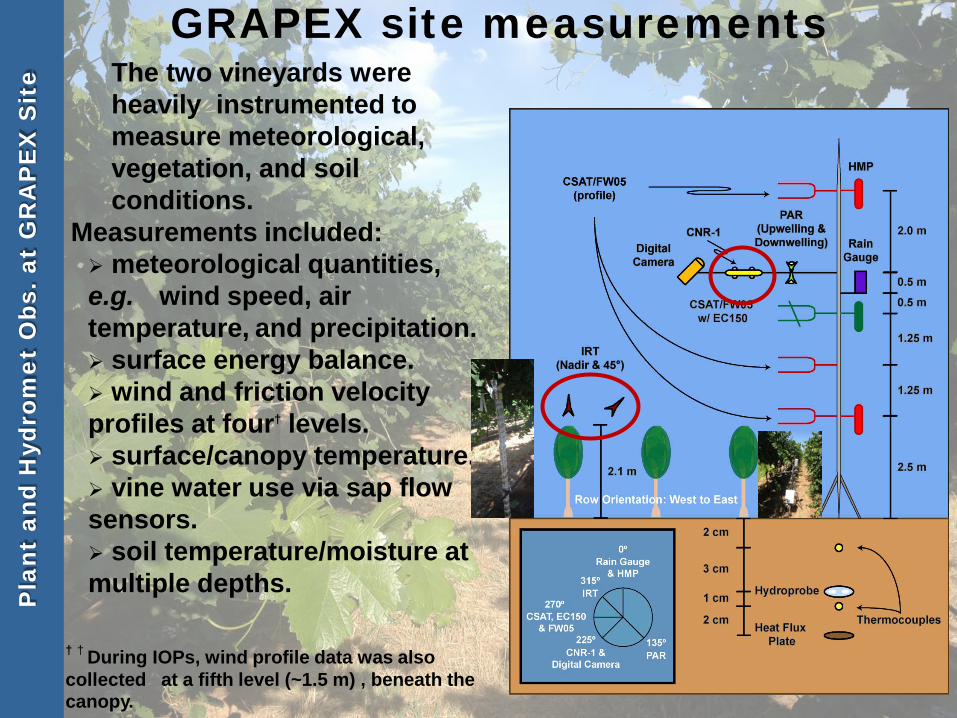
The two vineyards were heavily instrumented to measure meteorological, vegetation, and soil conditions.
Measurements included: meteorological quantities, e.g. wind speed, air temperature, and precipitation. surface energy balance. wind and friction velocity profiles at four† levels. surface/canopy temperature. vine water use via sap flow sensors. soil temperature/moisture at multiple depths.
† † During IOPs, wind profile data was also collected at a fifth level (~1.5 m) , beneath the canopy.
GRAPEX site measurementsP
lant
and
Hyd
rom
etO
bs. a
t G
RA
PE
X S
ite
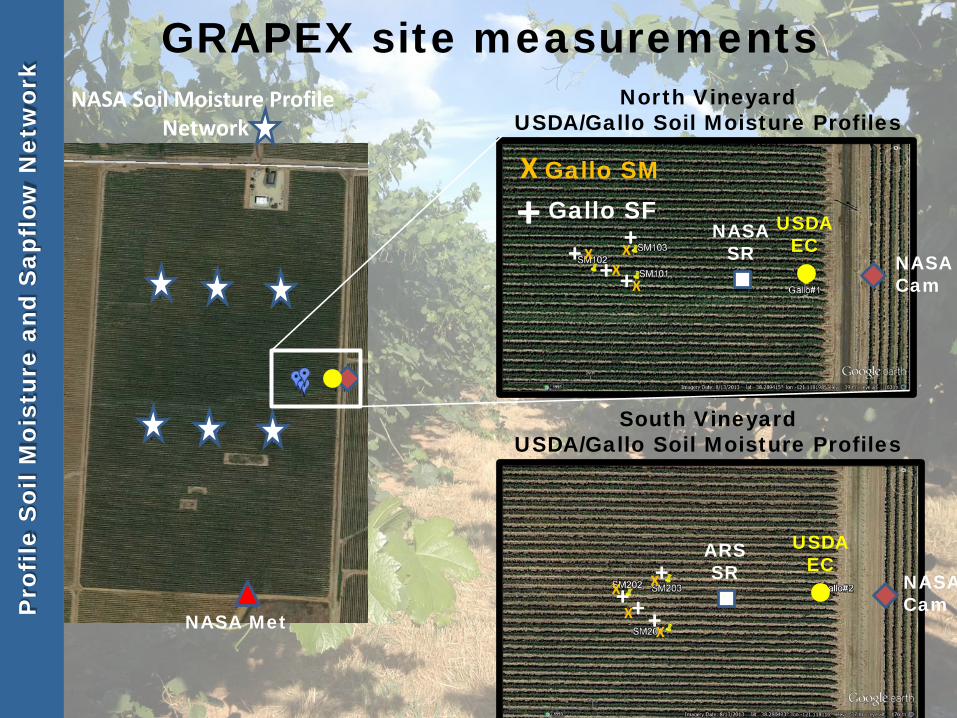
GRAPEX site measurementsP
rofi
le S
oil M
oist
ure
and
Sap
flow
Net
wor
k
NASA Soil Moisture ProfileNetwork
NASA Met
NASA Cam
North VineyardUSDA/Gallo Soil Moisture Profiles
South VineyardUSDA/Gallo Soil Moisture Profiles
X
X X
X
X Gallo SMGallo SF
+++
++
X
++
++XX X
NASASR
USDAEC
USDAEC
ARSSR NASA
Cam
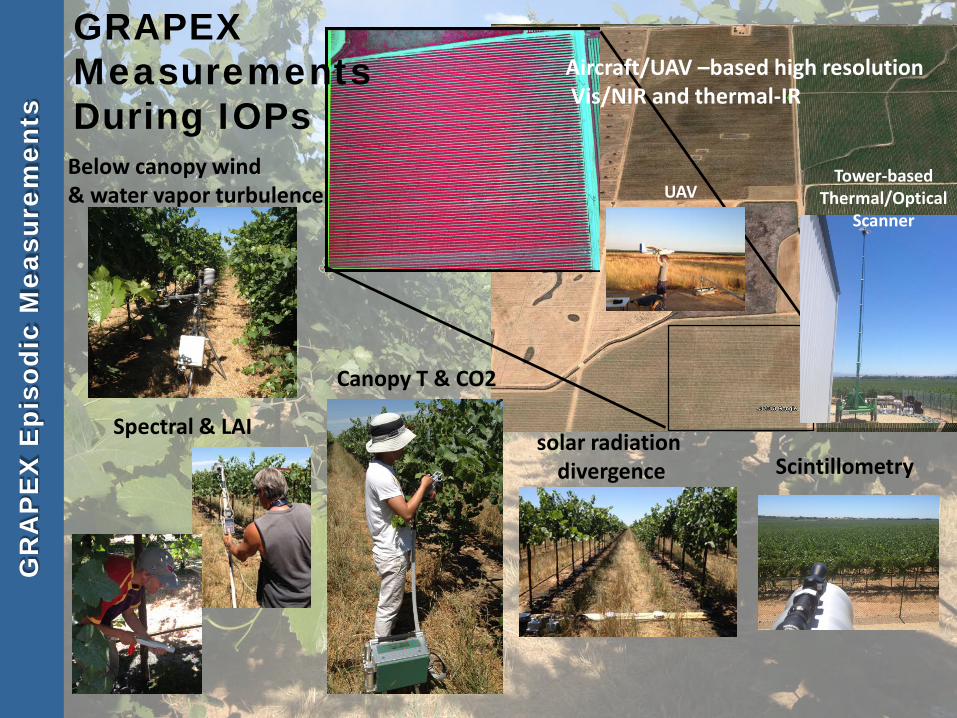
GRAPEX MeasurementsDuring IOPs
GR
AP
EX
Epi
sodi
c M
easu
rem
ents
Spectral & LAI
Canopy T & CO2
solar radiationdivergence
Below canopy wind& water vapor turbulence
Aircraft/UAV –based high resolution Vis/NIR and thermal-IR
Scintillometry
Tower-basedThermal/Optical
ScannerUAV
GR
AP
EX
Epi
sodi
c M
easu
rem
ents
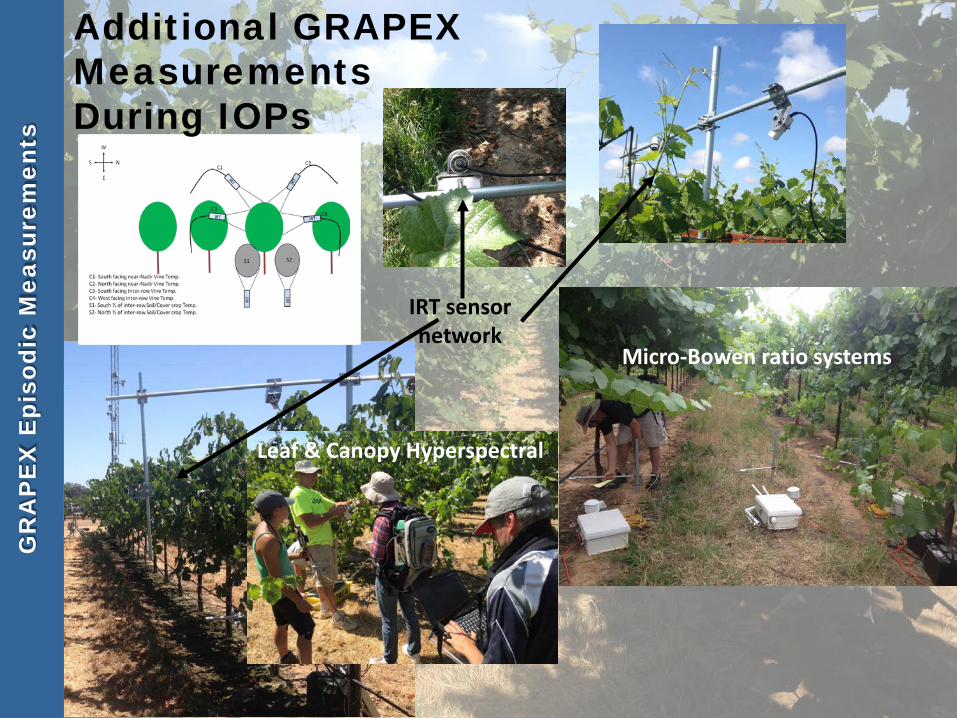
Additional GRAPEX MeasurementsDuring IOPs
Leaf & Canopy Hyperspectral
Micro-Bowen ratio systems
IRT sensornetwork
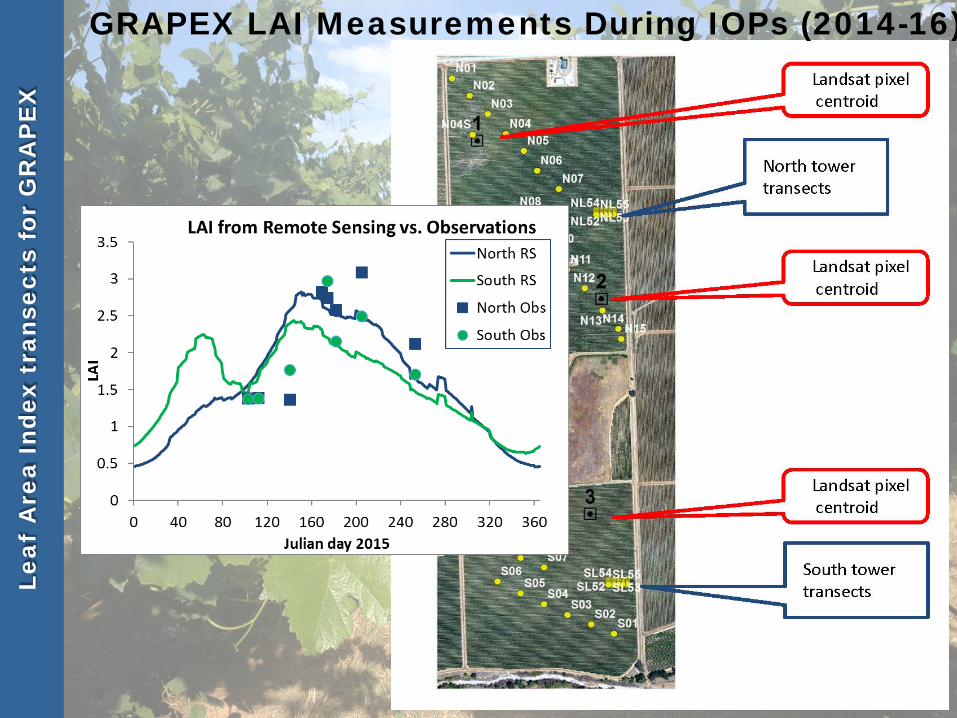
Leaf
Are
a In
dex
tran
sect
s fo
r G
RA
PE
XGRAPEX LAI Measurements During IOPs (2014-16)
GR
AP
EX
Int
ensi
ve O
bser
vati
on P
erio
ds (
IOP
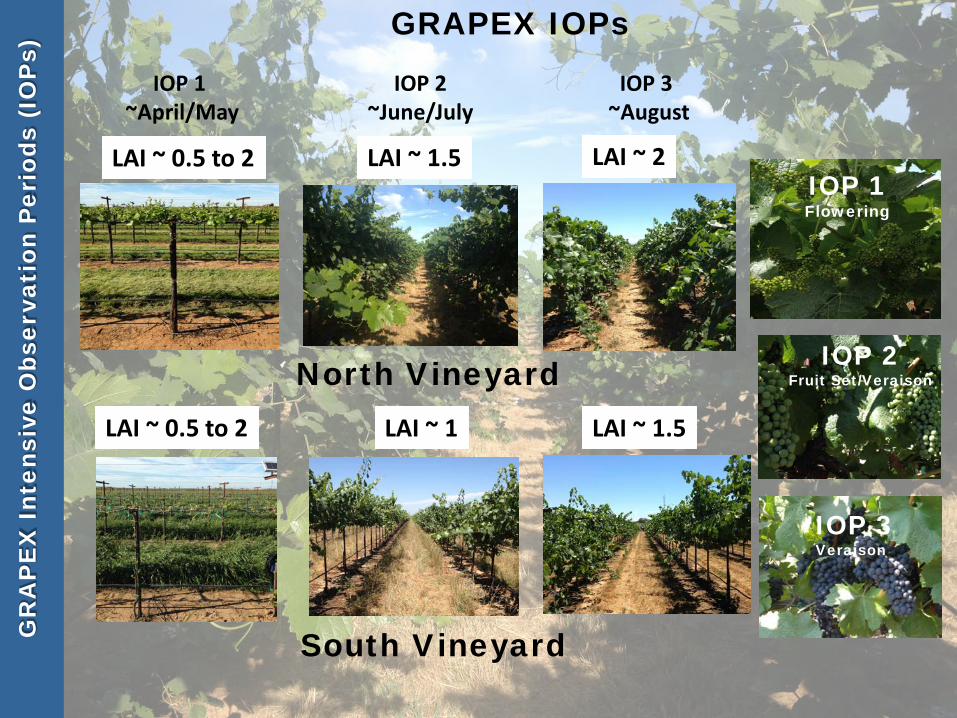
s)GRAPEX IOPs
IOP 1 ~April/May
IOP 2~June/July
IOP 3 ~August
LAI ~ 1.5
LAI ~ 1
LAI ~ 2
LAI ~ 1.5
IOP 1Flowering
IOP 2Fruit Set/Veraison
IOP 3Veraison
LAI ~ 0.5 to 2
LAI ~ 0.5 to 2
North Vineyard
South Vineyard
Tw
o-S
ourc
e E
nerg
y B
alan
ce A
ppro
ach
(TS
EB
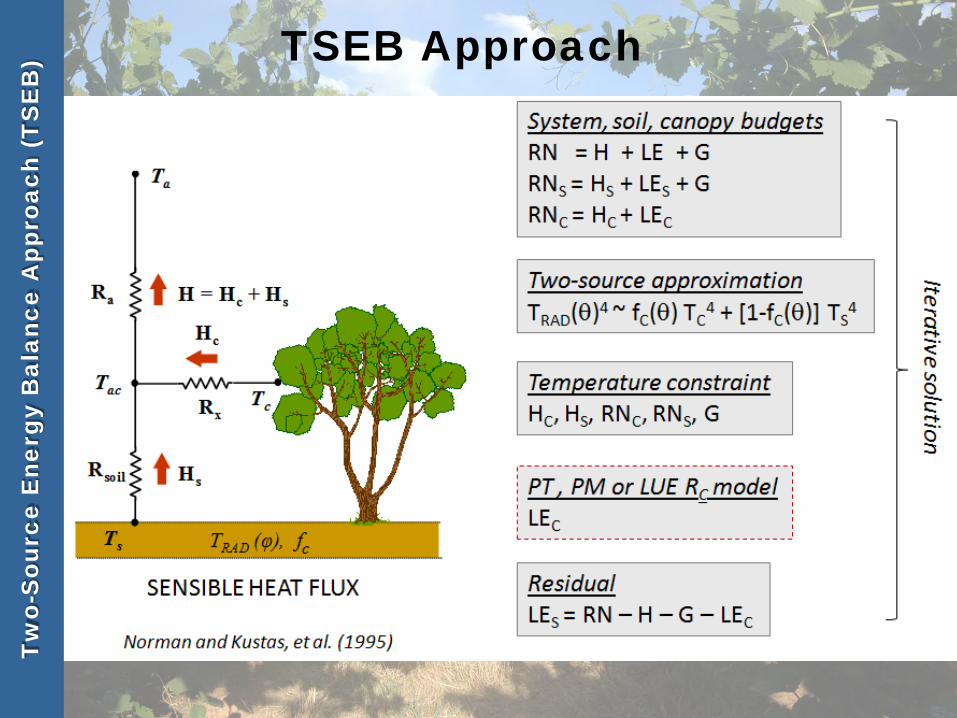
) TSEB Approach
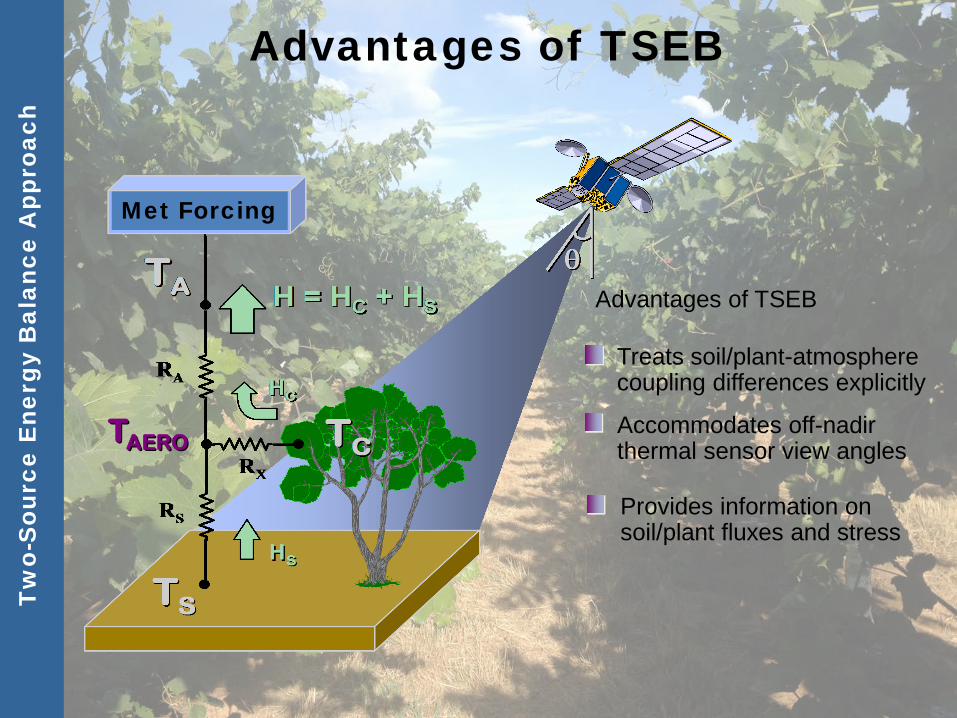
Provides information onsoil/plant fluxes and stress
Accommodates off-nadirthermal sensor view angles
Treats soil/plant-atmosphere coupling differences explicitly
TAERO
Tw
o-S
ourc
e E
nerg
y B
alan
ce A
ppro
ach
Advantages of TSEB
Met Forcing
Advantages of TSEB
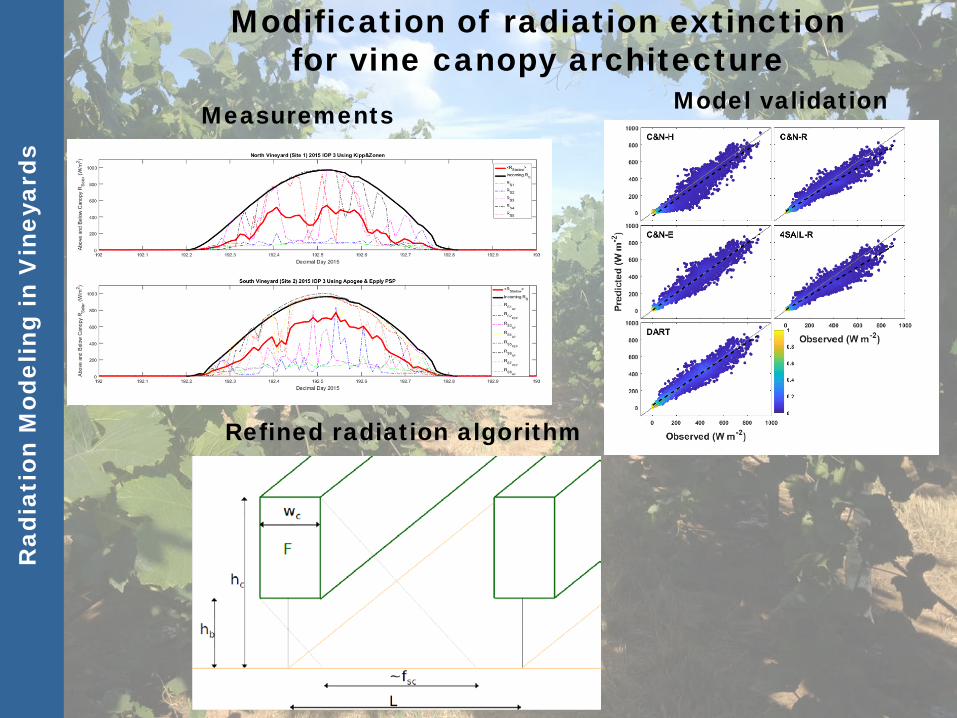
Modification of radiation extinction for vine canopy architecture
Rad
iati
on M
odel
ing
in V
iney
ards
Measurements
Refined radiation algorithm
Model validation
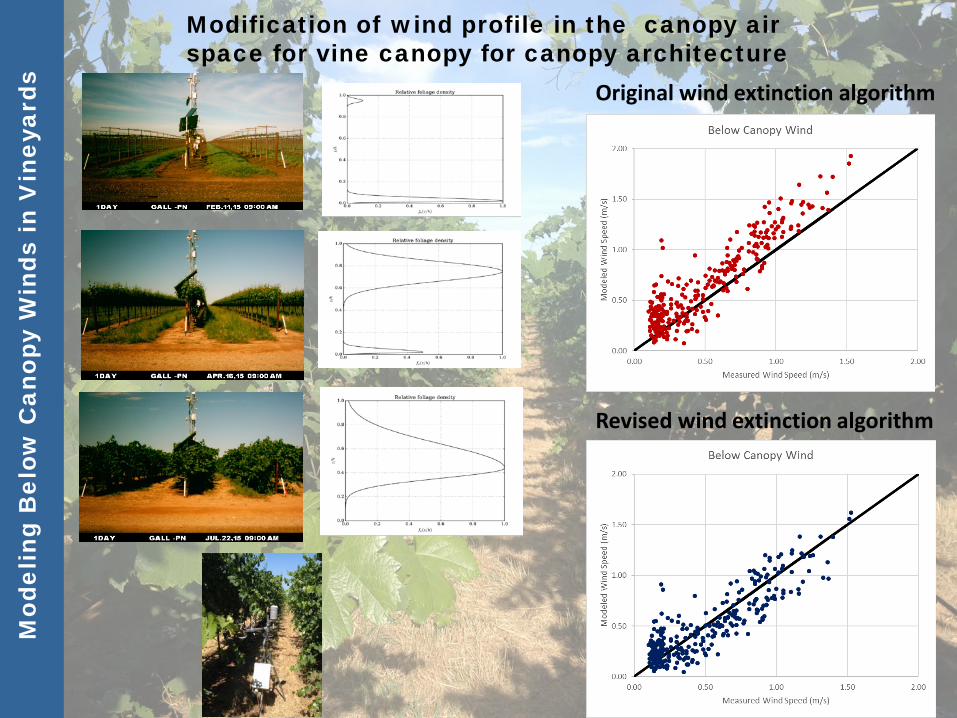
Modification of wind profile in the canopy airspace for vine canopy for canopy architecture
Mod
elin
g B
elow
Can
opy
Win
ds in
Vin
eyar
ds Original wind extinction algorithm
Revised wind extinction algorithm
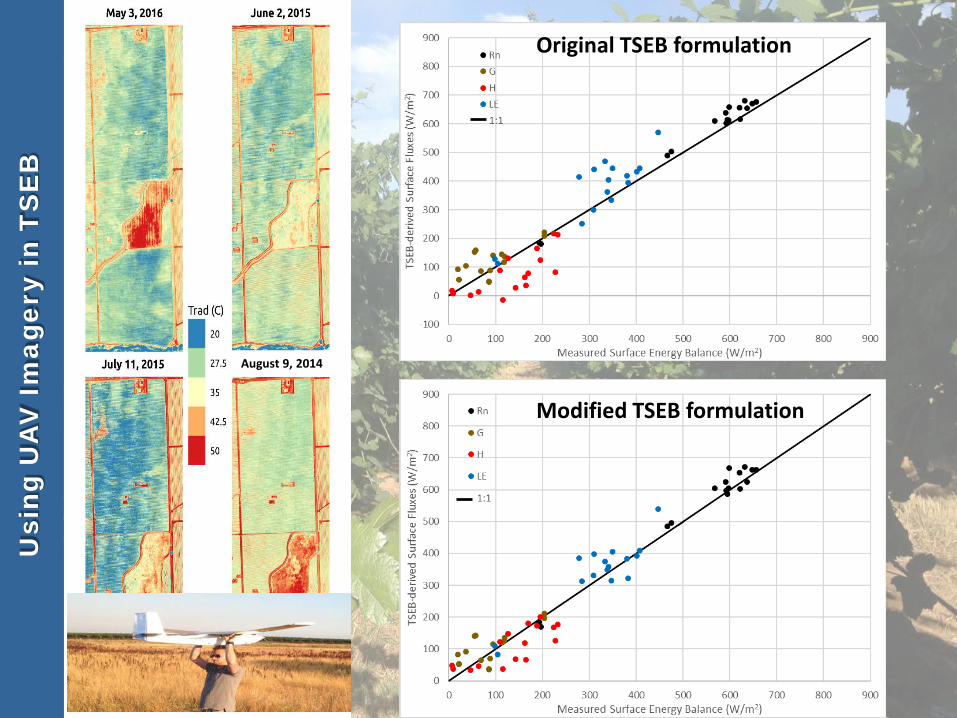
August 9, 2014
Usi
ng U
AV
Im
ager
y in
TS
EB
Original TSEB formulation
Modified TSEB formulation
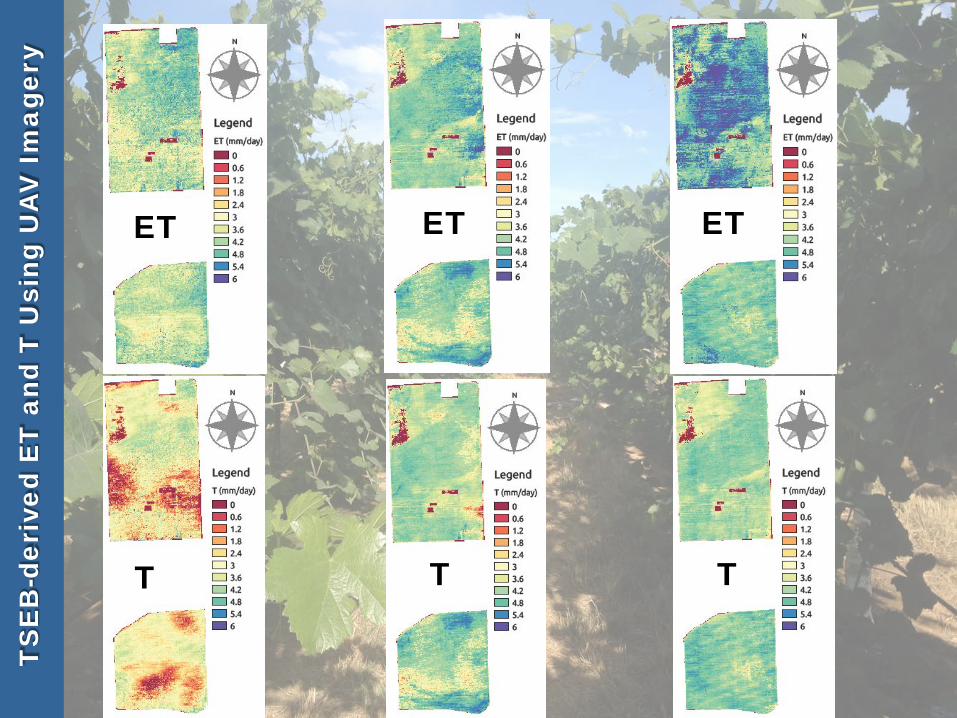
TS
EB
-der
ived
ET
and
T U
sing
UA
V I
mag
ery
ET ET ET
T T T
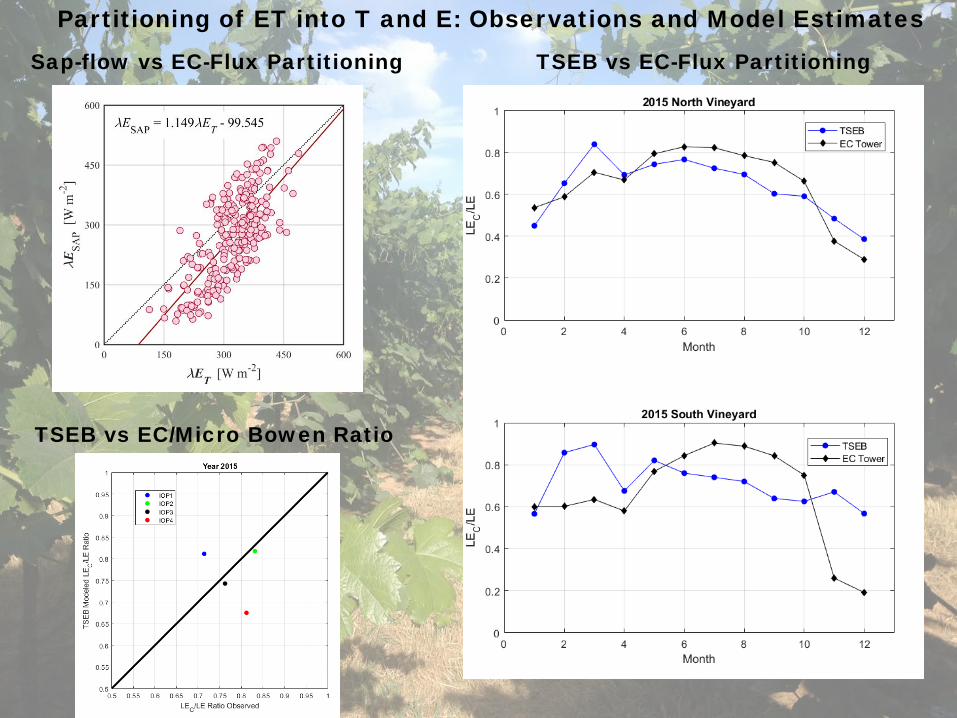
Partitioning of ET into T and E: Observations and Model Estimates
TSEB vs EC-Flux PartitioningSap-flow vs EC-Flux Partitioning
TSEB vs EC/Micro Bowen Ratio
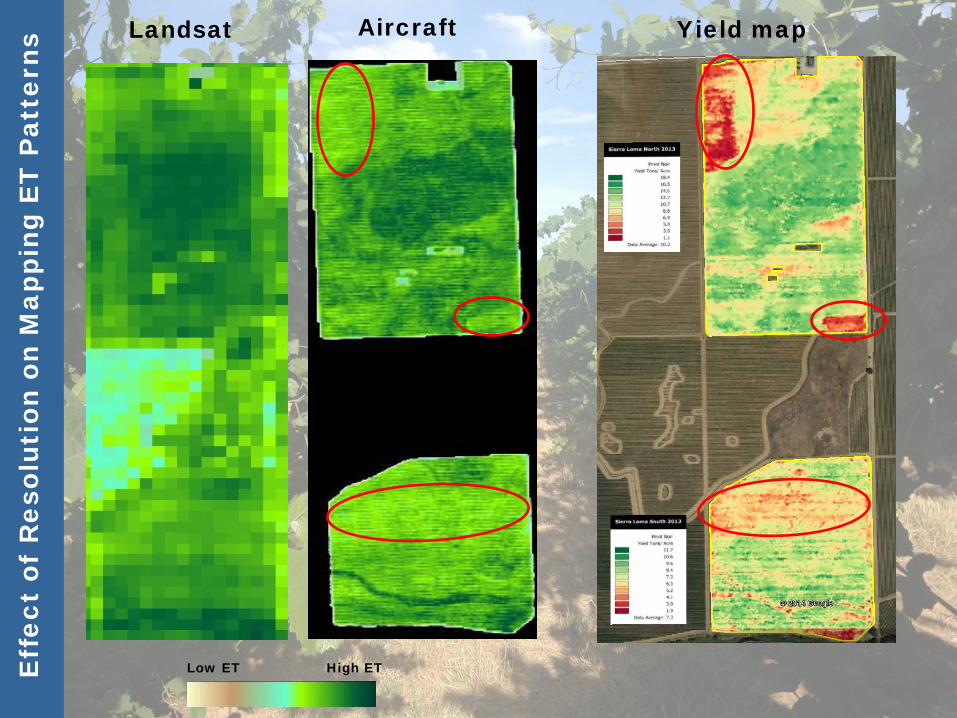
Low ET High ET
LandsatE
ffec
t of
Res
olut
ion
on M
appi
ng E
T P
atte
rns
Vernel pools
Old stream bed
Yield mapAircraft
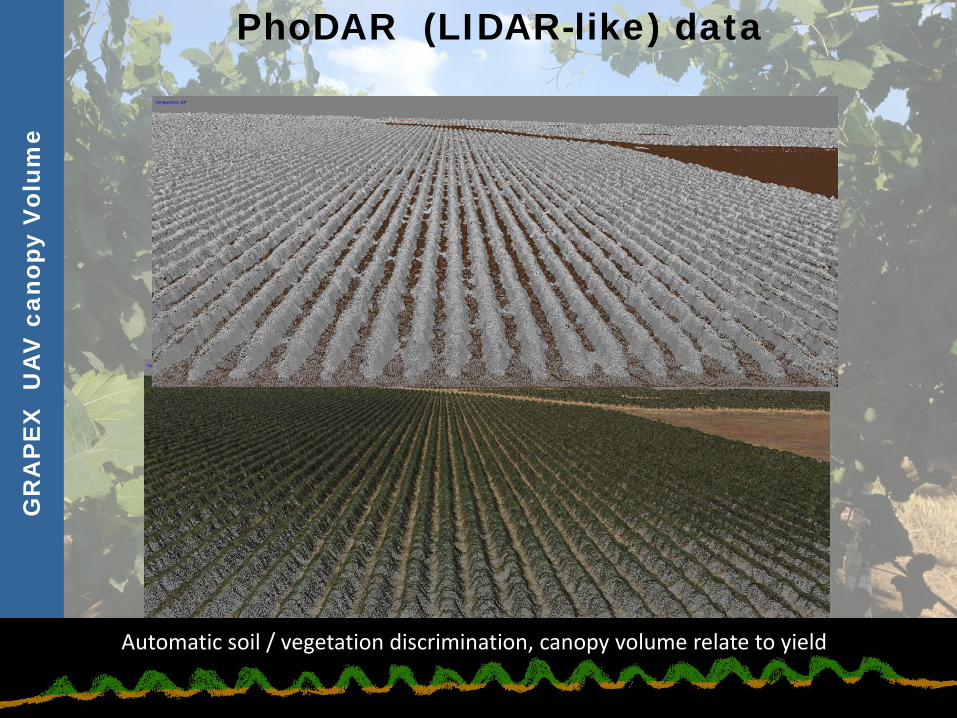
PhoDAR (LIDAR-like) dataG
RA
PE
X U
AV
can
opy
Vol
ume
Automatic soil / vegetation discrimination, canopy volume relate to yield
GR
AP
EX
UA
V S
hado
w D
etec
tion
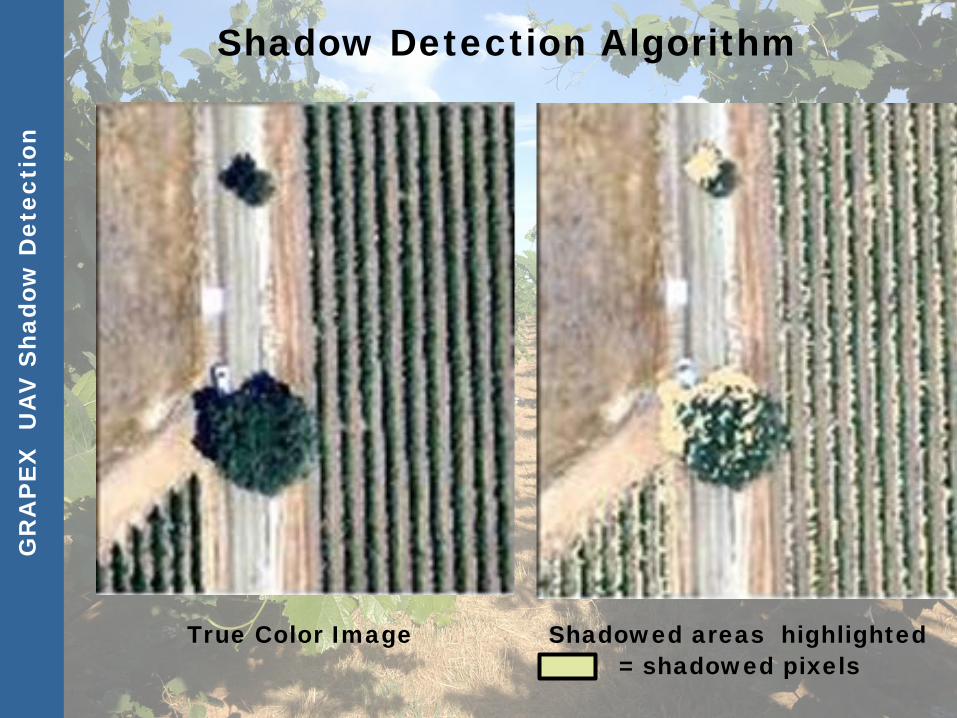
Shadow Detection Algorithm
True Color Image Shadowed areas highlighted = shadowed pixels
Exp
andi
ng G
RA
PE
X S
tudy
Sit
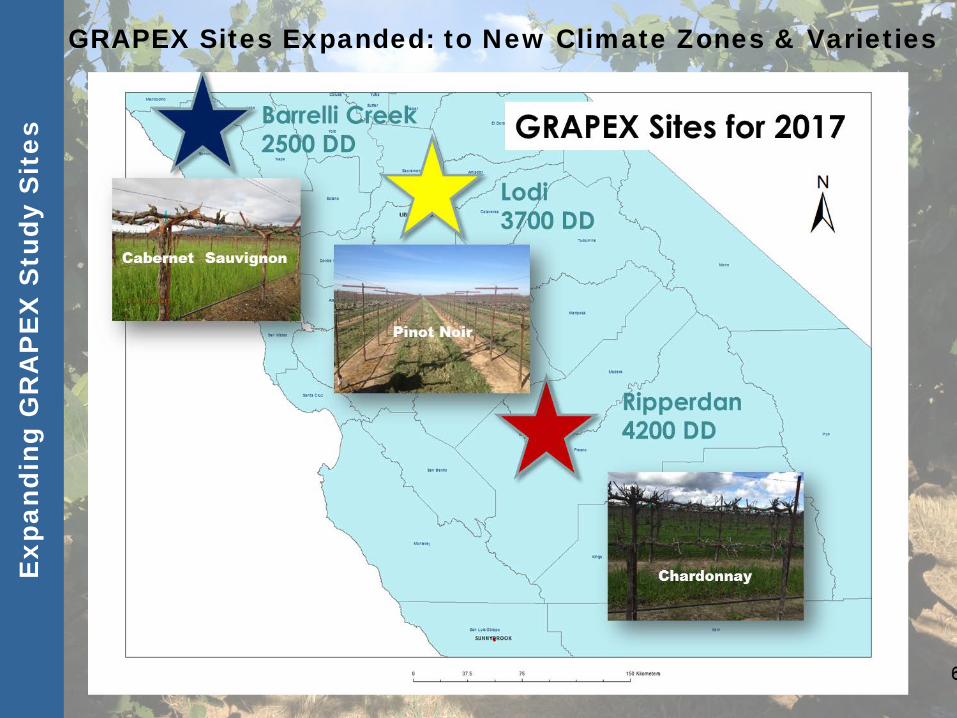
esGRAPEX Sites Expanded: to New Climate Zones & Varieties
Con
clus
ions
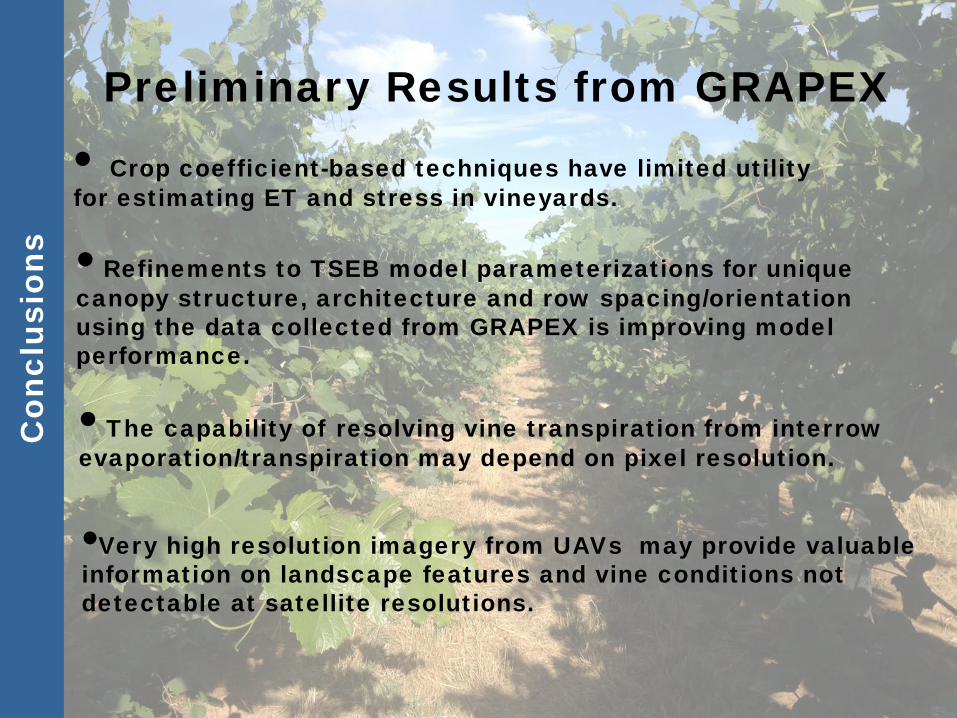
•Very high resolution imagery from UAVs may provide valuable information on landscape features and vine conditions not detectable at satellite resolutions.
• Crop coefficient-based techniques have limited utility for estimating ET and stress in vineyards.
• The capability of resolving vine transpiration from interrow evaporation/transpiration may depend on pixel resolution.
Preliminary Results from GRAPEX
• Refinements to TSEB model parameterizations for unique canopy structure, architecture and row spacing/orientation using the data collected from GRAPEX is improving model performance.