
The Governance of Long-Term Investing in...
230
Departme nt of I nd ustrial E ngi neeri ng a nd Ma nageme nt The Go ve rnance o f Lo ng-Te rm I nve st ing in K nowle dge Cre at io n Novel Co ntrol Mecha nisms for Red uci ng Ma nagerial Myopia a nd I ncreasi ng Growth i n Orga nizatio ns A ntti Niemi DOCTORAL DISSERTATIONS
-
Upload
duongthien -
Category
Documents
-
view
217 -
download
1
Transcript of The Governance of Long-Term Investing in...

9HSTFMG*afdejd+
ISBN 978-952-60-5349-3 ISBN 978-952-60-5356-1 (pdf) ISSN-L 1799-4934 ISSN 1799-4934 ISSN 1799-4942 (pdf) Aalto University School of Science Department of Industrial Engineering and Management www.aalto.fi
BUSINESS + ECONOMY ART + DESIGN + ARCHITECTURE SCIENCE + TECHNOLOGY CROSSOVER DOCTORAL DISSERTATIONS
Aalto-D
D 15
0/2
013
Antti N
iemi
The G
overnance of Long-T
erm Investing in K
nowledge C
reation A
alto U
nive
rsity
Department of Industrial Engineering and Management
The Governance of Long-Term Investing in Knowledge Creation Novel Control Mechanisms for Reducing Managerial Myopia and Increasing Growth in Organizations
Antti Niemi
DOCTORAL DISSERTATIONS

Aalto University publication series DOCTORAL DISSERTATIONS 150/2013
The Governance of Long-Term Investing in Knowledge Creation
Novel Control Mechanisms for Reducing Managerial Myopia and Increasing Growth in Organizations
Antti Niemi
A doctoral dissertation completed for the degree of Doctor of Science (Technology) to be defended, with the permission of the Aalto University School of Science, at a public examination held at the lecture hall AS1 of the school on 15 November 2013 at 12.
Aalto University School of Science Department of Industrial Engineering and Management Strategic Management

Supervising professor Professor Markku Maula Thesis advisor Professor Thomas Keil Preliminary examiners Professor Søren Salomo, Technical University of Denmark , Denmark Professor Yuval Deutsch, York University, Canada Opponent Professor Maurizio Sobrero, University of Bologna, Italy
Aalto University publication series DOCTORAL DISSERTATIONS 150/2013 © Antti Niemi ISBN 978-952-60-5349-3 ISBN 978-952-60-5356-1 (pdf) ISSN-L 1799-4934 ISSN 1799-4934 (printed) ISSN 1799-4942 (pdf) http://urn.fi/URN:ISBN:978-952-60-5356-1 Unigrafia Oy Helsinki 2013 Finland Publication orders (printed book): [email protected]

Abstract Aalto University, P.O. Box 11000, FI-00076 Aalto www.aalto.fi
Author Antti Niemi Name of the doctoral dissertation The governance of long-term investing in knowledge creation: Novel control mechanisms for reducing managerial myopia and increasing growth in organizations Publisher School of Science Unit Department of Industrial Engineering and Management
Series Aalto University publication series DOCTORAL DISSERTATIONS 150/2013
Field of research Strategic Management
Manuscript submitted 11 June 2013 Date of the defence 15 November 2013
Permission to publish granted (date) 20 August 2013 Language English
Monograph Article dissertation (summary + original articles)
Abstract Investments in learning are central to the sustained growth and competiveness of
corporations. However, a corporation’s ability to invest in learning is restrained by managerial preferences for low-risk and short-term investments. Such managerial myopia can be induced by excessive reliance on the short-term financial control of management that is based on the comparison of actual income relative to annual or shorter-term targets. Previous research on corporate governance and corporate internal controls has identified the balancing controls for reducing managerial myopia, but it has focused on top management. There is a lack of understanding of how managerial myopia can be curbed at lower organizational levels.
This dissertation makes a contribution by filling the gap in the understanding of the mechanisms that reduce managerial myopia at lower organizational levels to increase investments in learning new knowledge that is likely to take a long time to generate income. This dissertation extends mechanisms such as strategic controls and boards of directors, which have been examined in previous research on corporate governance and corporate internal controls, to lower organizational levels. Agency theory, organizational control theory, and resource dependence theory are the key theories applied in this dissertation, following the tradition of previous research on corporate governance and corporate internal controls.
This dissertation proposes the use of written ex ante reasoning and reviewers as possible controls against managerial myopia. In addition, the issues of attention, income decrease and the time it takes for an investment to generate income are proposed as potential influences on investments in long-term learning. The hypotheses were tested empirically using a regression analysis on a longitudinal sample of 2,147 research and development projects in a large industrial corporation. Most of the hypotheses received empirical support.
This dissertation contributes to the extant literature by extending previous applications of agency theory to lower organizational levels. In addition, the findings of this dissertation contribute to the literature on managerial myopia and organizational learning. The findings have practical implications for managers and shareholders who consider investments that involve learning and are likely to require long periods of time to generate income.
Keywords governance, organizational control, investment, knowledge, myopia
ISBN (printed) 978-952-60-5349-3 ISBN (pdf) 978-952-60-5356-1
ISSN-L 1799-4934 ISSN (printed) 1799-4934 ISSN (pdf) 1799-4942
Location of publisher Helsinki Location of printing Helsinki Year 2013
Pages 226 urn http://urn.fi/URN:ISBN:978-952-60-5356-1


Tiivistelmä Aalto-yliopisto, PL 11000, 00076 Aalto www.aalto.fi
Tekijä Antti Niemi Väitöskirjan nimi Pitkäaikaisen sijoittamisen hallinnointitavat tiedon tuottamisessa: Uudet ohjausmekanismit lyhytnäköisyyden vähentämiseksi ja kasvun edistämiseksi organisaatioissa Julkaisija Perustieteiden korkeakoulu Yksikkö Tuotantotalouden laitos
Sarja Aalto University publication series DOCTORAL DISSERTATIONS 150/2013
Tutkimusala Strateginen johtaminen
Käsikirjoituksen pvm 11.06.2013 Väitöspäivä 15.11.2013
Julkaisuluvan myöntämispäivä 20.08.2013 Kieli Englanti
Monografia Yhdistelmäväitöskirja (yhteenveto-osa + erillisartikkelit)
Tiivistelmä Investoinnit oppimiseen ovat keskeisiä yritysten kestävän kasvun ja kilpailukyvyn osalta.
Yrityksen kykyä investoida oppimiseen rajoittaa kuitenkin johdon taipumus suosia investointeja, joilla on alhainen riski ja lyhyt takaisinmaksuaika. Tällaista lyhytnäköisyyttä voi aiheuttaa liiallinen turvautuminen lyhyen aikavälin taloudelliseen tulokseen perustuvaan ohjaukseen, jolloin yritystä ohjataan vertaamalla toteutunutta taloudellista tulosta vuosittaisiin tai lyhyemmän aikavälin tavoitteisiin. Aiempi tutkimus yritysten hallinnointitavoista ja yritysten sisäisistä ohjaustavoista on tunnistanut mekanismeja, joilla lyhytnäköisyyttä voidaan vähentää, mutta aiempi tutkimus on keskittynyt yritysten ylimpään johtoon. Ymmärrys lyhytnäköisyyden rajoittamisesta alemmilla organisaatiotasoilla on puutteellista.
Väitöskirja täydentää puuttuvaa ymmärrystä mekanismeista, joilla lyhytnäköisyyttä voidaan rajoittaa alemmilla organisaatiotasoilla ja näin kasvattaa investointeja sellaisen uuden tiedon oppiseen, jonka pohjalta syntyvän taloudellisen tuloksen toteutuminen voi kestää pitkän ajan. Aiempi tutkimus yritysten hallinnointitavoista ja sisäisistä ohjaustavoista on tarkastellut hallituksen ja strategisen ohjauksen käyttöä yritysten johtamisessa ja tässä väitöskirjassa näiden mekanismien soveltamista laajennetaan johtamiseen alemmilla organisaatiotasoilla. Kuten aikaisemmassa tutkimuksessa yritysten hallinnointitavoista ja sisäisistä ohjaustavoista, tärkeimmät väitöskirjan pohjana olevat teoriat ovat agenttiteoria, organisatorinen ohjausteoria, ja resurssi-riippuvuusteoria.
Väitöskirjassa ehdotetaan lyhytnäköisyyden rajoittamiseen mahdollisina ohjauskeinoina investoinnin potentiaalisen tuoton ennaltakuvaavan kirjallisen päättelyn ja erityisten tarkastajien käyttö. Lisäksi ehdotetaan, että investoinnit pitkäaikaiseen oppimiseen riippuvat johdon huomiota ohjaavista tekijöistä, taloudellisen tuloksen heikentymisestä, ja investoinneista taloudellisen tuloksen toteutumiseen kuluvasta ajasta. Väitöskirjan hypoteesit tutkittiin empiriisesti regressioanalyysillä tarkastelemalla suuren teollisuusyrityksen 2147 tuotekehitysprojektista koostuvaa pitkittäisotosta. Empiriiset tulokset tukivat suurinta osaa hypoteeseistä.
Väitöskirja täydentää olemassa olevaa kirjallisuutta laajentamalla agenttiteorian aikaisempia sovelluksia alemmille organisaatiotasoille. Lisäksi väitöskirjan löydökset täydentävät aikaisempaa johdon lyhytnäkösyyteen ja organisaatioiden oppimiseen liityvää tutkimusta. Löydökset tarjoavat käytännön johtopäätöksiä johtajille ja sijoittajille, jotka harkitsevat investointeja sellaisen uuden tiedon tuottamiseen, jonka pohjalta syntyvän
Avainsanat hallinto, ohjaus, sijoittaminen, osaaminen, lyhytnäköisyys
ISBN (painettu) 978-952-60-5349-3 ISBN (pdf) 978-952-60-5356-1
ISSN-L 1799-4934 ISSN (painettu) 1799-4934 ISSN (pdf) 1799-4942
Julkaisupaikka Helsinki Painopaikka Helsinki Vuosi 2013
Sivumäärä 226 urn http://urn.fi/URN:ISBN:978-952-60-5356-1

Acknowledgements
1
Acknowledgements
Many individuals have supported me over the years in the research that
has culminated in this dissertation. Thoughts and constructive criticism
from both researchers and practitioners have helped me to improve the
quality of the research and have made the research endeavor an exciting
experience.
First of all, I would like to thank my supervisors. Professor Tomi
Laamanen led me into this sphere of research and encouraged me to learn
about and delve deeper into the existing body of knowledge. I continued my
research under the supervision of Professor Thomas Keil, who provided me
with invaluable insights into structuring the research into this dissertation
and who tirelessly supported me through the process. I also wish to thank
Professor Markku Maula for increasing the rigor of the empirical analysis of
this research.
I am grateful for Professor Søren Salomo of Technical University of
Denmark and Yuval Deutsch of York University, who acted as my external
examiners. I also want to thank Professor Maurizio Sobrero of University of
Bologna for acting as my opponent.
I am indebted to the case organization for allowing me access to the
valuable data source that made this dissertation possible. A number of
managers from the case organization offered me their support and
constructive feedback. For the sake of confidentiality, I cannot name any of
them here, but I am nevertheless most thankful for every one of them.
I did not request or receive any external funding for this research.
Nevertheless, I want to express my gratitude to Aalto University and to the
citizens of Finland, who have provided me with tuition and access to the
research infrastructure for the entirety of my education and research.

2
Table of contents
1. Introduction ..................................................................................... 4
1.1 Background ................................................................................ 4
1.2 Research problem and objectives ............................................. 6
1.3 Research approach and methods ............................................. 7
1.4 Scope ........................................................................................... 8
1.5 The structure of the dissertation .............................................. 9
2. Literature review ............................................................................ 10
2.1 Relevant theoretical perspectives ............................................ 11
2.2 Board of directors ....................................................................20
2.3 Corporate internal controls..................................................... 39
2.4 Investment in learning ............................................................ 42
2.5 Managerial myopia .................................................................. 52
3. Theory and hypotheses .................................................................. 57
3.1 Decisions on investments in learning in organizations ........ 59
3.2 Written ex ante reasoning as a control mechanism .............. 64
3.3 Reviewers as control mechanism ........................................... 71
3.4 Other factors that reduce managerial myopia ....................... 81
3.5 Summary of hypotheses ......................................................... 88
4. Methods .......................................................................................... 89
4.1 Empirical research context ..................................................... 89
4.2 Data .......................................................................................... 113
4.3 Variables .................................................................................. 114
4.4 Models for hypotheses testing .............................................. 127
4.5 Statistical methods ................................................................ 129
5. Results ............................................................................................ 131
5.1 Model 1: Project actual cost ................................................... 131
5.2 Model 2: Project budget ........................................................ 145
5.3 Comparison across models ................................................... 156
5.4 Summary of results ................................................................ 159

Table of contents
3
6. Discussion and conclusions ........................................................ 160
6.1 Discussion of results ............................................................. 160
6.2 Theoretical and empirical contributions ............................. 168
6.3 Managerial implications ....................................................... 170
6.4 Limitations .............................................................................. 173
6.5 Directions for further research .............................................. 175
7. Appendix ....................................................................................... 177
8. References .................................................................................... 199
4
1. Introduction
1.1 Background
The past research on managerial myopia suggests that an excessive
preference for low risk and short-term investments restrains an
organization’s ability to allocate resources to learning new knowledge that
is likely to take a long time to generate income (e.g., Hayes and Abernathy,
1980; Hill, 1985; Porter, 1992; Hoskisson et al., 1993; Jensen, 1993;
Levinthal and March, 1993; Laverty, 1996; Zahra, 1996; Miller, 2002;
Marginson and McAulay, 2008: Barrett, 2010). Managerial myopia can be
induced by an excessive reliance on the short-term financial control of
management, which is based on the comparison of actual income relative to
annual or shorter-term targets. Such a short-term focus can reduce
investments in learning new knowledge that is likely to take a long time to
generate income and may eventually erode an organization’s ability to
remain competitive in a changing environment over time (Leonard-Barton,
1992; Levinthal and March, 1993; Utterback, 1994; Christensen and Bower,
1996). Managerial myopia has been observed to be a common dilemma
faced by numerous organizations that limits wealth creation. A common
indication of the prevalence of managerial myopia is incessant discussions
in the public media about degrading competitiveness and calls for
innovation to improve competitiveness.
Previous research on corporate governance and organizational control has
addressed the dilemma of managerial myopia. Such research has
contributed to an understanding of how corporate governance and
organizational controls can be employed to curb managerial myopia within
organizations. The literature on corporate governance is based on agency
theory, which suggests that equity-based incentives such as stock and stock
options can be applied to avoid excessive managerial myopia (Jensen and
Meckling, 1976; Holmström, 1979; Fama, 1980; Fama and Jensen, 1983a,
1983b). Agency theory further contends that equity-based incentives do not
provide a perfect solution and can be complemented by monitoring.
Corporate governance regards boards of directors as the main monitoring

Introduction
5
mechanism. In its monitoring role, a board assesses management’s ability
and effort and the external factors that influence shareholder return. If a
board of directors perceives a need for improvement by management to
increase shareholder return, the board can adjust the management of the
organization by modifying incentives or changing the management
personnel.
Whereas corporate governance focuses on the apex of an organization by
investigating the role of incentives and the board of directors in controlling
the CEO, the research on corporate internal controls focuses on studying
the next level down in the organizational hierarchy. In particular, it
investigates how the corporate management of a multidivisional firm
controls the divisional management that reports to the corporate CEO (e.g.,
Gupta, 1987; Hill and Hoskisson, 1987; Baysinger and Hoskisson, 1989,
1990; Hitt et al., 1990; Goold and Quinn, 1990; Hoskisson et al., 1991, 1993;
Johnson et al., 1993; Hitt et al., 1996; Barringer and Bluedorn, 1999).
Corporate management can apply strategic controls to evaluate the
strategies by division management. As a consequence, division
management can also be evaluated based on its longer-term strategic
decisions rather than by its short-term financial performance. This method
of evaluation is expected to motivate division management to pay more
attention to sustaining longer-term competitiveness.
In summary, previous research on corporate governance and strategic
controls provides a number of controls against managerial myopia, but that
research focused on boards, CEOs and division management. Board
monitoring and strategic controls are not as applicable to control beneath
the upper echelons. In addition, the effectiveness of equity-based incentives
is reduced considerably at lower organizational levels because the decisions
of an individual manager can only have a marginal effect on the total
organizational income, which determines the outcomes of equity-based
incentives (Baker et al., 1988; Baker, 1992, Balkin, et al., 2000; Zenger and
Marshall, 2000).
In conclusion, there is a lack of understanding about the controls that can
be used against managerial myopia at lower organizational levels. However,
most individuals who are employed by large organizations work at lower
organizational levels. Additionally, the bulk of the decisions that determine
organizational income are made at lower organizational levels. Therefore,
the difficulty of controlling managerial myopia at lower levels is expected to
impose a substantial limitation on an organization’s ability to invest in
learning new knowledge that is likely to take a long time to generate
income. An improved understanding of how to curb managerial myopia at

6
lower organizational levels could help organizations to better sustain their
long-term competitiveness.
1.2 Research problem and objectives
This research aims to fill the gap in the understanding of the controls that
can be used against managerial myopia at the lower organizational levels.
This research problem is addressed with the following main research
question:
How can large organizations better control against managerial myopia
at lower organizational levels to increase investments in learning new
knowledge that is likely to take a long time to generate income?
This main research question is addressed in three stages and guided by
three further questions. The existing knowledge about controls against
managerial myopia is used as a starting point to search for answers to the
main research question. This first stage is driven by the following question:
1. How can the known control mechanisms be extended for
application at lower organizational levels?
This question is addressed by an overview of the extant research on
boards of directors and corporate internal controls. Based on this review, a
number of controls against managerial myopia at the upper echelons are
identified and then modified for use at lower organizational levels. As a
result, a model of the control mechanisms at lower organizational levels is
developed. In the next phase, this study investigates how such control
mechanisms can actually curb managerial myopia. This investigation is
guided by the second question:
2. How do investments in learning new knowledge that is likely to
take a long time to generate income depend on the use of controls
against managerial myopia at lower organizational levels?
This question is examined to determine how the identified controls can
both encourage and impede the ability and motivation of decision makers
at lower organizational levels to invest in the learning that is needed to
support an organization’s long-term competitiveness. The theory is
formulated as a number hypotheses for empirical testing. In addition to the
control mechanisms themselves, the extant literature on corporate

Introduction
7
governance and organizational learning is also reviewed to identify other
factors that can influence managerial myopia and the effect of control
mechanisms in curbing managerial myopia and increasing investments in
learning new knowledge that is likely to take a long time to generate
income. This issue is addressed by the following third question:
3. What other factors can influence managerial myopia and the
effect of control mechanisms in increasing investments in
learning new knowledge that is likely to take a long time to
generate income?
The objective of this study is to identify the controls against managerial
myopia at the lower organizational levels of large organizations. In
particular, this study aims to conceptualize the mechanisms for how these
controls against managerial myopia influence investments in learning new
knowledge that is likely to take a long time to generate income. This study
also aims to formulate a theory of empirically testable hypotheses and to
actually test those hypotheses. Finally, this study seeks to provide tangible
recommendations to practitioners for reducing managerial myopia in large
organizations.
1.3 Research approach and methods
The construction of the theoretical model is guided by the research
problem and question. The basis is an overview of the extant body of
knowledge that is related to the research problem. In particular, the past
research on corporate governance, corporate internal controls, investment
in learning, and managerial myopia are reviewed. The known control
mechanisms that are applicable to the organizational upper echelons are
utilized as the basis for a theory of controls against managerial myopia at
lower organizational levels. The theory of this study is formulated as a
number of hypotheses that can be tested empirically.
The hypotheses of this study are tested on the data of research and
development projects in a large industrial corporation. When the interest of
research regards managers at the lower levels of an organization, a detailed
focus on a single firm provides certain gains. Organizational processes are
usually complex and rich in subtlety. Organizational phenomena tend to
have a temporal dimension of dynamism that can be best captured by
longitudinal data (e.g., Pettigrew, 1992). A focus on one organization helps
to provide a more comprehensive and longitudinal understanding of the
details that are related to the phenomena that influence decisions by

8
individuals (e.g., Siggelkow, 2007). The methods that were used in this
study are discussed in more detail in chapter 4.
The data on the research and development projects were obtained from
the corporation’s management information systems. The sample consisted
of the over 260 million euros invested in 2,147 research and development
projects over a thirteen-year period between 1997 and 2009. The
hypotheses were tested empirically with quantitative statistical methods
using a regression analysis. Finally, based on the empirical findings,
conclusions are drawn for both theoretical and practical implications.
1.4 Scope
The theoretical scope of this study focuses on large organizations that
have several organizational levels. In small companies, in which most of the
decisions that influence long-term competiveness are made by the
management team, the controls against managerial myopia, which focus on
upper echelons and have been identified by previous research, are likely to
be effective.
The empirical findings of this study are based on a single large industrial
company. When the focus is on the managers at the lower levels of an
organization, the focus on a single firm provides certain gains.
Organizational processes are usually complex and rich in subtlety.
Organizational phenomena tend to have a temporal dimension of
dynamism that can be best captured by longitudinal data (e.g., Pettigrew,
1992). The focus on one organization helps to provide a more
comprehensive and longitudinal understanding of the details that are
related to the phenomena that influences the decisions that are made by
individuals (e.g., Siggelkow, 2007).
The generalizability of the findings from a study that is based on the
investigation of only one organization is inherently suspect. Any finding can
be due to something that is idiosyncratic to the organization, and similar
phenomena may not exist in most other organizations. This risk can be
minimized by sampling an organization that is a typical representative of
many similar organizations and does not have idiosyncratic characteristics
that would be critical to the findings. To address the potential limitation of
the generalizability of the findings, a typical industrial corporation was
chosen for investigation. To further minimize the risk of any idiosyncratic
characteristics, the corporation and the processes within the organization
are analyzed and described in detail. This description suggests that the
activities within the organization closely match the findings of previous
literature on corporations, and no idiosyncratic characteristics that are

Introduction
9
critical to the findings are observed. Therefore, the findings from this study
are assumed to be generalizable to a broader population of similar
corporations.
The empirical data consist of research and development projects.
Research and development expenditure has been widely used in the past
research to measure the activities that are related to long-term learning in
firms (e.g., Hoskisson and Hitt, 1988; Hitt et al, 1991; Hoskisson et al.,
1993; Helfat, 1994a, 1994b; Hitt et al, 1996; Hundley et al., 1996; Palmer
and Wiseman, 1999; Greve, 2003; Lee and O’Neill, 2003; Chen and Miller,
2007; Sanders and Hambrick, 2007; Chen, 2008; Kim et al., 2008).
Research and development projects are expected to effectively represent the
general investments in learning new knowledge that is likely to take a long
time to generate income, but adequate caution is nevertheless warranted in
generalizing the results to different types of long-term learning.
1.5 The structure of the dissertation
Following this introduction, chapter 2 provides a literature review.
Chapter 3 formulates the theory and hypotheses. Methods, including the
empirical research context and operational variables, are described in
chapter 4. The empirical results are presented in chapter 5. Finally, chapter
6 discusses the conclusions of the research, including the practical
implications and avenues for future research.

10
2. Literature review
This chapter reviews the theories and literature that are relevant for the
theory and hypotheses developed in chapter 3. The review of the theories
and literature is driven by the research question that asks how large
organizations can improve controls against managerial myopia at lower
organizational levels to increase investments in learning new knowledge
that is likely to take a long time to generate income. To address this
research question, the literature on corporate governance, corporate
internal controls, investment in learning, and managerial myopia are
reviewed. Before the review of this literature, the relevant theoretical
perspectives are introduced. These perspectives include agency theory,
organizational control theory, and resource dependence theory.
The literature on corporate governance and corporate internal controls is
reviewed to provide an understanding of how large organizations can be
controlled. The literature on board of directors focuses on the very apex of
an organization, investigating the shareholder-board and board-CEO
dyads. On the other hand, the literature on corporate internal controls
focuses on the next level of organizational hierarchy, the relationship
between CEOs and division managers.
The literature on investment in learning is reviewed to provide an
understanding of the factors that influence the amount of resources that are
invested in learning. Once the literature on corporate governance,
corporate internal controls, and investment in learning are reviewed, the
literature on managerial myopia is reviewed to provide an understanding of
how investments in learning can be bounded by the limitations of
organizational controls. This review provides the basis for the following
chapter, which examines how known organizational controls can be
extended to reduce the managerial myopia that limits investments in
learning.
Literature review
11
2.1 Relevant theoretical perspectives
2.1.1 Agency theory
Agency theory explains how a firm can be organized with separate owners
and management (Ross, 1973; Jensen and Meckling, 1976; Harris and
Raviv, 1978, 1979; Holmström, 1979; Fama, 1980; Fama and Jensen, 1983a,
1983b). Agency theory and related research is discussed in detail in many
reviews (e.g., Eisenhardt, 1989; Shleifer and Vishny, 1997; Dalton et al.,
2007).
Jensen and Meckling (1976, p. 308) define an agency relationship as “a
contract under which one or more persons (the principal(s)) engage
another person (the agent) to perform some service on their behalf which
involves delegating some decision making authority to the agent.” For
example, in a corporate context, agency theory is applied by regarding
shareholders as principals and a CEO as an agent. Agency theory has its
roots in economics and is deduced from a number of assumptions through
mathematical analysis. The main assumptions of agency theory are related
to self-interest, asymmetric information, and the risk aversion of a principal
and agent.
Agency theory assumes that both a principal and agent maximize their
self-interest. Because the desires and goals of the principal and the agent
are usually different, an agency creates a conflict of interests. In particular,
the agent can take actions that benefit the agent at the cost of the principal.
The self-interest of the agent is neither hypothetical nor marginal but has
been found in many empirical studies. For example, Shleifer and Vishny
(1997) provide several examples of how agents have benefited at the cost of
principals. As an example, they illustrate how in some cases, management
has made decisions to buy corporate assets from firms that were owned by
management at a 99 percent discount, thereby practically appropriating the
wealth of the shareholders. In conclusion, a principal has reason to be
concerned about the self-interest and mischief of an agent. A principal is
even unlikely to hire an agent in the first place unless the principal can
somehow curb the agent’s actions. Agency theory seeks to determine how a
principal can best motivate an agent to take actions that benefit the
principal.
If a principal can directly observe the actions that are taken by an agent
and their outcomes without any uncertainty, it is straightforward for the
principal to motivate the agent simply by compensating the agent based on
the actions that were taken by the agent. The principal and agent can make
a contract that defines how much the principal will pay for the agent once

12
the agent has taken each action. The principal then observes the actions of
the agent and pays the agent according to the contract.
However, the principal usually cannot fully observe the agent’s actions or
their influence on outcomes directly. This is the assumption of asymmetric
information. In this case, the principal cannot compensate the agent based
on observed actions. If the principal would just hire the agent without being
able to observe what the agent does, the principal would expect the agent to
take actions with self-interest, which could be quite harmful for the
principal. Thus, the principal would not hire the agent in the first place.
However, agency theory suggests that a principal can solve this problem by
making an agent’s compensation contingent on the principal’s income. For
example, a principal and an agent can make a contract that specifies that
the agent gets a certain percentage of the principal’s income. When the
agent’s income depends on the principal’s income, the agent is motivated to
take actions that increase the principal’s income.
Agency theory further shows that even when an agent’s income depends
on a principal’s income, the agent still may not take the actions preferred by
the principal because the principal and agent can have different risk
preferences. The risk preferences can differ because the principal and agent
have different levels of wealth. In addition, the principal can diversify his or
her wealth among many agencies, and one agency influences only a minor
part of the principal’s wealth. On the other hand, the agent is likely to get
most of his or her income from only one agency. Therefore, the variation in
the income from one agency has a much larger impact on the agent’s than
on the principal’s total wealth. The agent is likely to take actions to adjust
the variation of the agency’s income to optimize personal risk, but such
variation is likely to be less than preferred by the principal. Agency theory
notes that because of this dilemma of risk aversion by an agent, a principal
cannot fully align the agent’s actions with the principal’s preferences by
making the agent’s compensation contingent on the principal’s income.
Agency theory suggests that a principal can improve an agent’s motivation
to take actions that are in line with the principal’s preferences by
complementing the agent’s income-based compensation with the
monitoring of the agent’s actions. Holmström (1979) showed that any
additional information about an agent's actions, however imperfect, can be
used to improve the agent’s incentives. A principal can monitor an agent
with information systems such as auditing, formal control systems,
budgeting systems, reporting systems, additional layers of management
and boards of directors (e.g., Eisenhardt, 1989). The role of a board of

Literature review
13
directors has been the most studied mechanism for the monitoring of
agents.
A principal’s decisions are not limited solely to choosing an agent and the
agent’s compensation, but, in addition, the principal can also make
decisions on choosing which actions are to be implemented (Fama and
Jensen, 1983a; Aghion and Bolton, 1992; Aghion and Tirole, 1997). Usually
a principal delegates most of the decisions to be taken by an agent but
retains rights to make certain key decisions that can have a major impact on
the principal’s income.
In addition to income-based compensation and monitoring, the market
for corporate control provides a third control mechanism for an agency
(Jensen and Meckling, 1976; Fama, 1980; Fama and Jensen, 1983a, 1983b).
The market for corporate control is usually regarded as a “last resort”
control for cases in which both income-based compensation and
monitoring fail to motivate the agent adequately. If management acts with
self-interest against a principal, the principal’s income from the agency is
likely to be relatively low. As a result, the potential for increasing a
principal’s income by changing the management becomes an attractive
opportunity. The market for corporate control means that if management
acts with self-interest against a principal, the agency, such as a firm, can be
taken over by other principals who can then replace the management with
other individuals.
In summary, agency theory suggests that a principal can motivate an
agent to take actions that are in line with the principal’s interests through a
combination of financial incentives and the monitoring of the agent’s
actions. The market for corporate control works as a third, last-resort type
of control. The theoretical predictions of agency theory have been widely
tested, and many of the empirical results tend to support the theory. As a
result, agency theory has been adopted as the dominant theoretical basis for
corporate governance. The following chapters briefly review the past
research on the details and empirical findings that are related to financial
incentives and monitoring by boards of directors. Because this study
focuses more on monitoring than on financial incentives, the past research
on boards of directors is reviewed in greater detail than the research on
financial incentives.
Equity-based incentives
Stock ownership and stock options are the two most widely applied types
of equity-based financial incentives in firms (e.g., Jensen and Murphy,
1990). They can also be applied in combination. Equity-based incentives

14
are usually complemented by fixed-base salaries and variable bonuses that
are contingent on short-term performance such as a firm’s annual
operating profit.
When stock ownership is applied, the principal grants or sells the agent
part of a firm’s equity. According to agency theory, such ownership share is
expected to motivate the agent to take actions that maximize the firm’s
future income. On the other hand, stock options give an agent the right to
buy stock at a specified price during some time period in the future. As a
result, if the stock price increases above the specified price in the future, the
agent can benefit by buying stock at a discount. Stock options motivate the
agent to maximize the stock price by the time that the agent can exercise
the stock options. Such an increase in stock price will also benefit the
principal.
Agency theory posits that neither stock ownership nor stock options align
an agent’s preferences perfectly with a principal’s. As discussed above, an
agent may prefer less risk than a principal, even when the agent owns stock.
On the other hand, stock options can motivate an agent to prefer more risk
than a principal (e.g., Deutsch et al., 2010). This motivation arises because
stock options provide the agent with income only if the stock price exceeds
a certain limit, and the agent receives no income if the stock price remains
lower. As a result, the agent has an incentive to choose actions that
maximize the expected value of the stock price above the limit price,
whereas shareholders prefer actions that maximize the expected value of
the stock price overall. In practice, stock options can motivate an agent to
take risky actions that have an increased probability of losses, which
decreases the expected value of the stock price overall (Burns and Kedia,
2006; Harris and Bromiley, 2007). Stock options even create a temptation
for the agent to influence the stock price through fraudulent activities such
as concealing information that could have a negative impact on the stock
price, such as the size and probability of losses due to the agent’s actions. In
conclusion, a principal can motivate an agent through a combination of
stock ownership and stock options to attune the agent’s preference for risk,
but, in practice, setting the right balance can be challenging.
The past research has paid considerable empirical attention to trying to
determine how a principal’s income depends on an agent’s equity-based
incentives. Jensen and Murphy (1990) studied a sample of over 1,000
corporations and found that CEO wealth changed S3.25 for every S1000
change in shareholder wealth. The result suggests that an agent’s income is
contingent on a principal’s income. In testing the effects on equity-based
incentives on performance, Morck et al. (1988) studied Fortune 500 firms
and found that when management owns up to 5% or more than 25% of a

Literature review
15
firm’s shares, management ownership increases the firm’s market
valuation. The relationship was negative between 5% and 25%. Morck et al.
interpreted the result so that both small and large ownership shares
motivate managers, but, in the middle range, management tends to have
incentives to act with self-interest and has the adequate power to do so.
McConnell and Servaes (1990) repeated a similar study with a larger
sample of firms and found that managerial ownership increased firm value
up to approximately 50% ownership and then sloped slightly downward.
Hermalin and Weisbach (1991) found that market value increases when
management ownership is below 1% or between 5% and 20%, and it
decreases in the other ranges. Holderness et al. (1999) found results that
were quite similar to Morck et al. (1988). Himmelberg et al. (1999)
investigated the same relationships with panel data, but they did not find
significant effects.
Recent overviews of the empirical studies on equity-based incentives
include meta-analyses by Tosi et al. (2000) and Dalton et al. (2003). Tosi et
al. investigated the results from 42 empirical studies on equity-based
compensation, whereas Dalton et al. included 229 studies. These two meta-
analyses found only weak support for agency theory’s propositions that
equity-based compensation helps the principal to motivate an agent to take
actions that are in line with a principal’s preferences. However, Nyberg et
al. (2010) identified a number of weaknesses in the two meta-analyses. In
particular, Nyberg et al. noted that there is a large variety in how the
different studies that were included in the meta-analyses defined the
variables for measuring a principal’s income and an agent’s equity-based
incentives. Further, many of the variables that were used in the earlier
studies do not adequately take into account the timing differences between
incentives and performance. The variety of the variables complicates the
interpretation of the findings from the past research. Nyberg et al. provided
their own empirical investigation on the primary data to address these
shortcomings.
Nyberg et al. (2010) tried to address the shortcomings that are related to
the variables that measure a principal’s income and an agent’s equity-based
incentives with an empirical test on a sample of Standard and Poor’s 1500
firms. They measured a principal’s income as the fiscal-year return for
shareholders, including the stock price change and the dividends that were
reinvested. An agent’s equity-based incentives included a one-year change
in the values of the CEO’s in-the-money options, restricted stock, other
equity, and the net proceeds that were accumulated throughout the fiscal
year from sales in any of these equity types. They also included other agent
incentives such as annual salary, other annual compensation, long-term

16
incentive payouts, and other miscellaneous non-equity payouts. Nyberg et
al. found that CEO return and shareholder return had a significant positive
relationship, suggesting that an agent’s income is contingent on a
principal’s income as predicted by agency theory. Further, they estimated a
regression coefficient of CEO return on shareholder return over a three-
year period for each firm to indicate alignment. They then found that
shareholder return over the subsequent three-year period was positively
related to the alignment. This result suggests that a principal can increase
income by setting equity-based incentives for an agent.
Empirical studies on stock options have found that management stock
options tend to increase the volatility of firm performance and stock price
(e.g., Coles et al., 2006; Williams and Rao, 2006; Wright et al., 2007;
Sanders and Hambrick, 2007). These findings are in line with the
theoretical predictions that stock options motivate managers to take riskier
actions.
In summary, a principal can use equity-based incentives such as stock
ownership and stock options to motivate an agent to take actions that
increase the principal’s income. The topic has attracted a large number of
empirical studies that investigated the topic using a variety of variables.
While not all of the empirical studies agree with each other, many of the
studies tend to support the basic predictions of agency theory. The
empirical research also finds support for the prediction that stock options
increase risk taking.
2.1.2 Organizational control theory
Organizational control theory studies how the actions of individuals can
be aligned with the interests of the firm that employs them (Thompson,
1967; Ouchi 1977, 1979, 1980; Eisenhardt, 1985; Snell, 1992).
Organizational control theory identifies a number of control mechanisms
and antecedents that determine the appropriate control mechanism. Major
control mechanisms include behavior control, output control, and clan
control, and key antecedents consist of task programmability and outcome
measurability. Eisenhardt (1989) noted that the control mechanisms of
organizational control theory mirror the mechanisms that are proposed by
agency theory.
If a supervisor knows exactly how a task should be performed, task
programmability is high. In this case, the supervisor can define the task in
detail to a worker and then simply monitor the behavior of the worker to
control that he or she performs the task as defined. This type of action is
referred to as behavior control. The supervisor can control the worker

Literature review
17
adequately by specifying the behavior and the related pay, monitoring the
behavior, and then paying the worker as agreed.
However, if the supervisor cannot clearly specify a task, task
programmability is lower. Thus, it is more difficult to control a worker by
simply observing the worker’s behavior. However, if the supervisor can still
measure the output of the worker’s behavior, the outcome measurability is
regarded to be high. When the supervisor can measure the worker’s output,
the supervisor can base the worker’s pay on the measured output. This
process is referred to as output control. The supervisor can control the
worker adequately by specifying the output and the related pay, measuring
the output, and then paying the worker as agreed. A typical outcome
measure that is used for outcome control is the financial performance that
is related to a worker’s tasks.
Both behavior and output controls rely on performance evaluations. A
performance evaluation means that a specific aspect of a worker’s activities
is measured. For behavior control, the behavior of a worker is measured,
and for output control, the output of a worker is measured. When a
performance evaluation is used, a worker’s pay depends on performance
evaluation.
If a supervisor can both specify the task clearly and measure output, the
supervisor can use either behavior or output control, or both in
combination. The decision about a choice of controls can depend on the
relative strengths and weaknesses of the two controls. Behavior control has
several weaknesses. First, the monitoring of behavior takes supervisory
time and possibly other monitoring systems to observe behavior, which is
costly. Second, a detailed definition of tasks reduces workers’ discretion and
can lead to rigid and overly cautious behavior. Third, behavior control may
still be used when tasks are not perfectly programmed or when behavior is
not completely monitored, which can create conflicts of interpretation.
One advantage of output control is that it allows for some discretion by
workers who can adapt their behavior to best improve the output, without
requiring the supervisor to determine the behavior. However, output
control also has some weaknesses. First, measuring output can require
information systems that can be costly. Second, output control is reactive,
having been referred to as “ex post control.” As a result, output control
provides no means for preventing mistakes before they happen. Third, if
some critical goals are not included in the output definition, workers are
motivated to pursue only the measured output, and they tend to ignore any
other goals even if they might be critical to the organization. Fourth,
Eisenhardt (1985) integrated organizational control theory with agency
theory and concluded that, like equity-based incentives in agency theory,

18
output control also has the weakness of increasing a worker’s exposure to
financial risk. When output depends on uncertain external factors that are
beyond the control of a worker, the worker is subject to increased risk,
which can decrease the effectiveness of output control.
Finally, sometimes both task programmability and output measurability
are low. In this case, performance evaluation is difficult. As a result, neither
behavior nor output control is effective. Organizational control theory
suggests that in this case, the supervisor can resort to clan control. In clan
control, the supervisor tries to align a worker’s preferences as closely as
possible with the preferences of the organization. This alignment can be
achieved by selecting workers that share the organization’s preferences and
then training and socializing them deeply to internalize the organization’s
preferences. The disadvantage of clan control is that the intended
internalization efforts may fail, and it can be difficult to quickly identify
such a failure.
In summary, organizational control theory identifies different types of
control mechanisms, mainly behavior control, output control, and clan
control. Each control has specific requirements, strengths and weaknesses.
Sometimes, these controls can be used in combination. Part of
organizational control theory is similar to agency theory, and the two
theories have been integrated in past research. Organizational control
theory has focused on supervisor-worker relationships at the lower
organizational levels, but it has also been extended to the higher
organizational levels. These extensions are discussed below.
2.1.3 Resource dependence theory
Resource dependence theory (Pfeffer and Salancik, 1978) proposes that an
organization’s performance and survival depends on its ability to gain
control over resources that are owned by others. Organizations need a
multitude of different resources, and they do not own all such resources.
Thus, organizations are dependent on others who own the needed
resources. In other words, organizations are dependent on their
environment for resources. This dependence on resources makes
organizational performance dependent on actions that are taken by others
in the environment, which increases the uncertainty that is faced by an
organization.
Resource dependence theory posits that organizations try to reduce their
dependence on their environment. As a result, an understanding of an
organization’s environment is needed to understand the organization’s
actions. Organizations can reduce their dependence on their environments

Literature review
19
by trying to gain control over their resources by applying a variety of
strategies. In addition to reducing their dependence on the environment,
organizations can apply resource dependence strategies to gain power over
others in their environments. Together, dependence and power can make
organizations interdependent with others in their environments. Resource
dependence theory also argues that an organization’s relationship with its
environment is dynamic. Organizations need to adapt to changes in their
environments by applying various resource dependence strategies to
acquire additional access or control over resources they need. Finally, an
organization’s performance depends on how the organization can manage
its control over the needed resources.
Resource dependence theory introduces a number of strategies for
managing dependence on the environment. Some strategies are introduced
for illustration here, but these examples do not constitute an exhaustive list
of potential strategies. For example, an organization can decide to own
resources to limit its dependence on its environment. Accordingly,
organizations tend to own their most critical resources. This approach can
result in the acquisition of critical suppliers to establish vertical integration.
Another strategy to gain control over resources is to avoid reliance on a
single supplier by maintaining a number of alternative suppliers. Yet
another strategy to limit dependence on the environment is to seek control
of the resources that are critical to others to increase their dependence on
an organization. In other words, an organization can use resources to gain
power over others in its environment. For example, horizontal mergers and
acquisitions help organizations to gain more power over their suppliers and
customers.
Resource dependence theory has been used in numerous applications.
Resource dependence theory is relevant for this study because it provides
an important basis for previous research on corporate governance and
particularly for boards of directors. Resource dependence theory suggests
that board members’ roles in other organizations provide the board
members with the knowledge and resources that can help them monitor
and counsel management and facilitate inter-organizational relationships
(Pfeffer and Salancik, 1978). The application of resource dependence theory
on corporate governance is discussed in more detail in the following review
of the literature on boards of directors.

20
2.2 Board of directors
Corporate governance describes the structures and processes that
determine how resource allocation decisions are made among different
corporate stakeholders. Corporate governance has attracted substantial
interest from scholars. Previous research has studied corporate governance
from multiple disciplinary perspectives including economics, management,
law, political science, and sociology. Given the wide variety of previous
research, there is no clear and universal definition of corporate governance.
An overview of the past literature and the definitions of corporate
governance are available in a number of recent reviews of corporate
governance (e.g., Shleifer and Vishny, 1997; Daily et al., 2003; Davis, 2005;
Dalton et al., 2007; Aguilera and Jackson, 2010).
A board of directors is a corporate governance mechanism that has been
studied extensively in the past. This chapter provides an overview of the
roles and characteristics of boards of directors.
2.2.1 The roles of a board of directors
Monitoring
Agency theory suggests that equity-based incentives can be
complemented by the monitoring of an agent by a principal. A board of
directors is the main mechanism for monitoring management in firms (e.g.,
Fama, 1980). The function of a board of directors is to design a
management compensation mechanism that is contingent on both equity-
based incentives and managerial actions that are monitored by the board.
Typically, such a compensation mechanism also includes the possibility of
management dismissal. Unlike agency theory, which is built upon a formal
theory with a mathematical basis, the function of a board of directors still
lacks a similar formal theory (Hermalin and Weisbach, 2003). This lack of
formal theory implies that, as yet, there are no clear answers for questions
such as why boards exist in the first place or if they are optimal governance
mechanisms. Hermalin and Weisbach note that boards exist because the
law requires them in most countries. As an additional idea of why boards
may benefit shareholders, they suggest that making several individuals
responsible for overseeing a firm reduces the risk that they will jointly
pursue interests that are in conflict with the shareholders because each
board member has less to gain from such actions and is still subject to

Literature review
21
possible personal penalties, such as lost income or reputation, or legal
sanctions. Despite the lack of a formal theoretical basis, past research has
brought much insight into the function of boards of directors that is based
on empirical studies of the functions of existing boards of directors. Walsh
and Seward (1990) provide a detailed overview of the function of boards of
directors, and the following discussion is based to a large extent on their
study.
In monitoring management, a board of directors needs to determine what
actions management takes and how those actions influence shareholder
return. The board of directors can then reward management based on the
observed actions. However, in practice, it is difficult to determine both the
actions that have been taken by management and the impact of those
actions on shareholder return. Shareholder return depends on both
managerial actions and the external effects that are beyond managerial
control. Management typically has little control over external factors such
as new technologies that have been developed by outsiders, actions by
competing firms, or regulations. Nevertheless, such factors can have a
major positive or negative impact on shareholder return. To determine how
well managerial actions contribute to shareholder return, the board of
directors needs to understand also how shareholder return depends on
such external factors. This determination can be very difficult because the
number of external factors can be high and therefore require time to assess.
Walsh and Seward argue that, in assessing how well the actions that are
taken by management contribute to shareholder return, a board of directors
needs to assess both the ability and the efforts of management However,
this assessment is not easy. The difficulty is reflected by the fact that Walsh
and Seward do not provide details on how either can be assessed in
practice. Despite the vast amount of research on management ability, there
is no universal definition for it, and it can include abilities that are related
to following areas: (a) product, firm, and industry knowledge; (b) emotional
maturity; (c) entrepreneurial abilities; (d) intellectual abilities; (e)
interpersonal abilities; and (f) leadership skills. Effort is also a vaguely
defined construct. Typically, research on boards of directors and on
monitoring in general tends to assume that the directors make their
assessments of management’s ability or effort in some way, even if the
details are not specified.
Whatever the actual methods by which a board of directors assesses
management’s ability and effort, the board of directors combines the results
of its assessment with an understanding of external factors to determine if
shareholder return can be improved by adjusting the mechanisms for
controlling management. If the board of directors is satisfied with

22
management’s actions and sees no room for improvement, management
control will remain unchanged. If the board of directors perceives a need
for improvement, it can adjust management controls by modifying
incentives or changing management. Walsh and Seward suggest that if a
board of directors assesses a need for improving management efforts,
incentives are modified to motivate for more effort. Incentives can also be
modified when the board of directors observes that management’s ability
and effort is adequate, but incentives can mislead managerial efforts. On
the other hand, ability is less amenable to change than effort. If ability
needs to be improved, management is dismissed and replaced with new
individuals. However, rather than outright dismissing the management, the
board of directors is likely to first modify incentives to test how managerial
actions change and thereby clarify their understanding of the managerial
ability. Usually the dismissal of management is combined with a prior poor
financial performance. In particular, weak financial performance relative to
peer firms typically increases the probability of management turnover.
In summary, the function of a board of directors is to monitor managerial
actions and external factors. Based on this monitoring, a board can then
determine the ability and effort of management. If the board perceives an
opportunity for increased shareholder return, it can adjust management
incentives or change management. However, the quality and effectiveness
of monitoring depends on how much related knowledge and time the board
members have invested. In practice, monitoring is always limited and far
from perfect. In addition, the benefits of monitoring are further challenged
because management has a built-in motivation to meddle with monitoring.
Walsh and Seward note that management is expected to be aware of the
fact that their career and related income are strongly dependent on
monitoring by a board of directors. Therefore, they have an incentive to
tamper with the board’s ability to monitor and control them. Walsh and
Seward list a number of tactics that management can use to influence the
board of directors. Managers can promote their positive abilities and
conform to the generally accepted norms of good management behavior
such as following correct decision-making procedures. They can also hide
negative attributes or information from the board. Or, when managers
realize that they have made an error, they can promptly admit it and
propose a corrective action plan to be given a second chance. Management
may also try to exaggerate the impact of external factors and try to scare the
board into believing that the firm is at the mercy of powerful and
dominating market trends that mostly determine the firm’s performance.
Management can also try to influence the board to approve mediocre
performance expectations that can be easily met. Managers can also try to

Literature review
23
become expensive to substitute by gathering personal publicity by
personifying the firm and thereby tying customer commitment to
themselves. The board of directors is likely to think twice before dismissing
a manager who is trusted personally by customers.
Mizruchi (1996) and Zajac and Westphal (1996) identify a number of
approaches that management can take to compromise the monitoring
incentives of a board of directors. Often board members are managers of
other firms. If a firm’s managers also have board appointments in outside
firms, they can act as board members in the firms that are managed by their
own board members or in firms that are managed by the board members of
firms that are managed by their board members. Such board interlocks
provide a reason for board members with management positions in other
firms to avoid aggressive monitoring because it can result in retaliation
from their own boards. For similar reasons, when board members with
management positions in other firms have an opportunity to influence the
selection of other board members, they are motivated to give preference to
their own kind and candidates that have track records of past directorships
without aggressive monitoring. Additionally, whenever a board of directors
has adequate representation of interlocked directors, they are likely to
listen more positively to management, which may even create an
opportunity to influence board nominations. When management is
powerful enough to influence the selection of the directors in a firm’s own
board, it can gain increasing power over the board as board members are
replaced over time. Once management has adequate power over the board,
management can influence monitoring by the board to reduce the risk of
dismissal and to improve compensation.
In conclusion, the function of a board of directors is to monitor
managerial actions and external factors and to determine management
compensation and the changes that are based on such monitoring.
However, the monitoring is far from perfect because the board members
have limited knowledge and time for monitoring. In addition, management
is motivated to apply a number of influencing tactics to tamper with
monitoring. On the other hand, the prevalence of boards of directors
suggests that their total contribution to shareholder return is perceived as
adequate for them to remain as an accepted corporate mechanism. In
particular, previous research has observed a number of mechanisms that
can improve the supervision and contributions provided by boards of
directors. These mechanisms are discussed in more detail in following
chapters.

24
Counseling
Resource dependence theory argues that in addition to monitoring, a
board of directors can provide expert advice and counseling to management
(Pfeffer, 1972; Pfeffer and Salancik, 1978). In particular, board members
typically have current or past management or director assignments in
external organizations. Such external experience provides board members
with knowledge that is not available within the firm. Directors can use this
knowledge to provide valuable advice to management. This valuable
knowledge is expected to help management to make better decisions and
thereby to increase shareholder returns.
In particular, counseling from a board of directors can assist management
in strategy making (e.g., Zahra and Pearce, 1989; Judge and Zeithaml,
1992; Westphal, 1999; Stiles, 2001). Fresh perspectives and new
information that is provided by board members can help management to
identify promising strategic opportunities, articulate a firm’s mission,
develop the firm’s strategy and effectively control and evaluate the
implementation of the chosen strategy. Board involvement in strategy
making helps to improve strategy by reducing problems due to narrow
thinking, escalating commitment, and weak analysis. The board of directors
helps and forces management to check their assumptions that underlie
their strategies. The board can be involved in strategy making to varying
extents. At very least, the board can ratify strategic proposals and review
the evaluations of strategy implementation that are provided by
management. The board can also ask pointed questions about a strategy,
and such questions can even result in the revision of the strategy. A more
active approach can involve the board in actually formulating the strategy
together with management. At the other extreme, the board can make
strategic decisions separately from management and collect its own
information about the progress of strategy implementation. Empirical
studies have found that board involvement in strategy making can improve
firm performance (Judge and Zeithaml, 1992; Westphal, 1999; Stiles,
2001).
Westphal (1999) and Adams and Ferreira (2007) suggest that counseling
can also support the monitoring role of boards of directors. When a board
of directors is involved in counseling, also it learns to better understand
management’s actions and the factors that influence firm performance. This
involvement helps the board to better monitor management. In particular,
when the board has knowledge that is valuable for management,
management will be inclined to ask for advice. However, asking for advice
from the board also forces management to disclose more information about

Literature review
25
their actions and the firm’s problems. This additional information helps the
board to better monitor management, which would be difficult for them to
do without the counseling process.
Other board roles
Agency theory also suggests that a principal can retain some rights to
some decisions rather than delegate them to an agent. A board of directors
has the ultimate control over all of the decisions that are made by
management, but it usually delegates most of the decision-making to
management (Fama and Jensen, 1983a; Zahra and Pearce, 1989). The
board usually retains some critical decision rights in addition to the choice
of management and its compensation. Management cannot make such
decisions without the approval of the board. For example, the board
typically makes decisions that are related to major policy initiatives and
strategies.
In addition to a board’s monitoring and counseling roles, resource
dependence theory identifies additional roles for the board of directors. The
board can also provide a firm with access to commitments or support from
external organizations and improve the legitimacy of the firm (Pfeffer and
Salancik, 1978; Hillman and Dalziel. 2003). Board members with
assignments in external organizations can help to facilitate cooperation
between the firm and the external organizations. For example, the firm may
be able to identify the potential for mutually beneficial business
opportunities and successfully negotiate the implementation with
customers or suppliers with which the board members are affiliated. In
particular, board members that represent prestigious or legitimate persons
or organizations can improve the legitimacy of the firm and thereby
convince others to cooperate with the firm.
2.2.2 Board characteristics
The effectiveness of a board of directors in monitoring and its other roles
is influenced by a number of board characteristics. This chapter reviews the
key characteristics of boards of directors.
Outside directors
Board directors can be grouped into three categories: (a) inside directors,
(b) affiliated directors, and (c) outside directors (Pearce and Zahra, 1992).

26
Inside directors are current members of the management team or other
employees of a firm. Affiliated directors are neither managers nor
employees of the firm, but they have close links with the firm. Affiliated
directors can, for example, be former managers of the firm or consultants
or suppliers of the firm. Outside directors are neither insiders nor affiliated
with the firm. Unlike inside or affiliated directors, the outside directors are
not under the direct control of management. In particular, management
can directly influence the career or income of the inside and affiliated
directors. As a result, these directors have strong incentives to act as
instructed by management, which compromises their function of
monitoring management. On the other hand, management cannot influence
the outside directors as directly, which provides the outside directors with
more independence for monitoring management. Outside directors are
sometimes referred to as independent directors, but the past research tends
to maintain that such independence is rarely completely genuine because
management can use several tactics to influence the directors, as discussed
above. Even if the outside directors are not completely independent, they
are considerably more independent than the inside or affiliated directors.
Therefore, the proportion of outside directors is expected to be an
important board characteristic that can improve monitoring by the board.
Past empirical studies have investigated the effect of the proportion of
outside directors on monitoring by a board of directors. Instead of
measuring monitoring directly, scholars have studied the effect on
outcomes that are related to monitoring such as management
compensation, management turnover, and decisions that decrease
shareholder return such as paying greenmail and the adoption of poison
pills. Such studies tend to support the view that outside directors help to
improve the monitoring of management.
Conyon and Peck (1998) found that the proportion of outside directors
had no effect on the size of management compensation, but it had a
significant effect in making management compensation contingent on
shareholder return. Ryan and Wiggins (2004) found that the proportion of
outside directors increased equity-based incentives for management. Both
of the empirical results support the notion that outside directors improve
monitoring because compensation alignment is expected to be a result of
effective monitoring.
Mizruchi (1983) proposed that the proportion of outside directors
increases management turnover due to improved monitoring. The
empirical studies have confirmed this proposition. Weisbach (1988) found
a stronger association between prior poor performance and the probability
of management turnover in firms with boards that are dominated by
Literature review
27
outsiders. In addition, Weisbach found positive stock returns that were
related to turnover announcements, suggesting that the turnovers increased
shareholder return. Haleblian and Rajagopalan (2006) also found that a
higher proportion of outside directors increased the likelihood of
management turnover. Boeker and Goodstein (1993) found that poorly
performing firms were more likely to choose management from outside a
firm when the proportion of outside directors increased.
Kosnik (1987) suggested that the payment of greenmail reflects ineffective
monitoring by a board of directors. The payment of greenmail is the
practice of repurchasing stock at a premium above the market price from a
shareholder who threatens to take over a firm. This practice decreases
shareholder return because shareholders would expect to receive a
premium themselves if the takeover would be completed. On the other
hand, the payment of greenmail benefits management personnel who wish
to avoid the risk of dismissal after a takeover. Kosnik found that the
decision to pay greenmail was lower in firms with more outside directors.
This finding suggests that outside directors improve monitoring by
preventing management from paying greenmail.
Mallette and Fowler (1992) suggested that the adoption of a “poison pill”
takeover defense provision indicates ineffective monitoring by a board of
directors. A poison pill provision usually makes the takeover of a firm more
difficult by making it excessively expensive. A poison pill provision benefits
management by decreasing the risk of dismissal after a takeover but
decreases shareholder return because they lose potential gains from
takeover premiums. Mallette and Fowler found that a higher proportion of
outside directors decreased the adoption of poison pill provisions, thereby
indicating improved monitoring by the board.
A number of studies have investigated how the proportion of outside
directors influences research and development (R&D) investments by a
firm. Hill and Snell (1988) and Baysinger et al. (1991) found that a higher
proportion of outside directors decreased R&D expenditure by a firm.
Similarly, Zahra (1996) found that outside directors decreased corporate
entrepreneurship. Additionally, Hoskisson et al. (2002) and Kor (2006)
tested the effect of outside directors on R&D investments, but they did not
find significant effects. Instead, Hoskisson et al. (2002) found that outsider
directors increased a firm’s acquisitions. Hill and Snell (1988) suggested
that endogeneity may explain the negative effect of outside directors on
R&D. Firms that rely on strategies that focus on diversification both invest
less in R&D and prefer outside directors because they can provide valuable
information for diversification. Baysinger et al. (1991) further suggested
that firms with such a diversification strategy are likely to rely more on

28
financial control systems, which discourages management from investing in
R&D, which is difficult to measure with financial controls alone.
In addition to monitoring, a large number of studies have investigated
how outside directors influence firm performance. Many studies found that
outside directors improve performance, but some studies have also raised
opposite concerns.
Hill and Snell (1988) found that firms with a higher proportion of outsider
directors also had higher returns on assets. Additionally, Pearce and Zahra
(1992) found that firms with a higher proportion of outside directors also
had a higher return on assets, returns on equity, and earnings per share.
Daily and Dalton (1993) studied a sample of smaller firms and found results
that were similar to Pearce and Zahra. Daily and Dalton (1994a, 1994b) also
found that a higher proportion of outside directors decreased the risk of
bankruptcy. Kroll et al. (2008) found that the number of outside directors
increased shareholder returns from acquisitions. On the other hand,
Hermalin and Weisbach (1991) did not find any significant effect of the
proportion of outside directors on a firm’s market value. Further, a meta-
analysis of Dalton et al. (1998) does not find significant aggregate evidence
for performance improvement.
Hermalin and Weisbach (1998) and Denis and Sarin (1999) noted a
potential endogeneity problem when testing the causal relationship
between outside directors and performance. This problem is because the
number of outside directors can increase during periods of poor firm
performance as a control to improve performance. As a result, a lagged
empirical design is needed to properly test the causal relationships, but
most of the past studies have failed to use this design. In conclusion, there
is some evidence that suggests that outsider directors can not only improve
monitoring but also firm performance, but the findings are still subject to
some concerns.
A number of studies have investigated how outside directors influence
investments in R&D. Baysinger and Hoskisson (1990) proposed that
outside directors based management compensation more on objective
financial criteria and less on subjective assessments. Such an emphasis on
financial criteria is expected to decrease management’s motivation to invest
in R&D. Empirical studies by Hill and Snell (1988), Baysinger et al. (1991)
and Hoskisson et al. (2002) have confirmed this proposition by finding that
the R&D expenditure is negatively related to a higher proportion of outside
directors. Additionally, Zahra (1996) found that a higher proportion of
outside directors decreases corporate entrepreneurship as measured by
survey items.
Literature review
29
Duality
Duality refers to a situation in which a CEO also chairs a board of
directors (Rechner and Dalton, 1991). The alternative situation would
involve the roles of the chairperson and the CEO being held by different
individuals. Because the chairperson of the board can have a large influence
on setting the board’s agenda and the choice of directors, duality is
expected to compromise the monitoring effectiveness of the board. Kor
(2006) found that duality decreased a firm’s R&D investments. Rechner
and Dalton (1991) found that firms with duality demonstrated lower
performance as measured by returns on assets, returns on equity, and profit
margins. Daily and Dalton (1994a, 1994b) found that duality increased the
risk of bankruptcy.
On the other hand, a number of studies provide contrary results. In
studying smaller firms, Daily and Dalton (1993) did not find a significant
effect of duality on performance. Baliga et al. (1996) and Coles et al. (2001)
did not find any significant effects either. Boyd (1995) found no general
significant effect of duality on performance but found a positive effect in
firms that operate in industries that were growing slowly or had a large
number of firms with relatively different market shares.
Dalton et al. (2007) concluded that the effect of duality on firm
performance remains unsettled. They noted that most firms still had
duality, with CEOs that also chaired the board. Further, they noted that
even in most of the firms that did not have duality, the board was chaired
not by an outside director but an affiliated director such as a former CEO.
Such an arrangement with an affiliated chairperson may be even worse of a
situation than duality because the chairperson is not independent, but,
further, there can be additional uncertainty about the division of power
between the CEO and the chairperson.
Board size
Resource dependence theory suggests that board members have expertise
that helps them to monitor and counsel management and to provide access
to external resources. Increasing the size of a board is likely to increase
such gains as each additional board member adds to the pool of available
expertise and resources (e.g., Pfeffer, 1972; Pfeffer and Salancik, 1978;
Goodstein et al., 1994; Dalton et al., 1999). Larger boards can have more
diverse occupational and industrial experience that provide multiple
perspectives on strategy and operations, which can improve performance.

30
Further, larger boards can represent more diverse stakeholders and help a
firm to better take its interests into account.
On the other hand, past research has identified many problems with
increasing board size such as free riding and the difficulty of consensus due
to diverse opinions and coalitions. As the number of directors increases,
each director can have less influence on a board’s decisions, which
decreases the reputational gains or costs of the board’s performance for
each individual director (Golden and Zajac, 2001; Hermalin and Weisbach,
2003). As a result, directors are more likely to commit free riding, which
decreases the effectiveness of the board. Increasing board size also
increases the number of opinions on the board, which makes it more
difficult for the board to find the adequate consensus that is needed to
reach decisions (Goodstein et al., 1994). An increase in the number of
directors also increases the risk that the board will develop different
coalitions that increase conflict and make it even more difficult to establish
consensus (Goodstein et al., 1994; Tuggle et al., 2010a). The problems of
free riding and lower consensus can hamper the board’s ability for strategy
making (Goodstein et al., 1994). This can become especially harmful when a
firm’s environment is changing fast, and strategic decisions are critical for
survival.
Increasing board size can influence the monitoring of management, but
the past research provides two opposing views on this effect (Pearce and
Zahra, 1992; Alexander et al., 1993; Goodstein et al., 1994; Dalton et al.,
1999). Basically, it is more difficult to get decisions done by a larger board,
and this issue can have both a negative and positive impact on monitoring.
On one hand, it is more difficult for management to get the board to make
decisions that benefit management at the cost of the shareholders. Large
boards make it more difficult for management to persuade more numerous
interests represented by board members. It is also more difficult for
management to hide information from a board with more varied
knowledge. On the other hand, it is easier for management to prevent the
board from making decisions that limit actions that benefit management at
the cost of the shareholders. It is easier for management to manage
coalitions within larger boards to prevent them from achieving the
consensus that is needed for such decisions.
The results from the empirical studies on the effect of board size on firm
actions and performance support the existence of both benefits and costs of
increasing board size. Goodstein et al. (1994) did not find any effect of
board size on firm strategic change in the form of product scope changes,
whereas Golden and Zajac (2001) found that increased board size first
increases strategic change but then begins to decrease with larger boards.

Literature review
31
As for firm performance, Pearce and Zahra (1992) found that board size is
positively related to firm performance. However, a number of other studies
have found that board size decreases performance (Chaganti et al., 1985;
Boyd, 1990; Judge and Zeithaml, 1992; Yermack, 1996; Eisenberg et al.,
1998). Cheng (2008) found that firms with larger boards have a lower
variability of performance, indicating that it takes more compromises to
reach a consensus, which reduces more extreme decisions. Cheng (2008)
also found that larger board size decreased firm R&D expenditures.
Occupational diversity
The occupational diversity of a board of directors has been identified as a
characteristic that can reflect the expertise and resources that are available
from the board members (e.g., Pfeffer, 1972; Kosnik, 1990; Goodstein et al.
1994; Forbes and Milliken, 1999; Hillman et al., 2000; Golden and Zajac,
2001; Haynes and Hillman, 2010). Previous research has typically
investigated occupational diversity by grouping the occupations of board
members into different categories. Examples of different categories include
executives, lawyers, bankers, consultants, accountants, academicians,
government officials, and politicians. Sometimes executive experience is
divided further into general management, finance, accounting, sales and
marketing, information systems, operations, engineering, and human
resources.
Board members’ current and past occupational experience provides them
with knowledge that is related to particular occupations. Typically, different
occupations rely on different knowledge. The more diverse the occupational
experience of a board, the wider the knowledge that is available for the
board to monitor and counsel management. Occupational diversity can help
to identify and express different perspectives and reduce complacency and
the risk of groupthink by a board. In conclusion, occupational diversity can
improve the effectiveness of a board and a firm’s performance. On the other
hand, the occupation diversity of board members can also create problems,
limiting the effectiveness of the board. Board members with different
occupational experience can have difficulty in developing a shared
understanding, which may hinder consensus and even create conflict
(Goodstein et al. 1994; Forbes and Milliken, 1999; Golden and Zajac, 2001).
This type of problem can decrease a board’s ability to make decisions
effectively.
Empirical research has also investigated the effects of occupational
diversity. Kosnik (1990) found that occupational diversity decreased
monitoring by boards as expressed by a resistance to greenmail. Goodstein

32
et al. (1994) found that occupational diversity decreased strategic change.
On the other hand, Haynes and Hillman (2010) found that occupational
diversity increased strategic change. Golden and Zajac (2001) found that
occupational diversity first increased strategic change, but it began to
decrease when the level of diversity reached a certain height.
Interlocks
An interlocking directorate occurs when a person who is affiliated with
one organization sits on the board of directors of another organization
(Mizruchi, 1996). Interlocks can provide a firm with valuable information,
facilitate cooperation with other firms, increase the legitimacy of the firm,
and spread management’s reputation. Resource dependence theory
suggests that a board with interlocks can help a firm to obtain information
that can improve strategy making and cooperation with other organizations
(Pfeffer and Salancik, 1978). Through interlock ties, board members have
access to information that is available in the other firms for which they
serve as directors. However, in addition, when directors communicate with
other directors in other firms, they are also exposed to information from
those other firms (Carpenter and Westphal, 2001). Information from
interlocks is also typically more up-to-date than information from
secondary sources. In addition, in contrast to information that is available
through other channels, interlocks can provide especially influential
information because they are inexpensive, trustworthy, and credible
information sources (Davis, 1991; Haunschild, 1993; Haunschild and
Beckman, 1998).
Interlocks provide information that can support strategy making in a firm.
When working in other firms through interlocks, directors are exposed to
information that can help a firm in strategy formulation and evaluation
(Carpenter and Westphal, 2001). Such information can help the firm to
notice and respond to environmental changes more rapidly (Davis, 1991).
Geletkanycz and Hambrick (1997) suggest that external interlock ties can
provide information that shapes management’s views on the environment
and adds ideas for strategic choices.
Interlocks between similar and dissimilar firms are expected to provide
different types of information (Geletkanycz and Hambrick, 1997;
Haunschild and Beckman, 1998; Carpenter and Westphal, 2001). Similar
firms refer to firms that follow similar strategies or operate in similar
product-market contexts. Interlock ties to such firms can provide
experience and information that leads to development of knowledge that is
related to implementing a firm’s strategy. On the other hand, firms that

Literature review
33
follow different strategies and operate in different business environments
are referred to as dissimilar firms. Interlock ties to dissimilar firms provide
directors with more novel information and exposure to diverse strategies.
Such interlocks lead to greater knowledge and insight about a broad range
of potential strategic alternatives. Geletkanycz and Hambrick (1997) found
that interlocks to similar firms were related to strategic conformity and that
interlocks to dissimilar firms were associated with the adoption of deviant
strategies.
However, Carpenter and Westphal (2001) proposed that interlock ties
between similar and dissimilar firms also have potential weaknesses for
strategy making. If the interlocks of a board are dominated by similar firms,
information from the interlocks may reinforce management’s commitment
to the current strategy and lead management to ignore the environmental
changes that threaten a firm’s long-term viability. On the other hand, if a
board’s ties are dominated by dissimilar firms, the board may lack sufficient
expertise to evaluate the firm's current strategy or to assess the implications
of abandoning the strategy. Carpenter and Westphal suggested that it is
optimal for a board of directors to have a heterogeneous mix of ties to
strategically similar and dissimilar firms. With such a combination, the
board has knowledge for understanding both the current strategy and
possible alternative strategies, which can help the firm to choose the
optimal strategy.
The imitation of practices and strategies between firms has attracted
research on interlocks. Haunschild (1993) suggests that directors can learn
through their interlocks how various practices are implemented and how
efficient they are. The experience of a practice in one firm tends to
encourage directors to imitate the practice in other firms. The past
empirical research has found support for the imitation hypothesis by
showing that interlocks increase the adoption of poison pills (Davis, 1991),
acquisitions (Haunschild, 1993), alliances (Gulati and Westphal, 1999), and
even the practice of imitation itself (Westphal et al., 2001).
In addition to being a source of information for strategy making and for
imitating practices in other firms, interlocks can also provide resources to
facilitate cooperation with other firms as suggested by resource dependence
theory (e.g., Pfeffer and Salancik, 1978; Burt, 1980). For example,
Bazerman and Schoorman (1983) suggested that interlocks can provide the
information and trust that is needed to establish cooperation with suppliers
and customers. In the past, interlocks were even used to facilitate
cooperation with competitors, but such interlocks are now typically illegal
due to anti-trust concerns. Gulati and Westphal (1999) argued that board
ties can also help firms to initiate alliances because the ties provide

34
firsthand knowledge about another firm’s capabilities and activities.
Haunschild (1993) suggested that interlocks can also provide firms with
more accurate information about potential acquisition targets and thereby
improve the chances for acquisitions.
Interlocks can also increase the legitimacy of a firm (Bazerman and
Schoorman, 1983; Mizruchi, 1996). When investors evaluate a firm as an
investment opportunity, they consider the ability of the firm’s board as an
indication of its potential value. By appointing individuals with ties to other
important organizations, a firm can signal to potential investors that it is a
legitimate organization.
Interlocks can also spread the reputation of a firm’s management. Gulati
and Westphal (1999) note how interlocks can be used to spread knowledge
about the ability and effort of the involved individuals. As an example, they
consider the information flow between three individuals. If A is cheated by
its relationship with partner B, and A has third-party ties to B through C, A
can impose reputational costs on B by spreading the word to C that B
cannot be trusted. Gulati and Westphal applied this logic by suggesting that
managers can have access to indirect information about directors through
their appointments on other boards. However, the same general
mechanism can also be applied to analyzing how information about the
ability and efforts of managers can spread through interlocks to external
directors and managers.
Board tenure
It has been proposed that the effectiveness of a board of directors depends
on both the average tenure of board members and the distribution of tenure
among board members (Kosnik, 1990). Increasing the average tenure has
been suggested to have both benefits and costs. On the one hand, a board
with a low average tenure has less knowledge of the strategy and operations
of the firm, which is likely to limit the effectiveness of the board (Kesner,
1988; Singh and Harianto, 1989; Kosnik, 1990; Golden and Zajac, 2001). A
board with a low tenure that is just learning about the firm is more prone to
management tactics that are aimed at compromising its monitoring
function (Mallette and Fowler, 1992). Westphal and Zajac (1995) suggest
that when management has some influence on choosing board members,
boards with low tenure are likely to include directors that were chosen by
management, which further limits its effectiveness in monitoring. On the
other hand, a board with a higher tenure can be familiar with the firm’s
resources, strategy, and operations (Singh and Harianto, 1989). Senior
board members can provide the board and the management with deep

Literature review
35
insight about the firm that is needed when management changes (Kosnik,
1990). Hillman et al. (2008) propose that directors with long tenures may
start to identify strongly with the firm, which improves their commitment
to monitoring and counseling management. On the other hand, Dalton et
al. (2007) propose that board members with long tenure are more likely to
have become friendly with management, compromising their effectiveness
in monitoring.
Previous research proposes that board tenure homogeneity can have both
positive and negative implications. On the one hand, boards that consist of
many members with long tenures have acquired a high level of firm-specific
knowledge and skills and also higher levels of cohesiveness, which allows
them to utilize their skills (Alderfer, 1986; Singh and Harianto, 1989;
Forbes and Milliken, 1999). On the other hand, past research contends that
boards with homogeneous tenures suffer from various problems (Kosnik,
1990; Mallette and Fowler, 1992; Johnson et al., 1993; Golden and Zajac,
2001; Tuggle et al., 2010a). Long-tenured boards develop pressures for
conformity, which can reinforce compliance and commitment to the status
quo and impede the search for multiple alternatives. Board members with
similar tenures share the same board experience, which can create biased
perceptions and increase groupthink. The increased rigidity of
homogeneous tenure is likely to limit the board’s ability to make strategic
changes when needed.
In contrast, boards with heterogeneous tenures can rely on a greater
diversity of experience and knowledge (Johnson et al., 1993; Forbes and
Milliken, 1999; Golden and Zajac, 2001; Tuggle et al., 2010a). Directors
with low tenures can draw more strongly on the knowledge that they bring
from their external experiences. Such knowledge helps to raise the number
of different perspectives and cognitive diversity that is available to a board.
A board’s effectiveness in monitoring and counseling is likely to increase as
a result. The board is also more likely to make decisions on strategic
changes when needed. However, Kosnik (1990) suggests that the
heterogeneity of board tenures may also impede a board’s work because
board members with diverse experiences may have more difficulty
understanding each other and developing frequent and open
communication.
The effect of board tenure also depends on management tenure and on
CEO tenure in particular (Alderfer, 1986; Singh and Harianto, 1989;
Sundaramurthy, 1996; Shen, 2003; Kor, 2006). In their early tenure, CEOs
typically have little influence in shaping board knowledge and membership,
and a board can more effectively monitor the CEO and focus on counseling.
As the CEO’s tenure increases, both in absolute terms and relative to the

36
board’s tenure, the influence of the CEO increases at the cost of the board.
This process decreases the effectiveness of monitoring by the board.
A number of empirical studies have investigated the effects of board
tenure. An investigation by Kosnik (1990) found that an average board
tenure increased boards’ resistance to greenmail, indicating improved
monitoring by boards. Singh and Harianto (1989) found that the longer the
average board tenure relative to that of the CEO, the better the board could
resist actions that were regarded harmful to shareholder return. Carpenter
and Westphal (2001) found that the average board tenure was positively
related to both monitoring and counseling in stable environments but only
for counseling and not for monitoring in unstable environments. Mallette
and Fowler (1992) proposed a curvilinear relationship between average
board tenure and a firm’s resistance to poison pills, but they found neither
significant curvilinear nor linear effects. Golden and Zajac (2001) proposed
a curvilinear effect of average board tenure on strategic change that is based
on the argument that tenure brings both benefits and costs. They found
support for the curvilinear relationship.
Attention
An attention-based view of a firm refers to how “decision-makers focus
their attention on a limited set of issues and answers and the issues and
answers they attend to and enact determines what they do” (Ocasio, 1997).
Focused attention also implies that decision makers allocate their attention
away from certain issues and answers. A selective focus of attention is
necessitated by the fact that bounded rationality does not allow for effective
attention to all possible stimuli. An attention-based view of a firm also
proposes that attention is affected by the decision-making context,
including a firm's procedural and communication channels. The context is
further dependent on the rules, resources, players, and social positions of
the firm.
The attention of a board of directors is also subject to the mechanisms
that are proposed by the attention-based view of the firm (e.g., Golden and
Zajac, 2001; Tuggle et al., 2010b). In case of a board, the issues and
answers are related to the role of the board in the monitoring, counseling,
and provision of resources. A firm’s context and structures determine the
issues and answers that draw the attention of the board members. Tuggle et
al. (2010b) studied how a board’s attention depends on the context that is
defined by a firm’s performance and the structures that are related to the
board’s composition, particularly duality. Golden and Zajac (2001)
investigated how the differences in boards’ attention to strategic and non-

Literature review
37
strategic issues influenced strategic change by firms. They suggested that
boards that pay more attention to, that is, spend more time on strategic
issues, are more familiar with such issues and therefore are more inclined
to make strategic changes as a result. They found empirical support that
attention to strategic issues relative to non-strategic issues promoted
strategic change.
Board incentives
Even if shareholders nominate a board of directors to monitor and
counsel management, board members can be regarded as agents who act
with self-interest (e.g., Deutsch et al., 2010). As a result, the effectiveness of
the board also depends on what type of incentives that the board members
have to act in line with the shareholders’ interests. Boards of directors are
given incentives that include various financial incentives, extended tenure,
and the opportunity to obtain other directorships (Yermack, 2004).
Firms typically compensate their board members with a fixed annual
compensation and fixed fees for each board meeting. However, agency
theory suggests that because such fixed compensation does not align the
incentives of board members with those of shareholders, fixed
compensation can cause board passivity and ineffectiveness (Kosnik, 1987,
1990; Mallette and Fowler, 1992; Johnson et al., 1993). According to agency
theory, equity-based incentives can motivate the agent to act more towards
the interests of shareholders. Accordingly, equity-based incentives have
also been proposed for boards of directors. In addition to stock, a board can
also be granted stock options as equity-based incentives (Yermack, 2004;
Deutsch et al, 2007, 2010). Yermack (2004) studied Fortune 500 firms and
found that compensation of boards was contingent on shareholder return.
On average, outside directors’ pay changed 11 cents for each $1,000 of
change in shareholder wealth. Yermack further found that more than half of
this change came from stock and stock options. The rest of the change was
due to alterations in the likelihood of obtaining new directorships in other
firms or losing a board seat in the current firm.
A number of studies have investigated how the effectiveness of boards
depends on the equity-based incentives of the board. Mallette and Fowler
(1992) studied whether stock holdings by a board improve monitoring by
the board by decreasing the adoption of poison pill provisions, but they did
not find a significant effect. Johnson et al. (1993) found that stock
ownership by outside directors increased restructuring by firms, suggesting
improved monitoring. Hoskisson et al. (1994) found similar evidence.
Deutsch et al. (2007) found that stock and stock option pay for outside

38
directors had a curvilinear effect on a firm’s acquisition rate. They
suggested that the decreasing effect at higher ownership levels is due to
directors starting to focus on preserving their accumulated stock wealth.
Deutsch et al. (2010) found that the stock option compensation of outside
directors increased firm-level risk taking. Hambrick and Jackson (2000)
studied how outside director stock holdings influence subsequent firm
performance and found that high performing firms tended to have much
higher ownership by the board than poorly performing firms.
Kosnik (1990) suggested that the effect of a board’s equity-based
incentives depend on management’s equity-based incentives. Kosnik
argued that when management has weak equity-based incentives, it is more
likely to take actions that are less aligned with the shareholders’
preferences, and the board’s monitoring plays a more critical role. As
monitoring by a board can be improved with equity-based incentives to the
board, such incentives have a stronger effect when management has weak
equity-based incentives. Kosnik found empirical support that in firms
whose management’s equity interests were small, corporate resistance to
greenmail was most likely when the outside directors' equity interests were
high relative to their total compensation. Also Deutsch et al. (2010) found
that outside director compensation and CEO compensation are mutually
substituting. Studying stock option pay, they found that if both the outside
directors and the CEO are provided with stock options, the outside
directors’ incentives weaken the effect of the CEO’s incentives on firm-level
risk taking.
In addition to equity-based incentives, board members have also career
incentives. Yermack (2004) noted that even if the fixed and equity-based
compensation of a board are typically neither the sole or main source of
director income, they can still be high enough to have some significance. As
a result, board members have an incentive to retain their board
appointments and to obtain new ones in other firms. Gilson (1990) found
that directors who had to resign due to poor performance later had fewer
seats on other boards, implying a loss of income opportunities. On the other
hand, Yermack showed that strong firm performance helped board
members to obtain new appointments, and the related income change was
also considerable. Because firm performance has an effect on the career of
board members, it provides the board with an incentive to perform its role
effectively.
Literature review
39
2.3 Corporate internal controls
Whereas the literature on boards of directors focuses on the apex of an
organization by examining the shareholder-board and the board-CEO
dyads, the literature on corporate internal controls focuses on the next
hierarchical level in an organization, that is, the dyad between the CEO and
division management.
The past research on corporate internal controls focuses on how the
corporate management of a multidivisional firm controls the divisional
management that reports to the corporate CEO (e.g., Gupta, 1987; Hill and
Hoskisson, 1987; Baysinger and Hoskisson, 1989, 1990; Hitt et al., 1990;
Goold and Quinn, 1990; Hoskisson et al., 1991, 1993; Johnson et al., 1993;
Hitt et al., 1996; Barringer and Bluedorn, 1999). Corporate internal controls
consist of financial controls and strategic controls.
Financial controls base their performance evaluations on objective
financial criteria such as return on investment, return on equity, or net
income. Managerial rewards are contingent on the achievement of such
financial objectives. In essence, financial controls are similar to outcome
controls in organizational control theory. Financial controls are generally
based on annual or shorter-term financial performance. Performance
targets are established at the start of a performance period, at the start of a
year, for example. Actual results are then monitored, and managers are
judged according to their actual performance relative to the targets. Actual
performance relative to the targets influences both management’s direct
income and its career opportunities. If a manager exceeds a performance
target, the manager can be awarded with a bonus. If a manager fails to
reach the target, the manager faces an increased risk of being dismissed or
demoted. Financial controls have certain weaknesses. First, a focus on
short-term performance reduces managerial incentive to make long-term
investments. Second, financial controls hinder cooperation between
corporate divisions when the divisions are interdependent with each other.
Cooperation between divisions becomes difficult because each division
manager tries to maximize his or her own performance at the cost of other
divisions.
Strategic controls are based on the evaluation of the strategic actions of
division management. Hitt et al. (1996) describe strategic controls as the
evaluation of “the strategies business-level managers formulate and the
strategic actions they take rather than their outcomes.” Baysinger and
Hoskisson (1990) also include the outcomes by noting that “[u]nder a
system of strategic controls, division (SBU) managers are evaluated on the
basis of how strategically desirable their decisions were before
40
implementation (ex ante) and on the basis of the financial performance of
the firm after the decisions were implemented (ex post).” Strategic controls
can be regarded as a monitoring mechanism in terms of agency theory, but
they are nevertheless different from any other controls that are discussed in
the corporate governance or organizational control literature. The
characteristic element of strategic controls is that division management is
evaluated based on the quality of the strategic plan ex ante, that is, before
the strategy is actually even implemented. This ex ante evaluation is a
unique control mechanism that is not included in any other controls
discussed in corporate governance or organizational control literature.
Strategic controls provide several advantages over financial controls.
Strategic controls help division managers to take risky strategies because
they feel that corporate management understands such strategies. Strategic
controls allow for a focus on long-term performance because division
managers expect to be evaluated based on their strategies rather than on
short-term financial performance only. The motivation for risky and long-
term strategies also encourages division managers to commit to innovation.
The main weakness of strategic controls is that their use requires that
corporate management has an adequate understanding of the operations
and markets that are related to the division strategies. Establishing and
maintaining the knowledge required for strategic controls can take a
substantial amount of time from corporate management, thereby adding a
cost to strategic controls.
Previous research on corporate internal controls has studied how the
degree of corporate diversification influences the balance between financial
and strategic controls. The main finding is that when a corporation is a
conglomerate that consists of independent divisions that operate in
unrelated businesses, the cost of obtaining the detailed information that is
needed for strategic controls is high and limits the use of these controls. As
a result, only financial controls are available in practice for use in such
firms. On the other hand, when divisions that operate in the same market
and need to coordinate strategies with each other, strategic controls are
more useful because there is relatively less information to be obtained, and
obtaining such information not only supports strategic controls but also
helps corporate management in the coordination that it needs between the
divisions.
Previous research has also investigated how corporate governance and
corporate internal controls interact with each other. Baysinger and
Hoskisson (1990) proposed that outside directors would prefer financial
controls over strategic controls because outside directors have less
knowledge of a firm and its markets than inside directors. Inside directors,

Literature review
41
on the contrary, would be in a better position to use strategic controls.
Baysinger and Hoskisson did not test their propositions, however. Johnson
et al. (1993) found empirical evidence that the use of strategic controls
improves the alignment between the interests of management and
shareholders and thereby lessens the need for monitoring by a board.
In addition to Johnson et al. (1993), a number of empirical studies have
investigated corporate internal controls. Gupta (1987) found that
subjectivity in the performance evaluations of divisions was positively
associated with the effectiveness of pursuing strategies that are based on
differentiation. The association was negative for strategies based on low-
cost leadership. Gupta argued that subjective performance evaluation
encourages paying attention to the identification of unfilled customer needs
and the design of unique new products, which is useful for a differentiation
strategy. Johnson et al. (1993) provided the first empirical measure for
strategic controls. They used three survey items to measure the emphasis
on strategic controls, including the use of (a) face-to-face meetings, (b)
informal meetings, and (c) subjective criteria. In addition, Hitt et al. (1996)
used three similar survey items to test how corporate headquarters control
divisions. In addition, Hitt et al. developed three survey items to measure
the emphasis on financial controls, including the use of (a) return criteria
such as return on assets or return on invested capital, (b) cash flows, (c)
objective strategic criteria such as return on investments, and (d) formal
reports from financial management information systems by corporate
management. Hitt et al. found that strategic controls increased research
and development expenditures and new product introductions. Financial
controls, on the other hand, decreased R&D and new product intensity but
increased acquisition intensity. They also found that both acquisition and
divestiture intensity decreased the use of strategic controls but increased
the use of financial controls. Further, Barringer and Bluedorn (1999) used
similar measures for financial and strategic controls. They found that
strategic controls increased corporate entrepreneurship, which was defined
as a firm’s tendency toward innovation, risk-taking, and proactiveness.
Financial controls did not have any effect on corporate entrepreneurship.

42
2.4 Investment in learning
Cyert and March (1963) suggested that, provided that an organization
does not change, environmental changes tend to degrade the organization’s
productivity below a satisfying level, creating pressure to seek new
solutions through intentional learning. To address the pressure for
learning, individuals and firms alike need to invest some of their resources
into the pursuit and acquisition of new knowledge and to the adaptation to
environmental changes. On the other hand, an excessive allocation of
resources to learning can also pose a threat to survival (March, 1991). As a
result, there are both benefits and costs of investments in learning, and the
level of investments in learning is determined by their balance. This chapter
reviews previous research to identify the factors that determine the level of
investments in learning.
Because the body of knowledge about learning is broad, this chapter
reviews the past research with a limited focus on certain definitions of
resources to be invested and learning. Resources that can be invested in
learning include money and equivalents, personal time, the operating time
of any equipment, or any other assets that are needed for learning.
Learning refers to the acquisition of knowledge that is new to the person or
firm that is engaged in the learning process. Such knowledge can already be
possessed by someone else, or it can be entirely novel to the world, not
known to anyone. In addition, learning includes any effort that is made to
acquire knowledge, and it does not distinguish between the various types of
learning. If the existing resources are not allocated to learning, they are
assumed to be allocated to alternatives including consumption, saving,
production or operations that rely solely on the use of knowledge that is
already known by an individual or a firm.
The focus on any learning is different from the influential stream of
research about exploration and exploitation in learning that was initiated
by March (1991), which focused on the balance between two types of
learning. The literature on exploration and exploitation is interested in the
balance between exploration and exploitation. March defines exploration as
including “things captured by terms such as search, variation, risk taking,
experimentation, play, flexibility, discovery, innovation.” On the other
hand, exploitation “includes such things as refinement, choice, production,
efficiency, selection, implementation, execution.” Other scholars have
usually used the March’s definitions, but they have also provided their own
characterizations. For example, Levinthal and March (1993) portray
exploration as “the pursuit of knowledge, of things that might come to be
known” and exploitation as “the use and development of things already
Literature review
43
known.” Fang et al. (2010) state that “exploration refers to the search for
new, useful adaptations, and exploitation refers to the use and propagation
of known adaptations.”
Although this study is interested in investigating learning in
organizations, it is first examined from the perspective of an individual
rather than that of an organization. That is, this study first identifies the
factors that determine an individual’s motivation to invest in learning. This
approach is chosen because it is useful for an understanding of
organizational phenomena, and such phenomena are later discussed from
the perspective of a principal-agent dyad. Because a principal and an agent
are individuals, organizational learning can be understood by how the
principal and the agent prefer learning as individuals and how the agency
mechanism influences these preferences.
2.4.1 The variations in learning preferences between individuals
Just as different individuals have different production resources, some
individuals can allocate more resources to learning than others. However,
there are also other reasons that cause some individuals to be more
attracted to learning than others.
Differences in knowledge
An individual’s past experience may help him or her to identify an
opportunity that has the attractive potential for profits because others lack
the same past experience that is needed to identify the opportunity in time.
Others may lack the required experience because each individual has
unique past experiences and knowledge that determines the choice of
factors to which an individual pays attention (Hambrick and Mason, 1984;
Sitkin and Pablo, 1992; Ocasio, 1997; Grégoire et al., 2010). Further, if
others cannot perceive an opportunity as early as an informed individual,
the income potential from the opportunity is likely to be improved for that
individual due to limited competition. As an illustration of individual
differences in perceiving opportunities, Shane (2000) showed how a
technical invention was communicated to thousands of individuals, but
only a few with the appropriate knowledge could identify the new
opportunities that the invention presented. Further, the identified
opportunities were unique in the case of each of those few individuals.
Cohen and Levithal (1990) suggested that knowledge that has been
acquired in the past can help an individual to develop an absorptive

44
capacity that provides an edge over others in knowledge acquisition. Others
may not be able to learn new knowledge that is built on the individual’s
unique knowledge base, which provides the individual with a source of
competitive advantage over an extended period of time. The resource-based
theory of firms (e.g., Wernerfelt, 1984; Henderson and Cockburn, 1994;
Newbert, 2008) suggests that a similar type of knowledge advantage can
exist also for firms.
Differences in risk preferences
Levitt and March (1988) and Levinthal and March (1993) noted that
learning involves uncertainty about success or failure. As individuals differ
in their preferences for risk regarding their income (e.g., Glimcher and
Rustichini, 2004; Wolf et al., 2007; Cesarini et al. 2009), the higher the
uncertainty of the success of an investment in learning, the fewer
individuals find the investment attractive. In particular, an effort to learn
novel knowledge that was not known to anyone else is likely to involve a
high uncertainty of success, screening out most individuals and making the
endeavor attractive only to individuals with high risk tolerance. Empirical
evidence seems to support the notion that uncertain investments offer
attractive returns to those who can tolerate uncertainty. Lundblad (2007)
studied almost two centuries of equity market returns and found that
higher uncertainty investments indeed offered a higher return.
Differences in patience
Competition for learning some knowledge is also limited if the learning is
expected to take a relatively long time, postponing the potential gains from
the learning. Montague and Berns (2002) and Glimcher et al. (2007)
suggested that individuals discount future gains. Such behavior has its
origin in the mechanisms of the human brain, but the strength of the
discounting varies among individuals, making long-term learning more
attractive to some individuals than others. The limited competition for
investments in learning that are expected to take a long time may make
such learning attractive to individuals with patience. The past research on
investors has also found that certain types of investors tend to be more
attracted than others to investing in a firm that is involved in long-term
learning (Zahra, 1996; Kochhar, 1996; Hoskisson et al., 2002; Connelly et
al., 2010).

Literature review
45
Prelec and Loewenstein (1991) suggested that learning that is expected to
take a long time to generate income is also likely to involve high
uncertainty. The longer time that is needed for learning increases the
likelihood of unexpected incidents. On the other hand, learning that
involves uncertainty is also likely to require time to complete as the
uncertainties need to be resolved. Thus, investments that are uncertain
tend to take a long time to generate income, and investments that tend to
take a long time to generate income tend to be uncertain.
Differences in intrinsic motivations for learning
An individual may also be attracted to learning because of an intrinsic
motivation for learning. Amabile (1993) suggested that an individual is
intrinsically motivated when he or she seeks enjoyment, interest,
satisfaction of curiosity, self-expression, or personal challenge in an
activity. Researchers have shown that some individuals have an intrinsic
motivation to work on complex and novel tasks that involving learning (e.g.,
Maslow, 1968; Oldham and Cummings, 1996; Osterloh and Frey, 2000;
Kim and Oh, 2002; Katz, 2005; Eisenberger et al., 2005; Sauerman and
Cohen, 2010). Tierney et al. (1999), Dewett (2007) and Zhang and Bartol
(2010) suggested that intrinsic motivation increases an individual’s
creativity in learning new knowledge. Eisenberger and Aselage (2008)
showed that an individual can be simultaneously motivated both
intrinsically and by the potential for future income through learning.
The synthesis of variation of learning preferences between
individuals
In summary, there are several possible reasons for an individual to
allocate resources such as time to learning. Some individuals have unique
knowledge that helps them to identify new opportunities for learning. A
high tolerance for learning failures and the patience to wait for learning
gains can increase the attractiveness of learning. An individual may also be
intrinsically motivated by learning. Such reasons for learning are not
exclusive, but they may reinforce each other in making learning an inviting
investment for an individual. Such individual differences are also reflected
in the differences between firms. For example, Helfat (1994a, 1994b)
studied firms and found that the balance between investments in existing
production and the learning of new knowledge is firm-specific and varies
even between firms in the same industry.

46
In particular, some individuals may be more attracted than others to
invest in learning new knowledge that is likely to take a long time to
generate income. New knowledge tends to have a relatively high probability
of failure, to take a long time to generate income, and to present
intrinsically motivating challenges. Additionally, if new knowledge is
expected to take a long time to learn, the length of time toward completion
is likely to increase the uncertainty of success because the environment is
more likely to change during the course of the learning. An individual with
a high tolerance for learning failure, the patience to wait for learning gains,
and an intrinsic motivation for learning is more likely than others to find it
attractive to learn new knowledge that is likely to take a long time to
generate income.
2.4.2 The variation of learning preferences over time
Mansfield (1964) and Grabowski and Baxter (1973) suggested that
resources are allocated to both learning and existing production, depending
on the attractiveness of the potential income from each alternative. Often
an individual has found a certain approach of arranging resources for
production that is attractive and can be repeated over and over again.
However, if the marginal expected income from adding more resources into
the existing production is decreasing, the individual may find it more
attractive to invest part of the resources in some other alternatives, possibly
learning new knowledge. On the other hand, Nohria and Gulati (1996)
found that alternative long-term investments also have decreasing marginal
expected income. Thus, an individual is likely to retain a balance between
investments in learning and existing production. For example, Collins and
Porras (1994) found that successful firms allocated resources persistently to
both learning and existing production. Helfat (1994a) and Chen and Miller
(2007) also found that investments in learning in a firm vary over time, but
it is nevertheless positively related to the past level of investments in
learning. That is, the balance between investments in learning and existing
production is likely to have somewhat limited variance over time. The past
research has identified several reasons for the temporal variation of the
balance between existing production and learning.
Effect of changes in knowledge
Herriott et al. (1985) suggested that as an individual learns new
knowledge over time, the estimates of the expected income of alternative
Literature review
47
investments can change, also changing the allocation of resources between
production and learning. In particular, the resources that are allocated to
learning can both increase and decrease over time as an individual learns
new knowledge.
An individual may learn new knowledge about the future productivity of
existing production and adjust the allocation of resources accordingly. A
long tradition of research has identified that discontent with the status quo
prompts learning. Schumpeter (1934) proposed that environmental
changes can cause a creative destruction that undermines the productivity
gains from existing knowledge and resources. Cyert and March (1963)
suggested that environmental changes tend to degrade productivity below a
satisfying level, creating pressure to seek new solutions through intentional
learning. Grabowski and Baxter (1973) suggested that learning efforts by
competitors may provoke learning to retain competitiveness. Porter (1980)
portrayed a wide range of mechanisms for how actions by others may erode
the profitability of existing production and generate pressure for learning.
Lant et al. (1992) and Mone et al. (1998) suggested that if an individual
learns that the expected income from existing production decreases
permanently, the individual may find it more attractive to allocate some
resources to other investments, possibly learning. Zahra and George (2002)
noted that triggers such as performance decline, radical external
innovations, and government policy changes can induce learning for the
acquisition of new knowledge. Montague et al. (2006) even suggested that
the learning response to discontent with the status quo has its origin in the
human brain, which seems to have evolved with mechanisms for
stimulating exploration in cases when the environment has been depleted
of sources for exploitation.
However, an individual may also learn new knowledge that suggests that
the expected income from existing production increases. In this case, the
individual may find it more attractive to cancel some learning investments
and to allocate more resources to expand the existing production.
The balance between existing production and learning can also change
independently of existing production. Dosi (1988) suggested that an
individual may perceive learning as an attractive opportunity, even when
the productivity of existing resources is not threatened, although Knott and
Posen (2009) found that learning in response to a threat is more prevalent.
Huber (1991) suggested that an individual may discover an opportunity for
learning new knowledge by accident. Greve (1998) and Greve and Taylor
(2000) also suggested that innovations by others may help an individual to
perceive new opportunities. As an individual discovers new opportunities
with attractive future income potential, the individual may then allocate

48
resources from existing production to a new opportunity if the expected
income from the opportunity is more attractive than the income from the
existing production.
On the other hand, Green et al. (2003) suggested that as an individual
learns new knowledge, the estimated expected income from a learning
investment can also decrease, thereby decreasing the relative attractiveness
of the learning investment. Moreover, if an individual invests in learning,
the individual is likely to complete the learning at some point. If an
individual has completed or cancelled learning investments and lacks the
knowledge of another, equally attractive, learning investment, the
individual will allocate resources to expand existing production instead.
The effect of changes in available income and resources for
investing
A change in income from existing resources can affect an individual’s
estimate of the expected income from alternative investments. If the
income from existing resources is less than in the past, one reason for the
decrease may be a permanent external change that decreases the
productivity of the existing resources. Cyert and March (1963) suggested
that if an individual experiences a decrease in income, he or she tends to
invest in learning to increase the income back to a satisfactory level. Mone
et al. (1998) suggested that an individual estimates the probability of a
permanent change based on personal knowledge of production. If the
estimate of the likelihood of a permanent change is high enough, an
individual may find it attractive to allocate some resources to learning.
Thus, a decrease in income relative to the past can increase investment in
learning but need not increase it.
On the other hand, if income from existing resources increases, one
reason for the increase relative to the past may be an increased productivity
of existing resources in a changed environment. In this case, an individual
may increase the estimate of the expected income from existing resources
and therefore allocate some resources for learning to expand existing
production. Thus, an increase in income relative to past may decrease
investment in learning but need not decrease it.
A change in the amount of resources that are available for investing can
also cause changes in the amount of resources that are allocated for
learning. If past investments succeed in increasing resources available for
investing, an individual allocates such additional resources to the next best
investment opportunities that can be either an expansion of the individual’s
existing production or an initiation of new learning initiatives. Thus, an
Literature review
49
increase in resources can but need not necessarily increase investments in
learning.
Similarly, if past investments fail, and as a result, an individual has fewer
resources available for investing than in the past, the individual will cut the
least attractive investments. The least attractive investments can be either a
part of the individual’s existing production or learning. Thus, a decrease in
resources can but need not necessarily decrease investments in learning.
In summary, if income from past investments exceeds resources that are
needed for the past investments, an individual can invest more, which can,
but need not, increase investments in learning. On the other hand, if the
income from past investments is less than the resources that were needed
in the past, the individual must cut investing, which can, but need not,
decrease investments in learning.
A change in the amount of resources that are available for investing can
also affect investments in learning through changes in the likelihood of
survival. Cyert and March (1963) and Singh (1986) suggested that the more
resources that an individual has, the lower the risks to survival. As an
individual always has limited resources, a decrease in the available
resources implies not only that the individual can invest less, but it may
also cut the individual’s resources that are available for consumption, or at
least increase the risk of lowering consumption in the future. As some level
of consumption is eventually required for survival, a decrease in resources
also increases the threat to survival, perhaps only a little, but in any case
somewhat.
To minimize increasing the threat to survival after an income decrease, an
individual can choose an investment that has a lower probability of
threatening survival but has also somewhat lower expected value than the
investments that were made prior to the income decrease. Even if an
individual prefers an investment with a certain probability of failure at
some point, the individual may start to prefer an investment with an even
lower probability of failure and lower expected income if the resources that
are available to the individual decrease for some reason. In other words, an
individual becomes more risk averse (Pratt, 1964) if the individual’s
resources decrease. Such risk aversion is likely to decrease the preference
for learning investments. In contrast, an increase in resources decreases an
individual’s risk aversion and increases the preference for learning
investments.
If an individual’s resources decrease to a very low level, the individual’s
behavior can become risk-seeking, and the individual may prefer
investments with negative expected values (Cyert and March, 1963; Singh,
1986). If an individual’s resources decrease low enough to threaten survival,

50
the individual will choose investments that maximize the probability of
survival, regardless of their expected value (Cyert and March, 1963; Singh,
1986). As a result, an individual can invest in gambles with a negative
expected income but with a higher probability of survival than any
alternative investments. For example, an individual could face a situation
where an investment has a positive expected value, but it is still less than is
needed for survival. In this case, a higher positive gain is needed for
survival. The individual is then motivated to prefer an investment with the
highest probability that the income generated by the investment will exceed
the income that is needed for survival. Such an investment is attractive to
the individual even if it has a negative expected value, thereby motivating
risk-seeking by the individual. As some learning investments may have
potential for very high income but a negative expected value that is due to a
high probability of failure, they can become attractive for individuals who
have become risk-seeking. Investments with a negative expected value are
likely to further deplete resources, and the individual must find gambles
with increasingly higher potential income to provide some probability of
survival. Thus, the individual is likely to become increasingly risk seeking.
If the individual succeeds in increasing his or her resources, the individual
will return to choosing less risky investments.
However, Kahneman and Tversky (1979) found that some individuals
became increasingly risk seeking after they experienced negative income
that decreased their resources regardless of their absolute amount of
resources. Smith et al. (2002) found that risk seeking in the case of losses
was reflected in the human brain. Montague and Berns (2002) suggested
that the brain has evolved to include decision making mechanisms that
support survival. Thus, even if a risk-seeking response to negative income
when the threat to survival is low may not always seem rational, it is
possible that evolution has favored such a behavioral trait. Based on few
assumptions, Rayo and Becker (2007) suggested how evolution may have
favored such a risk-seeking response.
The responses of risk preferences to income changes have been studied
extensively, and there seems to be a wide variety of preferences among
individuals (e.g., Glimcher and Rustichini, 2004; Wolf et al., 2007; Cesarini
et al. 2009). For example, Pennings and Smidts (2003) studied farmers and
found that some (39%) were always risk averse, and some were always risk-
seeking (27%), while some were risk averse for income increases but risk-
seeking for income decreases (30%). A minority (4%) was even risk averse
for income decreases but risk-seeking for income increases.
Literature review
51
Summary
In summary, an individual retains a certain balance between the resources
that are allocated to existing production and learning new knowledge. The
individual adjusts learning based on new knowledge, income from existing
resources, and changes in resources that are available for investment. As a
result, the individual may choose to both increase and decrease resources
allocated to learning at different points over time.
As income changes can influence both resources that are available for
investment and the estimates of expected incomes from alternative
investment opportunities, income changes also influence investments in
learning through these two mechanisms. An income decrease can both
encourage and discourage investments in learning through several different
mechanisms.
An income decrease increases the probability that the productivity of
existing resources has decreased permanently, which increases the relative
attraction of learning. An income decrease may also provoke a behavioral
response of risk-seeking that may make some learning investments
attractive. On the other hand, an income decrease can decrease the
resources that are available for investing, thereby decreasing investments in
learning. A decrease in the available resources also increases the threat to
survival and thereby increases risk aversion, which can decrease the
attraction of learning investments because of their higher probability of
failure.
These same mechanisms can also encourage and discourage investments
in learning after an income increase. An income increase increases the
probability that the productivity of existing resources has increased
permanently, which decreases the relative attraction to learning. An income
increase may also decrease risk tolerance if an individual has recently
responded to a performance decrease with risk-seeking. On the other hand,
an income increase can increase the resources that are available for
investing, thereby increasing investments in learning. An increase in the
available resources also decreases the threat to survival and thereby
decreases risk aversion, which can increase the attraction to learning
investments.

52
2.5 Managerial myopia
2.5.1 The dilemma of managerial myopia
A number of scholars have observed that organizations suffer from
managerial myopia, which is defined as an excessive preference for low-risk
and short-term investments in firms (e.g., Hayes and Abernathy, 1980; Hill,
1985; Porter, 1992; Hoskisson et al., 1993; Jensen, 1993; Levinthal and
March, 1993; Laverty, 1996; Zahra, 1996; Miller, 2002; Marginson and
McAulay, 2008: Barrett, 2010; Souder and Shaver, 2010). This preference
restrains a firm’s ability to allocate resources to learning new knowledge
that is likely to take a long time to generate income. Eventually, the firm’s
ability to sustain competitiveness in a changing environment erodes over
time (Leonard-Barton, 1992; Levinthal and March, 1993; Utterback, 1994;
Christensen and Bower, 1996). In essence, managerial myopia reflects the
ineffectiveness of a principal in controlling an agent.
Previous research on managerial myopia suggests that myopia can be
induced by short-term financial control. Hoskisson and Hitt (1988) and
Hoskisson et al. (1993) suggested that short-term financial control is widely
used by principals to control agents. Additionally, the output controls
described by organization control theory are similar to short-term financial
controls (Ouchi, 1977, 1979; Eisenhardt, 1985; Jaeger and Baliga, 1985;
Snell, 1992; Kirsch, 1996). In short-term financial control, a principal
reviews the past income from the production based on the resources
allocated to an agent and sets an income target for the agent for the next
period. The eventual performance relative to the target influences the
agent’s immediate and future income by shaping the agent’s career
opportunities (Fama, 1980; Narayanan, 1985; Gibbons and Murphy, 1992;
Holmström, 1999).
If the agent exceeds the target, the principal awards the agent with bonus
compensation, a promotion, or the promise of an increased probability of
such awards in the future if the agent continues to exceed the target in the
subsequent period of time. On the other hand, if the agent fails to reach the
target, the principal sanctions the agent, for example by demoting,
dismissing, or threatening the agent with an increased risk of such actions
unless the agent can improve his or her performance in the next period
(Walsh and Seward, 1990). For example, Tuggle et al. (2010b) found that
boards their increased monitoring of firm management after an income
decrease. Moreover, several studies have found evidence that poor financial
performance indeed increases the risk of agent turnover (Schwartz and
Menon, 1985; Morck et al., 1989; Grinyer and McKiernan, 1990; Gilson and

Literature review
53
Vetsuypens, 1993; Daily and Dalton, 1995; Chevalier and Ellison, 1999;
McNeil et al., 2004).
Hoskisson and Hitt (1988) suggested that short-term financial control
provokes the agent to prefer investments with relatively low uncertainty
and a short time to generate income, also in case of investments in learning.
Uncertainty about the income of an investment implies uncertainty about
an agent’s personal income as performance below the target that was set by
a principal may cause low income for the agent. The agent may prefer to
avoid uncertainty more than the principal if the agent’s total income
depends more on the performance than the principal’s total income. This is
often the case because a principal’s income may be diversified across many
other resources that are not delegated to an agent. The agent is also likely to
prefer investments that require shorter periods of time to produce income
than the principal because an investment with a payback beyond the
following few time periods of time decreases short-term performance,
which may result in dismissal of the agent prior to the eventual potential
future income increase from the investment. For example, Mishina et al.
(2004) found that firms that are trying to develop new products had lower
sales growth in the short term. Thus, trying to avoid a dismissal, an agent
may avoid investments that require a long period of time to generate
income to maximize short-term performance, anticipating a bonus or an
earlier promotion as a result (Narayanan, 1985, Stein, 1989).
Laverty (1996) and Marginson and McAulay (2008) noted that an
individual can have a natural preference for low risk and short-term
investments, even without short-term financial control. If a principal
prefers low risk and short-term investments, short-term financial control
enables the principal to motivate an agent to allocate resources according to
the principal’s preferences. However, if a principal prefers investing in
learning new knowledge that is likely to take a long time to generate
income, short-term financial control may not provide the principal with the
means to control an agent.
As short-term financial control encourages an agent to prefer investments
with relatively low uncertainty and a short period of time to generate
income, it is not likely to enable a principal to motivate the agent to allocate
the delegated resources to learning new knowledge that is likely to take a
long time to generate income even if the principal prefers such learning. In
a case in which the principal delegates the agent resources that are
allocated only for repeating production with existing knowledge, short-term
financial control enables the principal to control the agent as long as the
environment does not change and poses a threat that would require
learning that takes a long time to generate income. However, even in this

54
case, the principal loses the ability to invest in learning opportunities that
are based on further developing the potentially rare resources and
knowledge that are embedded in existing production. Moreover, the
environment tends to change continuously, and short-term investments in
learning tend not to sufficiently improve productivity, resulting in
decreasing income at some point in time (Leonard-Barton, 1992; Levinthal
and March, 1993; Utterback, 1994; Christensen and Bower, 1996; Uotila et
al., 2009). Thus, under short-term financial control, an agent may invest
less in learning than a principal prefers, even when the agent manages
resources that are allocated only to repeating production with existing
knowledge.
2.5.2 The limitations of equity-based incentives against myopia
Even if a share of future dividends and stock options can help an agent to
benefit from investments that take a long time to generate income, the
agent typically has only a limited tenure and cannot influence resource
allocation decisions beyond the tenure. If the agent allocates resources for
an investment that takes a long time to generate income, it is possible that
the successor will have different preferences and therefore will allocate
resources differently. If the successor does not complete the long-term
investments that were started by the agent, the agent will not achieve the
intended future dividends. At worst, once the agent leaves, the principal
may even transfer some of the resources and knowledge to a new firm
without the appropriate compensation, leaving fewer dividends for the
agent (Burkart et al., 1997; Shleifer and Vishny, 1997; Baker et al., 1999;
Foss, 2003; Masulis et al. 2009). The legal system provides the agent with
some security against such appropriation if the resources that were
delegated to the agent are structured as a firm, but even a court has
bounded rationality and may not be able to judge the appropriation of
complex resources and knowledge correctly. Limited tenure and the
possibility of post-tenure changes in resource allocation can decrease the
agent’s motivation to invest in long-term learning even if the agent is
compensated with equity-based incentives.
Moreover, the ability to control the agent with a share of future dividends
and stock options is also limited in firms that employ several agents. When
a firm employs thousands of agents, equity-based incentives depend on the
resource allocation decisions made by all of the agents. Resource allocation
decisions by one agent have only a marginal effect on the agent’s share of
the firm’s total income and dividends (Baker et al., 1988; Baker, 1992,
Balkin, et al., 2000; Zenger and Marshall, 2000). Only a few agents at the

Literature review
55
upper echelons are able to allocate resources with a significant effect on the
income and dividends. As the resource allocation decisions that are made
by the remaining majority of the agents can have only a marginal effect on
the income and dividends, the effect of the decisions on the shareholder
return is not likely to have much effect on the choices that are made by
these agents. The choice is likely to be based to a large extent on whatever
other controls the principal has set in place.
Finally, short-term financial control typically exists to some extent even in
cases in which an agent has long-term financial incentives such as a share
of future dividends or stock options. Even if an agent is motivated by long-
term financial incentives, a principal can set a certain short-term income
target. If the agent fails to reach the target, the principal may choose to
sanction the agent. Thus, long-term financial control does not exclude
simultaneous short-term financial control.
2.5.3 The limitations of other control mechanisms against myopia
In organizational control theory, behavior control provides little control
against managerial myopia because most managerial actions have low task
programmability. Output control is based on the evaluation of past output,
and because long delays between actions and output make the control
ineffective, it is based on short-term performance. Thus, it is not a cure
against managerial myopia but, on the contrary, output control is rather a
cause of managerial myopia. When task programmability and output
measurability are low, clan control is recommended by organizational
control theory. Clan control has the potential to reduce managerial myopia,
but as discussed above, verifying the effectiveness of clan control is difficult.
In corporate governance, monitoring by a board of directors is intended to
be the main control mechanism in addition to equity-based incentives.
However, the board members have bounded rationality and can monitor
only few of the most critical actions by the CEO and perhaps a number of
key executives. However, the bulk of the decisions that determine the
shareholder return of a firm are made at the lower organizational levels,
and it is likely to be difficult for the board to directly monitor such
decisions. As a result, direct monitoring by the board is unlikely to control
managerial myopia at lower organizational levels. On the other hand,
information of short-term financial performance can be presented in a
concise format, and the board is likely to use short-term financial control
for many organizational levels, if it so wishes. Thus, potential visibility of

56
short-term financial performance to the board may actually strengthen
motives for managerial myopia.
In the corporate internal controls literature, strategic controls are
specifically intended to reduce managerial myopia. Hitt et al. (1996)
contend that “[b]usiness-level managers are more likely to undertake risky
projects because they feel that corporate managers understand their
strategic proposals. Additionally, business-level managers believe they will
be rewarded for the quality of their strategies rather than for short-term
financial outcomes.” Even if strategic controls seem promising, the related
past research has focused on investigating how a CEO can apply them to
control the division managers who report to the CEO. Therefore, strategic
controls may not control the bulk of the managers at the lower
organizational levels and the decisions that are made by them. Moreover,
even if the strategies tend to focus on key resource allocation opportunities,
they are likely to cover only a minor part of the resource allocation
decisions that are taken by all of the managers in large organizations.
In summary, known control mechanisms provide some support for
reducing managerial myopia, but each also has considerable limitations.
Long-term financial control suffers from difficulties in aligning risk
preferences, limited tenure, and in particular, a low effectiveness on the
bulk of lower management echelons. Moreover, short-term financial control
is often used in addition to long-term financial control and creates myopic
pressure. The effectiveness of clan control is difficult to verify. Monitoring
by a board and strategic control are limited to a subset of resource
allocation decisions. Finally, the past research on strategic controls has
focused on the dyad between the CEO and division managers rather than
the bulk of the managers at the lower organizational levels.
In conclusion, the past research has observed the dilemma of managerial
myopia to be a widespread problem, which over time erodes the ability of
firms to make investments that are needed to sustain competitiveness in a
changing environment. The empirical evidence on managerial myopia
suggests that organizational control mechanisms fail to adequately address
managerial myopia. The review of corporate governance and corporate
internal control mechanisms confirms this problem because all of the
known controls have limitations in effectively guarding against managerial
myopia. However, despite their weaknesses, some control mechanisms help
organizations to avoid even worse levels of managerial myopia. Thus,
managerial myopia is not an insurmountable dilemma, and other control
mechanisms for better curbing managerial myopia may yet be discovered.

Theory and hypotheses
57
3. Theory and hypotheses
The past research in managerial myopia suggests that an excessive
preference for low risk and short-term investments restrains an
organization’s ability to allocate resources for learning new knowledge that
is likely to take a long time to generate income (e.g., Hayes and Abernathy,
1980; Hill, 1985; Porter, 1992; Hoskisson et al., 1993; Jensen, 1993;
Levinthal and March, 1993; Laverty, 1996; Zahra, 1996; Miller, 2002;
Marginson and McAulay, 2008: Barrett, 2010). Eventually, the
organization’s ability to sustain competitiveness in a changing environment
erodes (Leonard-Barton, 1992; Levinthal and March, 1993; Utterback,
1994; Christensen and Bower, 1996). This chapter investigates how various
control mechanisms in a firm can curb managerial myopia and thereby
increase its preference for investments in learning new knowledge that is
likely to take a long time to generate income.
Previous research on corporate governance and corporate internal
controls tends to focus on one principal-agent dyad at some organizational
level. Corporate governance focuses on the shareholder-board and board-
CEO dyads at the very apex of an organization. Corporate internal control
focuses on the next level dyad between a CEO and a division manager. On
the other hand, the emphasis of organizational control theory focuses on
the lowest organizational level between a supervisor and a worker.
The literature on corporate governance and corporate internal controls
has addressed the dilemma of managerial myopia and has developed a
basic understanding of how corporate governance and corporate internal
controls can be applied in combination to curb managerial myopia by a
division manager. However, the past research lacks an understanding of
how controls on managerial myopia can be extended below division
management. Because a typical corporation consists of several layers of
management below division management and the bulk of decisions are
made by lower level managers, there is a lack of understanding of how
managerial myopia can be controlled in an organization.
This chapter aims to investigate how the control mechanisms that have
been identified by the literature on corporate governance and corporate

58
internal controls can be extended to address the problem of managerial
myopia at the lower organizational levels and thereby increase the
preference for investments in learning new knowledge that is likely to take
a long time to generate income. As in the literature on corporate
governance and corporate internal controls, the hypotheses that are
developed in this chapter are based on the key theories that underlie the
literature on corporate governance and corporate internal controls: agency
theory, organizational control theory, and resource dependence theory.
The following section first discusses how decisions on investment in long-
term learning are typically made in large organizations and how such
decisions can be influenced by myopic behavior. The rest of this chapter
investigates how the control mechanisms that have been identified by the
literature on corporate governance and organizational control can be
extended to curb managerial myopia for such investments at the lower
organizational levels. The effect of each control mechanism is examined
from the perspective of both a principal and an agent by addressing the
following two questions:
1. Does the control mechanism help a principal to motivate an
agent to increase investments in learning new knowledge that is
likely to take a long time to generate income?
2. Does the control mechanism help a principal to increase
investments in learning new knowledge that is likely to take a
long time to generate income?

Theory and hypotheses
59
3.1 Decisions on investments in learning in organizations
3.1.1 Investment decisions
Agency theory suggests that a principal has the ultimate control over all of
the decisions in an agency, but he or she usually delegates most of the
decisions to one or more agents (Fama and Jensen, 1983a; Aghion and
Bolton, 1992; Aghion and Tirole, 1997). Large organizations are structured
as vertical hierarchies with several successive layers of principal-agent
dyads. Decision rights are delegated to different levels of hierarchy. Each
principal has certain rights to make some decisions that are related to some
resources. The principal can further delegate some of these rights to an
agent. On the other hand, some decisions require the principal to ask for
approval from a higher level in the hierarchy.
In particular, each principal has rights to allocate certain resources. Such
resources can include money and equivalents, personal time, the operating
time of equipment, or any other assets (e.g., Wernerfelt, 1984). The
principal employs several agents and delegates specific rights to each agent
to determine how certain resources are allocated.
Monetary resources are typically managed through budgeting (e.g.,
Chandler, 1962; Cyert and March, 1963; Bower, 1970). In budgeting, the
board of directors retains the ultimate right to allocate all of a firm’s
income. The board decides what share of the income is distributed as
dividends to the shareholders. The rest of the income is used for the firm’s
investments and operations. The board delegates rights to the CEO to
allocate a certain maximum amount of money. This amount is defined as
budget. The budget is usually defined for one year, but it can be frequently
updated based on the actual income of the firm. The CEO delegates the
firm’s budget further and determines the budget for each division manager.
Such delegations of budget repeat down the management hierarchy. Each
principal can delegate the budget resources further to the lower levels or
use a part of budget directly for expenditures. The lowest level of the
organization cannot delegate the budget further, but rather it is used for
expenditures. As a result, the budget is eventually spent for expenditures.
Typically, a principal does not delegate a budget to an agent by one
decision per year. Instead, the principal asks the agent to specify a list of
alternative activities for which the budget is requested. The principal then
decides which activities are to be implemented and delegates the agent a
budget for each activity (e.g., Chandler, 1962; Bower, 1970). The agent can
then further allocate the budget for each activity. The budget of an activity
is usually defined for some period of time, and the agent needs to ask the

60
principal for a decision on a new budget for each period. Typically, the
maximum period for budgeting is one year, but the period can be much
shorter for some activities. In conclusion, a principal allocates a budget to
an agent through many separate decisions over time. Moreover, a
principal’s decision to allocate a certain budget for some purpose to an
agent is in essence an investment decision.
3.1.2 Learning investments
As discussed in an earlier chapter, resources can be invested in either
production and are based on either repeating existing knowledge or
learning new knowledge. A principal can determine which part of the
resources, if any, to invest in learning new knowledge that is likely to take a
long time to generate income. Such learning is based on the following
definitions. Learning refers to the acquisition of knowledge that is new to a
person or firm (e.g., Cohen and Levinthal, 1990; Huber, 1991; March, 1991).
Such knowledge can be already possessed by someone else, or it can be
entirely novel to the world and not known to anyone. If the existing
resources are not allocated to learning, it is assumed that they will be
allocated to alternatives including consumption, saving, or production or
operations that rely solely on the use of knowledge that is already possessed
by an individual or a firm. The long period of time to generate income
relates to managerial myopia, which can be caused by short-term financial
control (Hoskisson and Hitt, 1988; Hoskisson et al., 1993). Typically, the
maximum target period for short-term financial control is one year.
Investments in learning that take longer to generate income cause only a
cost for short-term financial performance. Thus, short-term financial
control provides a weak incentive for investments in such learning. In this
study, long periods of time to generate income refer to periods of time that
are longer than the maximum periods that are used for short-term financial
control, and those periods typically last for more than one year.
In learning new knowledge, it is typically difficult to predict perfectly what
needs to be done to succeed in learning or how much time such learning
will take (e.g., Levitt and March, 1988; Levinthal and March, 1993).
Learning is typically initiated based on a number of assumptions and
probability estimates on the relationships between the factors that are
related to the learning. As the learning progresses, the relationships
between the factors become more accurate and new factors are identified,
both of which create a need for deciding in detail the next steps that should
be taken to allocate the resources among a number of learning alternatives.
Moreover, such decisions emerge frequently, and they are numerous. Thus,

Theory and hypotheses
61
many investment decisions of various sizes need to be made during the
process of learning, and they all influence the amount of eventual expected
income and its probability distribution.
If a principal makes learning investments directly without delegating any
to an agent, the principal’s investments in learning are determined by a
number of factors that were reviewed above in the chapter on investments
in learning. However, the principal usually delegates some decisions on a
learning investment to the agent. In this case, the principal can use
budgeting for investments in learning. When the principal identifies an
opportunity to generate future income through learning new knowledge,
the principal delegates a certain budget and other resources so the agent
can take advantage of the opportunity. In essence, the principal makes an
investment in learning by such resource allocation. As the learning
progresses, the principal can make new investments by allocating more
resources to the agent. When the principal delegates some decisions about a
learning investment to the agent, the principal’s income from the learning
depends on how the agent makes decisions to choose between various
alternatives.
In large organizations, the lower levels also experience the most direct
exposure to the market. Such exposure helps to identify new opportunities
for learning, for example, ideas for new products or new production
techniques. The lower levels of an organization also include most of the
employees in large organizations. Thus, the lower levels of an organization
have the potential to identify a large number of opportunities for learning
new knowledge to generate future income. On the other hand, employees at
the lower levels of an organization usually have limited budgets and need to
request additional budgeting o make investments in learning. As a result, in
addition to initiating learning investments that are based on a principal’s
own ideas, the principal can receive proposals for learning investments
from an agent. Because the income a principal derives from learning
investments depends on the amount of proposals for learning that are
submitted by agents, the principal’s income from learning investments
depends on how able and motivated the agents are to present such
proposals.
3.1.3 The limitations that are caused by managerial myopia
As discussed above, a principal’s investments in learning depend on an
agent’s actions. In particular, it depends on how many proposals an agent
makes for learning investments and how the agent allocates the budget
delegated by the principal. When choosing investments to propose to the

62
principal, or to implement with the budget that was delegated by the
principal, the agent can choose between investments that are expected to
take different amounts of time to generate income. Some investments have
the potential to produce income in shorter time periods than others. The
agent’s preference for different investment alternatives with different time
horizons depends on how the principal controls the agent. If the agent is
mainly directed by financial control, the agent’s evaluated performance can
be decreased by investments in learning new knowledge that is likely to
take a long time to generate income. If the agent is under short-term
pressure, the agent may respond with myopic behavior.
An agent has several means of avoiding investments in learning new
knowledge that is likely to take a long time to generate income. When the
agent identifies an opportunity for learning new knowledge that has the
potential of generating income or addressing a threat to the
competitiveness of existing production, the agent can ignore the
opportunity and never request any budget for such learning. Because such a
budget would just add a cost to the agent’s short-term financial
performance, the agent is better off not requesting such a budget. Second,
when a principal delegates an agent with some resources for learning, the
agent can either minimize actual expenditures or direct learning for
projects that will produce income as quickly as possible. The agent can
minimize actual expenditures, for example, by quickly concluding that a
learning opportunity is less attractive than initially estimated and
proposing a discontinuation of the learning. To accelerate the production of
income from a learning investment, the agent can direct the learning
towards quick wins that sacrifice higher income in the longer term. For
example, the agent can address the pressure from competitors through low-
cost incremental improvements to support sales in the short-term, when a
more substantial investment in developing new technology is needed (e.g.,
Christensen and Bower, 1996). In conclusion, if an agent is subject to
managerial myopia, the agent can limit investments in learning new
knowledge that is likely to take a long time to generate income. Because the
principal has delegated most of the resources to the agent, the principal’s
investments in learning are also limited if the agent experiences pressures
that are caused by managerial myopia.
As discussed above, the principal can resort to a number of control
mechanisms, such as equity-based incentives, board monitoring, or
strategic controls, to limit managerial myopia if the principal is a
shareholder or a CEO. However, if the principal is a manager whose
position is lower in the organization, the principal has much fewer tools for

Theory and hypotheses
63
controlling managerial myopia, which limits the investments in learning
new knowledge that is likely to take a long time to generate income.
3.1.4 The determinants of investments in leaning
A principal is expected to have little reason to invest in anything unless he
or she understands how the invested resources can provide an attractive
income relative to the other opportunities to which the resources could be
allocated. To be able to understand the income potential of a learning
investment, a principal needs to understand both the related learning
opportunity and the competence and motivation of an agent to manage the
delegated resources. If the principal does not have adequate information for
such an understanding, the principal is unlikely to invest in the
opportunity. Thus, any information that can help the principal to better
understand the learning opportunity and the agent’s competence and
motivations are likely to increase the probability that the principal makes
investments in learning new knowledge that is likely to take a long time to
generate income.
In addition, improved control against managerial myopia is expected to
increase the principal’s investments in learning new knowledge that is likely
to take a long time to generate income. Such improved control encourages
the agent to request resources for learning investments. Improved control
against managerial myopia also motivates the agent to allocate the
resources that have been delegated to the agent in investments in learning
new knowledge that is likely to take a long time to generate income.
In conclusion, a principal’s investment in learning new knowledge that is
likely to take a long time to generate income is increased by (1) any
information that can help the principal to better understand the learning
opportunity and an agent’s competence and motivations, and (2) improved
control against managerial myopia.

64
3.2 Written ex ante reasoning as a control mechanism
3.2.1 Strategic controls
The past research on corporate internal controls has investigated how the
corporate management of a multidivisional firm can apply strategic
controls for the divisional management that reports to the corporate CEO
(e.g., Gupta, 1987; Hill and Hoskisson, 1987; Baysinger and Hoskisson,
1989, 1990; Hitt et al., 1990; Goold and Quinn, 1990; Hoskisson et al., 1991,
1993; Johnson et al., 1993; Hitt et al., 1996; Barringer and Bluedorn, 1999).
The research on strategic controls contends that strategic controls help
division managers to take on risky strategies because they feel that
corporate management understands such strategies. Strategic controls
allow for a focus on long-term performance because division managers
expect to be evaluated based on the quality of their strategies rather than on
short-term financial performance alone. In conclusion, strategic controls
are an effective control mechanism for curbing managerial myopia by
division managers and thereby to help a CEO increase a divisions’
investments in learning new knowledge that is likely to take a long time to
generate income.
Strategic controls can be regarded as one monitoring mechanism in terms
of agency theory, but they involve a unique element that is not included in
any of the other controls that are discussed in the corporate governance or
organizational control literature. This unique element of strategic control is
that division management is evaluated based on the quality of a strategic
plan before the strategy is actually implemented. Despite the eminence of
strategic controls for curbing managerial myopia, the research on strategic
controls has focused on strategy making and the apex of the firm. In this
study, the concept of strategic controls is extended beyond such past focus
by examining how similar mechanisms can be applied for controlling
activities other than strategy making at the lower organizational levels.
3.2.2 The definition of written ex ante reasoning
In making a decision on delegating the agent’s decision rights to allocate
resources, a principal can ask an agent to write a plan that describes and
reasons income potential from the resources before the plan is actually
implemented. Such a plan is defined as a written ex ante reasoning of an
investment’s income potential. A written ex ante reasoning can outline the
cause-and-effect relationships that exist between future income and the

Theory and hypotheses
65
factors that influence it. Examples of such plans include, but are not limited
to, a strategic plan that is used for strategic controls or a business plan that
is written for an entrepreneurial venture (e.g., MacMillan and Narasimha,
1987; Hormozi et al., 2002; Martens et al., 2007; Kirsch et al., 2009). A
written ex ante reasoning is a control mechanism that can be applied for
any type of investment at any organizational level.
To experience the full benefit of a written ex ante reasoning as a control
mechanism, the principal needs to (1) evaluate the written ex ante
reasoning that was prepared by the agent, (2) monitor ex post the
realization of the learning relative to the written ex ante reasoning, and (3)
ask the agent to revise the written ex ante reasoning frequently.
3.2.3 Improved knowledge of investment and agent competence
Asking an agent to prepare a written ex ante reasoning allows a principal
to use it to evaluate both the investment opportunity and the competence of
the agent. As discussed above, any information that helps the principal to
better understand how an investment can generate income increases the
probability that the principal will make the investment. As with strategic
and business plans, any other type of written ex ante reasoning helps the
principal to understand the various factors and causal relationships that are
related to a learning investment and then to estimate the potential income
that is to be gained from the learning investment. Therefore, a written ex
ante reasoning is expected to increase the probability that the principal will
make an investment. However, the principal also needs to be convinced
that managerial myopia by the agent can be adequately curbed.
The research on strategic controls contends that strategic controls help
division managers to take on risky strategies because the division managers
feel that corporate management understands such strategies and evaluates
the division managers based on the strategies (Baysinger and Hoskisson,
1990; Hitt et al., 1996). Similarly, a principal can use a written ex ante
reasoning to evaluate an agent’s competence in generating income for the
principal. To use a written ex ante reasoning to evaluate the competence of
the agent, the principal needs to (1) evaluate the written ex ante reasoning
for the competence of the agent, (2) monitor ex post the realization of the
learning process relative to the written ex ante reasoning, and (3) ask the
agent to revise the written ex ante reasoning frequently. Each step of this
process is outlined in detail below.
A principal can use a written ex ante reasoning to evaluate the
competence of an agent. The factors and causal relationships and related
assumptions that are identified in the written ex ante reasoning reflect the

66
knowledge and competence of the agent. The past research has found that
individuals can identify others who can contribute novel insights, and they
tend to return for more advice from such contributors (Sutton and
Hargadon, 1996; Hendry, 2002; Cross and Sproull, 2004). A written ex
ante reasoning that includes information that is novel to the principal
indicates that the agent has knowledge that is valuable to the principal. This
evidence of novel knowledge is a possible reason for the principal to hire
the agent. On the other hand, if an agent ignores or omits certain factors or
causal relationships of which a principal is aware and expects to influence
the income from an investment, the principal has a reason to doubt
whether the agent can make decisions that can maximize potential income.
This evidence of faulty or missing knowledge reduces the value of the agent
and decreases the principal’s reasons to delegate resources to that agent
and possibly even the need to hire the agent. By identifying both the
contribution and the weaknesses of a written ex ante reasoning that was
prepared by an agent, a principal can better evaluate the competence of the
agent and how the competence influences potential income from learning
investments. This process helps the principal to decide whether to hire the
agent and to delegate resources to the agent or invest resources in other
alternatives. The more detail that an agent provides through a written ex
ante reasoning, the more likely it is that it will contain information that is
novel to a principal. Thus, the quantity of the written ex ante reasoning is
expected to increase the likelihood that the principal evaluates the agent to
be competent and to delegate resources to the agent.
The principal needs to follow an analysis of the written ex ante reasoning
with the monitoring of the actual learning actions for several reasons
(Schreyögg and Steinmann, 1987; Goold and Quinn, 1990). First,
monitoring the realization of learning relative to the written ex ante
reasoning helps a principal to increase his or her own knowledge, which can
help the principal to identify new opportunities. Second, the principal can
compare the realization against the earlier estimates of an agent to evaluate
the competence of the agent in identifying the factors that are critical to the
learning investment. The third benefit from monitoring the realization of
the learning investment relative to the written ex ante reasoning is related
to ensuring that the agent does not mislead the principal. If a principal asks
only for a written ex ante reasoning from an agent but does not check the
agent’s actual ex post actions, the agent may be tempted to deceive the
principal by allocating resources for improving short-term income rather
than allocating them in accordance with the written ex ante reasoning. To
avoid this problem, the principal can check the agent’s actual resource
allocation against the written ex ante reasoning at some point. However,

Theory and hypotheses
67
the agent may have good reasons to act against the ex ante plan, but the
principal can take such differences into account, as explained below.
Unforeseen factors are common in learning new knowledge that is likely
to take a long time to generate income (e.g., Levitt and March, 1988;
Levinthal and March, 1993). Mintzberg (1994) suggested that such an
approach of sticking with an original plan was widely used in strategic
planning in the past but the success rates of learning investments were low
because all of the relevant factors in complex environments could not be
easily identified. Instead, learning investment success can be improved by
planning learning investments in successive steps (Ruefli and Sarrazin,
1981; Cooper and Kleinschmidt, 1986; Schreyögg and Steinmann, 1987;
Cooper, 1990; Block and Macmillan, 1993; McGrath and MacMillan, 1995;
Mosakowski, 1997; McGrath and MacMillan, 2000a).
In line with such learning in phases, a principal can ask an agent to revise
a written ex ante reasoning frequently based on the experiences and
resolutions of uncertainty from the learning process. This revision of the
written ex ante reasoning can be combined with the monitoring of the
realization of the written ex ante reasoning in each phase. In particular,
such monitoring also provides the agent an opportunity to explain possible
deviations from the plan based on experiences and resolutions of
uncertainty from the learning process. Such explanations can help the
principal to better evaluate if any of the deviations suggest the possibility of
managerial myopia by the agent to minimize investments in learning new
knowledge that is likely to take a long time to generate income. In addition,
asking the agent to revise the written ex ante reasoning adds to the quantity
of written ex ante reasoning, which can improve the principal’s evaluation
of the agent’s competence by providing more information that is novel to
the principal.
In summary, a written ex ante reasoning provides a principal with the
means to evaluate an agent’s competence. A written ex ante reasoning is
always related to a specific investment opportunity. However, the past
research suggests that an individual who demonstrates the competence to
learn valuable knowledge is likely to be able to also learn valuable
knowledge in the future (e.g., Sutton and Hargadon, 1996; Hendry, 2002;
Cross and Sproull, 2004; Nebus, 2006; Gompers et al., 2010). Therefore,
even if a principal can evaluate an agent’s competence only in ways that are
related to the specific investment for which the written ex ante reasoning
was prepared, it is also likely to help the principal to estimate how the agent
is likely to manage other types of investments. In conclusion, a written ex
ante reasoning helps a principal to better determine what type of resources
to delegate to an agent in the future.

68
3.2.4 Controlling against managerial myopia
The research on strategic controls contends that strategic controls help
division managers to take on risky strategies because division managers feel
that corporate management evaluates the division managers based on the
strategies they present (Baysinger and Hoskisson, 1990; Hitt et al., 1996).
Similarly, a written ex ante reasoning provides a principal with a
mechanism to limit managerial myopia in an agent and to motivate the
agent to invest resources in learning new knowledge that is likely to take a
long time to generate income. This gain is possible because the written ex
ante reasoning helps the principal to better evaluate the agent’s competence
to take actions that improve the principal’s income according to the
principal’s preferences. This evaluation of the agent’s competence helps the
principal to improve upon the evaluation of the agent’s competence based
on financial control. As a result, the agent can also demonstrate value to the
principal by means other than simply maximizing short-term financial
performance. Therefore, the agent need not avoid investments that burden
short-term financial performance.
An agent can actually benefit from making investments in learning new
knowledge that is likely to take a long time to generate income when such
investments most improve a principal’s expected income. By making such
investments and preparing related a written ex ante reasoning, the agent
can demonstrate that he or she is valuable to the principal. Being regarded
as a valuable agent to the principal, the agent can expect the principal to
have a reason to hire the agent to manage resources in the future. The
principal may even increase the agent’s wage or promote the agent to
manage additional resources that are delegated by the principal. In
conclusion, a written ex ante reasoning provides the principal with a control
mechanism to curb managerial myopia by the agent and to motivate the
agent to invest resources in learning new knowledge that is likely to take a
long time to generate income.
Because both the quantity of a written ex ante reasoning and the
frequency of its revision increase the likelihood that a principal will find an
agent to be competent, they are also expected to improve an agent’s
motivation to invest in learning new knowledge that is likely to take a long
time to generate income.

Theory and hypotheses
69
3.2.5 Effects on investment in learning
In summary, asking an agent to prepare a written ex ante reasoning
provides a principal with information that helps him or her to better
understand the learning opportunity and the agent’s competence. This
increases the principal’s investments in learning new knowledge that is
likely to take a long time to generate income in several ways. First, because
the principal understands the investment opportunity better, the principal
is more likely to allocate the needed budget and to delegate it to the agent
who wrote the specific ex ante reasoning. Second, because the principal can
control better managerial myopia, the agent is likely to better manage the
delegated resources according to the principal’s interests and to invest a
larger proportion of those resources into learning new knowledge that is
likely to take a long time to generate income. Third, the reduction in
managerial myopia increases the likelihood that the agent will propose
requests for additional resources for new opportunities for investments in
learning new knowledge that is likely to take a long time to generate
income. Fourth, because the principal has a better understanding of the
competence of the agent, the principal can better evaluate new resource
requests from the agent, which increases the probability that the principal
will approve the agent’s new proposals for investments in learning new
knowledge that is likely to take a long time to generate income.
In conclusion, the quantity of written ex ante reasoning and the frequency
of revisions are expected to increase both an agent’s and eventually a
principal’s investments in learning new knowledge that is likely to take a
long time to generate income. Moreover, because a principal typically
employs several agents, the principal’s investments in learning depend on
the quantity of written ex ante reasoning and the frequency of revisions by
all of the agents who are employed by the principal. The effect of the written
ex ante reasoning on the investments by the principal and the agent can be
summarized in following hypotheses.
Hypothesis 1: Investments by (i) an agent and (ii) a principal in
learning new knowledge that is likely to take a long time to
generate income are positively related to the quantity of written
ex ante reasoning of an investment’s income potential.
Hypothesis 2: Investments by (i) an agent and (ii) a principal in
learning new knowledge that is likely to take a long time to
generate income are positively related to the frequency of

70
revisions of written ex ante reasoning of an investment’s income
potential.

Theory and hypotheses
71
3.3 Reviewers as control mechanism
3.3.1 The board of directors as a basis
The corporate governance literature identifies the board of directors as
the main mechanism for monitoring management in firms (Pfeffer, 1972;
Pfeffer and Salancik, 1978; Fama, 1980; Fama 1983a, 1983b; Zahra and
Pearce, 1989). The board of directors also counsels management, makes
critical decisions about a firm’s strategy and operations, provides the firm
with access to commitments from external organizations, and improves the
legitimacy of the firm. Such activities by the board can limit managerial
myopia of the firm’s top management together with equity-based
incentives. However, the literature on corporate governance and the board
of directors has focused on the apex of the firm. The literature on
organizational control at lower organizational levels does not identify
control mechanisms that are similar to the board of directors. Instead, it
assumes that the agents at lower levels of organizations are monitored by
the one principal who controls each agent.
On the other hand, Fama and Jensen (1983a) suggest that when lower
level agents “interact to produce outputs, they acquire low-cost information
about colleagues, information not directly available to higher level agents.”
They continue by arguing that “if agents perceive that evaluation of their
performance is unbiased … then they value the fine tuning of the reward
system that results from mutual monitoring information, because it lowers
the uncertainty of payoffs from effort and skill.” However, Fama and Jensen
do not develop this idea further and provide no details on how such mutual
monitoring works. Nevertheless, the idea suggests that perhaps it is not
only the principal at the apex of a firm but also the principals at the lower
organizational levels who can benefit from others monitoring the agent.
This study extends the past research by investigating how principals at the
lower organizational levels can benefit from others to curb managerial
myopia in their organizations.
3.3.2 The definition of reviewers
Just as the shareholders of a firm can hire several board members to
monitor the CEO, a principal at any organizational level can hire one or
several individuals to monitor an agent. Such individuals are defined as
reviewers. The principal can ask the reviewers to take on most of the roles
that are held by a board of directors. Reviewers can monitor the agent. In

72
monitoring the agent, the principal can ask the reviewers to give their
opinions, supporting the principal in the evaluation of income potential
from resources that have been delegated to the agent and the agent’s
competence in managing such resources. In particular, the principal can
ask the reviewers to analyze any ex ante reasoning that has been prepared
by the agent.
In addition to the monitoring, the principal can ask the reviewers to
counsel the agent. This is similar to the board members roles of counseling
management. Reviewers are likely to have different knowledge sets than the
principal, and the agent can utilize their knowledge in helping the agent to
manage the resources that have been delegated to him or her. As with board
members, reviewers can also utilize their contacts to facilitate cooperation
between the agent and the contacts. Moreover, as with board members,
reviewers can be hired only as part part-time resources.
As with board members, reviewers can be characterized by their quantity
and qualities such as tenure and social ties. Such characteristics are
discussed in detail in the following section. However, a number of
differences between reviewers and board members are first discussed in the
present section.
The relationship between the reviewers and the principal differs from the
relationship between the board of directors and shareholders in one critical
respect. Whereas board members are accountable to a group of
shareholders, reviewers are accountable not to a group but only to one
individual, the principal. This difference can result in a number of
differences between reviewers and the board of directors.
A group of shareholders can suffer from the free rider problem, which
makes it more difficult for shareholders to control a board of directors. In
contrast, when the principal is only one individual, such a free rider
problem does not exist. Thus, the principal is expected to be able to control
the reviewers better than shareholders can control the board of directors. In
other words, it is expected to be easier for the principal to motivate
reviewers to take actions that are aligned with the principal’s preferences
than it is for shareholders to motivate the board members to actions that
are aligned with the shareholders’ preferences. In essence, reviewers have
an agent relationship to the principal, and the principal can control
reviewers in the ways that he or she can control agents.
Because, unlike board members, reviewers report only to one principal,
reviewers may be given fewer delegation rights than board members.
Shareholders typically delegate a board of directors with rights to many
critical decisions because the alternative of a large group of shareholders
making such numerous decisions is difficult in practice. On the other hand,

Theory and hypotheses
73
because the principal is one individual, the principal does not suffer from
such a difficulty in making decisions. Thus, the principal has less of a need
to delegate formal decision rights to the reviewers over the agent who they
are reviewing. In particular, the principal can, but need not, keep all of the
decision rights over the agent and delegate none of them to reviewers.
3.3.3 The number of reviewers
The past research on boards has identified board size as a determinant of
a board’s effectiveness in its role. Increasing the size of a board is likely to
increase gains such that each additional board member adds to a pool of
available expertise and resources (e.g., Pfeffer, 1972; Pfeffer and Salancik,
1978; Goodstein et al., 1994; Dalton et al., 1999). Further, larger boards can
represent more diverse stakeholders and help a firm to cooperate with more
stakeholders. On the other hand, the past research has identified many
problems with increasing board size such as free riding and the difficulty of
reaching a consensus due to diverse opinions and coalitions. As the number
of directors increases, each director can have less of an influence on the
board’s decisions, which decreases the reputational gains or costs of the
board performance on each individual director (Golden and Zajac, 2001;
Hermalin and Weisbach, 2003). As a result, board members are more likely
to commit free riding, which decreases the effectiveness of the board.
Increasing board size also increases the number of opinions that are
expressed on the board, which makes it more difficult for the board to
arrive at an adequate consensus that is needed to reach decisions
(Goodstein et al., 1994).
The results from the empirical studies on the effect of board size on
activities related to learning new knowledge support the existence of both
benefits and costs of increasing board size. Goodstein et al. (1994) did not
find any effect of board size on a firm’s strategic change in the form of
product scope changes, whereas Golden and Zajac (2001) found that board
size first increases strategic change, but it begins to decrease for larger
boards. Cheng (2008) found that larger board size decreased firm R&D
expenditures.
As with the number of board members, the number of reviewers can also
increase the combined expertise and contacts that are available from the
reviewers. As discussed above, any information that helps a principal to
better understand how an investment can generate income increases the
probability that the principal will make an investment. Because reviewers
have different experiences than the principal and the agent, they are likely
to identify new factors and causal relationships that are related to learning
74
opportunities. This gain can help the principal to better understand an
investment and its potential income and also the competence of the agent.
As discussed above, the improved evaluation of an agent’s competence can
limit managerial myopia by the agent and motivate the agent to allocate
resources to learning new knowledge that is likely to take a long time to
generate income.
In addition to helping the principal to better understand the investment
and the agent’s competence, reviewers can make suggestions to change
learning plans to improve expected income from learning. Reviewers’
experience and knowledge allow them to counsel the agent with new insight
into improving learning plans. In addition, reviewers may have contacts to
other principals who control resources that can contribute to the learning
that is managed by the agent. In this case, reviewers can facilitate the
cooperation between the agent and other resource owners, which can
further improve the expected income that is derived from the learning. In
conclusion, reviewers can improve the expected income that is derived from
learning through counseling and the facilitation of cooperation with other
resource owners. Such an increase in expected income makes the
investment more attractive to the principal and the agent and thereby
increases the probability that the principal and the agent will invest in
learning new knowledge that is likely to take a long time to generate
income.
On the other hand, the increasing number of reviewers is expected to
cause fewer problems from free riding and the difficulty of consensus due to
diverse opinions and coalitions than the increasing number of board
members. There are several reasons for this difference. First, as discussed
above, the principal is an individual who can better control the reviewers
than a group of shareholders can control a board of directors. The principal
can ask for each reviewer’s contribution and evaluate the benefits from each
reviewer’s separate evaluation rather than evaluating a joint conclusion by a
group of reviewers. Thus, the principal can better motivate individual
reviewers to make substantive contributions through more in-depth
reviews. Second, if the reviewers cannot make decisions due to a lack of
consensus, it is relatively easy for the principal to make the decision
instead. This is in contrast to shareholders, for whom it is typically difficult
to make decisions when a board of directors cannot make them. Moreover,
as discussed above, the principal is likely to delegate fewer decision rights
to reviewers than shareholders typically delegate to boards of directors.
Thus, there are likely to be fewer decisions for which the reviewers need to
find consensus.

Theory and hypotheses
75
In conclusion, like the increasing number of board members, an
increasing number of reviewers can improve the reviewers’ role. On the
other hand, the effectiveness of the reviewers is expected to be more
immune to the problems of free riding and difficulty of consensus. As a
result, the number of reviewers is expected to increase investments in
learning new knowledge that is likely to take a long time to generate
income. This process is summarized as the following hypothesis.
Hypothesis 3: Investments by (i) an agent and (ii) a principal in
learning new knowledge that is likely to take a long time to
generate income are positively related to the number of
reviewers.
3.3.4 A reviewer’s mutual reviewing tenure
Previous research on boards of directors has investigated how board
tenure homogeneity influences the effectiveness of the board. On the one
hand, boards that consist of many members with long mutual tenures
possess a high level of firm-specific knowledge and skills and they maintain
higher levels of cohesiveness through which to utilize their skills (Alderfer,
1986; Singh and Harianto, 1989; Forbes and Milliken, 1999). On the other
hand, the past research contends that boards with long mutual tenures
suffer from various problems (Kosnik, 1990; Mallette and Fowler, 1992;
Johnson et al., 1993; Golden and Zajac, 2001; Tuggle et al., 2010a). Long-
tenured boards develop pressures for conformity, which can reinforce
compliance and commitment to the status quo and impede the search for
multiple alternatives. Board members with similar tenures share the same
board experience, which can create biased perceptions and increase
groupthink. The increased rigidity of homogeneous tenure is likely to limit
a board’s ability to make strategic changes when needed.
An investigation by Kosnik (1990) found that average board tenure
increased the boards’ resistance to greenmail, indicating improved
monitoring by boards. Carpenter and Westphal (2001) found that board
average tenure was positively related to both monitoring and counseling in
stable environments but only for counseling and not monitoring in unstable
environments. Mallette and Fowler (1992) proposed a curvilinear
relationship between the average board tenure and a firm’s resistance to
poison pills, but they found neither significant curvilinear nor linear effects.
Golden and Zajac (2001) proposed a curvilinear effect of average board

76
tenure on strategic change based on the argument that tenure brings both
benefits and costs. They found support for the curvilinear relationship.
As in the case of board members, mutual tenure between reviewers is
expected to help them to achieve higher levels of cohesiveness to allow
them to utilize their different knowledge and skills. With increased mutual
tenure, reviewers may learn how to best utilize their varying knowledge in
evaluating the investments that are proposed by an agent and the
competence of the agent. Similarly, as reviewers learn to work together and
to utilize each other’s strengths, they are also likely to be more capable of
developing new insights into improving learning plans and opportunities
for facilitating cooperation with external resource owners. In summary,
such gains are expected to increase a principal’s and an agent’s investments
in learning new knowledge that is likely to take a long time to generate
income.
However, similar to board members, reviewers with long mutual tenure
can begin to suffer from problems that can reduce their effectiveness. As
reviewers work together, their knowledge starts to increasingly overlap, and
they may benefit less from the variety in their individual knowledge sets. As
a result, reviewers have fewer benefits that are related to their combined
knowledge in evaluating investments and agents. This process can reduce
the reviewers’ contributions to the principal and the agent. The reviewers
may even develop groupthink, which can reinforce compliance and
commitment to the status quo and impede the search for multiple
alternatives. Therefore, the positive effect from mutual tenure may begin to
decrease above some limit.
The possible effects of the average tenure of reviewers are summarized as
the following two alternative hypotheses.
Hypothesis 4a: Investments by (i) an agent and (ii) a principal
in learning new knowledge that is likely to take a long time to
generate income is positively related to reviewers’ mutual
reviewing tenure.
Hypothesis 4b: Investments by (i) an agent and (ii) a principal
in learning new knowledge that is likely to take a long time to
generate income have an inverted U relationship with reviewers’
mutual reviewing tenure.

Theory and hypotheses
77
3.3.5 Reviewers’ reviewing tenure with the agent
Previous research on boards of directors has investigated how board
members’ tenure with a CEO influences the effectiveness of the board
(Alderfer, 1986; Singh and Harianto, 1989; Sundaramurthy, 1996; Shen,
2003; Kor, 2006; Dalton et al., 2007). This research argues that board
members with long tenure are more likely to have become friendly with
management, compromising their effectiveness in monitoring.
Similarly to boards, reviewers are also likely to develop deeper social ties
over time with the agent whom they are reviewing. Therefore, their ability
to objectively evaluate the competence of the agent can suffer. As a result, a
principal is expected to be less able to rely on the reviewers for evaluating
the competence of an agent. Additionally, the agent is likely to be aware of
this lack of credibility of the reviewers. Because the principal can depend
less on the reviewers for evaluating the competence of the agent, the agent
cannot be as confident that the principal can properly evaluate him or her.
This situation can make the agent more hesitant about making investments
in learning new knowledge that is likely to take a long time to generate
income. Similarly, in such cases, the principal is less likely to make such
investments by allocating resources to the agent. In summary, reviewers’
reviewing tenure with an agent is likely to reduce the value of the reviewers
in curbing managerial myopia and decrease investments in learning new
knowledge that is likely to take a long time to generate income.
On the other hand, as reviewers learn to know an agent better, they are
likely to develop a better sense of the agent’s competence. If the reviewers
also have an ability to convincingly justify the competence of the agent to
the principal, the reviewers may be able to improve the principal’s
evaluation of the agent’s competence. In addition, becoming more familiar
with the agent is likely to improve the reviewers’ ability to counsel the
agent, which can help the agent to improve learning opportunities and the
potential income they can generate. Reviewers that are more familiar with
an agent can also better support the agent by utilizing their contacts to
cooperate with the agent and thereby improve income potential from
learning investments. The improved income potential from learning
investments increases their attractiveness to the agent and the principal,
and thus, this situation is likely to increase the probability that such
investments a made. In summary, reviewers’ reviewing tenure with an
agent can also increase investments in learning new knowledge that is likely
to take a long time to generate income.
In conclusion, reviewers’ reviewing tenure with an agent can have two
opposing effects on investments in learning new knowledge that is likely to

78
take a long time to generate income. These effects are summarized as the
following alternative hypotheses.
Hypothesis 5a: Investments by (i) an agent and (ii) a principal
in learning new knowledge that is likely to take a long time to
generate income are positively related to reviewers’ reviewing
tenure with the agent.
Hypothesis 5b: Investments by (i) a principal and (ii) an agent
in learning new knowledge that is likely to take a long time to
generate income are negatively related to reviewers’ reviewing
tenure with the agent.
3.3.6 Reviewers’ ties to external reviewers
The research on interlocks by boards of directors suggests that board
members can have appointments on boards at multiple firms (Pfeffer and
Salancik, 1978; Burt, 1980). Through their various directorships, board
members have access to information that is available in other firms. Each
appointment exposes the director to different information and,
consequently, the amount of knowledge that is possessed by a board
director is positively related to the number of his or her board
appointments. However, in addition, when directors communicate with
other directors on the boards of other firms, they are also exposed to
knowledge that is possessed by such external directors. Through such
interlocking contacts to external directors in other firms, the board
members have access to the knowledge of those external directors. Board
members’ ties to external directors expand their sources of information to
include those of the other firms to which the external directors are
affiliated, for example, through their boards or managerial roles at the
other firms (Carpenter and Westphal, 2001).
The information from board members and their ties to external firms and
directors has several advantages over the information that is acquired from
other public or more formal sources. The information that is acquired
through interlocks is typically more up-to-date than the information that is
acquired from secondary sources. In addition, in contrast to the
information that is made available through other channels, interlocks can
provide especially influential information because they are inexpensive,
trustworthy, and credible information sources (Davis, 1991; Haunschild,
1993; Haunschild and Beckman, 1998).
Theory and hypotheses
79
The information that is acquired from interlocks benefits a firm in several
ways. The information from interlocks can help the firm to notice and
respond to environmental changes more rapidly (Davis, 1991). Geletkanycz
and Hambrick (1997) suggest that external interlock ties can provide
information that shapes management’s views on the environment and adds
ideas for strategic choices. In addition to being a source of information for
strategy making and for imitating the practices of other firms, interlocks
can also provide resources to facilitate cooperation with other firms (e.g.,
Pfeffer and Salancik, 1978; Burt, 1980). Finally, interlocks can also spread
the reputation of the firm’s management. Gulati and Westphal (1999) note
how interlocks can be used to spread knowledge about the abilities and
efforts of the individuals who are involved in the interlock. In conclusion,
the increasing number of ties to external directors through other board
appointments increases the knowledge that possessed by board members.
Such information provides multiple gains for the firm.
Like board members, reviewers can also establish ties to other reviewers
through their various reviewer appointments. Principals can hire different
reviewers for the evaluation of different investments and agents. As a result,
an organization with multiple principals has a large number of review tasks
with differing compositions of reviewers. Because different types of tasks
have different combinations of reviewers and reviewers can be involved in
several review tasks, a rich network of ties between the reviewers can
develop over time. In particular, the reviewers who are nominated by the
principal for a certain current review task can each have experiences of
other reviewer tasks. Further, such experiences of other review tasks
provide the reviewers with ties to other reviewers who are not involved in
the current review task. Such other reviewers are defined as external
reviewers for this study. In other words, each reviewer of a given review
task has also a number of ties to external reviewers from other review tasks.
Each reviewer can have a number of ties, and in total, the reviewers for a
given task may have ties to a number of external reviewers. The number of
the combined ties of the reviewers of a given review task is defined as the
number of reviewers’ ties to external reviewers.
Reviewers’ ties to external reviewers provide benefits similar to board
members’ ties to other directors through multiple interlocks. In particular,
reviewers’ ties to external reviewers increase the amount of information
available to the reviewers. The increased amount of information helps the
principal to better understand an investment and the competence of the
agent. In addition, reviewers can make better suggestions to change
learning plans to improve expected income from learning. Moreover, as
with board interlocks, reviewers’ ties to external reviewers can also help the

80
reviewers to facilitate the cooperation between an agent and other resource
owners, which can further improve the expected income from the learning.
As discussed above, these types of information benefits can increase both a
principal’s and an agent’s motivation to invest in learning new knowledge
that is likely to take a long time to generate income.
In conclusion, a greater number of reviewers’ ties to external reviewers
can provide information benefits that can increase investments in learning
new knowledge that is likely to take a long time to generate income. This
effect is summarized as the following hypothesis.
Hypothesis 6: Investments by (i) an agent and (ii) a principal in
learning new knowledge that is likely to take a long time to
generate income are positively related to reviewers’ ties to
external reviewers.

Theory and hypotheses
81
3.4 Other factors that reduce managerial myopia
3.4.1 Attention to investments in learning
The literature on corporate governance proposes that the attention of a
board of directors is subject to the mechanisms that are proposed by an
attention-based view of a firm (e.g., Golden and Zajac, 2001; Tuggle et al.,
2010b). In the case of a board, the issues and answers are related to the role
of the board in monitoring, counseling, and providing resources. The firm
context and structures determine the issues and answers that draw the
attention of the board members. Tuggle et al. (2010b) studied how a
board’s attention depends on the context that is defined by a firm’s
performance and the structures that are related to the board’s composition,
in particular, duality. Golden and Zajac (2001) investigated how the
differences in a board’s attention to strategic and non-strategic issues
influences strategic change by a firm. They suggested that boards that pay
more attention to, that is, spend more time addressing strategic issues, are
more familiar with such issues and more inclined to make strategic changes
as a result. They found empirical support that attention to strategic issues
relative to non-strategic issues promoted strategic change.
In addition to board members, other principals in general are also subject
to the mechanisms that are proposed by the attention-based view of a firm.
Ocasio (1997) proposed that decision makers are more likely attend to
issues with greater value and relevance to an organization. A principal’s
attention is divided among a number of resource allocation decisions. A
principal is expected to pay most of his or her attention to the largest
investments that are the most critical in determining income (e.g.,
Chandler, 1962; Bower, 1970). A principal’s largest investments are likely to
raise even some attention from other principals at the higher organizational
levels. Such attention by higher organizational levels is likely to increase the
principal’s motivation to pay attention to relatively large investments. In
conclusion, the increased size of an investment is likely to increase the
attention that a principal gives to an investment.
The increased attention of a principal is expected to improve the
principal’s understanding of an investment. When the principal pays more
attention to an investment, the principal can better evaluate the income
potential of an investment. Such attention also makes the principal is also
better equipped to evaluate the competence of an agent, which encourages
the agent to invest in learning new knowledge that is likely to take a long
time to generate income. Additionally, the principal’s motivation to invest
in such learning is improved by his or her enhanced understanding of an

82
investment’s income potential and a reduced risk of managerial myopia by
the agent. In conclusion, the increasing attention by a principal increases
his or her investments in learning new knowledge that is likely to take a
long time to generate income. This concept is summarized as the following
hypothesis.
Hypothesis 7: An investment by (i) an agent and (ii) a principal
in learning new knowledge that is likely to take a long time to
generate income is positively related to the principal’s attention
to the investment.
3.4.2 Income decrease
Previous literature on learning suggests that an investment in learning is
influenced by a decrease in income from existing resources (e.g., Cyert and
March, 1963; Kahneman and Tversky, 1979; Staw et al., 1981; Singh, 1986;
Hundley et al., 1996; Mone at al., 1998; Greve, 2003, Chen and Miller,
2007; Chen, 2008). The effect of the income decrease on a learning
investment is not unequivocal, even in case of an autonomous principal
who is independent of any agency relationship. As concluded in section
2.4.2.3 above, there are conflicting pressures that can either increase or
decrease learning after an income decrease. An income decrease increases
the probability that the productivity of existing resources has decreased
permanently, which increases the relative attractiveness of a learning
investment. An income decrease may also provoke a behavioral response of
risk-seeking, which may make some learning investments attractive. On the
other hand, an income decrease can decrease the resources that are
available for investing, thereby decreasing investments in learning. A
decrease in the available resources also increases the threat to survival and
thereby increases risk aversion, which can decrease the attraction of
learning investments because of their higher probability of failure. In
conclusion, depending on the context, an autonomous principal who is
independent of any agency relationship can either increase or decrease
investments in learning when income decreases.
The effect of an income decrease on learning is affected further by the
existence of an agency relationship. If a principal controls an agent based
on short-term financial control, a decrease in the agent’s income implies a
decreased performance-contingent payment to the agent (Hoskisson and
Hitt, 1988; Walsh and Seward, 1990; Hoskisson et al., 1993). However, the
agent’s future income can be further decreased because a decrease in
income can be interpreted to indicate that the agent has inadequate
Theory and hypotheses
83
competence. As a result, an income decrease can decrease an agent’s future
career opportunities (Fama, 1980; Narayanan, 1985; Gibbons and Murphy,
1992; Holmström, 1999). A number of empirical studies have found
evidence that poor financial performance indeed increases the risk of agent
turnover (Schwartz and Menon, 1985; Morck et al., 1989; Grinyer and
McKiernan, 1990; Gilson and Vetsuypens, 1993; Daily and Dalton, 1995;
Chevalier and Ellison, 1999; McNeil et al., 2004).
Because an income decrease has a detrimental effect on an agent’s
competence evaluation and future career when a short-term financial
control is used, an income decrease strengthens the agent’s managerial
myopia. In other words, an income decrease decreases an agent’s
motivation to invest in learning new knowledge that is likely to take a long
time to generate income. When income decreases, an agent can offset the
decrease in his or her competence evaluation by increasing financial
performance over the subsequent period. The pressure for the necessity of
increasing income after an income decrease is intensified by the fact that it
is typical for control based on short-term financial performance that the
risk of dismissal of the agent increases considerable by any subsequent
income decreases. To keep his or her job, the agent is under pressure to
increase income after an income decrease.
To increase income, it is usually easier for an agent to decide to decrease
his or her own investments rather than to try to increase sales, which are
dependent on decisions by external players such as customers and
competitors. On the other hand, short-term sales usually require certain
expenditures and investments, and decreasing such costs can also reduce
sales, thereby making it more difficult to increase income. Therefore, an
attractive alternative to increasing income after an income decrease is to
decrease any investments that do not also decrease income in the short
term. As a result, after an income decrease, an agent is motivated to
decrease investments in learning new knowledge that is likely to take a long
time to generate income.
In conclusion, a decrease in income increases managerial myopia and
thereby decreases an agent’s investments in learning new knowledge that is
likely to take a long time to generate income. However, this study focuses
on examining how income decrease moderates the effects of control
mechanisms as hypothesized above in this study.
In this study, income decrease is expected to positively moderate the
positive effects of the control mechanisms hypothesized above. That is, the
use of written ex ante reasoning and reviewers can curb managerial myopia
increasingly after income decrease. This is because written ex ante
reasoning and reviewers help principals to better evaluate the competence
84
of agents on attributes other than short-term financial performance. As a
principal can evaluate an agent’s competence based on attributes other than
short-term financial performance, income decrease is likely to have a
relatively lesser impact on the evaluation of the agent’s competence. In
particular, the agent’s future career is less dependent on the agent’s ability
to increase income over the subsequent period. Thus, the agent has less
pressure to increase income by resorting to cutting investments in learning.
Therefore, managerial myopia is not increased as much after an income
decrease. In conclusion, the use of written ex ante reasoning and reviewers
reduces the increase in managerial myopia after an income decrease. In
other words, the effect of written ex ante reasoning and reviewers in
reducing managerial myopia is higher when income decreases rather than
when income increases.
Both the quantity of written ex ante reasoning and the frequency of
revisions improve a principal’s ability to evaluate the competence of an
agent for generating income from learning investments. Thus, the effects of
written ex ante reasoning and the frequency of revisions are increased when
income decreases. As discussed earlier, the number of reviewers improves a
principal’s evaluation of an agent’s competence. Similarly, reviewers’
mutual reviewing tenure helps them to better evaluate an agent’s
competence, which can help the principal’s evaluation, too. Also reviewers’
mutual tenure with an agent helps the reviewers to become more familiar
with the agent, which supports the evaluation by the principal. Finally,
reviewers’ ties to external reviewers also improve the reviewers’ ability to
contribute to the principal’s competence evaluation. In summary, all of the
mechanisms related to the reviewers help a principal better evaluate the
competence of an agent. Therefore, their effects are expected to increase
when income decreases. In addition, the principal’s attention to the
investment improves the principal’s ability to evaluate the agent, and this
effect is expected to be stronger when income decreases. In conclusion,
these effects can be summarized as the following hypothesis.
Hypothesis 8: The positive effects predicted by hypotheses H1
through H7 are expected to be amplified when income decreases.
3.4.3 The time required to generate income from learning investment
Previous research suggests that the time that it takes for a learning
investment to produce income varies between learning investments. March
(1991) identified two types of learning, exploration and exploitation: (a)

Theory and hypotheses
85
exploration includes “things captured by terms such as search, variation,
risk taking, experimentation, play, flexibility, discovery, innovation,” and
(b) exploitation includes “such things as refinement, choice, production,
efficiency, selection, implementation, execution.” March further noted that
exploration is more remote in time than exploitation but did not specify
such difference in more detail. Levinthal and March (1993) noted that some
learning is more distant in time than other. Additionally, the research on
technological changes has found that some learning investments take much
longer to generate income than others (e.g., Tushman and Anderson, 1986;
Christensen and Bower, 1996). A firm can make parallel learning
investments that require different lengths of time to generate income and
that aim to create successive generations of solutions. In other words, a
firm can simultaneously develop both a new next generation solution and a
solution that will later replaced the next generation solution. In conclusion,
different learning investments can require substantially different times to
generate income.
In this study, the long periods of time required to generate income refers
to periods of time that are longer than the maximum period used for short-
term financial control, which is typically more than one year. However,
there can be considerable variation in the amounts of time that are required
to generate income, even among investments that take more than one year
to generate income. For example, some investments in learning can aim at
generating income in two years, whereas others may be expected to take
longer than five years to generate any income.
An agent is expected to have different preferences for long-term learning
investments that require different lengths of time in generating income.
The longer the period of time that it takes for the potential income from an
investment to be produced, the less likely it is that an agent’s income will be
impacted by the learning. This is because a longer period of time will
increase the probability that the agent will experience a career move due to
promotion, dismissal, or other career event. As a result, the agent is
unlikely to be in a position in which income is significantly affected by the
outcome of learning new knowledge that is likely to take a long time to
generate income. Therefore, if an agent is evaluated based on financial
performance, the agent’s motivation to make a learning investment
decreases as the investment’s time to generate potential income increases.
However, the controls that are based on the use of written ex ante
reasoning and reviewers can curb such decreasing motivation as a function
of the time that is required for potential income to be produced by an
investment. This is because the use of written ex ante reasoning and
reviewers help a principal to evaluate an agent’s competence in terms of

86
attributes that extend beyond financial performance. As the principal can
also evaluate the agent’s competence based on other attributes than
financial performance, income decrease is likely to have a relatively lesser
impact on the evaluation of the agent’s competence. Thus, the agent has
fewer reasons to excessively determine the preference of investments based
on the time that is required for them to generate potential income.
Consequently, a principal’s capacity to evaluate an agent’s competence
beyond financial performance increases both the agent’s and the principal’s
investments in learning new knowledge that is likely to take a long time to
generate income. In addition, the principal’s investments are further
increased because the principal can better rely on the agent to manage
delegated resources adequately, which encourages the principal to delegate
more resources for learning to the agent.
In conclusion, the use of written ex ante reasoning and reviewers can
make learning investments that require increased time to produce income
more attractive to the principal and agent. The increasing attractiveness of
such investments is expected to increase a principal’s and an agent’s total
investments in learning new knowledge that is likely to take a long time to
generate income. Therefore, it can be hypothesized that the positive effects
predicted by hypotheses 1 through 7 are expected to be increased as an
investment’s required time to generate income increases. However, this
hypothesis can be further extended to include hypothesis 8.
It was discussed above how an income decrease heightens managerial
myopia because the pressure for an agent to increase income in the next
period increases. In particular, when income decreases, an agent is tempted
to cut investments that require long periods of time to generate potential
income. In choosing to cut such long-term investments, the agent is likely
to have more reason to first cut investments that require the longest periods
of time to produce income because cutting such investments has the lowest
probability of affecting the agent’s future income. Therefore, when the
principal controls the agent with short-term financial control, an income
decrease is likely to most heavily reduce learning investments that require
the longest periods of time to generate income. On the other hand, the use
of written ex ante reasoning and reviewers can diminish such reductions. In
other words, the use of written ex ante reasoning and reviewers can
increase investments in learning when income decreases and such an effect
is expected to increase as the learning investment’s required time to
generate income increases.
In summary, the effect of an investment’s time to generate income can be
encapsulated in the following hypothesis.

Theory and hypotheses
87
Hypothesis 9: The positive effects predicted by hypotheses H1
through H8 are expected to be amplified as an investment’s time
horizon increases.

88
3.5 Summary of hypotheses
The hypotheses of this study are summarized in Table 3-1.
Table 3-1 Summary of hypotheses
Investments by (i) an agent and (ii) a principal in learning new knowledgethat is likely to take a long time to generate incomeare positively related to the
H1 Quantity of written ex ante reasoning of an investment’s income potential
H2 Frequency of revision of written ex ante reasoning of an investment’s income potential
H3 Number of reviewersH4 (a) Reviewers’ mutual reviewing tenure, or alternatively,
(b) Have an inverted U relationship with reviewers’ mutual reviewing tenure
H5 (a) Reviewers’ reviewing tenure with the agent, or alternatively,(b) Are negatively related to reviewers’ reviewing tenure with the agent
H6 Reviewers’ ties to external reviewersH7 Principal’s attention to the investment
The positive effects predicted by
H8 H1 through H7 are expected to be amplified when income decreases
H9 H1 through H8 are expected to be amplified as an investment’s time horizon increases
Methods
89
4. Methods
4.1 Empirical research context
4.1.1 Research approach
The hypotheses of this study are tested on data of principal-agent dyads
that are involved in research and development (R&D) projects in a large
industrial corporation. Previous research on corporate governance and
corporate internal controls has relied on large samples of firms. Such an
approach is warranted when the focus is limited to few decision makers at
the apex of each firm. On the other hand, when the focus is on managers at
the lower levels of an organization, a focus on a single firm provides certain
gains. Organizational processes are usually complex and rich in subtlety.
Organizational phenomena tend to have a temporal dimension of
dynamism that can be best captured by longitudinal data (e.g., Pettigrew,
1992). A focus on one organization helps to provide a more comprehensive
and longitudinal understanding of the details that are related to the
phenomena that influence the decisions that are made by individuals (e.g.,
Siggelkow, 2007).
A number of past empirical studies have focused on single firms to
investigate behavior at the lower organizational levels. This study follows
the tradition of several past empirical studies that have investigated
behavior in R&D projects focusing on a single firm. Katz (1982) studied
how communication behaviors and project characteristics influenced
performance in R&D project groups in a single firm. Hansen (1999)
investigated how ties between units in a single large firm influenced the
completion times of R&D projects. Hansen et al. (2005) also focused on one
large firm to investigate how a search for knowledge in R&D projects
depended on the contacts of R&D project team members.
The research on social networks provides another example of how
behavior at the lower organizational levels has been examined by studies

90
that have focused in detail on single firms. Many previous empirical studies
on social network theory are based on an investigation of activities within a
single firm. Typically, the managers or other professionals of a single firm
have been approached with surveys asking questions on mutual ties and
performance attributes. Many of these studies have only investigated a
single large industrial corporation, usually focusing on one division or other
part of the corporation (Tsai and Ghoshal, 1998; Gargiulo and Benassi,
2000; Rodan and Galunic, 2004; Obstfeld, 2005; Zhang and Bartol, 2010).
Additionally, single companies that operate in the professional services
such as banking or consulting have been the focus of several studies (Ibarra,
1993; Mizruchi and Brewster Stearns, 2001; Morrison, 2002; Cross and
Sproull, 2004; Mehra et al., 2006; Biais and Weber, 2009; Mors, 2010).
Instead of acquiring survey data, a number of past studies that focused on a
single organization have relied on secondary data from information systems
that were related to the organization (Nerkar and Paruchuri, 2005; Reagans
et al., 2005; Gargiulo et al., 2009; Palomeras and Melero, 2010; Briscoe
and Tsai, 2011).
The generalizability of findings is a weakness of studies that focus on a
single company. The generalizability of findings from a study that is based
on the investigation of only one organization is inherently suspect. Any
finding can be due to something that is idiosyncratic to the organization,
and similar phenomena may not exist in most other organizations. This risk
can be minimized by sampling an organization that is a typical
representative of many similar organizations and which does not have
idiosyncratic characteristics that would be critical to the findings.
Ideally, an optimal research design would include detailed and
longitudinal data from several organizations. However, such an approach is
limited because detailed data are usually confidential, and it is difficult to
acquire a permit for adequate access. In addition, a detailed investigation of
an organization requires considerable resources. Thus, a scarcity of
resources can further limit opportunities to conduct intensive
investigations of multiple organizations.
This study follows the past tradition of investigating behavior at the lower
organizational levels, R&D projects in particular, by focusing in detail on a
single firm. To address the potential limitation of generalizability of the
findings, a typical industrial corporation was chosen for investigation. To
further minimize the risk of any idiosyncratic characteristics, the case
organization and processes within the organization are analyzed and
described in detail. This description of the case organization is provided
below, and it suggests that activities within the organization closely match
the findings of the past literature on corporations, and no idiosyncratic

Methods
91
characteristics that could be critical to the findings were observed.
Therefore, the findings from this study are assumed to be generalizable to a
broader population of similar corporations.
4.1.2 Corporate organizational structure
The case organization was a division of an industrial corporation. The
division was a large global operation, exceeding one billion euros in sales
during the investigation period from 1999 to 2009. The corporation and the
processes within it are described in detail below; however, for reasons of
confidentiality, some data have been disguised, and names are not used.
The corporation and the division were organized much like the typical
large industrial global corporations that have been discussed extensively in
the past research (e.g., Barnard, 1938; Simon, 1947; Chandler, 1962; Bower,
1970; Rumelt, 1974). The parent corporation was publicly traded with a
diverse ownership and no single dominating owner. The corporation had
thousands of owners, including mutual funds, pension funds and individual
investors. The corporation employed tens of thousands of employees and
was structured in a vertical hierarchy sometimes spanning close to ten
management levels. The corporation was managed by a board of directors
and a CEO.
All of the board’s directors were outsiders for most of the investigation
period. In the early years of the sample period, the CEO and a
representative of an employee union were members of the board, but the
board had a clear majority of outsiders even at that time. The board was
never chaired by the CEO.
Several divisions with profit and loss responsibilities reported to the CEO.
Further, case division consisted of smaller units with profit and loss
responsibilities. Such units were further divided into smaller units with
profit and loss responsibilities. The organizational structure of the division
evolved over the years, but typically there were two levels of hierarchy with
a profit and loss responsibility below the division level, referred to as the
business line and profit center levels. Profit centers were the lowest
management levels with profit and loss responsibilities. Each profit center
was typically responsible for the operations that were required to design,
produce, and sell a number of products. Sometimes manufacturing or sales
operations were organized as entities that reported directly to some
management level above the profit centers, but they were nevertheless
controlled by the profit centers through a matrix relationship. The
management levels under each profit center were typically organized
according to functional structure. Operating profit was not usually

92
measured for these functional structures, but only sales or cost were
measured.
Table 4-1 describes how the organizational structure evolved from 1999 to
2009. Different individuals in the positions of chairman of the board,
corporate CEO, and division manager are described by a serial number for
each position. The serial numbers increase by one whenever a new
individual was nominated for each position. All of the eleven individuals in
these positions were different persons. None of the division presidents was
promoted to the position of CEO, and none of the CEOs served as chairman
of the board. The number of business lines and profit centers identifies the
number of each per each year.
Each profit center with a unique name is indicated by a profit center
identification number. The number of R&D projects that were managed by
a profit center is listed for each year when the profit center was active. The
profit center structure highlights that the organization changed frequently,
and while some of the profit centers existed for several years, many others
were short-lived. Some of the profit centers disappeared as a result of
divestments, and some emerged as the result of acquisitions, but most of
the changes were due to internal reorganizations.

Methods
93
Table 4-1 Profit center organization structure and number of R&D projects in 1999-2009
Year 1999 2000 2001 2002 2003 2004 2005 2006 2007 2008 2009Chairman of board 1 1 1 1 2 2 2 2 2 2 3Corporate CEO 1 2 3 3 3 4 4 4 4 4 4Division manager 1 1 1 1 2 2 3 3 4 4 4Number of business lines 5 10 9 8 8 8 5 8 4 5 5Number of profit centers 17 22 27 18 19 17 14 15 12 14 16
Profit center ID Number of R&D projects1 3 5 5 9 10 2 5 5 1 6 32 12 16 17 13 11 14 11 11 53 12 11 21 8 11 11 11 64 9 11 13 10 13 18 9 115 22 10 16 22 12 6 4 46 9 2 3 4 57 17 11 3 48 5 6 10 99 8 7 410 7 6 611 812 413 1714 915 1616 917 4518 12 11 8 5 4 4 7 4 14 719 9 9 8 12 8 5 5 7 9 720 18 24 25 21 121 4 522 10 723 4 324 11 125 2726 827 728 45 43 36 54 61 63 3529 13 25 16 1130 7 8 4 531 9 12 5 8 9 12 1032 4 6 533 234 835 336 437 138 11 1039 7 5 5 8 8 7 9 940 941 242 11 21 19 8 11 443 6 12 3 7 15 744 4 1 1 245 4 346 247 148 149 11 18 24 1750 6 50 44 3551 252 5 11 453 5 25 1354 1 255 64 2956 17 657 1

94
4.1.3 R&D investment process
Origins of R&D projects
The division’s R&D expenditures consisted of the costs of activities in
hundreds of separate R&D projects. Prior to starting an R&D project, an
idea for improving some product or customer production process emerged
from various sources such as market surveys, customer feedback, internal
experience with previous products, or suppliers promoting new component
technologies. Sometimes an idea was a concrete technical solution that just
needed to be tested for technical and economical feasibility. At other times,
an idea was less concrete, such as a customer’s need for which no technical
solution was yet identified, or the development of a new technology that
had not yet been applied in existing products. These types of ideas required
additional work to be developed into concrete solutions.
An idea could be identified by an individual employee or evolve as the
result of joint discussions by several employees. If an idea could be
investigated further with the investment of minimal time and resources, an
employee could develop the idea somewhat further without starting a
formal R&D project. However, once the resources that were required to
develop an idea further exceeded the resources that were available without
a formal R&D project or within certain cost limits, it was required that a
formal R&D project be initiated to continue the development, and a
proposal for such an R&D project needed to be prepared.
The initiation of R&D projects
Investments in R&D projects were determined according to a typical
corporate resource allocation process (e.g., Bower, 1970). Profit center
managers gathered a pool of proposals for R&D projects and invested in a
set of those R&D projects with income potential and which best aligned
with their preferences. Even if a profit center manager made the final
decisions on choosing R&D projects, the proposal preparation was usually
coordinated by a functional manager who reported to the profit center
manager, such as an R&D manager, together with other functional
managers who reported to the profit center manager, such as sales and
production managers. In practice, this preparation work was often
organized as an R&D committee that was chaired by a profit center
manager, with an R&D manager working as a secretary. Such an R&D

Methods
95
committee tended to meet repeatedly to discuss different choices before
making its final decisions about starting R&D projects.
Usually, the R&D project proposals that were presented for a profit center
manager or an R&D committee were screened by an R&D manager who
gathered proposals from the organization and made some pre-selections.
However, the proposals could also bypass an R&D manager through
another route and end up as proposals to be considered by a profit center
manager.
Sometimes a profit center manager wanted or was required to submit a
project proposal for final approval to higher level management. Typically,
strategic projects with links to other profit centers or with very large
budgets were submitted to higher level management for decisions. On the
other hand, a profit center manager could typically increase a profit center’s
total R&D budget for smaller projects without needing to acquire a permit
from the higher management levels. Thus, to a large extent, a profit center
manager could control the profit center’s total R&D budget. Moreover, all of
a profit center’s projects needed to be approved by the profit center
manager. It was unusual for higher level management to force profit center
managers to invest in something that was not proposed, or even opposed,
by a profit center manager. In summary, a profit center’s total R&D budget
was determined by the profit center manager, even if higher management
levels could reject certain strategic or otherwise larger projects.
The information expectations for R&D project approval
Profit center managers chose R&D projects based on preferences that
were influenced by their strategic and financial goals and targets. A profit
center manager needed some information about each R&D project proposal
to be able to determine the best match with those goals and targets.
Therefore, profit center managers needed some information on R&D
project proposals and typically defined certain questions that each project
proposal needed to answer. The scope and details of information that were
required for R&D project proposals varied from year to year. Often there
were some division-wide templates, and even then, individual profit center
managers could add specific requirements for their part. Thus, a detailed
description of the requirements was not always possible, but some common
issues were nevertheless identified and tended to be repeated from year to
year.
Common questions for R&D project proposals over the years included
estimates of future income potential, including both cost and sales, and
some reasoning justifying such estimates. The accuracy and detail of such
96
estimates tended to depend on a project’s type and, in particular, on the
time that was needed to generate income. R&D projects were categorized
into three types that had different time horizons. Projects with modestly
long time horizon were typically expected to generate income in one to
three years. Such projects focused on product development. Projects that
required medium long time horizon were typically expected to generate
income in three to five years. Such projects focused on developing
technologies and components that were to be used as the basis for product
development projects later. Finally, projects with very long time horizons
were typically not expected to generate income until sometime after five
years. Such projects usually focused on applied research. The estimates for
projects at the very early stages with very long time horizons were allowed
to be somewhat vague, whereas projects with only modestly long time
horizon required relatively accurate and well-justified estimates.
The financial estimates and reasoning were typically accompanied by a
reasoning of how a project supported the qualitative strategic goals of a
profit center manager. Additionally, project budget and schedule estimates
were common and important topics in project proposals because
determining how much to invest in an R&D project had a direct impact on
short-term cost and the income of a profit center manager.
In evaluating R&D project proposals, profit center managers relied on
both written and oral sources. All of the written material on the project
proposals were stored in an R&D project reporting information system. In
addition, it was typical that profit center managers met formally or
informally with their R&D managers, other members of an R&D committee,
and other employees who were involved in preparing a proposal or who
possessed knowledge that was critical to a project proposal. Such
discussions were not always based on written documentation, and their
content was not documented. Moreover, it was possible that sometimes
verbal discussions partly substituted for written material and thereby
reduced the amount of written material. However, the most critical
reasoning that was needed to justify a project was usually documented and
stored in the R&D project reporting information system.
An R&D project’s budgeting
Rather than just approving or rejecting a proposal as such, a key element
of a decision that was made by a profit center manager was to determine
the size of the budget of an R&D project. Profit center managers often
analyzed budgeted tasks and their costs in detail and challenged proposals.
As explained above, choosing a set of R&D projects from proposals was

Methods
97
usually an iterative process. A profit center manager could return a
proposal for further adjustments on the proposal content, including tasks
and budget. Sometimes a profit center manager even dictated such details.
As in the traditional corporate resource allocation processes described by
Bower (1970), investments in R&D projects followed an annual cycle. The
corporate strategy process usually started in the spring, and once a strategy
was chosen in the fall, the budgeting for the following full year began. The
choice and budgeting of R&D projects were part of the overall budgeting in
the last quarter of each calendar year. Each fall, the profit center managers
reviewed the proposals for R&D projects for the following year and chose
R&D projects and defined a budget for each, as described above.
However, it tended to take several years of R&D work to develop a
solution that could be sold to generate income. To minimize risks, profit
center managers were not willing to approve resources for an R&D project
for several years. As a result, not only the new R&D projects that were
based on new ideas but also R&D projects that had been started earlier
needed to go through the approval and budgeting process at the end of each
year. Only a minority of R&D project proposals during budgeting were
proposals for new R&D projects based on new ideas. In summary, at the
end of each year, the profit center managers picked a set of R&D project
investments for the following year from a pool of proposals for continuing
R&D projects that had been initiated earlier and new R&D projects that
were based on new ideas.
For projects that continued from the past, the justification for the
investment was mainly based on past reasoning and related documentation.
Still, the past documentation needed to be updated to revise a task plan
based on past experiences and to include new tasks. Additionally, the
estimates and justifications related to income and strategic benefits needed
to be updated to match any changes that had occurred since the previous
version. The information needed to justify a project to a profit center
manager was prepared from scratch only for entirely new R&D projects
based on new ideas.
Even if the overall budgeting for the following year was completed only
once a year, profit center managers wanted to limit risks by actually
reviewing the progress of projects more frequently and also changing
budgets, if needed. A profit center manager could review projects for
changing tasks and budget any time of year if a reason for such changes was
identified. However, in addition to reviews based on ad hoc needs, a
number of reviews were already scheduled when a project was approved
during the annual budgeting process. Both planned and unplanned reviews
were referred to as “milestones.” As a result of the milestones, a budget that
98
was defined during the annual budgeting at the end of each year was only a
guideline, and it could be and often was adjusted at the milestones that took
place during the year. Whenever a budget was adjusted, the adjusted
budget became the formal project budget, which was documented and
tracked in the R&D project management information system. Budget
adjustments typically also required some updating of the information on
justifying a project.
A profit center manager could also decide to stop an R&D project
completely at any milestone if the project was no longer justified based on
new information that was learned about the project or due to other changes
that were external to the project. The flexibility in adjusting R&D
investments during the year also went in the opposite direction, as profit
center managers could initiate new R&D projects at any time during a year.
Most of the new projects were initiated based on the annual budgeting at
the end of each year, but if an attractive idea for a new project emerged
during the year, profit center managers could approve budgets for them. In
practice, the management of milestones and new project proposals was
typically arranged so that a profit center manager met with an R&D
committee at regular intervals during the year, and they made decisions on
milestones and new projects in such meetings.
Milestones and the stage-gate model
The practice of defining milestones for projects changed in 2004. Until
2003, projects typically had one milestone per each quarter of a year, or
four milestones per year in total. Four was the maximum amount of
milestones and sometimes milestones were omitted for certain quarters.
The number of milestones changed in 2004. Starting from the beginning
of 2004, a revised R&D process was implemented in the entire division. The
revised R&D process was similar to a typical stage-gate R&D process, as
discussed extensively by past researchers (e.g., Cooper and Kleinschmidt,
1986; Cooper, 1990). The key change of the new R&D process was the
introduction of minimum required standard tasks to be included for each
project. The change was intended to increase the quality of the R&D
projects by making sure that none of the tasks found to be critical to a
project’s success were ignored in any project. The definition of critical tasks
was based on a benchmarking of the literature on stage-gate processes (e.g.,
Cooper and Kleinschmidt, 1986; Cooper, 1990; Cooper at al. 2002a,
2002b), discussions with other companies, and best practices that were
identified internally. Standard tasks were further divided into standard

Methods
99
phases. Each project was divided into similar phases with the same
minimum tasks defined for each phase.
Standard phases with standard tasks for each phase were separated by
standard stage-gates with defined standard minimum requirements to be
completed for each gate. The stage-gate model presented by Cooper (1990)
includes five phases that are preceded by five gates. Stages include
preliminary assessment, detailed investigation (and business case
preparations), development, testing and validation, and full production and
market launch. The R&D process in the case division had similar phases
with the exception that the first two phases were combined into only one
phase. The division had five gates, but the second gate, defined by Cooper
between the first two gates, was omitted, and the fifth gate was a new one
that was added after the last phase to ensure that a developed new solution
was adequately integrated into ongoing operations in all the functional
areas before closing the R&D project. Moreover, the last two phases and
gates that were related to testing and validation and full production and
market launch were omitted for projects that only focused on applied
research.
The introduction of the stage-gate process changed the number of
milestones per project. Prior to 2004, projects tended to have quarterly
milestones, but from 2004 on, the milestones were defined by gates
between the project phases. On the other hand, the standard gates only set
the minimum requirements, and profit center managers could still add any
number of additional milestones between the gates. The basic function of
the milestones did not change, and the gates and other milestones were still
points at which profit center managers reviewed a project’s progress and
updated budgets. Gates and other milestone decisions were often made by
profit center managers in regular R&D committee meetings. Additionally,
the annual budgeting process remained in place. The annual budgeting and
stage-gate models did not conflict with each other much. Gates with
standard criteria added the number of tasks in projects in general but
otherwise acted like additional milestones, as before.
As a result of the stage-gate process, profit center managers were required
to make sure that all of the gate requirements were completed, and they
were not supposed to approve projects to pass a gate unless all of the
requirements were met. However, the requirements for standard tasks and
gate criteria were mostly presented in the form of checklists, and a
relatively high degree of variety remained for how each profit center
manager interpreted the requirements in practice. Thus, even if the
information requirements for projects were more aligned than prior to
2004, there was plenty of variety that remained in the actual project

100
documentation between different profit center managers and even between
projects within a profit center.
Project manager
By approving an R&D project, a profit center manager also nominated an
R&D project manager, either full-time or part-time in addition to other
responsibilities. Usually, someone was needed to prepare a project plan and
budget for approval before an R&D project manager was formally
nominated. Often the person who prepared a project plan was chosen with
the intention of being nominated as the R&D project manager later. An
R&D project manager was responsible for implementing the project plan,
which had been approved as the basis of the project’s budget. Usually an
R&D project manager also nominated an R&D project team and
organization to help with implementing the project.
However, when creating new knowledge, it is typically difficult to predict
with high accuracy what actually needs to be done to succeed in learning or
how much time it will take (Ruefli and Sarrazin, 1981; Cooper and
Kleinschmidt, 1986; Schreyögg and Steinmann, 1987; Cooper, 1990; Block
and Macmillan, 1993; Mintzberg, 1994; McGrath and MacMillan, 1995).
This was also typical of R&D projects in the case division. A project plan
and budget were based on the best estimate of needed tasks at the time of
budgeting, but rigidly following the plan was not usually the preferred
approach as new knowledge would be discovered during the development
of the project. The amount of changes and detailed task definitions was
usually so high that a profit center manager could not have had enough
time to approve each change. As a result, many of the decisions on how to
react to changes and how to define tasks in detail was left to be decided by
an R&D project manager. A profit center manager could review and revise a
project plan and budget at milestones. Some milestones were included in
the project plan, but additional milestones could also be added on an ad hoc
basis if the R&D project manager identified a need for major changes that
required decisions by the profit center manager.
Reviewers
In addition to a project manager, a profit center manager could also
nominate reviewers for each R&D project. Up to 13 reviewers were
nominated per R&D project. Some projects did not have any reviewers.
Reviewing projects was rarely a full-time task, and the reviewers were

Methods
101
typically heads of various functions who reported to a profit center
manager, but other managers also reported to other profit center managers.
The reviewers were distinct from an R&D project team that reported to an
R&D project manager.
R&D project reviewers reported to a profit center manager, and they were
responsible for helping the profit center manager in making decisions that
were related to the project but which could also support an R&D project
manager. The reviewers who were heads of various functions helped the
profit center managers to evaluate the attractiveness of an R&D project
from the perspective of each function. They also supported the R&D project
manager by ensuring that the project manager got access to the resources
that were available within their function, as needed. For example, they
could allow employees from their functions to participate as members of a
project team and to report to the project manager. The support in
functional expertise and resourcing was similar to what Cooper (1990)
described as the role of a group that was used to make gate decisions in
certain stage-gate processes.
In the case division, reviewers were not limited to functional heads who
reported to the profit center manager, but they could also be other
employees from the organization that were overseen by the profit center
manager or employees who worked for other profit center managers,
including other profit center managers themselves. Anyone that a profit
center manager regarded as being useful in supporting the profit center
manager with an R&D project could be nominated as a reviewer.
One critical support that reviewers could provide was to help a profit
center manager to evaluate how well an R&D project manager was
managing a project. The reviewers provided the profit center manager with
additional expertise and time that was spent in evaluating an R&D project
manager. The reviewers with specific functional expertise could advise a
profit center manager about how well an R&D project manager was able to
take into account the related functional factors that could potentially have a
critical impact on a project’s cost or sales goals. The reviewers who had
worked with a profit center manager previously had likely learned the
preferences of the profit center manager, such as how the profit center
manager preferred to set a balance between short-term cost pressures and
future income potential. Such reviewers could act as additional eyes to help
evaluate how decisions that were made by an R&D project manager were
aligned with those preferences.
The reviewers could also occasionally help a profit center manager to
communicate the investments in R&D projects to managers who were
higher in the organization. Because the organization of the division changed
102
frequently, higher level managers also typically had extensive previous
contacts within the organization, including other organizations that were
managed by profit center managers. If higher level managers respected the
opinions of such contacts, they could serve as useful reviewers to help to
justify an R&D project for higher level managers.
The primary role of the reviewers was to advise profit center managers,
but it was still the profit center managers themselves who approved the
project plans and budgets. The reviewers were not similar to typical
company boards that actually make decisions and vote for them. A profit
center manager was the decision maker and could make decisions against
the opinion of the reviewers, if needed. However, if the profit center
managers trusted the reviewers adequately, they could delegate decisions to
the reviewers. Such delegation could be conditioned up on certain rules. For
example, a profit center manager could allow the reviewers to make a
decision only if they all agreed, but otherwise it was required that the
decision be brought back to the profit center manager. If the profit center
managers delegated decisions, the delegation was usually limited to
milestones that did not include major changes in budgets or tasks. The
profit center managers usually wanted to make decisions with a major
impact on short-term cost or potential income from an R&D project.
4.1.4 Incentives for balancing short-term and long-term financial performance
Formal financial incentives
The corporate board members were only granted fixed annual and
meeting fees and did not receive any bonuses or other remuneration. All of
the managers in the corporation had a fixed based salary. In addition to
fixed base salary, most of the managers had short-term financial incentives
in the form of annual performance bonuses that were tied to annual
financial performance and other development objectives that were central
to the operations managed by each manager. The emphasis was on annual
financial performance, which determined at least 80% of short-term
financial incentives. Annual financial performance was divided into
corporate performance, division performance, and performance in the
lower organizational units. For the managers at levels that were below the
division manager, the corporate and division performance were the major
part of the annual financial performance that determined the short-term
financial incentives. The short-term financial incentives were typically half
of the annual base salary at a maximum for the CEO and the division

Methods
103
president. The maximum percentage relative to the base salary decreased at
the lower management levels and was typically not more than 20% of the
base salary for profit center managers.
Additionally, different types of dividend-based long-term incentives were
used over the years in which this study was conducted. These incentives
were similar to the instruments that are widely used in other firms and
which are discussed in the past literature, such as options and share-based
incentives (e.g., Jensen and Meckling, 1976; Coles et al., 2006; Sanders and
Hambrick, 2007; Deutsch et al., 2010). Before 2006, the direct share
holdings of the CEO and the division manager were usually less than their
annual base salaries. Instead, options were the basis for their dividend-
based long-term incentives. The options were granted to all of the
management levels down to most of the profit center managers, mainly in
2000 and 2001. The subscription period was from 2003 to 2005, which
provided incentives for a few of the upcoming years. It is not known how
the amount of options that were granted to each manager was determined,
but most likely, as with the annual performance bonus, the options were a
reward that was based on past annual financial performance or base salary.
Additionally, the exact amount of the options that were granted to the
managers below the division manager is not known. Based on the total
number of options that were granted, it can be roughly estimated that, on
average, each manager could have doubled his or her annual base salary if
the share price would have doubled during the subscription period.
Eventually the share price did not increase that much, and the gains were
equal to a few month’s base salary, at the maximum. Between 2002 and
2005, most of the managers, except for the CEO, did not receive any
additional options.
From 2006 on, the options as incentives were replaced by a share
ownership plan. The board intended the share ownership plan to support
the meeting of the financial targets set for the following years and to
commit managers to staying with the corporation. Unlike the earlier
options, the profit center managers were not covered by the share
ownership plan between 2006 and 2008 because the plan was typically
limited to the three highest management levels. The managers who were
covered by the share ownership plan received a number of shares each year
that were based on the same type of triggers as annual performance
bonuses. Once the managers received some of the shares, they needed to
own the shares for at least three years before being able to sell them. In
addition, they needed to remain employees of the corporation for the three-
year period. In 2008, the corporate board set a new rule that limited the
amount of shares granted each year to no more than annual base salary.

104
A different share ownership plan was adopted for 2009. It extended the
coverage of the plan to include most of the profit center managers as the
lowest level of managers. Rather than just granting shares as was done
earlier, the new plan required each manager to purchase the shares before
being granted any as an incentive. Typically, the managers could be granted
a maximum that was four to six times the amount of the shares that they
had first bought themselves. However, the multiplier was dependent on
how the share price and annual operating profits developed over the
coming three years and could eventually be much less. In addition, the gain
from the share ownership plan for each year was limited to not more than
1.5 times the annual base salary of each manager. As earlier, the managers
also needed to remain employed by the corporation for the following three
years to be granted any additional shares. After having been granted shares
after three years, the managers were not able to sell them for an additional
year. In summary, the incentive was based on financial performance for
four years in future. Approximately 90% of the managers that were offered
the plan participated in it.
CEO and division president
The CEO, and to some extent the division manager, had the authority to
make decisions that could potentially have sufficient impact to influence the
share price. Thus, the CEO and the division manager could influence the
gains from the options or share rewards that they were granted. As the
gains from the options and shares depended on financial performance over
several years, they were likely to be effective, to some extent, in motivating
the CEO and the division manager to make investments that took several
years to generate income.
However, the CEO and the division manager also had several reasons to
prioritize short-term financial performance over long-term financial
performance. The annual base salary and bonuses based on annual
financial performance usually exceeded potential gains from dividend-
based long-term incentives. Thus, the CEO and the division manager
maximized their personal income by staying in their positions for as long as
possible. Moreover, the CEO and the division manager needed to avoid
being dismissed to benefit from their dividend-based long-term incentives.
This increased the incentive for the CEO and the division manager to avoid
being dismissed.
High annual financial performance was the key for the CEO and division
manager to avoid being dismissed. Top management changes and the
related financial performance of operating profit per sales are listed in

Methods
105
Table 4-2. The threat of being dismissed due to a weak annual financial
performance was real because two of the CEOs were actually dismissed
before retirement. In both cases, the corporate operating profit per sales
had been decreasing for two consecutive years prior to their dismissal, and
the board communicated the changes to have been mainly due to weak
annual financial performance. Similarly, one of the division presidents was
dismissed after two consecutive years of decreasing division operating
profit per sales. In conclusion, even if the corporate CEO and the division
manager had dividend-based long-term financial incentives, their priority
was nevertheless to guarantee adequate short-term financial performance,
and, in particular, to avoid a decrease in operating profit per sales.
Table 4-2 Top management changes in 1998-2009
Profit center managers
Only the CEO, and to some extent the division manager, could make
decisions that could potentially have a large enough impact to influence the
share price. Thus, the options and shares were likely to be to some extent
effective in motivating the CEO and the division manager to make
investments that took several years to generate income. However, the
options and shares were not likely to be as effective for motivating profit
center managers. Even if every manager from the CEO down to the profit
center managers received some dividend-based long-term incentives, the
managers below the division manager could influence the corporate share
price to a very limited degree because each profit center contributed just a
small part of the total corporate dividends. In practice, the most that the
profit center managers could do to influence the benefits from the
dividend-based long-term incentives was to keep their annual operating
profit as high as possible to maximize the number of shares granted to
them, to not leave the corporation, and to try to avoid being dismissed for
three years. Keeping their annual operating profit high was also essential
for the latter objective of avoiding being dismissed. In conclusion, for profit
center managers, the options and share ownership plan were mostly about
committing them to not leaving the company and keeping their operating
profits at a satisfactory level for four years.
Even the incentive for keeping operating profits at a satisfactory level for
four years did not necessarily imply that the profit center managers had a
Year 1998 2000 2000 2001 2002 2003 2004 2005 2006 2007 2008 2009Chairman of board 1 1 1 1 1 2 2 2 2 2 2 3Corporate CEO 1 1* 2 3 3 3* 4 4 4 4 4 4Annual change in corporate operating profit per sales -1% -7% 5% 1% -2% -9% 8% 2% 1% 0.1% 1% -4%Division manager 1 1 1 1 1 2 2* 3 3 4 4 4Annual change in division operating profit per sales -1% -10% 9% 2% -1% -5% -1% 2% 0.3% 0.4% 1% -6%
A serial number of manager in each position.* Manager dismissed. Other changes due to retirement.

106
reason to prefer investments that took several years to generate income. As
discussed above and highlighted by Table 4-1, many of the profit centers did
not exist for four years, but rather for much shorter periods. A change in the
profit center structure also usually reset financial performance indicators,
and the monitoring of financial performance started to be tracked only
from beginning of the new structure. Thus, a profit center manager could
sacrifice long-term competitiveness and income by cutting R&D
investments with a good chance that the resulting decrease in income
would never become visible because the financial performance indicators
were likely to be reset before the decrease could be observed. This process
was likely to increase the temptation to keep R&D investments to a
minimum, even if it threatened competitiveness over the coming years.
In addition to the financial incentives that motivated profit center
managers to keep R&D investments to a minimum, the incentives for the
higher level managers created similar pressures. It was difficult for the
division manager to achieve adequate annual financial performance and
avoid a decrease in operating profits per sales unless all of the management
levels below contributed accordingly. Thus, the pressure for annual
financial performance and avoiding a decrease in operating profits per sales
cascaded down the management levels to the profit center managers. Each
profit center manager usually had personal annual financial performance
expectations, and if he or she failed to meet the expectations, the potential
negative consequences were more than just a lower annual performance
bonus. Additionally, the career of profit center managers depended on
meeting annual financial performance expectations and career was a
determinant of personal income for profit center managers. A fixed base
salary increased considerably at each higher management level. Thus,
promotion, demotion, and dismissal had considerable influence on a
manager’s personal income.
As discussed above, annual financial performance was a critical career
determinant for the CEO and the division manager. Unlike the dismissals of
a CEO and a division manager, the direct evidence of the career
determinants of the profit center managers was not available. The
organization of the division changed constantly, and most of the details of
organizational structure were not archived. Table 4-1 illustrates how the
structure of the profit centers changed over the years and demonstrates
how regularly the organization was changing. The names of the profit
centers were archived but not the names of their managers or their financial
performance. Thus, it is not possible to analyze the careers of individual
profit center managers or how financial performance was related to

Methods
107
organizational changes. Each manager chose their subordinates, and the
reasons for the choices were not communicated or documented.
Despite the lack of documented evidence on career determinants, it is
assumed that annual financial performance relative to expectations was a
major career determinant for profit center managers, even if it was not the
only one. On one hand, the assumption is based on the evidence that was
found on the career of the CEO and the division manager, which can likely
be generalized to the lower level managers. On the other hand, informal
discussions with managers at different levels seemed to support the
assumption based on how the managers had chosen their organizations and
perceived others’ choices as well.
Based on this assumption, it is expected that successful annual financial
performance improved the chances for promotion and decreased the risks
of demotion or dismissal and thereby increased a manager’s personal
potential future income considerably. On the other hand, a weak annual
financial performance decreased a manager’s chances for promotion and
substantially increased the risk of demotion or dismissal and thereby
decreased a manager’s personal potential future income considerably. In
summary, the profit center managers had strong motivations to maximize
annual operating profits.
The profit center managers could meet the expectation for annual
financial performance by increasing sales, increasing costs less than sales,
and decreasing costs. All of the profit centers mostly operated in the same
market, which was growing relatively slowly. As a result, it was not easy to
increase sales, and tight cost control was critical for profit center managers
to achieve adequate annual financial performance. As R&D investments
usually could increase income only in later years, keeping R&D investments
to a minimum could contribute to the goal of tight cost control.
Despite the cost pressures, there were also some balancing pressures
supporting investments in R&D. Stopping R&D investments completely was
not an attractive alternative because competition was active in R&D. If a
profit center manager stopped investing in R&D, sales could have been
decreased somewhat even in the short term, and there would have been
potential for a major decrease in a few years’ time. Higher management
would have noticed such a decrease in R&D investments and as the CEO
and the division manager had some effective dividend-based long-term
incentives, they had motivation to invest in R&D if it could help to avoid a
major decrease in sales in few years. Additionally, if a large scale reduction
in R&D investments would have been noticed outside of the corporation,
the share price would likely have decreased immediately. Thus, the profit
center managers had to strike a balance between pressures to minimize

108
costs and R&D investments and to avoid the potential for an excessive
decrease in sales in coming years due to not having developed solutions
that remained sufficiently competitive. The corporation had no explicit
universal rules for determining such a balance, and the profit center
managers needed to find a balance for each specific situation.
Because some level of R&D was desirable to management at the levels
above the profit center managers, R&D investments may have also played
some positive role as career determinants. Even if annual financial
performance was a major determinant of annual bonuses and share
ownership plans, another determinant included other development
objectives that were central to the operations overseen by each manager. It
is likely that such other objectives also played some role in how managers
were chosen for different positions. Because the CEO and the division
president had effective dividend-based long-term incentives, their total
income could be improved if the managers that reported to them could both
meet short-term financial expectations and, in addition, create
opportunities for future income through R&D investments. Thus, it is
possible that some profit center managers who were experiencing good
sales or otherwise strong short-term financial performance could improve
their career chances by also demonstrating R&D investments beyond the
minimum. Such behavior may have offered a profit center manager an
opportunity to distinguish him- or herself from other competing managers
with strong short-term financial performances. However, there was no
documented evidence to confirm if R&D investments also had a positive
effect on the profit center managers’ careers.
In summary, profit center managers were subject to various pressures for
minimizing R&D investments and some balancing pressures for making
R&D investments. Annual performance bonuses motivated them to
minimize R&D investments. The options and share ownership plan were
not effective in motivating long-term investments because the profit center
managers could not sufficiently influence share price. Frequent
organizational restructurings blurred the ability to identify the effects of
cost cutting in decreasing subsequent income, and they created a
temptation for minimizing R&D investments. Minimizing R&D investments
increased annual financial performance, which improved managers’
chances for promotion and decreased the risk of demotion or dismissal and
thereby increased a manager’s personal potential future income. Such
pressures to minimize R&D investments were balanced slightly by the top
management’s concern for ensuring adequate competitiveness, which made
drastic cuts in R&D investments undesirable and also offered to some

Methods
109
extent an opportunity to boost managers’ careers through R&D
investments.
In total, the balance on incentives for R&D investments by profit center
managers tended to tilt towards a preference for minimizing R&D
investments without excessively sacrificing competitiveness. However,
formal R&D expenditure limits were usually higher than the actual R&D
expenditures, and corporate management sometimes encouraged the
lower-level managers to increase the total division R&D expenditures.
Therefore, a profit center manager was not formally limited to investing
more in R&D if a profit center manager wanted to do so.
Project managers
As it was difficult for the division manager to achieve adequate annual
financial performance unless the profit center managers contributed
accordingly, the profit center managers were also dependent on the R&D
project managers to find a good balance between minimizing R&D
investments and ensuring adequate competitiveness in the following years.
The profit center managers approved a budget for each R&D project each
fall and even adjusted the budget at milestones during the year, but they did
not have time to make the bulk of the detailed decisions that influenced the
cost and future income potential of each project. The profit center
managers delegated these decisions to their subordinate project managers.
Because R&D projects were aimed at creating new knowledge, it was
typically difficult to predict with high accuracy what would actually need to
be done to succeed in learning or how much time it would take (Ruefli and
Sarrazin, 1981; Cooper and Kleinschmidt, 1986; Cooper, 1990; Block and
Macmillan, 1993; Mintzberg, 1994; McGrath and MacMillan, 1995). Project
budgets were based on the best estimates of the necessary tasks at the time
of budgeting, but rigidly following the plan was not always the preferred
alternative as new knowledge was discovered during the course of the
project. Such uncertainty was usually taken into account when preparing a
project plan and budget, and not all the tasks were defined in detail, but the
intention was to define the details as new knowledge was learned during the
project. A project manager was even often allowed to exceed the budget that
had been approved by a profit center manager to some extent, using his or
her own judgment. The amount of changes and detailed task definitions
was usually so high that a profit center manager would not have had the
time to approve each change. As a result, many of the decisions on how to
react to the changes and how to define the tasks in detail were left to a
project manager, and these decisions also influenced the project’s actual

110
cost. In conclusion, a profit center manager delegated part of the resources
to be allocated by a project manager and let the project manager find a good
balance between minimizing R&D investments while ensuring adequate
competitiveness in following years.
The decisions made by R&D project managers on actual project costs were
not a marginal determinant of the total annual financial performance of a
profit center. Instead, the actual cost of R&D projects was one of the critical
elements in determining the total annual financial performance of a profit
center. Such substantial impact can be illustrated by estimates that are
based on the average financial performance of the division.
Over the years, the division invested, on average, 3% of sales in R&D, and
operating profit per sales was, on average, 5% and never exceeded 10%.
This situation was paralleled the profit center level on average, even if there
was some variation. As the profit centers had ten R&D projects per year on
average, each project represented an average of 0.3% of sales for the profit
center. If a project manager could save 30% of the cost of an average-sized
project, the savings were 0.1% of the operating profit per sales of the entire
profit center. Such a savings may not have been the most critical
determinant of the profit center manager’s annual financial performance,
but it was nevertheless one of the visible determinants, relative to the
average of 5%. In addition, relative to many of the other costs, an R&D
project’s cost was something that could be easily cut without an immediate
decrease in sales. It was not at all unusual that a project’s actual cost was
30% below, or above, the project budget, as this was actually the situation
for more than half of the R&D projects. Thus, profit center managers with
pressure to meet expectations for annual financial performance had a
reason to be interested in how much their project managers actually spent
on R&D projects.
Given how important it was for profit center managers to maximize
annual financial performance without excessively risking competitiveness
and how much the annual financial performance was influenced by an R&D
project’s actual cost, it is likely that profit center managers were motivated
to choose an R&D project manager that could establish a delicate balance
between minimizing a project’s actual cost and ensuring adequate
competitiveness. There were no standard or documented rules for how
profit center managers should choose individuals for job positions in their
organizations, but it is possible that the project decisions made by project
managers influenced their future careers and income.
When an R&D project manager made project decisions, a profit center
manager could evaluate how the project manager balanced the project’s
actual cost and future income potential. A project manager that could

Methods
111
minimize a project’s actual cost and develop some new knowledge toward
generating future income was likely to be an attractive candidate to manage
R&D projects or some other position under a profit center manager in
future. A profit center manager was likely to prefer such R&D project
managers rather than those who either spent excessively or could not
develop useful knowledge. Thus, the career and future income of an R&D
manager likely depended on how well the project manager could minimize
the cost and develop knowledge that generated future income.
Of these two criteria, evaluating the usefulness of developed knowledge
was likely to be much more uncertain and difficult. On the other hand, the
project’s actual cost was easy and reliable to evaluate. A profit center
manager could track how much a project manager actually spent on an
R&D project and compare it to the budget. Often it was possible to track the
performance against budget not only for the project as a whole but also for
individual tasks. The lower the project’s actual cost was, the better it
supported the profit center manager’s pressure for minimizing profit center
costs. Thus, it is likely that actual cost was a strong determinant of how
attractive an R&D project manager was regarded for future R&D project
manager positions, or other management positions, by a profit center
manager.
The process of choosing candidates for new R&D project manager or other
managerial positions was not just an occasional exception, but it was a
fairly common practice. As illustrated in Table 4-1 above, the division’s
organizational structure changed frequently. The whole profit center
structure of the division was reorganized frequently, and only a few profit
centers existed for several years. Further, the organizations within the
profit centers evolved frequently. The restructuring of the organization was
often combined with layoffs. Thus, R&D project managers were under the
constant pressure of being placed in a position either as a continuing
manager of an existing R&D project in a new organizational structure or in
a new R&D project, or being nominated for another position within the
organization rather than being dismissed during layoffs. The choice of
managers for new positions and for dismissal was often in the hands of the
profit center managers. Thus, the profit center managers had considerable
influence on the career of all of the managers in their organizations,
including the R&D project managers. As a result, project decisions by a
project manager were likely to influence the future career and income of the
project manager. Further, as the profit center managers experienced strong
pressures to minimize costs, the career and future income of an R&D
manager were likely to depend on how well the project manager could
minimize the costs in R&D projects.

112
Even if the career and future income of an R&D manager were likely to
depend on what type of decisions they made in R&D projects and how well
they minimized a project’s actual cost, there is no direct evidence on how
much R&D project managers intentionally took such aspects into account
when making decisions in R&D projects. Project managers did not have
incentives to communicate or document such personal motivations and no
evidence was available to confirm such personal motivations. Agency theory
(e.g., Alchian and Demsetz, 1972; Ross, 1973; Jensen and Meckling, 1976)
suggests that individuals maximize their own interests even when
managing resources that belonging to someone else. This finding suggests
that when a project manager was deciding how to react to a project’s
changes and how to define project tasks in detail, he or she made choices
that were based on which alternative he or she expected to maximize his or
her own future personal income. It is possible that some R&D project
managers were more careful than others in considering how the decisions
influenced a project’s actual cost and how it further influenced their future
career options. However, the pressure to keep costs to a minimum was such
a regularly communicated topic in the division that it can be assumed that
most of the R&D project managers had a motivation to minimize their R&D
project’s actual cost unless they were convinced that the profit center
manager regarded the costly tasks to be useful. In conclusion, a project
manager had an incentive to minimize an R&D project’s actual cost unless
the profit center manager could be convinced otherwise.
4.1.5 Agency context
The case firm provides an agency context for testing the hypotheses. The
basic agency relationship started at the top with the owners as principals
and the board as agents. The CEO was an agent who reported to the board
as a principal. The CEO was a principal in relation to the division managers,
who were agents in relation to the CEO. In a sense, the CEO had a double
role as an agent and a principal. The division managers also acted as
principals in relation to the managers who reported to them. This vertical
hierarchy of principal-agent dyads was repeated down the organizational
hierarchy. With respect to the R&D projects, the profit center managers
were in a principal role relative to the R&D project managers, who were
agents in that dyad. For testing the hypotheses of this study, this study
focuses on the latter principal-agent dyad, in which the profit center
managers function as principals and the R&D project managers function as
agents.
Methods
113
In this agency context, a profit center manager is defined as a principal
and a project manager as an agent. The R&D project reviewers are regarded
as reviewers who help the principal to evaluate the agent. Ideally, the
hypotheses would also be tested for the principal-agent dyads at higher
levels in the corporate hierarchy, but no data exists for the hypothesized
control mechanisms for the higher level agency dyads.
4.2 Data
The sample consists of R&D projects. The data were obtained from the
division’s R&D project reporting information system, which included
information on R&D projects over a thirteen-year period between 1997 and
2009. Between 1997 and 2003, the work that took more than one year was
organized as separate projects, one for each year. A new system that
enabled multiyear projects was introduced in 2004. However, the variables
used in this study evolved from year to year. Therefore, the project system
was sampled annually after year-end, and the work that had been done in a
project in a prior year was counted as a separate project. In other words,
project length was always a maximum of one year. The sampling
methodology obtained 3,079 projects over the sample period. However, 504
projects from years 1997 and 1998 were needed to calculate the lagged
variables of the study. Further, 428 projects were screened out due to a
possibly unreliable dependent variable, which is discussed below. Thus, the
final sample that was used to test the hypotheses consisted of 2,147
projects. An investment in a project varied from a few thousand to 2.5
million euros. In total, over 260 million euros were invested in 2,147
projects.
The data analysis relies on written information from the R&D project
reporting system and the corporate public accounting records for actual
income information. The analysis could have been complemented by a
survey to or structured interviews with the profit center managers or the
R&D project managers. The managers could have been asked for their
opinions on how they thought they or the other managers were taking into
account the hypothesized control mechanisms when making decisions that
were related to R&D projects. Such a complementary analysis was not taken
for the following reasons. First, the data from the R&D project reporting
system was historical data, and it would not have matched with a survey or
structured interviews, which would have decreased the complementary
value somewhat, if not completely. Second, asking opinions of the
managers would have addressed perceptions, which would have required

114
an extension of the theoretical framework. The question of how individuals
make decisions does not necessarily coincide with how they think or report
how they make the decisions (e.g., Simon, 1947). Prior research has
recommended behavioral measures rather than perceptual ones (Hansen et
al., 2005). This study followed the recommended approach of observing
how the managers actually make decisions. Investigating how managers
thought they behaved could have been a following step, but it would have
required a broader theoretical framework, which would have been outside
of the scope of this study.
4.3 Variables
4.3.1 Dependent variables
Research and development (R&D) expenditures have been widely used in
previous research to measure activities related to long-term learning in
firms. Hoskisson et al. (1993) and Palmer and Wiseman (1999) used R&D
intensity, defined as R&D expenditures per sales, to measure managerial
risk taking. Kim et al. (2008) used R&D intensity to measure risky and
uncertain long-term investments, that is, investments with outcomes that
are neither immediate nor certain. Lee and O’Neill (2003) and Sanders and
Hambrick (2007) used R&D expenditures instead of R&D intensity to
measure uncertain long-term investments.
According to Cohen and Levinthal (1989), economists generally consider
R&D as the creation of new information. Helfat (1994a, 1994b) and Mahlich
and Roediger-Schluga (2006) used R&D intensity to measure knowledge
creation by firms. Greve (2003), Chen and Miller (2007), and Chen (2008)
used R&D intensity to measure organizational search. Dosi (1988) argued
that R&D reflects a firm’s innovation activity. Hoskisson and Hitt (1988),
Hitt et al. (1996), and Hundley et al. (1996) measured a firm’s commitment
to innovative activities through R&D intensity.
In summary, R&D expenditures have been used to measure risky and
uncertain long-term investments. They have also been used to measure
knowledge creation, organizational search, and innovation. Such activities
are in essence learning new knowledge. Therefore, R&D expenditures are
used in this study to measure investments in learning new knowledge that
is likely to take a long time to generate income.
Previous research has tended to focus on R&D expenditures by firms as a
whole rather than R&D expenditures in organizational units within firms.
Such a focus is warranted because the past research has focused on top

Methods
115
management. However, as a whole, a firm’s R&D expenditures are typically
the sum of R&D expenditures from several organizational units within a
firm. Because this study aims to understand the control mechanisms at the
lower organizational levels, R&D expenditures at lower organizational
levels are used instead of the sum for the whole firm.
An R&D project budget
R&D expenditures are measured at the level of individual R&D projects.
Because profit center managers determined the budget of R&D projects,
R&D project budgets are used to measure R&D expenditures by profit
center managers. The project budget approved by a profit center manager
reflects the profit center manager’s investment in learning new knowledge
that is likely to take a long time to generate income. Project budget is
measured as the R&D project budget indicated in the R&D project reporting
system. A logarithmic transformation is used for project budgets in models
in which it is the dependent variable.
An R&D project’s actual cost
Because R&D project managers determined the actual cost of R&D
projects, an R&D project’s actual cost is used to measure R&D expenditures
by R&D project managers. The project’s actual cost reflects the R&D project
manager’s investment in learning new knowledge that is likely to take a
long time to generate income. Project actual cost is measured as the R&D
project expenditures that are indicated in the R&D project reporting
system. A logarithmic transformation is used for a project’s actual cost in
the models in which it is the dependent variable.
The R&D projects’ actual costs often exceeded the project budget for many
of the projects in the case firm. A project manager could usually exceed a
project’s budget without a permit from the project profit center manager.
On the other hand, actual costs exceeded budgets with 50% or more for 410
projects, including projects with zero budgets. Projects were excluded from
this study because it is likely that the project managers of these projects had
had to ask for an approval from the profit center manager but had not
updated the project budget accordingly.
4.3.2 Independent variables

116
Quantity of written ex ante reasoning (H1)
Previous research has relied on both surveys and text analyses to
investigate the amount of communication that is related to various topics.
Studies that are based on surveys usually ask respondents to estimate the
amount of communication with others or the use of written communication
materials (Keller, 2001; Lewis et al., 2002; Haas and Hansen, 2007;
Westphal and Graebner, 2010). Studies that are based on text analysis have
been more specific by actually counting the length of the text related to
certain topics. A number of studies have investigated the annual reports
that are published by firms, usually focusing on the letters to shareholders
that are included in annual reports. (Bowman, 1976, 1984; Staw et al., 1983;
D’Aveni and MacMillan, 1990; Abrahamson and Park, 1994). These studies
have focused on certain topics and have counted the number of lines or
sentences that are related to a topic. Additionally, the written business
plans submitted to venture capital firms (MacMillan and Narasimha, 1987),
the proxy statements published by firms (Matejka et al., 2009), and the
written minutes of boards of directors (Tuggle et al., 2010a) have been
analyzed based on a similar approach of counting the number of sentences
related to certain topics.
The text analysis approach used in previous research was also used in this
study. Instead of annual reports or other instruments that have been used
as data in past research, this study is based on the information sheets
written for each R&D project. Each R&D project had a project information
sheet in the R&D project information system. Part of the information on a
project sheet was filled out prior to the project’s budget approval, and the
rest was completed during the course of the project. Some of the fields in
the project information sheet included attached documents. The
information that was entered into a project sheet prior to the project’s
budget approval was intended to justify the project’s approval. The
information that was entered into the project sheet during the course of a
project was intended to justify how well the project was progressing
according to the project plan and to justify any deviations from the plan
based on new knowledge discovered during the course of the project.
Quantity of ex ante reasoning of an investment decision is measured as the
logarithm of the size of a project’s information sheet without any attached
documents.
For a model that tests project actual cost by R&D project managers, the
size of the project information sheet adequately reflects the quantity of ex
ante reasoning because both the information filled out prior to the project’s

Methods
117
budget approval and that filled out during the actual project help the
project manager to justify the actions to a profit center manager.
However, for a model testing project budget by profit center managers, an
ideal measure would include only the size of the project information sheet
prior to budget approval. In practice, it was not possible to distinguish
exactly which part of the project information sheet was filled before project
budget approval. However, it was possible to measure how much the
information increased from year to year in projects that lasted for several
years. On average, the size of a project information sheet increased over
time for all of the projects, but when this was controlled, the size of
information sheet increased less than 30% for projects continued from the
previous year. This increase included both updates during the year and
revisions for a new budget approval at year end. Thus, it suggests that a
large majority of information on the project information sheets was
intended for project budget approval even if this amount could not be
exactly measured. As a result, the size of a project information sheet is
expected to be a good estimate of the size of the information sheet prior to
project budget approval. Therefore, even if this estimate is not an ideal
measure for the testing project budget by profit center managers, it is
expected to be an adequate proxy measure.
Frequency of revision of written ex ante reasoning (H2)
Previous research on boards of directors has measured the frequency of
monitoring and counseling by boards in several ways. Tuggle et al. (2010a)
measured board meeting frequency as the count of the meetings per year.
The frequency of actual information updates has also been measured. Judge
and Zeithaml (1992) used a survey item that measured how board members
utilized progress reports from the management. Tashakori and Boulton
(1983) measured the frequency with which board members were provided
analyses of a firm’s internal financial, human, and structural factors.
The frequency of information updates was also measured in this study to
test the hypothesis on the frequency of revisions of ex ante written
reasoning. Each R&D project information sheet had a log that listed each
revision of the information sheet. The log included the date of revision and
the name of the person who did the revision. Thus, it was possible to
determine how often the written reasoning on an R&D project sheet was
updated based on new knowledge. Frequency of revision of written ex ante
reasoning is measured as the number of times an R&D project information
sheet was updated during the course of the project. If a project information
sheet was updated more than once in the same day, only one update was

118
counted because several updates were likely to be working copies of the
same update to be communicated to a profit center manager as a single
update.
Number of reviewers (H3)
As the concept of reviewers is theoretically new, previous research did not
develop readily available empirical variables that could be used as such.
Boards of directors provide a close theoretical concept that has been
studied extensively with established empirical variables. As discussed in the
theory chapter above, the reviewers who were related to hypothesis 4 are
distinct from boards of directors. The main differences are that boards of
directors act at the apex of a firm and make decisions collectively. However,
the empirical studies on boards of directors provide a useful starting point
for developing empirical measures. A number of past studies on boards of
directors have included the number of directors as a key measure (Judge
and Zeithaml, 1992: Pearce and Zahra, 1992; Geletkanycz and Hambrick,
1997; Carpenter and Westphal, 2001; Golden and Zajac, 2001; Cheng,
2008: Deutsch et al., 2010; Duchin et al., 2010; Haynes and Hillman, 2010;
Tuggle et al., 2010b).
Financial analysts who follow firms and analyze them for the needs of
investors are also somewhat related to the concept of reviewers. Thus, the
empirical research on financial analysts can also provide some guidance for
measuring reviewers empirically. A number of past studies on financial
analysts have included the number of analysts as a key measure (Wright et
al., 2002; Yu, 2008; Duchin et al., 2010; Pfarrer et al., 2010).
As discussed above, a number of reviewers were nominated for each R&D
project, and not all projects had reviewers. Such reviewers acted much like
the reviewers who are discussed in the theory chapter for hypothesis 3. The
R&D project reviewers helped the profit center managers to evaluate their
projects as investments, and they also evaluated the competence of the
project managers. The R&D project reviewers could also support the project
managers’ careers by sharing the word of the competence of project
managers to managers who may hire project managers for other tasks in
future. Because the R&D project reviewers played a role that was similar to
the reviewers related to hypothesis 4, the logarithm of number of R&D
project reviewers is used as a measure of the number of reviewers. If a
project does not have any reviewers, the number of reviewers is zero. In this
case, the reviewer-related variables as discussed below are zero.

Methods
119
Reviewers’ mutual reviewing tenure (H4)
Previous research on corporate governance has measured average board
tenure to investigate the effects of tenure (Singh and Harianto, 1989;
Kosnik, 1990; Mallette and Fowler, 1992; Carpenter and Westphal, 2001;
Golden and Zajac, 2001). However, whereas boards are relatively
permanent mechanisms, and only their membership changes, the reviewer
teams established by a principal are temporary in comparison. Thus,
measuring the average tenure of reviewers in a reviewer team is not an
accurate measure of the mutual past review experience among reviewers.
Instead, the past review experience among reviewers in a review team is
better captured by the past mutual experience of each pair of reviewers in
all of the various past review teams.
Past mutual experience of each pair of reviewers can be calculated as the
number of past projects that two reviewers have reviewed together in the
past. These numbers can then be summed to get the total past cooperation
by all of the reviewers. However, such a sum needs to be divided properly to
be independent of the number of reviewers. The proper denominator is
suggested by network density, which is an established and widely applied
measure in social network theory (Mizruchi and Brewster Stearns, 2001;
Morrison, 2002; Soda et al., 2004; Sparrowe et al., 2001; Reagans et al.,
2005; Fleming et al., 2007; Mors 2010; Wong and Boh, 2010). Network
density provides an adequate basis for a measure for reviewers’ mutual
reviewing tenure. Network density for any group of individuals is defined as
the number of the past ties among the members of the group divided by the
total number of possible ties in the group, which equals (n(n-1))/2 where n
is the number of members in the group. Network density is also used to
measure reviewers’ mutual reviewing tenure.
The number of past projects that two reviewers have reviewed together in
the previous two years is calculated for each pair of reviewers of the project.
These numbers are then summed to get the total past cooperation by all the
reviewers. This sum is divided by the total number of possible ties between
the reviewers according to a network density measure, as discussed above.
This number is used as the measure of the reviewers’ mutual reviewing
tenure for each project.
Reviewers’ reviewing tenure with agent (H5)
Previous research on boards of directors has measured board members’
tenure with the CEO as the ratio of a CEO's tenure to the average board
tenure (Singh and Harianto, 1989; Sundaramurthy, 1996). As explained

120
above, average board tenure cannot be directly adapted to reviewers.
Therefore, reviewers’ reviewing tenure with an agent cannot be adapted
directly from measures that have been used for board members’ tenure with
a CEO.
However, the reviewers’ reviewing tenure with an agent can be adapted
based on a measure of tie strength that has been applied in social network
theory (McFadyen and Cannella, 2004; Soda et al., 2004; Reagans et al.,
2005; Fleming et al., 2007). The past mutual working experience between
two individuals has been measured by tie strength as the number of
projects or tasks the individuals have performed together in the past. For
example, Soda et al. (2004) used a data set of TV productions and counted
the number of projects on which two individuals had worked together in the
past. An approach that is similar to tie strength is used in this study to
measure the number of times that the reviewers had evaluated a project
manager in the past.
The extent to which the reviewers of a project had reviewed a project
manager in the past is first obtained by identifying the past projects that
were led by the project manager in the previous two years. The number of
reviewers of the current project as reviewers of each past project that was
managed by the project manager is counted. Then, the numbers of these
past projects are summed together. Finally, this sum of past reviews is
divided by the number of reviewers to obtain the measure of reviewers’
reviewing tenure with agent for the current project.
Reviewers’ ties to external reviewers (H6)
Again, the past research does not provide a readily available empirical
measure for reviewers’ ties to external reviewers. External reviewers are
defined as individuals with whom the reviewers have reviewed projects in
the past but who are not reviewers in the current project. However, the past
research on board interlocks and social network theory provides useful
empirical measures as the basis for measuring reviewers’ ties to external
reviewers. Past studies on board interlocks have measured the number of
boards on which board members sit (Davis, 1991; Haunschild, 1993;
Arthurs et al., 2008). The board members in such others boards provide
indirect ties for a focal firm. Studies in social network theory have gone one
step further and measured the number of individuals as indirect ties. In
their study of patent inventors, Fleming et al. (2007) measured the number
of external ties to a focal inventor’s collaborators and defined external ties
as the individuals who have not collaborated with the focal inventor. Soda
et al. (2004), Smith et al. (2005), and Vissa and Chacar (2009) studied

Methods
121
different types of teams and measured the number of ties the team
members had with other individuals who were not included in the team.
Such measures counted not only the number of ties of an individual but also
the total number of ties of all of the team members, thereby quantifying the
number of ties of the team as a whole. This approach can also be used to
measure reviewers’ ties to external reviewers in this study.
Reviewers’ ties to external reviewers are measured as the number of
reviewers with whom the reviewers of a project had worked on other
projects over the previous two years. The variable is calculated by first
listing all of the other projects that the reviewers of a project had reviewed
over the previous two years. Next, all of the reviewers that are listed for
these other projects are identified, and the reviewers of the current project
are excluded from the list. No person is counted twice as an external
reviewer. The number of the reviewers that remain on this list is divided by
the number of reviewers to obtain a measure of the reviewers’ ties to
external reviewers.
Principal’s attention (H7)
Occasio (1997) proposed that decision makers are more likely attend to
issues with greater value and relevance to an organization. The past
research on investment processes in large organizations has found that
larger investments attract more management attention than smaller
investments (e.g., Chandler, 1962; Bower, 1970). Moreover, larger
investments raise attention at more numerous and higher organizational
levels. The size of an investment is also used to measure attention in this
study.
Because a profit center manager is regarded as a principal in the research
context, a principal’s attention is based on the attention that a profit center
manager pays to an R&D project. The attention of a profit center manager is
expected to focus on the R&D projects with the largest budgets. There are
two alternatives of comparison groups among R&D projects. The first
alternative is to compare an R&D project to the other R&D projects of a
profit center manager. However, when testing a model on the total R&D
investment by profit center managers that include all of the R&D projects of
a profit center manager, this alternative does not distinguish attention
differences between different profit center managers. Instead, the attention
of a profit center manager can also be measured by comparing the budget of
an R&D project to other R&D projects within a business line, which is the
organizational level above the profit centers. Such a definition supports
testing a model on the total R&D investment by profit center managers.

122
Comparing R&D projects to other R&D projects within a business line is
also theoretically an attractive measure of the attention of profit center
managers because R&D projects that are large relative to others in a
business line are likely to be noticed by business line managers. Business
line managers may ask questions about such projects. Such projects are also
likely to be the basis for how business line managers evaluate profit center
managers in ensuring competitiveness over the coming years. Thus, profit
center managers are likely to pay the most attention to such projects as
well.
Comparing R&D projects to other R&D projects within a business line can
also be used as a measure of a principal’s attention when testing an R&D
investment by R&D project managers. Thus, a principal’s attention for a
project is measured as the negative of the number of other projects with
larger budget within a business line.
Income decrease (H8)
Several authors have measured income changes with return on assets
(Hambrick and D’Aveni, 1988; Bromiley, 1991; Wiseman and Bromiley,
1996; Lant et al., 1992; Palmer and Wiseman, 1999; Audia et al., 2000;
Greve, 2003; Miller and Chen, 2004; Audia and Greve, 2006; Sanders and
Hambrick, 2007; Chen and Miller, 2007). Singh (1986) and Hill et al.
(1991) relied on after-tax return on assets to measure income changes.
Some authors have used return on equity instead (Bromiley, 1991; Wiseman
and Bromiley, 1996; Palmer and Wiseman, 1999; Audia and Greve, 2006).
Grabowski (1968) measured income based on after-tax profit and
depreciation and divided their sum by sales. Grabowski and Vernon (2000)
and Mahlich and Roediger-Schluga (2006) elaborated on this measure by
adding after-tax R&D expenditures in the sum in the numerator. Hundley
et al. (1996) measured operating profit per sales. Many other authors have
also based their income measures on return on sales, but they did not
specify the measures in detail (Bromiley, 1991; Wiseman and Bromiley,
1996: Audia et al., 2000; Greve, 2003; Audia and Greve, 2006; Morrow et
al., 2007).
The operating profit per sales was the key measure for evaluating the
financial performance in the case firm. The managers with profit and loss
responsibilities at various organizational levels had annual targets for
operating profit per sales, and the ratio was frequently tracked in
management reviews. In addition, many of the managers’ actions were
justified as an effort to increase operating profits per sales. Even if it would
be optimal to measure the income of each profit center manager separately,

Methods
123
no such data were available for the whole sample. Instead, the division
income was measured. However, all of the profit center managers were
operating in the same market, and their incomes are all assumed to have
been strongly correlated with each other. Thus, the changes in division
income are assumed to reflect the changes in profit center manager
incomes. The division operating profit per sales is chosen as the measure of
income for this study. The income information was obtained from public
accounting records. The income change is defined as the change in
operating profit per sales relative to the previous year. Income decrease is
defined as negative income changes.
Time horizon (H9)
Previous studies on research and development activities have categorized
such activities into different types because the different types of activities
tend to differ in dimensions such as time span, specific relative to general
problem orientation, and the generation of new knowledge relative to the
use of existing knowledge. Typically, R&D activities are categorized as basic
research, applied research, product development, and technical services
(Tushman, 1977, 1979; Katz, 1982; Reagans and Zuckerman, 2001). The
case division did not use the exact same categorizations of R&D activities
but used the categorization in three types based on different periods of
times to generate income, reflecting a similar characterization of R&D
activities.
All of the R&D projects within the case division are regarded as long-term
investments because they were expected to take longer than one year to
generate income, with the exception of some minor occasional income from
product pilots. Projects were further categorized into three types that had
different time horizons. Projects with modestly long time horizons typically
were expected to generate income in one to three years. Such projects
focused on product development. Projects with medium long time horizons
typically were expected to generate income in three to five years. Such
projects focused on developing technologies and the components to be used
as the basis for product development projects later. Finally, projects with
very long time horizons were typically not expected to generate income
until sometime after five years. Such projects usually focused on applied
research. This project categorization was used to measure the time horizon
for each project.

124
4.3.3 Control variables
Project year
Longitudinal studies usually include a variable for year to control to
account for unobserved differences across time (e.g., Mishina et al., 2004;
Reagans et al., 2005; Deutsch et al., 2010). In this study, year is included to
control for any types of annual changes in the research context. Each year is
included as a separate binary variable. In particular, the project year can
control for the effects from the introduction of a new R&D project reporting
information system in 2004.
Continuation project
Between 1997 and 2003, the work that took more than one year was
organized as separate projects, one for each year. A new system that
enabled multiyear projects was introduced in 2004. However, the variables
used in this study evolved from year to year even within these projects.
Therefore, the project system was sampled annually after year-end, and the
work that was done on a project in a prior year was counted as a separate
project. In other words, project length was always one year at maximum.
However, even if the measured variables evolved from year to year in
multiyear projects, they may have been somewhat related over years. It is
also possible that a project manager expected the profit center manager and
the reviewers to be more knowledgeable about such a project, thereby
influencing the project manager’s motivation to invest in the project.
Therefore, project continuation is controlled with a binary variable that
indicates whether a project with a similar name existed in the previous
year.
Project milestones
The R&D projects were divided into a sequence of phases. Each phase
ended at a milestone at which the profit center manager could decide
whether to continue the project to the next phase. A profit center manager
needed to evaluate the project to make such a continuation decision. It is
possible that a project manager might expect the profit center manager and
the reviewers to be more knowledgeable about a project, which they had
evaluated at previous milestones, thereby influencing the project manager’s
motivation to invest in the project. The number of milestones that were
Methods
125
passed by a project also reflects the progress of the project’s work and may
therefore influence the project’s actual cost. Therefore, project milestones is
included as a control and measured as the number of milestones that have
been passed by a project.
Project status problems
The R&D project information sheet had an indicator for communicating if
a project had encountered any problems achieving a project’s objectives,
such as technical, cost, schedule, and other objectives. The status of a
project reflects the progress of the project’s work and may therefore
influence a project’s actual cost. Therefore, project status problems was
controlled as a binary variable that indicated if a project had encountered
any problems in achieving a project’s objectives.
Project manager frugality
Previous research on R&D has found that R&D investments are persistent
at the firm level and are correlated with R&D investments in the past
(Hambrick et al., 1983; Hansen and Hill, 1991; Helfat, 1994b; Mahlich and
Roediger-Schluga, 2006). It is possible that R&D investing also is persistent
at the individual level of R&D project managers. In particular, it may be
that a project manager had a tendency to spend relative to project budget.
A project manager could spend more or less than the budget set for a
project by a profit center manager. It may be that certain project managers
were more skilled in keeping a project’s actual cost to the minimum than
others. On the other hand, it is possible that some project managers were
under heavier myopic pressure for cost minimization and avoided any
actions pertaining to increased costs as much as possible within a project’s
objectives, whereas some project managers perceived greater benefits than
threats from taking actions that increased a project’s cost above the
minimum. It is also possible that some project managers were able to
receive approval for relatively high budgets with a high reserve for
contingencies.
The projects that were managed in the past two years were identified for
each project manager. For each of these projects, a ratio was calculated as
the difference between a project’s budget and the project’s actual cost,
divided by the project’s budget. The higher this ratio, the lower the project’s
actual cost is relative to the project’s budget. Project manager frugality is

126
measured as the average of this ratio in the projects that were managed by a
project manager in the past two years.
If a project manager has a tendency to spend more relative to a project’s
budget, project manager frugality is expected to have negative effect on the
project’s actual cost. On the other hand, a project’s budget was determined
by a profit center manager, and project manager frugality can have either a
positive or a negative effect on a project’s budget. If profit center managers
preferred managers who could keep costs to the minimum, project manager
frugality is expected to increase a profit center manager’s total budget as
profit center managers are likely to be more willing to invest if their
projects are managed by frugal project managers. However, if profit center
managers appreciated more project managers who spent more relative to
the budget, perhaps because such project managers could come up better
with new ideas of learning investments during projects, project manager
frugality has negative effect profit center manager budget.
Reviewer experience
Previous research on various teams has measured a team’s experience in
work that is related to the current work of a team’s members as such
experience can influence the current work of the team. Team experience has
been measured as the number of days during which team members have
worked on similar tasks (Drazin and Rao, 2002), the average tenure of a
team’s members since graduation (Reagans et al. 2005), the number of
similar positions that have been previously held by a team’s members (Kor
and Misangyi, 2008), and the number of companies at which a team’s
members had previously worked (Kirsch et al. 2009). Following the past
research, the experience of the reviewers as a team is also measured in the
study.
The more that reviewers had reviewed R&D projects in the past, the more
competent they could be in evaluating a project and the competence of a
project manager. A project manager could expect a more reliable
competence evaluation if the project reviewers had extensive past review
experience. This may have motivated a project manager to increase a
project’s actual cost. On the other hand, if a project had just one reviewer,
and that reviewer was very experienced, the reviewer may have been
dominating. This situation may have limited the initiative of a project
manager, thereby decreasing a project’s actual cost. Because a reviewer’s
experience could influence a project’s actual cost, it is controlled with a
variable. Reviewer experience is measured as the number of times that

Methods
127
project reviewers have reviewed R&D projects in the past two years divided
by the number of reviewers.
4.4 Models for hypotheses testing
4.4.1 Main models
Each hypothesis of this study addresses investments by two decision
makers in an agency dyad: (i) the agent and (ii) the principal. Thus, two
types of empirical models are used to test the hypotheses, one for a
principal and one for an agent. In this study, profit center managers are
regarded as the principals and R&D project managers are regarded as the
agents.
An R&D project’s budget is used to measure R&D expenditures by profit
center managers. Because a profit center manager can invest in several
R&D projects per year, the R&D expenditures by a profit center manager
can be investigated either at the level of individual projects or through an
annual portfolio that includes all of the a profit center manager’s R&D
projects for a given year. However, even when a profit center manager has
several parallel R&D projects, they are typically managed by different
project managers and involve different reviewers. Because the hypotheses
of this study are focused on studying the principal-agent dyad and data
provides variables for each individual R&D project, R&D expenditure by a
profit center manager is examined by a model that is based on individual
projects rather than on the annual portfolio of all of a profit center
manager’s projects. The variables that are included in the model for profit
center managers are described in Table 4-3.
An R&D project’s actual cost is used to measure R&D expenditures by
R&D project managers. Again, a project manager can manage several R&D
projects per year, but a profit manager’s R&D expenditures are examined
by a model that is based on individual projects for the same reasons, as in
the case of profit center managers. The variables included in the model for
profit center managers are described in Table 4-3.

128
Table 4-3 The main models for hypotheses testing
4.4.2 Modeling the effect of income decrease
The binary income decrease variable is based on annual income and is
controlled by the project year variable. Hypotheses H8 proposes
moderating the effects that are due to income decrease. To test these
effects, a product term with the binary income decrease variable is inserted
for each independent variable in the two main models above. If this
additional variable is significant, it implies that the effect of the
corresponding hypothesized control mechanism differs significantly
between income increases and decreases. If this additional variable is not
significant, there is no significant difference in the effect of the
corresponding hypothesized control mechanism between income increases
and decreases.
4.4.3 Modeling the effect of time horizon
Hypotheses H9 proposes the effects that are due a project’s time horizon.
To test these effects, projects are divided into three separate subsamples
that are based on the project-level variable Time horizon. In other words,
the effects of the control mechanisms are tested separately for projects with
modestly (1-3 years), medium (3-5 years), and very (>5 years) long time
horizons. These subsamples are tested for each of the two main models
described above. In addition, the full models including all of the
subsamples are tested for both the main models.
Model 1: Project actual cost by project manager Model 2: Project budget by profit center manager
Dependent variable Dependent variableProject actual cost Project budget
Control variables Control variablesProject year dummy variable Project year dummy variableProject budget Project budget in previous yearContinuation project Continuation projectProject milestonesProject status problemsProject manager frugality Project manager frugalityReviewer experience Reviewer experience
Independent variables Independent variablesQuantity of written ex ante reasoning Quantity of written ex ante reasoningFrequency of revision of written ex ante reasoningNumber of reviewers Number of reviewersReviewers’ mutual reviewing tenure Reviewers’ mutual reviewing tenureReviewers’ reviewing tenure with agent Reviewers’ reviewing tenure with agentReviewers’ ties to external reviewers Reviewers’ ties to external reviewersPrincipal’s attention Principal’s attention

Methods
129
4.5 Statistical methods
Each R&D project is related to one profit center manager and one project
manager. Moreover, each profit center manager and project manager can
have several R&D projects per year. The R&D projects that are related to
the same profit center manager can be correlated with respect to several
variables. Similarly, R&D projects that are managed by the same project
manager can also be correlated. Ordinary least squares (OLS) regression
with time dummies and cluster-robust standard errors is the statistical
method used to test the hypotheses in this study because it can account for
possible correlation within profit center managers and project managers
(e.g., Petersen, 2009; Arai, 2011).
As discussed above, some of the projects were multiyear projects and the
potential correlation between different years of a multiyear project is
controlled with the variable Continuation project. In addition to this control
variable, annual projects related to the same multiyear project can be
clustered. Rather than including a multiyear project as the third clustering
dimension, each model was analyzed using two clustering alternatives.
First, each model was tested by clustering that was based on profit center
managers and multiyear projects. Second, each model was run by clustering
based on project managers and multiyear projects. The results for these two
clustering alternatives were almost identical to the results from clustering
based on profit center managers and project managers only. Thus, the
results that were based on the two alternatives, including clustering based
on multiyear projects, are not reported.
The OLS regression helps to analyze how the variation of one dependent
variable depends on the variation of several dependent variables (Box et al.,
1978; Faraway, 2002). In terms of mathematical notation, the OLS
regression is based on equations in the form of yi = b0 + b1x1i + … +bNxNi
+ei where yi are values observed for the dependent variable, x1i … xNi are
the values observed for the independent variables, b0 …. bN are the
regression coefficients to be calculated and ei is the error term that is
represented by the residuals of the model. The equations are solved by
finding regression coefficients that minimize the sum of the squared
residuals.
The results from the OLS regression provide useful conclusions only if the
data complies with a number of assumptions. The most critical
assumptions are homoscedasticity and low multicollinearity. The
homoscedasticity assumption is met if the variance of error terms is
constant for all the values of the independent variables. If this assumption
is violated, the errors are heteroscadastic. Several tests such as the Breusch-

130
Pagan test exist for detecting heteroscedasticity. Heteroscedasticity can be
corrected in several ways. In this study, heteroscedasticity is addressed by
using cluster-robust standard errors (Petersen, 2009; Arai, 2011). Standard
errors are corrected for two dimensions of clustering, profit center
managers and project managers.
The assumption of low multicollinearity requires that none of the
independent variables have excessive mutual correlation. Multicollinearity
can be detected by a high correlation between two independent variables.
Typically, correlations below 0.7 are considered to be adequate for a low
multicollinearity (e.g., Deutsch et al., 2010), but variance inflation factors
(VIF) can also be calculated for each independent variable (O’Brian, 2007).
If the VIF values are below 10, the assumption of low multicollinearity is
adequately met. If a high multicollinearity is detected, it can be addressed
by not including the highly correlated variables in the same model. In
addition to homoscedasticity and low multicollinearity, the normality of
error terms is sometimes investigated, but normality is not critical for the
validity of the OLS regression, especially when the sample size is large
enough as it is in this study (e.g., Faraway, 2002).
If the assumptions of the OLS regression are met, it can be used to test the
hypotheses between the independent variables and the dependent variable.
The hypothesis testing is based on regression coefficients. A standard error
can be calculated for each regression coefficient. Standard errors can be
further corrected for clustering as discussed above. Corrected standard
errors can then be used to estimate the likelihood that each regression
coefficient differs from zero. If a regression coefficient has a high enough
probability of being different from zero, the coefficient is regarded as
significant, and the corresponding dependent variable is interpreted to have
a significant effect on the dependent variable. Such significance is regarded
as support for the tested hypothesis of the relationship between the
independent and the dependent variables. Finally, the statistical
significance of the overall OLS model can be tested with an F-test based on
F-statistic. The OLS model is considered to be significant if the model F-
statistic is below 0.05.

Results
131
5. Results
5.1 Model 1: Project actual cost
Descriptive statistics, including the means, standard errors, and
correlations for the main model, are presented in Table 5-1. The descriptive
statistics, including the means, standard errors, and correlations for the
subsamples that are based on time horizon are presented in Table 7-1, Table
7-2, and Table 7-3.
As expected, the reviewers’ mutual reviewing tenure and its squared term
have a high correlation. None of the other correlations of the independent
variables exceeds 0.7, and multicollinearity is not expected to become a
problem for these variables (e.g., Deutsch et al., 2010). Additionally, the
variance inflation factors (VIF) of the independent variables can be
examined to detect multicollinearity problems in all the models (O’Brian,
2007). The VIF values are calculated for all the models. Again, the mutual
reviewing tenure and its squared term have high VIF values, but none of the
others exceed 10, indicating no multicollinearity problems.
The correlations related to the variables that test the effects of income
decrease are relatively high; few even exceed 0.7. This finding creates the
potential for multicollinearity problems. To address these potential
problems, a separate model is tested for the effect of income decrease on
each independent variable. This approach also helps to minimize the total
number of variables, enabling a better identification of significant effects.
Model 1 is split into 48 different submodels to test the effects of control
and independent variables and the effects of time horizon and income
decrease. All of the 48 different submodels are defined and summarized in
Table 5-2.
R statistical software is used for statistical analysis. First, ordinary least
squares linear regression is applied for each model with an R function lm.
The Breusch-Pagan test for the heteroscedasticity of residuals of the OLS
models suggests that the residuals of most of the models are
heteroscedastic, but this was corrected by testing the significance of the
coefficients using cluster-robust standard errors. The significance of the

132
coefficients was tested with cluster-robust standard errors with R function
coeftest from library lmtest, as proposed by Arai (2011).
Table 5-3, Table 5-4, Table 5-5, Table 7-4, Table 7-5, Table 7-6, Table 7-7,
Table 7-8, Table 7-9, Table 7-10, Table 7-11, and Table 7-12 summarize the
results of the regression analysis for all the submodels of Model 1. These
tables include the F-statistics of each model, and the statistics suggest that
the models are significant. Table 5-6 summarizes the effects that are
identified in all the submodels. The results are discussed below, one
hypothesis at a time. For each hypothesis, the direct effect is analyzed first,
followed by an analysis of the moderating effects.

Results
133
Des
crip
tive
stat
isti
csan
dco
rrel
atio
nsTi
me
hori
zon:
All
proj
ects
Var
iabl
eM
ean
S.D
.1
23
45
67
89
1011
1213
1415
1617
1819
2021
2223
241
R&D
proj
ectb
udge
t(lo
g)4.
571.
062
R&D
proj
ecta
ctua
lcos
t(lo
g)3.
961.
400.
813
R&D
proj
ectb
udge
t16
521
10.
780.
654
R&D
proj
ectb
udge
tT-1
65.5
162
0.37
0.34
0.48
5Co
ntin
uati
onpr
ojec
t0.
470.
500.
120.
110.
080.
436
Proj
ectm
ilest
ones
1.77
1.73
-0.0
50.
02-0
.05
-0.0
6-0
.18
7Pr
ojec
tsta
tus
prob
lem
s0.
440.
500.
00-0
.01
0.00
0.03
0.11
0.02
8A
gent
frug
alit
y-0
.15
2.25
-0.0
4-0
.04
-0.0
40.
01-0
.04
0.06
-0.0
39
Revi
ewer
expe
rien
ce8.
8610
.60.
02-0
.06
-0.0
10.
060.
16-0
.23
-0.0
40.
0010
Qua
ntit
yof
wri
tten
exan
tere
ason
ing
9.21
1.04
0.24
0.24
0.20
0.21
0.35
-0.5
90.
17-0
.07
0.07
11Fr
eque
ncy
ofre
visi
onof
wri
tten
exan
tere
ason
ing
5.17
2.94
0.15
0.20
0.14
0.05
0.05
-0.2
00.
00-0
.03
-0.1
40.
3812
Num
bero
frev
iew
ers
0.75
0.55
0.13
0.13
0.10
0.12
0.11
-0.2
40.
02-0
.02
-0.0
70.
290.
1613
Revi
ewer
s’m
utua
lrev
iew
ing
tenu
re0.
230.
750.
050.
070.
030.
100.
13-0
.18
0.04
-0.0
20.
060.
180.
030.
4114
Revi
ewer
s’m
utua
lrev
iew
ing
tenu
resq
uare
d0.
623.
950.
020.
040.
000.
020.
03-0
.09
0.00
0.00
0.08
0.06
0.00
0.18
0.86
15Re
view
ers’
revi
ewin
gte
nure
wit
hag
ent
0.83
1.44
-0.0
1-0
.04
-0.0
20.
120.
22-0
.06
-0.0
10.
020.
510.
01-0
.11
0.18
0.13
0.08
16Re
view
ers’
ties
toex
tern
alre
view
ers
2.16
4.32
0.14
0.11
0.10
0.11
0.27
-0.3
60.
06-0
.06
0.43
0.45
0.08
0.20
0.16
0.10
0.17
17Pr
inci
pal’s
atte
ntio
n-2
9.2
26.5
0.50
0.44
0.41
0.17
-0.1
20.
23-0
.10
0.03
-0.0
2-0
.24
-0.0
4-0
.01
0.02
0.03
0.02
-0.1
818
Inco
me
decr
ease
xQ
uant
ity
ofw
ritt
enex
ante
reas
onin
g4.
104.
450.
00-0
.02
-0.0
3-0
.09
-0.1
90.
15-0
.22
0.05
0.00
-0.2
4-0
.01
-0.0
1-0
.09
-0.0
2-0
.02
-0.1
50.
0319
Inco
me
decr
ease
xFr
eque
ncy
ofre
visi
onof
wri
tten
exan
tere
ason
ing
2.31
3.20
0.05
0.07
0.03
-0.0
7-0
.18
0.01
-0.2
20.
04-0
.09
-0.0
70.
390.
07-0
.07
-0.0
2-0
.10
-0.0
80.
030.
8120
Inco
me
decr
ease
xN
umbe
rofr
evie
wer
s0.
340.
500.
020.
000.
00-0
.05
-0.1
40.
01-0
.20
0.04
-0.0
3-0
.10
0.07
0.39
0.05
0.05
0.04
-0.0
80.
000.
760.
6721
Inco
me
decr
ease
xRe
view
ers’
mut
ualr
evie
win
gte
nure
0.07
0.49
0.01
0.03
0.00
0.00
-0.0
2-0
.01
-0.0
60.
010.
04-0
.01
0.00
0.17
0.62
0.71
0.02
0.04
0.03
0.16
0.13
0.31
22In
com
ede
crea
sex
Revi
ewer
s’m
utua
lrev
iew
ing
tenu
resq
uare
d0.
243.
220.
010.
030.
00-0
.02
-0.0
4-0
.01
-0.0
50.
000.
05-0
.02
-0.0
10.
070.
560.
810.
010.
030.
030.
080.
060.
140.
8923
Inco
me
decr
ease
xRe
view
ers’
revi
ewin
gte
nure
wit
hag
ent
0.37
1.17
-0.0
8-0
.13
-0.0
80.
000.
050.
04-0
.07
0.03
0.44
-0.1
7-0
.14
0.04
-0.0
20.
000.
71-0
.07
0.02
0.33
0.16
0.31
0.08
0.04
24In
com
ede
crea
sex
Revi
ewer
s’ti
esto
exte
rnal
revi
ewer
s0.
612.
160.
060.
050.
030.
000.
09-0
.17
-0.1
30.
020.
110.
140.
110.
080.
060.
07-0
.01
0.40
-0.0
90.
350.
350.
320.
180.
120.
1025
Inco
me
decr
ease
xPr
inci
pal’s
atte
ntio
n-1
2.8
22.0
0.27
0.25
0.23
0.13
0.06
-0.0
50.
15-0
.04
0.02
0.12
0.03
-0.0
20.
080.
040.
010.
050.
47-0
.64
-0.5
0-0
.51
-0.0
7-0
.01
-0.2
1-0
.32
N=2
147
Table 5-1 Descriptive statistics and correlations: All projects

134
Model Time horizon Independent variables Income decrease effectModel 1.1.1 All projects No, controls only NoModel 1.1.2 All projects Yes NoModel 1.1.2.1 All projects Yes, test for H4b NoModel 1.1.3.1 All projects Yes H1Model 1.1.3.2 All projects Yes H2Model 1.1.3.3 All projects Yes H3Model 1.1.3.4.1 All projects Yes H4Model 1.1.3.4.2 All projects Yes, test for H4b H4Model 1.1.3.4.2 All projects Yes, test for H4b H4Model 1.1.3.5 All projects Yes H5Model 1.1.3.6 All projects Yes H6Model 1.1.3.7 All projects Yes H7Model 1.2.1 Modestly long time horizon No, controls only NoModel 1.2.2 Modestly long time horizon Yes NoModel 1.2.2.1 Modestly long time horizon Yes, test for H4b NoModel 1.2.3.1 Modestly long time horizon Yes H1Model 1.2.3.2 Modestly long time horizon Yes H2Model 1.2.3.3 Modestly long time horizon Yes H3Model 1.2.3.4.1 Modestly long time horizon Yes H4Model 1.2.3.4.2 Modestly long time horizon Yes, test for H4b H4Model 1.2.3.4.3 Modestly long time horizon Yes, test for H4b H4Model 1.2.3.5 Modestly long time horizon Yes H5Model 1.2.3.6 Modestly long time horizon Yes H6Model 1.2.3.7 Modestly long time horizon Yes H7Model 1.3.1 Medium long time horizon No, controls only NoModel 1.3.2 Medium long time horizon Yes NoModel 1.3.2.1 Medium long time horizon Yes, test for H4b NoModel 1.3.3.1 Medium long time horizon Yes H1Model 1.3.3.2 Medium long time horizon Yes H2Model 1.3.3.3 Medium long time horizon Yes H3Model 1.3.3.4.1 Medium long time horizon Yes H4Model 1.3.3.4.2 Medium long time horizon Yes, test for H4b H4Model 1.3.3.4.3 Medium long time horizon Yes, test for H4b H4Model 1.3.3.5 Medium long time horizon Yes H5Model 1.3.3.6 Medium long time horizon Yes H6Model 1.3.3.7 Medium long time horizon Yes H7Model 1.4.1 Very long time horizon No, controls only NoModel 1.4.2 Very long time horizon Yes NoModel 1.4.2.1 Very long time horizon Yes, test for H4b NoModel 1.4.3.1 Very long time horizon Yes H1Model 1.4.3.2 Very long time horizon Yes H2Model 1.4.3.3 Very long time horizon Yes H3Model 1.4.3.4.1 Very long time horizon Yes H4Model 1.4.3.4.2 Very long time horizon Yes, test for H4b H4Model 1.4.3.4.3 Very long time horizon Yes, test for H4b H4Model 1.4.3.5 Very long time horizon Yes H5Model 1.4.3.6 Very long time horizon Yes H6Model 1.4.3.7 Very long time horizon Yes H7
Table 5-2 Summary and definitions of submodels for Model 1

Results
135
Table 5-3 Regression analysis with a R&D project’s actual cost as the dependent variable, All projects, Part 1
Regression analysisTime horizon: All R&D projectsDependent variable : R&D project actual cost Model 1.1.1 Model 1.1.2 Model 1.1.2.1Control variablesProject budget 0.0042 *** (0.0003) 0.0031 *** (0.0003) 0.0031 *** (0.0003)Continuation project 0.1835 ** (0.0578) 0.1799 *** (0.0522) 0.1805 *** (0.0523)Project milestones 0.1662 *** (0.0284) 0.1199 *** (0.0270) 0.1199 *** (0.0270)Project status problems -0.0667 (0.0551) -0.0936 . (0.0498) -0.0933 . (0.0500)Agent frugality -0.0107 * (0.0044) -0.0110 (0.0070) -0.0111 (0.0070)Reviewer experience -0.0019 (0.0029) -0.0076 * (0.0035) -0.0076 * (0.0035)
Independent variablesH1: Quantity of written ex ante reasoning 0.3224 *** (0.0549) 0.3225 *** (0.0550)H2: Frequency of revision of written ex ante reasoning 0.0240 * (0.0108) 0.0241 * (0.0108)H3: Number of reviewers 0.0273 (0.0522) 0.0316 (0.0559)H4: Reviewers’ mutual reviewing tenure 0.0469 (0.0366) 0.0327 (0.0667)H4: Reviewers’ mutual reviewing tenure squared 0.0028 (0.0088)H5: Reviewers’ reviewing tenure with agent -0.0201 (0.0236) -0.0200 (0.0235)H6: Reviewers’ ties to external reviewers 0.0251 *** (0.0070) 0.0250 *** (0.0070)H7: Principal’s attention 0.0164 *** (0.0017) 0.0164 *** (0.0017)
Constant 2.4905 *** (0.1958) 0.6399 (0.4542) 0.6370 (0.4546)N 2147 2147 2147R2 0.451 0.532 0.532Adjusted R2 0.447 0.527 0.527F 109.2 *** 104.9 *** 100.5 ***. p < 0.10 * p < 0.05 ** p < 0.01 *** p < 0.001Unstandardized coefficients; Cluster-robust standard errors in parentheses.Project year control variables not reported
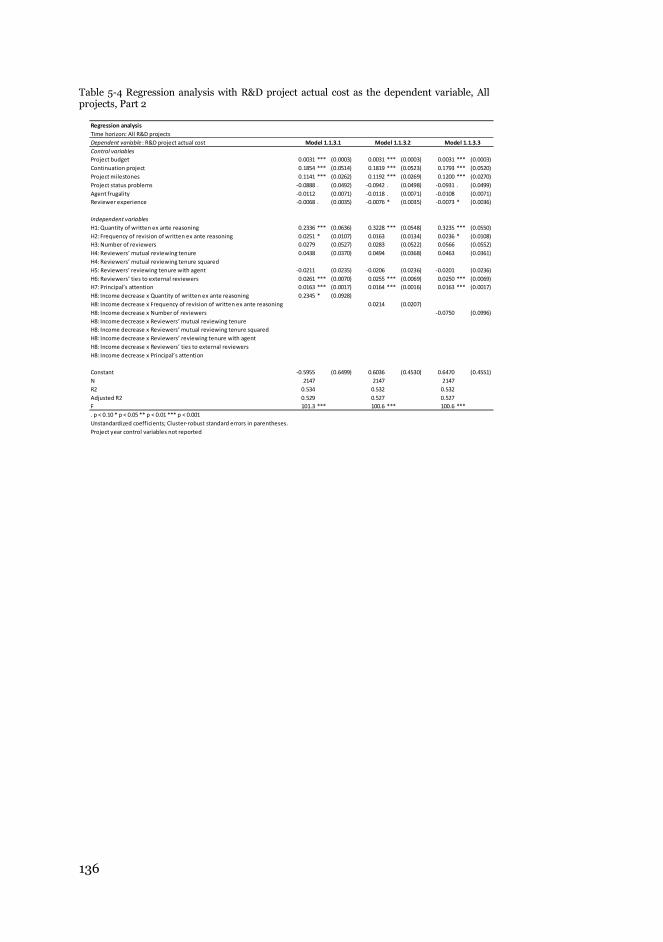
136
Table 5-4 Regression analysis with R&D project actual cost as the dependent variable, All projects, Part 2
Regression analysisTime horizon: All R&D projectsDependent variable : R&D project actual cost Model 1.1.3.1 Model 1.1.3.2 Model 1.1.3.3Control variablesProject budget 0.0031 *** (0.0003) 0.0031 *** (0.0003) 0.0031 *** (0.0003)Continuation project 0.1854 *** (0.0514) 0.1819 *** (0.0523) 0.1793 *** (0.0520)Project milestones 0.1141 *** (0.0262) 0.1192 *** (0.0269) 0.1200 *** (0.0270)Project status problems -0.0888 . (0.0492) -0.0942 . (0.0498) -0.0931 . (0.0499)Agent frugality -0.0112 (0.0071) -0.0118 . (0.0071) -0.0108 (0.0071)Reviewer experience -0.0068 . (0.0035) -0.0076 * (0.0035) -0.0073 * (0.0036)
Independent variablesH1: Quantity of written ex ante reasoning 0.2336 *** (0.0636) 0.3228 *** (0.0548) 0.3235 *** (0.0550)H2: Frequency of revision of written ex ante reasoning 0.0251 * (0.0107) 0.0163 (0.0134) 0.0236 * (0.0108)H3: Number of reviewers 0.0279 (0.0527) 0.0283 (0.0522) 0.0566 (0.0552)H4: Reviewers’ mutual reviewing tenure 0.0438 (0.0370) 0.0494 (0.0368) 0.0463 (0.0361)H4: Reviewers’ mutual reviewing tenure squaredH5: Reviewers’ reviewing tenure with agent -0.0211 (0.0235) -0.0206 (0.0236) -0.0201 (0.0236)H6: Reviewers’ ties to external reviewers 0.0261 *** (0.0070) 0.0255 *** (0.0069) 0.0250 *** (0.0069)H7: Principal’s attention 0.0163 *** (0.0017) 0.0164 *** (0.0016) 0.0163 *** (0.0017)H8: Income decrease x Quantity of written ex ante reasoning 0.2345 * (0.0928)H8: Income decrease x Frequency of revision of written ex ante reasoning 0.0214 (0.0207)H8: Income decrease x Number of reviewers -0.0750 (0.0996)H8: Income decrease x Reviewers’ mutual reviewing tenureH8: Income decrease x Reviewers’ mutual reviewing tenure squaredH8: Income decrease x Reviewers’ reviewing tenure with agentH8: Income decrease x Reviewers’ ties to external reviewersH8: Income decrease x Principal’s attention
Constant -0.5955 (0.6499) 0.6036 (0.4530) 0.6470 (0.4551)N 2147 2147 2147R2 0.534 0.532 0.532Adjusted R2 0.529 0.527 0.527F 101.3 *** 100.6 *** 100.6 ***. p < 0.10 * p < 0.05 ** p < 0.01 *** p < 0.001Unstandardized coefficients; Cluster-robust standard errors in parentheses.Project year control variables not reported

Results
137
Regr
essi
onan
alys
isTi
me
hori
zon:
All
R&D
proj
ects
Dep
ende
ntva
riabl
e:R
&D
proj
ecta
ctua
lcos
tM
odel
1.1.
3.4.
1M
odel
1.1.
3.4.
2M
odel
1.1.
3.4.
3M
odel
1.1.
3.5
Mod
el1.
1.3.
6M
odel
1.1.
3.7
Cont
rolv
aria
bles
Proj
ectb
udge
t0.
0031
***
(0.0
003)
0.00
31**
*(0
.000
3)0.
0031
***
(0.0
003)
0.00
31**
*(0
.000
3)0.
0031
***
(0.0
003)
0.00
31**
*(0
.000
3)Co
ntin
uati
onpr
ojec
t0.
1798
***
(0.0
521)
0.18
10**
*(0
.052
2)0.
1812
***
(0.0
522)
0.17
16**
*(0
.051
9)0.
1831
***
(0.0
524)
0.18
81**
*(0
.052
3)Pr
ojec
tmile
ston
es0.
1212
***
(0.0
268)
0.12
13**
*(0
.026
8)0.
1209
***
(0.0
268)
0.11
74**
*(0
.027
0)0.
1201
***
(0.0
270)
0.11
76**
*(0
.026
9)Pr
ojec
tsta
tus
prob
lem
s-0
.094
0.
(0.0
497)
-0.0
933
.(0
.049
9)-0
.092
8.
(0.0
499)
-0.0
945
.(0
.050
1)-0
.091
3.
(0.0
499)
-0.0
929
.(0
.049
7)A
gent
frug
alit
y-0
.011
0(0
.007
0)-0
.011
1(0
.007
0)-0
.011
0(0
.007
0)-0
.011
0(0
.006
9)-0
.011
4.
(0.0
069)
-0.0
093
(0.0
070)
Revi
ewer
expe
rien
ce-0
.007
3*
(0.0
035)
-0.0
074
*(0
.003
5)-0
.007
4*
(0.0
035)
-0.0
066
.(0
.003
5)-0
.007
0.
(0.0
036)
-0.0
069
*(0
.003
5)
Inde
pend
entv
aria
bles
H1:
Qua
ntit
yof
wri
tten
exan
tere
ason
ing
0.32
45**
*(0
.055
0)0.
3249
***
(0.0
552)
0.32
53**
*(0
.055
2)0.
3204
***
(0.0
544)
0.32
50**
*(0
.055
1)0.
3271
***
(0.0
551)
H2:
Freq
uenc
yof
revi
sion
ofw
ritt
enex
ante
reas
onin
g0.
0232
*(0
.010
9)0.
0232
*(0
.010
9)0.
0233
*(0
.010
9)0.
0247
*(0
.010
9)0.
0246
*(0
.010
7)0.
0234
*(0
.010
7)H
3:N
umbe
rofr
evie
wer
s0.
0248
(0.0
528)
0.03
37(0
.055
4)0.
0303
(0.0
569)
0.03
42(0
.052
0)0.
0251
(0.0
520)
0.01
64(0
.053
1)H
4:Re
view
ers’
mut
ualr
evie
win
gte
nure
0.07
72.
(0.0
452)
0.05
01(0
.066
2)0.
0746
(0.0
820)
0.04
01(0
.036
0)0.
0438
(0.0
373)
0.04
97(0
.036
4)H
4:Re
view
ers’
mut
ualr
evie
win
gte
nure
squa
red
0.00
59(0
.009
8)-0
.002
4(0
.020
9)H
5:Re
view
ers’
revi
ewin
gte
nure
wit
hag
ent
-0.0
217
(0.0
237)
-0.0
217
(0.0
237)
-0.0
215
(0.0
237)
0.01
81(0
.028
3)-0
.022
0(0
.023
6)-0
.021
2(0
.023
0)H
6:Re
view
ers’
ties
toex
tern
alre
view
ers
0.02
54**
*(0
.007
0)0.
0252
***
(0.0
070)
0.02
54**
*(0
.007
0)0.
0234
***
(0.0
070)
0.02
00*
(0.0
078)
0.02
39**
*(0
.006
9)H
7:Pr
inci
pal’s
atte
ntio
n0.
0164
***
(0.0
017)
0.01
64**
*(0
.001
7)0.
0164
***
(0.0
017)
0.01
64**
*(0
.001
7)0.
0164
***
(0.0
017)
0.01
88**
*(0
.002
1)H
8:In
com
ede
crea
sex
Qua
ntit
yof
wri
tten
exan
tere
ason
ing
H8:
Inco
me
decr
ease
xFr
eque
ncy
ofre
visi
onof
wri
tten
exan
tere
ason
ing
H8:
Inco
me
decr
ease
xN
umbe
rofr
evie
wer
sH
8:In
com
ede
crea
sex
Revi
ewer
s’m
utua
lrev
iew
ing
tenu
re-0
.065
7(0
.062
9)-0
.072
6(0
.064
3)-0
.090
5(0
.070
4)H
8:In
com
ede
crea
sex
Revi
ewer
s’m
utua
lrev
iew
ing
tenu
resq
uare
d0.
0089
(0.0
156)
H8:
Inco
me
decr
ease
xRe
view
ers’
revi
ewin
gte
nure
wit
hag
ent
-0.0
745
.(0
.039
5)H
8:In
com
ede
crea
sex
Revi
ewer
s’ti
esto
exte
rnal
revi
ewer
s0.
0181
(0.0
139)
H8:
Inco
me
decr
ease
xPr
inci
pal’s
atte
ntio
n-0
.005
8*
(0.0
027)
Cons
tant
0.62
18(0
.455
0)0.
6135
(0.4
567)
0.61
30(0
.456
4)0.
7041
(0.4
536)
0.60
84(0
.456
9)0.
4912
(0.4
569)
N21
4721
4721
4721
4721
4721
47R2
0.53
20.
532
0.53
20.
533
0.53
20.
534
Adj
uste
dR2
0.52
70.
527
0.52
70.
528
0.52
70.
529
F10
0.6
***
96.5
6**
*92
.84
***
101.
0**
*10
0.7
***
101.
4**
*.p
<0.
10*
p<
0.05
**p
<0.
01**
*p
<0.
001
Uns
tand
ardi
zed
coef
fici
ents
;Clu
ster
-rob
usts
tand
ard
erro
rsin
pare
nthe
ses.
Proj
ecty
earc
ontr
olva
riab
les
notr
epor
ted
Table 5-5 Regression analysis with R&D project actual cost as the dependent variable, All projects, Part 3

138
Table 5-6 Summary of regression results with R&D project actual cost as the dependent variable
Dependent variable: All projects Time horizonR&D project actual cost Modestly
longMedium
longVery long
H1: Quantity of written ex ante reasoning + + + +Income decrease if different ++ 0 0 ++
H2: Frequency of revision of written ex ante reasoning + + 0 0Income decrease if different 0 0 0 +
H3: Number of reviewers 0 0 0 +Income decrease if different 0 0 0 0
H4: Reviewers’ mutual reviewing tenure + 0 0 +Income decrease if different 0 0 U 0
H5: Reviewers’ reviewing tenure with agent 0 0 0 -Income decrease if different - - 0 0
H6: Reviewers’ ties to external reviewers + 0 + 0Income decrease if different 0 0 0 +
H7: Principal’s attention + + + +Income decrease if different + - + - 0 0
Effects: Additional effects for income decrease0 = Not significant ++ = More positive than income increase+ = Positive + - = Positive but less positive that income increase- = NegativeU = U-curved

Results
139
5.1.1 Quantity of written ex ante reasoning
The results from Model 1.1.2 support hypothesis H1 that the quantity of
written ex ante reasoning has a positive and significant effect ( =.3224,
p<.001) on a R&D project’s actual cost. Model 1.1.3.1 further supports
hypothesis H8 that this effect increases when income decreases ( =.2345,
p<.05).
The effect of time horizon predicted by hypothesis H9 is analyzed with
models 1.2.2, 1.2.3.1, 1.3.2, 1.3.3.1, 1.4.2.1, and 1.4.3.1. This analysis suggests
that the positive effect is increased by income decrease only for projects
with very long time horizons ( =.3836, p<.05) but not for projects with
modestly or medium long time horizons. This finding supports hypothesis
H9 that the effect predicted by hypothesis H8 increases as the time horizon
increases.
In summary, the results provide support for the direct effect predicted by
hypothesis H1. In addition, the moderating effect of income decrease as
predicted by hypothesis H8 is supported. Finally, the moderating effect of
time horizon as predicted by hypothesis H9 is also supported.
5.1.2 Frequency of revision of written ex ante reasoning
The results from Model 1.1.2 support hypothesis H2 that the frequency of
ex ante reasoning has positive and significant effect ( =.0240, p<.05) on an
R&D project actual cost.
The analysis of the effect of time horizon by models 1.2.2, 1.2.3.2, 1.3.2,
1.3.3.2, 1.4.2.1, and 1.4.3.2 provides additional insight into the effect of the
frequency of revision of written ex ante reasoning. Projects with modestly
long time horizons actually have positive effect ( =.0364, p<.05) from the
frequency of revision of written ex ante reasoning regardless of income
change. Projects with very long time horizons have positive effect ( =.0703,
p<.10), but only when income decreases. This finding is according to
hypothesis H8. Projects with medium long time horizons have no
significant effect at all.
The findings suggest that the effect of time horizon is more complex than
predicted by hypothesis H9. Contrary to hypothesis H9, projects with
modestly long time horizons can benefit most from frequent updates to
written reasoning. A potential reason is that these projects are closest to
market launch, and profit center managers are likely to pay attention to
these projects more often to ensure a smooth launch to market. These
projects are likely to be under constant attention by a profit center manager

140
with not much room for increased attention to the frequency if income
decreases. On the other hand, projects with very long time horizons are not
as critical for immediate income, and project managers feel no significant
gain from more frequent revisions of written ex ante reasoning when
income increases. However, when income decreases, these projects are
most sensitive to myopia, and project managers feel they can benefit by
increasing the frequency of revisions of written ex ante reasoning by profit
center managers. This behavior is in accordance with the predictions of
hypotheses H8 and H9. It is also similar to how project managers react to
income decrease by also increasing the quantity of ex ante reasoning for
projects with very long time horizons.
In summary, the results provide support for the direct effects that were
predicted by hypothesis H2. In addition, the moderating effect of income
decrease predicted by hypothesis H8 is supported. Finally, the moderating
effect of time horizon as predicted by hypothesis H9 is partially supported,
but the effect is more complex than predicted.
5.1.3 Number of reviewers
Model 1.1.2 has no significant effect for the number of reviewers. Model
1.1.3.3 on the effect of income decrease provides the same result of no
significance. The analysis of the effect of time horizon by models 1.2.2,
1.2.3.3, 1.3.2, 1.3.3.3, 1.4.2.1, and 1.4.3.3 provides additional insight into the
effect of the number of reviewers. The analysis of model 1.4.2.1 suggests
that the effect of the number of reviewers is significant for projects with
very long time horizons ( =.1790, p<.10). This finding supports hypothesis
H3 that predicts such a positive effect. On the other hand, the effect is not
significant for projects with modestly or medium long time horizons. It
seems that the effect of the number of reviewers is somewhat weak as it has
no significant effect when the time horizon is medium, long or shorter.
However, the findings support hypothesis H9, which predicts that the
positive effect of the number of reviewers is stronger for projects with
longer time horizons.
In summary, the results provide support for the effect predicted by
hypothesis H3. The moderating effect of income decrease predicted by
hypothesis H8 is not supported. Finally, the moderating effect of time
horizon predicted by hypothesis H9 is supported.

Results
141
5.1.4 Reviewers’ mutual reviewing tenure
The results from models 1.1.2 and 1.1.2.1 do not show any significant effect
for reviewers’ mutual reviewing tenure. However, adding the effect for
income decrease in model 1.1.3.4.1 makes the effect significant. Thus,
reviewers’ mutual reviewing tenure has a positive and significant effect
( =.0772, p<.10) on an R&D project actual cost. The effect of income
decrease is insignificant.
The analysis of the effect of time horizon by models 1.2.2, 1.2.2.1, 1.2.3.4.1,
1.2.3.4.2, 1.2.3.4.3, 1.3.2, 1.3.2.1, 1.3.3.4.1, 1.3.3.4.2, 1.3.3.4.3, 1.4.2, 1.4.2.1,
1.4.3.4.1, 1.4.3.4.2, and 1.4.3.4.3 provides additional insight into the effect
of reviewers’ mutual reviewing tenure. The effect is not significant in any of
the models 1.2.2, 1.2.2.1, 1.2.3.4.1, 1.2.3.4.2, and 1.2.3.4.3 analyzing projects
with modestly long time horizons. Models 1.3.2 shows that the effect is
positive and significant ( =.1143, p<.10) for projects with medium time
horizons. In model 1.4.2.1, the direct effect is not significant, but the
squared term is positive and significant ( =.0249, p<.10). Thus, reviewers’
mutual reviewing tenure also has a positive effect for projects with very long
time horizons. The results support hypothesis H4a, which predicts that
reviewers’ mutual reviewing tenure increases an R&D project actual cost.
Moreover, the effect is only significant for projects with medium and very
long time horizons, supporting hypothesis H9, which predicts that the
effect of reviewers’ mutual reviewing tenure increases as time horizon
increases.
The results from model 1.3.3.4.3 show that the effect of reviewers’ mutual
reviewing tenure is U-curved for projects with medium time horizons when
income decreases. In other words, the effect is first negative, but it turns
into a positive effect when reviewers’ mutual reviewing tenure becomes
high enough. This finding is somewhat peculiar because it is not linear on
the time horizon as projects with modestly or very long time horizons do
not have similar effects. It remains an open question as to how the time
horizon influences the effect of the reviewers’ ties to external reviewers
when income decreases. The effect for an R&D project budget is somewhat
similar but more consistent, as discussed below.
In summary, the results provide support for the direct effect predicted by
hypothesis H4a. The alternative hypothesis H4b is not supported. The
moderating effect of income decrease as predicted by hypothesis H8 is not
supported. Finally, the moderating effect of time horizon predicted by
hypothesis H9 is supported.

142
5.1.5 Reviewers’ reviewing tenure with agent
Model 1.1.2 has no significant effect for the reviewers’ reviewing tenure
with an agent. Model 1.1.3.5 shows that the effect of the reviewers’
reviewing tenure with an agent is negative ( =-.0745, p<.10) when income
decreases. The analysis of the effect of time horizon by models 1.2.2, 1.2.3.5,
1.3.2, 1.3.3.5, 1.4.2.1, and 1.4.3.5 provides additional insight into the effect
of reviewers’ reviewing tenure with an agent. The effect is negative for
projects with very long time horizons ( =-.0890, p<.10). The effect is
significant and negative for projects with modestly long time horizons ( =-
.0900, p<.10) but only when income decreases. The results support
hypothesis H5b, which predicts that the effect of reviewers’ reviewing
tenure with an agent is negative. If reviewers have reviewed a project
manager extensively in the past, the profit center manager is likely to
suspect that the reviewers have a deeper social tie with the project manager
and may be too positively biased for the project manager.
However, the negative effect of reviewers’ reviewing tenure with agent is
limited to projects with very long time horizons or situations in which
income decreases. When income is not decreasing, the effect is not
significant for projects with modestly or medium long time horizons. This
finding seems possible because profit center managers are expected to be
less familiar with knowledge related to projects with very long time
horizons as such projects tend to rely most on novel knowledge. On the
other hand, projects with shorter time horizons involve knowledge that is
likely to be more familiar to profit center managers. As a result, profit
center managers can better evaluate potential bias by reviewers and are less
concerned about potential bias. Therefore, reviewers’ reviewing tenure with
agent does not decrease investments by project managers when project
time horizon is not very long and income is not decreasing. Hypothesis H9
predicts that the positive effect from reviewers’ reviewing tenure with agent
increases as time horizon increases but the findings suggest that, on the
contrary, it is the negative effect that increases.
The results also show than when income decreases, the effect of reviewers’
reviewing tenure with agent becomes negative, regardless of time horizon.
A possible explanation for this finding seems to be that as income
decreases, profit center managers start to question a project’s reasoning
more critically and intensively. The potential bias due to reviewers who are
familiar with project managers becomes more of a concern under such
pressure when income decreases. Hypothesis H8 predicts that the positive
effect from reviewers’ reviewing tenure with agent increases as income
Results
143
decreases, but the findings suggest that, on the contrary, it is the negative
effect that increases.
In summary, the results provide support for the direct effect predicted by
hypothesis H5b. The alternative hypothesis H5a is not supported. Support
for the moderating effect of income decrease is found, but the effect is
contrary to the prediction by hypothesis H8. Finally, support for the
moderating effect of time horizon is found, but the effect is also contrary to
the prediction by hypothesis H9.
5.1.6 Reviewers’ ties to external reviewers
The results from Model 1.1.2 support hypothesis H6 that the reviewers’
ties to external reviewers have a positive and significant effect ( =.0251,
p<.001) on an R&D project actual cost.
The analysis of the effect of time horizon 1.2.2, 1.2.3.6, 1.3.2, 1.3.3.6,
1.4.2.1, and 1.4.3.6 provides additional insight into the effect of the
reviewers’ ties to external reviewers. The analysis suggests that the effect is
significant only for projects with medium ( =.0370, p<.01) and very
( =.0300, p<.05) long time horizons to income but not for projects with
modestly long time horizons. This supports hypothesis H9, which proposes
that the effect of reviewers’ ties to external reviewers is increased by
increasing time horizon. The analysis on the period of time that is required
to produce income also suggests that reviewers’ ties to external reviewers
have effect for projects with very long time horizons only when income
decreases ( =.0650, p<.05) but not when income increases. Such
increasing effect from income decrease supports hypothesis H8 and the
related hypothesis H9.
In summary, the results provide support for the direct effect predicted by
hypothesis H6. In addition, the moderating effect of income decrease
predicted by hypothesis H8 is supported. Finally, the moderating effect of
time horizons predicted by hypothesis H9 is also supported.
5.1.7 Principal’s attention
The results from Model 1.1.2 support hypothesis H7 that the principal’s
attention has positive and significant effect ( =.0164, p<.001) on an R&D
project actual cost. On the other hand, results from model 1.1.3.7 differ
somewhat from hypothesis H8 because the effect of principal’s attention
does not increase but is less positive ( =.0188-.0058, p<.05) when income
decreases.

144
The analysis of the effect of time horizon by models 1.2.2, 1.2.3.7, 1.3.2,
1.3.3.7, 1.4.2.1, and 1.4.3.7 provides additional insight into the effect of
principal’s attention when income decreases. The effect of principal’s
attention becomes less positive only for projects with modestly long time
horizons ( =.0172-.0055, p<.10) but not for projects with medium
( =.0152, p<.001) or very ( =.0220, p<.001) long time horizons. This
finding supports hypothesis H9 that predicts that principal’s attention can
better limit managerial myopia for projects with longer time horizons.
Profit center managers and managers higher in the hierarchy are likely to
be more familiar with projects with modestly long time horizons because
these projects focus on more established knowledge than other projects.
Thus, principal’s attention increases understanding by these managers
relatively less than for projects with longer time horizons. As the benefit
from principal’s attention is lower for projects with modestly long time
horizons, it does not provide as strong support against myopia for these
projects when income decreases.
In summary, the results provide support for the direct effect predicted by
hypothesis H7. Support for the moderating effect of income decrease is
found but the effect is contrary to prediction by hypothesis H8. Finally, the
moderating effect of time horizon predicted by hypothesis H9 is supported.

Results
145
5.2 Model 2: Project budget
Descriptive statistics including means, standard errors, and correlations
for the main model are presented in Table 5-1. Descriptive statistics
including means, standard errors, and correlations for subsamples based on
time horizon are presented in Table 7-1, Table 7-2, and Table 7-3.
As expected, reviewers’ mutual reviewing tenure and its squared term
have a high correlation. None of the other correlations of the independent
variables exceeds 0.7 and multicollinearity is not expected to become a
problem for these variables (e.g., Deutsch et al., 2010). Also variance
inflation factors (VIF) of the independent variables can be examined to
detect multicollinearity problems in all the models (O’Brian, 2007). VIF
values are calculated for all the following models. Again, mutual reviewing
tenure and its squared term have high VIF values but none of the others
exceed 10, indicating no multicollinearity problems.
Correlations related to variables testing the effects of income decrease are
relatively high, few even exceed 0.7. This creates potential for
multicollinearity problems. To address potential problems, a separate
model is tested for the effect of income decrease on each independent
variable. This approach also helps minimize the total number of variables,
enabling better identification of significant effects.
Model 2 is split into 44 different submodels to test effects of control and
independent variables and effects of time horizon and income decrease. All
the 44 different submodels are defined and summarized in Table 5-7.
R statistical software is used for statistical analysis. First, ordinary least
squares linear regression is applied for each model with R function lm.
Breusch-Pagan test for the heteroscedasticity of residuals of OLS models
suggests that the residuals of the most models are heteroscedastic but this
is corrected by testing the significance of the coefficients using cluster-
robust standard errors. The significance of coefficients is tested with
cluster-robust standard errors with R function coeftest from library lmtest
as proposed by Arai (2011).
Table 5-8, Table 5-9, Table 5-10, Table 7-13, Table 7-14, Table 7-15, Table
7-16, Table 7-17, Table 7-18, Table 7-19, Table 7-20, and Table 7-21
summarize the results of regression analysis for all the submodels of Model
2. These tables include F-statistics of each model and the statistics suggest
that the models are significant. Table 5-11 summarizes the effects identified
in all the submodels. The results are discussed next one hypothesis at a
time. For each hypothesis, the direct effect is analyzed first, followed by an
analysis of moderating effects.

146
Table 5-7 Summary and definitions of submodels for Model 2
Model Time horizon Independent variables Income decrease effectModel 2.1.1 All projects No, controls only NoModel 2.1.2 All projects Yes NoModel 2.1.2.1 All projects Yes, test for H4b NoModel 2.1.3.1 All projects Yes H1Model 2.1.3.3 All projects Yes H3Model 2.1.3.4.1 All projects Yes H4Model 2.1.3.4.2 All projects Yes, test for H4b H4Model 2.1.3.4.2 All projects Yes, test for H4b H4Model 2.1.3.5 All projects Yes H5Model 2.1.3.6 All projects Yes H6Model 2.1.3.7 All projects Yes H7Model 2.2.1 Modestly long time horizon No, controls only NoModel 2.2.2 Modestly long time horizon Yes NoModel 2.2.2.1 Modestly long time horizon Yes, test for H4b NoModel 2.2.3.1 Modestly long time horizon Yes H1Model 2.2.3.3 Modestly long time horizon Yes H3Model 2.2.3.4.1 Modestly long time horizon Yes H4Model 2.2.3.4.2 Modestly long time horizon Yes, test for H4b H4Model 2.2.3.4.3 Modestly long time horizon Yes, test for H4b H4Model 2.2.3.5 Modestly long time horizon Yes H5Model 2.2.3.6 Modestly long time horizon Yes H6Model 2.2.3.7 Modestly long time horizon Yes H7Model 2.3.1 Medium long time horizon No, controls only NoModel 2.3.2 Medium long time horizon Yes NoModel 2.3.2.1 Medium long time horizon Yes, test for H4b NoModel 2.3.3.1 Medium long time horizon Yes H1Model 2.3.3.3 Medium long time horizon Yes H3Model 2.3.3.4.1 Medium long time horizon Yes H4Model 2.3.3.4.2 Medium long time horizon Yes, test for H4b H4Model 2.3.3.4.3 Medium long time horizon Yes, test for H4b H4Model 2.3.3.5 Medium long time horizon Yes H5Model 2.3.3.6 Medium long time horizon Yes H6Model 2.3.3.7 Medium long time horizon Yes H7Model 2.4.1 Very long time horizon No, controls only NoModel 2.4.2 Very long time horizon Yes NoModel 2.4.2.1 Very long time horizon Yes, test for H4b NoModel 2.4.3.1 Very long time horizon Yes H1Model 2.4.3.3 Very long time horizon Yes H3Model 2.4.3.4.1 Very long time horizon Yes H4Model 2.4.3.4.2 Very long time horizon Yes, test for H4b H4Model 2.4.3.4.3 Very long time horizon Yes, test for H4b H4Model 2.4.3.5 Very long time horizon Yes H5Model 2.4.3.6 Very long time horizon Yes H6Model 2.4.3.7 Very long time horizon Yes H7

Results
147
Table 5-8 Regression analysis with R&D project budget as the dependent variable, All projects, Part 1
Regression analysisTime horizon: All R&D projectsDependent variable : R&D project budget Model 2.1.1 Model 2.1.2 Model 2.1.2.1Control variablesProject budget 0.0026 *** (0.0002) 0.0014 *** (0.0002) 0.0014 *** (0.0002)Continuation project -0.1634 * (0.0734) 0.0122 (0.0631) 0.0145 (0.0632)Agent frugality -0.0210 (0.0142) -0.0159 *** (0.0041) -0.0161 *** (0.0040)Reviewer experience -0.0004 (0.0030) -0.0050 (0.0033) -0.0051 (0.0033)
Independent variablesH1: Quantity of written ex ante reasoning 0.3127 *** (0.0445) 0.3133 *** (0.0445)H3: Number of reviewers 0.0503 (0.0579) 0.0729 (0.0601)H4: Reviewers’ mutual reviewing tenure -0.0662 . (0.0365) -0.1407 * (0.0674)H4: Reviewers’ mutual reviewing tenure squared 0.0147 . (0.0084)H5: Reviewers’ reviewing tenure with agent -0.0382 . (0.0221) -0.0379 . (0.0220)H6: Reviewers’ ties to external reviewers 0.0358 *** (0.0073) 0.0354 *** (0.0074)H7: Principal’s attention 0.0240 *** (0.0014) 0.0239 *** (0.0014)
Constant 4.4130 *** (0.1669) 2.6319 *** (0.4082) 2.6165 *** (0.4068)N 2147 2147 2147R2 0.165 0.476 0.477Adjusted R2 0.159 0.471 0.472F 30.08 *** 96.59 *** 92.18 ***. p < 0.10 * p < 0.05 ** p < 0.01 *** p < 0.001Unstandardized coefficients; Cluster-robust standard errors in parentheses.Project year control variables not reported

148
Regr
essi
onan
alys
isTi
me
hori
zon:
All
R&D
proj
ects
Dep
ende
ntva
riabl
e:R
&D
proj
ectb
udge
tM
odel
2.1.
3.1
Mod
el2.
1.3.
3M
odel
2.1.
3.4.
1M
odel
2.1.
3.4.
2M
odel
2.1.
3.4.
3Co
ntro
lvar
iabl
esPr
ojec
tbud
get
0.00
14**
*(0
.000
2)0.
0014
***
(0.0
002)
0.00
14**
*(0
.000
2)0.
0014
***
(0.0
002)
0.00
14**
*(0
.000
2)Co
ntin
uati
onpr
ojec
t0.
0146
(0.0
631)
0.01
31(0
.063
4)0.
0123
(0.0
629)
0.01
41(0
.063
1)0.
0132
(0.0
628)
Age
ntfr
ugal
ity
-0.0
161
***
(0.0
040)
-0.0
161
***
(0.0
040)
-0.0
159
***
(0.0
041)
-0.0
161
***
(0.0
040)
-0.0
159
***
(0.0
041)
Revi
ewer
expe
rien
ce-0
.005
0(0
.003
3)-0
.004
8(0
.003
4)-0
.005
0(0
.003
4)-0
.005
0(0
.003
4)-0
.004
9(0
.003
4)
Inde
pend
entv
aria
bles
H1:
Qua
ntit
yof
wri
tten
exan
tere
ason
ing
0.30
35**
*(0
.062
6)0.
3133
***
(0.0
444)
0.31
27**
*(0
.044
5)0.
3134
***
(0.0
445)
0.31
28**
*(0
.044
4)H
3:N
umbe
rofr
evie
wer
s0.
0736
(0.0
607)
0.09
74(0
.072
0)0.
0504
(0.0
565)
0.07
42(0
.060
4)0.
0642
(0.0
604)
H4:
Revi
ewer
s’m
utua
lrev
iew
ing
tenu
re-0
.140
9*
(0.0
676)
-0.1
466
*(0
.066
2)-0
.066
3(0
.044
4)-0
.139
0*
(0.0
672)
-0.0
508
(0.0
885)
H4:
Revi
ewer
s’m
utua
lrev
iew
ing
tenu
resq
uare
d0.
0147
.(0
.008
5)0.
0155
.(0
.008
2)0.
0178
.(0
.010
1)-0
.005
5(0
.019
1)H
5:Re
view
ers’
revi
ewin
gte
nure
wit
hag
ent
-0.0
380
.(0
.022
0)-0
.038
1.
(0.0
221)
-0.0
382
.(0
.022
3)-0
.038
5.
(0.0
222)
-0.0
384
.(0
.022
3)H
6:Re
view
ers’
ties
toex
tern
alre
view
ers
0.03
54**
*(0
.007
4)0.
0347
***
(0.0
074)
0.03
58**
*(0
.007
3)0.
0352
***
(0.0
074)
0.03
51**
*(0
.007
4)H
7:Pr
inci
pal’s
atte
ntio
n0.
0239
***
(0.0
014)
0.02
39**
*(0
.001
4)0.
0240
***
(0.0
014)
0.02
39**
*(0
.001
4)0.
0239
***
(0.0
014)
H8:
Inco
me
decr
ease
xQ
uant
ity
ofw
ritt
enex
ante
reas
onin
g0.
0224
(0.0
823)
H8:
Inco
me
decr
ease
xN
umbe
rofr
evie
wer
s-0
.063
3(0
.100
4)H
8:In
com
ede
crea
sex
Revi
ewer
s’m
utua
lrev
iew
ing
tenu
re0.
0003
(0.0
649)
-0.0
388
(0.0
659)
-0.2
004
(0.1
223)
H8:
Inco
me
decr
ease
xRe
view
ers’
mut
ualr
evie
win
gte
nure
squa
red
0.03
56.
(0.0
206)
H8:
Inco
me
decr
ease
xRe
view
ers’
revi
ewin
gte
nure
wit
hag
ent
H8:
Inco
me
decr
ease
xRe
view
ers’
ties
toex
tern
alre
view
ers
H8:
Inco
me
decr
ease
xPr
inci
pal’s
atte
ntio
n
Cons
tant
2.50
87**
*(0
.491
6)2.
6299
***
(0.4
122)
2.63
19**
*(0
.408
1)2.
6156
***
(0.4
068)
2.62
58**
*(0
.406
7)N
2147
2147
2147
2147
2147
R20.
477
0.47
70.
476
0.47
70.
478
Adj
uste
dR2
0.47
10.
471
0.47
10.
471
0.47
2F
87.9
6**
*88
.02
***
91.9
4**
*88
.00
***
84.4
0**
*.p
<0.
10*
p<
0.05
**p
<0.
01**
*p
<0.
001
Uns
tand
ardi
zed
coef
fici
ents
;Clu
ster
-rob
usts
tand
ard
erro
rsin
pare
nthe
ses.
Proj
ecty
earc
ontr
olva
riab
les
notr
epor
ted
Table 5-9 Regression analysis with R&D project budget as the dependent variable, All projects, Part 2
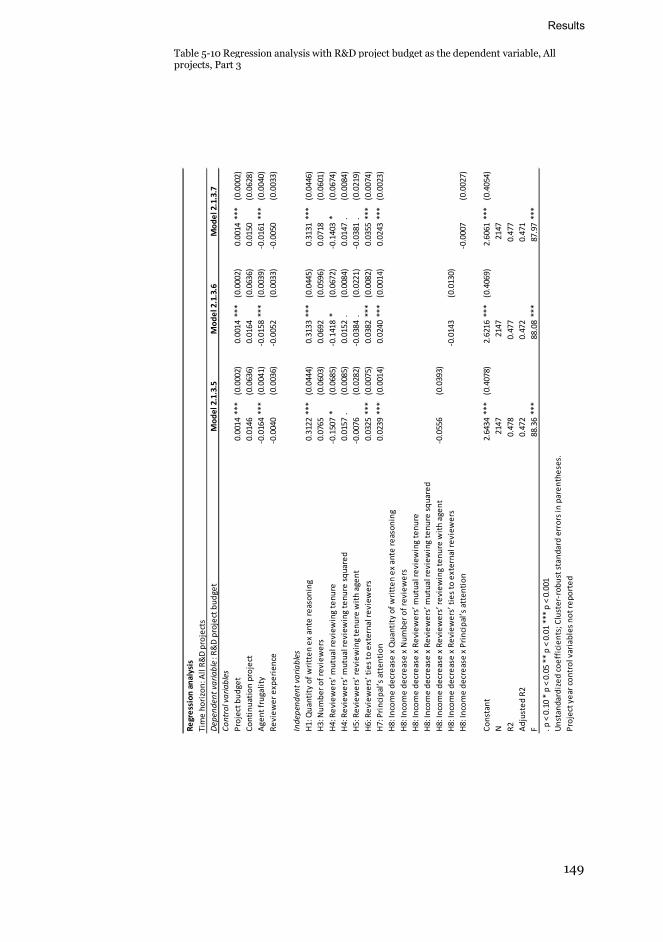
Results
149
Regr
essi
onan
alys
isTi
me
hori
zon:
All
R&D
proj
ects
Dep
ende
ntva
riabl
e:R
&D
proj
ectb
udge
tM
odel
2.1.
3.5
Mod
el2.
1.3.
6M
odel
2.1.
3.7
Cont
rolv
aria
bles
Proj
ectb
udge
t0.
0014
***
(0.0
002)
0.00
14**
*(0
.000
2)0.
0014
***
(0.0
002)
Cont
inua
tion
proj
ect
0.01
46(0
.063
6)0.
0164
(0.0
636)
0.01
50(0
.062
8)A
gent
frug
alit
y-0
.016
4**
*(0
.004
1)-0
.015
8**
*(0
.003
9)-0
.016
1**
*(0
.004
0)Re
view
erex
peri
ence
-0.0
040
(0.0
036)
-0.0
052
(0.0
033)
-0.0
050
(0.0
033)
Inde
pend
entv
aria
bles
H1:
Qua
ntit
yof
wri
tten
exan
tere
ason
ing
0.31
22**
*(0
.044
4)0.
3133
***
(0.0
445)
0.31
31**
*(0
.044
6)H
3:N
umbe
rofr
evie
wer
s0.
0765
(0.0
603)
0.06
92(0
.059
6)0.
0718
(0.0
601)
H4:
Revi
ewer
s’m
utua
lrev
iew
ing
tenu
re-0
.150
7*
(0.0
685)
-0.1
418
*(0
.067
2)-0
.140
3*
(0.0
674)
H4:
Revi
ewer
s’m
utua
lrev
iew
ing
tenu
resq
uare
d0.
0157
.(0
.008
5)0.
0152
.(0
.008
4)0.
0147
.(0
.008
4)H
5:Re
view
ers’
revi
ewin
gte
nure
wit
hag
ent
-0.0
076
(0.0
282)
-0.0
384
.(0
.022
1)-0
.038
1.
(0.0
219)
H6:
Revi
ewer
s’ti
esto
exte
rnal
revi
ewer
s0.
0325
***
(0.0
075)
0.03
82**
*(0
.008
2)0.
0355
***
(0.0
074)
H7:
Prin
cipa
l’sat
tent
ion
0.02
39**
*(0
.001
4)0.
0240
***
(0.0
014)
0.02
43**
*(0
.002
3)H
8:In
com
ede
crea
sex
Qua
ntit
yof
wri
tten
exan
tere
ason
ing
H8:
Inco
me
decr
ease
xN
umbe
rofr
evie
wer
sH
8:In
com
ede
crea
sex
Revi
ewer
s’m
utua
lrev
iew
ing
tenu
reH
8:In
com
ede
crea
sex
Revi
ewer
s’m
utua
lrev
iew
ing
tenu
resq
uare
dH
8:In
com
ede
crea
sex
Revi
ewer
s’re
view
ing
tenu
rew
ith
agen
t-0
.055
6(0
.039
3)H
8:In
com
ede
crea
sex
Revi
ewer
s’ti
esto
exte
rnal
revi
ewer
s-0
.014
3(0
.013
0)H
8:In
com
ede
crea
sex
Prin
cipa
l’sat
tent
ion
-0.0
007
(0.0
027)
Cons
tant
2.64
34**
*(0
.407
8)2.
6216
***
(0.4
069)
2.60
61**
*(0
.405
4)N
2147
2147
2147
R20.
478
0.47
70.
477
Adj
uste
dR2
0.47
20.
472
0.47
1F
88.3
6**
*88
.08
***
87.9
7**
*.p
<0.
10*
p<
0.05
**p
<0.
01**
*p
<0.
001
Uns
tand
ardi
zed
coef
fici
ents
;Clu
ster
-rob
usts
tand
ard
erro
rsin
pare
nthe
ses.
Proj
ecty
earc
ontr
olva
riab
les
notr
epor
ted
Table 5-10 Regression analysis with R&D project budget as the dependent variable, All projects, Part 3

150
Table 5-11 Summary of regression results with R&D project budget as the dependent variable
Dependent variable: All projects Time horizonR&D project budget Modestly
longMedium
longVery long
H1: Quantity of written ex ante reasoning + + + +Income decrease if different 0 0 0 0
H2: Frequency of revision of written ex ante reasoningIncome decrease if different
H3: Number of reviewers 0 0 0 0Income decrease if different 0 0 0 0
H4: Reviewers’ mutual reviewing tenure U 0 0 0Income decrease if different + U + U
H5: Reviewers’ reviewing tenure with agent - 0 0 -Income decrease if different 0 0 0 0
H6: Reviewers’ ties to external reviewers + + + +Income decrease if different 0 + - 0 0
H7: Principal’s attention + + + +Income decrease if different 0 0 0 0
Effects: Additional effects for income decrease0 = Not significant ++ = More positive than income increase+ = Positive + - = Positive but less positive that income increase- = NegativeU = U-curved

Results
151
5.2.1 Quantity of written ex ante reasoning
The results from Model 2.1.2.1 show that, as predicted by hypothesis H1,
the quantity of ex ante reasoning has a positive and significant effect
( =.3133, p<.001) on an R&D project budget. The analysis of the effect of
time horizon by models 2.2.2, 2.2.3.1, 2.3.2, 2.3.3.1, 2.4.2.1, and 2.4.3.1
provides little additional insight into the effect of the quantity of ex ante
reasoning. The effect is positive for projects with all different types of time
horizons and no support is found for hypothesis H9 that predicts that the
quantity of ex ante reasoning has larger effect for projects with longer time
horizons. The effect of income decrease is not significant in any model.
Thus, no support is found for hypothesis H8 that proposes that the quantity
of ex ante reasoning has larger effect when income decreases.
In summary, the results provide support for the effect predicted by
hypothesis H1. No support is found for the moderating effects predicted by
hypotheses H8 and H9.
5.2.2 Frequency of revision of written ex ante reasoning
This control mechanism is not studied for an R&D project budget
decisions since it is used only after project budget is approved.
5.2.3 Number of reviewers
Model 2.1.2.1 has no significant effect for the number of reviewers. Model
2.1.3.3 on the effect of income decrease provides the same result of no
significance. Also the analysis of the effect of time horizon by models 2.2.2,
2.2.3.3, 2.3.2, 2.3.3.3, 2.4.2.1, and 2.4.3.3 shows no significant effects. Thus,
hypothesis H3 is not supported.
The analyses below show that other reviewer characteristics have
significant effects on a profit center manager’s R&D project actual cost. A
possible explanation for the insignificance of the number of reviewers is
that profit center managers pay more attention to the qualitative
characteristics of reviewers rather than just the pure number of reviewers
as such.
In summary, the results do not provide support for the direct effect
predicted by hypothesis H3. Further, no support is found for the
moderating effects predicted by hypotheses H8 and H9.

152
5.2.4 Reviewers’ mutual reviewing tenure
The results from Model 2.1.2.1 show that reviewers’ mutual reviewing
tenure has a U-curved effect on an R&D project budget. However, model
2.1.3.4.3 shows that the effect disappears when the effect of income
decrease is included. In model 2.1.3.4.3, only the squared term is positive
and significant ( =.0356, p<.10) and only when income decreases.
The analysis of the effect of time horizon by models 2.2.2, 2.2.2.1,
2.2.3.4.1, 2.2.3.4.2, 2.2.3.4.3, 2.3.2, 2.3.2.1, 2.3.3.4.1, 2.3.3.4.2, 2.3.3.4.3,
2.4.2, 2.4.2.1, 2.4.3.4.1, 2.4.3.4.2, and 2.4.3.4.3 provides additional insight
into the effect of reviewers’ mutual reviewing tenure. Model 2.2.3.4.3 shows
that reviewers’ mutual reviewing tenure has a U-curved effect ( =-.3557,
p<.10, squared =.0847, p<.10) for projects with modestly long time
horizons but only when income decreases. The effect is not significant when
income increases. Similarly, model 2.4.3.4.3 shows that reviewers’ mutual
reviewing tenure has a U-curved effect ( =-.3852, p<.10, squared =.0527,
p<.05) for projects with very long time horizons but only when income
decreases. For projects with medium long time horizons, model 2.3.3.4.3
shows that only the squared term is positive and significant ( =.1670,
p<.10) and only when income decreases. It is somewhat peculiar why the
direct effect is not significant for projects with medium long time horizons
as it is for other projects. However, the results suggest that the effect of
reviewers’ mutual reviewing tenure does not increase with increasing time
horizon, and as a result, hypothesis H9, which predicts this effect, is not
supported.
The results suggest that reviewers’ mutual reviewing tenure has an effect
only when income decreases and not when income decreases. However,
hypothesis H8 is not supported because income decrease does not only
increase the positive effect of reviewers’ mutual reviewing tenure. Instead,
it seems that the effect is first negative but turns into a positive effect when
reviewers’ mutual reviewing tenure becomes high enough. The findings are
contrary to the decreasing effect of a high degree of reviewers’ mutual
reviewing tenure as predicted by hypothesis H4b. Instead, it seems that a
high degree of reviewers’ mutual reviewing tenure has an increasing effect.
However, the findings do not support hypothesis H4a either. Hypothesis
H4a predicts a linear positive effect of reviewers’ mutual reviewing tenure.
The findings show that the effect is first a decreasing, and then it begins to
increase only when reviewers’ mutual reviewing tenure becomes high
enough.
Hypotheses H4a and H4b are based on the two phenomena that were
proposed by the theory. On one hand, the theory suggests that as reviewers

Results
153
work together, they learn how to best utilize their varying knowledge. On
the other hand, as reviewers work together, their knowledge becomes more
overlapping, and the reviewers may benefit less from the variety in their
individual knowledge sets. A potential explanation for the finding of a U-
curved effect is that the first theoretical argument of the benefits from
working together requires a relatively long mutual reviewing tenure. Before
such benefits can develop, the negative effect from increasing knowledge
overlap dominates. In other words, when reviewers have low mutual
tenure, they can benefit from their different experience and knowledge. As
the mutual tenure increases, reviewers’ knowledge becomes more
overlapping and they may benefit less from the variety in knowledge in
their joint review task. However, when reviewers gather enough mutual
review experience, they gradually learn how to best utilize the remaining
differences in their knowledge. They learn to work better together, which
improves their ability to review. As a result, the effect of reviewers’ mutual
reviewing tenure first decreases but then begins to increase, as the results
show.
In summary, the results do not support hypotheses H4a and H4b, but
they suggest that the effect is somewhat different from the prediction. No
support is found for the moderating effects predicted by hypotheses H8 and
H9.
5.2.5 Reviewers’ reviewing tenure with agent
The results from Model 2.1.2.1 show that, as predicted by hypothesis H5b,
reviewers’ reviewing tenure with agent has a negative and significant effect
( =-.0379, p<.10) on an R&D project budget. Model 2.1.3.5 on the effect of
income decrease provides no support for hypothesis H8 that predicts that
the effect of reviewers’ reviewing tenure with agent increases when income
decreases.
The analysis of the effect of time horizon by models 2.2.2, 2.2.3.5, 2.3.2,
2.3.3.5, 2.4.2.1, and 2.4.3.5 provides more insight into the effect. The
analysis shows that reviewers’ reviewing tenure with agent has a negative
and significant effect ( = -.1160, p<.01) for projects with very long time
horizons but not for other projects. This finding provides support for
hypothesis H5b, which predicts that reviewers’ reviewing tenure with agent
has a negative effect because profit center managers are concerned about
the reviewers’ potential bias for the agent due to the reviewers’ past social
ties with the agent. This negative effect is only limited to projects with very
long time horizons probably because these projects mostly focus on novel
knowledge that is less familiar to the profit center managers. As profit

154
center managers are expected to be more familiar with the knowledge that
is related to projects with modestly and medium long time horizons, profit
center managers can better notice and take into account possible biases due
to reviewers being familiar with project managers. Hypothesis H9 predicts
that the positive effect from reviewers’ reviewing tenure with agent
increases as time horizon increases but the findings suggest that on the
contrary, it is the negative effect that increases.
In summary, the results provide support for the effect predicted by
hypothesis H5b. The alternative hypothesis H5a is not supported. No
support was found for the moderating effect predicted by hypothesis H8.
Finally, support for the moderating effect of time horizon is found but the
effect is contrary to the prediction by hypothesis H9.
5.2.6 Reviewers’ ties to external reviewers
The results from Model 2.1.2.1 show that reviewers’ ties to external
reviewers have positive and significant effect ( =.0354, p<.001) on an R&D
project budget. This finding supports hypothesis H6. Model 2.1.3.6 further
shows that this effect does not change when income decreases.
The analysis of the effect of time horizon by models 2.2.2, 2.2.3.6, 2.3.2,
2.3.3.6, 2.4.2.1, and 2.4.3.6 provides some additional results about the
effect. The effect of reviewers’ ties to external reviewers becomes less
positive only for projects with modestly long time horizons ( =.0377-.0358,
p<.05) but not for projects with medium ( =.0495, p<.01) or very
( =.0333, p<.001) long time horizons. A possible explanation for the
findings is that the gain from external reviewers is higher for projects with
longer time horizons because such projects involve more novel knowledge.
The access to broader knowledge through external reviewers helps the
reviewers to better evaluate projects. On the other hand, such a gain is
lower for projects with modestly long time horizons because these projects
tend to be based on less novel knowledge. As income decreases, profit
center managers start to question a project’s reasoning more critically and
intensively. Because the gain from external reviewers is relatively weaker
for projects with modestly long time horizons, the positive effect of
reviewers’ ties to external reviewers becomes less positive. This finding is
contrary to hypothesis H8, which predicts that the effect of reviewers’ ties
to external reviewers increases when income decreases. On the other hand,
the effect does not become weaker for projects with longer time horizons
because these projects benefit more from external reviewers. This result
supports hypothesis H9, which predicts that the positive effect of reviewers’
ties to external reviewers is stronger for projects with longer time horizons.

Results
155
In summary, the results provide support for the direct effect predicted by
hypothesis H6. Support for the moderating effect of income decrease is
found, but the effect is contrary to the prediction by hypothesis H8. Finally,
the moderating effect of time horizon predicted by hypothesis H9 is
supported.
5.2.7 Principal’s attention
The results from Model 2.1.2.1 show that the principal’s attention has
positive and significant effect ( =.0239, p<.001) on an R&D project budget.
Thus, hypothesis H7 is supported. Model 2.1.3.7 provides no support for
hypothesis H8, which predicts that the effect of a principal’s attention
increases when income decreases.
The analysis of the effect of time horizon by models 2.2.2, 2.2.3.7, 2.3.2,
2.3.3.7, 2.4.2.1, and 2.4.3.7 provides little additional insight into the effect.
The effect is positive for projects with all different types of time horizons,
and no support is found for hypothesis H9, which predicts that the quantity
of ex ante reasoning has a larger effect for projects with longer time
horizons.
In summary, the results provide support for the direct effect predicted by
hypothesis H7. No support was found for the moderating effects predicted
by hypotheses H8 and H9.
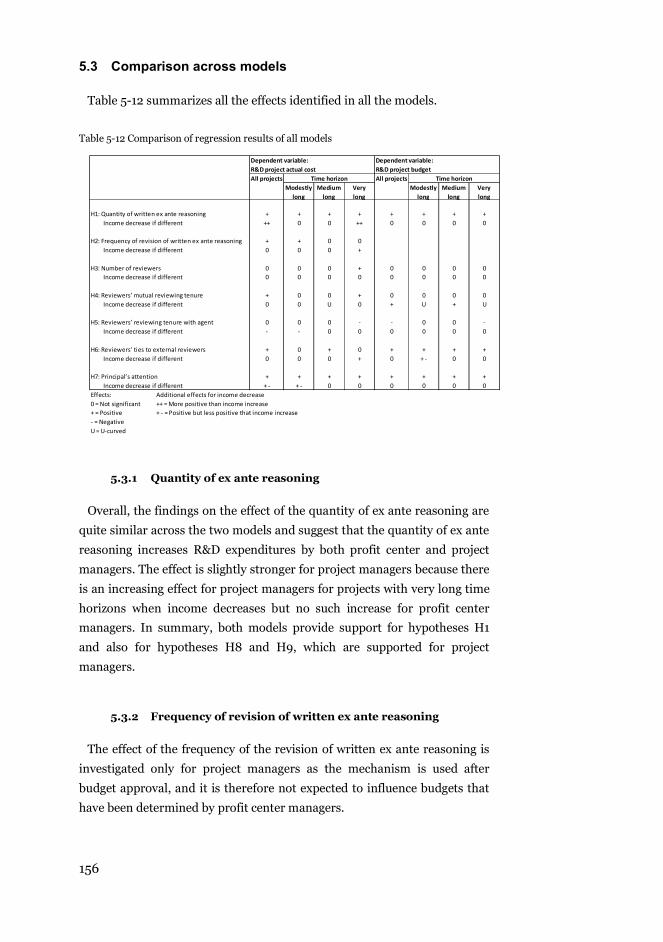
156
5.3 Comparison across models
Table 5-12 summarizes all the effects identified in all the models.
Table 5-12 Comparison of regression results of all models
5.3.1 Quantity of ex ante reasoning
Overall, the findings on the effect of the quantity of ex ante reasoning are
quite similar across the two models and suggest that the quantity of ex ante
reasoning increases R&D expenditures by both profit center and project
managers. The effect is slightly stronger for project managers because there
is an increasing effect for project managers for projects with very long time
horizons when income decreases but no such increase for profit center
managers. In summary, both models provide support for hypotheses H1
and also for hypotheses H8 and H9, which are supported for project
managers.
5.3.2 Frequency of revision of written ex ante reasoning
The effect of the frequency of the revision of written ex ante reasoning is
investigated only for project managers as the mechanism is used after
budget approval, and it is therefore not expected to influence budgets that
have been determined by profit center managers.
Dependent variable: Dependent variable:R&D project actual cost R&D project budgetAll projects Time horizon All projects Time horizon
Modestly long
Medium long
Verylong
Modestly long
Medium long
Very long
H1: Quantity of written ex ante reasoning + + + + + + + +Income decrease if different ++ 0 0 ++ 0 0 0 0
H2: Frequency of revision of written ex ante reasoning + + 0 0Income decrease if different 0 0 0 +
H3: Number of reviewers 0 0 0 + 0 0 0 0Income decrease if different 0 0 0 0 0 0 0 0
H4: Reviewers’ mutual reviewing tenure + 0 0 + 0 0 0 0Income decrease if different 0 0 U 0 + U + U
H5: Reviewers’ reviewing tenure with agent 0 0 0 - - 0 0 -Income decrease if different - - 0 0 0 0 0 0
H6: Reviewers’ ties to external reviewers + 0 + 0 + + + +Income decrease if different 0 0 0 + 0 + - 0 0
H7: Principal’s attention + + + + + + + +Income decrease if different + - + - 0 0 0 0 0 0
Effects: Additional effects for income decrease0 = Not significant ++ = More positive than income increase+ = Positive + - = Positive but less positive that income increase- = NegativeU = U-curved

Results
157
5.3.3 Number of reviewers
The findings on the effect of the number of reviewers are quite similar
across the two models because the number of reviewers has no significant
effect in most cases. It seems that it is usually more the qualities than the
sheer quantity of reviewers that determines the amount of an investment.
However, the number of reviewers has a positive effect on an R&D project
actual cost for projects with very long time horizons. In summary,
hypotheses H3 and H9 are supported for project managers. No hypotheses
are supported for profit center managers.
5.3.4 Reviewers’ mutual reviewing tenure
The findings suggest that reviewers’ mutual reviewing tenure has different
types of effects for project managers and profit center managers. Reviewers’
mutual reviewing tenure has a positive effect for investments by project
managers but only when a project’s time horizon is medium long or longer.
On the other hand, for profit center managers, reviewers’ mutual reviewing
tenure depends on income decrease and is significant only when income
decreases. Moreover, the effect is first negative and starts to increase when
reviewers’ mutual reviewing tenure becomes high enough. In summary,
hypotheses H4a and H9 are supported for project managers, whereas the
effect for profit center managers is different from the predictions of
hypotheses H4a and H4b.
5.3.5 Reviewers’ reviewing tenure with agent
The findings show that reviewers’ reviewing tenure with agent has quite
similar effects for project managers and profit center managers. The effect
is a negative effect for projects with very long time horizons for both project
managers and profit center managers. However, in addition, the effect is
negative for project managers regardless of time horizon when income
decreases. In other words, project managers are more sensitive to
reviewers’ reviewing tenure with agent than profit center managers.
Because income decrease has no effect for profit center managers, it seems
that project managers are somewhat overcautious in relation to income
decreases. In summary, for both project managers and profit center
managers, the findings support hypothesis H5b and are contrary to
hypothesis H9. In addition, the findings for project managers are contrary
to hypothesis H8.

158
5.3.6 Reviewers’ ties to external reviewers
The findings suggest that reviewers’ ties to external reviewers have
different types of effects for project managers and profit center managers.
Reviewers’ ties to external reviewers seem to provide somewhat more
benefit for profit center managers than project managers. The effect is
positive and significant for project managers only for projects with medium
long or longer time horizons. On other hand, the effect is positive for profit
center managers regardless of time horizon even though the effect is
slightly weaker for projects with modestly long time horizons when income
decreases. In summary, hypotheses H1 and H9 are supported for both
project managers and profit center managers. Hypothesis H8 is supported
for project managers, but the findings are contrary to hypothesis H8 for
profit center managers.
5.3.7 Principal’s attention
The findings on the effect of a principal’s attention are quite similar for
profit center and project managers and suggest that a principal’s attention
increases R&D expenditures by both profit center and project managers.
Project managers and profit center managers differ in their reactions to
income decrease. Income decrease does not change the effect for profit
center managers, but it weakens the positive effect for project managers for
projects with modestly long time horizons. The findings suggest that, as in
case of reviewers’ reviewing tenure with agent, project managers are
somewhat overcautious on income decreases because profit center
managers do not seem to react to income decreases in a similar manner. In
summary, hypothesis H7 is a support for both project managers and profit
center managers. In addition, the findings for project managers support
hypothesis H9, but they are contrary to hypothesis H8.

Results
159
5.4 Summary of results
The results of the hypotheses tests are summarized in Table 5-13. The
results are discussed further in the next chapter.
Table 5-13 Summary of results
Investments by (i) an agent and (ii) a principal in learning new knowledge (i) Agent (ii) Principalthat is likely to take a long time to generate incomeare positively related to the
H1 Quantity of written ex ante reasoning of an investment’s income potential
Supported Supported
H2 Frequency of revision of written ex ante reasoning of an investment’s income potential
Supported
H3 Number of reviewers Supported Not significantH4 (a) Reviewers’ mutual reviewing tenure, or alternatively, Supported Not significant
(b) Have an inverted U relationship with reviewers’ mutual reviewing tenure
Not significant Contrary supported
H5 (a) Reviewers’ reviewing tenure with the agent, or alternatively, Not significant Not significant(b) Are negatively related to reviewers’ reviewing tenure with the agent
Supported Supported
H6 Reviewers’ ties to external reviewers Supported SupportedH7 Principal’s attention to the investment Supported Supported
The positive effects predicted by
H8 H1 through H7 are expected to be amplified when income decreases
Supported: H1, H2. H6Contrary: H5,H7
Supported: -Contrary: H6
H9 H1 through H8 are expected to be amplified as an investment’s time horizon increases
Supported: H1, H3, H4, H6, H7, H8Contrary: H5
Supported: H6Contrary: H5

160
6. Discussion and conclusions
6.1 Discussion of results
This study set out to analyze how large organizations can improve the
controls against managerial myopia at the lower organizational levels to
increase investments in learning new knowledge that is likely to take a long
time to generate income. The analysis began with a review of the extant
body of knowledge that is related to the research problem. In particular,
previous research on corporate governance, corporate internal controls,
investments in learning, and managerial myopia were reviewed. Previous
research was found to have identified a number of control mechanisms
against managerial myopia at the upper echelons. The arguments that had
been developed for the apex of an organization were extended to the lower
organizational levels.
The hypotheses were tested empirically with quantitative statistical
methods, applying a regression analysis. The empirical testing was based on
data from research and development projects within a division of a large,
publicly traded, global industrial corporation. The sample consisted of over
260 million euros invested in 2,147 research and development projects over
a thirteen-year period between 1997 and 2009.
6.1.1 The written ex ante reasoning as a control mechanism
The first two hypotheses of this study propose that a principal can
increase investments in learning new knowledge that is likely to take a long
time to generate income by asking an agent to prepare a written ex ante
reasoning of an investment’s income potential. A written ex ante reasoning
can outline the cause-and-effect relationships that exist between future
income and the factors that influence it. A written ex ante reasoning is
developed as an extension from the concept of strategic controls, with
which corporate management can evaluate division managers based on
their longer term strategic decisions rather than short-term financial
performance only (Gupta, 1987; Hill and Hoskisson, 1987; Baysinger and

Discussion and conclusions
161
Hoskisson, 1989, 1990; Hitt et al., 1990; Goold and Quinn, 1990; Hoskisson
et al., 1991, 1993; Johnson et al., 1993; Hitt et al., 1996; Barringer and
Bluedorn, 1999). Whereas strategic controls are limited to controls that are
based on the strategies at the apex of a corporation, written ex ante
reasoning can be applied to other types of investments at the lower
organizational levels.
Hypothesis H1 predicts that investments by both a principal and an agent
in learning new knowledge that is likely to take a long time to generate
income are positively related to the quantity of written ex ante reasoning of
an investment’s income potential. The empirical findings on both the agent
and the principal support this hypothesis. Hypothesis H2 proposes that
investments by both the principal and the agent in learning new knowledge
that is likely to take a long time to generate income are positively related to
the frequency of the revisions of written ex ante reasoning for an
investment’s income potential. No empirical data are available for testing
the hypothesis for the principal, but evidence supporting the hypothesis for
the agent is found. In conclusion, the empirical findings suggest that, as
predicted by the hypotheses, written ex ante reasoning can curb managerial
myopia at the organizational levels below the upper echelons.
6.1.2 Reviewers as control mechanism
Hypotheses H3 through H6 propose that a principal can increase
investments in learning new knowledge that is likely to take a long time to
generate income by hiring reviewers to support the principal in controlling
an agent. The principal can ask the reviewers to give their opinions on
supporting the principal to evaluate the potential income from resources
that are delegated to the agent and the agent’s competence in managing
such resources. Reviewers as a control mechanism are based on an
extension of the role of the board of directors at the very apex of a
corporation. The corporate governance literature has investigated
extensively the role the board of directors, in particular its role in
controlling management (e.g., Jensen and Meckling, 1976; Holmström,
1979; Fama, 1980; Fama and Jensen, 1983a, 1983b). However, the role of
the board of directors is limited to monitoring top management. The
control of the reviewers proposed in the study investigates the application
of a similar mechanism at the lower organizational levels. In particular,
previous research on boards has identified that the effectiveness of a board
in its role of controlling management depends on various characteristics
such as board members’ quantity and qualities such as tenure and social
ties. Accordingly, this study investigates how the similar attributes of the

162
reviewers influence investments in learning new knowledge that is likely to
take a long time to generate income.
Hypothesis H3 predicts that investments by both a principal and an agent
in learning new knowledge that is likely to take a long time to generate
income are positively related to the number of reviewers who are hired by
the principal to control the agent. The empirical findings of this study
provide support for hypothesis H3 for the agent but not for the principal.
However, the analysis of the effect of the time horizon notes that the effect
is positive for the agent only when time horizon is very long. It seems that it
is usually the qualities of reviewers rather than the quantity as such that
determines the decision making by an agent and a principal. Nevertheless,
the principal can also sometimes curb managerial myopia and increase
investments in long-term learning by hiring reviewers to review the agent.
As with the mutual tenure of board members (Alderfer, 1986; Singh and
Harianto, 1989; Forbes and Milliken, 1999, reviewers’ mutual reviewing
tenure is also expected to influence the effectiveness of their control.
Applied to reviewers, this finding suggests that with increasing mutual
tenure, reviewers learn how to best utilize their varying knowledge in
developing new insight into improving an agent’s learning plans and
utilizing their external ties to facilitate the agent’s cooperation with external
resources owners. The agent can also feel more confident that reviewers can
better evaluate his or her competence, thereby further decreasing
managerial myopia. Hypothesis H4a posits that investments in learning
new knowledge that is likely to take a long time to generate income are
positively related to reviewers’ mutual reviewing tenure. On the other hand,
the research on boards suggests that excessive mutual tenure may cause
groupthink, which hinders the effectiveness of the board (Kosnik, 1990;
Mallette and Fowler, 1992; Johnson et al., 1993; Golden and Zajac, 2001;
Tuggle et al., 2010a). Thus, an alternative hypothesis, H4b, predicts that the
effect of reviewers’ mutual reviewing tenure is not linear but curvilinear,
that is, the effect begins to decrease when mutual tenure is excessively long.
The empirical evidence shows that the effect of reviewers’ mutual
reviewing tenure is different for an agent and a principal. The empirical
evidence supports the positive effect predicted by hypothesis H4a for an
agent. However, the effect is somewhat weak because it is significant only
when time horizon is long enough. For the principal, the effect of reviewers’
mutual reviewing tenure is somewhat different than predicted by either
hypothesis H4a or H4b. In particular, the effect is significant only when
income decreases and it is U-curved: it is first negative, but it becomes
positive when reviewers’ mutual reviewing tenure is high enough. However,
such an effect seems possible based on the two contrary effects as proposed

Discussion and conclusions
163
by the related theory, but they seem to be balanced differently than
predicted. When reviewers have low mutual tenure, they can benefit from
their different experience and knowledge. As the mutual tenure increases,
the reviewers’ knowledge overlaps more, and they may benefit less from the
variety in knowledge in their joint review task. However, when reviewers
gather enough mutual review experience, they gradually learn how to best
utilize the remaining differences in their knowledge. They learn to work
better together, which improves their ability to conduct a review. As a
result, the effect of reviewers’ mutual reviewing tenure first decreases, but it
eventually begins to increase. In conclusion, the effect of reviewers’ mutual
reviewing tenure is somewhat different than predicted, but it provides the
principal with a control mechanism to curb managerial myopia at the
organizational levels below the upper echelons.
Hypotheses H5a and H5b propose that reviewers’ reviewing tenure with
an agent has either a positive (a) or a negative (b) effect on investments in
learning new knowledge that is likely to take a long time to generate
income. The positive effect is based on the predictions that as reviewers
learn to know an agent, they can better counsel the agent and understand
the agent’s competence. On the other hand, the past research on boards
suggests that board members with long tenure are more likely to have
become friendly with management, compromising their effectiveness in
monitoring (Alderfer, 1986; Singh and Harianto, 1989; Sundaramurthy,
1996; Shen, 2003; Kor, 2006; Dalton et al., 2007). Thus, an alternative
hypothesis of a negative effect by reviewers’ reviewing tenure with an agent
is formulated.
The empirical findings of this study support hypothesis H5b for both an
agent and a principal. The negative effect suggests that both the agent and
the principal are concerned about the potential bias of the reviewers who
are familiar with the agent. However, the findings suggest that such
concern depends on both time horizon and income changes. For both the
agent and the principal, the negative effect is significant only when time
horizon is long enough and if income is not decreasing. It seems that when
time horizon is shorter, investments tend to involved less novel
information, and it is easier for a principal to identify and take into account
any bias by reviewers. Moreover, the findings show that an agent tends to
be more cautious with respect to potential bias because the effect is
negative for the agent regardless of time horizon when income decreases.
The principal does not react to income decrease with similar caution. In
conclusion, the findings of this study suggest that when using reviewers as a
control to curb managerial myopia, attention needs to be paid to using

164
reviewers who are too familiar with an agent because it can limit
investments in long-term learning in certain situations.
Hypothesis H6 predicts that reviewers’ ties to external reviewers increase
investments in learning new knowledge that is likely to take a long time to
generate income. The hypothesis is based on the corporate governance
literature that suggests that board member’s appointments in additional
external boards provide them with contact with other directors, and such
contacts are a source of valuable information that helps the board members
to increase their effectiveness (Pfeffer and Salancik, 1978; Burt, 1980;
Davis, 1991; Haunschild, 1993; Haunschild and Beckman, 1998; Carpenter
and Westphal, 2001). Similarly, when reviewers work with various other
reviewers in reviewing different investments and agents, they form ties to
many reviewers who can provide them with valuable information that
contributes to their effectiveness as reviewers.
The empirical findings of this study provide support for hypothesis H6 for
an agent and a principal. The effect of the reviewers’ ties to external
reviewers is positive for both the agent and the reviewer. Reviewers’ ties to
external reviewers seem to provide somewhat more benefit for the principal
than the agent. The effect is positive and significant for the agent only when
time horizon is long enough. When time horizon is shorter, the investment
is likely to involve less novel knowledge, and the agent experiences less of a
benefit from the external reviewers who can provide access to novel
knowledge. On other hand, the effect is positive for the principal, regardless
of the time horizon, even though the effect is slightly weaker when income
decreases. In conclusion, the principal can curb managerial myopia and
increase investments in long-term learning by hiring reviewers who have
extensive ties to other external reviewers due to their past reviewing
experiences.
6.1.3 The effect of a principal’s attention
Hypothesis H7 predicts that investments in learning new knowledge that
is likely to take a long time to generate income are increased by a principal’s
attention to the investment. Ocasio (1997) proposed that decision makers
are more likely attend to issues with greater value and relevance to an
organization. The literature on corporate governance also proposes that the
attention of boards of directors is subject to the mechanisms that is
proposed by the attention-based view of a firm (e.g., Golden and Zajac,
2001; Tuggle et al., 2010b). In addition, management is expected to pay the
most attention to the largest investments that are the most critical to
determining income (e.g., Chandler, 1962; Bower, 1970). This study

Discussion and conclusions
165
proposes that a principal’s attention as a function of investment size also
influences the principal’s attention to learning investments. Increased
attention by a principal is expected to improve the principal’s
understanding of an investment and an agent’s competence. Therefore,
both investments by an agent and a principal are expected to increase. The
empirical results provide support for hypothesis H7 for both the agent and
the principal.
6.1.4 The effects of income decrease
Hypothesis H8 predicts that the positive effects predicted by hypotheses
H1 through H7 are amplified when income decreases. When managerial
myopia is not controlled, an income decrease is expected to increase such
myopia. This is because when an agent is controlled based on short-term
financial control, an income decrease increases the agent’s experience of
pressure to improve income in the next period. Minimizing investments in
long-term learning is the most attractive alternative to decreasing costs
because such a cut does not decrease short-term sales. Because the controls
against myopia are expected to help a principal to evaluate an agent’s
competence, which is also based on attributes other than short-term
financial performance, income decrease is likely to have a relatively lesser
impact on the evaluation of an agent’s competence. In particular, the
agent’s future career is less dependent on the agent’s ability to increase
income over the subsequent period. Thus, the agent experiences less
pressure to increase income by resorting to cutting investments in learning.
As a consequence, managerial myopia is not increased as much after an
income decrease.
The empirical findings support hypothesis H8 for the agent for a number
of mechanisms hypothesized above. For the agent, the effects of the
quantity (H1) of a written ex ante reasoning and the frequency (H2) of the
revision of the written ex ante reasoning and the reviewers’ ties to external
reviewers (H6) increase when income decreases. However, hypothesis H8 is
not supported for the principal for any of the mechanisms that are
hypothesized above.
On the other hand, the results on some of the mechanisms suggest that
the effect of income decrease is more refined. The effect of reviewers’
reviewing tenure with an agent (H5) becomes negative and significant for
the agent when income decreases. As already discussed above for
hypothesis H5, such a negative effect is expected to be due to a concern that
reviewers who are familiar with an agent are biased for the agent, which

166
weakens the credibility of the reviewers in evaluating the agent’s
competence when income decreases.
In addition, the positive effect of a principal’s attention (H7) becomes
weaker for an agent when income decreases. This finding suggests that the
effect of a principal’s attention is moderated by the time horizon. The
principal’s attention provides the most gains for projects with relatively
long time horizons. This finding is expected because such projects tend to
involve more knowledge that is novel for a principal, and the principal’s
attention increases his or her understanding, which helps to decrease
managerial myopia. On the other hand, the principal is more familiar with
project with only modestly long time horizons and the benefit from the
principal’s attention is weaker. Such weaker benefits are more easily
decreased when the pressure for managerial myopia increases when income
decreases.
For the principal, the positive effect of the reviewers’ ties to external
reviewers (H6) also becomes weaker for investments with modestly long
time horizons when income decreases. Such an effect seems possible
because investments with modestly long time horizons tend to benefit less
from external reviewers because they involve less novel knowledge than
investments with longer time horizons. The benefit from external reviewers
is highest for longer term investments that involve more novel knowledge.
As income decreases, the principal begins to question the investments more
critically and intensively, and the gain from external reviewers is less useful
in addressing such increasing pressure.
6.1.5 The effect of time horizon
Hypothesis H9 predicts that the positive effects predicted by hypotheses
H1 through H8 are amplified as an investment’s time horizon increases.
Previous research on organizational learning suggests that some learning
investments take much longer to generate income than others (e.g.,
Tushman and Anderson, 1986; March, 1991; Christensen and Bower, 1996).
An agent is expected to have different preferences for long-term learning
investments with different temporal distances in generating income. The
more distant in time the potential income from an investment, the less
likely the agent’s income will be impacted by the learning. Therefore, if the
agent is evaluated based on financial performance, the agent’s motivation
to make a learning investment decreases as the investment’s time to
generate potential income decreases. Because the controls against myopia
are expected to help the principal to evaluate the agent’s competence based
on attributes other than financial performance, income decrease is likely to

Discussion and conclusions
167
have a relatively lesser impact on the evaluation of the agent’s competence.
Thus, the agent has fewer reasons to determine a preference for
investments based excessively on their time to generate potential income.
Consequently, this process increases both an agent’s and a principal’s
investments in learning new knowledge that is likely to take a long time to
generate income.
The empirical findings support hypothesis H9 for a number of
mechanisms as hypothesized above. For the agent, the effects of the
quantity of written ex ante reasoning (H1), the number of reviewers (H3),
the reviewers’ mutual reviewing tenure (H4), the reviewers’ ties to external
reviewers (H6), the principal’s attention (H7), and the positive effect of
income decrease (H8) on the quantity of written ex ante reasoning and the
frequency of revisions of written ex ante reasoning and on the reviewers’
ties to external reviewers increase when an investment’s time horizon is
extended. For a principal, the effect of the reviewers’ ties to external
reviewers (H6) increases when an investment’s time horizon increases.
However, the results for some other mechanisms suggest that the effect of
the time horizon is more complex. The effect of the frequency of revisions of
a written ex ante reasoning (H2) seems to include a positive element as
predicted by hypothesis H9; however, in addition, the results hint at the
existence of an additional positive effect. The frequency of revisions of
written ex ante reasoning seems to also be beneficial for projects with
modestly long time horizons and a possible explanation is that these
projects are closest to market launch, and the principal is likely to be paying
attention to such projects more often to ensure a smooth launch to market.
In addition, the effect of the time horizon seems to be contrary to the
hypothesis for the effect of reviewers’ reviewing tenure with an agent (H5)
for the agent and the principal. Rather than increasing the positive effect of
reviewers’ reviewing tenure with an agent as predicted by hypothesis H9,
increasing a time horizon actually increases the negative effect of reviewers’
reviewing tenure with an agent. As discussed above, this finding seems to
be due to an increasing concern for potential bias by reviewers who are
familiar with the agent. The empirical results suggest that the potential
benefits from reviewers’ reviewing tenure with an agent are lost through a
principal’s decreasing ability to evaluate the bias by reviewers who are
familiar with an agent.

168
6.2 Theoretical and empirical contributions
The theoretical and empirical results provide several contributions. The
extension of the applications of agency theory to the lower organizational
levels is the major contribution of this study. In addition, this study makes
a number of other contributions to the literature on managerial myopia and
organizational learning. The theory that is developed in this study is
subjected to quantitative empirical testing. Thus, the theoretical
contributions of this study are supported by empirical validation.
This study contributes to agency theory by extending applications of
agency theory to the lower organizational levels. Agency theory posits that a
principal can control an agent through a combination of compensation and
monitoring. Previous research has investigated how compensation can be
applied throughout organizations that consist of several levels. However,
the past research on the applications of certain monitoring mechanisms has
focused on the upper echelons of organizations. This study examines two
such monitoring mechanisms, boards of directors and strategic controls,
and extends them with applications at the lower organizational levels.
Boards of directors have been identified as applications of monitoring as
proposed by agency theory (e.g., Fama and Jensen, 1983a; Eisenhardt,
1989). A principal can monitor an agent by using a board of directors, and
such monitoring helps the principal to reduce agency costs. Previous
research on corporate governance has investigated how shareholders can
monitor the management by a board of directors, but the use of a board of
directors is limited to this highest organizational level. Nevertheless,
management also needs to control agents at the lower organizational levels,
and managers at the lower organizational levels have their own agents that
need to be monitored. However, the past research has not examined how
managers at the lower organizational levels would utilize a control
mechanism that is similar to a board of directors to control their agents.
This study contributes to agency theory by examining how managers at the
lower organizational levels can also control their agents with reviewers, a
mechanism that is similar to a board of directors. Because most of the
decisions that influence the performance of large organizations are made by
managers at the lower organizational levels, this contribution provides a
relevant theoretical extension of the application of monitoring mechanisms
proposed by agency theory.
Strategic controls serve as another monitoring mechanism that has been
investigated by the past research on corporate internal controls (e.g.,
Gupta, 1987; Hill and Hoskisson, 1987; Baysinger and Hoskisson, 1989,
1990; Hitt et al., 1990; Goold and Quinn, 1990; Hoskisson et al., 1991, 1993;
Discussion and conclusions
169
Johnson et al., 1993; Hitt et al., 1996; Barringer and Bluedorn, 1999).
Previous research on corporate internal controls has focused on examining
how a CEO as a principal can monitor the division management as an agent
through strategic controls. This study extends the scope of strategic
controls in two dimensions. First, the scope is extended from the strategy
making to learning investments. Second, the focus on the CEO-division
management dyad is extended to cover the lower organizational levels. This
study contributes to agency theory by examining how managers at the lower
organizational levels can control their agents by applying ex ante reasoning,
a mechanism derived from strategic controls as an application of
monitoring of an agent by a principal. This contribution provides a relevant
theoretical extension of the application of the monitoring mechanism
proposed by agency theory because most of decisions that influence the
performance of large organizations are made by managers at the lower
organizational levels.
In addition to extending the applications of agency theory to the lower
organizational levels, this study also makes a number of other contributions
to the literature on managerial myopia and organizational learning.
The literature on managerial myopia has extensively examined how
financial controls limit long-term learning in organizations (Hayes and
Abernathy, 1980; Hill, 1985; Porter, 1992; Hoskisson et al., 1993; Jensen,
1993; Levinthal and March, 1993; Laverty, 1996; Zahra, 1996; Miller, 2002;
Marginson and McAulay, 2008: Barrett, 2010; Souder and Shaver, 2010).
On the other hand, the literature has paid less attention to identifying the
factors that can curb the myopic effect produced by financial controls. A
stream of research has studied how strategic controls can be used to
balance financial controls to reduce managerial myopia, but it has focused
on the CEO-division management dyad and strategy making (Hitt et al.,
1990; Johnson et al., 1993; Hitt et al., 1996; Barringer and Bluedorn.,
1999). This study extends the past research on strategic controls by showing
that an ex ante reasoning can be applied at the lower organizational levels
to limit managerial myopia. In addition, this study identifies the use of
reviewers at the lower organizational levels as a control for limiting
managerial myopia. Similar control not been investigated at the lower
organizational levels by previous research. In conclusion, this study
contributes to the literature on managerial myopia by showing that the
control mechanisms examined in this study can be applied to limit
managerial myopia.
The literature on organizational learning has paid substantial attention to
analyzing how investments in learning depend on financial performance
(e.g., Cyert and March, 1963; Kahneman and Tversky, 1979; Staw et al.,
170
1981; Singh, 1986; Hundley et al., 1996; Mone at al., 1998; Greve, 2003,
Chen and Miller, 2007; Chen, 2008). This research is dominated by the
behavioral theory of the firm that was initiated by Cyert and March (1963).
The research has investigated how an organization’s financial performance,
which is reflected by measures such as current income and its relationship
to the past and peer income, slack, and the closeness to bankruptcy, can
influence an organization’s investments in areas such as learning, research
and development intensity. This study suggests that an organization’s
reaction to financial performance is influenced by the controls that are
applied within the organization. In particular, the findings of this study
show that the effect from controls such as ex ante reasoning and reviewers
can be amplified or attenuated when an organization’s income decreases.
Because investments in learning depend on such moderation, these
organizational controls influence how investments in learning change when
income decreases. This study contributes to the research on organizational
learning by showing how the control mechanisms examined in this study
can have moderating effects with financial performance on determining
investments in learning.
The literature on organizational learning has also paid considerable
attention to identifying the factors that determine the balance between
exploration and exploitation (March, 1991). However, the past research on
exploration and exploitation has focused on investigating how
organizational structure, and decentralization in particular, determines the
balance between exploration and exploitation (e.g., Gupta et al., 2006; Fang
et al., 2010). The findings of this study show that organizational controls
influence investments in long-term learning. On the other hand, March
(1991) noted that exploration is more remote in time than exploitation.
Even if this study does not specifically examine exploration and
exploitation, exploration can involve long-term learning. The findings of
this study contribute to the literature on exploration and exploitation by
suggesting that it can be extended by investigating how the organizational
control mechanisms examined in this study influence the balance between
exploration and exploitation.
6.3 Managerial implications
The findings of this study have several implications for practitioners. In
essence, this study aims to support the growth and long-term
competitiveness of large organizations. In particular, this study is intended
to help managers who perceive opportunities for growth and

Discussion and conclusions
171
competitiveness but feel that they lack the adequate tools to motivate their
organizations to pursue such opportunities. The tradition of short-term
financial control usually dominates organizations and shapes many
organizational processes throughout an organization. In such an
organizational environment, managers may feel that even if they would like
to motivate their organization to pursue the learning that is needed for
growth and competitiveness, they actually have few alternatives other than
short-term financial control. This study provides some ideas that managers
can adopt and adapt further to meet their needs to balance the managerial
myopia that is inflicted by the dominance of short-term financial control. In
particular, this study identifies the use of written ex ante reasoning and
reviewers as potential controls to encourage investments in learning new
knowledge that is likely to take a long time to generate income.
The findings of this study suggest that managers who wish to increase
investments in long-term learning can request that their organizations
establish information systems and processes for the preparation of written
ex ante reasoning. For example, managers can ask their subordinates to
plan and justify their investments properly in written format before making
such investments. Managers may also require their subordinates to adopt a
similar practice and to cascade the use of written ex ante reasoning
throughout the lower organizational levels. To make written ex ante
reasoning effective, managers need to read the prepared reports and reread
them again over time to evaluate the competence of their reports.
Moreover, managers needs to ask their reports to revise their written ex
ante reasoning frequently to give them an opportunity to propose changes
to the original plan. It is likely that the efficient use of written ex ante
reasoning takes some practice at first, even training. This study does not
provide any guidelines on the detailed content of written ex ante reasoning
but the vast literature on strategy and innovation (e.g., Porter, 1980; Senge,
1990; Block and MacMillan, 1993; Hamel and Prahalad, 1994; Utterback,
1994; Mintzberg et al., 1998; McGrath and MacMillan, 2000a, 2000b) and
business planning (e.g., MacMillan and Narasimha, 1987; Roberts, 1991;
Hormozi et al., 2002; Martens et al., 2007; Kirsch et al., 2009) provides
plenty of examples that can be used as a basis for training on what can be
taken into account in ex ante reasoning for an investment’s income
potential.
In addition, the findings of this study suggest that managers who wish to
increase investments in long-term learning can benefit from the use of
reviewers at the lower organizational levels. Managers can employ
reviewers to review their various investments and direct reports. Further,
managers can cascade the practice throughout all of the levels of their

172
organizations. In establishing reviewer systems, it is recommended that
managers pay attention the design of reviewing tasks to create networks
between reviewers. The findings of this study suggest that reviewing is
improved by both reviewers’ mutual reviewing tenure and their ties to
external reviewers. Mutual reviewing tenure can be increased when
individuals engage together in several different review tasks over time. On
the other hand, reviewers’ ties to other reviewers can be increased by
mixing different reviewers in different review tasks. The benefits from
reviewers’ mutual reviewing tenure and their ties to external reviewers can
both be captured through a balanced composition of review teams that
include some reviewers with mutual reviewing tenure but at the same time
including some reviewers that have low mutual reviewing tenure to build
new ties between reviewers. In addition, the findings of this study suggest
that involving some reviewers who have previously reviewed an individual
requires some caution because such reviewers may decrease the
individual’s motivation when the managers themselves are not familiar
enough with the related knowledge to be able to assess a potential bias of a
reviewer for the individual.
Managers at any organizational level can motivate their organizations to
increase learning investments with written ex ante reasoning and reviewers.
However, if the managers themselves are not controlled with such
mechanisms but only with short-term financial controls, the benefits from
written ex ante reasoning and reviewers may be more limited. This finding
is due to the fact that such managers are likely to have limited room to
allocate their resources to long-term learning in the first place. However, if
managers at lower organizational levels can afford some long-term learning
investments, they can benefit from written ex ante reasoning and reviewers.
It is the CEOs that can most benefit from the findings of this study. They
typically have some equity-based incentives in addition to short-term
financial control through boards of directors. Thus, CEOs have incentives to
allocate resources to the long-term learning that is needed for growth and
competitiveness. Traditionally, CEOs have had limited means of
encouraging long-term learning in their organizations. They could apply
strategic controls for their division managers, but that left most of
organizational levels dependent on short-term financial control. However,
CEOs usually have the power to design control processes that are used
throughout the organizational levels. The findings of this study suggest that
CEOs can cascade the use of written ex ante reasoning and reviewers
throughout the lower organizational levels. This study does not provide
details for such corporate level control systems based on written ex ante

Discussion and conclusions
173
reasoning and reviewers, but it outlines the fundamental mechanisms that
CEOs can adapt to the specific needs of their organizations.
The findings of this study also suggest recommendations for boards of
directors. The role of a board of directors includes ensuring the growth and
long-term competitiveness of an organization. Boards can improve their
effectiveness in this role by requiring CEOs to complement financial control
systems with the controls against managerial myopia identified in this
study. Moreover, whenever CEOs propose the adoption of such controls,
boards are recommended to support the CEOs in such efforts.
Finally, the findings of this study have implications for investors and
shareholders. Ultimately, it is the shareholders who can most benefit when
organizations grow and sustain their competitiveness over long run. Today,
shareholder return is limited due to widespread managerial myopia in
organizations. Because the findings of this study suggest methods for how
organizations can reduce the dilemma of managerial myopia, the findings
provide shareholders with the means for improved wealth creation. In
particular, shareholders who have a preference for long-term investments
are recommended to invest in firms that can demonstrate that they
complement short-term financial control with controls based on written ex
ante reasoning and reviewers throughout all the organizational levels.
6.4 Limitations
The empirical findings of this study are based on a single large industrial
company. The generalizability of the findings from a study based on the
investigation of a single organization is inherently suspect. Any finding can
be due to something that is idiosyncratic to the organization, and similar
phenomena may not exist in most other organizations. This risk can be
minimized by sampling an organization that is a typical representative of
many similar organizations and does not have the idiosyncratic
characteristics that would be critical to the findings. To address the
potential limitation of the generalizability of findings, a typical industrial
corporation was chosen for investigation. To further minimize the risk of
any idiosyncratic characteristics, the corporation and the processes within
it were analyzed and described in detail. This analysis suggests that the
activities within the organization match closely with the findings of the past
literature on corporations, and no idiosyncratic characteristics critical to
the findings were observed. Therefore, the findings from this study are
assumed to be generalizable to a broader population of similar
corporations.

174
The empirical data consists of research and development projects.
Research and development expenditures have been widely used by the past
research to measure the activities related to long-term learning in firms
(e.g., Hoskisson and Hitt, 1988; Hoskisson et al., 1993; Helfat, 1994a,
1994b; Hitt et al, 1996; Hundley et al., 1996; Palmer and Wiseman, 1999;
Greve, 2003; Lee and O’Neill, 2003; Chen and Miller, 2007; Sanders and
Hambrick, 2007; Chen, 2008; Kim et al., 2008). Research and
development projects are expected to effectively represent general
investments in learning new knowledge that is likely to take a long time to
generate income, but adequate caution is nevertheless warranted in
generalizing the results to different types of long-term learning.
The empirical analysis of this study relies on written information from the
R&D project reporting system and corporate public accounting records of
the case organization for actual income information. The analysis could
have been complemented by a survey or structured interviews. Managers
could have been asked for their opinions on how they thought they or the
other managers were taking into account the hypothesized control
mechanisms when making decisions related to R&D projects. Such a
complementary analysis was not done for the following reasons. First, the
data from the R&D project reporting system was historical data, and it
would not have matched with a survey or structured interviews, which
would have decreased the complementary value somewhat, even if not
completely. Second, asking opinions of the managers would have addressed
perceptions, which would have required an extension of the theoretical
framework as well. The question of how individuals make decisions does
not necessarily coincide with how they think or report how they make the
decisions (e.g., Simon, 1947). The prior research has recommended
behavioral measures instead of perceptual ones (Hansen et al., 2005). This
study followed the recommended approach of observing how managers
actually make decisions.
The empirical model of this study includes some unexplained variance
due to the limitations of data availability. The literature on organizational
learning suggests that the income potential of existing production and
learning opportunities changes frequently as new knowledge is acquired
(e.g., Herriott et al., 1985; Green et al., 2003). Thus, the relative
attractiveness of an R&D project changes continuously. A large part of the
variation of a project’s actual cost relative to the budget is expected to be
due to such changes in knowledge about the potential income from a
project or alternative investment opportunities. However, the data available
for this study did not include information on such changes in knowledge,
and therefore this effect is not controlled in the empirical test. Thus,

Discussion and conclusions
175
changes in knowledge over the course of an R&D project remain a cause of
the unexplained variance.
6.5 Directions for further research
The limitations of this study point out the need for testing the theory of
this study in other firms. The models and hypothesis developed in this
study should be tested through large sample designs. Adequate resources
should be allocated to such large sample studies because of the intensive
nature of the investigation of large numbers of decision makers within each
firm. Because the theory of this study focuses on large firms with several
organizational levels, large firms would be most suitable for studies based
on larger samples.
In addition, further research could extend the empirical findings of this
study by investigating decision makers at several organizational levels at
the same time. This study is based on an analysis of the dyad between profit
center managers and R&D project managers, but further dynamics are
likely to be found through simultaneous attention to controls at the higher
organizational levels. For example, Baysinger and Hoskisson (1990) and
Johnson et al. (1993) investigated how corporate governance mechanisms
interacted with corporate internal controls. Such investigations could also
be extended to include controls at the lower organizational levels identified
in this study.
The empirical findings of this study are based on research and
development projects. Albeit an important type of long-term learning, they
are not the only type of long-term learning investments in organizations.
Organizations also typically have other types of investments related to
business development and internal organizational processes, and these
investments can also involve substantial investments in learning new
knowledge that is likely to take a long time to generate income. The
mechanisms identified in this study could also be tested on such other long-
term learning investments.
This study has investigated how the identified mechanisms influence
investments in learning new knowledge that is likely to take a long time to
generate income. The literature on managerial myopia suggests that such
learning improves long-term competitiveness and increases shareholder
value. However, further empirical research could test how shareholder
value and a firm’s long-term competitiveness depend on the mechanisms
identified in this study.

176
The findings of this study suggest that there may be opportunities to
develop new theoretical insights through a combination of theories related
to organizational learning with the organizational control theories and
corporate governance literature. The balance between exploration and
exploitation has attracted wide research interest. Exploration can involve
the type of long-term learning that is the focus of this study. The findings of
this study hint that further research on exploration and exploitation might
investigate the effects of the controls examined in this study as well as other
organizational controls that have been developed in the past research. The
relationship between financial performance and organizational learning is
another topic that has raised considerable attention in the past research. In
addition, this stream of research may benefit from an analysis of
opportunities to integrate research that incorporates theories related to
organizational control. This study found some initial links between these
two streams of research, but a more thorough examination of the
integration of these research streams may provide fruitful ground for
developing new theoretical insights.
Finally, the findings of this study suggest that more research on controls
for managerial myopia is needed. Previous research on managerial myopia
suggests that the phenomenon has societal consequences due to its critical
role for competitiveness, and research on identifying factors to limit
managerial myopia can have practical relevance and impact. The findings of
this study suggest that managerial myopia is not an insurmountable
dilemma. Rather, managerial myopia is an agency cost that can be adjusted
with organizational controls. Further research into identifying controls for
managerial myopia may provide an understanding of other types of
controls. In particular, previous research on organizational controls has
focused on the organizational upper echelons, whereas mechanisms within
large and complex organizations have attracted less attention. Thus, a
detailed, in-depth investigation inside different types of organizations may
yet reveal unknown territories in which new types of controls against
managerial myopia may be found. In conclusion, this study suggests that
more research on different types of organizational controls is warranted.

Appendix
177
7. Appendix

178
Des
crip
tive
stat
isti
csan
dco
rrel
atio
nsTi
me
hori
zon:
R&D
proj
ects
wit
hm
odes
tly
long
tim
eho
rizo
n
Var
iabl
eM
ean
S.D
.1
23
45
67
89
1011
1213
1415
1617
1819
2021
2223
241
R&D
proj
ectb
udge
t(lo
g)4.
551.
102
R&D
proj
ecta
ctua
lcos
t(lo
g)3.
971.
430.
843
R&D
proj
ectb
udge
t16
519
80.
820.
724
R&D
proj
ectb
udge
tT-1
68.9
155
0.40
0.39
0.46
5Co
ntin
uati
onpr
ojec
t0.
470.
500.
160.
170.
130.
476
Proj
ectm
ilest
ones
1.81
1.72
-0.0
9-0
.06
-0.1
2-0
.11
-0.2
07
Proj
ects
tatu
spr
oble
ms
0.45
0.50
-0.0
1-0
.02
0.01
0.05
0.08
0.01
8A
gent
frug
alit
y-0
.16
2.47
-0.0
4-0
.04
-0.0
50.
03-0
.02
0.06
0.00
9Re
view
erex
peri
ence
8.21
9.2
0.05
-0.0
30.
030.
070.
14-0
.25
-0.0
3-0
.01
10Q
uant
ity
ofw
ritt
enex
ante
reas
onin
g9.
181.
040.
300.
260.
290.
270.
38-0
.61
0.18
-0.0
60.
1011
Freq
uenc
yof
revi
sion
ofw
ritte
nex
ante
reas
onin
g5.
132.
840.
160.
210.
170.
060.
07-0
.21
0.00
0.00
-0.1
20.
3712
Num
bero
frev
iew
ers
0.74
0.55
0.18
0.17
0.19
0.19
0.15
-0.1
80.
010.
03-0
.07
0.25
0.12
13Re
view
ers’
mut
ualr
evie
win
gte
nure
0.24
0.75
0.03
0.06
0.05
0.09
0.10
-0.1
30.
060.
000.
100.
15-0
.01
0.40
14Re
view
ers’
mut
ualr
evie
win
gte
nure
squa
red
0.61
4.11
0.00
0.02
0.00
0.00
-0.0
1-0
.05
-0.0
10.
010.
100.
04-0
.03
0.15
0.85
15Re
view
ers’
revi
ewin
gte
nure
wit
hag
ent
0.78
1.31
0.06
0.02
0.05
0.19
0.22
-0.1
0-0
.04
0.02
0.49
0.06
-0.1
30.
220.
150.
0616
Revi
ewer
s’ti
esto
exte
rnal
revi
ewer
s1.
913.
950.
170.
120.
160.
120.
25-0
.34
0.05
-0.0
40.
450.
410.
080.
220.
190.
110.
2217
Prin
cipa
l’sat
tent
ion
-29.
027
.00.
510.
470.
430.
18-0
.11
0.24
-0.0
90.
03-0
.03
-0.2
3-0
.04
0.04
-0.0
10.
020.
02-0
.14
18In
com
ede
crea
sex
Qua
ntit
yof
wri
tten
exan
tere
ason
ing
4.08
4.46
0.01
-0.0
1-0
.05
-0.1
0-0
.18
0.18
-0.2
10.
05-0
.02
-0.2
1-0
.02
-0.0
1-0
.07
0.02
-0.0
5-0
.11
0.02
19In
com
ede
crea
sex
Freq
uenc
yof
revi
sion
ofw
ritt
enex
ante
reas
onin
g2.
273.
150.
060.
070.
02-0
.09
-0.1
70.
03-0
.21
0.04
-0.0
9-0
.05
0.39
0.04
-0.0
70.
00-0
.12
-0.0
50.
020.
8120
Inco
me
decr
ease
xN
umbe
rofr
evie
wer
s0.
330.
480.
020.
01-0
.02
-0.0
6-0
.12
0.07
-0.2
00.
04-0
.06
-0.0
90.
040.
350.
060.
090.
02-0
.06
-0.0
30.
780.
6721
Inco
me
decr
ease
xRe
view
ers’
mut
ualr
evie
win
gte
nure
0.08
0.56
-0.0
20.
01-0
.01
-0.0
2-0
.03
0.03
-0.0
60.
010.
07-0
.02
-0.0
20.
140.
720.
840.
020.
050.
020.
160.
110.
2822
Inco
me
decr
ease
xRe
view
ers’
mut
ualr
evie
win
gte
nure
squa
red
0.32
3.84
0.00
0.02
-0.0
1-0
.03
-0.0
50.
01-0
.05
0.01
0.07
-0.0
2-0
.02
0.06
0.66
0.93
0.00
0.04
0.04
0.09
0.06
0.15
0.91
23In
com
ede
crea
sex
Revi
ewer
s’re
view
ing
tenu
rew
ith
agen
t0.
331.
00-0
.06
-0.1
2-0
.08
0.01
0.06
0.05
-0.1
20.
030.
39-0
.15
-0.1
50.
04-0
.01
0.01
0.65
-0.0
30.
000.
350.
160.
340.
080.
0324
Inco
me
decr
ease
xRe
view
ers’
ties
toex
tern
alre
view
ers
0.60
2.22
0.04
0.03
0.02
0.01
0.12
-0.1
6-0
.11
0.02
0.15
0.15
0.10
0.06
0.07
0.09
0.01
0.47
-0.1
10.
340.
340.
300.
170.
120.
1325
Inco
me
decr
ease
xPr
inci
pal’s
atte
ntio
n-1
2.8
22.5
0.26
0.25
0.24
0.14
0.04
-0.0
50.
13-0
.04
0.02
0.09
0.03
-0.0
40.
060.
030.
010.
000.
49-0
.63
-0.4
9-0
.53
-0.0
7-0
.02
-0.2
4-0
.33
Table 7-1 Descriptive statistics and correlation: Projects with modestly long time horizon
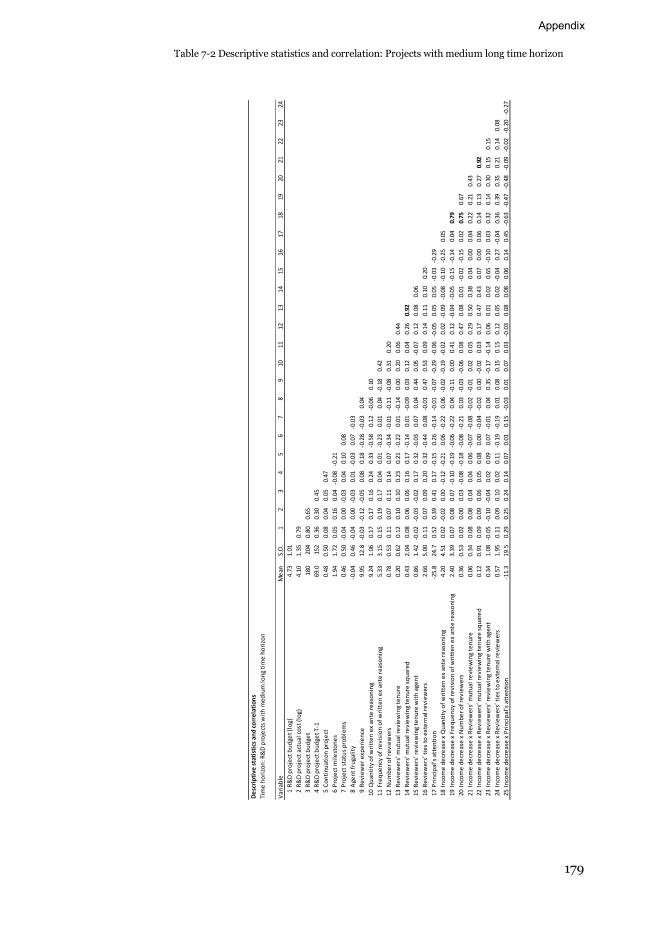
Appendix
179
Des
crip
tive
stat
isti
csan
dco
rrel
atio
nsTi
me
hori
zon:
R&D
proj
ects
wit
hm
ediu
mlo
ngti
me
hori
zon
Var
iabl
eM
ean
S.D
.1
23
45
67
89
1011
1213
1415
1617
1819
2021
2223
241
R&D
proj
ectb
udge
t(lo
g)4.
731.
012
R&D
proj
ecta
ctua
lcos
t(lo
g)4.
101.
350.
793
R&D
proj
ectb
udge
t18
020
40.
800.
654
R&D
proj
ectb
udge
tT-1
69.0
152
0.36
0.30
0.45
5Co
ntin
uati
onpr
ojec
t0.
480.
500.
080.
040.
050.
476
Proj
ectm
ilest
ones
1.94
1.72
0.05
0.16
0.04
-0.0
8-0
.21
7Pr
ojec
tsta
tus
prob
lem
s0.
460.
50-0
.04
0.00
-0.0
30.
040.
100.
088
Age
ntfr
ugal
ity
-0.0
40.
46-0
.04
0.00
-0.0
30.
01-0
.03
0.07
-0.0
39
Revi
ewer
expe
rien
ce9.
9512
.8-0
.03
-0.1
2-0
.05
0.08
0.18
-0.2
8-0
.03
0.04
10Q
uant
ity
ofw
ritt
enex
ante
reas
onin
g9.
241.
060.
170.
170.
160.
240.
33-0
.58
0.12
-0.0
60.
1011
Freq
uenc
yof
revi
sion
ofw
ritt
enex
ante
reas
onin
g5.
333.
150.
150.
190.
170.
040.
01-0
.23
0.01
0.04
-0.1
80.
4212
Num
bero
frev
iew
ers
0.78
0.53
0.11
0.07
0.11
0.14
0.07
-0.3
4-0
.01
-0.1
1-0
.08
0.31
0.20
13Re
view
ers’
mut
ualr
evie
win
gte
nure
0.20
0.62
0.12
0.10
0.10
0.23
0.21
-0.2
20.
01-0
.14
0.00
0.20
0.06
0.44
14Re
view
ers’
mut
ualr
evie
win
gte
nure
squa
red
0.43
2.04
0.08
0.06
0.06
0.16
0.17
-0.1
40.
01-0
.09
0.03
0.12
0.04
0.26
0.92
15Re
view
ers’
revi
ewin
gte
nure
wit
hag
ent
0.86
1.42
-0.0
2-0
.03
-0.0
20.
170.
32-0
.03
0.07
0.04
0.44
0.05
-0.0
70.
120.
080.
0616
Revi
ewer
s’ti
esto
exte
rnal
revi
ewer
s2.
665.
000.
110.
070.
090.
200.
32-0
.44
0.08
-0.0
10.
470.
530.
090.
140.
110.
100.
2017
Prin
cipa
l’sat
tent
ion
-25.
824
.70.
520.
390.
410.
17-0
.15
0.26
-0.1
4-0
.01
-0.0
7-0
.29
-0.0
6-0
.05
0.05
0.05
-0.0
3-0
.29
18In
com
ede
crea
sex
Qua
ntit
yof
wri
tten
exan
tere
ason
ing
4.20
4.51
0.02
-0.0
20.
00-0
.12
-0.2
10.
06-0
.22
0.06
-0.0
2-0
.19
-0.0
20.
02-0
.09
-0.0
8-0
.10
-0.2
50.
0519
Inco
me
decr
ease
xFr
eque
ncy
ofre
visi
onof
wri
tten
exan
tere
ason
ing
2.40
3.39
0.07
0.08
0.07
-0.1
0-0
.19
-0.0
6-0
.22
0.04
-0.1
10.
000.
410.
12-0
.04
-0.0
5-0
.15
-0.1
40.
040.
7920
Inco
me
decr
ease
xN
umbe
rofr
evie
wer
s0.
360.
530.
020.
000.
03-0
.08
-0.1
8-0
.08
-0.2
10.
03-0
.03
-0.0
60.
080.
470.
080.
01-0
.02
-0.1
50.
020.
750.
6721
Inco
me
decr
ease
xRe
view
ers’
mut
ualr
evie
win
gte
nure
0.06
0.34
0.08
0.08
0.04
0.04
0.06
-0.0
7-0
.08
-0.0
2-0
.01
0.02
0.05
0.29
0.50
0.38
0.04
0.00
0.04
0.22
0.21
0.43
22In
com
ede
crea
sex
Revi
ewer
s’m
utua
lrev
iew
ing
tenu
resq
uare
d0.
120.
910.
090.
090.
060.
050.
080.
00-0
.04
-0.0
20.
00-0
.02
0.03
0.17
0.47
0.43
0.07
0.00
0.06
0.14
0.13
0.27
0.92
23In
com
ede
crea
sex
Revi
ewer
s’re
view
ing
tenu
rew
ith
agen
t0.
341.
08-0
.05
-0.1
0-0
.04
0.02
0.09
0.07
-0.0
10.
040.
35-0
.17
-0.1
40.
060.
010.
020.
65-0
.10
0.03
0.32
0.14
0.30
0.15
0.15
24In
com
ede
crea
sex
Revi
ewer
s’ti
esto
exte
rnal
revi
ewer
s0.
571.
950.
110.
090.
100.
020.
11-0
.19
-0.1
90.
010.
080.
150.
150.
120.
050.
02-0
.04
0.27
-0.0
40.
360.
390.
350.
210.
140.
0825
Inco
me
decr
ease
xPr
inci
pal’s
atte
ntio
n-1
1.3
19.5
0.29
0.25
0.24
0.14
0.07
0.01
0.15
-0.0
30.
010.
070.
03-0
.03
0.08
0.08
0.06
0.14
0.45
-0.6
3-0
.47
-0.4
8-0
.09
-0.0
2-0
.20
-0.2
7
Table 7-2 Descriptive statistics and correlation: Projects with medium long time horizon

180
Des
crip
tive
stat
isti
csan
dco
rrel
atio
nsTi
me
hori
zon:
R&D
proj
ects
wit
hve
rylo
ngti
me
hori
zon
Var
iabl
eM
ean
S.D
.1
23
45
67
89
1011
1213
1415
1617
1819
2021
2223
241
R&D
proj
ectb
udge
t(lo
g)4.
431.
022
R&D
proj
ecta
ctua
lcos
t(lo
g)3.
791.
370.
773
R&D
proj
ectb
udge
t14
724
80.
710.
534
R&D
proj
ectb
udge
tT-1
54.0
189
0.32
0.28
0.52
5Co
ntin
uati
onpr
ojec
t0.
470.
500.
060.
050.
020.
306
Proj
ectm
ilest
ones
1.50
1.75
-0.0
9-0
.02
-0.0
30.
04-0
.10
7Pr
ojec
tsta
tus
prob
lem
s0.
400.
490.
05-0
.01
-0.0
2-0
.03
0.16
-0.0
58
Age
ntfr
ugal
ity
-0.2
42.
89-0
.07
-0.0
6-0
.03
-0.0
2-0
.08
0.07
-0.0
99
Revi
ewer
expe
rien
ce8.
749.
60.
01-0
.02
-0.0
40.
020.
20-0
.15
-0.0
70.
0210
Qua
ntit
yof
wri
tten
exan
tere
ason
ing
9.23
1.00
0.19
0.24
0.04
0.09
0.29
-0.5
80.
23-0
.13
0.01
11Fr
eque
ncy
ofre
visi
onof
wri
tten
exan
tere
ason
ing
5.09
2.92
0.12
0.18
0.06
0.03
0.08
-0.1
6-0
.02
-0.1
0-0
.13
0.35
12N
umbe
rofr
evie
wer
s0.
730.
570.
030.
09-0
.07
-0.0
30.
05-0
.28
0.07
-0.1
0-0
.05
0.36
0.18
13Re
view
ers’
mut
ualr
evie
win
gte
nure
0.27
0.89
0.03
0.08
-0.0
40.
020.
11-0
.22
0.05
-0.0
40.
110.
240.
070.
4314
Revi
ewer
s’m
utua
lrev
iew
ing
tenu
resq
uare
d0.
875.
120.
050.
07-0
.01
0.02
0.05
-0.1
40.
000.
000.
110.
100.
020.
210.
8815
Revi
ewer
s’re
view
ing
tenu
rew
ith
agen
t0.
861.
64-0
.13
-0.1
2-0
.11
0.00
0.17
0.00
0.00
0.01
0.62
-0.1
0-0
.12
0.16
0.16
0.12
16Re
view
ers’
ties
toex
tern
alre
view
ers
2.19
4.28
0.11
0.11
-0.0
20.
000.
24-0
.33
0.07
-0.1
50.
340.
410.
040.
220.
190.
130.
0717
Prin
cipa
l’sat
tent
ion
-33.
726
.90.
460.
430.
350.
14-0
.12
0.17
-0.0
90.
020.
05-0
.21
-0.0
2-0
.08
0.04
0.08
0.07
-0.1
818
Inco
me
decr
ease
xQ
uant
ity
ofw
ritt
enex
ante
reas
onin
g3.
984.
39-0
.04
-0.0
4-0
.03
-0.0
2-0
.18
0.20
-0.2
40.
080.
04-0
.38
0.01
-0.0
3-0
.14
-0.0
70.
09-0
.13
0.04
19In
com
ede
crea
sex
Freq
uenc
yof
revi
sion
ofw
ritt
enex
ante
reas
onin
g2.
283.
120.
020.
050.
010.
01-0
.16
0.06
-0.2
40.
06-0
.05
-0.1
90.
360.
06-0
.11
-0.0
6-0
.01
-0.0
80.
040.
8320
Inco
me
decr
ease
xN
umbe
rofr
evie
wer
s0.
320.
49-0
.01
-0.0
2-0
.01
0.00
-0.1
40.
00-0
.17
0.05
0.01
-0.1
70.
110.
400.
010.
000.
13-0
.04
0.00
0.73
0.69
21In
com
ede
crea
sex
Revi
ewer
s’m
utua
lrev
iew
ing
tenu
re0.
060.
460.
030.
05-0
.01
-0.0
1-0
.08
-0.1
0-0
.08
0.01
0.04
0.01
0.02
0.19
0.48
0.58
0.03
0.05
0.04
0.15
0.14
0.32
22In
com
ede
crea
sex
Revi
ewer
s’m
utua
lrev
iew
ing
tenu
resq
uare
d0.
213.
370.
040.
050.
01-0
.02
-0.0
5-0
.05
-0.0
50.
000.
06-0
.01
-0.0
10.
060.
450.
650.
030.
060.
040.
070.
050.
130.
9123
Inco
me
decr
ease
xRe
view
ers’
revi
ewin
gte
nure
wit
hag
ent
0.47
1.47
-0.1
4-0
.14
-0.0
9-0
.02
0.04
0.05
-0.0
10.
030.
57-0
.21
-0.1
20.
04-0
.04
-0.0
10.
82-0
.07
0.05
0.34
0.18
0.31
0.07
0.05
24In
com
ede
crea
sex
Revi
ewer
s’ti
esto
exte
rnal
revi
ewer
s0.
662.
270.
050.
050.
00-0
.02
0.02
-0.1
8-0
.13
0.02
0.11
0.09
0.09
0.09
0.03
0.06
0.00
0.43
-0.0
90.
370.
340.
350.
190.
150.
0825
Inco
me
decr
ease
xPr
inci
pal’s
atte
ntio
n-1
4.8
23.5
0.25
0.27
0.19
0.09
0.07
-0.1
30.
20-0
.06
0.00
0.26
0.02
0.01
0.12
0.08
-0.0
30.
050.
43-0
.69
-0.5
5-0
.51
-0.0
5-0
.01
-0.2
0-0
.33
Table 7-3 Descriptive statistics and correlation: Projects with very long time horizon
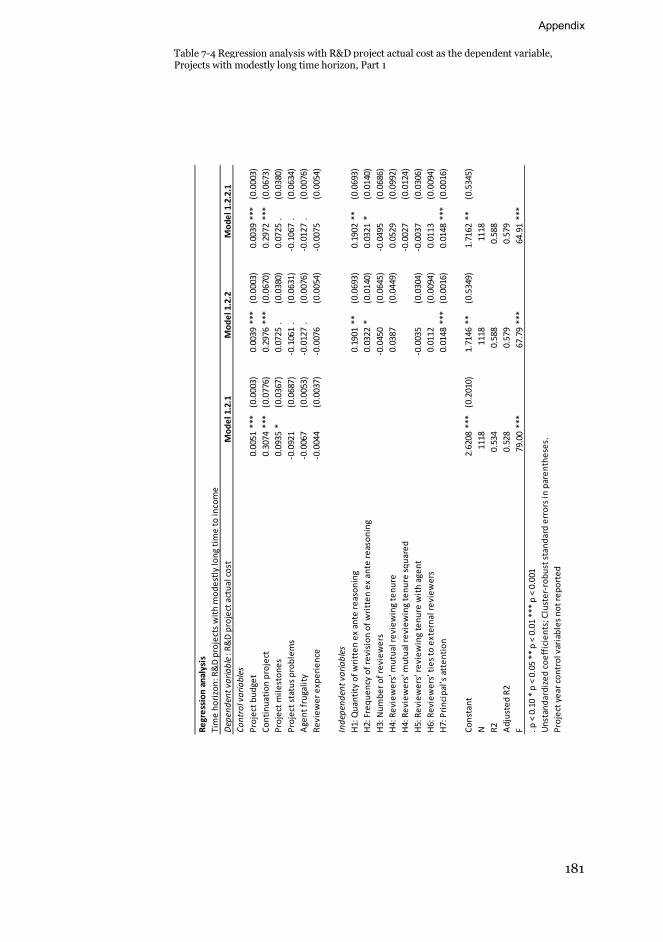
Appendix
181
Regr
essi
onan
alys
isTi
me
hori
zon:
R&D
proj
ects
wit
hm
odes
tly
long
tim
eto
inco
me
Dep
ende
ntva
riabl
e:R
&D
proj
ecta
ctua
lcos
tM
odel
1.2.
1M
odel
1.2.
2M
odel
1.2.
2.1
Cont
rolv
aria
bles
Proj
ectb
udge
t0.
0051
***
(0.0
003)
0.00
39**
*(0
.000
3)0.
0039
***
(0.0
003)
Cont
inua
tion
proj
ect
0.30
74**
*(0
.077
6)0.
2976
***
(0.0
670)
0.29
72**
*(0
.067
3)Pr
ojec
tmile
ston
es0.
0935
*(0
.036
7)0.
0725
.(0
.038
0)0.
0725
.(0
.038
0)Pr
ojec
tsta
tus
prob
lem
s-0
.092
1(0
.068
7)-0
.106
1.
(0.0
631)
-0.1
067
.(0
.063
4)A
gent
frug
alit
y-0
.006
7(0
.005
3)-0
.012
7.
(0.0
076)
-0.0
127
.(0
.007
6)Re
view
erex
peri
ence
-0.0
044
(0.0
037)
-0.0
076
(0.0
054)
-0.0
075
(0.0
054)
Inde
pend
entv
aria
bles
H1:
Qua
ntit
yof
wri
tten
exan
tere
ason
ing
0.19
01**
(0.0
693)
0.19
02**
(0.0
693)
H2:
Freq
uenc
yof
revi
sion
ofw
ritt
enex
ante
reas
onin
g0.
0322
*(0
.014
0)0.
0321
*(0
.014
0)H
3:N
umbe
rofr
evie
wer
s-0
.045
0(0
.064
5)-0
.049
5(0
.068
6)H
4:Re
view
ers’
mut
ualr
evie
win
gte
nure
0.03
87(0
.044
9)0.
0529
(0.0
992)
H4:
Revi
ewer
s’m
utua
lrev
iew
ing
tenu
resq
uare
d-0
.002
7(0
.012
4)H
5:Re
view
ers’
revi
ewin
gte
nure
wit
hag
ent
-0.0
035
(0.0
304)
-0.0
037
(0.0
306)
H6:
Revi
ewer
s’ti
esto
exte
rnal
revi
ewer
s0.
0112
(0.0
094)
0.01
13(0
.009
4)H
7:Pr
inci
pal’s
atte
ntio
n0.
0148
***
(0.0
016)
0.01
48**
*(0
.001
6)
Cons
tant
2.62
08**
*(0
.201
0)1.
7146
**(0
.534
9)1.
7162
**(0
.534
5)N
1118
1118
1118
R20.
534
0.58
80.
588
Adj
uste
dR2
0.52
80.
579
0.57
9F
79.0
0**
*67
.79
***
64.9
1**
*.p
<0.
10*
p<
0.05
**p
<0.
01**
*p
<0.
001
Uns
tand
ardi
zed
coef
fici
ents
;Clu
ster
-rob
usts
tand
ard
erro
rsin
pare
nthe
ses.
Proj
ecty
earc
ontr
olva
riab
les
notr
epor
ted
Table 7-4 Regression analysis with R&D project actual cost as the dependent variable,Projects with modestly long time horizon, Part 1

182
Regr
essi
onan
alys
isTi
me
hori
zon:
R&D
proj
ects
wit
hm
odes
tly
long
tim
eto
inco
me
Dep
ende
ntva
riabl
e:R
&D
proj
ecta
ctua
lcos
tM
odel
1.2.
3.1
Mod
el1.
2.3.
2M
odel
1.2.
3.3
Cont
rolv
aria
bles
Proj
ectb
udge
t0.
0039
***
(0.0
003)
0.00
39**
*(0
.000
3)0.
0039
***
(0.0
003)
Cont
inua
tion
proj
ect
0.30
38**
*(0
.067
9)0.
2969
***
(0.0
673)
0.29
82**
*(0
.066
8)Pr
ojec
tmile
ston
es0.
0686
.(0
.037
0)0.
0729
.(0
.038
1)0.
0725
.(0
.038
0)Pr
ojec
tsta
tus
prob
lem
s-0
.103
0(0
.062
9)-0
.105
1.
(0.0
630)
-0.1
060
.(0
.063
1)A
gent
frug
alit
y-0
.013
0.
(0.0
075)
-0.0
125
(0.0
076)
-0.0
128
.(0
.007
7)Re
view
erex
peri
ence
-0.0
072
(0.0
054)
-0.0
075
(0.0
054)
-0.0
076
(0.0
054)
Inde
pend
entv
aria
bles
H1:
Qua
ntit
yof
wri
tten
exan
tere
ason
ing
0.13
57(0
.083
5)0.
1896
**(0
.069
4)0.
1895
**(0
.069
9)H
2:Fr
eque
ncy
ofre
visi
onof
wri
tten
exan
tere
ason
ing
0.03
29*
(0.0
141)
0.03
64*
(0.0
162)
0.03
23*
(0.0
138)
H3:
Num
bero
frev
iew
ers
-0.0
481
(0.0
654)
-0.0
461
(0.0
638)
-0.0
513
(0.0
773)
H4:
Revi
ewer
s’m
utua
lrev
iew
ing
tenu
re0.
0379
(0.0
454)
0.03
78(0
.044
9)0.
0386
(0.0
449)
H4:
Revi
ewer
s’m
utua
lrev
iew
ing
tenu
resq
uare
dH
5:Re
view
ers’
revi
ewin
gte
nure
wit
hag
ent
-0.0
029
(0.0
302)
-0.0
034
(0.0
303)
-0.0
035
(0.0
304)
H6:
Revi
ewer
s’ti
esto
exte
rnal
revi
ewer
s0.
0119
(0.0
094)
0.01
08(0
.009
4)0.
0112
(0.0
094)
H7:
Prin
cipa
l’sat
tent
ion
0.01
47**
*(0
.001
6)0.
0148
***
(0.0
016)
0.01
48**
*(0
.001
6)H
8:In
com
ede
crea
sex
Qua
ntit
yof
wri
tten
exan
tere
ason
ing
0.15
33(0
.115
3)H
8:In
com
ede
crea
sex
Freq
uenc
yof
revi
sion
ofw
ritt
enex
ante
reas
onin
g-0
.011
4(0
.025
0)H
8:In
com
ede
crea
sex
Num
bero
frev
iew
ers
0.01
64(0
.118
6)H
8:In
com
ede
crea
sex
Revi
ewer
s’m
utua
lrev
iew
ing
tenu
reH
8:In
com
ede
crea
sex
Revi
ewer
s’m
utua
lrev
iew
ing
tenu
resq
uare
dH
8:In
com
ede
crea
sex
Revi
ewer
s’re
view
ing
tenu
rew
ith
agen
tH
8:In
com
ede
crea
sex
Revi
ewer
s’ti
esto
exte
rnal
revi
ewer
sH
8:In
com
ede
crea
sex
Prin
cipa
l’sat
tent
ion
Cons
tant
0.87
77(0
.777
1)1.
7348
**(0
.536
0)1.
7150
**(0
.535
0)N
1118
1118
1118
R20.
588
0.58
80.
588
Adj
uste
dR2
0.57
90.
579
0.57
9F
65.1
2**
*64
.93
***
64.9
1**
*.p
<0.
10*
p<
0.05
**p
<0.
01**
*p
<0.
001
Uns
tand
ardi
zed
coef
fici
ents
;Clu
ster
-rob
usts
tand
ard
erro
rsin
pare
nthe
ses.
Proj
ecty
earc
ontr
olva
riab
les
notr
epor
ted
Table 7-5 Regression analysis with R&D project actual cost as the dependent variable, Projects with modestly long time horizon, Part 2
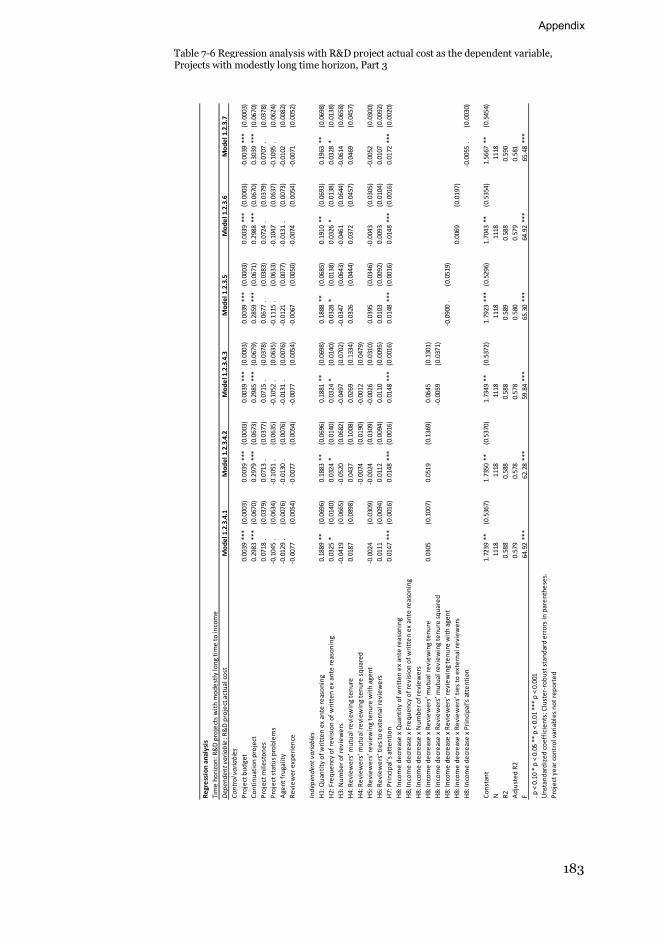
Appendix
183
Regr
essi
onan
alys
isTi
me
hori
zon:
R&D
proj
ects
wit
hm
odes
tly
long
tim
eto
inco
me
Dep
ende
ntva
riabl
e:R
&D
proj
ecta
ctua
lcos
tM
odel
1.2.
3.4.
1M
odel
1.2.
3.4.
2M
odel
1.2.
3.4.
3M
odel
1.2.
3.5
Mod
el1.
2.3.
6M
odel
1.2.
3.7
Cont
rolv
aria
bles
Proj
ectb
udge
t0.
0039
***
(0.0
003)
0.00
39**
*(0
.000
3)0.
0039
***
(0.0
003)
0.00
39**
*(0
.000
3)0.
0039
***
(0.0
003)
0.00
39**
*(0
.000
3)Co
ntin
uati
onpr
ojec
t0.
2983
***
(0.0
670)
0.29
79**
*(0
.067
3)0.
2985
***
(0.0
679)
0.28
59**
*(0
.067
1)0.
2988
***
(0.0
670)
0.30
39**
*(0
.067
0)Pr
ojec
tmile
ston
es0.
0718
.(0
.037
9)0.
0713
.(0
.037
7)0.
0715
.(0
.037
8)0.
0677
.(0
.038
3)0.
0724
.(0
.037
9)0.
0707
.(0
.037
8)Pr
ojec
tsta
tus
prob
lem
s-0
.104
5.
(0.0
634)
-0.1
051
.(0
.063
5)-0
.105
2.
(0.0
635)
-0.1
115
.(0
.063
3)-0
.104
7(0
.063
7)-0
.109
5.
(0.0
624)
Age
ntfr
ugal
ity
-0.0
129
.(0
.007
6)-0
.013
0.
(0.0
076)
-0.0
131
.(0
.007
6)-0
.012
1(0
.007
7)-0
.013
1.
(0.0
073)
-0.0
102
(0.0
082)
Revi
ewer
expe
rien
ce-0
.007
7(0
.005
4)-0
.007
7(0
.005
4)-0
.007
7(0
.005
4)-0
.006
7(0
.005
0)-0
.007
4(0
.005
4)-0
.007
1(0
.005
2)
Inde
pend
entv
aria
bles
H1:
Qua
ntit
yof
wri
tten
exan
tere
ason
ing
0.18
89**
(0.0
696)
0.18
83**
(0.0
696)
0.18
81**
(0.0
698)
0.18
88**
(0.0
685)
0.19
10**
(0.0
693)
0.19
63**
(0.0
698)
H2:
Freq
uenc
yof
revi
sion
ofw
ritt
enex
ante
reas
onin
g0.
0325
*(0
.014
0)0.
0324
*(0
.014
0)0.
0324
*(0
.014
0)0.
0328
*(0
.013
8)0.
0326
*(0
.013
8)0.
0328
*(0
.013
8)H
3:N
umbe
rofr
evie
wer
s-0
.041
9(0
.066
5)-0
.052
0(0
.068
2)-0
.049
7(0
.070
2)-0
.034
7(0
.064
3)-0
.046
1(0
.064
4)-0
.061
4(0
.065
8)H
4:Re
view
ers’
mut
ualr
evie
win
gte
nure
0.01
87(0
.089
8)0.
0437
(0.1
008)
0.02
69(0
.133
4)0.
0326
(0.0
444)
0.03
72(0
.045
7)0.
0469
(0.0
457)
H4:
Revi
ewer
s’m
utua
lrev
iew
ing
tenu
resq
uare
d-0
.007
4(0
.019
0)-0
.001
2(0
.047
9)H
5:Re
view
ers’
revi
ewin
gte
nure
wit
hag
ent
-0.0
024
(0.0
309)
-0.0
024
(0.0
309)
-0.0
026
(0.0
310)
0.03
95(0
.034
6)-0
.004
3(0
.030
5)-0
.005
2(0
.030
0)H
6:Re
view
ers’
ties
toex
tern
alre
view
ers
0.01
11(0
.009
4)0.
0112
(0.0
094)
0.01
10(0
.009
5)0.
0103
(0.0
092)
0.00
93(0
.010
4)0.
0107
(0.0
092)
H7:
Prin
cipa
l’sat
tent
ion
0.01
47**
*(0
.001
6)0.
0148
***
(0.0
016)
0.01
48**
*(0
.001
6)0.
0148
***
(0.0
016)
0.01
48**
*(0
.001
6)0.
0172
***
(0.0
020)
H8:
Inco
me
decr
ease
xQ
uant
ity
ofw
ritt
enex
ante
reas
onin
gH
8:In
com
ede
crea
sex
Freq
uenc
yof
revi
sion
ofw
ritt
enex
ante
reas
onin
gH
8:In
com
ede
crea
sex
Num
bero
frev
iew
ers
H8:
Inco
me
decr
ease
xRe
view
ers’
mut
ualr
evie
win
gte
nure
0.03
05(0
.100
7)0.
0519
(0.1
369)
0.06
45(0
.130
1)H
8:In
com
ede
crea
sex
Revi
ewer
s’m
utua
lrev
iew
ing
tenu
resq
uare
d-0
.005
9(0
.037
1)H
8:In
com
ede
crea
sex
Revi
ewer
s’re
view
ing
tenu
rew
ith
agen
t-0
.090
0.
(0.0
519)
H8:
Inco
me
decr
ease
xRe
view
ers’
ties
toex
tern
alre
view
ers
0.00
69(0
.019
7)H
8:In
com
ede
crea
sex
Prin
cipa
l’sat
tent
ion
-0.0
055
.(0
.003
0)
Cons
tant
1.72
39**
(0.5
367)
1.73
50**
(0.5
370)
1.73
49**
(0.5
372)
1.79
23**
*(0
.529
6)1.
7043
**(0
.535
4)1.
5667
**(0
.545
4)N
1118
1118
1118
1118
1118
1118
R20.
588
0.58
80.
588
0.58
90.
588
0.59
0A
djus
ted
R20.
579
0.57
80.
578
0.58
00.
579
0.58
1F
64.9
2**
*62
.28
***
59.8
4**
*65
.30
***
64.9
2**
*65
.48
***
.p<
0.10
*p
<0.
05**
p<
0.01
***
p<
0.00
1U
nsta
ndar
dize
dco
effi
cien
ts;C
lust
er-r
obus
tsta
ndar
der
rors
inpa
rent
hese
s.Pr
ojec
tyea
rcon
trol
vari
able
sno
trep
orte
d
Table 7-6 Regression analysis with R&D project actual cost as the dependent variable, Projects with modestly long time horizon, Part 3
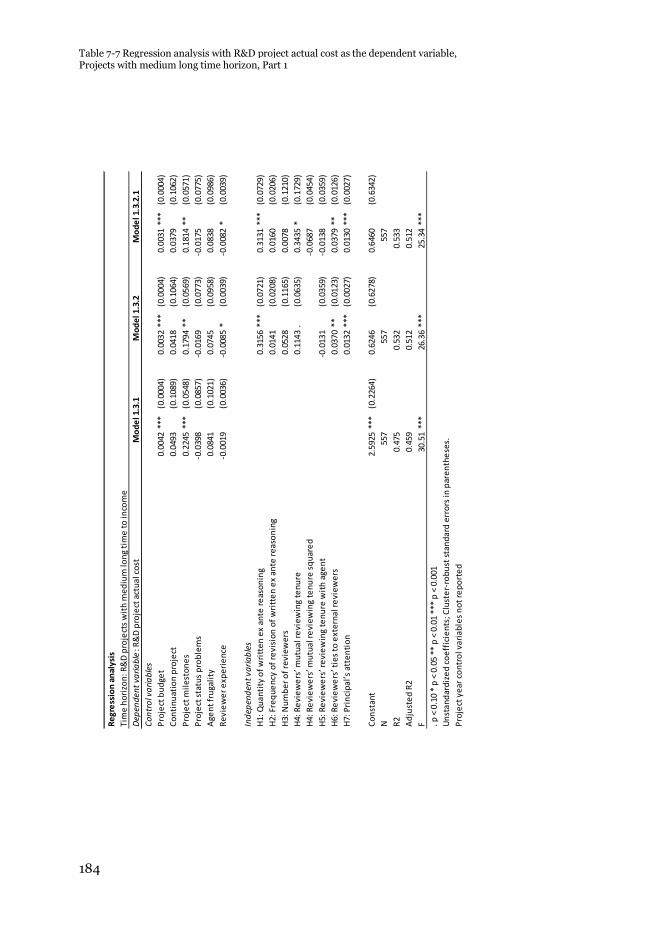
184
Regr
essi
onan
alys
isTi
me
hori
zon:
R&D
proj
ects
wit
hm
ediu
mlo
ngti
me
toin
com
eD
epen
dent
varia
ble
:R&
Dpr
ojec
tact
ualc
ost
Mod
el1.
3.1
Mod
el1.
3.2
Mod
el1.
3.2.
1Co
ntro
lvar
iabl
esPr
ojec
tbud
get
0.00
42**
*(0
.000
4)0.
0032
***
(0.0
004)
0.00
31**
*(0
.000
4)Co
ntin
uati
onpr
ojec
t0.
0493
(0.1
089)
0.04
18(0
.106
4)0.
0379
(0.1
062)
Proj
ectm
ilest
ones
0.22
45**
*(0
.054
8)0.
1794
**(0
.056
9)0.
1814
**(0
.057
1)Pr
ojec
tsta
tus
prob
lem
s-0
.039
8(0
.085
7)-0
.016
9(0
.077
3)-0
.017
5(0
.077
5)A
gent
frug
alit
y0.
0841
(0.1
021)
0.07
45(0
.095
8)0.
0838
(0.0
986)
Revi
ewer
expe
rien
ce-0
.001
9(0
.003
6)-0
.008
5*
(0.0
039)
-0.0
082
*(0
.003
9)
Inde
pend
entv
aria
bles
H1:
Qua
ntit
yof
wri
tten
exan
tere
ason
ing
0.31
56**
*(0
.072
1)0.
3131
***
(0.0
729)
H2:
Freq
uenc
yof
revi
sion
ofw
ritt
enex
ante
reas
onin
g0.
0141
(0.0
208)
0.01
60(0
.020
6)H
3:N
umbe
rofr
evie
wer
s0.
0528
(0.1
165)
0.00
78(0
.121
0)H
4:Re
view
ers’
mut
ualr
evie
win
gte
nure
0.11
43.
(0.0
635)
0.34
35*
(0.1
729)
H4:
Revi
ewer
s’m
utua
lrev
iew
ing
tenu
resq
uare
d-0
.068
7(0
.045
4)H
5:Re
view
ers’
revi
ewin
gte
nure
wit
hag
ent
-0.0
131
(0.0
359)
-0.0
138
(0.0
359)
H6:
Revi
ewer
s’ti
esto
exte
rnal
revi
ewer
s0.
0370
**(0
.012
3)0.
0379
**(0
.012
6)H
7:Pr
inci
pal’s
atte
ntio
n0.
0132
***
(0.0
027)
0.01
30**
*(0
.002
7)
Cons
tant
2.59
25**
*(0
.226
4)0.
6246
(0.6
278)
0.64
60(0
.634
2)N
557
557
557
R20.
475
0.53
20.
533
Adj
uste
dR2
0.45
90.
512
0.51
2F
30.5
1**
*26
.36
***
25.3
4**
*.p
<0.
10*
p<
0.05
**p
<0.
01**
*p
<0.
001
Uns
tand
ardi
zed
coef
fici
ents
;Clu
ster
-rob
usts
tand
ard
erro
rsin
pare
nthe
ses.
Proj
ecty
earc
ontr
olva
riab
les
notr
epor
ted
Table 7-7 Regression analysis with R&D project actual cost as the dependent variable, Projects with medium long time horizon, Part 1

Appendix
185
Regr
essi
onan
alys
isTi
me
hori
zon:
R&D
proj
ects
wit
hm
ediu
mlo
ngti
me
toin
com
eD
epen
dent
varia
ble
:R&
Dpr
ojec
tact
ualc
ost
Mod
el1.
3.3.
1M
odel
1.3.
3.2
Mod
el1.
3.3.
3Co
ntro
lvar
iabl
esPr
ojec
tbud
get
0.00
32**
*(0
.000
4)0.
0032
***
(0.0
004)
0.00
32**
*(0
.000
4)Co
ntin
uati
onpr
ojec
t0.
0343
(0.1
078)
0.03
99(0
.107
4)0.
0403
(0.1
059)
Proj
ectm
ilest
ones
0.17
35**
(0.0
577)
0.17
73**
(0.0
567)
0.18
11**
(0.0
569)
Proj
ects
tatu
spr
oble
ms
-0.0
172
(0.0
767)
-0.0
169
(0.0
769)
-0.0
128
(0.0
783)
Age
ntfr
ugal
ity
0.06
83(0
.095
8)0.
0662
(0.0
958)
0.06
47(0
.101
6)Re
view
erex
peri
ence
-0.0
083
*(0
.003
9)-0
.008
6*
(0.0
039)
-0.0
076
.(0
.003
9)
Inde
pend
entv
aria
bles
H1:
Qua
ntit
yof
wri
tten
exan
tere
ason
ing
0.24
49**
(0.0
844)
0.31
66**
*(0
.072
1)0.
3193
***
(0.0
723)
H2:
Freq
uenc
yof
revi
sion
ofw
ritt
enex
ante
reas
onin
g0.
0142
(0.0
207)
0.00
02(0
.031
3)0.
0133
(0.0
205)
H3:
Num
bero
frev
iew
ers
0.04
94(0
.115
6)0.
0555
(0.1
166)
0.12
62(0
.152
9)H
4:Re
view
ers’
mut
ualr
evie
win
gte
nure
0.11
27.
(0.0
635)
0.11
85.
(0.0
644)
0.11
13.
(0.0
635)
H4:
Revi
ewer
s’m
utua
lrev
iew
ing
tenu
resq
uare
dH
5:Re
view
ers’
revi
ewin
gte
nure
wit
hag
ent
-0.0
122
(0.0
358)
-0.0
135
(0.0
362)
-0.0
138
(0.0
361)
H6:
Revi
ewer
s’ti
esto
exte
rnal
revi
ewer
s0.
0388
**(0
.012
2)0.
0372
**(0
.012
3)0.
0366
**(0
.012
1)H
7:Pr
inci
pal’s
atte
ntio
n0.
0134
***
(0.0
027)
0.01
33**
*(0
.002
7)0.
0130
***
(0.0
027)
H8:
Inco
me
decr
ease
xQ
uant
ity
ofw
ritt
enex
ante
reas
onin
g0.
1840
(0.1
684)
H8:
Inco
me
decr
ease
xFr
eque
ncy
ofre
visi
onof
wri
tten
exan
tere
ason
ing
0.03
25(0
.036
8)H
8:In
com
ede
crea
sex
Num
bero
frev
iew
ers
-0.1
719
(0.2
053)
H8:
Inco
me
decr
ease
xRe
view
ers’
mut
ualr
evie
win
gte
nure
H8:
Inco
me
decr
ease
xRe
view
ers’
mut
ualr
evie
win
gte
nure
squa
red
H8:
Inco
me
decr
ease
xRe
view
ers’
revi
ewin
gte
nure
wit
hag
ent
H8:
Inco
me
decr
ease
xRe
view
ers’
ties
toex
tern
alre
view
ers
H8:
Inco
me
decr
ease
xPr
inci
pal’s
atte
ntio
n
Cons
tant
-0.3
137
(1.1
806)
0.57
51(0
.633
2)0.
6101
(0.6
304)
N55
755
755
7R2
0.53
40.
533
0.53
3A
djus
ted
R20.
513
0.51
20.
512
F25
.36
***
25.3
0**
*25
.29
***
.p<
0.10
*p
<0.
05**
p<
0.01
***
p<
0.00
1U
nsta
ndar
dize
dco
effi
cien
ts;C
lust
er-r
obus
tsta
ndar
der
rors
inpa
rent
hese
s.Pr
ojec
tyea
rcon
trol
vari
able
sno
trep
orte
d
Table 7-8 Regression analysis with R&D project actual cost as the dependent variable, Projects with medium long time horizon, Part 2

186
Regr
essi
onan
alys
isTi
me
hori
zon:
R&D
proj
ects
wit
hm
ediu
mlo
ngti
me
toin
com
eD
epen
dent
varia
ble
:R&
Dpr
ojec
tact
ualc
ost
Mod
el1.
3.3.
4.1
Mod
el1.
3.3.
4.2
Mod
el1.
3.3.
4.3
Mod
el1.
3.3.
5M
odel
1.3.
3.6
Mod
el1.
3.3.
7Co
ntro
lvar
iabl
esPr
ojec
tbud
get
0.00
31**
*(0
.000
4)0.
0031
***
(0.0
004)
0.00
31**
*(0
.000
4)0.
0032
***
(0.0
004)
0.00
32**
*(0
.000
4)0.
0031
***
(0.0
004)
Cont
inua
tion
proj
ect
0.04
34(0
.107
1)0.
0408
(0.1
069)
0.03
68(0
.107
2)0.
0394
(0.1
066)
0.04
16(0
.106
8)0.
0433
(0.1
085)
Proj
ectm
ilest
ones
0.18
63**
(0.0
572)
0.18
64**
(0.0
573)
0.18
50**
(0.0
573)
0.18
11**
(0.0
571)
0.17
95**
(0.0
568)
0.17
67**
(0.0
571)
Proj
ects
tatu
spr
oble
ms
-0.0
121
(0.0
779)
-0.0
132
(0.0
780)
-0.0
125
(0.0
779)
-0.0
165
(0.0
778)
-0.0
170
(0.0
775)
-0.0
134
(0.0
774)
Age
ntfr
ugal
ity
0.05
36(0
.100
0)0.
0624
(0.1
027)
0.05
45(0
.102
5)0.
0724
(0.0
961)
0.07
47(0
.096
4)0.
0722
(0.0
980)
Revi
ewer
expe
rien
ce-0
.007
9*
(0.0
039)
-0.0
078
*(0
.003
9)-0
.007
9*
(0.0
039)
-0.0
082
*(0
.003
9)-0
.008
5*
(0.0
040)
-0.0
083
*(0
.003
9)
Inde
pend
entv
aria
bles
H1:
Qua
ntit
yof
wri
tten
exan
tere
ason
ing
0.32
08**
*(0
.071
9)0.
3185
***
(0.0
725)
0.32
39**
*(0
.072
0)0.
3137
***
(0.0
721)
0.31
54**
*(0
.073
0)0.
3141
***
(0.0
709)
H2:
Freq
uenc
yof
revi
sion
ofw
ritt
enex
ante
reas
onin
g0.
0119
(0.0
208)
0.01
34(0
.020
8)0.
0120
(0.0
208)
0.01
45(0
.020
9)0.
0141
(0.0
209)
0.01
20(0
.020
2)H
3:N
umbe
rofr
evie
wer
s0.
0446
(0.1
156)
0.01
91(0
.119
5)0.
0325
(0.1
202)
0.05
49(0
.116
4)0.
0528
(0.1
167)
0.04
17(0
.116
9)H
4:Re
view
ers’
mut
ualr
evie
win
gte
nure
0.21
54**
(0.0
742)
0.33
63.
(0.1
750)
0.27
12(0
.185
5)0.
1124
.(0
.063
3)0.
1143
.(0
.063
9)0.
1160
.(0
.062
9)H
4:Re
view
ers’
mut
ualr
evie
win
gte
nure
squa
red
-0.0
410
(0.0
471)
-0.0
284
(0.0
486)
H5:
Revi
ewer
s’re
view
ing
tenu
rew
ith
agen
t-0
.015
7(0
.035
5)-0
.015
7(0
.035
6)-0
.017
8(0
.035
5)0.
0030
(0.0
534)
-0.0
131
(0.0
363)
-0.0
135
(0.0
355)
H6:
Revi
ewer
s’ti
esto
exte
rnal
revi
ewer
s0.
0378
**(0
.012
5)0.
0381
**(0
.012
7)0.
0379
**(0
.012
7)0.
0361
**(0
.012
0)0.
0372
*(0
.015
3)0.
0364
**(0
.012
3)H
7:Pr
inci
pal’s
atte
ntio
n0.
0132
***
(0.0
027)
0.01
31**
*(0
.002
7)0.
0131
***
(0.0
027)
0.01
32**
*(0
.002
7)0.
0132
***
(0.0
027)
0.01
52**
*(0
.003
3)H
8:In
com
ede
crea
sex
Qua
ntit
yof
wri
tten
exan
tere
ason
ing
H8:
Inco
me
decr
ease
xFr
eque
ncy
ofre
visi
onof
wri
tten
exan
tere
ason
ing
H8:
Inco
me
decr
ease
xN
umbe
rofr
evie
wer
sH
8:In
com
ede
crea
sex
Revi
ewer
s’m
utua
lrev
iew
ing
tenu
re-0
.232
8*
(0.1
124)
-0.1
964
.(0
.111
8)-0
.256
9*
(0.1
132)
H8:
Inco
me
decr
ease
xRe
view
ers’
mut
ualr
evie
win
gte
nure
squa
red
0.06
34*
(0.0
288)
H8:
Inco
me
decr
ease
xRe
view
ers’
revi
ewin
gte
nure
wit
hag
ent
-0.0
312
(0.0
604)
H8:
Inco
me
decr
ease
xRe
view
ers’
ties
toex
tern
alre
view
ers
-0.0
005
(0.0
175)
H8:
Inco
me
decr
ease
xPr
inci
pal’s
atte
ntio
n-0
.005
0(0
.004
4)
Cons
tant
0.56
47(0
.627
3)0.
5869
(0.6
315)
0.55
04(0
.629
3)0.
6484
(0.6
285)
0.62
63(0
.637
8)0.
5756
(0.6
171)
N55
755
755
755
755
755
7R2
0.53
40.
535
0.53
60.
532
0.53
20.
534
Adj
uste
dR2
0.51
30.
513
0.51
30.
511
0.51
10.
513
F25
.45
***
24.4
2**
*23
.55
***
25.2
4**
*25
.21
***
25.3
7**
*.p
<0.
10*
p<
0.05
**p
<0.
01**
*p
<0.
001
Uns
tand
ardi
zed
coef
fici
ents
;Clu
ster
-rob
usts
tand
ard
erro
rsin
pare
nthe
ses.
Proj
ecty
earc
ontr
olva
riab
les
notr
epor
ted
Table 7-9 Regression analysis with R&D project actual cost as the dependent variable, Projects with medium long time horizon, Part 3

Appendix
187
Regr
essi
onan
alys
isTi
me
hori
zon:
R&D
proj
ects
wit
hve
rylo
ngti
me
toin
com
eD
epen
dent
varia
ble
:R&
Dpr
ojec
tact
ualc
ost
Mod
el1.
4.1
Mod
el1.
4.2
Mod
el1.
4.2.
1Co
ntro
lvar
iabl
esPr
ojec
tbud
get
0.00
29**
*(0
.000
5)0.
0022
***
(0.0
004)
0.00
22**
*(0
.000
4)Co
ntin
uati
onpr
ojec
t0.
0106
(0.1
180)
0.05
99(0
.111
4)0.
0608
(0.1
112)
Proj
ectm
ilest
ones
0.17
23**
(0.0
623)
0.10
19.
(0.0
579)
0.10
14.
(0.0
579)
Proj
ects
tatu
spr
oble
ms
-0.0
410
(0.1
288)
-0.1
039
(0.1
234)
-0.0
986
(0.1
248)
Age
ntfr
ugal
ity
-0.0
187
*(0
.009
2)-0
.004
5(0
.013
7)-0
.004
8(0
.014
6)Re
view
erex
peri
ence
0.00
84(0
.005
7)0.
0039
(0.0
075)
0.00
40(0
.007
5)
Inde
pend
entv
aria
bles
H1:
Qua
ntit
yof
wri
tten
exan
tere
ason
ing
0.53
72**
*(0
.102
1)0.
5443
***
(0.1
036)
H2:
Freq
uenc
yof
revi
sion
ofw
ritt
enex
ante
reas
onin
g0.
0116
(0.0
180)
0.01
26(0
.018
0)H
3:N
umbe
rofr
evie
wer
s0.
1329
(0.0
996)
0.17
90.
(0.1
040)
H4:
Revi
ewer
s’m
utua
lrev
iew
ing
tenu
re0.
0401
(0.0
695)
-0.1
025
(0.1
157)
H4:
Revi
ewer
s’m
utua
lrev
iew
ing
tenu
resq
uare
d0.
0249
.(0
.013
9)H
5:Re
view
ers’
revi
ewin
gte
nure
wit
hag
ent
-0.0
882
(0.0
536)
-0.0
890
.(0
.053
7)H
6:Re
view
ers’
ties
toex
tern
alre
view
ers
0.03
15*
(0.0
129)
0.03
00*
(0.0
131)
H7:
Prin
cipa
l’sat
tent
ion
0.01
94**
*(0
.003
1)0.
0192
***
(0.0
031)
Cons
tant
2.27
95**
*(0
.362
5)-1
.007
1(0
.907
3)-1
.098
1(0
.922
8)N
468
468
468
R20.
323
0.48
40.
485
Adj
uste
dR2
0.29
90.
457
0.45
7F
13.4
7**
*18
.10
***
17.4
0**
*.p
<0.
10*
p<
0.05
**p
<0.
01**
*p
<0.
001
Uns
tand
ardi
zed
coef
fici
ents
;Clu
ster
-rob
usts
tand
ard
erro
rsin
pare
nthe
ses.
Proj
ecty
earc
ontr
olva
riab
les
notr
epor
ted
Table 7-10 Regression analysis with R&D project actual cost as the dependent variable, Projects with very long time horizon, Part 1

188
Regr
essi
onan
alys
isTi
me
hori
zon:
R&D
proj
ects
wit
hve
rylo
ngti
me
toin
com
eD
epen
dent
varia
ble
:R&
Dpr
ojec
tact
ualc
ost
Mod
el1.
4.3.
1M
odel
1.4.
3.2
Mod
el1.
4.3.
3Co
ntro
lvar
iabl
esPr
ojec
tbud
get
0.00
22**
*(0
.000
4)0.
0022
***
(0.0
004)
0.00
22**
*(0
.000
4)Co
ntin
uati
onpr
ojec
t0.
0735
(0.1
096)
0.07
03(0
.113
3)0.
0648
(0.1
108)
Proj
ectm
ilest
ones
0.09
60.
(0.0
556)
0.09
83.
(0.0
564)
0.10
13.
(0.0
580)
Proj
ects
tatu
spr
oble
ms
-0.0
801
(0.1
215)
-0.0
891
(0.1
238)
-0.0
989
(0.1
251)
Age
ntfr
ugal
ity
-0.0
044
(0.0
138)
-0.0
081
(0.0
143)
-0.0
049
(0.0
149)
Revi
ewer
expe
rien
ce0.
0069
(0.0
074)
0.00
46(0
.007
3)0.
0042
(0.0
075)
Inde
pend
entv
aria
bles
H1:
Qua
ntit
yof
wri
tten
exan
tere
ason
ing
0.38
16**
*(0
.113
3)0.
5369
***
(0.1
005)
0.54
23**
*(0
.104
7)H
2:Fr
eque
ncy
ofre
visi
onof
wri
tten
exan
tere
ason
ing
0.01
54(0
.017
8)-0
.007
8(0
.020
6)0.
0129
(0.0
180)
H3:
Num
bero
frev
iew
ers
0.20
30.
(0.1
041)
0.16
03(0
.103
8)0.
1997
*(0
.101
6)H
4:Re
view
ers’
mut
ualr
evie
win
gte
nure
-0.1
015
(0.1
122)
-0.0
691
(0.1
177)
-0.1
076
(0.1
150)
H4:
Revi
ewer
s’m
utua
lrev
iew
ing
tenu
resq
uare
d0.
0233
.(0
.013
7)0.
0210
(0.0
142)
0.02
54.
(0.0
139)
H5:
Revi
ewer
s’re
view
ing
tenu
rew
ith
agen
t-0
.100
2.
(0.0
559)
-0.0
937
.(0
.054
0)-0
.089
0.
(0.0
536)
H6:
Revi
ewer
s’ti
esto
exte
rnal
revi
ewer
s0.
0292
*(0
.013
6)0.
0317
*(0
.013
5)0.
0299
*(0
.013
1)H
7:Pr
inci
pal’s
atte
ntio
n0.
0187
***
(0.0
029)
0.01
91**
*(0
.003
0)0.
0192
***
(0.0
031)
H8:
Inco
me
decr
ease
xQ
uant
ity
ofw
ritt
enex
ante
reas
onin
g0.
3836
*(0
.191
0)H
8:In
com
ede
crea
sex
Freq
uenc
yof
revi
sion
ofw
ritt
enex
ante
reas
onin
g0.
0703
.(0
.042
4)H
8:In
com
ede
crea
sex
Num
bero
frev
iew
ers
-0.0
560
(0.2
058)
H8:
Inco
me
decr
ease
xRe
view
ers’
mut
ualr
evie
win
gte
nure
H8:
Inco
me
decr
ease
xRe
view
ers’
mut
ualr
evie
win
gte
nure
squa
red
H8:
Inco
me
decr
ease
xRe
view
ers’
revi
ewin
gte
nure
wit
hag
ent
H8:
Inco
me
decr
ease
xRe
view
ers’
ties
toex
tern
alre
view
ers
H8:
Inco
me
decr
ease
xPr
inci
pal’s
atte
ntio
n
Cons
tant
-3.0
247
*(1
.526
6)-1
.161
9(0
.899
3)-1
.068
8(0
.938
5)N
468
468
468
R20.
491
0.48
90.
485
Adj
uste
dR2
0.46
20.
460
0.45
6F
17.0
4**
*16
.89
***
16.6
8**
*.p
<0.
10*
p<
0.05
**p
<0.
01**
*p
<0.
001
Uns
tand
ardi
zed
coef
fici
ents
;Clu
ster
-rob
usts
tand
ard
erro
rsin
pare
nthe
ses.
Proj
ecty
earc
ontr
olva
riab
les
notr
epor
ted
Table 7-11 Regression analysis with R&D project actual cost as the dependent variable, Projects with very long time horizon, Part 2

Appendix
189
Regr
essi
onan
alys
isTi
me
hori
zon:
R&D
proj
ects
wit
hve
rylo
ngti
me
toin
com
eD
epen
dent
varia
ble
:R&
Dpr
ojec
tact
ualc
ost
Mod
el1.
4.3.
4.1
Mod
el1.
4.3.
4.2
Mod
el1.
4.3.
4.3
Mod
el1.
4.3.
5M
odel
1.4.
3.6
Mod
el1.
4.3.
7Co
ntro
lvar
iabl
esPr
ojec
tbud
get
0.00
22**
*(0
.000
4)0.
0022
***
(0.0
004)
0.00
22**
*(0
.000
4)0.
0021
***
(0.0
004)
0.00
22**
*(0
.000
4)0.
0022
***
(0.0
004)
Cont
inua
tion
proj
ect
0.06
25(0
.111
1)0.
0628
(0.1
110)
0.06
21(0
.111
6)0.
0562
(0.1
115)
0.06
68(0
.111
0)0.
0781
(0.1
102)
Proj
ectm
ilest
ones
0.09
96.
(0.0
581)
0.09
96.
(0.0
581)
0.09
96.
(0.0
582)
0.09
70.
(0.0
586)
0.10
78.
(0.0
572)
0.10
04.
(0.0
578)
Proj
ects
tatu
spr
oble
ms
-0.0
937
(0.1
244)
-0.0
910
(0.1
252)
-0.0
908
(0.1
254)
-0.0
946
(0.1
263)
-0.0
953
(0.1
231)
-0.0
931
(0.1
247)
Age
ntfr
ugal
ity
-0.0
058
(0.0
142)
-0.0
059
(0.0
148)
-0.0
059
(0.0
149)
-0.0
054
(0.0
147)
-0.0
020
(0.0
125)
-0.0
040
(0.0
150)
Revi
ewer
expe
rien
ce0.
0043
(0.0
074)
0.00
44(0
.007
4)0.
0044
(0.0
075)
0.00
64(0
.008
0)0.
0059
(0.0
073)
0.00
52(0
.007
5)
Inde
pend
entv
aria
bles
H1:
Qua
ntit
yof
wri
tten
exan
tere
ason
ing
0.54
45**
*(0
.101
9)0.
5490
***
(0.1
031)
0.54
93**
*(0
.103
4)0.
5437
***
(0.1
021)
0.53
85**
*(0
.101
3)0.
5603
***
(0.1
033)
H2:
Freq
uenc
yof
revi
sion
ofw
ritt
enex
ante
reas
onin
g0.
0094
(0.0
184)
0.01
05(0
.018
4)0.
0104
(0.0
184)
0.01
35(0
.018
1)0.
0174
(0.0
185)
0.01
21(0
.017
9)H
3:N
umbe
rofr
evie
wer
s0.
1438
(0.0
966)
0.17
89.
(0.1
034)
0.17
98.
(0.1
036)
0.18
67.
(0.1
039)
0.19
54.
(0.1
051)
0.17
69.
(0.1
015)
H4:
Revi
ewer
s’m
utua
lrev
iew
ing
tenu
re0.
0669
(0.0
651)
-0.0
506
(0.1
328)
-0.0
550
(0.1
347)
-0.1
164
(0.1
173)
-0.1
321
(0.1
148)
-0.1
064
(0.1
186)
H4:
Revi
ewer
s’m
utua
lrev
iew
ing
tenu
resq
uare
d0.
0198
(0.0
158)
0.02
13(0
.019
9)0.
0250
.(0
.013
9)0.
0290
*(0
.014
0)0.
0240
.(0
.014
2)H
5:Re
view
ers’
revi
ewin
gte
nure
wit
hag
ent
-0.0
906
.(0
.053
5)-0
.090
9.
(0.0
536)
-0.0
910
.(0
.053
7)-0
.052
2(0
.052
7)-0
.095
3.
(0.0
537)
-0.0
862
(0.0
528)
H6:
Revi
ewer
s’ti
esto
exte
rnal
revi
ewer
s0.
0312
*(0
.012
8)0.
0301
*(0
.013
0)0.
0300
*(0
.013
1)0.
0273
*(0
.013
6)0.
0115
(0.0
134)
0.02
72*
(0.0
126)
H7:
Prin
cipa
l’sat
tent
ion
0.01
93**
*(0
.003
1)0.
0192
***
(0.0
031)
0.01
92**
*(0
.003
1)0.
0194
***
(0.0
031)
0.01
96**
*(0
.003
1)0.
0220
***
(0.0
041)
H8:
Inco
me
decr
ease
xQ
uant
ity
ofw
ritt
enex
ante
reas
onin
gH
8:In
com
ede
crea
sex
Freq
uenc
yof
revi
sion
ofw
ritt
enex
ante
reas
onin
gH
8:In
com
ede
crea
sex
Num
bero
frev
iew
ers
H8:
Inco
me
decr
ease
xRe
view
ers’
mut
ualr
evie
win
gte
nure
-0.2
104
(0.1
686)
-0.1
796
(0.1
881)
-0.1
811
(0.1
897)
H8:
Inco
me
decr
ease
xRe
view
ers’
mut
ualr
evie
win
gte
nure
squa
red
-0.0
020
(0.0
111)
H8:
Inco
me
decr
ease
xRe
view
ers’
revi
ewin
gte
nure
wit
hag
ent
-0.0
784
(0.0
873)
H8:
Inco
me
decr
ease
xRe
view
ers’
ties
toex
tern
alre
view
ers
0.06
50*
(0.0
280)
H8:
Inco
me
decr
ease
xPr
inci
pal’s
atte
ntio
n-0
.007
4(0
.004
6)
Cons
tant
-1.0
698
(0.9
069)
-1.1
331
(0.9
189)
-1.1
356
(0.9
215)
-1.0
385
(0.9
258)
-1.0
962
(0.9
020)
-1.4
611
(0.9
007)
N46
846
846
846
846
846
8R2
0.48
60.
487
0.48
70.
487
0.49
10.
489
Adj
uste
dR2
0.45
80.
458
0.45
60.
458
0.46
20.
460
F17
.43
***
16.7
6**
*16
.08
***
16.7
9**
*17
.07
***
16.9
2**
*.p
<0.
10*
p<
0.05
**p
<0.
01**
*p
<0.
001
Uns
tand
ardi
zed
coef
fici
ents
;Clu
ster
-rob
usts
tand
ard
erro
rsin
pare
nthe
ses.
Proj
ecty
earc
ontr
olva
riab
les
notr
epor
ted
Table 7-12 Regression analysis with R&D project actual cost as the dependent variable, Projects with very long time horizon, Part 3

190
Regr
essi
onan
alys
isTi
me
hori
zon:
R&D
proj
ects
wit
hm
odes
tly
long
tim
eto
inco
me
Dep
ende
ntva
riabl
e:R
&D
proj
ectb
udge
tM
odel
2.2.
1M
odel
2.2.
2M
odel
2.2.
2.1
Cont
rolv
aria
bles
Proj
ectb
udge
t0.
0030
***
(0.0
003)
0.00
15**
*(0
.000
3)0.
0015
***
(0.0
003)
Cont
inua
tion
proj
ect
-0.1
864
*(0
.087
5)-0
.019
2(0
.071
5)-0
.017
9(0
.071
7)A
gent
frug
alit
y-0
.021
5(0
.022
2)-0
.020
2*
(0.0
090)
-0.0
203
*(0
.009
1)Re
view
erex
peri
ence
0.00
10(0
.004
2)-0
.002
0(0
.004
5)-0
.002
3(0
.004
4)
Inde
pend
entv
aria
bles
H1:
Qua
ntit
yof
wri
tten
exan
tere
ason
ing
0.35
27**
*(0
.065
7)0.
3526
***
(0.0
659)
H3:
Num
bero
frev
iew
ers
0.06
09(0
.078
6)0.
0831
(0.0
830)
H4:
Revi
ewer
s’m
utua
lrev
iew
ing
tenu
re-0
.090
3.
(0.0
482)
-0.1
610
.(0
.082
6)H
4:Re
view
ers’
mut
ualr
evie
win
gte
nure
squa
red
0.01
34(0
.010
9)H
5:Re
view
ers’
revi
ewin
gte
nure
wit
hag
ent
-0.0
160
(0.0
283)
-0.0
149
(0.0
281)
H6:
Revi
ewer
s’ti
esto
exte
rnal
revi
ewer
s0.
0287
**(0
.010
0)0.
0285
**(0
.010
0)H
7:Pr
inci
pal’s
atte
ntio
n0.
0239
***
(0.0
016)
0.02
39**
*(0
.001
6)
Cons
tant
4.32
15**
*(0
.188
8)2.
1511
***
(0.5
812)
2.14
19**
*(0
.581
5)N
1118
1118
1118
R20.
209
0.51
50.
516
Adj
uste
dR2
0.19
90.
507
0.50
7F
20.8
2**
*58
.35
***
55.6
4**
*.p
<0.
10*
p<
0.05
**p
<0.
01**
*p
<0.
001
Uns
tand
ardi
zed
coef
fici
ents
;Clu
ster
-rob
usts
tand
ard
erro
rsin
pare
nthe
ses.
Proj
ecty
earc
ontr
olva
riab
les
notr
epor
ted
Table 7-13 Regression analysis with R&D project budget as the dependent variable, Projects with modestly long time horizon, Part 1

Appendix
191
Regr
essi
onan
alys
isTi
me
hori
zon:
R&D
proj
ects
wit
hm
odes
tly
long
tim
eto
inco
me
Dep
ende
ntva
riabl
e:R
&D
proj
ectb
udge
tM
odel
2.2.
3.1
Mod
el2.
2.3.
3M
odel
2.2.
3.4.
1M
odel
2.2.
3.4.
2M
odel
2.2.
3.4.
3Co
ntro
lvar
iabl
esPr
ojec
tbud
get
0.00
15**
*(0
.000
3)0.
0015
***
(0.0
003)
0.00
15**
*(0
.000
3)0.
0015
***
(0.0
003)
0.00
15**
*(0
.000
3)Co
ntin
uati
onpr
ojec
t-0
.018
9(0
.070
7)-0
.021
1(0
.072
0)-0
.019
2(0
.071
5)-0
.017
4(0
.071
7)-0
.020
0(0
.071
8)A
gent
frug
alit
y-0
.020
2*
(0.0
090)
-0.0
204
*(0
.009
0)-0
.020
2*
(0.0
090)
-0.0
204
*(0
.009
1)-0
.020
2*
(0.0
088)
Revi
ewer
expe
rien
ce-0
.002
0(0
.004
4)-0
.001
8(0
.004
5)-0
.002
0(0
.004
5)-0
.002
1(0
.004
5)-0
.002
1(0
.004
5)
Inde
pend
entv
aria
bles
H1:
Qua
ntit
yof
wri
tten
exan
tere
ason
ing
0.34
97**
*(0
.090
0)0.
3532
***
(0.0
653)
0.35
29**
*(0
.065
7)0.
3540
***
(0.0
659)
0.35
45**
*(0
.065
7)H
3:N
umbe
rofr
evie
wer
s0.
0611
(0.0
794)
0.08
44(0
.099
9)0.
0599
(0.0
791)
0.08
35(0
.083
1)0.
0438
(0.0
850)
H4:
Revi
ewer
s’m
utua
lrev
iew
ing
tenu
re-0
.090
3.
(0.0
483)
-0.0
915
.(0
.048
3)-0
.086
3(0
.061
4)-0
.155
7.
(0.0
796)
0.07
37(0
.165
3)H
4:Re
view
ers’
mut
ualr
evie
win
gte
nure
squa
red
0.02
11(0
.015
8)-0
.054
8(0
.048
0)H
5:Re
view
ers’
revi
ewin
gte
nure
wit
hag
ent
-0.0
160
(0.0
283)
-0.0
161
(0.0
284)
-0.0
162
(0.0
285)
-0.0
162
(0.0
284)
-0.0
142
(0.0
285)
H6:
Revi
ewer
s’ti
esto
exte
rnal
revi
ewer
s0.
0287
**(0
.010
0)0.
0278
**(0
.010
1)0.
0286
**(0
.010
0)0.
0281
**(0
.010
1)0.
0285
**(0
.010
2)H
7:Pr
inci
pal’s
atte
ntio
n0.
0239
***
(0.0
016)
0.02
39**
*(0
.001
6)0.
0240
***
(0.0
016)
0.02
39**
*(0
.001
6)0.
0238
***
(0.0
016)
H8:
Inco
me
decr
ease
xQ
uant
ity
ofw
ritt
enex
ante
reas
onin
g0.
0072
(0.1
203)
H8:
Inco
me
decr
ease
xN
umbe
rofr
evie
wer
s-0
.071
5(0
.131
4)H
8:In
com
ede
crea
sex
Revi
ewer
s’m
utua
lrev
iew
ing
tenu
re-0
.006
5(0
.087
1)-0
.073
9(0
.105
0)-0
.355
7.
(0.1
859)
H8:
Inco
me
decr
ease
xRe
view
ers’
mut
ualr
evie
win
gte
nure
squa
red
0.08
47.
(0.0
476)
H8:
Inco
me
decr
ease
xRe
view
ers’
revi
ewin
gte
nure
wit
hag
ent
H8:
Inco
me
decr
ease
xRe
view
ers’
ties
toex
tern
alre
view
ers
H8:
Inco
me
decr
ease
xPr
inci
pal’s
atte
ntio
n
Cons
tant
2.11
51**
(0.7
335)
2.16
66**
*(0
.589
2)2.
1506
***
(0.5
817)
2.13
06**
*(0
.582
0)2.
1455
***
(0.5
811)
N11
1811
1811
1811
1811
18R2
0.51
50.
516
0.51
50.
516
0.51
8A
djus
ted
R20.
506
0.50
60.
506
0.50
70.
508
F55
.52
***
55.5
7**
*55
.52
***
53.1
4**
*51
.15
***
.p<
0.10
*p
<0.
05**
p<
0.01
***
p<
0.00
1U
nsta
ndar
dize
dco
effi
cien
ts;C
lust
er-r
obus
tsta
ndar
der
rors
inpa
rent
hese
s.Pr
ojec
tyea
rcon
trol
vari
able
sno
trep
orte
d
Table 7-14 Regression analysis with R&D project budget as the dependent variable, Projects with modestly long time horizon, Part 2

192
Regr
essi
onan
alys
isTi
me
hori
zon:
R&D
proj
ects
wit
hm
odes
tly
long
tim
eto
inco
me
Dep
ende
ntva
riabl
e:R
&D
proj
ectb
udge
tM
odel
2.2.
3.5
Mod
el2.
2.3.
6M
odel
2.2.
3.7
Cont
rolv
aria
bles
Proj
ectb
udge
t0.
0015
***
(0.0
003)
0.00
15**
*(0
.000
3)0.
0015
***
(0.0
003)
Cont
inua
tion
proj
ect
-0.0
136
(0.0
721)
-0.0
146
(0.0
717)
-0.0
184
(0.0
713)
Age
ntfr
ugal
ity
-0.0
203
*(0
.008
9)-0
.019
7*
(0.0
085)
-0.0
203
*(0
.008
9)Re
view
erex
peri
ence
-0.0
005
(0.0
047)
-0.0
022
(0.0
044)
-0.0
019
(0.0
045)
Inde
pend
entv
aria
bles
H1:
Qua
ntit
yof
wri
tten
exan
tere
ason
ing
0.35
12**
*(0
.065
7)0.
3535
***
(0.0
654)
0.35
29**
*(0
.065
9)H
3:N
umbe
rofr
evie
wer
s0.
0648
(0.0
786)
0.04
65(0
.078
4)0.
0589
(0.0
786)
H4:
Revi
ewer
s’m
utua
lrev
iew
ing
tenu
re-0
.095
3*
(0.0
481)
-0.0
834
.(0
.047
3)-0
.089
6.
(0.0
483)
H4:
Revi
ewer
s’m
utua
lrev
iew
ing
tenu
resq
uare
dH
5:Re
view
ers’
revi
ewin
gte
nure
wit
hag
ent
0.02
05(0
.035
8)-0
.018
3(0
.028
5)-0
.016
3(0
.028
2)H
6:Re
view
ers’
ties
toex
tern
alre
view
ers
0.02
49*
(0.0
100)
0.03
77**
*(0
.010
9)0.
0286
**(0
.010
0)H
7:Pr
inci
pal’s
atte
ntio
n0.
0239
***
(0.0
016)
0.02
39**
*(0
.001
6)0.
0243
***
(0.0
025)
H8:
Inco
me
decr
ease
xQ
uant
ity
ofw
ritt
enex
ante
reas
onin
gH
8:In
com
ede
crea
sex
Num
bero
frev
iew
ers
H8:
Inco
me
decr
ease
xRe
view
ers’
mut
ualr
evie
win
gte
nure
H8:
Inco
me
decr
ease
xRe
view
ers’
mut
ualr
evie
win
gte
nure
squa
red
H8:
Inco
me
decr
ease
xRe
view
ers’
revi
ewin
gte
nure
wit
hag
ent
-0.0
762
(0.0
513)
H8:
Inco
me
decr
ease
xRe
view
ers’
ties
toex
tern
alre
view
ers
-0.0
358
*(0
.014
5)H
8:In
com
ede
crea
sex
Prin
cipa
l’sat
tent
ion
-0.0
007
(0.0
029)
Cons
tant
2.18
87**
*(0
.583
0)2.
1584
***
(0.5
788)
2.13
62**
*(0
.582
6)N
1118
1118
1118
R20.
517
0.51
80.
516
Adj
uste
dR2
0.50
80.
508
0.50
6F
55.9
1**
*56
.01
***
55.5
4**
*.p
<0.
10*
p<
0.05
**p
<0.
01**
*p
<0.
001
Uns
tand
ardi
zed
coef
fici
ents
;Clu
ster
-rob
usts
tand
ard
erro
rsin
pare
nthe
ses.
Proj
ecty
earc
ontr
olva
riab
les
notr
epor
ted
Table 7-15 Regression analysis with R&D project budget as the dependent variable, Projects with modestly long time horizon, Part 3
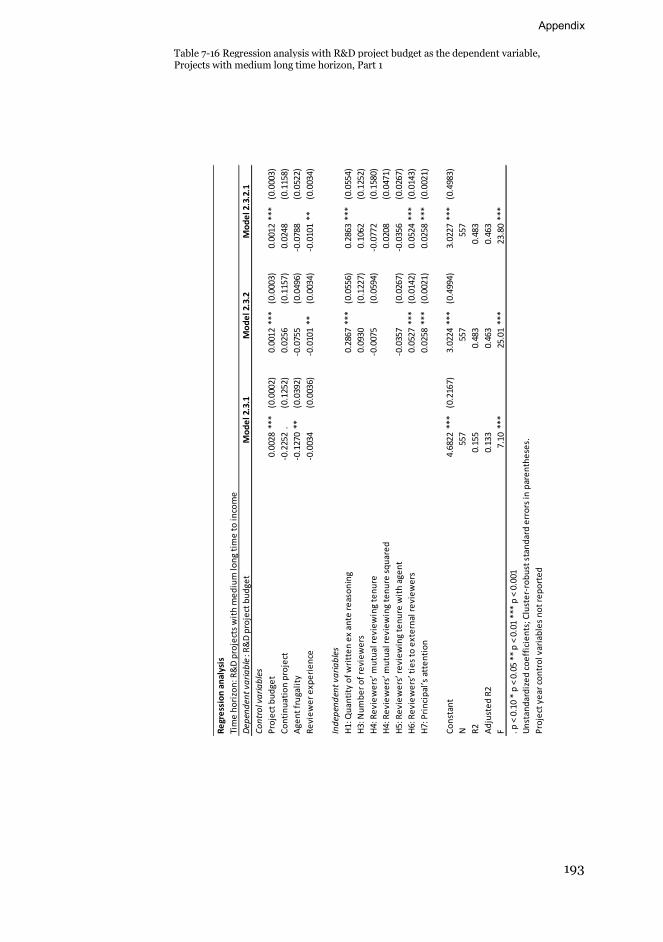
Appendix
193
Regr
essi
onan
alys
isTi
me
hori
zon:
R&D
proj
ects
wit
hm
ediu
mlo
ngti
me
toin
com
eD
epen
dent
varia
ble
:R&
Dpr
ojec
tbud
get
Mod
el2.
3.1
Mod
el2.
3.2
Mod
el2.
3.2.
1Co
ntro
lvar
iabl
esPr
ojec
tbud
get
0.00
28**
*(0
.000
2)0.
0012
***
(0.0
003)
0.00
12**
*(0
.000
3)Co
ntin
uati
onpr
ojec
t-0
.225
2.
(0.1
252)
0.02
56(0
.115
7)0.
0248
(0.1
158)
Age
ntfr
ugal
ity
-0.1
270
**(0
.039
2)-0
.075
5(0
.049
6)-0
.078
8(0
.052
2)Re
view
erex
peri
ence
-0.0
034
(0.0
036)
-0.0
101
**(0
.003
4)-0
.010
1**
(0.0
034)
Inde
pend
entv
aria
bles
H1:
Qua
ntit
yof
wri
tten
exan
tere
ason
ing
0.28
67**
*(0
.055
6)0.
2863
***
(0.0
554)
H3:
Num
bero
frev
iew
ers
0.09
30(0
.122
7)0.
1062
(0.1
252)
H4:
Revi
ewer
s’m
utua
lrev
iew
ing
tenu
re-0
.007
5(0
.059
4)-0
.077
2(0
.158
0)H
4:Re
view
ers’
mut
ualr
evie
win
gte
nure
squa
red
0.02
08(0
.047
1)H
5:Re
view
ers’
revi
ewin
gte
nure
wit
hag
ent
-0.0
357
(0.0
267)
-0.0
356
(0.0
267)
H6:
Revi
ewer
s’ti
esto
exte
rnal
revi
ewer
s0.
0527
***
(0.0
142)
0.05
24**
*(0
.014
3)H
7:Pr
inci
pal’s
atte
ntio
n0.
0258
***
(0.0
021)
0.02
58**
*(0
.002
1)
Cons
tant
4.68
22**
*(0
.216
7)3.
0224
***
(0.4
994)
3.02
27**
*(0
.498
3)N
557
557
557
R20.
155
0.48
30.
483
Adj
uste
dR2
0.13
30.
463
0.46
3F
7.10
***
25.0
1**
*23
.80
***
.p<
0.10
*p
<0.
05**
p<
0.01
***
p<
0.00
1U
nsta
ndar
dize
dco
effi
cien
ts;C
lust
er-r
obus
tsta
ndar
der
rors
inpa
rent
hese
s.Pr
ojec
tyea
rcon
trol
vari
able
sno
trep
orte
d
Table 7-16 Regression analysis with R&D project budget as the dependent variable, Projects with medium long time horizon, Part 1

194
Regr
essi
onan
alys
isTi
me
hori
zon:
R&D
proj
ects
wit
hm
ediu
mlo
ngti
me
toin
com
eD
epen
dent
varia
ble
:R&
Dpr
ojec
tbud
get
Mod
el2.
3.3.
1M
odel
2.3.
3.3
Mod
el2.
3.3.
4.1
Mod
el2.
3.3.
4.2
Mod
el2.
3.3.
4.3
Cont
rolv
aria
bles
Proj
ectb
udge
t0.
0013
***
(0.0
003)
0.00
12**
*(0
.000
3)0.
0012
***
(0.0
003)
0.00
13**
*(0
.000
3)0.
0012
***
(0.0
003)
Cont
inua
tion
proj
ect
0.01
30(0
.115
1)0.
0257
(0.1
152)
0.02
33(0
.116
6)0.
0217
(0.1
170)
0.01
44(0
.115
5)A
gent
frug
alit
y-0
.069
5(0
.049
0)-0
.073
1(0
.050
5)-0
.076
4(0
.050
1)-0
.081
2(0
.053
2)-0
.073
6(0
.053
3)Re
view
erex
peri
ence
-0.0
097
**(0
.003
3)-0
.009
5**
(0.0
035)
-0.0
101
**(0
.003
4)-0
.010
2**
(0.0
034)
-0.0
099
**(0
.003
4)
Inde
pend
entv
aria
bles
H1:
Qua
ntit
yof
wri
tten
exan
tere
ason
ing
0.20
34**
(0.0
684)
0.28
91**
*(0
.055
9)0.
2874
***
(0.0
557)
0.28
70**
*(0
.055
5)0.
2860
***
(0.0
544)
H3:
Num
bero
frev
iew
ers
0.08
82(0
.122
2)0.
1512
(0.1
779)
0.09
07(0
.123
5)0.
1081
(0.1
254)
0.12
28(0
.125
4)H
4:Re
view
ers’
mut
ualr
evie
win
gte
nure
-0.0
073
(0.0
592)
-0.0
104
(0.0
598)
-0.0
262
(0.0
755)
-0.1
269
(0.1
783)
-0.0
283
(0.2
032)
H4:
Revi
ewer
s’m
utua
lrev
iew
ing
tenu
resq
uare
d0.
0285
(0.0
480)
-0.0
018
(0.0
563)
H5:
Revi
ewer
s’re
view
ing
tenu
rew
ith
agen
t-0
.033
4(0
.026
1)-0
.036
2(0
.026
8)-0
.036
0(0
.026
7)-0
.035
9(0
.026
7)-0
.038
8(0
.026
5)H
6:Re
view
ers’
ties
toex
tern
alre
view
ers
0.05
33**
*(0
.014
1)0.
0522
***
(0.0
138)
0.05
26**
*(0
.014
3)0.
0522
***
(0.0
144)
0.05
22**
*(0
.014
4)H
7:Pr
inci
pal’s
atte
ntio
n0.
0259
***
(0.0
021)
0.02
57**
*(0
.002
1)0.
0257
***
(0.0
021)
0.02
58**
*(0
.002
1)0.
0257
***
(0.0
021)
H8:
Inco
me
decr
ease
xQ
uant
ity
ofw
ritt
enex
ante
reas
onin
g0.
1740
(0.1
153)
H8:
Inco
me
decr
ease
xN
umbe
rofr
evie
wer
s-0
.124
6(0
.220
7)H
8:In
com
ede
crea
sex
Revi
ewer
s’m
utua
lrev
iew
ing
tenu
re0.
0668
(0.1
052)
0.08
52(0
.105
9)-0
.376
3(0
.301
7)H
8:In
com
ede
crea
sex
Revi
ewer
s’m
utua
lrev
iew
ing
tenu
resq
uare
d0.
1670
.(0
.093
2)H
8:In
com
ede
crea
sex
Revi
ewer
s’re
view
ing
tenu
rew
ith
agen
tH
8:In
com
ede
crea
sex
Revi
ewer
s’ti
esto
exte
rnal
revi
ewer
sH
8:In
com
ede
crea
sex
Prin
cipa
l’sat
tent
ion
Cons
tant
2.25
47**
(0.8
198)
3.01
87**
*(0
.502
9)3.
0188
***
(0.5
000)
3.01
81**
*(0
.498
3)3.
0215
***
(0.4
896)
N55
755
755
755
755
7R2
0.48
50.
484
0.48
30.
483
0.48
6A
djus
ted
R20.
465
0.46
30.
463
0.46
20.
464
F24
.01
***
23.8
5**
*23
.81
***
22.7
2**
*21
.89
***
.p<
0.10
*p
<0.
05**
p<
0.01
***
p<
0.00
1U
nsta
ndar
dize
dco
effi
cien
ts;C
lust
er-r
obus
tsta
ndar
der
rors
inpa
rent
hese
s.Pr
ojec
tyea
rcon
trol
vari
able
sno
trep
orte
d
Table 7-17 Regression analysis with R&D project budget as the dependent variable, Projects with medium long time horizon, Part 2

Appendix
195
Regr
essi
onan
alys
isTi
me
hori
zon:
R&D
proj
ects
wit
hm
ediu
mlo
ngti
me
toin
com
eD
epen
dent
varia
ble
:R&
Dpr
ojec
tbud
get
Mod
el2.
3.3.
5M
odel
2.3.
3.6
Mod
el2.
3.3.
7Co
ntro
lvar
iabl
esPr
ojec
tbud
get
0.00
12**
*(0
.000
3)0.
0012
***
(0.0
003)
0.00
12**
*(0
.000
3)Co
ntin
uati
onpr
ojec
t0.
0254
(0.1
160)
0.01
94(0
.116
6)0.
0246
(0.1
161)
Age
ntfr
ugal
ity
-0.0
755
(0.0
496)
-0.0
732
(0.0
498)
-0.0
780
(0.0
496)
Revi
ewer
expe
rien
ce-0
.010
0**
(0.0
034)
-0.0
100
**(0
.003
4)-0
.010
1**
(0.0
034)
Inde
pend
entv
aria
bles
H1:
Qua
ntit
yof
wri
tten
exan
tere
ason
ing
0.28
65**
*(0
.055
8)0.
2863
***
(0.0
553)
0.28
94**
*(0
.054
8)H
3:N
umbe
rofr
evie
wer
s0.
0933
(0.1
232)
0.09
36(0
.122
9)0.
0940
(0.1
231)
H4:
Revi
ewer
s’m
utua
lrev
iew
ing
tenu
re-0
.007
4(0
.059
4)-0
.007
8(0
.059
5)-0
.006
9(0
.059
1)H
4:Re
view
ers’
mut
ualr
evie
win
gte
nure
squa
red
H5:
Revi
ewer
s’re
view
ing
tenu
rew
ith
agen
t-0
.033
3(0
.041
3)-0
.034
1(0
.027
0)-0
.035
7(0
.026
8)H
6:Re
view
ers’
ties
toex
tern
alre
view
ers
0.05
25**
*(0
.014
1)0.
0495
**(0
.015
6)0.
0521
***
(0.0
145)
H7:
Prin
cipa
l’sat
tent
ion
0.02
58**
*(0
.002
1)0.
0256
***
(0.0
021)
0.02
51**
*(0
.003
0)H
8:In
com
ede
crea
sex
Qua
ntit
yof
wri
tten
exan
tere
ason
ing
H8:
Inco
me
decr
ease
xN
umbe
rofr
evie
wer
sH
8:In
com
ede
crea
sex
Revi
ewer
s’m
utua
lrev
iew
ing
tenu
reH
8:In
com
ede
crea
sex
Revi
ewer
s’m
utua
lrev
iew
ing
tenu
resq
uare
dH
8:In
com
ede
crea
sex
Revi
ewer
s’re
view
ing
tenu
rew
ith
agen
t-0
.004
9(0
.047
4)H
8:In
com
ede
crea
sex
Revi
ewer
s’ti
esto
exte
rnal
revi
ewer
s0.
0206
(0.0
239)
H8:
Inco
me
decr
ease
xPr
inci
pal’s
atte
ntio
n0.
0014
(0.0
039)
Cons
tant
3.02
57**
*(0
.502
1)3.
0207
***
(0.4
963)
3.01
80**
*(0
.499
8)N
557
557
557
R20.
483
0.48
40.
483
Adj
uste
dR2
0.46
20.
463
0.46
3F
23.7
8**
*23
.85
***
23.8
0**
*.p
<0.
10*
p<
0.05
**p
<0.
01**
*p
<0.
001
Uns
tand
ardi
zed
coef
fici
ents
;Clu
ster
-rob
usts
tand
ard
erro
rsin
pare
nthe
ses.
Proj
ecty
earc
ontr
olva
riab
les
notr
epor
ted
Table 7-18 Regression analysis with R&D project budget as the dependent variable, Projects with medium long time horizon, Part 3

196
Regr
essi
onan
alys
isTi
me
hori
zon:
R&D
proj
ects
wit
hve
rylo
ngti
me
toin
com
eD
epen
dent
varia
ble
:R&
Dpr
ojec
tbud
get
Mod
el2.
4.1
Mod
el2.
4.2
Mod
el2.
4.2.
1Co
ntro
lvar
iabl
esPr
ojec
tbud
get
0.00
17**
*(0
.000
3)0.
0012
***
(0.0
002)
0.00
12**
*(0
.000
2)Co
ntin
uati
onpr
ojec
t-0
.156
2(0
.123
9)0.
0463
(0.1
108)
0.04
89(0
.111
2)A
gent
frug
alit
y-0
.020
4*
(0.0
081)
-0.0
090
*(0
.003
9)-0
.009
4*
(0.0
038)
Revi
ewer
expe
rien
ce0.
0017
(0.0
042)
0.00
28(0
.006
2)0.
0029
(0.0
062)
Inde
pend
entv
aria
bles
H1:
Qua
ntit
yof
wri
tten
exan
tere
ason
ing
0.21
19**
(0.0
802)
0.22
07**
(0.0
798)
H3:
Num
bero
frev
iew
ers
0.02
60(0
.097
0)0.
0740
(0.1
039)
H4:
Revi
ewer
s’m
utua
lrev
iew
ing
tenu
re-0
.037
1(0
.050
2)-0
.184
9.
(0.1
045)
H4:
Revi
ewer
s’m
utua
lrev
iew
ing
tenu
resq
uare
d0.
0258
*(0
.012
6)H
5:Re
view
ers’
revi
ewin
gte
nure
wit
hag
ent
-0.1
154
**(0
.039
5)-0
.116
0**
(0.0
394)
H6:
Revi
ewer
s’ti
esto
exte
rnal
revi
ewer
s0.
0336
***
(0.0
087)
0.03
21**
*(0
.008
8)H
7:Pr
inci
pal’s
atte
ntio
n0.
0214
***
(0.0
023)
0.02
13**
*(0
.002
2)
Cons
tant
4.29
54**
*(0
.135
1)3.
5311
***
(0.7
394)
3.42
65**
*(0
.736
4)N
468
468
468
R20.
146
0.41
40.
417
Adj
uste
dR2
0.11
90.
388
0.38
9F
5.52
***
15.7
8**
*15
.18
***
.p<
0.10
*p
<0.
05**
p<
0.01
***
p<
0.00
1U
nsta
ndar
dize
dco
effi
cien
ts;C
lust
er-r
obus
tsta
ndar
der
rors
inpa
rent
hese
s.Pr
ojec
tyea
rcon
trol
vari
able
sno
trep
orte
d
Table 7-19 Regression analysis with R&D project budget as the dependent variable, Projects with very long time horizon, Part 1

Appendix
197
Regr
essi
onan
alys
isTi
me
hori
zon:
R&D
proj
ects
wit
hve
rylo
ngti
me
toin
com
eD
epen
dent
varia
ble
:R&
Dpr
ojec
tbud
get
Mod
el2.
4.3.
1M
odel
2.4.
3.3
Mod
el2.
4.3.
4.1
Mod
el2.
4.3.
4.2
Mod
el2.
4.3.
4.3
Cont
rolv
aria
bles
Proj
ectb
udge
t0.
0012
***
(0.0
002)
0.00
12**
*(0
.000
2)0.
0012
***
(0.0
002)
0.00
12**
*(0
.000
2)0.
0012
***
(0.0
002)
Cont
inua
tion
proj
ect
0.04
80(0
.111
2)0.
0489
(0.1
113)
0.04
77(0
.112
1)0.
0451
(0.1
128)
0.03
96(0
.113
0)A
gent
frug
ality
-0.0
091
*(0
.003
8)-0
.009
4*
(0.0
038)
-0.0
089
*(0
.003
9)-0
.009
5*
(0.0
039)
-0.0
092
*(0
.004
0)Re
view
erex
peri
ence
0.00
24(0
.006
3)0.
0028
(0.0
062)
0.00
27(0
.006
2)0.
0031
(0.0
063)
0.00
33(0
.006
3)
Inde
pend
entv
aria
bles
H1:
Qua
ntit
yof
wri
tten
exan
tere
ason
ing
0.25
60*
(0.1
007)
0.22
14**
(0.0
804)
0.21
23**
(0.0
802)
0.22
09**
(0.0
799)
0.21
88**
(0.0
798)
H3:
Num
bero
frev
iew
ers
0.06
88(0
.105
1)0.
0629
(0.1
192)
0.02
67(0
.096
3)0.
0788
(0.1
059)
0.08
62(0
.105
8)H
4:Re
view
ers’
mut
ualr
evie
win
gte
nure
-0.1
863
.(0
.104
8)-0
.181
5.
(0.1
051)
-0.0
419
(0.0
529)
-0.1
918
.(0
.107
2)-0
.106
2(0
.117
5)H
4:Re
view
ers’
mut
ualr
evie
win
gte
nure
squa
red
0.02
59*
(0.0
126)
0.02
55*
(0.0
126)
0.02
95*
(0.0
139)
0.01
08(0
.017
5)H
5:Re
view
ers’
revi
ewin
gte
nure
wit
hag
ent
-0.1
136
**(0
.038
2)-0
.116
1**
(0.0
394)
-0.1
151
**(0
.039
8)-0
.116
8**
(0.0
395)
-0.1
179
**(0
.039
3)H
6:Re
view
ers’
ties
toex
tern
alre
view
ers
0.03
21**
*(0
.008
8)0.
0324
***
(0.0
086)
0.03
37**
*(0
.008
9)0.
0315
***
(0.0
089)
0.02
99**
*(0
.008
8)H
7:Pr
inci
pal’s
atte
ntio
n0.
0213
***
(0.0
022)
0.02
13**
*(0
.002
2)0.
0214
***
(0.0
023)
0.02
13**
*(0
.002
2)0.
0215
***
(0.0
022)
H8:
Inco
me
decr
ease
xQ
uant
ity
ofw
ritte
nex
ante
reas
onin
g-0
.077
9(0
.148
4)H
8:In
com
ede
crea
sex
Num
bero
frev
iew
ers
0.02
70(0
.173
9)H
8:In
com
ede
crea
sex
Revi
ewer
s’m
utua
lrev
iew
ing
tenu
re0.
0178
(0.1
005)
-0.0
521
(0.0
826)
-0.3
852
.(0
.207
1)H
8:In
com
ede
crea
sex
Revi
ewer
s’m
utua
lrev
iew
ing
tenu
resq
uare
d0.
0527
*(0
.024
2)H
8:In
com
ede
crea
sex
Revi
ewer
s’re
view
ing
tenu
rew
ith
agen
tH
8:In
com
ede
crea
sex
Revi
ewer
s’ti
esto
exte
rnal
revi
ewer
sH
8:In
com
ede
crea
sex
Prin
cipa
l’sat
tent
ion
Cons
tant
3.79
32**
*(1
.060
3)3.
4154
***
(0.7
488)
3.52
71**
*(0
.739
4)3.
4235
***
(0.7
361)
3.44
45**
*(0
.734
4)N
468
468
468
468
468
R20.
417
0.41
70.
414
0.41
70.
420
Adj
uste
dR2
0.38
80.
388
0.38
60.
388
0.39
0F
14.4
8**
*14
.46
***
15.0
0**
*14
.47
***
13.9
6**
*.p
<0.
10*
p<
0.05
**p
<0.
01**
*p
<0.
001
Uns
tand
ardi
zed
coef
fici
ents
;Clu
ster
-rob
usts
tand
ard
erro
rsin
pare
nthe
ses.
Proj
ecty
earc
ontr
olva
riab
les
notr
epor
ted
Table 7-20 Regression analysis with R&D project budget as the dependent variable, Projects with very long time horizon, Part 2
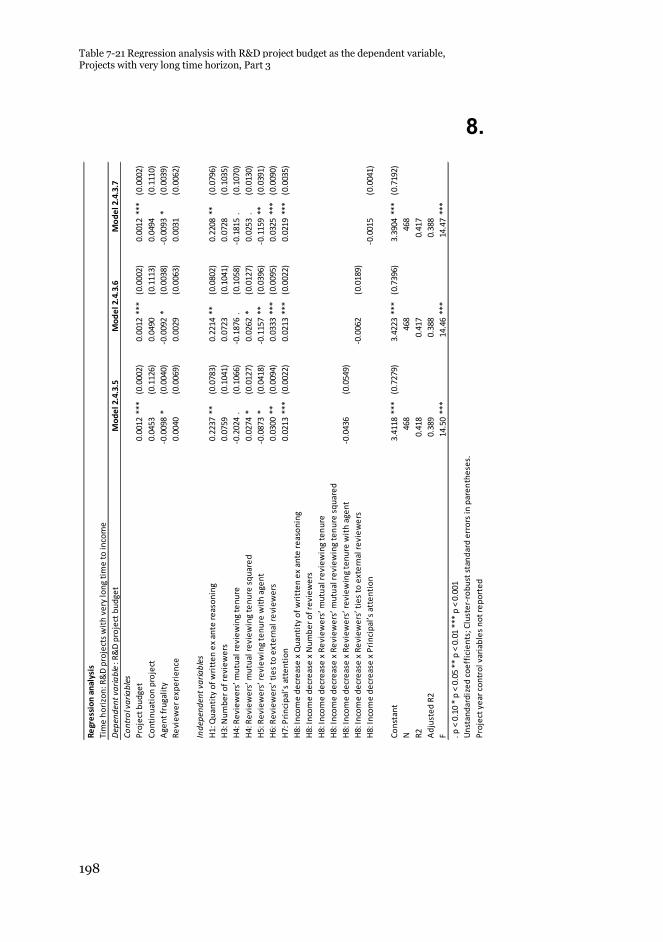
198
8.
Regr
essi
onan
alys
isTi
me
hori
zon:
R&D
proj
ects
wit
hve
rylo
ngti
me
toin
com
eD
epen
dent
varia
ble
:R&
Dpr
ojec
tbud
get
Mod
el2.
4.3.
5M
odel
2.4.
3.6
Mod
el2.
4.3.
7Co
ntro
lvar
iabl
esPr
ojec
tbud
get
0.00
12**
*(0
.000
2)0.
0012
***
(0.0
002)
0.00
12**
*(0
.000
2)Co
ntin
uati
onpr
ojec
t0.
0453
(0.1
126)
0.04
90(0
.111
3)0.
0494
(0.1
110)
Age
ntfr
ugal
ity
-0.0
098
*(0
.004
0)-0
.009
2*
(0.0
038)
-0.0
093
*(0
.003
9)Re
view
erex
peri
ence
0.00
40(0
.006
9)0.
0029
(0.0
063)
0.00
31(0
.006
2)
Inde
pend
entv
aria
bles
H1:
Qua
ntit
yof
wri
tten
exan
tere
ason
ing
0.22
37**
(0.0
783)
0.22
14**
(0.0
802)
0.22
08**
(0.0
796)
H3:
Num
bero
frev
iew
ers
0.07
59(0
.104
1)0.
0723
(0.1
041)
0.07
28(0
.103
5)H
4:Re
view
ers’
mut
ualr
evie
win
gte
nure
-0.2
024
.(0
.106
6)-0
.187
6.
(0.1
058)
-0.1
815
.(0
.107
0)H
4:Re
view
ers’
mut
ualr
evie
win
gte
nure
squa
red
0.02
74*
(0.0
127)
0.02
62*
(0.0
127)
0.02
53.
(0.0
130)
H5:
Revi
ewer
s’re
view
ing
tenu
rew
ith
agen
t-0
.087
3*
(0.0
418)
-0.1
157
**(0
.039
6)-0
.115
9**
(0.0
391)
H6:
Revi
ewer
s’ti
esto
exte
rnal
revi
ewer
s0.
0300
**(0
.009
4)0.
0333
***
(0.0
095)
0.03
25**
*(0
.009
0)H
7:Pr
inci
pal’s
atte
ntio
n0.
0213
***
(0.0
022)
0.02
13**
*(0
.002
2)0.
0219
***
(0.0
035)
H8:
Inco
me
decr
ease
xQ
uant
ity
ofw
ritt
enex
ante
reas
onin
gH
8:In
com
ede
crea
sex
Num
bero
frev
iew
ers
H8:
Inco
me
decr
ease
xRe
view
ers’
mut
ualr
evie
win
gte
nure
H8:
Inco
me
decr
ease
xRe
view
ers’
mut
ualr
evie
win
gte
nure
squa
red
H8:
Inco
me
decr
ease
xRe
view
ers’
revi
ewin
gte
nure
wit
hag
ent
-0.0
436
(0.0
549)
H8:
Inco
me
decr
ease
xRe
view
ers’
ties
toex
tern
alre
view
ers
-0.0
062
(0.0
189)
H8:
Inco
me
decr
ease
xPr
inci
pal’s
atte
ntio
n-0
.001
5(0
.004
1)
Cons
tant
3.41
18**
*(0
.727
9)3.
4223
***
(0.7
396)
3.39
04**
*(0
.719
2)N
468
468
468
R20.
418
0.41
70.
417
Adj
uste
dR2
0.38
90.
388
0.38
8F
14.5
0**
*14
.46
***
14.4
7**
*.p
<0.
10*
p<
0.05
**p
<0.
01**
*p
<0.
001
Uns
tand
ardi
zed
coef
fici
ents
;Clu
ster
-rob
usts
tand
ard
erro
rsin
pare
nthe
ses.
Proj
ecty
earc
ontr
olva
riab
les
notr
epor
ted
Table 7-21 Regression analysis with R&D project budget as the dependent variable, Projects with very long time horizon, Part 3

References
199
References
Abrahamson, E., & Park, C. 1994. Concealment of negative organizational
outcomes: An agency theory perspective. Academy of Management Journal,
37(5): 1302-1334.
Adams, R. B., & Ferreira, D. 2007. A theory of friendly boards. Journal of
Finance, 62(1): 217-250.
Aghion, P., & Bolton, P. 1992. An incomplete contracts approach to
financial contracting. Review of Economic Studies, 59(3): 473-494.
Aghion, P., & Tirole, J. 1997. Formal and real authority in organizations.
Journal of Political Economy, 105(1): 1-29.
Aguilera, R. V., & Jackson, G. 2010. Comparative and international
corporate governance. Academy of Management Annals, 4(1): 485-556.
Alchian, A. A., & Demsetz, H. 1972. Production, information costs, and
economic organization. American Economic Review, 62(5): 777-795.
Alderfer, C. P. 1986. From the boardroom: The invisible director on
corporate boards. Harvard Business Review, November-December: 38-52.
Alexander, J. A., Fennell, M. L., & Halpern, M. T. 1993. Leadership
instability in hospitals: The influence of board-CEO relations and
organizational growth and decline. Administrative Science Quarterly, 38:
74-99.
Amabile, T. M. 1993. Motivational synergy: Toward new
conceptualizations of intrinsic and extrinsic motivation in the workplace.
Human Resource Management Review, 3(3): 185-201.
Anderson, M. H. 2008. Social networks and the cognitive motivation to
realize network opportunities: A study of managers’ information gathering
behaviors. Journal of Organizational Behavior, 59: 51-78.
Arai, M. 2011. Cluster-robust standard errors using R. Stockholm
University. Available at: http://people.su.se/~ma/clustering.pdf (accessed
27 February 2013).
Arthurs, J. D., Hoskisson, R. E., Busenitz, L. W., & Johnson, R. A. 2008.
Managerial agents watching other agents: Multiple agency conflicts
regarding underpricing in IPO firms. Academy of Management Journal,
51(2): 277-294.

200
Audia, P. G., & Greve, H. R. 2006. Less likely to fail: Low performance,
firm size, and factory expansion in the shipbuilding industry. Management
Science, 52(1): 83-94.
Audia, P. G., Locke, E. A., & Smith, K. G. 2000. The paradox of success:
An archival and a laboratory study of strategic persistence following radical
environmental change. Academy of Management Journal, 43(5): 837-853.
Baker, G. P. 1992. Incentive contracts and performance measurement.
Journal of Political Economy, 100(3): 598-614.
Baker, G., Gibbons, R., & Murphy, K. J. 1999. Informal authority in
organizations. Journal of Law, Economics, & Organization. 15(1): 56-73.
Baker, G. P., Jensen, M. C., & Murphy, K. J. 1988. Compensation and
incentives: Practice vs. theory. Journal of Finance, 43(3): 593-616.
Baliga, B. R., Moyer, R. C., & Rao, R. S. 1996. CEO duality and firm
performance: What’s the fuss? Strategic Management Journal, 17: 41-53.
Balkin, D. B., Markman, G. D., & Gomez-Meija, L. R. 2000. Is CEO pay in
high-technology firms related to innovation? Academy of Management
Journal, 43(6): 1118-1129.
Barnard, C. I. 1938. The functions of the executive. Revised edition 1968.
Cambride: MA: Harvard University Press.
Barrett, C. 2010. Smart people, smart ideas and the right environment
drive innovation. Research Technology Management, January-February,
2010.
Barringer, B. R., & Bluedorn, A. C. 1999. The relationship between
corporate entrepreneurship and strategic management. Strategic
Management Journal, 20: 421-444.
Baysinger, B., & Hoskisson, R. E. 1989. Diversification strategy and R&D
intensity in multiproduct firms. Academy of Management Journal, 32(2):
310-332.
Baysinger, B., & Hoskisson, R. E. 1990. The composition of boards of
directors and strategic control: Effects on corporate strategy. Academy of
Management Review, 15(1): 72-87.
Baysinger, B. D., Kosnik, R. D., & Turk, T. A. 1991. Effects of board and
ownership structure on corporate R&D strategy. Academy of Management
Journal, 34(1): 205-214.
Bazerman, M. H., & Schoorman, F. D. 1983. A limited rationality model of
interlocking directorates. Academy of Management Review, 8(2): 206-217.
Biais, B., & Weber, M. 2009. Hindsight bias, risk perception, and
investment performance. Management Science, 55(6): 1018-1029.
Block, Z., & MacMillan, I. C. 1993. Corporate venturing: Creating new
businesses with the firm. Boston, MA: Harvard Business School Press.

References
201
Boeker, W., & Goodstein, J. 1993. Performance and successor choice: The
moderating effects of governance and ownership. Academy of Management
Journal, 36(1): 172-186.
Bower, J. L. 1970. Managing the resource allocation process: A study of
corporate planning and investment. Revised edition 1986. Boston, MA:
Harvard Business School Press.
Bowman, E. H. 1976. Strategy and the weather. Sloan Management
Review, 17(2): 49-62.
Bowman, E. H. 1984. Content analysis of annual reports for corporate
strategy and risk. Interfaces, 14(1): 61-71.
Box, G. E. P., Hunter, W. G., & Hunter, J. S. 1978. Statistic for
experimenters: An introduction to design, data analysis, and model
building. Wiley.
Boyd, B. K. 1995. CEO duality and firm performance: A contingency
model. Strategic Management Journal, 16: 301-312.
Briscoe, F., & Tsai W. 2011. Overcoming relational inertia: How
organizational members respond to acquisition events in a law firm.
Administrative Science Quarterly, 56(3): 408-440.
Bromiley, P. 1991. Testing a causal model of corporate risk taking and
performance. Academy of Management Journal, 34(1): 37-59.
Burkart, M., Gromb, D., & Panunzi, F. 1997. Large shareholders,
monitoring, and the value of the firm. Quarterly Journal of Economics,
112(3): 693-728.
Burns, N., & Kedia, S. 2006. The impact of performance-based
compensation on misreporting. Journal of Financial Economics, 79: 35-67.
Burt, R. S. 1980. Cooptive corporate actor networks: A reconsideration of
interlocking directorates involving American manufacturing.
Administrative Science Quarterly: 557- 582.
Carpenter, M. A., & Westphal, J. D. 2001. The strategic context of external
network ties: Examining the impact of director appointments on board
involvement in strategic decision making. Academy of Management
Journal, 44(4): 639-660.
Cesarini, D., Dawes, C. T., Johannesson, M., Lichtenstein, P., & Wallace,
B. 2009. Genetic variation in preferences for giving and risk taking.
Quarterly Journal of Economics, May 2009: 809-842.
Chaganti, R. S., Mahajan, V., & Sharma, S. 1985. Corporate board size,
composition and corporate failures in retailing industry. Journal of
Management Studies, 22(4): 400-417.
Chandler, A. D., Jr. 1962. Strategy and structure: Chapters in the history
of the American industrial enterprise. Cambridge, MA: MIT Press.
202
Chen, W. 2008. Determinants of firms’ backward- and forward-looking
R&D search behavior. Organization Science, 19(4): 609-622.
Chen, W., & Miller, K. D. 2007. Situational and institutional determinants
of firms’ R&D search intensity. Strategic Management Journal, 28: 369-
381.
Cheng, S. 2008. Board size and the variability of corporate performance.
Journal of Financial Economics, 87: 157-176.
Chevalier, J., & Ellison, G. 1999. Career concerns of mutual fund
managers. Quarterly Journal of Economics, 114(2): 389-432.
Christensen, C. M., & Bower, J. L. 1996. Customer power, strategic
investment, and the failure of leading firms. Strategic Management
Journal, 17(3): 197-218.
Cohen, W. M., & Levinthal, D. A. 1989. Innovation and learning: The two
faces of R&D. The Economic Journal, 99: 569-596.
Cohen, W. M., & Levinthal, D. A. 1990. Absorptive capacity: A new
perspective on learning and innovation. Administrative Science Quarterly,
35(1): 128-152.
Coles, J. L., Daniel, N. D., & Naveen, L. 2006. Managerial incentives and
risk-taking. Journal of Financial Economics 79: 431–468.
Collins J. C., & Porras, J. I. 1994. Built to last. New York: HarperBusiness.
Connelly, B. L., Tihanyi, L., Certo, S. T., & Hitt, M. A. 2010. Marching to
the beat of different drummers: The influence of institutional owners on
competitive actions. Academy of Management Journal, 53(4): 723-742.
Conyon, M. J., & Peck, S. I. 1998. Board control, remuneration
committees, and top management compensation. Academy of Management
Journal, 41(2): 146-157.
Cooper, R. G. 1990. Stage-gate systems: A new tool for managing new
products. Business Horizons, 33(3): 44-54.
Cooper, R. G., Edgett, S. J., & Kleinschmidt, E. J. 2002a. Optimizing the
stage-gate process: What best-practice companies do – I. Research
Technology Management, 45(5): 21-27.
Cooper, R. G., Edgett, S. J., & Kleinschmidt, E. J. 2002b. Optimizing the
stage-gate process: What best-practice companies do – II. Research
Technology Management, 45(6): 43-49.
Cooper, R. G., & Kleinschmidt, E. J. 1986. An investigation in to the new
product process: Steps, deficiencies, and impact. Journal of Product
Innovation Management, 3(2): 71-85.
Cross, R., & Sproull, L. 2004. More than an answer: Information
relationships for actionable knowledge. Organization Science, 15(4): 446-
462.

References
203
Cyert, R. M. & March, J. G. 1963. A behavioral theory of the firm. Revised
edition 1992. Malden, MA: Blackwell Publishers.
D’Aveni, R. A., & MacMillan, I. C. 1990. Crises and the content of
managerial communications: A study of the focus of attention of top
managers in surviving and failing firms. Administrative Science Quarterly,
35: 634-657.
Daily, C. M., & Dalton D. R. 1993. Boards of directors leadership and
structure: Control and performance implications. Entrepreneurship Theory
and Practice, Spring: 65-81.
Daily, C. M., & Dalton D. R. 1994a. Bankruptcy and corporate governance:
The impact of board composition and structure. Academy of Management
Journal, 37(6): 1603-1617.
Daily, C. M., & Dalton D. R. 1994b. Corporate governance and the
bankrupt firm: An empirical assessment. Strategic Management Journal,
15: 643-654.
Daily, C. M., & Dalton D. R. 1995. CEO and director turnover in failing
firms: An illusion of change? Strategic Management Journal, 16(5): 393-
400.
Daily, C. M., Dalton, D. R., & Rajagopalan, N. 2003. Governance through
ownership: Centuries of practice, decades of research. Academy of
Management Journal, 45(2): 151-158.
Dalton, D. R., Daily, C. M., Certo, S. T., & Roengpitya, R. 2003. Meta-
analyses of financial performance and equity: Fusion or confusion?
Academy of Management Journal, 46(1): 13-26.
Dalton, D. R., Daily, C. M., Ellstrand, A. E., & Johnson, J. L. 1998. Meta-
analytic reviews of board composition, leadership structure, and financial
performance. Strategic Management Journal, 19: 269-290.
Dalton, D. R., Daily, C. M., Johnson, J. L., & Ellstrand, A. E. 1999.
Number of directors and financial performance: A meta-analysis. Academy
of Management Journal, 42(6): 674-686.
Dalton, D. R., Hitt, M. A., Certo, S. T., & Dalton, C. M. 2007. The
fundamental agency problem and its mitigation: Independence, equity, and
the market for corporate control. Academy of Management Annals, 1-64.
Davis, G. F. 1991. Agents without principles? The spread of the poison pill
through the intercorporate network. Administrative Science Quarterly,
36(4): 583-613.
Davis, G. F. 2005.New directors in corporate governance. Annual Review
of Sociology, 31: 143-162.
Denis, D. J., & Sarin, A. 1999. Ownership and board structures in publicly
traded corporations. Journal of Financial Economics, 52: 187-223.

204
Deutsch, Y., Keil, T., & Laamanen, T. 2007. Decision making in
acquisitions: The effect of outside directors’ compensation on acquisition
patterns. Journal of Management, 33(1): 30-56.
Deutsch, Y., Keil, T., & Laamanen, T. 2010. A dual agency view of board
compensation: The join effects of outside director and CEO stock options
on firm risk. Strategic Management Journal, 32: 212-227.
Dewett, T. 2007. Linking intrinsic motivation, risk taking, and employee
creativity in an R&D environment. R&D Management, 37(3): 197-208.
Dosi, G. 1988. Sources, procedures, and microeconomic effects of
innovation. Journal of Economic Literature, 26(3): 1120-1171.
Drazin, R., & Rao, H. 2002. Harnessing managerial knowledge to
implement product-line extensions: How do mutual fund families allocate
portfolio managers to old and new funds? Academy of Management
Journal, 45(3): 609-619.
Duchin, R., Matsusaka, J. G., & Ozbas, O. 2010. When are outside
directors effective? Journal of Financial Economics, 96: 195-214.
Eisenberg, T., Sundgren, S., & Wells, M. T. 1998. Larger board size and
decreasing firm value in small firms. Journal of Financial Economics, 48:
35-54.
Eisenberger, R., & Aselage, J. 2008. Incremental effects of reward on
experienced performance pressure: Positive outcomes for intrinsic interest
and creativity. Journal of Organizational Behavior, 30(1): 95-117.
Eisenberger, R., Jones, J. R., Stinglhamber, F., Shanock, L., & Randall, A.
T. 2005. Flow experiences at work: for high need achievers alone? Journal
of Organizational Behavior, 26: 755-775.
Eisenhardt, K. M. 1985. Control: Organizations and economic approaches.
Management Science, 31(2): 134-149.
Eisenhardt, K. M. 1989. Agency theory: An assessment and review.
Academy of Management Review, 14(1): 57-74.
Fama, E. F. 1980. Agency problems and the theory of the firm. Journal of
Political Economy, 88(2): 288-307.
Fama, E. F., & Jensen, M. C. 1983a. Separation of ownership and control.
Journal of Law and Economics, 26: 301-325.
Fama, E. F., & Jensen, M. C. 1983b. Agency problems and residual claims.
Journal of Law and Economics, 26: 327-349.
Fang, C., Lee, J., & Schilling, M. A. 2010. Balancing exploration and
exploitation through structural design: The isolation of subgroups and
organizational learning. Organization Science, 21(3): 625-642.
Faraway, J. J. 2002. Practical regression and ANOVA using R.
http://cran.r-project.org/doc/contrib/Faraway-PRA.pdf

References
205
Fleming, L., Mingo, S., & Chen, D. 2007. Collaborative brokerage,
generative creativity, and creative success. Administrative Science
Quarterly, 52: 443-475.
Forbes, D. P., & Milliken, F. J. 1999. Cognition and corporate governance:
Understanding boards of directors as strategic decision-making groups.
Academy of Management Review, 24(3): 489-505.
Foss, N. 2003. Selective intervention and internal hybrids: Interpreting
and learning from the rise and decline of the Oticon spaghetti organization.
Organization Science, 14(3): 331-349.
Gargiulo, M., & Benassi, M. 2000. Trapped in your own net? Network
cohesion, structural holes, and the adaptation of social capital.
Organization Science, 11(2): 183-196.
Gargiulo, M.,Ertug, G., & Galunic, C. 2009. The two faces of control:
Network closure and individual performance among knowledge workers.
Administrative Science Quarterly, 54: 299-333.
Geletkanycz, M. A., & Hambrick, D. C. 1997. The external ties of top
executives: Implications for strategic choice and performance.
Administrative Science Quarterly, 42(4): 654-681.
Gibbons, R., & Murphy, K. J. 1992. Optimal incentive contracts in the
presence of career concerns: Theory and evidence. Journal of Political
Economy, 100(3): 468-505.
Gilson, S. C. 1990. Bankruptcy, boards, banks, and blockholders: Evidence
on changes in corporate ownership and control when firms default. Journal
of Financial Economics, 27: 355-387.
Gilson, S. C., & Vetsuypens, M. R. 1993. CEO compensation in financially
distressed firms: An empirical analysis. Journal of Finance, 48(2): 425-458.
Glimcher, P. W., Kable, J., & Louei, K. 2007. Neuroeconomic studies of
impulsivity: Now or just as soon as possible? American Economic Review,
97(2): 142-147.
Glimcher, P. W., & Rustichini, A. 2004. Neuroeconomics: The consilience
of brain and decision. Science, 306: 447- 452.
Golden, B. R., & Zajac, E. J. 2001. When will boards influence strategy?
Inclination x power = strategic change. Strategic Management Journal,
22(12): 1087-1111.
Gompers, P., Kovner, A., Lerner, J., & Scharfstein, D. 2010. Performance
persistence in entrepreneurship. Journal of Financial Economics, 96: 18-
32.
Goodstein, J., Gautam, K., & Boeker, W. 1994. The effects of board size
and diversity on strategic change. Strategic Management Journal, 15: 241-
250.

206
Goold, M., & Quinn, J. J. 1990. The paradox of strategic controls.
Strategic Management Journal, 11: 43-57.
Grabowski, H. G. 1968. The determinants of industrial research and
development: A study of the chemical, drug, and petroleum industries.
Journal of Political Economy, 76(2): 292-306.
Grabowski, H. G., & Baxter, N. D. 1973. Rivalry in industrial research and
development: An empirical study. Journal of Industrial Economics, 21(3):
209-235.
Grabowski, H., & Vernon, J. 2000. The determinants of pharmaceutical
research and development expenditures. Journal of Evolutionary
Economics, 10(1/2): 201-215.
Green, S. G., Welsh, M. A., & Dehler, G. E. 2003. Advocacy, performance,
and threshold influences on decisions to terminate new product
development. Academy of Management Journal, 46(4): 419-434.
Grégoire, D. A., Barr, P. S., & Shephard, D. A. 2010. Cognitive processes of
opportunity recognition: The role of structural alignment. Organization
Science, 21(2): 413-431.
Greve, H. R. 1998. Managerial cognition and the mimetic adoption of
market positions: What you see is what you do. Strategic Management
Journal, 19(10): 967-988.
Greve, H. R. 2003. A behavioral theory of R&D expenditures and
innovations: Evidence from shipbuilding. Academy of Management
Journal, 46(6): 685-702.
Greve, H. R., & Taylor, A. 2000. Innovations as catalysts for
organizational change: Shifts in organizational cognition and search.
Administrative Science Quarterly, 45(1): 54-80.
Grinyer, P., & McKiernan, P. 1990. Generating major change in stagnating
companies. Strategic Management Journal, 11(4): 131-146.
Gulati, R., & Westphal, J. D. 1999. Cooperative or controlling? The effects
of CEO-board relations and the content of interlocks on the formation of
joint ventures. Administrative Science Quarterly, 44: 473-506.
Gupta, A. K. 1987. SBU strategies, corporate-SBU relations, and SBU
effectiveness in strategy implementation. Academy of Management
Journal, 30(3): 477-500.
Gupta, A. K., Smith, K. G., & Shalley, C. E. 2006. The interplay between
exploration and exploitation. Academy of Management Journal, 49(4):
693-706.
Haas, M. R., & Hansen, M. T. 2007. Different knowledge, different
benefits: Toward a productivity perspective on knowledge sharing in
organizations. Strategic Management Journal, 28: 1133-1153.

References
207
Haleblian, J., & Rajagopalan, N. 2006. A cognitive model of CEO
dismissal: Understanding the influence of board perceptions, attributions
and efficacy beliefs. Journal of Management Studies, 43(5): 1009-1026.
Hambrick, D. C., & D’Aveni, R. A. 1988. Large corporate failures as
downward spirals. Administrative Science Quarterly, 33: 1-23.
Hambrick, D. C., & Jackson, E. M. 2000. Outside directors with a stake:
The linchpin in improving governance. California Management Review,
42(2): 108-127.
Hambrick, D. C., MacMillan, I. C., & Barbosa, R. R. 1983. Business unit
strategy and changes in the product R&D budget. Management Science,
29(7): 757-769.
Hambrick, D. C., & Mason, P. A. 1984. Upper echelons: The organization
as a reflection of its top managers. Academy of Management Review, 9(2):
193-206.
Hamel, G., & Prahalad, C. K. 1994. Competing for the future. Harvard
Business School Press.
Hansen, G. S., & Hill, C. W. L. 1991. Are institutional investors myopic? A
time-series study of four technology-driven industries. Strategic
Management Journal, 12(1): 1-16.
Hansen, M. T. 1999. The search-transfer problem: The role of weak ties in
sharing knowledge across organization subunits. Administrative Science
Quarterly, 44(1): 82-111.
Hansen, M. T., Mors, M. L., & Lovas, B. 2005. Knowledge sharing in
organizations: Multiple networks, multiple phases. Academy of
Management Journal, 48(5): 776-793.
Harris, J., & Bromiley, P. 2007. Incentives to cheat: The influence of
executive compensation and firm performance on financial
misrepresentation. Organization Science, 18(3): 350-367.
Harris, M., & Raviv, A. 1978. Some results on incentive contracts with
applications to education and employment, health insurance, and law
enforcement. American Economic Review, 68(1): 20-30.
Harris, M., & Raviv, A. 1979. Optimal incentive contracts with imperfect
information. Journal of Economic Theory, 20: 231-259.
Haunschild, P. R. 1993. Interorganizational imitation: The impact of
interlocks on corporate acquisition activity. Administrative Science
Quarterly, 38(4): 564-592.
Haunschild, P. R., & Beckman, C. M. 1998. When do interlocks matter?:
Alternative sources of information and interlock influence. Administrative
Science Quarterly, 43: 815-844.
Hayes, R. H., & Abernathy, W. J. 1980. Managing our way to economic
decline. Harvard Business Review, July-August: 67-77.

208
Haynes, K. T., & Hillman, A. 2010. The effect of board capital and CEO
power on strategic change. Strategic Management Journal, 31: 1145-1163.
Helfat, C. E. 1994a. Firm-specificity in corporate applied R&D.
Organization Science, 5(2): 173-184.
Helfat, C. E. 1994b. Evolutionary trajectories in petroleum firm R&D.
Management Science, 40(12): 1720-1747.
Henderson, R., & Cockburn, I. 1994. Measuring competence? Exploring
firm effects in pharmaceutical research. Strategic Management Journal, 15,
winter special issue: 63-84.
Hendry, J. 2002. The principal’s other problems: Honest incompetence
and the specification of objectives. Academy of Management Review, 27(1):
98-113.
Hermalin, B. E., & Weisbach, M. S. 1991. The effects of board composition
and direct incentives on firm performance. Financial Management: 101-112.
Hermalin, B. E., & Weisbach, M. S. 2003. Board of directors as an
endogenously determined institution: A survey of the economic literature.
Economic Policy Review: 7-26.
Herriott, S. R., Levinthal, D., & March, J. G. 1985. Learning from
experience in organizations. American Economic Review, 75(2): 298-302.
Hill, C. W. L. 1985. Oliver Williamson and the M-firm firm: A critical
review. Journal of Economic Issues, 19(3): 731-751.
Hill, C. W. L., & Hoskisson, R. E. 1987. Strategy and structure in the
multiproduct firm. Academy of Management Review, 12(2): 331-341.
Hill, C. W. L., & Snell, S. A. 1988. External control, corporate strategy, and
firm performance in research-intensive industries. Strategic Management
Journal, 9(6): 577-590.
Hillman, A. J., Cannella, A. A. Jr., & Paetzold, R. L. 2000. The resource
dependence role of corporate directors: Strategic adaptation of board
composition in response to environmental change. Journal of Management
Studies, 37(2): 235-255.
Hillman, A. J., & Dalziel, T. 2003. Boards of directors and firm
performance: Integrating agency and resource dependency perspectives.
Academy of Management Review, 28(3): 383-396.
Himmelberg, C. P., Hubbard, R. G., & Palia, D. 1999. Understanding the
determinants of managerial ownership and the link between ownership and
performance. Journal of Financial Economics, 53: 353-384.
Hitt, M. A., Hoskisson, R. E., & Ireland, R. D. 1990. Mergers and
acquisitions and managerial commitment to innovation in M-form firms.
Strategic Management Journal, 11(special issue): 29-47.
References
209
Hitt, M. A., Hoskisson, R. E., Ireland, R. D., & Harrison, J. S. 1991. Effects
of acquisitions on R&D inputs and outputs. Academy of Management
Journal, 34(3): 693-706.
Hitt, M. A., Hoskisson, R. E., Johnson, R. A., & Moesel, D. D. 1996. The
market for corporate control and firm innovation. Academy of Management
Journal, 39(5): 1084-1119.
Holderness, C. G., Kroszner, & Sheehan, D. P. 1999. Were the good old
days that good? Changes in managerial stock ownership since the Great
Depression. Journal of Finance, 54(2): 435-469.
Holmström, B. 1979. Moral hazard and observability. Bell Journal of
Economics, 10(1): 74-91.
Holmström, B. 1999. Managerial incentive problems: A dynamic
perspective. Review of Economic Studies, 66: 169-182.
Hormozi, A. M., Sutton, G. S., McMinn, R. D., & Lucio, W. 2002. Business
plans for new or small business: Paving the path to success. Management
Decision, 40(7/8): 755- 763.
Hoskisson, R. E., & Hitt, M. A. 1988. Strategic control systems and
relative R&D investment in large multiproduct firms. Strategic
Management Journal, 9(6): 605-621.
Hoskisson, R. E., Hitt, M. A., & Hill, C. W. L. 1991. Managerial risk taking
in diversified firms: An evolutionary perspective. Organization Science,
2(3): 296-314.
Hoskisson, R. E., Hitt, M. A., & Hill, C. W. L. 1993. Managerial incentives
and investment in R&D in large multiproduct firms. Organization Science,
4(2): 325-341.
Hoskisson, R. E., Hitt, M. A., Johnson, R. A., & Grossman, W. 2002.
Conflicting voices: The effects of institutional ownership heterogeneity and
internal governance on corporate innovation strategies. Academy of
Management Journal, 45, 4: 697-716.
Hoskisson, R. E., Johnson, R. A., & Moesel, D. D. 1994. Corporate
divestiture intensity in restructuring firms: Effects of governance, strategy,
and performance. Academy of Management Journal, 37(5): 1207-1251.
Huber, G. P. 1991. Organizational learning: The contributing processes
and the literatures. Organization Science, 2(1): 88-115.
Hundley, G., Jacobson, C. K., & Park, S. H. 1996. Effects of profitability
and liquidity on R&D intensity: Japanese and U.S. companies compared.
Academy of Management Journal, 39(6): 1659-1674.
Ibarra, H. 1993. Network centrality, power, and innovation involvement:
Determinants of technical and administrative roles. Academy of
Management Journal, 36(3): 471-501.

210
Jaeger, A. M., & Baliga, B. R. 1985. Control systems and strategic
adaptation: Lessons from the Japanese experience. Strategic Management
Journal, 6(2): 115-134.
Jensen, M. C. 1993. The modern industrial revolution, exit, and the failure
of internal control systems. Journal of Finance, 48(3): 831-880.
Jensen, M. C., & Meckling, W. H. 1976. Theory of the firm: Managerial
behavior, agency costs and ownership structure. Journal of Financial
Economics, 3: 305-360.
Jensen, M. C., & Murphy, K. J. 1990. Performance pay and top-
management incentives. Journal of Political Economy, 98(2): 225-264.
Johnson, R. A., Hoskisson, R. E., & Hitt, M. A. 1993. Board of director
involvement in restructuring: The effects of board versus managerial
controls and characteristics. Strategic Management Journal, 14: 33-50.
Judge, W. Q. Jr., & Zeithaml, C. P. 1992. Institutional and strategic choice
perspectives on board involvement in the strategic decision process.
Academy of Management Journal, 35(4): 766-794.
Kahneman, D., & Tversky, A. 1979. Prospect theory: An analysis of
decision under risk. Econometrica, 47(2): 263-292.
Katz, R. 1982. The effects of group longevity on project communication
and performance. Administrative Science Quarterly, 27(1): 81-104.
Katz, R. 2005. Motivating technical professionals today. Research
Technology Management, 48(6): 19-27.
Keller, R. T. 2001. Cross-functional project groups in research and
product development: Diversity, communications, job stress, and
outcomes. Academy of Management Journal, 44(3): 547-555.
Kesner, I. F. 1988. Directors’ characteristics and committee membership:
An investigation of type, occupation, tenure, and gender. Academy of
Management Journal, 31(1): 66-84.
Kim, H., Kim, H., & Lee, P. M. 2008. Ownership structure and the
relationship between financial slack and R&D investments: Evidence from
Korean firms. Organization Science, 19(3): 404-418.
Kim, B., & Oh, H. 2002. Economic compensation compositions preferred
by R&D personnel of different R&D types and intrinsic values. R&D
Management, 32(1): 47-59.
Kirsch, L. J. 1996. The management of complex tasks in organizations:
Controlling the systems department process. Organization Science: 7(1): 1-
21.
Kirsch, D., Goldfarb, B., & Gera, A. 2009. Form or substance: The role of
business plans in venture capital decision making. Strategic Management
Journal, 30: 487-515.

References
211
Knott, A. M., & Posen, H. E. 2009. Firm R&D behavior and evolving
technology in established industries. Organization Science, 20(2): 352-367.
Kochhar, R., & David, P. 1996. Institutional investors and firm
innovation: A test of competing hypotheses. Strategic Management Journal,
17(1): 73-84.
Kor, Y. Y. 2006. Direct and interaction effects of top management team
and board compositions on R&D investment strategy. Strategic
Management Journal, 27: 1081-1099.
Kor, Y. Y., & Misangyi, V. F. 2008. Outside directors’ industry-specific
experience and firms’ liability of newness. Strategic Management Journal,
29(12): 1345-1355.
Kosnik, R. D. 1987. Greenmail: A study of board perforamnce in corporate
governance. Administrative Science Quarterly, 32(2): 163-185.
Kosnik, R. D. 1990. Effects of board demography and directors’ incentives
on corporate greenmail decisions. Academy of Management Journal, 33(1):
129-150.
Kroll, M., Walters, B. A., & Wright, P. 2008. Board vigilance, director
experience, and corporate outcomes. Strategic Management Journal, 29:
363-382.
Lant, T. K., Milliken, F. J., & Batra, B. 1992. The role of managerial
learning and interpretation in strategic persistence and reorientation: An
empirical exploration. Strategic Management Journal, 13: 585-608.
Laverty, K. J. 1996. Economic “short-termism”: The debate, the
unresolved issues, and the implications for management practice and
research. Academy of Management Review, 21(3): 825-860.
Lee, P. M., & O’Neill, H. M. 2003. Ownership structures and R&D
investments of U.S. and Japanese firms: Agency and stewardship
perspectives. Academy of Management Journal, 46(2): 212-225.
Leonard-Barton, D. 1992. Core capabilities and core rigidities: A paradox
in managing new product development. Strategic Management Journal, 13,
summer special issue: 111-125.
Levinthal, D. A., & March, J. G. 1993. The myopia of learning. Strategic
management journal, 14, winter special issue: 95-112.
Levitt, B., & March, J. G. 1988. Organizational learning. Annual Review of
Sociology, 14: 319-340.
Lewis, M. W., Welsh, M. A., Dehler, G. E., & Green, S. G. 2002. Product
development tensions: Exploring contracting styles of project management.
Academy of Management Journal, 45(3): 546-564.
Lundblad, C. 2007. The risk return tradeoff in the long run. Journal of
Financial Economics, 85: 123-150.

212
MacMillan, I. C., & Narasimha, P. N. S. 1987. Characteristics
distinguishing funded from unfunded business plans evaluated by venture
capitalists. Strategic Management Journal, 8(6): 579-585.
Mahlich, J. C., & Roediger-Schluga, T. 2006. The determinants of
pharmaceutical R&D expenditures: Evidence from Japan. Review of
Industrial Organization, 28: 145-164.
Mallette, P., & Fowler, K. L. 1992. Effects of board composition and stock
ownership on the adoption of “poison pills”. Academy of Management
Journal, 35(5): 1010-1035.
Mansfield, E. 1964. Industrial research and development expenditures:
Determinants, prospects, and relation to size of firm and inventive output.
Journal of Political Economy, 72(4): 319-340.
March, J. G. 1991. Exploration and exploitation in organizational learning.
Organization Science, 2(1): 71-87.
Marginson, D., & McAulay, L. 2008. Exploring the debate on short-
termism: A theoretical and empirical analysis. Strategic Management
Journal, 29: 273-292.
Martens, M. L., Jennings, J. E., & Jennings, P. D. 2007. Do the stories
they tell get them the money they need? The role of entrepreneurial
narratives in resource acquisition. Academy of Management Journal, 50(5):
1107-1132.
Maslow, A. H. 1968. Toward a Psychology of Being. 3rd ed. 1999. New
York: Wiley.
Masulis, R. W., Wang, C., & Xie, F. 2009. Agency problems at dual-class
companies. Journal of Finance, 64(4): 1697-1727.
Matejka, M., Merchant, K. A., & van der Stede, W. A. 2009. Employment
horizon and the choice of performance measures: Empirical evidence from
annual bonus plans of loss-making entities. Management Science, 55(6):
890-905.
McConnell, J. J., & Servaes, H. 1990. Additional evidence on equity
ownership and corporate value. Journal of Financial Economics, 27: 595-
612.
McEvily, B., & Zaheer, A. 1999. Bridging ties: A source of firm
heterogeneity in competitive capabilities. Strategic Management Journal,
20(12): 1133-1156.
McFadyen, M. A., & Cannella, A. A., Jr. 2004. Social capital and
knowledge creation: Diminishing returns of the number and strength of
exchange relationships. Academy of Management Journal, 47(5): 735-746.
McGrath, R. G., & MacMillan, I. C. 1995. Discovery-driven planning.
Harvard Business Review, July-August: 44-54.

References
213
McGrath, R. G., & MacMillan, I. C. 2000a. Assessing technology projects
using real options reasoning. Research Technology Management, 43(4): 35-
49.
McGrath, R. G., & MacMillan, I. C. 2000b. The entrepreneurial mindset.
Harvard Business School Press.
McNeil, C., Nichaus, G., & Powers, E. 2004. Management turnover in
subsidiaries of conglomerates versus stand-alone firms. Journal of
Financial Economics, 72: 63-96.
Mehra, A., Dixon, A. L., Brass, D. J., & Robertson, B. 2006. The social
network ties of group leaders: Implications for group performance and
leader reputation. Orgnization Science, 17(1): 64-79.
Miller, K. D. 2002. Knowledge inventories and managerial myopia.
Strategic Management Journal, 23: 689-706.
Miller, K. D., & Chen, W. 2004. Variable organizational risk preferences:
Tests of the March-Shapira model. Academy of Management Journal, 47(1):
105-115.
Mintzberg, H. 1994. The rise and fall of strategic planning. Prentice-Hall.
Mintzberg, H., Ahlstrand, B., & Lampel, J. 1998. Strategy safari. The Free
Press.
Mishina, Y., Pollock, T. G., & Porac, J. F. 2004. Are more resources always
better for growth? Resource stickiness in market and product expansion.
Strategic Management Journal, 25(12): 1179-1197.
Mizurchi, M. S. 1983. Who controls whom? An examination of the relation
between management and boards of directors in large American
corporations. Academy of Management Review, 8(3): 426-435.
Mizruchi, M. S. 1996. What do interlocks do? An analysis, critique, and
assessment of research on interlocking directorates. Annual Review of
Sociology, 22: 271-298.
Mizruchi, M. S., & Brewster Stearns, L. 2001. Getting deals done: The use
of social networks in bank decision-making. American Sociological Review,
66(5): 647-671.
Mone, M. A., McKinley, W., & Barker, V. L., III. 1998. Organizational
decline and innovation: A contingency framework. Academy of
Management Review, 23(1): 115-132.
Montague, P. R., & Berns, G. S. 2002. Neural economics and the
biological substrates of valuation. Neuron, 36: 265-284.
Montague, P.R., King-Casas, B., & Cohen, J. D. 2006. Imaging valuation
models in human choice. Annual Review of Neuroscience, 29: 417-448.
Morck, R., Shleifer, A., & Vishny, R. W. 1988. Management ownership and
market valuation: An empirical analysis. Journal of Financial Economics,
20: 293-315.
214
Morck, R., Shleifer, A., & Vishny, R. W. 1989. Alternative mechanisms for
corporate control. American Economic Review, 79(4): 842-852.
Morrison, E. W. 2002. Newcomers’ relationships: The role of social
network ties during socialization. Academy of Management Journal, 45(6):
1149-1160.
Morrow, J. L., Jr., Sirmon, D. G., Hitt, M. A., & Holcomb, T. R. 2007.
Creating value in the face of declining performance: Firm strategies and
organizational recovery. Strategic Management Journal, 28: 271-283.
Mors, M. L. 2010. Innovation in a global consulting firm: When the
problem is too much diversity. Strategic Management Journal, 31: 841-872.
Mosakowski, E. 1997. Strategy making under causal ambiguity:
Conceptual issues and empirical evidence. Organization Science, 8(4): 414-
442.
Narayanan, M. P. 1985. Managerial incentives for short-term results.
Journal of Finance, 40(5): 1469-1484.
Nebus, J. 2006. Building collegial information networks: A theory of
advice network generation. Academy of Management Review, 31(3): 615-
637.
Nerkar, A., & Paruchuri, S. 2005. Evolution of R&D capabilities: The role
of knowledge networks within a firm. Management Science, 51(5): 771-785.
Newbert, S. L. 2008. Value, rareness, competitive advantage, and
performance: A conceptual-level empirical investigation of the resource-
based view of the firm. Strategic Management Journal, 29: 745-768.
Nohria, N., & Gulati, R. 1996. Is slack good or bad for innovation?
Academy of Management Journal, 39(5): 1245-1264.
Nyberg, A. J., Fulmer, I. S., Gerhart, B., & Carpenter, M. A. 2010. Agency
theory revisited: CEO return and shareholder interest alignment. Academy
of Management Journal, 53(5): 1029-1049.
O’Brian, R. M. 2007. A caution regarding rules of thumb for variance
inflation factors. Quality & Quantity, 41: 673-690.
Obstfeld, D. 2005. Social networks, the tertius iungens orientation, and
involvement in innovation. Administrative Science Quarterly, 50: 100-130.
Ocasio, W. 1997. Towards an attention-based view of the firm. Strategic
Management Journal, 18, summer special issue: 187-206.
Oldham, G. R., & Cummings, A. 1996. Employee creativity and contextual
factors at work. Academy of Management Journal, 39(3): 607-634.
Osterloh, M., & Frey, B. S. 2000. Motivation, knowledge transfer, and
organizational forms. Organization Science, 11(5): 538-550.
Ouchi, W. G. 1977. The relationship between organizational structure and
organizational control. Administrative Science Quarterly, 22(4): 95-113.
References
215
Ouchi, W. G. 1979. A conceptual framework for the design of
organizational control mechanisms. Management Science, 25(9): 833-848.
Ouchi, W. G. 1980. Markets, bureaucracies, and clans. Administrative
Science Quarterly: 129-141.
Palmer, T. B., & Wiseman, R. M. 1999. Decoupling risk taking from
income stream uncertainty: A holistic model of risk. Strategic Management
Journal, 20: 1037-1062.
Palomeras, N., & Melero, E. 2010. Markets for inventors: Learning-by-
hiring as a driver of mobility. Management Science, 56(5): 881-895.
Pearce, J. A. III, & Zahra, S. A. 1992. Board composition from a strategic
contingency perspective. Journal of Management Studies, 29(4): 411-438.
Pennings, J. M. E., & Smidts, A. 2003. The shape of utility functions and
organizational behavior. Management Science, 49(9): 1251-1263.
Perry-Smith, J. E. 2006. Social yet creative: The role of social
relationships in facilitating individual creativity. Academy of Management
Journal, 49(1): 85-101.
Petersen, M. A. 2009. Estimating standard errors in finance panel data
sets: Comparing approaches. Review of Financial Studies, 22(1): 435-480.
Pettigrew, A. M. 1992. The character and significance of strategy process
research. Strategic Management Journal, Winter92 Special Issue: 5-16.
Pfarrer, M. D., Pollock, T. G., & Rindova, V. P. 2010. A tale of two assets:
The effects of firm reputation and celebrity on earnings surprises and
investors’ reactions. Academy of Management Journal, 53(5) 1131-1152.
Pfeffer, J. 1972. Size and composition of corporate boards of directors:
The organization and its environment. Administrative Science Quarterly:
218-228.
Pfeffer, J., & Salancik, G. R. 1978. The external control of organizations.
New York: Harper & Row.
Porter, M. E. 1980. Competitive strategy: Techniques for analyzing
industries and competitors. New York: The Free Press.
Porter, M. E. 1992. Capital disadvantage: America’s failing capital
investment system. Harvard Business Review, September-October: 65-82.
Pratt,J. W. 1964. Risk aversion in the small and in the large.
Econometrica, 32(1/2): 122-136.
Prelec, D., & Loewenstein, G. 1991. Decision making over time and under
uncertainty: A common approach. Management Science, 37(7): 770-786.
Rayo, L, & Becker, G. S. 2007. Evolutionary efficiency and happiness.
Journal of Political Economy, 115(2): 302-337.
Reagans, R., & McEvily, B. 2003. Network structure and knowledge
transfer: The effects of cohesion and range. Administrative Science
Quarterly, 48: 240-267.

216
Reagans, R., & Zuckerman, E. W. 2001. Networks, diversity, and
productivity: The social capital of corporate R&D teams. Organization
Science, 12(4): 502-517.
Reagans, R., Argote, L., & Brooks, D. 2005. Individual experience and
experience working together: Predicting learning rates from knowing who
knows what and knowing how to work together. Management Science,
51(6): 869-881.
Rechner, P. L., & Dalton, D. R. 1991. CEO duality and organizational
performance: A longitudinal analysis. Strategic Management Journal, 12:
155-160.
Roberts, E. B. 1991. High stakes for high-tech entrepreneurs:
Understanding venture capital decision making. Sloan Management
Review, 32(2): 9-20.
Rodan, S., & Galunic, C. 2004. More than network structure: How
knowledge heterogeneity influences managerial performance and
innovativeness. Strategic Management Journal, 25: 541-562.
Ross, S. A. 1973. The economic theory of agency: The principal’s problem.
American Economic Review, 63(2): 134-139.
Ruefli, T., & Sarrazin, J. 1981. Strategic control of corporate development
under ambiguous circumstances. Management Science, 27(10): 1158-1170.
Rumelt, R. P. 1974. Strategy, structure, and economic performance.
Revised edition 1986. Boston, MA: Harvard Business School Press.
Ryan, H. E. Jr., & Wiggins, R. A. III. 2004. Who is in whose pocket?
Director compensation, board independence, and barriers to effective
monitoring. Journal of Financial Economics, 73: 497-524.
Sanders, W. G., & Hambrick, D. C. 2007. Swinging for the fences: The
effects of CEO stock options on company risk taking and performance.
Academy of Management Journal, 50(5): 1055-1078.
Sauerman, H., & Cohen, W. M. 2010. What makes them tick? Employee
motives and firm innovation. Management Science, 56(12): 2134-2153.
Schreyögg, G., & Steinmann, H. 1987. Strategic control: A new
perspective. Academy of Management Review, 12(1): 91-103.
Schumpeter, J. A. 1934. The theory of economic development: An inquiry
into profits, capital, credit, interest, and the business cycle. Reprinted in
1978. New York: Oxford University Press.
Schwartz, K. B., & Menon, K. 1985. Executive succession in failing firms.
Academy of Management Journal, 28(3): 680-686.
Senge, P. M. 1990. The fifth discipline: The art and practice of the learning
organization. New York: Doubleday.
Shane, S. 2000. Prior knowledge and the discovery of entrepreneurial
opportunities. Organization Science, 11(4): 448-469.

References
217
Shen, W. 2003. The dynamics of the CEO-board relationship: An
evolutionary perspective. Academy of Management Review, 28(3): 466-
476.
Shleifer, A., & Vishny, R. W. 1997. A survey of corporate governance.
Journal of Finance, 52(2): 737-783.
Siggelkow, N. 2007. Persuasion with case studies. Academy of
Management Journal, 50(1): 20-24.
Simon, H. A. 1947. Administrative behavior: A study of decision-making
processes in administrative organizations. Fourth edition 1997. New York:
The Free Press.
Singh, H., & Harianto, F. 1989. Management-board relationships,
takeover risk, and the adoption of golden parachutes. Academy of
Management Journal, 32(1): 7-24.
Singh, J. V. 1986. Performance, slack, and risk taking in organizational
decision making. Academy of Management Journal, 29(3): 562-585.
Sitkin, S. B., & Pablo, A. L. 1992. Reconceptualizing the determinants of
risk behavior. Academy of Management Review, 17(1): 9-38.
Smith, K, Dickhaut, J, McCabe, K., & Pardo, J. V. 2002. Neuronal
substrates for choice under ambiguity, risk, gains, and losses. Management
Science, 48(6): 711-718.
Smith, K.G., Collins, C. J., & Clark, K. D. 2005. Existing knowledge,
knowledge creation capability, and the rate of new product introduction in
high-technology firms. Academy of Management Journal, 48(2): 346-357.
Snell, S. A. 1992. Control theory in strategic human resource
management: The mediating effect of administrative information. Academy
of Management Journal, 35(2): 292-327.
Soda, G., Usai, A., & Zaheer, A. 2004. Network memory: The influence of
past and current networks on performance. Academy of Management
Journal, 47(6): 893-906.
Souder, D., & Shaver, J. M. 2010. Constraints and incentives for making
long horizon corporate investments. Strategic Management Journal, 31:
1316-1336.
Sparrowe, R. T., Liden, R. C., Wayne, S. J., & Kraimer, M. L. 2001. Social
networks and the performance of individuals and groups. Academy of
Management Journal, 44(2): 316-325
Staw, B. M., McKechnie, P. I., & Puffer, S. M. 1983. The justification of
organizational performance. Administrative Science Quarterly, 28: 582-
600.
Staw, B. M., Sanderlands, L. E., & Dutton, J. E. 1981. Threat rigidity
effects in organizational behavior: A multilevel analysis. Administrative
Science Quarterly, 26(4): 501-524.

218
Stein, J. C. 1989. Efficient capital markets, inefficient firms: A model of
myopic corporate behavior. Quarterly Journal of Economics, 104(4): 655-
669.
Stiles, P. 2001. The impact of the board on strategy: An empirical
examination. Journal of Management Studies, 38(5): 627-650.
Sundaramurthy, C. 1996. Corporate governance within the context of
antitakeover provisions. Strategic Management Journal, 17: 377-394.
Sutton, R. I., & Hargadon, A. 1996. Brainstorming groups in context:
Effectiveness in a product design firm. Administrative Science Quarterly,
41(4): 685-718.
Tashakori, A., & Boulton, W. 1983. A look at the board’s role in planning.
Journal of Business Strategy, 3(3): 64-70.
Thompson, J. D. 1967. Organizations in Action. New York: McGraw-Hill.
Tierney, P., Farmer, S. M., & Graen, G. B. 1999. An examination of
leadership and employee creativity: The relevance of traits and
relationships. Personnel Psychology, 52: 591-620.
Tosi, H. L., Weyner, S., Katz, J. P., & Gomez-Meija, L. R. 2000. How
much does performance matter? A meta-analysis of CEO pay studies.
Journal of Management, 26(2): 301-339.
Tsai, W, & Ghoshal, S. 1998. Social capital and value creation: The role of
intrafirm networks. Academy of Management Journal, 41(4): 464-476.
Tuggle, C. S., Schnatterly, K., & Johnson, R. A. 2010a. Attention patterns
in the boardroom: How board composition and processes affect discussion
of entrepreneurial issues. Academy of Management Journal, 53(3): 550-
571.
Tuggle, C. S., Sirmon, D. G., Reutzel, C. R., & Bierman, L. 2010b.
Commading board of director attention: Investigating how organizational
performance and CEO duality affect board members’ attention to
monitoring. Strategic Management Journal, 31: 946-968.
Tushman, M. L. 1977. Special boundary roles in the innovation process.
Administrative Science Quarterly, 22(4): 587-605.
Tushman, M. L. 1979. External communications and project performance:
An investigation into the role of gatekeepers. Management Science, 26(11):
1071-1085.
Tushman, M. L., & Andeson, P. 1986. Technological discontinuities and
organizational environments. Administrative Science Quarterly, 31: 439-
465.
Uotila, J., Maula, M., Keil, T., & Zahra, S. A. 2009. Exploration,
exploitation, and financial performance: Analysis of S&P 500 corporations.
Strategic Management Journal, 30: 221-231.

References
219
Utterback, J. M. 1994. Mastering the dynamics of innovation. Boston:
MA: Harvard Business School Press.
Vissa, B., & Chacar, A. S. 2009. Leveraging ties: The contingent value of
entrepreneurial teams’ external advice networks on Indian software venture
performance. Strategic Management Journal, 30: 1179-1191.
Walsh, J. P., & Seward, J. K. 1990. On the efficiency of internal and
external corporate control mechanisms. Academy of Management Review,
15(3): 421-458.
Weisbach, M. S. 1988. Outside directors and CEO turnover. Journal of
Financial Economics, 20: 431-460.
Wernerfelt, B. 1984. A resource-based view of the firm. Strategic
Management Journal, 5(2): 171-180.
Westphal, J. D. 1999. Collaboration in the boardroom: Behavioral and
performance consequences of CEO-board social ties. Academy of
Management Journal, 42(1): 7-24.
Westphal, J. D., & Graebner, M. E. 2010. A matter of appearances: How
corporate leaders manage the impressions of financial analysts about the
conduct of their boards. Academy of Management Journal, 53(1): 15-43.
Westphal, J. D., Seidel, M. L., & Stewart, K. J. 2001. Second-order
imitation: Uncovering latent effects of board network ties. Administrative
Science Quarterly, 46: 717-747.
Westphal, J. D., & Zajac, E. J. 1995. Who shall govern? CEO/board power,
demographic similarity,and new director selection. Administrative Science
Quarterly, 40: 60-83.
Williams, M. A., & Rao, R. P. 2006. CEO stock options and equity risk
incentives. Journal of Business Finance and Accounting, 33(1)&(2): 26-44.
Wiseman, R. M., & Bromiley, P. 1996. Toward a model of risk in declining
organizations: An empirical examination of risk, performance and decline.
Organization Science, 7(5): 524-543.
Wolf, M., van Doorn, G. S., Leimar, O., & Weissing, F. J. 2007. Life-
history trade-offs favour the evolution of animal personalities. Nature, 447:
581-584.
Wong, S., & Boh, W. F. 2010. Leveraging the ties of others to build a
reputation for trustworthiness among peers. Academy of Management
Journal, 53(1): 129-146.
Wright, P., Kroll, M., & Elenkov, D. 2002. Acquisition returns, increase in
firm size, and chief executive officer compensation: The moderating role of
monitoring. Academy of Management Journal, 45(3): 599-608.
Wright, P., Kroll, M., Krug, J. A., Pettus, M. 2007. Influences of top
management team incentives on firm risk taking. Strategic Management
Journal, 28: 81-89.

220
Yermack, D. 1996. Higher market valuation of companies with a small
board of directors. Journal of Financial Economics, 40: 185-211.
Yermack, D. 2004. Remuneration, retention, and reputation incentives
for outside directors. Journal of Finance: 59(5): 2281-2308.
Yu, F. 2008. Analyst coverage and earnings management. Journal of
Financial Economics, 88: 245-271.
Zahra, S. A. 1996. Governance, ownership, and corporate
entrepreneurship: The moderating impact of industry technological
opportunities. Academy of Management Journal, 39(6): 1713-1735.
Zahra, S. A., & George, G. 2002. Absorptive capacity: A review,
reconceptualization, and extension. Academy of Management Review,
27(2): 185-203.
Zahra, S. A., & Pearce, J. A., II. 1989. Boards of directors and corporate
financial performance: A review and integrative model. Journal of
Management, 15(2): 291-334.
Zajac, E. J., & Westphal, J. D. 1996. Director reputation, CEO-board
power, and the dynamics of board interlocks. Administrative Science
Quarterly, 41: 507-529.
Zenger, T. R., & Marshall, C. R. 2000. Determinants of incentive intensity
in group-based rewards. Academy of Management Journal, 43(2): 149-163.
Zhang, X., & Bartol, K. M. 2010. Linking empowering leadership and
employee creativity: The influence of psychological empowerment, intrinsic
motivation, and creative process engagement. Academy of Management
Journal, 53(1): 107-128.


9HSTFMG*afdejd+
ISBN 978-952-60-5349-3 ISBN 978-952-60-5356-1 (pdf) ISSN-L 1799-4934 ISSN 1799-4934 ISSN 1799-4942 (pdf) Aalto University School of Science Department of Industrial Engineering and Management www.aalto.fi
BUSINESS + ECONOMY ART + DESIGN + ARCHITECTURE SCIENCE + TECHNOLOGY CROSSOVER DOCTORAL DISSERTATIONS
Aalto-D
D 15
0/2
013
Antti N
iemi
The G
overnance of Long-T
erm Investing in K
nowledge C
reation A
alto U
nive
rsity
Department of Industrial Engineering and Management
The Governance of Long-Term Investing in Knowledge Creation Novel Control Mechanisms for Reducing Managerial Myopia and Increasing Growth in Organizations
Antti Niemi
DOCTORAL DISSERTATIONS