THE GOODYEAR TIRE & RUBBER COMPANYmanufactures and markets rubber-related chemicals for various...
120
Transcript of THE GOODYEAR TIRE & RUBBER COMPANYmanufactures and markets rubber-related chemicals for various...

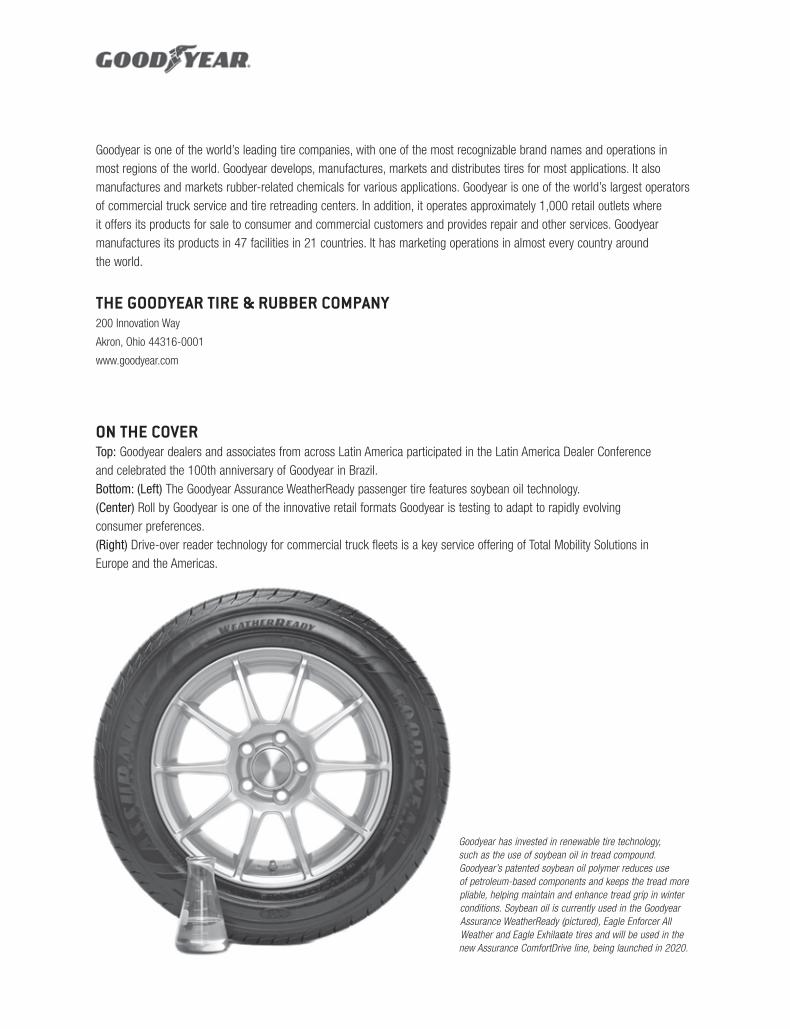
Goodyear is one of the world’s leading tire companies, with one of the most recognizable brand names and operations in most regions of the world. Goodyear develops, manufactures, markets and distributes tires for most applications. It also manufactures and markets rubber-related chemicals for various applications. Goodyear is one of the world’s largest operatorsof commercial truck service and tire retreading centers. In addition, it operates approximately 1,000 retail outlets where it offers its products for sale to consumer and commercial customers and provides repair and other services. Goodyear manufactures its products in 47 facilities in 21 countries. It has marketing operations in almost every country around the world.
THE GOODYEAR TIRE & RUBBER COMPANY200 Innovation Way
Akron, Ohio 44316-0001
www.goodyear.com
Goodyear has invested in renewable tire technology, such as the use of soybean oil in tread compound.Goodyear’s patented soybean oil polymer reduces use of petroleum-based components and keeps the tread morepliable, helping maintain and enhance tread grip in winterconditions. Soybean oil is currently used in the GoodyearAssurance WeatherReady (pictured), Eagle Enforcer AllWeather and Eagle Exhilarate tires and will be used in thenew Assurance ComfortDrive line, being launched in 2020.
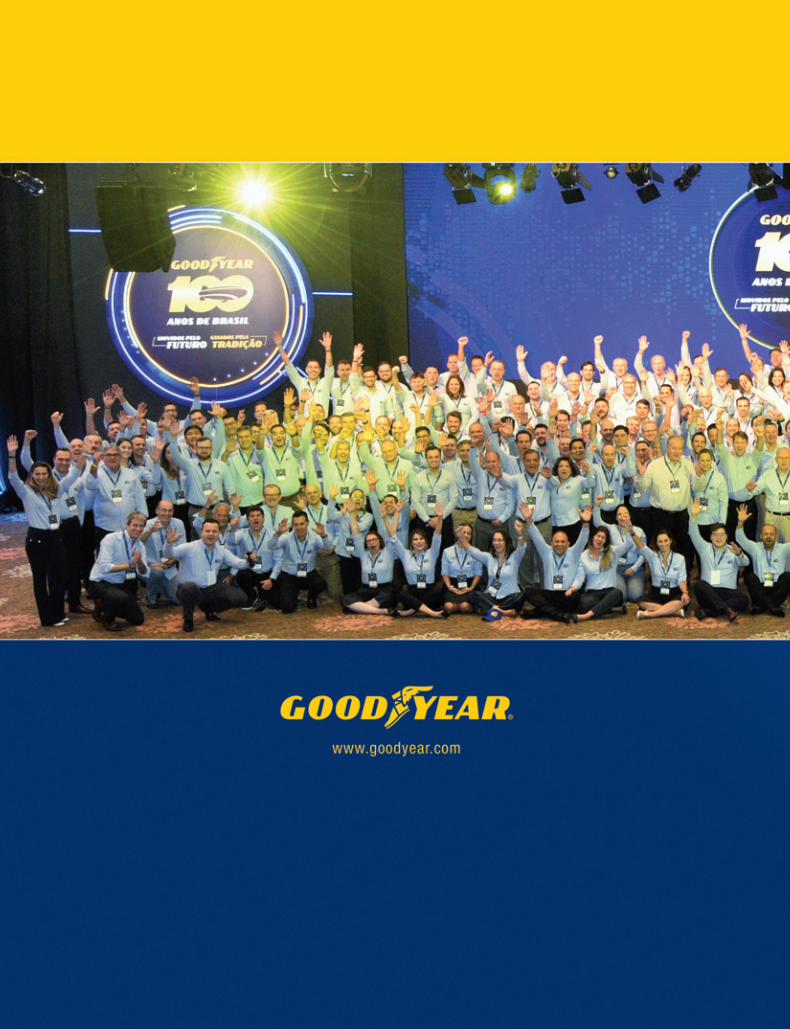
ON THE COVERTop: Goodyear dealers and associates from across Latin America participated in the Latin America Dealer Conference and celebrated the 100th anniversary of Goodyear in Brazil. Bottom: (Left) The Goodyear Assurance WeatherReady passenger tire features soybean oil technology. (Center) Roll by Goodyear is one of the innovative retail formats Goodyear is testing to adapt to rapidly evolving consumer preferences. (Right) Drive-over reader technology for commercial truck fleets is a key service offering of Total Mobility Solutions in Europe and the Americas.
1
FINANCIAL OVERVIEW
* Total debt includes Notes payable and overdrafts, Long term debt and finance leases due within one year, and Long term debt and finance leases.
YEAR ENDED DEC. 31 YEAR ENDED DEC. 31
(in millions, except per share and associates) 2019 2018
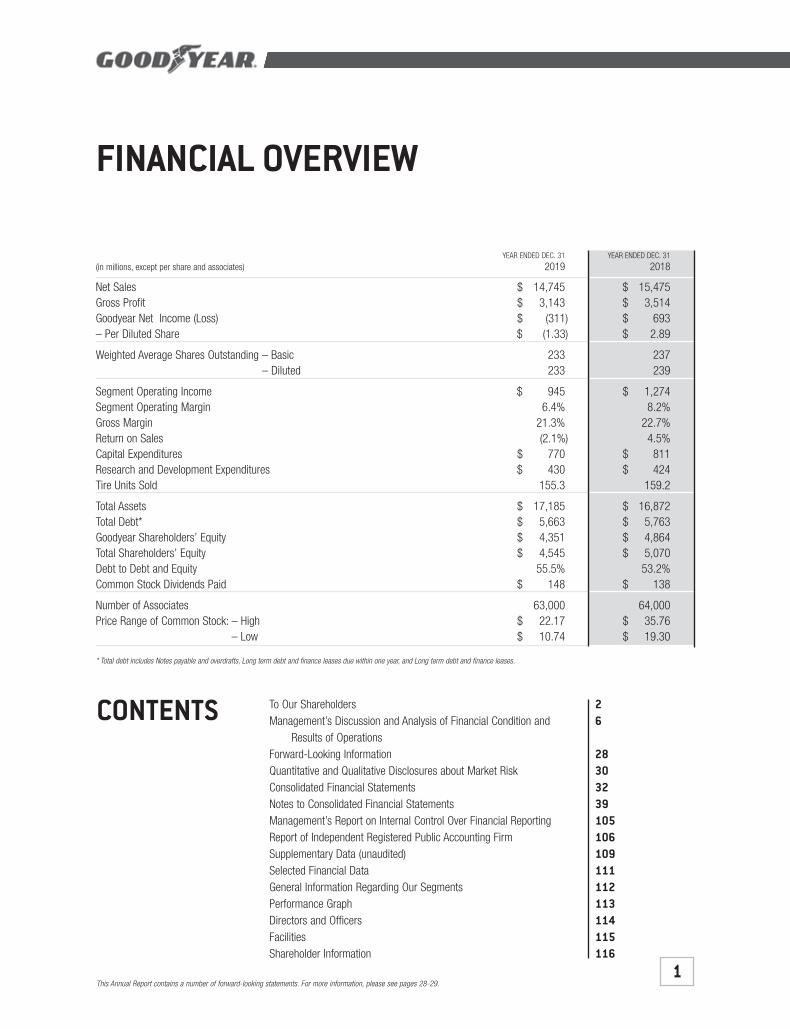
Net Sales $ 14,745 $ 15,475Gross Profit $ 3,143 $ 3,514Goodyear Net Income (Loss) $ (311) $ 693– Per Diluted Share $ (1.33) $ 2.89
Weighted Average Shares Outstanding – Basic 233 237– Diluted 233 239
Segment Operating Income $ 945 $ 1,274Segment Operating Margin 6.4% 8.2%Gross Margin 21.3% 22.7%Return on Sales (2.1%) 4.5%Capital Expenditures $ 770 $ 811Research and Development Expenditures $ 430 $ 424Tire Units Sold 155.3 159.2
Total Assets $ 17,185 $ 16,872Total Debt* $ 5,663 $ 5,763Goodyear Shareholders’ Equity $ 4,351 $ 4,864Total Shareholders’ Equity $ 4,545 $ 5,070Debt to Debt and Equity 55.5% 53.2%Common Stock Dividends Paid $ 148 $ 138
Number of Associates 63,000 64,000Price Range of Common Stock: – High $ 22.17 $ 35.76
– Low $ 10.74 $ 19.30
CONTENTS To Our ShareholdersManagement’s Discussion and Analysis of Financial Condition and
Results of OperationsForward-Looking InformationQuantitative and Qualitative Disclosures about Market RiskConsolidated Financial StatementsNotes to Consolidated Financial StatementsManagement’s Report on Internal Control Over Financial ReportingReport of Independent Registered Public Accounting FirmSupplementary Data (unaudited)Selected Financial DataGeneral Information Regarding Our SegmentsPerformance GraphDirectors and OfficersFacilitiesShareholder Information
26
28303239105106109111112113114115116
This Annual Report contains a number of forward-looking statements. For more information, please see pages 28-29.
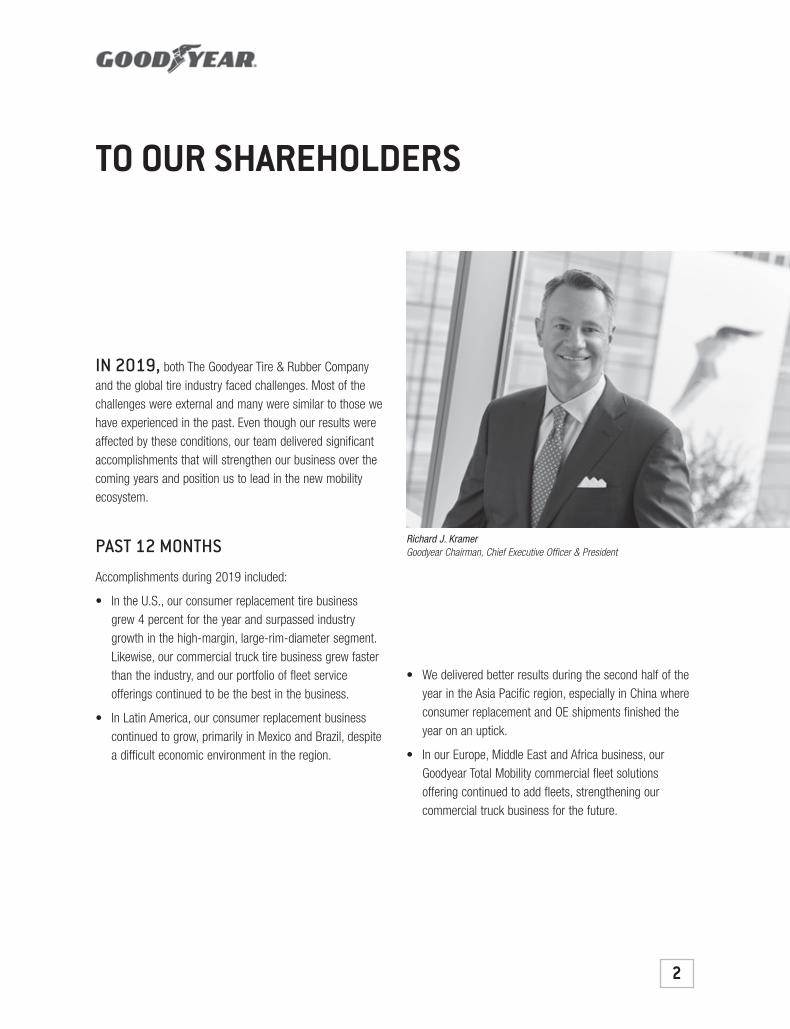
Richard J. KramerGoodyear Chairman, Chief Executive Officer & President
TO OUR SHAREHOLDERS
IN 2019, both The Goodyear Tire & Rubber Companyand the global tire industry faced challenges. Most of thechallenges were external and many were similar to those wehave experienced in the past. Even though our results wereaffected by these conditions, our team delivered significantaccomplishments that will strengthen our business over thecoming years and position us to lead in the new mobilityecosystem.
PAST 12 MONTHS
Accomplishments during 2019 included:
• In the U.S., our consumer replacement tire businessgrew 4 percent for the year and surpassed industrygrowth in the high-margin, large-rim-diameter segment.Likewise, our commercial truck tire business grew fasterthan the industry, and our portfolio of fleet service offerings continued to be the best in the business.
• In Latin America, our consumer replacement businesscontinued to grow, primarily in Mexico and Brazil, despitea difficult economic environment in the region.
2
• We delivered better results during the second half of theyear in the Asia Pacific region, especially in China whereconsumer replacement and OE shipments finished theyear on an uptick.
• In our Europe, Middle East and Africa business, ourGoodyear Total Mobility commercial fleet solutions offering continued to add fleets, strengthening our commercial truck business for the future.
During the year, we adapted our plans to meet shifting market conditions. We invested in modernizing two manufacturing facilities in Germany and announced a planto adjust production in one of our U.S. plants to reflect thechanging needs of our markets. In addition, we renewed our commitment to effectively managing our working capi-tal. As a result, we improved our cash flow from operationssignificantly, delivering a 32 percent increase over a year ago.
One of the brightest spots across all our regions is ourproduct portfolio. Our lineup of consumer and commercialtires for both original equipment and replacement segmentsis clearly the best in our history. On the consumer side, thehighest growth segment is premium, large-rim-diametertires. Over the past year, we outpaced the industry in thishigh-margin segment in the U.S.
In many of our most important markets – including the U.S., Europe and China – our consumer products have won honors from third-party tests, consumer surveys and influential magazine rankings.
Though OE sales were down during the past year, we areworking closer with automakers than ever, helping themsolve their most complex challenges on new vehicles. In 2019, we continued to be successful on a higher percentage of our OE fitment bids than in the recent past.Importantly, nearly 25 percent of our OE wins were on electric or hybrid vehicles.
3
Likewise, our commercial truck tire business is deliveringbest-in-class products around the world. Our complete tirelineup for long-haul, regional and mixed service applicationsis supported by diagnostic tools, tire management servicesand around-the-clock roadside assistance to help fleetsoperate more efficiently.
In addition to helping our fleet partners with tires, we arealso providing services to enable greater efficiency for theircommercial truck operations. We are expanding our TotalMobility Solutions offering to include new tools to handlemaintenance and monitor tire performance in real time.Finally, we are offering an e-commerce platform for commercial truck tire sales in the U.S., following our successful consumer tire sales option throughgoodyear.com.
4
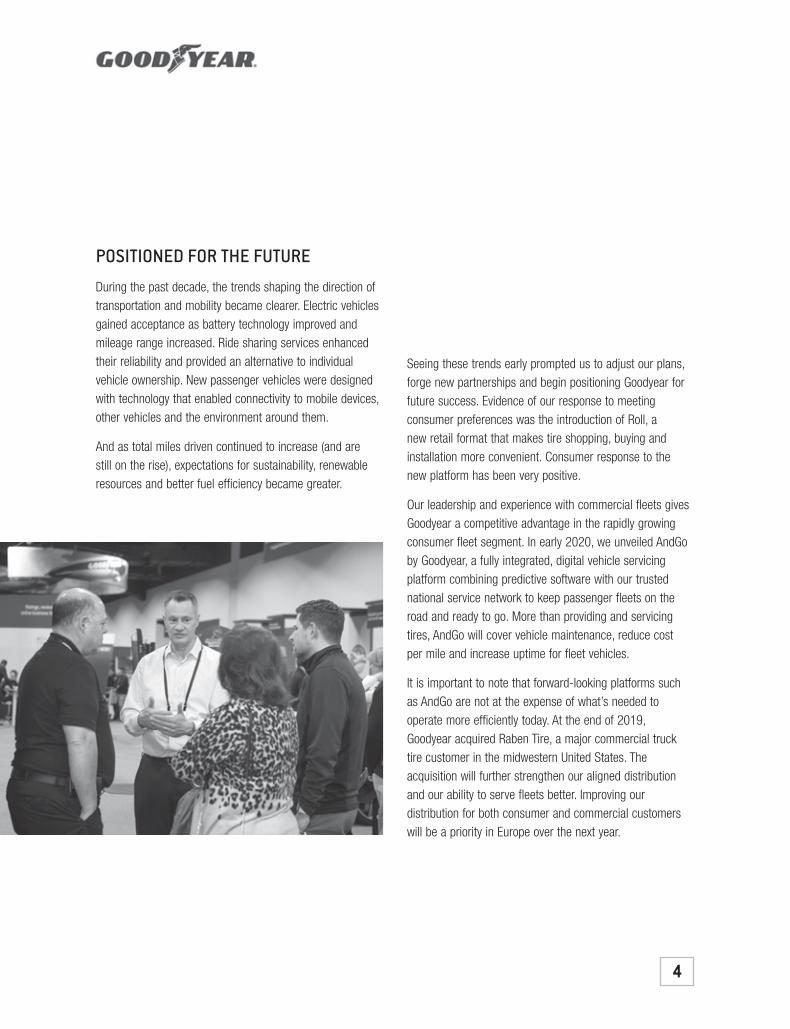
Seeing these trends early prompted us to adjust our plans,forge new partnerships and begin positioning Goodyear forfuture success. Evidence of our response to meeting consumer preferences was the introduction of Roll, a new retail format that makes tire shopping, buying andinstallation more convenient. Consumer response to the new platform has been very positive.
Our leadership and experience with commercial fleets givesGoodyear a competitive advantage in the rapidly growingconsumer fleet segment. In early 2020, we unveiled AndGoby Goodyear, a fully integrated, digital vehicle servicing platform combining predictive software with our trustednational service network to keep passenger fleets on theroad and ready to go. More than providing and servicingtires, AndGo will cover vehicle maintenance, reduce cost per mile and increase uptime for fleet vehicles.
It is important to note that forward-looking platforms suchas AndGo are not at the expense of what’s needed to operate more efficiently today. At the end of 2019, Goodyear acquired Raben Tire, a major commercial trucktire customer in the midwestern United States. The acquisition will further strengthen our aligned distributionand our ability to serve fleets better. Improving our distribution for both consumer and commercial customerswill be a priority in Europe over the next year.
POSITIONED FOR THE FUTURE
During the past decade, the trends shaping the direction oftransportation and mobility became clearer. Electric vehiclesgained acceptance as battery technology improved andmileage range increased. Ride sharing services enhancedtheir reliability and provided an alternative to individual vehicle ownership. New passenger vehicles were designedwith technology that enabled connectivity to mobile devices,other vehicles and the environment around them.
And as total miles driven continued to increase (and are still on the rise), expectations for sustainability, renewableresources and better fuel efficiency became greater.
Our commitment to sustainability has never been stronger.While we continue to reduce waste and consumption of natural resources, we are expanding our use of renewableresources. The clear example is the Goodyear AssuranceWeatherReady consumer tire, which includes soybean oil inthe tread compound. In addition to using a plant-basedalternative to a petroleum compound, we increased thetread’s pliability, enhancing its performance in cold, wet and snowy conditions. What began with a grant from theUnited Soybean Board in 2011 became a game-changinginnovation.
Whether we work with traditional customers such asautomakers and commercial fleets, or new partners such as technology companies and suppliers of sustainableresources, our goal is the same: we want to enable mobility;make it easy for consumers to buy, own and recommendour brand; and make it easier for Goodyear and its partners and customers to grow profitably.
LEADING WITH CONFIDENCE
As we manage our business through the current cycle ofchallenges and external pressures, we are looking forwardto a wealth of opportunities ahead. We will make the necessary decisions to run our company as efficiently aspossible now without losing sight of the changes in mobilitythat are happening around us. We believe those changesplay to Goodyear’s strengths.
Our product lineup – consumer, commercial and off-highway, OE and replacement – has never been better. We are incorporating technology in new ways to enhanceour products and services and make the experience of buying and owning Goodyear easier than ever. We’re building partnerships to help us deliver for customers today and enable new forms of mobility for tomorrow. We’re exploring new sustainable materials and processes to reduce our burden on the environment.
As always, the heartbeat of our confidence is our people.The power of the Goodyear brand around the world isstrengthened by our associates, our customers and, you, our investors. We are looking forward to sharing a brightfuture with everyone who is a part of the Goodyear family.Thank you for your continued support, confidence and trust.
Respectfully submitted,
Richard J. KramerChairman, Chief Executive Officer & President
5
MANAGEMENT’S DISCUSSION AND ANALYSIS OF FINANCIAL CONDITION AND RESULTS OFOPERATIONS.
OVERVIEW
The Goodyear Tire & Rubber Company is one of the world’s leading manufacturers of tires, with one of the mostrecognizable brand names in the world and operations in most regions of the world. We have a broad globalfootprint with 47 manufacturing facilities in 21 countries, including the United States. We operate our businessthrough three operating segments representing our regional tire businesses: Americas; Europe, Middle East andAfrica; and Asia Pacific.
This management’s discussion and analysis provides comparisons of material changes in the consolidatedfinancial statements for the years ended December 31, 2019 and 2018. For a comparison of the years endedDecember 31, 2018 and 2017, refer to Management’s Discussion and Analysis of Financial Condition andResults of Operations included in our annual report on Form 10-K for the year ended December 31, 2018.
Results of Operations
In 2019, challenging macro-economic industry conditions persisted throughout much of the year, includinghigher raw material costs, foreign currency headwinds due to a strong U.S. dollar, lower OE industry volumes,softening demand in Europe, weak market conditions in China, and economic volatility in Latin America,particularly in Brazil. These headwinds were partially offset by continued strength in U.S. consumer replacementsales.
In order to continue to drive growth in our business and address the challenging economic environment, weremain focused on our key strategies by:
• Developing great products and services that anticipate and respond to the needs of consumers;• Building the value of our brand, helping our customers win in their markets, and becoming consumers’
preferred choice; and• Improving our manufacturing efficiency and creating an advantaged supply chain focused on reducing our
total delivered costs, optimizing working capital levels and delivering best in industry customer service.
Our 2019 results reflect a 2.4% decrease in tire unit shipments compared to 2018. In 2019, we realizedapproximately $199 million of cost savings, including raw material cost saving measures of approximately$93 million, which exceeded the impact of general inflation. Our raw material costs, including cost savingmeasures, increased by approximately 4% in 2019 compared to 2018.
Net sales were $14,745 million in 2019, compared to $15,475 million in 2018. Net sales decreased in 2019primarily due to unfavorable foreign currency translation, primarily in EMEA, lower volume, primarily inEMEA, and lower sales in other tire-related businesses, primarily due to a decrease in third-party sales ofchemical products in Americas, partially offset by improvements in price and product mix, primarily in EMEAand Americas.
Goodyear net loss in 2019 was $311 million, or $1.33 per diluted share, compared to Goodyear net income of$693 million, or $2.89 per diluted share, in 2018. The decrease in Goodyear net income in 2019 was primarilydriven by lower segment operating income, the net gain recognized on the TireHub transaction in 2018, higherincome tax expense and higher rationalization expense.
Our total segment operating income for 2019 was $945 million, compared to $1,274 million in 2018. The$329 million, or 25.8%, decrease in segment operating income was primarily due to the impact of higher rawmaterial costs of $185 million, primarily in Americas and EMEA, lower volume of $81 million, primarily inEMEA, higher selling, administrative and general expense (“SAG”) of $47 million, primarily due to higherwages and benefits driven by higher incentive compensation, lower income in other tire-related businesses of$38 million, driven by lower third-party chemical sales in Americas, the impact of unfavorable foreign currencytranslation of $38 million, and higher conversion costs of $36 million, primarily in EMEA and Asia Pacific.These decreases more than offset improvements in price and product mix of $120 million, primarily in Americasand EMEA. Refer to “Results of Operations — Segment Information” for additional information.
6
Liquidity
At December 31, 2019, we had $908 million in Cash and cash equivalents as well as $3,578 million of unusedavailability under our various credit agreements, compared to $801 million and $3,151 million, respectively, atDecember 31, 2018. Cash flows from operating activities of $1,207 million, which are driven by the profitabilityof our strategic business units (“SBUs”) and changes in working capital, were used to fund capital expendituresof $770 million, dividends paid on our common stock of $148 million, and net debt repayments of $119 million.Refer to “Liquidity and Capital Resources” for additional information.
Outlook
We expect to continue to experience challenging global industry conditions in 2020, including lower global OEindustry demand, particularly in Europe and Asia, foreign currency headwinds, weak consumer replacementdemand in Europe, and volatility in emerging markets. We anticipate our consumer OE tire unit volume todecline by about 2.0 million units in 2020, primarily in Asia Pacific. We also expect that the changes we plan topursue to our distribution network in Europe could reduce our consumer replacement tire unit volume by up to1.5 million units in 2020.
In 2020, we expect to continue to see benefits from pricing actions that we implemented to recover raw materialcost increases and continued strong performance in our sales of 17-inch and above consumer replacement tires.
For the full year of 2020, we expect our raw material costs will be essentially flat compared to 2019, excludingtransactional foreign currency and raw material cost saving measures. Natural and synthetic rubber prices andother commodity prices historically have been volatile, and this estimate could change significantly based onfluctuations in the cost of these and other key raw materials. We are continuing to focus on price and productmix, to substitute lower cost materials where possible, to work to identify additional substitution opportunities, toreduce the amount of material required in each tire, and to pursue alternative raw materials.
The recent coronavirus outbreak in China has caused the temporary closure of many businesses in China,including our Pulandian manufacturing facility, which has limited business activity and automotiveproduction. Given the dynamic nature of this situation, our outlook does not currently include any impact fromthe coronavirus since that impact cannot be reasonably estimated at this time.
Refer to “Risk Factors” for a discussion of the factors that may impact our business, results of operations,financial condition or liquidity and “Forward-Looking Information — Safe Harbor Statement” for a discussion ofour use of forward-looking statements.
RESULTS OF OPERATIONS — CONSOLIDATED
All per share amounts are diluted and refer to Goodyear net income (loss).
Goodyear net loss in 2019 was $311 million, or $1.33 per share, compared to Goodyear net income of$693 million, or $2.89 per share, in 2018. The decrease in Goodyear net income in 2019 was driven by lowersegment operating income, the net gain recognized on the TireHub transaction in 2018, higher income taxexpense and higher rationalization expense.
Net Sales
Net sales in 2019 of $14,745 million decreased $730 million, or 4.7%, compared to $15,475 million in 2018,primarily due to unfavorable foreign currency translation of $451 million, primarily in EMEA, lower volume of$307 million, primarily in EMEA, and lower sales in other tire-related businesses of $168 million, primarily dueto a decrease in third-party sales of chemical products in Americas, partially offset by improvements in price andproduct mix of $196 million, primarily in EMEA and Americas. Goodyear worldwide tire unit net sales were$12,524 million and $13,060 million in 2019 and 2018, respectively. Consumer and commercial net sales were$8,835 million and $2,953 million, respectively, in 2019. Consumer and commercial net sales were$9,167 million and $3,002 million, respectively, in 2018.
7
The following table presents our tire unit sales for the periods indicated:Year Ended December 31,
(In millions of tires) 2019 2018 % Change
Replacement UnitsUnited States . . . . . . . . . . . . . . . . . . . . . . . . . . . . . . . . . . . . . . . . . . . . . . . . . . . . . . . 40.3 38.9 3.6%
International . . . . . . . . . . . . . . . . . . . . . . . . . . . . . . . . . . . . . . . . . . . . . . . . . . . . . . . 74.7 76.2 (2.0)
Total . . . . . . . . . . . . . . . . . . . . . . . . . . . . . . . . . . . . . . . . . . . . . . . . . . . . . . . . . 115.0 115.1 (0.1)
OE UnitsUnited States . . . . . . . . . . . . . . . . . . . . . . . . . . . . . . . . . . . . . . . . . . . . . . . . . . . . . . . 11.2 13.2 (15.2)
International . . . . . . . . . . . . . . . . . . . . . . . . . . . . . . . . . . . . . . . . . . . . . . . . . . . . . . . 29.1 30.9 (5.8)
Total . . . . . . . . . . . . . . . . . . . . . . . . . . . . . . . . . . . . . . . . . . . . . . . . . . . . . . . . . 40.3 44.1 (8.5)
Goodyear worldwide tire units . . . . . . . . . . . . . . . . . . . . . . . . . . . . . . . . . . . . . 155.3 159.2 (2.4)
The decrease in worldwide tire unit sales of 3.9 million units, or 2.4%, compared to 2018, included a decrease of0.1 million replacement tire units, or 0.1%, comprised primarily of a decrease in EMEA partially offset by anincrease in Americas. OE tire units decreased by 3.8 million units, or 8.5%, primarily due to lower vehicleproduction globally. Consumer and commercial unit sales in 2019 were 141.9 million and 11.7 million,respectively. Consumer and commercial unit sales in 2018 were 145.5 million and 11.8 million, respectively.
Cost of Goods Sold
Cost of goods sold (“CGS”) was $11,602 million in 2019, decreasing $359 million, or 3.0%, from$11,961 million in 2018. CGS was 78.7% of sales in 2019 compared to 77.3% of sales in 2018. CGS in 2019decreased due to foreign currency translation of $345 million, primarily in EMEA and Americas, lower volumeof $226 million, primarily in EMEA, lower costs in other tire-related businesses of $130 million, driven by lowerthird-party chemical sales in Americas, and lower start-up costs of $36 million associated with our new plant inSan Luis Potosi, Mexico. These decreases were partially offset by higher raw material costs of $185 million,primarily in Americas and EMEA, higher costs related to product mix of $76 million, primarily in EMEA andAsia Pacific, the year-over-year impact of favorable indirect tax settlements in Brazil of $42 million, and higherconversion costs of $36 million, primarily in EMEA and Asia Pacific. CGS in 2019 included pension expense of$14 million compared to $15 million in 2018. CGS in 2019 and 2018 also included incremental savings fromrationalization plans of $20 million and $41 million, respectively.
CGS in 2019 included accelerated depreciation and asset write-offs of $15 million ($12 million after-tax andminority) and favorable indirect tax settlements in Brazil of $11 million ($7 million after-tax and minority) andin the U.S. of $6 million ($5 million after-tax and minority). CGS in 2018 included accelerated depreciation andasset write-offs of $4 million ($3 million after-tax and minority) and favorable indirect tax settlements in Brazilof $53 million, of which $51 million ($39 million after-tax and minority) related to years prior to 2018, and in theU.S. of $4 million ($3 million after-tax and minority).
Selling, Administrative and General Expense
SAG was $2,323 million in 2019, increasing $11 million, or 0.5%, from $2,312 million in 2018. SAG was 15.8%of sales in 2019 compared to 14.9% of sales in 2018. The increase in SAG was primarily due to higher wages andbenefits of $65 million, primarily due to higher incentive compensation, and higher information technologyexpense of $11 million, partially offset by foreign currency translation of $68 million. SAG in 2019 includedpension expense of $15 million compared to $17 million in 2018. SAG in 2019 and 2018 also includedincremental savings from rationalization plans of $17 million and $34 million, respectively.
Rationalizations
We recorded net rationalization charges of $205 million ($165 million after-tax and minority) in 2019. Netrationalization charges include $115 million in EMEA, primarily related to a plan to modernize two of our
8
manufacturing facilities in Germany, and $90 million in Americas, primarily related to a plan to curtailproduction of tires for declining, less profitable segments of the tire market at our Gadsden, Alabamamanufacturing facility.
We recorded net rationalization charges of $44 million ($32 million after-tax and minority) in 2018. Netrationalization charges included charges of $31 million related to global plans to reduce SAG headcount,$16 million related to plans to reduce manufacturing headcount and improve operating efficiency in EMEA, and$15 million related to the closure of our tire manufacturing facility in Philippsburg, Germany. Net rationalizationcharges in 2018 also included reversals of $19 million for actions no longer needed for their originally intendedpurposes.
Upon completion of the 2019 plans, we estimate that annual segment operating income will benefit from animprovement in CGS of approximately $140 million. The savings realized in 2019 from rationalization planstotaled $37 million ($20 million CGS and $17 million SAG).
For further information, refer to the Note to the Consolidated Financial Statements No. 3, Costs Associated withRationalization Programs.
Interest Expense
Interest expense was $340 million in 2019, increasing $19 million from $321 million in 2018. The increase wasprimarily due to higher average debt balances of $6,408 million in 2019 compared to $6,218 million in 2018 anda higher average interest rate of 5.31% in 2019 compared to 5.16% in 2018.
Other (Income) Expense
Other (Income) Expense in 2019 was expense of $98 million, compared to income of $174 million in 2018. The$272 million change in Other (Income) Expense was primarily driven by the gain, net of transaction costs, of$272 million ($207 million after-tax and minority) recognized on the TireHub transaction in 2018, a decrease ininterest income on favorable indirect tax settlements in Brazil of $30 million, and charges of $25 million($25 million after-tax and minority) related to flooding at our Beaumont, Texas chemical facility in 2019. Theseincreases in expense were partially offset by an increase in net gains on asset sales of $15 million, $12 million($12 million after-tax and minority) in expenses related to hurricanes Harvey and Irma in 2018, and a net gain oninsurance recoveries of $4 million ($3 million after-tax and minority) in 2019.
Non-service related pension and other postretirement benefits expense of $118 million in 2019 includes pensionsettlement charges of $5 million ($4 million after-tax and minority). Non-service related pension and otherpostretirement benefits expense of $121 million in 2018 includes pension settlement charges of $22 million($17 million after-tax and minority) and a one-time charge of $9 million ($7 million after-tax and minority)related to the adoption of the new accounting standards update which no longer allows non-service relatedpension and other postretirement benefits cost to be capitalized in inventory.
Net (gains) losses on asset sales were a gain of $16 million ($15 million after-tax and minority) in 2019 ascompared to a gain of $1 million ($1 million after-tax and minority) in 2018.
Other (Income) Expense in 2019 included interest income on favorable indirect tax settlements in Brazil of$8 million ($5 million after-tax and minority), compared to interest income on favorable indirect tax settlementsin Brazil of $38 million ($29 million after-tax and minority) in 2018. Other (Income) Expense in 2019 includedcharges of $5 million ($4 million after-tax and minority), compared to charges of $4 million ($3 million after-taxand minority) in 2018, for non-asbestos legal claims related to discontinued products. Other (Income) Expense in2019 also included a net gain of $2 million ($2 million after-tax and minority) related to an acquisition and$2 million ($2 million after-tax and minority) of favorable foreign currency translation on indirect tax items.
For further information, refer to the Note to the Consolidated Financial Statements No. 5, Other (Income)Expense.
Income Taxes
Income tax expense in 2019 was $474 million on income before income taxes of $177 million. In 2019, incometax expense was unfavorably impacted by net discrete adjustments totaling $386 million ($386 million after
9
minority interest). Discrete adjustments were due to non-cash charges of $334 million related to an accelerationof royalty income in the U.S. from the sale of certain European royalty payments to Luxembourg and$150 million related to an increase in our valuation allowance on tax losses in Luxembourg, which were partiallyoffset by a non-cash tax benefit of $98 million related to a reduction of our U.S. valuation allowance for foreigntax credits.
At December 31, 2019, our valuation allowance on certain of our U.S. federal, state and local deferred tax assetswas $13 million, primarily related to state tax loss and credit carryforwards, and our valuation allowance on ourforeign deferred tax assets was $969 million. At December 31, 2018, our valuation allowance on certain U.S.federal, state and local deferred tax assets was $113 million and our valuation allowance on our foreign deferredtax assets was $204 million.
Foreign source taxable income for the fourth quarter of 2019 includes accelerated royalty income in the U.S. of$2.1 billion received from Luxembourg as payment for the purchase of the right to receive technology royaltiesfrom our European operations for a period of 12 years. External specialists assisted management with thistransaction. The royalty sale transaction resulted in a U.S. tax charge of $334 million and a deferred tax asset andoffsetting valuation allowance of $576 million in Luxembourg.
Foreign source taxable income for the fourth quarter of 2019 also includes $320 million of accelerated cross-border sales of inventory from the U.S. to Canada, resulting in a U.S. tax charge of approximately $70 millionthat was offset by the establishment of a deferred tax asset.
The federal portion of the tax charges related to both the royalty acceleration and Canadian prepaymenttransactions was fully offset by the utilization of foreign tax credits of approximately $310 million. In addition,as a result of these transactions, we released an existing U.S. valuation allowance on foreign tax credits of$98 million.
We considered our current forecasts of future profitability in assessing our ability to realize our remaining netforeign tax credits of $403 million. These forecasts include the impact of recent trends, including variousmacroeconomic factors such as raw material prices, on our profitability, as well as the impact of tax planningstrategies. Macroeconomic factors, including raw material prices, possess a high degree of volatility and cansignificantly impact our profitability. As such, there is a risk that future foreign source income will not besufficient to fully utilize these foreign tax credits. However, we believe our forecasts of future profitability alongwith three significant sources of foreign income as described in “Critical Accounting Policies” provide ussufficient positive evidence to conclude that it is more likely than not that our foreign tax credits, net ofremaining valuation allowances, will be fully utilized prior to their various expiration dates.
Income tax expense in 2018 was $303 million on income before income taxes of $1,011 million. In 2018, incometax expense was unfavorably impacted by net discrete adjustments of $65 million ($65 million after minorityinterest). Discrete adjustments were primarily due to charges totaling $135 million related to deferred tax assetsfor foreign tax credits, including the establishment of a valuation allowance on foreign tax credits of $98 million,partially offset by a tax benefit of $88 million related to a worthless stock deduction created by permanentlyceasing operations of our Venezuelan subsidiary during the fourth quarter of 2018. Income tax expense in 2018also included net charges of $18 million for various other discrete tax adjustments, including those related tofinalizing our accounting for certain provisional items related to the Tax Cuts and Jobs Act that was enacted onDecember 22, 2017 (the “Tax Act”).
Our losses in various foreign taxing jurisdictions in recent periods represented sufficient negative evidence torequire us to maintain a full valuation allowance against certain of our net deferred tax assets. In Luxembourg,we maintained a valuation allowance on all deferred tax assets with limited lives. As a result of recent negativeevidence, including cumulative losses in the most recent three-year period and a forecast of continued losses for2020, we increased our valuation allowance on our net deferred tax assets in Luxembourg to now include losseswith unlimited lives, resulting in a non-cash tax charge of $150 million. Each reporting period we assessavailable positive and negative evidence and estimate if sufficient future taxable income will be generated toutilize these existing deferred tax assets. We do not believe that sufficient positive evidence required to release
10
valuation allowances having a significant impact on our financial position or results of operations will existwithin the next twelve months.
For further information, refer to “Critical Accounting Policies” and Note to the Consolidated FinancialStatements No. 6, Income Taxes.
Minority Shareholders’ Net Income
Minority shareholders’ net income was $14 million in 2019, compared to $15 million in 2018. Minorityshareholders’ net income in 2019 includes $7 million ($7 million after-tax and minority) of expense related to anindirect tax settlement in Turkey.
RESULTS OF OPERATIONS — SEGMENT INFORMATION
Segment information reflects our SBUs, which are organized to meet customer requirements and globalcompetition and are segmented on a regional basis.
Results of operations are measured based on net sales to unaffiliated customers and segment operating income.Each segment exports tires to other segments. The financial results of each segment exclude sales of tiresexported to other segments, but include operating income derived from such transactions. Segment operatingincome is computed as follows: Net Sales less CGS (excluding asset write-off and accelerated depreciationcharges) and SAG (including certain allocated corporate administrative expenses). Segment operating incomealso includes certain royalties and equity in earnings of most affiliates. Segment operating income does notinclude net rationalization charges (credits), asset sales and certain other items.
Total segment operating income was $945 million in 2019, and $1,274 million in 2018. Total segment operatingmargin (segment operating income divided by segment sales) in 2019 was 6.4%, compared to 8.2% in 2018.
Management believes that total segment operating income is useful because it represents the aggregate value ofincome created by our SBUs and excludes items not directly related to the SBUs for performance evaluationpurposes. Total segment operating income is the sum of the individual SBUs’ segment operating income. Referto the Note to the Consolidated Financial Statements No. 8, Business Segments, for further information and for areconciliation of total segment operating income to Income before Income Taxes.
AmericasYear Ended December 31,
(In millions) 2019 2018 2017
Tire Units . . . . . . . . . . . . . . . . . . . . . . . . . . . . . . . . . . . . . . . . . . . . . . . . . 70.4 70.9 70.9
Net Sales . . . . . . . . . . . . . . . . . . . . . . . . . . . . . . . . . . . . . . . . . . . . . . . . . . $ 7,922 $ 8,168 $ 8,212
Operating Income . . . . . . . . . . . . . . . . . . . . . . . . . . . . . . . . . . . . . . . . . . . 550 654 847
Operating Margin . . . . . . . . . . . . . . . . . . . . . . . . . . . . . . . . . . . . . . . . . . . 6.9% 8.0% 10.3%
Americas unit sales in 2019 decreased 0.5 million units, or 0.7%, to 70.4 million units. Replacement tire volumeincreased 1.3 million units, or 2.5%, primarily in our consumer business in the United States driven by growth in17-inch and above rim size tires. OE tire volume decreased 1.8 million units, or 10.6%, primarily in ourconsumer business in the United States, driven by lower vehicle production, including the impact resulting froma strike at a major OE customer, and our OE selectivity strategy.
Net sales in 2019 were $7,922 million, decreasing $246 million, or 3.0%, compared to $8,168 million in 2018.The decrease in net sales was driven by a decrease in other tire-related businesses of $160 million, primarily dueto a decrease in third-party sales of chemical products, unfavorable foreign currency translation of $105 million,primarily related to the Argentine peso and the Brazilian real, and a decrease in volume of $41 million. Thesedecreases were partially offset by improvements in price and product mix of $58 million, driven by an increase inpricing.
Operating income in 2019 was $550 million, decreasing $104 million, or 15.9%, from $654 million in 2018. Thedecrease in operating income was due to increased raw material costs of $108 million, which more than offset
11
favorable price and product mix of $70 million, a decrease in favorable indirect tax settlements in Brazil of$42 million, higher SAG of $35 million, primarily due to higher wages and benefits driven by higher incentivecompensation, lower income in other tire-related businesses of $33 million, primarily due to lower third-partychemical sales driven by lower global demand by tire manufacturers, unfavorable foreign currency translation of$11 million, and lower volume of $8 million. Income in other tire-related businesses included a $7 millionnegative impact related to flooding at our Beaumont, Texas chemical facility. These decreases were partiallyoffset by lower start-up costs of $36 million associated with our new plant in San Luis Potosi, Mexico and lowerconversion costs of $29 million, reflecting a benefit from overhead absorption. Conversion costs includedincremental savings from rationalization plans of $14 million.
Operating income in 2019 excluded rationalization charges of $90 million and accelerated depreciation and assetwrite-offs of $13 million. Operating income in 2018 excluded the net gain recognized on the TireHub transactionof $272 million, rationalization charges of $3 million and net gains on asset sales of $3 million.
Price and product mix improvements include TireHub equity losses of $33 million and $15 million in 2019 and2018, respectively. These losses reflect higher than expected start-up expenses and additional costs incurred tobuild out TireHub’s distribution footprint for future growth. We expect to continue to incur our share of theselosses as TireHub transitions through its start-up phase, however these losses are expected to moderate in 2020.
Americas’ results are highly dependent upon the United States, which accounted for 81% of Americas’ net salesin both 2019 and 2018. Results of operations in the United States are expected to continue to have a significantimpact on Americas’ future performance.
Europe, Middle East and AfricaYear Ended December 31,
(In millions) 2019 2018 2017
Tire Units . . . . . . . . . . . . . . . . . . . . . . . . . . . . . . . . . . . . . . . . . . . . . . . . . 55.1 57.8 57.1
Net Sales . . . . . . . . . . . . . . . . . . . . . . . . . . . . . . . . . . . . . . . . . . . . . . . . . . $ 4,708 $ 5,090 $ 4,928
Operating Income . . . . . . . . . . . . . . . . . . . . . . . . . . . . . . . . . . . . . . . . . . . 202 363 367
Operating Margin . . . . . . . . . . . . . . . . . . . . . . . . . . . . . . . . . . . . . . . . . . . 4.3% 7.1% 7.4%
Europe, Middle East and Africa unit sales in 2019 decreased 2.7 million units, or 4.6%, to 55.1 million units.Replacement tire volume decreased 1.4 million units, or 3.3%, primarily in our consumer business, driven byincreased competition and decreased industry demand. OE tire volume decreased 1.3 million units, or 8.5%,primarily in our consumer business, driven by lower vehicle production and our exit of declining, less profitablemarket segments.
Net sales in 2019 were $4,708 million, decreasing $382 million, or 7.5%, compared to $5,090 million in 2018.Net sales decreased primarily due to unfavorable foreign currency translation of $287 million, driven by theweakening of the euro, Turkish lira, South African rand and Polish zloty, and lower volume of $217 million.These decreases were partially offset by improvements in price and product mix of $117 million, driven by ourcontinued focus on 17-inch and above rim size consumer tires and price increases on commercial replacementtire sales.
Operating income in 2019 was $202 million, decreasing $161 million, or 44.4%, compared to $363 million in2018. Operating income decreased due to lower volume of $59 million, higher raw material costs of $57 million,higher conversion costs of $43 million, driven by inflation, unfavorable foreign currency translation of$19 million, higher SAG of $15 million, primarily due to inflation, higher research and development costs of$6 million, $5 million of start-up costs, primarily at our new plant in Luxembourg, and higher transportationcosts of $5 million. These decreases in operating income were partially offset by improvements in price andproduct mix of $64 million. SAG and conversion costs included incremental savings from rationalization plans of$15 million and $6 million, respectively.
Operating income in 2019 excluded net rationalization charges of $115 million, net gains on asset sales of$16 million, and accelerated depreciation and asset write-offs of $2 million. Operating income in 2018 excluded
12
net rationalization charges of $36 million, accelerated depreciation and asset write-offs of $4 million, and netlosses on asset sales of $2 million.
EMEA’s results are highly dependent upon Germany, which accounted for 21% and 33% of EMEA’s net sales in2019 and 2018, respectively. The decline in sales reported in Germany is primarily related to a businessreorganization that centralized our OE sales for EMEA in Luxembourg. Results of operations in Germany areexpected to continue to have a significant impact on EMEA’s future performance.
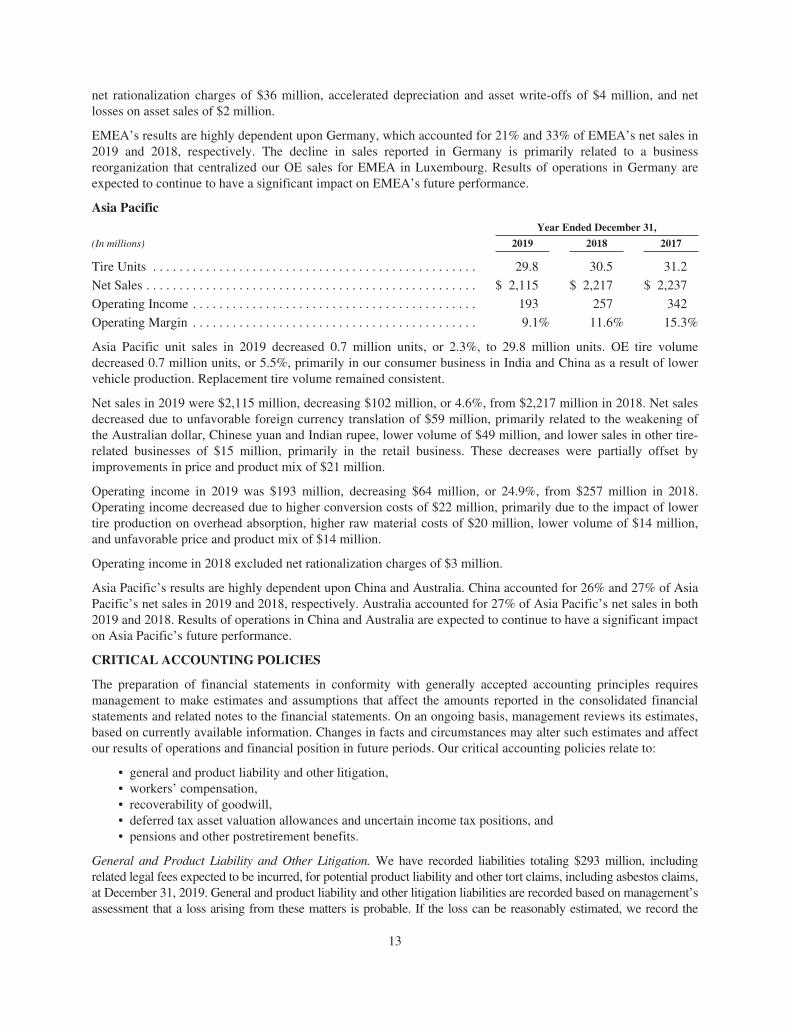
Asia PacificYear Ended December 31,
(In millions) 2019 2018 2017
Tire Units . . . . . . . . . . . . . . . . . . . . . . . . . . . . . . . . . . . . . . . . . . . . . . . . . 29.8 30.5 31.2
Net Sales . . . . . . . . . . . . . . . . . . . . . . . . . . . . . . . . . . . . . . . . . . . . . . . . . . $ 2,115 $ 2,217 $ 2,237
Operating Income . . . . . . . . . . . . . . . . . . . . . . . . . . . . . . . . . . . . . . . . . . . 193 257 342
Operating Margin . . . . . . . . . . . . . . . . . . . . . . . . . . . . . . . . . . . . . . . . . . . 9.1% 11.6% 15.3%
Asia Pacific unit sales in 2019 decreased 0.7 million units, or 2.3%, to 29.8 million units. OE tire volumedecreased 0.7 million units, or 5.5%, primarily in our consumer business in India and China as a result of lowervehicle production. Replacement tire volume remained consistent.
Net sales in 2019 were $2,115 million, decreasing $102 million, or 4.6%, from $2,217 million in 2018. Net salesdecreased due to unfavorable foreign currency translation of $59 million, primarily related to the weakening ofthe Australian dollar, Chinese yuan and Indian rupee, lower volume of $49 million, and lower sales in other tire-related businesses of $15 million, primarily in the retail business. These decreases were partially offset byimprovements in price and product mix of $21 million.
Operating income in 2019 was $193 million, decreasing $64 million, or 24.9%, from $257 million in 2018.Operating income decreased due to higher conversion costs of $22 million, primarily due to the impact of lowertire production on overhead absorption, higher raw material costs of $20 million, lower volume of $14 million,and unfavorable price and product mix of $14 million.
Operating income in 2018 excluded net rationalization charges of $3 million.
Asia Pacific’s results are highly dependent upon China and Australia. China accounted for 26% and 27% of AsiaPacific’s net sales in 2019 and 2018, respectively. Australia accounted for 27% of Asia Pacific’s net sales in both2019 and 2018. Results of operations in China and Australia are expected to continue to have a significant impacton Asia Pacific’s future performance.
CRITICAL ACCOUNTING POLICIES
The preparation of financial statements in conformity with generally accepted accounting principles requiresmanagement to make estimates and assumptions that affect the amounts reported in the consolidated financialstatements and related notes to the financial statements. On an ongoing basis, management reviews its estimates,based on currently available information. Changes in facts and circumstances may alter such estimates and affectour results of operations and financial position in future periods. Our critical accounting policies relate to:
• general and product liability and other litigation,• workers’ compensation,• recoverability of goodwill,• deferred tax asset valuation allowances and uncertain income tax positions, and• pensions and other postretirement benefits.
General and Product Liability and Other Litigation. We have recorded liabilities totaling $293 million, includingrelated legal fees expected to be incurred, for potential product liability and other tort claims, including asbestos claims,at December 31, 2019. General and product liability and other litigation liabilities are recorded based on management’sassessment that a loss arising from these matters is probable. If the loss can be reasonably estimated, we record the
13
amount of the estimated loss. If the loss is estimated within a range and no point within the range is more probable thananother, we record the minimum amount in the range. As additional information becomes available, any potentialliability related to these matters is assessed and the estimates are revised, if necessary. Loss ranges are based upon thespecific facts of each claim or class of claims and are determined after review by counsel. Court rulings on our cases orsimilar cases may impact our assessment of the probability and our estimate of the loss, which may have an impact onour reported results of operations, financial position and liquidity. We record receivables for insurance recoveriesrelated to our litigation claims when it is probable that we will receive reimbursement from the insurer. Specifically,we are a defendant in numerous lawsuits alleging various asbestos-related personal injuries purported to result fromalleged exposure to asbestos in certain products previously manufactured by us or present in certain of our facilities.Typically, these lawsuits have been brought against multiple defendants in federal and state courts.
We periodically, and at least annually, update, using actuarial analyses, our existing reserves for pending claims,including a reasonable estimate of the liability associated with unasserted asbestos claims, and estimate ourreceivables from probable insurance recoveries. In determining the estimate of our asbestos liability, weevaluated claims over the next ten-year period. Due to the difficulties in making these estimates, analysis basedon new data and/or changed circumstances arising in the future may result in an increase in the recordedobligation, and that increase may be significant. We had recorded gross liabilities for both asserted andunasserted asbestos claims, inclusive of defense costs, totaling $153 million at December 31, 2019.
We maintain certain primary and excess insurance coverage under coverage-in-place agreements, and also haveadditional excess liability insurance with respect to asbestos liabilities. We record a receivable with respect tosuch policies when we determine that recovery is probable and we can reasonably estimate the amount of aparticular recovery. This determination is based on consultation with our outside legal counsel and takes intoconsideration agreements with certain of our insurance carriers, the financial viability and legal obligations of ourinsurance carriers, and other relevant factors.
As of December 31, 2019, we recorded a receivable related to asbestos claims of $95 million, and we expect thatapproximately 60% of asbestos claim related losses would be recoverable through insurance through the periodcovered by the estimated liability. Of this amount, $13 million was included in Current Assets as part ofAccounts Receivable at December 31, 2019. The recorded receivable consists of an amount we expect to collectunder coverage-in-place agreements with certain primary and excess insurance carriers as well as an amount webelieve is probable of recovery from certain of our other excess insurance carriers. Although we believe theseamounts are collectible under primary and certain excess policies today, future disputes with insurers could resultin significant charges to operations.
Workers’ Compensation. We had recorded liabilities, on a discounted basis, of $198 million for anticipated costsrelated to U.S. workers’ compensation claims at December 31, 2019. The costs include an estimate of expectedsettlements on pending claims, defense costs and a provision for claims incurred but not reported. Theseestimates are based on our assessment of potential liability using an analysis of available information withrespect to pending claims, historical experience and current cost trends. The amount of our ultimate liability inrespect of these matters may differ from these estimates. We periodically, and at least annually, update our lossdevelopment factors based on actuarial analyses. The liability is discounted using the risk-free rate of return.
For further information on general and product liability and other litigation, and workers’ compensation, refer to Noteto the Consolidated Financial Statements No. 19, Commitments and Contingent Liabilities.
Recoverability of Goodwill. Goodwill is tested for impairment annually or more frequently if an indicator ofimpairment is present. Goodwill totaled $565 million at December 31, 2019.
We test goodwill for impairment on at least an annual basis, with the option to perform a qualitative assessmentto determine whether further impairment testing is necessary or to perform a quantitative assessment bycomparing the fair value of a reporting unit to its carrying amount, including goodwill. Under the qualitativeassessment, an entity is not required to calculate the fair value of a reporting unit unless the entity determines thatit is more likely than not (defined as a likelihood of more than 50%) that its fair value is less than its carryingamount. If under the quantitative assessment the fair value of a reporting unit is less than its carrying amount,
14
then an impairment charge is recorded for that difference, not to exceed the total goodwill allocated to thatreporting unit. Our policy is to perform a quantitative assessment at least once every five years.
As a result of industry conditions, the decrease in our market capitalization and the length of time since the lastquantitative assessment was performed for all reporting units, management performed a quantitative assessmentas of October 31, 2019, the date of our annual goodwill impairment testing. Based upon the results of ourassessment, there were no impairments of the Company’s goodwill. Fair values substantially exceeded thecarrying amounts for each reporting unit tested, except for the EMEA reporting unit discussed below. In addition,we assessed the period from October 31, 2019 to December 31, 2019 and determined there were no factors thatcaused us to change our conclusions as of October 31, 2019.
We determine the estimated fair value for each reporting unit based on discounted cash flow projections andmarket values for comparable businesses. Our estimates of future cash flows include assumptions concerningfuture operating performance and economic conditions and may differ from actual future cash flows. Under thediscounted cash flow approach, fair value is calculated as the sum of the projected discounted cash flows of thereporting unit over the next five years and the terminal value at the end of those five years and is dependent onestimates for future revenue, operating margin, capital expenditures, rationalization activities and working capitalchanges, as well as expected long-term growth rates for cash flows and an appropriate discount rate. The riskadjusted discount rate used is consistent with the weighted average cost of capital for companies in the tireindustry and is intended to represent a rate of return that would be expected by a market participant. Under themarket value approach, market multiples are derived from market prices of stocks of companies that are in thetire industry. The appropriate multiple is applied to the forecasted revenues and earnings before interest, taxes,depreciation and amortization of the reporting unit to obtain an estimated fair value.
As of December 31, 2019, goodwill of $411 million is allocated to the EMEA reporting unit. As of theOctober 31, 2019 measurement date, EMEA had an estimated fair value that exceeded its carrying value,including goodwill, by approximately 10%. The most critical assumptions used in the calculation of the fair valueof the EMEA reporting unit are the projected long term operating margin, discount rate, and the selection ofmarket multiples. The projected long term operating margin utilized in our fair value estimates is consistent withthe reporting unit operating plan and is dependent on the successful execution of our business plan, overallindustry growth rates and the competitive environment. As a result, the long term operating margin could beadversely impacted by our ability to execute our business plan as well as by volatile macroeconomic factors suchas raw material prices, industry conditions or competition. Our business plan includes rationalization programs,aligned distribution actions, and recovering past raw material cost increases by improving price and product mix,including through continued focus on higher margin tires. The discount rate could be adversely impacted bychanges in the macroeconomic environment and volatility in the equity and debt markets. Although managementbelieves its estimate of fair value is reasonable, if the EMEA reporting unit’s future financial performance fallsbelow our expectations or there are negative revisions to significant assumptions, or if our market capitalizationdeclines further, and if such a decline becomes indicative that the fair value of our reporting units has declinedbelow their carrying values, we may need to record a material, non-cash goodwill impairment charge in a futureperiod.
Deferred Tax Asset Valuation Allowances and Uncertain Income Tax Positions. At December 31, 2019, ourvaluation allowance on certain of our U.S. federal, state and local deferred tax assets was $13 million, primarilyrelated to state tax loss and credit carryforwards, and our valuation allowance on our foreign deferred tax assetswas $969 million. At December 31, 2018, our valuation allowance on certain U.S. federal, state and localdeferred tax assets was $113 million and our valuation allowance on our foreign deferred tax assets was$204 million.
We record a reduction to the carrying amounts of deferred tax assets by recording a valuation allowance if, basedon the available evidence, it is more likely than not such assets will not be realized. The valuation of deferred taxassets requires judgment in assessing future profitability and the tax consequences of events that have beenrecognized in either our financial statements or tax returns.
We consider both positive and negative evidence when measuring the need for a valuation allowance. The weightgiven to the evidence is commensurate with the extent to which it may be objectively verified. Current and
15
cumulative financial reporting results are a source of objectively verifiable evidence. We give operating resultsduring the most recent three-year period a significant weight in our analysis. We typically only consider forecastsof future profitability when positive cumulative operating results exist in the most recent three-year period. Weperform scheduling exercises to determine if sufficient taxable income of the appropriate character exists in theperiods required in order to realize our deferred tax assets with limited lives (such as tax loss carryforwards andtax credits) prior to their expiration. We consider tax planning strategies available to accelerate taxable amountsif required to utilize expiring deferred tax assets. A valuation allowance is not required to the extent that, in ourjudgment, positive evidence exists with a magnitude and duration sufficient to result in a conclusion that it ismore likely than not that our deferred tax assets will be realized.
At December 31, 2019, our net deferred tax assets include $403 million of foreign tax credits, net of a valuationallowance of $3 million, as compared to $637 million, net of a valuation allowance of $103 million, atDecember 31, 2018. If not utilized, these foreign tax credits will expire from 2022 to 2028. These credits weregenerated primarily from the receipt of foreign dividends. Our earnings and forecasts of future profitability alongwith three significant sources of foreign income provide us sufficient positive evidence to utilize these credits,despite the negative evidence of their limited carryforward periods. Those sources of foreign income are (1)100% of our domestic profitability can be re-characterized as foreign source income under current U.S. tax lawto the extent domestic losses have offset foreign source income in prior years, (2) annual net foreign sourceincome, exclusive of dividends, primarily from royalties, and (3) tax planning strategies, including capitalizingresearch and development costs, accelerating income on cross border sales of inventory or raw materials to oursubsidiaries and reducing U.S. interest expense by, for example, reducing intercompany loans throughrepatriating current year earnings of foreign subsidiaries, all of which would increase our domestic profitability.
We considered our current forecasts of future profitability in assessing our ability to realize our remaining netforeign tax credits. These forecasts include the impact of recent trends, including various macroeconomic factorssuch as raw material prices, on our profitability, as well as the impact of tax planning strategies. Macroeconomicfactors, including raw material prices, possess a high degree of volatility and can significantly impact ourprofitability. As such, there is a risk that future foreign source income will not be sufficient to fully utilize theseforeign tax credits. However, we believe our forecasts of future profitability along with the three significantsources of foreign income described above provide us sufficient positive evidence to conclude that it is morelikely than not that our foreign tax credits, net of remaining valuation allowances, will be fully utilized prior totheir various expiration dates.
We recognize the effects of changes in tax rates and laws on deferred tax balances in the period in whichlegislation is enacted. We remeasure existing deferred tax assets and liabilities considering the tax rates at whichthey will be realized. We also consider the effects of enacted tax laws in our analysis of the need for valuationallowances.
Effective January 1, 2018, the Tax Act subjects a U.S. parent to current tax on its “global intangible low-taxedincome” (“GILTI”). To the extent that we incur expense under the GILTI provisions, we will treat it as acomponent of income tax expense in the period incurred.
The calculation of our tax liabilities involves dealing with uncertainties in the application of complex taxregulations, including those for transfer pricing. We recognize liabilities for anticipated tax audit issues based onour estimate of whether, and the extent to which, additional taxes will be due. If we ultimately determine thatpayment of these amounts is unnecessary, we reverse the liability and recognize a tax benefit during the period inwhich we determine that the liability is no longer necessary. We also recognize income tax benefits to the extentthat it is more likely than not that our positions will be sustained when challenged by the taxing authorities. Wederecognize income tax benefits when, based on new information, we determine that it is no longer more likelythan not that our position will be sustained. To the extent we prevail in matters for which liabilities have beenestablished, or determine we need to derecognize tax benefits recorded in prior periods, our results of operationsand effective tax rate in a given period could be materially affected. An unfavorable tax settlement would requireuse of our cash, and lead to recognition of expense to the extent the settlement amount exceeds recordedliabilities, resulting in an increase in our effective tax rate in the period of resolution. To reduce our risk of an
16
unfavorable transfer price settlement, the Company applies consistent transfer pricing policies and practicesglobally, supports pricing with economic studies and seeks advance pricing agreements and joint audits to theextent possible. A favorable tax settlement would be recognized as a reduction of expense to the extent thesettlement amount is lower than recorded liabilities and, in the case of an income tax settlement, would result in areduction in our effective tax rate in the period of resolution. We report interest and penalties related to uncertainincome tax positions as income tax expense.
For additional information regarding uncertain income tax positions and valuation allowances, refer to Note tothe Consolidated Financial Statements No. 6, Income Taxes.
Pensions and Other Postretirement Benefits. We have recorded liabilities for pension and other postretirementbenefits of $684 million and $241 million, respectively, at December 31, 2019. Our recorded liabilities and netperiodic costs for pensions and other postretirement benefits are based on a number of assumptions, including:
• life expectancies,• retirement rates,• discount rates,• long term rates of return on plan assets,• inflation rates,• future compensation levels,• future health care costs, and• maximum company-covered benefit costs.
Certain of these assumptions are determined with the assistance of independent actuaries. Assumptions about lifeexpectancies, retirement rates, future compensation levels and future health care costs are based on pastexperience and anticipated future trends. The discount rate for our U.S. plans is based on a yield curve derivedfrom a portfolio of corporate bonds from issuers rated AA or higher as of December 31 and is reviewed annually.Our expected benefit payment cash flows are discounted based on spot rates developed from the yield curve. Themortality assumption for our U.S. plans is based on actual historical experience, an assumed long term rate offuture improvement based on published actuarial tables, and current government regulations related to lump sumpayment factors. The long term rate of return on U.S. plan assets is based on estimates of future long term ratesof return similar to the target allocation of substantially all fixed income securities. Actual U.S. pension fundasset allocations are reviewed on a monthly basis and the pension fund is rebalanced to target ranges on anas-needed basis. These assumptions are reviewed regularly and revised when appropriate. Changes in one ormore of them may affect the amount of our recorded liabilities and net periodic costs for these benefits. Otherassumptions involving demographic factors such as retirement age and turnover are evaluated periodically andare updated to reflect our experience and expectations for the future. If actual experience differs fromexpectations, our financial position, results of operations and liquidity in future periods may be affected.
The weighted average discount rate used in estimating the total liability for our U.S. pension and otherpostretirement benefit plans was 3.22% and 3.14%, respectively, at December 31, 2019, compared to 4.24% and4.16%, respectively, at December 31, 2018. The decrease in the discount rate at December 31, 2019 was dueprimarily to lower yields on highly rated corporate bonds. Interest cost included in our U.S. net periodic pensioncost was $173 million in 2019, compared to $157 million in 2018 and $160 million in 2017. Interest costincluded in our worldwide net periodic other postretirement benefits cost was $11 million in 2019, compared to$12 million in 2018 and $13 million in 2017.
17
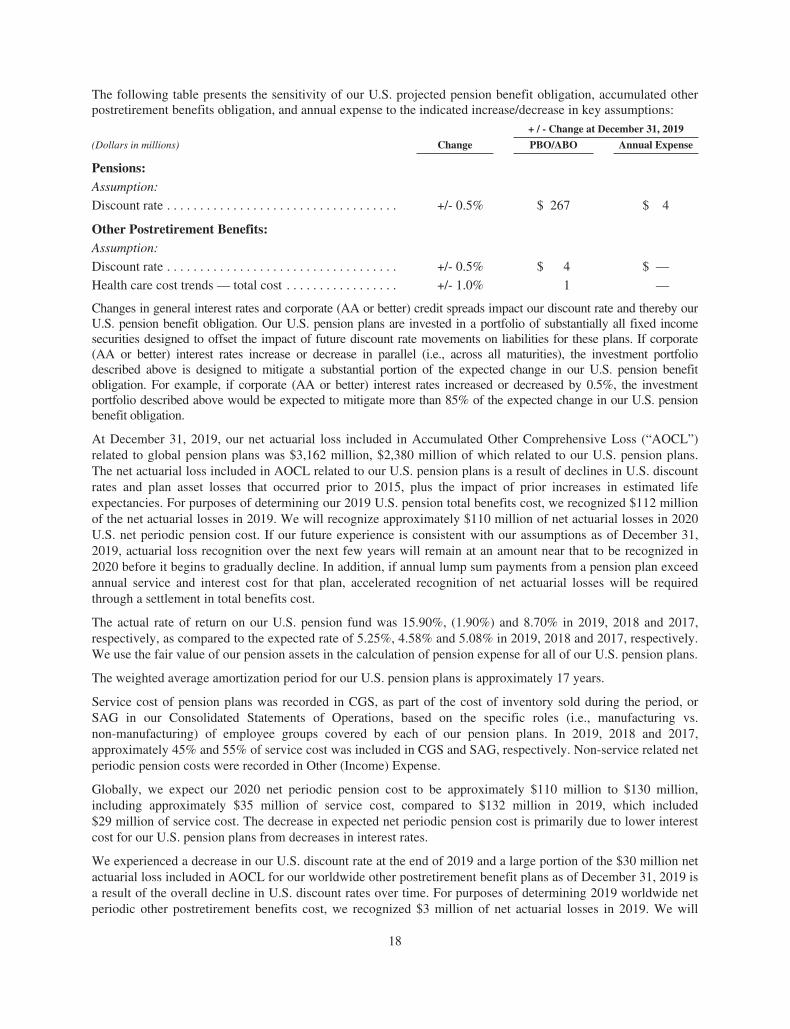
The following table presents the sensitivity of our U.S. projected pension benefit obligation, accumulated otherpostretirement benefits obligation, and annual expense to the indicated increase/decrease in key assumptions:
+ / - Change at December 31, 2019
(Dollars in millions) Change PBO/ABO Annual Expense
Pensions:Assumption:
Discount rate . . . . . . . . . . . . . . . . . . . . . . . . . . . . . . . . . . . +/- 0.5% $ 267 $ 4
Other Postretirement Benefits:Assumption:
Discount rate . . . . . . . . . . . . . . . . . . . . . . . . . . . . . . . . . . . +/- 0.5% $ 4 $ —
Health care cost trends — total cost . . . . . . . . . . . . . . . . . +/- 1.0% 1 —
Changes in general interest rates and corporate (AA or better) credit spreads impact our discount rate and thereby ourU.S. pension benefit obligation. Our U.S. pension plans are invested in a portfolio of substantially all fixed incomesecurities designed to offset the impact of future discount rate movements on liabilities for these plans. If corporate(AA or better) interest rates increase or decrease in parallel (i.e., across all maturities), the investment portfoliodescribed above is designed to mitigate a substantial portion of the expected change in our U.S. pension benefitobligation. For example, if corporate (AA or better) interest rates increased or decreased by 0.5%, the investmentportfolio described above would be expected to mitigate more than 85% of the expected change in our U.S. pensionbenefit obligation.
At December 31, 2019, our net actuarial loss included in Accumulated Other Comprehensive Loss (“AOCL”)related to global pension plans was $3,162 million, $2,380 million of which related to our U.S. pension plans.The net actuarial loss included in AOCL related to our U.S. pension plans is a result of declines in U.S. discountrates and plan asset losses that occurred prior to 2015, plus the impact of prior increases in estimated lifeexpectancies. For purposes of determining our 2019 U.S. pension total benefits cost, we recognized $112 millionof the net actuarial losses in 2019. We will recognize approximately $110 million of net actuarial losses in 2020U.S. net periodic pension cost. If our future experience is consistent with our assumptions as of December 31,2019, actuarial loss recognition over the next few years will remain at an amount near that to be recognized in2020 before it begins to gradually decline. In addition, if annual lump sum payments from a pension plan exceedannual service and interest cost for that plan, accelerated recognition of net actuarial losses will be requiredthrough a settlement in total benefits cost.
The actual rate of return on our U.S. pension fund was 15.90%, (1.90%) and 8.70% in 2019, 2018 and 2017,respectively, as compared to the expected rate of 5.25%, 4.58% and 5.08% in 2019, 2018 and 2017, respectively.We use the fair value of our pension assets in the calculation of pension expense for all of our U.S. pension plans.
The weighted average amortization period for our U.S. pension plans is approximately 17 years.
Service cost of pension plans was recorded in CGS, as part of the cost of inventory sold during the period, orSAG in our Consolidated Statements of Operations, based on the specific roles (i.e., manufacturing vs.non-manufacturing) of employee groups covered by each of our pension plans. In 2019, 2018 and 2017,approximately 45% and 55% of service cost was included in CGS and SAG, respectively. Non-service related netperiodic pension costs were recorded in Other (Income) Expense.
Globally, we expect our 2020 net periodic pension cost to be approximately $110 million to $130 million,including approximately $35 million of service cost, compared to $132 million in 2019, which included$29 million of service cost. The decrease in expected net periodic pension cost is primarily due to lower interestcost for our U.S. pension plans from decreases in interest rates.
We experienced a decrease in our U.S. discount rate at the end of 2019 and a large portion of the $30 million netactuarial loss included in AOCL for our worldwide other postretirement benefit plans as of December 31, 2019 isa result of the overall decline in U.S. discount rates over time. For purposes of determining 2019 worldwide netperiodic other postretirement benefits cost, we recognized $3 million of net actuarial losses in 2019. We will
18
recognize approximately $4 million of net actuarial losses in 2020. If our future experience is consistent with ourassumptions as of December 31, 2019, actuarial loss recognition over the next few years will remain at anamount near that to be recognized in 2020 before it begins to gradually decline.
For further information on pensions and other postretirement benefits, refer to Note to the Consolidated FinancialStatements No. 17, Pension, Other Postretirement Benefits and Savings Plans.
LIQUIDITY AND CAPITAL RESOURCES
OVERVIEW
Our primary sources of liquidity are cash generated from our operating and financing activities. Our cash flowsfrom operating activities are driven primarily by our operating results and changes in our working capitalrequirements and our cash flows from financing activities are dependent upon our ability to access credit or othercapital.
In the first quarter of 2019, we amended and restated our European revolving credit facility. Significant changesinclude extending the maturity to March 27, 2024, increasing the available commitments from €550 million to€800 million, decreasing the interest rate margin by 25 basis points and decreasing the annual commitment fee by5 basis points.
For further information on the other strategic initiatives we pursued in 2019, refer to “Management’s Discussionand Analysis of Financial Condition and Results of Operations — Overview.”
At December 31, 2019, we had $908 million of Cash and Cash Equivalents, compared to $801 million atDecember 31, 2018. The increase in cash and cash equivalents of $107 million was primarily due to cash flowsfrom operating activities of $1,207 million, driven by segment operating income of $945 million and cash fromworking capital of $82 million. These sources of cash were partially offset by cash used in investing activities of$800 million, primarily reflecting capital expenditures of $770 million, and cash used in financing activities of$307 million, primarily due to cash used for dividends of $148 million and net debt repayments of $119 million.
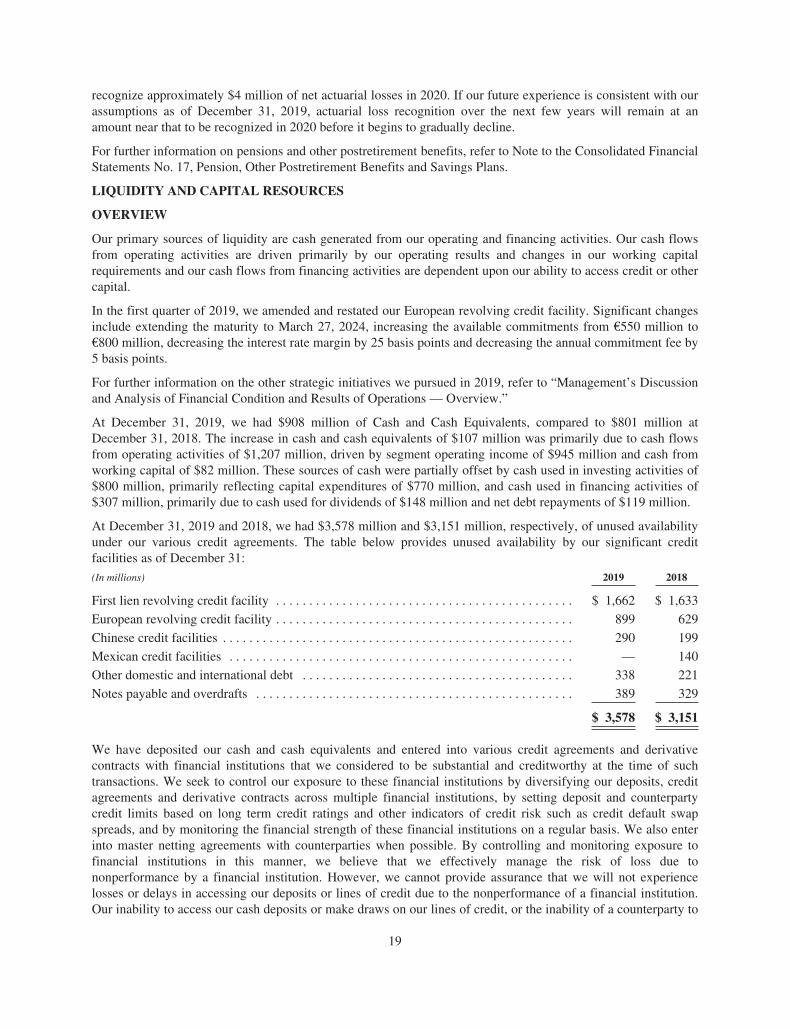
At December 31, 2019 and 2018, we had $3,578 million and $3,151 million, respectively, of unused availabilityunder our various credit agreements. The table below provides unused availability by our significant creditfacilities as of December 31:
(In millions) 2019 2018
First lien revolving credit facility . . . . . . . . . . . . . . . . . . . . . . . . . . . . . . . . . . . . . . . . . . . . . $ 1,662 $ 1,633
European revolving credit facility . . . . . . . . . . . . . . . . . . . . . . . . . . . . . . . . . . . . . . . . . . . . . 899 629
Chinese credit facilities . . . . . . . . . . . . . . . . . . . . . . . . . . . . . . . . . . . . . . . . . . . . . . . . . . . . . 290 199
Mexican credit facilities . . . . . . . . . . . . . . . . . . . . . . . . . . . . . . . . . . . . . . . . . . . . . . . . . . . . — 140
Other domestic and international debt . . . . . . . . . . . . . . . . . . . . . . . . . . . . . . . . . . . . . . . . . 338 221
Notes payable and overdrafts . . . . . . . . . . . . . . . . . . . . . . . . . . . . . . . . . . . . . . . . . . . . . . . . 389 329
$ 3,578 $ 3,151
We have deposited our cash and cash equivalents and entered into various credit agreements and derivativecontracts with financial institutions that we considered to be substantial and creditworthy at the time of suchtransactions. We seek to control our exposure to these financial institutions by diversifying our deposits, creditagreements and derivative contracts across multiple financial institutions, by setting deposit and counterpartycredit limits based on long term credit ratings and other indicators of credit risk such as credit default swapspreads, and by monitoring the financial strength of these financial institutions on a regular basis. We also enterinto master netting agreements with counterparties when possible. By controlling and monitoring exposure tofinancial institutions in this manner, we believe that we effectively manage the risk of loss due tononperformance by a financial institution. However, we cannot provide assurance that we will not experiencelosses or delays in accessing our deposits or lines of credit due to the nonperformance of a financial institution.Our inability to access our cash deposits or make draws on our lines of credit, or the inability of a counterparty to
19
fulfill its contractual obligations to us, could have a material adverse effect on our liquidity, financial conditionor results of operations in the period in which it occurs.
We expect our 2020 cash flow needs to include capital expenditures of approximately $800 million. We alsoexpect interest expense to range between $350 million and $375 million, restructuring payments to be$125 million to $150 million, dividends on our common stock to be approximately $150 million, andcontributions to our funded non-U.S. pension plans to be $25 million to $50 million. We expect working capitalto be a use of cash of $50 million to $100 million in 2020. We intend to operate the business in a way that allowsus to address these needs with our existing cash and available credit if they cannot be funded by cash generatedfrom operations.
We believe that our liquidity position is adequate to fund our operating and investing needs and debt maturities in2020 and to provide us with flexibility to respond to further changes in the business environment.
Our ability to service debt and operational requirements is also dependent, in part, on the ability of oursubsidiaries to make distributions of cash to various other entities in our consolidated group, whether in the formof dividends, loans or otherwise. In certain countries where we operate, such as China and South Africa, transfersof funds into or out of such countries by way of dividends, loans, advances or payments to third-party oraffiliated suppliers are generally or periodically subject to certain requirements, such as obtaining approval fromthe foreign government and/or currency exchange board before net assets can be transferred out of the country. Inaddition, certain of our credit agreements and other debt instruments limit the ability of foreign subsidiaries tomake distributions of cash. Thus, we would have to repay and/or amend these credit agreements and other debtinstruments in order to use this cash to service our consolidated debt. Because of the inherent uncertainty ofsatisfactorily meeting these requirements or limitations, we do not consider the net assets of our subsidiaries,including our Chinese and South African subsidiaries, which are subject to such requirements or limitations, tobe integral to our liquidity or our ability to service our debt and operational requirements. At December 31, 2019,approximately $711 million of net assets, including $102 million of cash and cash equivalents, were subject tosuch requirements. The requirements we must comply with to transfer funds out of China and South Africa havenot adversely impacted our ability to make transfers out of those countries.
Cash Position
At December 31, 2019, significant concentrations of cash and cash equivalents held by our internationalsubsidiaries included the following amounts:
• $337 million or 37% in Asia Pacific, primarily China, India and Japan ($278 million or 35% atDecember 31, 2018),
• $214 million or 24% in EMEA, primarily Belgium ($261 million or 33% at December 31, 2018), and
• $190 million or 21% in Americas, primarily Brazil, Canada and Chile ($134 million or 17% atDecember 31, 2018).
Operating Activities
Net cash provided by operating activities was $1,207 million in 2019, increasing $291 million compared to netcash provided by operating activities of $916 million in 2018.
The increase in net cash provided by operating activities was driven by an increase in cash provided by workingcapital of $202 million and lower cash payments for rationalizations of $115 million, reflecting cash paymentsmade during 2018 related to the closure of our tire manufacturing facility in Philippsburg, Germany. Also, cashflows from operating activities were favorably impacted by an increase in Balance Sheet accruals forCompensation and Benefits of $210 million, primarily due to higher wages and benefits, including higherincentive compensation, and a lower decrease in Other Current Liabilities in 2019 as compared to 2018 providinga net benefit of $131 million, primarily due to changes in indirect taxes. These impacts were partially offset by adecrease in operating income from our SBUs of $329 million.
Working capital was a source of cash of $82 million in 2019 as compared to a use of cash of $120 million in2018, reflecting the Company’s continued focus on reducing working capital, including actions taken with our
20
vendors and customers related to accounts payable and accounts receivable and managing production levels, aswell as the impact of moderating raw material prices during 2019.
Investing Activities
Net cash used by investing activities was $800 million in 2019, compared to $867 million in 2018. Capitalexpenditures were $770 million in 2019, compared to $811 million in 2018. Beyond expenditures required tosustain our facilities, capital expenditures in 2019 and 2018 primarily related to investments in additional 17-inchand above capacity around the world.
Financing Activities
Net cash used by financing activities was $307 million in 2019, compared to $243 million in 2018. Financingactivities in 2019 included net debt repayments of $119 million. Financing activities in 2018 included netborrowings of $135 million. We paid dividends on our common stock of $148 million and $138 million in 2019and 2018, respectively. We repurchased $220 million of our common stock in 2018 and did not repurchase anyshares in 2019.
Credit Sources
In aggregate, we had total credit arrangements of $9,078 million available at December 31, 2019, of which$3,578 million were unused, compared to $8,971 million available at December 31, 2018, of which$3,151 million were unused. At December 31, 2019, we had long term credit arrangements totaling$8,320 million, of which $3,189 million were unused, compared to $8,212 million and $2,822 million,respectively, at December 31, 2018. At December 31, 2019, we had short term committed and uncommittedcredit arrangements totaling $758 million, of which $389 million were unused, compared to $759 million and$329 million, respectively, at December 31, 2018. The continued availability of the short term uncommittedarrangements is at the discretion of the relevant lender and may be terminated at any time.
Outstanding Notes
At December 31, 2019, we had $3,311 million of outstanding notes, compared to $3,314 million at December 31,2018.
$2.0 Billion Amended and Restated First Lien Revolving Credit Facility due 2021
Our amended and restated first lien revolving credit facility is available in the form of loans or letters of credit, withletter of credit availability limited to $800 million. Availability under the facility is subject to a borrowing base, whichis based primarily on (i) eligible accounts receivable and inventory of The Goodyear Tire & Rubber Company andcertain of its U.S. and Canadian subsidiaries, (ii) the value of our principal trademarks, and (iii) certain cash in anamount not to exceed $200 million. To the extent that our eligible accounts receivable and inventory and othercomponents of the borrowing base decline in value, our borrowing base will decrease and the availability under thefacility may decrease below $2.0 billion. In addition, if the amount of outstanding borrowings and letters of creditunder the facility exceeds the borrowing base, we are required to prepay borrowings and/or cash collateralize letters ofcredit sufficient to eliminate the excess. As of December 31, 2019, our borrowing base, and therefore our availability,under the facility was $301 million below the facility’s stated amount of $2.0 billion. Based on our current liquidity,amounts drawn under this facility bear interest at LIBOR plus 125 basis points, and undrawn amounts under the facilitywill be subject to an annual commitment fee of 30 basis points.
At December 31, 2019 and 2018, we had no borrowings and $37 million of letters of credit issued under therevolving credit facility.
During 2016, we began entering into bilateral letter of credit agreements. At December 31, 2019, we had$351 million in letters of credit issued under bilateral credit agreements.
Amended and Restated Second Lien Term Loan Facility due 2025
Our amended and restated second lien term loan facility matures on March 7, 2025. The term loan bears interest,at our option, at (i) 200 basis points over LIBOR or (ii) 100 basis points over an alternative base rate (the higher
21
of (a) the prime rate, (b) the federal funds effective rate or the overnight bank funding rate plus 50 basis points or(c) LIBOR plus 100 basis points). In addition, if the Total Leverage Ratio is equal to or less than 1.25 to 1.00, wehave the option to further reduce the spreads described above by 25 basis points. “Total Leverage Ratio” has themeaning given it in the facility.
At December 31, 2019 and 2018, the amounts outstanding under this facility were $400 million.
€800 Million Amended and Restated Senior Secured European Revolving Credit Facility due 2024
On March 27, 2019, we amended and restated our European revolving credit facility. Significant changes to theEuropean revolving credit facility include extending the maturity to March 27, 2024, increasing the availablecommitments thereunder from €550 million to €800 million, decreasing the interest rate margin by 25 basispoints and decreasing the annual commitment fee by 5 basis points to 25 basis points. Loans will now bearinterest at LIBOR plus 150 basis points for loans denominated in U.S. dollars or pounds sterling and EURIBORplus 150 basis points for loans denominated in euros.
The European revolving credit facility consists of (i) a €180 million German tranche that is available only toGoodyear Dunlop Tires Germany GmbH (“GDTG”) and (ii) a €620 million all-borrower tranche that is availableto Goodyear Europe B.V. (“GEBV”), GDTG and Goodyear Dunlop Tires Operations S.A. Up to €175 million ofswingline loans and €75 million in letters of credit are available for issuance under the all-borrower tranche.Subject to the consent of the lenders whose commitments are to be increased, we may request that the facility beincreased by up to €200 million.
At December 31, 2019 and 2018, there were no borrowings and no letters of credit outstanding under theEuropean revolving credit facility.
Each of our first lien revolving credit facility and our European revolving credit facility have customaryrepresentations and warranties including, as a condition to borrowing, that all such representations and warrantiesare true and correct, in all material respects, on the date of the borrowing, including representations as to nomaterial adverse change in our business or financial condition since December 31, 2015 under the first lienfacility and December 31, 2018 under the European facility.
Accounts Receivable Securitization Facilities (On-Balance Sheet)
GEBV and certain other of our European subsidiaries are parties to a pan-European accounts receivablesecuritization facility that expires in 2023. The terms of the facility provide the flexibility to designate annuallythe maximum amount of funding available under the facility in an amount of not less than €30 million and notmore than €450 million. For the period from October 18, 2018 through October 15, 2020, the designatedmaximum amount of the facility is €320 million.
The facility involves the ongoing daily sale of substantially all of the trade accounts receivable of certain GEBVsubsidiaries. These subsidiaries retain servicing responsibilities. Utilization under this facility is based on eligiblereceivable balances.
The funding commitments under the facility will expire upon the earliest to occur of: (a) September 26, 2023, (b)the non-renewal and expiration (without substitution) of all of the back-up liquidity commitments, (c) the earlytermination of the facility according to its terms (generally upon an Early Amortisation Event (as defined in thefacility), which includes, among other things, events similar to the events of default under our senior securedcredit facilities; certain tax law changes; or certain changes to law, regulation or accounting standards), or (d) ourrequest for early termination of the facility. The facility’s current back-up liquidity commitments will expire onOctober 15, 2020.
At December 31, 2019, the amounts available and utilized under this program totaled $327 million (€291million). At December 31, 2018, the amounts available and utilized under this program totaled $335 million(€293 million). The program does not qualify for sale accounting, and accordingly, these amounts are included inLong Term Debt and Finance Leases.
22
Accounts Receivable Factoring Facilities (Off-Balance Sheet)
We have sold certain of our trade receivables under off-balance sheet programs. For these programs, we haveconcluded that there is generally no risk of loss to us from non-payment of the sold receivables. At December 31,2019 and 2018, the amount of receivables sold was $548 million and $568 million, respectively.
Supplier Financing
We have entered into payment processing agreements with several financial institutions. Under these agreements, thefinancial institution acts as our paying agent with respect to accounts payable due to our suppliers. These agreementsalso allow our suppliers to sell their receivables to the financial institutions at the sole discretion of both the supplierand the financial institution on terms that are negotiated between them. We are not always notified when our supplierssell receivables under these programs. Our obligations to our suppliers, including the amounts due and scheduledpayment dates, are not impacted by our suppliers’ decisions to sell their receivables under the program. Agreements forsuch supplier financing programs totaled up to $500 million at December 31, 2019 and 2018.
Further Information
After 2021, it is unclear whether banks will continue to provide LIBOR submissions to the administrator ofLIBOR, and no consensus currently exists as to what benchmark rate or rates may become accepted alternativesto LIBOR. In the United States, efforts to identify a set of alternative U.S. dollar reference interest rates includeproposals by the Alternative Reference Rates Committee that has been convened by the Federal Reserve Boardand the Federal Reserve Bank of New York. Additionally, the International Swaps and Derivatives Association,Inc. launched a consultation on technical issues related to new benchmark fallbacks for derivative contracts thatreference certain interbank offered rates, including LIBOR. We cannot currently predict the effect of thediscontinuation of, or other changes to, LIBOR or any establishment of alternative reference rates in the UnitedStates, the European Union or elsewhere on the global capital markets. The uncertainty regarding the future ofLIBOR, as well as the transition from LIBOR to any alternative reference rate or rates, could have adverseimpacts on floating rate obligations, loans, deposits, derivatives and other financial instruments that currently useLIBOR as a benchmark rate. We are in the process of evaluating our financing obligations and other contractsthat refer to LIBOR. Our second lien term loan facility and our European revolving credit facility, whichconstitute the most significant of our LIBOR-based debt obligations that mature after 2021, contain “fallback”provisions that address the potential discontinuation of LIBOR and facilitate the adoption of an alternate rate ofinterest. Our first lien revolving credit facility matures in 2021 and we have not issued any long term floating ratenotes. Our first lien revolving credit facility and second lien term loan facility also contain express provisions forthe use, at our option, of an alternative base rate (the higher of (a) the prime rate, (b) the federal funds effectiverate or the overnight bank funding rate plus 50 basis points or (c) LIBOR plus 100 basis points). We do notbelieve that the discontinuation of LIBOR, or its replacement with an alternative reference rate or rates, will havea material impact on our results of operations, financial position or liquidity.
For a further description of the terms of our outstanding notes, first lien revolving credit facility, second lien termloan facility, European revolving credit facility and pan-European accounts receivable securitization facility,refer to Note to the Consolidated Financial Statements No. 15, Financing Arrangements and Derivative FinancialInstruments.
Covenant Compliance
Our first and second lien credit facilities and some of the indentures governing our notes contain certaincovenants that, among other things, limit our ability to incur additional debt or issue redeemable preferred stock,pay dividends, repurchase shares or make certain other restricted payments or investments, incur liens, sellassets, incur restrictions on the ability of our subsidiaries to pay dividends or to make other payments to us, enterinto affiliate transactions, engage in sale and leaseback transactions, and consolidate, merge, sell or otherwisedispose of all or substantially all of our assets. These covenants are subject to significant exceptions andqualifications. Our first and second lien credit facilities and the indentures governing our notes also havecustomary defaults, including cross-defaults to material indebtedness of Goodyear and its subsidiaries.
23
We have additional financial covenants in our first and second lien credit facilities that are currently notapplicable. We only become subject to these financial covenants when certain events occur. These financialcovenants and related events are as follows:
• We become subject to the financial covenant contained in our first lien revolving credit facility when theaggregate amount of our Parent Company (The Goodyear Tire & Rubber Company) and guarantorsubsidiaries cash and cash equivalents (“Available Cash”) plus our availability under our first lienrevolving credit facility is less than $200 million. If this were to occur, our ratio of EBITDA toConsolidated Interest Expense may not be less than 2.0 to 1.0 for the most recent period of fourconsecutive fiscal quarters. As of December 31, 2019, our availability under this facility of $1,662 millionplus our Available Cash of $211 million totaled $1,873 million, which is in excess of $200 million.
• We become subject to a covenant contained in our second lien credit facility upon certain asset sales. Thecovenant provides that, before we use cash proceeds from certain asset sales to repay any junior lien,senior unsecured or subordinated indebtedness, we must first offer to use such cash proceeds to prepayborrowings under the second lien credit facility unless our ratio of Consolidated Net Secured Indebtednessto EBITDA (Pro Forma Senior Secured Leverage Ratio) for any period of four consecutive fiscal quartersis equal to or less than 3.0 to 1.0.
In addition, our European revolving credit facility contains non-financial covenants similar to the non-financialcovenants in our first and second lien credit facilities that are described above and a financial covenant applicableonly to GEBV and its subsidiaries. This financial covenant provides that we are not permitted to allow GEBV’sratio of Consolidated Net GEBV Indebtedness to Consolidated GEBV EBITDA for a period of four consecutivefiscal quarters to be greater than 3.0 to 1.0 at the end of any fiscal quarter. Consolidated Net GEBV Indebtednessis determined net of the sum of cash and cash equivalents in excess of $100 million held by GEBV and itssubsidiaries, cash and cash equivalents in excess of $150 million held by the Parent Company and its U.S.subsidiaries, and availability under our first lien revolving credit facility if the ratio of EBITDA to ConsolidatedInterest Expense described above is not applicable and the conditions to borrowing under the first lien revolvingcredit facility are met. Consolidated Net GEBV Indebtedness also excludes loans from other consolidatedGoodyear entities. This financial covenant is also included in our pan-European accounts receivablesecuritization facility. At December 31, 2019, we were in compliance with this financial covenant.
Our credit facilities also state that we may only incur additional debt or make restricted payments that are nototherwise expressly permitted if, after giving effect to the debt incurrence or the restricted payment, our ratio ofEBITDA to Consolidated Interest Expense for the prior four fiscal quarters would exceed 2.0 to 1.0. Certain ofour senior note indentures have substantially similar limitations on incurring debt and making restrictedpayments. Our credit facilities and indentures also permit the incurrence of additional debt through otherprovisions in those agreements without regard to our ability to satisfy the ratio-based incurrence test describedabove. We believe that these other provisions provide us with sufficient flexibility to incur additional debtnecessary to meet our operating, investing and financing needs without regard to our ability to satisfy the ratio-based incurrence test.
Covenants could change based upon a refinancing or amendment of an existing facility, or additional covenantsmay be added in connection with the incurrence of new debt.
As of December 31, 2019, we were in compliance with the currently applicable material covenants imposed byour principal credit facilities and indentures.
The terms “Available Cash,” “EBITDA,” “Consolidated Interest Expense,” “Consolidated Net SecuredIndebtedness,” “Pro Forma Senior Secured Leverage Ratio,” “Consolidated Net GEBV Indebtedness” and“Consolidated GEBV EBITDA” have the meanings given them in the respective credit facilities.
Potential Future Financings
In addition to our previous financing activities, we may seek to undertake additional financing actions whichcould include restructuring bank debt or capital markets transactions, possibly including the issuance of
24
additional debt or equity. Given the inherent uncertainty of market conditions, access to the capital marketscannot be assured.
Our future liquidity requirements may make it necessary for us to incur additional debt. However, a substantialportion of our assets are already subject to liens securing our indebtedness. As a result, we are limited in ourability to pledge our remaining assets as security for additional secured indebtedness. In addition, no assurancecan be given as to our ability to raise additional unsecured debt.
Dividends and Common Stock Repurchase Program
Under our primary credit facilities and some of our note indentures, we are permitted to pay dividends on andrepurchase our capital stock (which constitute restricted payments) as long as no default will have occurred andbe continuing, additional indebtedness can be incurred under the credit facilities or indentures following thepayment, and certain financial tests are satisfied.
During 2019, 2018 and 2017 we paid cash dividends of $148 million, $138 million and $110 million,respectively, on our common stock. On January 14, 2020, the Company’s Board of Directors (or a dulyauthorized committee thereof) declared cash dividends of $0.16 per share of our common stock, orapproximately $37 million in the aggregate. The cash dividend will be paid on March 2, 2020 to stockholders ofrecord as of the close of business on February 3, 2020. Future quarterly dividends are subject to Board approval.
On September 18, 2013, the Board of Directors approved our common stock repurchase program and, from timeto time, approved increases in the amount authorized to be purchased under that program. The program expiredon December 31, 2019. During 2019, we did not repurchase any shares under this program. Since 2013, werepurchased 52,905,959 shares at an average price, including commissions, of $28.99 per share, or$1,534 million in the aggregate.
The restrictions imposed by our credit facilities and indentures did not affect our ability to pay the dividends onor repurchase our capital stock as described above, and are not expected to affect our ability to pay similardividends or make similar repurchases in the future.
Asset Dispositions
The restrictions on asset sales imposed by our material indebtedness have not affected our ability to divestnon-core businesses, and those divestitures have not affected our ability to comply with those restrictions.
25
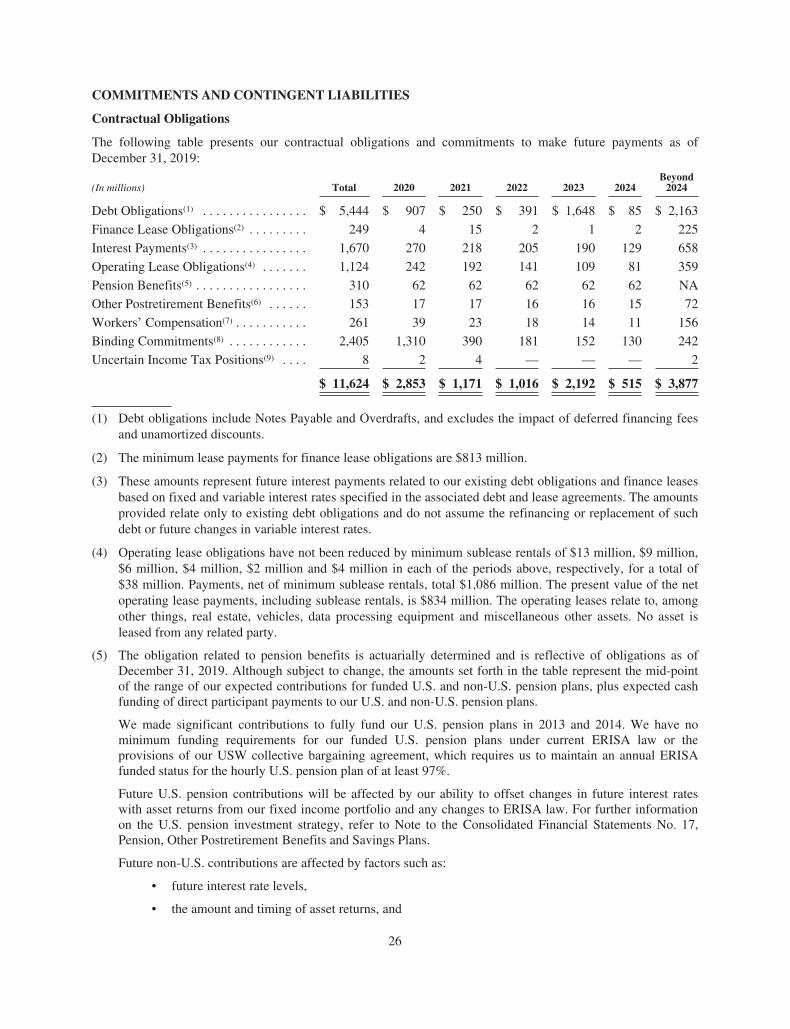
COMMITMENTS AND CONTINGENT LIABILITIES
Contractual Obligations
The following table presents our contractual obligations and commitments to make future payments as ofDecember 31, 2019:
(In millions) Total 2020 2021 2022 2023 2024Beyond
2024
Debt Obligations(1) . . . . . . . . . . . . . . . . $ 5,444 $ 907 $ 250 $ 391 $ 1,648 $ 85 $ 2,163
Finance Lease Obligations(2) . . . . . . . . . 249 4 15 2 1 2 225
Interest Payments(3) . . . . . . . . . . . . . . . . 1,670 270 218 205 190 129 658
Operating Lease Obligations(4) . . . . . . . 1,124 242 192 141 109 81 359
Pension Benefits(5) . . . . . . . . . . . . . . . . . 310 62 62 62 62 62 NA
Other Postretirement Benefits(6) . . . . . . 153 17 17 16 16 15 72
Workers’ Compensation(7) . . . . . . . . . . . 261 39 23 18 14 11 156
Binding Commitments(8) . . . . . . . . . . . . 2,405 1,310 390 181 152 130 242
Uncertain Income Tax Positions(9) . . . . 8 2 4 — — — 2
$ 11,624 $ 2,853 $ 1,171 $ 1,016 $ 2,192 $ 515 $ 3,877
(1) Debt obligations include Notes Payable and Overdrafts, and excludes the impact of deferred financing feesand unamortized discounts.
(2) The minimum lease payments for finance lease obligations are $813 million.
(3) These amounts represent future interest payments related to our existing debt obligations and finance leasesbased on fixed and variable interest rates specified in the associated debt and lease agreements. The amountsprovided relate only to existing debt obligations and do not assume the refinancing or replacement of suchdebt or future changes in variable interest rates.
(4) Operating lease obligations have not been reduced by minimum sublease rentals of $13 million, $9 million,$6 million, $4 million, $2 million and $4 million in each of the periods above, respectively, for a total of$38 million. Payments, net of minimum sublease rentals, total $1,086 million. The present value of the netoperating lease payments, including sublease rentals, is $834 million. The operating leases relate to, amongother things, real estate, vehicles, data processing equipment and miscellaneous other assets. No asset isleased from any related party.
(5) The obligation related to pension benefits is actuarially determined and is reflective of obligations as ofDecember 31, 2019. Although subject to change, the amounts set forth in the table represent the mid-pointof the range of our expected contributions for funded U.S. and non-U.S. pension plans, plus expected cashfunding of direct participant payments to our U.S. and non-U.S. pension plans.
We made significant contributions to fully fund our U.S. pension plans in 2013 and 2014. We have nominimum funding requirements for our funded U.S. pension plans under current ERISA law or theprovisions of our USW collective bargaining agreement, which requires us to maintain an annual ERISAfunded status for the hourly U.S. pension plan of at least 97%.
Future U.S. pension contributions will be affected by our ability to offset changes in future interest rateswith asset returns from our fixed income portfolio and any changes to ERISA law. For further informationon the U.S. pension investment strategy, refer to Note to the Consolidated Financial Statements No. 17,Pension, Other Postretirement Benefits and Savings Plans.
Future non-U.S. contributions are affected by factors such as:
• future interest rate levels,
• the amount and timing of asset returns, and
26
• how contributions in excess of the minimum requirements could impact the amount and timing offuture contributions.
(6) The payments presented above are expected payments for the next 10 years. The payments for other postretirementbenefits reflect the estimated benefit payments of the plans using the provisions currently in effect. Under therelevant summary plan descriptions or plan documents we have the right to modify or terminate the plans. Theobligation related to other postretirement benefits is actuarially determined on an annual basis.
(7) The payments for workers’ compensation obligations are based upon recent historical payment patterns onclaims. The present value of anticipated claims payments for workers’ compensation is $198 million.
(8) Binding commitments are for raw materials, capital expenditures, utilities, and various other types ofcontracts. The obligations to purchase raw materials include supply contracts at both fixed and variableprices. Those with variable prices are based on index rates for those commodities at December 31, 2019.
(9) These amounts primarily represent expected payments with interest for uncertain income tax positions asof December 31, 2019. We have reflected them in the period in which we believe they will be ultimatelysettled based upon our experience with these matters.
Additional other long term liabilities include items such as general and product liabilities, environmentalliabilities and miscellaneous other long term liabilities. These other liabilities are not contractual obligations bynature. We cannot, with any degree of reliability, determine the years in which these liabilities might ultimatelybe settled. Accordingly, these other long term liabilities are not included in the above table.
In addition, pursuant to certain long term agreements, we will purchase varying amounts of certain raw materialsand finished goods at agreed upon base prices that may be subject to periodic adjustments for changes in rawmaterial costs and market price adjustments, or in quantities that may be subject to periodic adjustments forchanges in our or our suppliers’ production levels. These contingent contractual obligations, the amounts ofwhich cannot be estimated, are not included in the table above.
We do not engage in the trading of commodity contracts or any related derivative contracts. We generallypurchase raw materials and energy through short term, intermediate and long term supply contracts at fixedprices or at formula prices related to market prices or negotiated prices. We may, however, from time to time,enter into contracts to hedge our energy costs.
At December 31, 2019, we had an agreement to provide a revolving loan commitment to TireHub of $50 million.No amounts were drawn on that commitment as of December 31, 2019.
Off-Balance Sheet Arrangements
An off-balance sheet arrangement is any transaction, agreement or other contractual arrangement involving anunconsolidated entity under which a company has:
• made guarantees,
• retained or held a contingent interest in transferred assets,
• undertaken an obligation under certain derivative instruments, or
• undertaken any obligation arising out of a material variable interest in an unconsolidated entity thatprovides financing, liquidity, market risk or credit risk support to the company, or that engages in leasing,hedging or research and development arrangements with the company.
We have entered into certain arrangements under which we have provided guarantees that are off-balance sheetarrangements. Those guarantees totaled approximately $74 million at December 31, 2019. For furtherinformation about our guarantees, refer to Note to the Consolidated Financial Statements No. 19, Commitmentsand Contingent Liabilities.
27
FORWARD-LOOKING INFORMATION — SAFE HARBOR STATEMENT
Certain information in this Annual Report (other than historical data and information) may constitute forward-looking statements regarding events and trends that may affect our future operating results and financial position.The words “estimate,” “expect,” “intend” and “project,” as well as other words or expressions of similarmeaning, are intended to identify forward-looking statements. You are cautioned not to place undue reliance onforward-looking statements, which speak only as of the date of this Annual Report. Such statements are based oncurrent expectations and assumptions, are inherently uncertain, are subject to risks and should be viewed withcaution. Actual results and experience may differ materially from the forward-looking statements as a result ofmany factors, including:
• if we do not successfully implement our strategic initiatives, our operating results, financial condition andliquidity may be materially adversely affected;
• we face significant global competition and our market share could decline;
• deteriorating economic conditions in any of our major markets, or an inability to access capital markets orthird-party financing when necessary, may materially adversely affect our operating results, financialcondition and liquidity;
• raw material and energy costs may materially adversely affect our operating results and financialcondition;
• if we experience a labor strike, work stoppage or other similar event our business, results of operations,financial condition and liquidity could be materially adversely affected;
• our international operations have certain risks that may materially adversely affect our operating results,financial condition and liquidity;
• we have foreign currency translation and transaction risks that may materially adversely affect ouroperating results, financial condition and liquidity;
• our long term ability to meet our obligations, to repay maturing indebtedness or to implement strategicinitiatives may be dependent on our ability to access capital markets in the future and to improve ouroperating results;
• financial difficulties, work stoppages, supply disruptions or economic conditions affecting our major OEcustomers, dealers or suppliers could harm our business;
• our capital expenditures may not be adequate to maintain our competitive position and may not beimplemented in a timely or cost-effective manner;
• we have a substantial amount of debt, which could restrict our growth, place us at a competitivedisadvantage or otherwise materially adversely affect our financial health;
• any failure to be in compliance with any material provision or covenant of our debt instruments, or amaterial reduction in the borrowing base under our revolving credit facility, could have a material adverseeffect on our liquidity and operations;
• our variable rate indebtedness subjects us to interest rate risk, which could cause our debt serviceobligations to increase significantly;
• we have substantial fixed costs and, as a result, our operating income fluctuates disproportionately withchanges in our net sales;
• we may incur significant costs in connection with our contingent liabilities and tax matters;
• our reserves for contingent liabilities and our recorded insurance assets are subject to variousuncertainties, the outcome of which may result in our actual costs being significantly higher than theamounts recorded;
28
• we are subject to extensive government regulations that may materially adversely affect our operatingresults;
• we may be adversely affected by any disruption in, or failure of, our information technology systems dueto computer viruses, unauthorized access, cyber-attack, natural disasters or other similar disruptions;
• if we are unable to attract and retain key personnel, our business could be materially adverselyaffected; and
• we may be impacted by economic and supply disruptions associated with events beyond our control, suchas war, acts of terror, political unrest, public health concerns, labor disputes or natural disasters.
It is not possible to foresee or identify all such factors. We will not revise or update any forward-lookingstatement or disclose any facts, events or circumstances that occur after the date hereof that may affect theaccuracy of any forward-looking statement.
29
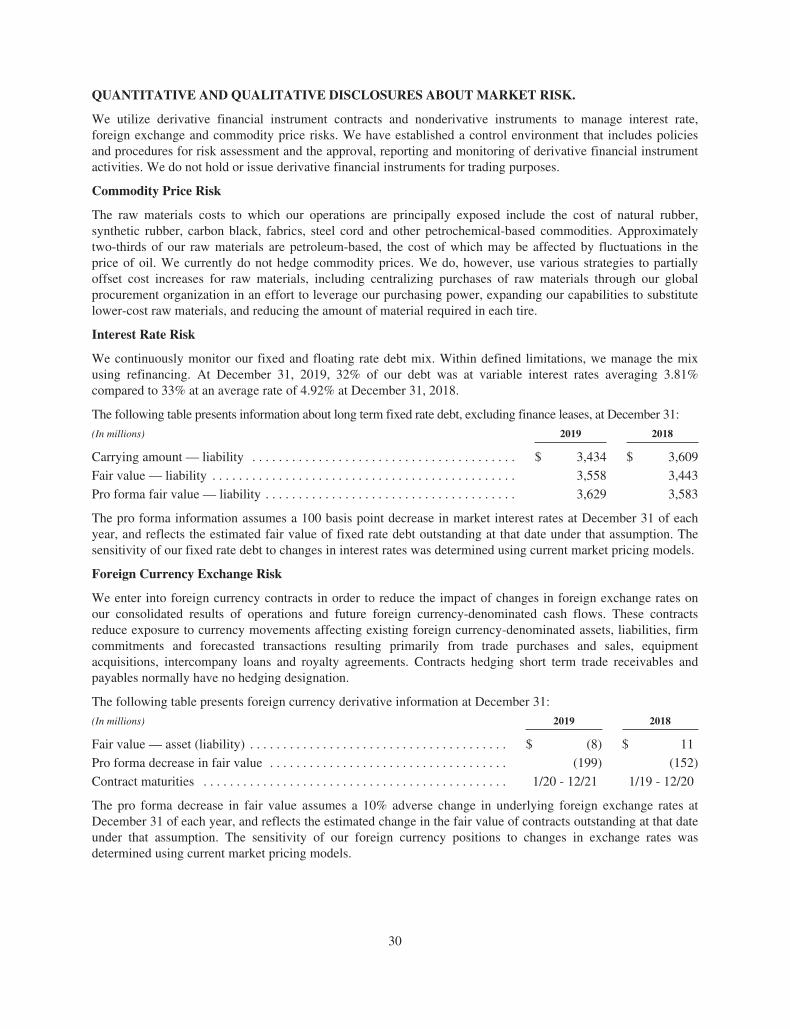
QUANTITATIVE AND QUALITATIVE DISCLOSURES ABOUT MARKET RISK.
We utilize derivative financial instrument contracts and nonderivative instruments to manage interest rate,foreign exchange and commodity price risks. We have established a control environment that includes policiesand procedures for risk assessment and the approval, reporting and monitoring of derivative financial instrumentactivities. We do not hold or issue derivative financial instruments for trading purposes.
Commodity Price Risk
The raw materials costs to which our operations are principally exposed include the cost of natural rubber,synthetic rubber, carbon black, fabrics, steel cord and other petrochemical-based commodities. Approximatelytwo-thirds of our raw materials are petroleum-based, the cost of which may be affected by fluctuations in theprice of oil. We currently do not hedge commodity prices. We do, however, use various strategies to partiallyoffset cost increases for raw materials, including centralizing purchases of raw materials through our globalprocurement organization in an effort to leverage our purchasing power, expanding our capabilities to substitutelower-cost raw materials, and reducing the amount of material required in each tire.
Interest Rate Risk
We continuously monitor our fixed and floating rate debt mix. Within defined limitations, we manage the mixusing refinancing. At December 31, 2019, 32% of our debt was at variable interest rates averaging 3.81%compared to 33% at an average rate of 4.92% at December 31, 2018.
The following table presents information about long term fixed rate debt, excluding finance leases, at December 31:
(In millions) 2019 2018
Carrying amount — liability . . . . . . . . . . . . . . . . . . . . . . . . . . . . . . . . . . . . . . . . $ 3,434 $ 3,609
Fair value — liability . . . . . . . . . . . . . . . . . . . . . . . . . . . . . . . . . . . . . . . . . . . . . . 3,558 3,443
Pro forma fair value — liability . . . . . . . . . . . . . . . . . . . . . . . . . . . . . . . . . . . . . . 3,629 3,583
The pro forma information assumes a 100 basis point decrease in market interest rates at December 31 of eachyear, and reflects the estimated fair value of fixed rate debt outstanding at that date under that assumption. Thesensitivity of our fixed rate debt to changes in interest rates was determined using current market pricing models.
Foreign Currency Exchange Risk
We enter into foreign currency contracts in order to reduce the impact of changes in foreign exchange rates onour consolidated results of operations and future foreign currency-denominated cash flows. These contractsreduce exposure to currency movements affecting existing foreign currency-denominated assets, liabilities, firmcommitments and forecasted transactions resulting primarily from trade purchases and sales, equipmentacquisitions, intercompany loans and royalty agreements. Contracts hedging short term trade receivables andpayables normally have no hedging designation.
The following table presents foreign currency derivative information at December 31:
(In millions) 2019 2018
Fair value — asset (liability) . . . . . . . . . . . . . . . . . . . . . . . . . . . . . . . . . . . . . . . $ (8) $ 11
Pro forma decrease in fair value . . . . . . . . . . . . . . . . . . . . . . . . . . . . . . . . . . . . (199) (152)
Contract maturities . . . . . . . . . . . . . . . . . . . . . . . . . . . . . . . . . . . . . . . . . . . . . . 1/20 - 12/21 1/19 - 12/20
The pro forma decrease in fair value assumes a 10% adverse change in underlying foreign exchange rates atDecember 31 of each year, and reflects the estimated change in the fair value of contracts outstanding at that dateunder that assumption. The sensitivity of our foreign currency positions to changes in exchange rates wasdetermined using current market pricing models.
30
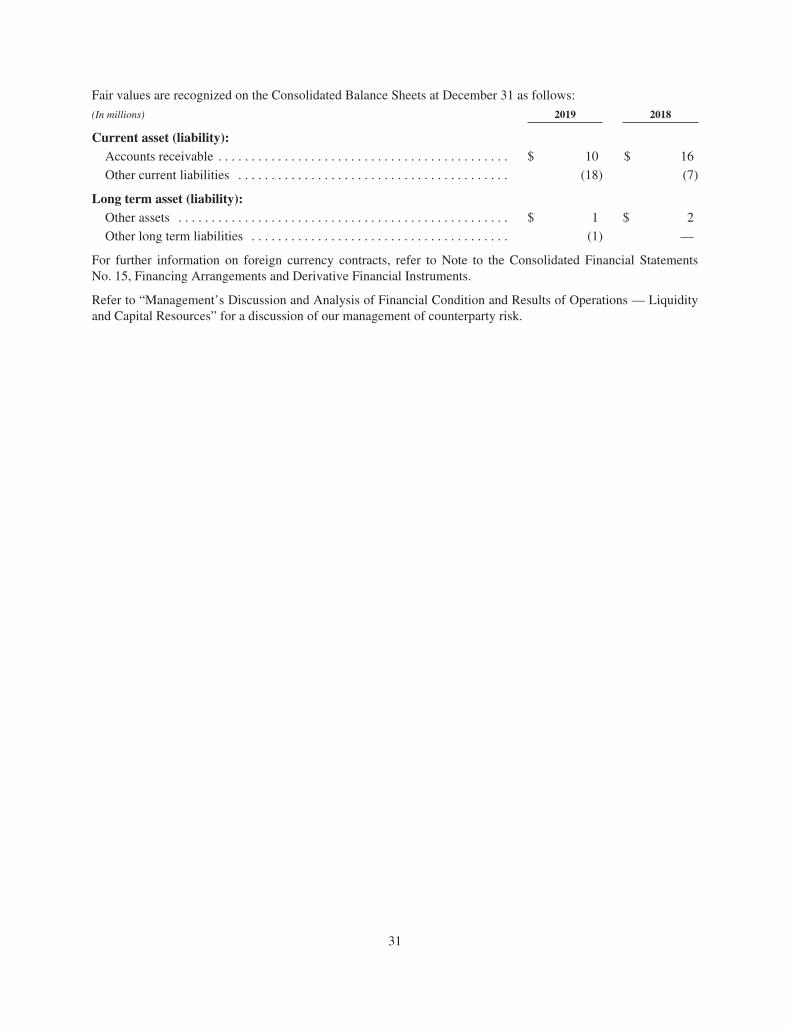
Fair values are recognized on the Consolidated Balance Sheets at December 31 as follows:
(In millions) 2019 2018
Current asset (liability):Accounts receivable . . . . . . . . . . . . . . . . . . . . . . . . . . . . . . . . . . . . . . . . . . . . $ 10 $ 16
Other current liabilities . . . . . . . . . . . . . . . . . . . . . . . . . . . . . . . . . . . . . . . . . (18) (7)
Long term asset (liability):Other assets . . . . . . . . . . . . . . . . . . . . . . . . . . . . . . . . . . . . . . . . . . . . . . . . . . $ 1 $ 2
Other long term liabilities . . . . . . . . . . . . . . . . . . . . . . . . . . . . . . . . . . . . . . . (1) —
For further information on foreign currency contracts, refer to Note to the Consolidated Financial StatementsNo. 15, Financing Arrangements and Derivative Financial Instruments.
Refer to “Management’s Discussion and Analysis of Financial Condition and Results of Operations — Liquidityand Capital Resources” for a discussion of our management of counterparty risk.
31

THE GOODYEAR TIRE & RUBBER COMPANY AND SUBSIDIARIES
CONSOLIDATED STATEMENTS OF OPERATIONSYear Ended December 31,
(In millions, except per share amounts) 2019 2018 2017
Net Sales (Note 2) . . . . . . . . . . . . . . . . . . . . . . . . . . . . . . . . . . . . . . . . . . . . . . $ 14,745 $ 15,475 $ 15,377
Cost of Goods Sold . . . . . . . . . . . . . . . . . . . . . . . . . . . . . . . . . . . . . . . . . . . . . 11,602 11,961 11,680
Selling, Administrative and General Expense . . . . . . . . . . . . . . . . . . . . . . . . . 2,323 2,312 2,279
Rationalizations (Note 3) . . . . . . . . . . . . . . . . . . . . . . . . . . . . . . . . . . . . . . . . . 205 44 135
Interest Expense (Note 4) . . . . . . . . . . . . . . . . . . . . . . . . . . . . . . . . . . . . . . . . 340 321 335
Other (Income) Expense (Note 5) . . . . . . . . . . . . . . . . . . . . . . . . . . . . . . . . . . 98 (174) 70
Income before Income Taxes . . . . . . . . . . . . . . . . . . . . . . . . . . . . . . . . . . . . . 177 1,011 878
United States and Foreign Tax Expense (Note 6) . . . . . . . . . . . . . . . . . . . . . . 474 303 513
Net Income (Loss) . . . . . . . . . . . . . . . . . . . . . . . . . . . . . . . . . . . . . . . . . . . . . . (297) 708 365
Less: Minority Shareholders’ Net Income . . . . . . . . . . . . . . . . . . . . . . . . . 14 15 19
Goodyear Net Income (Loss) . . . . . . . . . . . . . . . . . . . . . . . . . . . . . . . . . . . . $ (311) $ 693 $ 346
Goodyear Net Income (Loss) — Per Share of Common Stock
Basic . . . . . . . . . . . . . . . . . . . . . . . . . . . . . . . . . . . . . . . . . . . . . . . . . . . . . . $ (1.33) $ 2.92 $ 1.39
Weighted Average Shares Outstanding (Note 7) . . . . . . . . . . . . . . . . . . . . 233 237 249
Diluted . . . . . . . . . . . . . . . . . . . . . . . . . . . . . . . . . . . . . . . . . . . . . . . . . . . . . $ (1.33) $ 2.89 $ 1.37
Weighted Average Shares Outstanding (Note 7) . . . . . . . . . . . . . . . . . . . . 233 239 253
The accompanying notes are an integral part of these consolidated financial statements.
32
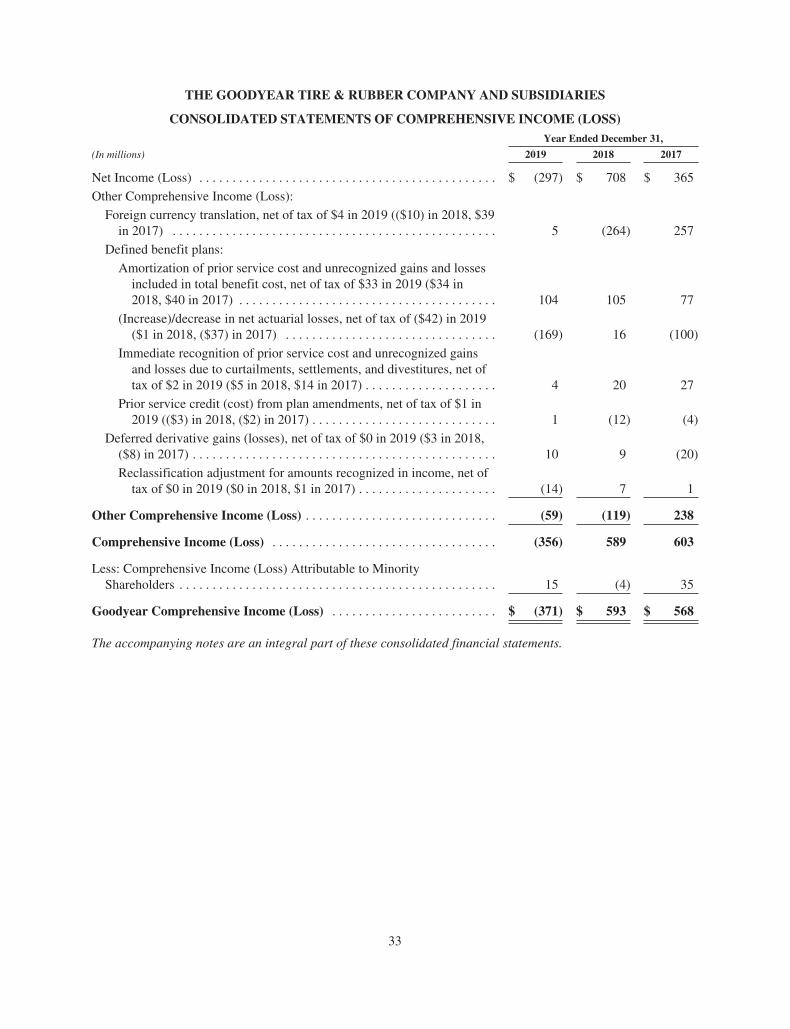
THE GOODYEAR TIRE & RUBBER COMPANY AND SUBSIDIARIES
CONSOLIDATED STATEMENTS OF COMPREHENSIVE INCOME (LOSS)Year Ended December 31,
(In millions) 2019 2018 2017
Net Income (Loss) . . . . . . . . . . . . . . . . . . . . . . . . . . . . . . . . . . . . . . . . . . . . . $ (297) $ 708 $ 365
Other Comprehensive Income (Loss):
Foreign currency translation, net of tax of $4 in 2019 (($10) in 2018, $39in 2017) . . . . . . . . . . . . . . . . . . . . . . . . . . . . . . . . . . . . . . . . . . . . . . . . . 5 (264) 257
Defined benefit plans:
Amortization of prior service cost and unrecognized gains and lossesincluded in total benefit cost, net of tax of $33 in 2019 ($34 in2018, $40 in 2017) . . . . . . . . . . . . . . . . . . . . . . . . . . . . . . . . . . . . . . . 104 105 77
(Increase)/decrease in net actuarial losses, net of tax of ($42) in 2019($1 in 2018, ($37) in 2017) . . . . . . . . . . . . . . . . . . . . . . . . . . . . . . . . (169) 16 (100)
Immediate recognition of prior service cost and unrecognized gainsand losses due to curtailments, settlements, and divestitures, net oftax of $2 in 2019 ($5 in 2018, $14 in 2017) . . . . . . . . . . . . . . . . . . . . 4 20 27
Prior service credit (cost) from plan amendments, net of tax of $1 in2019 (($3) in 2018, ($2) in 2017) . . . . . . . . . . . . . . . . . . . . . . . . . . . . 1 (12) (4)
Deferred derivative gains (losses), net of tax of $0 in 2019 ($3 in 2018,($8) in 2017) . . . . . . . . . . . . . . . . . . . . . . . . . . . . . . . . . . . . . . . . . . . . . . 10 9 (20)
Reclassification adjustment for amounts recognized in income, net oftax of $0 in 2019 ($0 in 2018, $1 in 2017) . . . . . . . . . . . . . . . . . . . . . (14) 7 1
Other Comprehensive Income (Loss) . . . . . . . . . . . . . . . . . . . . . . . . . . . . . (59) (119) 238
Comprehensive Income (Loss) . . . . . . . . . . . . . . . . . . . . . . . . . . . . . . . . . . (356) 589 603
Less: Comprehensive Income (Loss) Attributable to MinorityShareholders . . . . . . . . . . . . . . . . . . . . . . . . . . . . . . . . . . . . . . . . . . . . . . . . 15 (4) 35
Goodyear Comprehensive Income (Loss) . . . . . . . . . . . . . . . . . . . . . . . . . $ (371) $ 593 $ 568
The accompanying notes are an integral part of these consolidated financial statements.
33
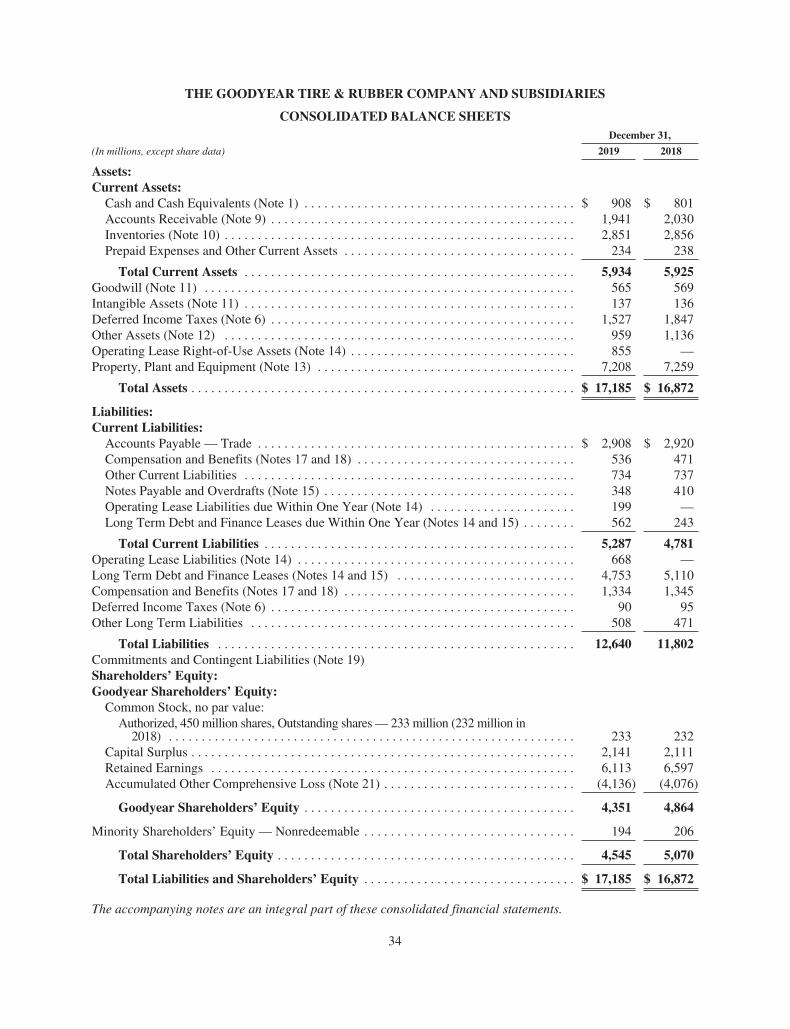
THE GOODYEAR TIRE & RUBBER COMPANY AND SUBSIDIARIES
CONSOLIDATED BALANCE SHEETSDecember 31,
(In millions, except share data) 2019 2018
Assets:Current Assets:
Cash and Cash Equivalents (Note 1) . . . . . . . . . . . . . . . . . . . . . . . . . . . . . . . . . . . . . . . . . $ 908 $ 801Accounts Receivable (Note 9) . . . . . . . . . . . . . . . . . . . . . . . . . . . . . . . . . . . . . . . . . . . . . . 1,941 2,030Inventories (Note 10) . . . . . . . . . . . . . . . . . . . . . . . . . . . . . . . . . . . . . . . . . . . . . . . . . . . . . 2,851 2,856Prepaid Expenses and Other Current Assets . . . . . . . . . . . . . . . . . . . . . . . . . . . . . . . . . . . 234 238
Total Current Assets . . . . . . . . . . . . . . . . . . . . . . . . . . . . . . . . . . . . . . . . . . . . . . . . . . 5,934 5,925Goodwill (Note 11) . . . . . . . . . . . . . . . . . . . . . . . . . . . . . . . . . . . . . . . . . . . . . . . . . . . . . . . . 565 569Intangible Assets (Note 11) . . . . . . . . . . . . . . . . . . . . . . . . . . . . . . . . . . . . . . . . . . . . . . . . . . 137 136Deferred Income Taxes (Note 6) . . . . . . . . . . . . . . . . . . . . . . . . . . . . . . . . . . . . . . . . . . . . . . 1,527 1,847Other Assets (Note 12) . . . . . . . . . . . . . . . . . . . . . . . . . . . . . . . . . . . . . . . . . . . . . . . . . . . . . 959 1,136Operating Lease Right-of-Use Assets (Note 14) . . . . . . . . . . . . . . . . . . . . . . . . . . . . . . . . . . 855 —Property, Plant and Equipment (Note 13) . . . . . . . . . . . . . . . . . . . . . . . . . . . . . . . . . . . . . . . 7,208 7,259
Total Assets . . . . . . . . . . . . . . . . . . . . . . . . . . . . . . . . . . . . . . . . . . . . . . . . . . . . . . . . . . $ 17,185 $ 16,872
Liabilities:Current Liabilities:
Accounts Payable — Trade . . . . . . . . . . . . . . . . . . . . . . . . . . . . . . . . . . . . . . . . . . . . . . . . $ 2,908 $ 2,920Compensation and Benefits (Notes 17 and 18) . . . . . . . . . . . . . . . . . . . . . . . . . . . . . . . . . 536 471Other Current Liabilities . . . . . . . . . . . . . . . . . . . . . . . . . . . . . . . . . . . . . . . . . . . . . . . . . . 734 737Notes Payable and Overdrafts (Note 15) . . . . . . . . . . . . . . . . . . . . . . . . . . . . . . . . . . . . . . 348 410Operating Lease Liabilities due Within One Year (Note 14) . . . . . . . . . . . . . . . . . . . . . . 199 —Long Term Debt and Finance Leases due Within One Year (Notes 14 and 15) . . . . . . . . 562 243
Total Current Liabilities . . . . . . . . . . . . . . . . . . . . . . . . . . . . . . . . . . . . . . . . . . . . . . . 5,287 4,781Operating Lease Liabilities (Note 14) . . . . . . . . . . . . . . . . . . . . . . . . . . . . . . . . . . . . . . . . . . 668 —Long Term Debt and Finance Leases (Notes 14 and 15) . . . . . . . . . . . . . . . . . . . . . . . . . . . 4,753 5,110Compensation and Benefits (Notes 17 and 18) . . . . . . . . . . . . . . . . . . . . . . . . . . . . . . . . . . . 1,334 1,345Deferred Income Taxes (Note 6) . . . . . . . . . . . . . . . . . . . . . . . . . . . . . . . . . . . . . . . . . . . . . . 90 95Other Long Term Liabilities . . . . . . . . . . . . . . . . . . . . . . . . . . . . . . . . . . . . . . . . . . . . . . . . . 508 471
Total Liabilities . . . . . . . . . . . . . . . . . . . . . . . . . . . . . . . . . . . . . . . . . . . . . . . . . . . . . . 12,640 11,802Commitments and Contingent Liabilities (Note 19)Shareholders’ Equity:Goodyear Shareholders’ Equity:
Common Stock, no par value:Authorized, 450 million shares, Outstanding shares — 233 million (232 million in
2018) . . . . . . . . . . . . . . . . . . . . . . . . . . . . . . . . . . . . . . . . . . . . . . . . . . . . . . . . . . . . . . 233 232Capital Surplus . . . . . . . . . . . . . . . . . . . . . . . . . . . . . . . . . . . . . . . . . . . . . . . . . . . . . . . . . . 2,141 2,111Retained Earnings . . . . . . . . . . . . . . . . . . . . . . . . . . . . . . . . . . . . . . . . . . . . . . . . . . . . . . . 6,113 6,597Accumulated Other Comprehensive Loss (Note 21) . . . . . . . . . . . . . . . . . . . . . . . . . . . . . (4,136) (4,076)
Goodyear Shareholders’ Equity . . . . . . . . . . . . . . . . . . . . . . . . . . . . . . . . . . . . . . . . . 4,351 4,864
Minority Shareholders’ Equity — Nonredeemable . . . . . . . . . . . . . . . . . . . . . . . . . . . . . . . . 194 206
Total Shareholders’ Equity . . . . . . . . . . . . . . . . . . . . . . . . . . . . . . . . . . . . . . . . . . . . . 4,545 5,070
Total Liabilities and Shareholders’ Equity . . . . . . . . . . . . . . . . . . . . . . . . . . . . . . . . $ 17,185 $ 16,872
The accompanying notes are an integral part of these consolidated financial statements.
34
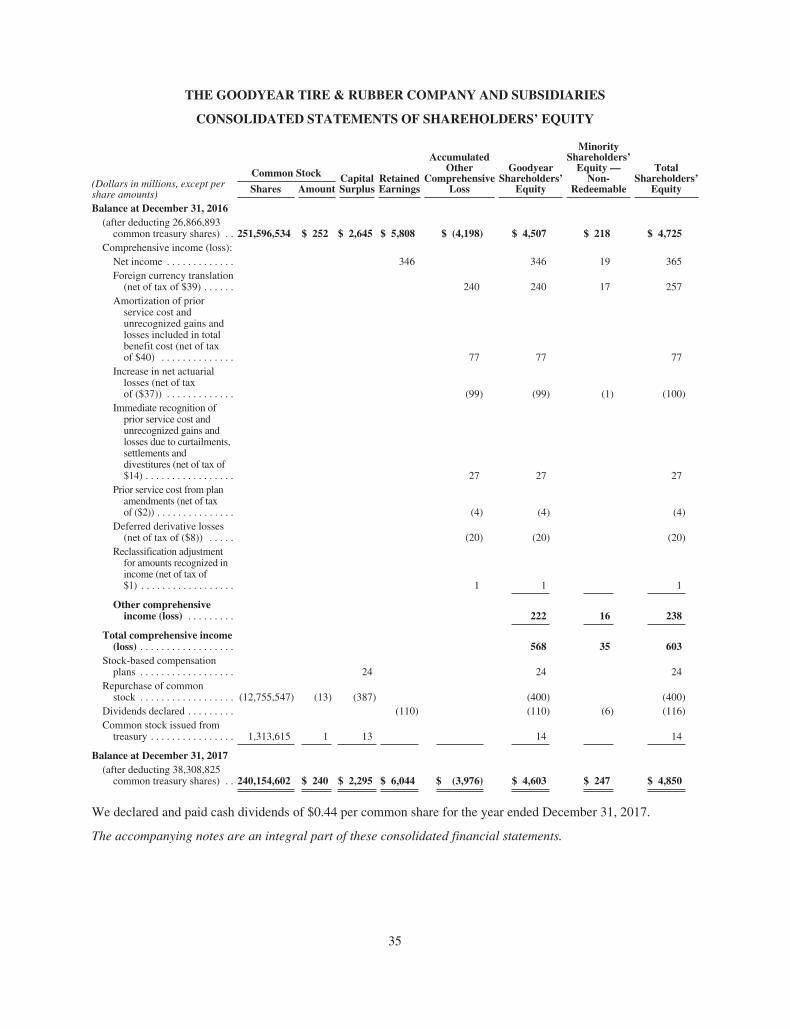
THE GOODYEAR TIRE & RUBBER COMPANY AND SUBSIDIARIES
CONSOLIDATED STATEMENTS OF SHAREHOLDERS’ EQUITY
(Dollars in millions, except pershare amounts)
Common Stock CapitalSurplus
RetainedEarnings
AccumulatedOther
ComprehensiveLoss
GoodyearShareholders’
Equity
MinorityShareholders’
Equity —Non-
Redeemable
TotalShareholders’
EquityShares Amount
Balance at December 31, 2016(after deducting 26,866,893
common treasury shares) . . 251,596,534 $ 252 $ 2,645 $ 5,808 $ (4,198) $ 4,507 $ 218 $ 4,725Comprehensive income (loss):
Net income . . . . . . . . . . . . . 346 346 19 365Foreign currency translation
(net of tax of $39) . . . . . . 240 240 17 257Amortization of prior
service cost andunrecognized gains andlosses included in totalbenefit cost (net of taxof $40) . . . . . . . . . . . . . . 77 77 77
Increase in net actuariallosses (net of taxof ($37)) . . . . . . . . . . . . . (99) (99) (1) (100)
Immediate recognition ofprior service cost andunrecognized gains andlosses due to curtailments,settlements anddivestitures (net of tax of$14) . . . . . . . . . . . . . . . . . 27 27 27
Prior service cost from planamendments (net of taxof ($2)) . . . . . . . . . . . . . . . (4) (4) (4)
Deferred derivative losses(net of tax of ($8)) . . . . . (20) (20) (20)
Reclassification adjustmentfor amounts recognized inincome (net of tax of$1) . . . . . . . . . . . . . . . . . . 1 1 1
Other comprehensiveincome (loss) . . . . . . . . . 222 16 238
Total comprehensive income(loss) . . . . . . . . . . . . . . . . . . 568 35 603
Stock-based compensationplans . . . . . . . . . . . . . . . . . . 24 24 24
Repurchase of commonstock . . . . . . . . . . . . . . . . . . (12,755,547) (13) (387) (400) (400)
Dividends declared . . . . . . . . . (110) (110) (6) (116)Common stock issued from
treasury . . . . . . . . . . . . . . . . 1,313,615 1 13 14 14
Balance at December 31, 2017(after deducting 38,308,825
common treasury shares) . . 240,154,602 $ 240 $ 2,295 $ 6,044 $ (3,976) $ 4,603 $ 247 $ 4,850
We declared and paid cash dividends of $0.44 per common share for the year ended December 31, 2017.
The accompanying notes are an integral part of these consolidated financial statements.
35
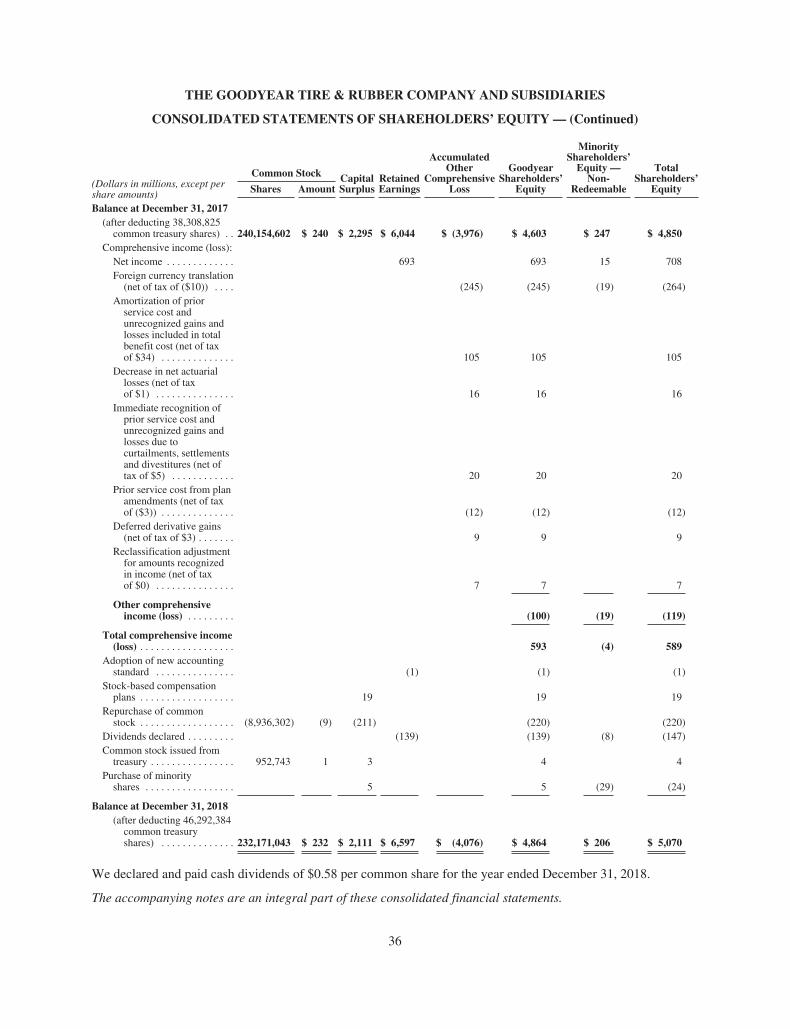
THE GOODYEAR TIRE & RUBBER COMPANY AND SUBSIDIARIES
CONSOLIDATED STATEMENTS OF SHAREHOLDERS’ EQUITY — (Continued)
(Dollars in millions, except pershare amounts)
Common Stock CapitalSurplus
RetainedEarnings
AccumulatedOther
ComprehensiveLoss
GoodyearShareholders’
Equity
MinorityShareholders’
Equity —Non-
Redeemable
TotalShareholders’
EquityShares Amount
Balance at December 31, 2017(after deducting 38,308,825
common treasury shares) . . 240,154,602 $ 240 $ 2,295 $ 6,044 $ (3,976) $ 4,603 $ 247 $ 4,850Comprehensive income (loss):
Net income . . . . . . . . . . . . . 693 693 15 708Foreign currency translation
(net of tax of ($10)) . . . . (245) (245) (19) (264)Amortization of prior
service cost andunrecognized gains andlosses included in totalbenefit cost (net of taxof $34) . . . . . . . . . . . . . . 105 105 105
Decrease in net actuariallosses (net of taxof $1) . . . . . . . . . . . . . . . 16 16 16
Immediate recognition ofprior service cost andunrecognized gains andlosses due tocurtailments, settlementsand divestitures (net oftax of $5) . . . . . . . . . . . . 20 20 20
Prior service cost from planamendments (net of taxof ($3)) . . . . . . . . . . . . . . (12) (12) (12)
Deferred derivative gains(net of tax of $3) . . . . . . . 9 9 9
Reclassification adjustmentfor amounts recognizedin income (net of taxof $0) . . . . . . . . . . . . . . . 7 7 7
Other comprehensiveincome (loss) . . . . . . . . . (100) (19) (119)
Total comprehensive income(loss) . . . . . . . . . . . . . . . . . . 593 (4) 589
Adoption of new accountingstandard . . . . . . . . . . . . . . . (1) (1) (1)
Stock-based compensationplans . . . . . . . . . . . . . . . . . . 19 19 19
Repurchase of commonstock . . . . . . . . . . . . . . . . . . (8,936,302) (9) (211) (220) (220)
Dividends declared . . . . . . . . . (139) (139) (8) (147)Common stock issued from
treasury . . . . . . . . . . . . . . . . 952,743 1 3 4 4Purchase of minority
shares . . . . . . . . . . . . . . . . . 5 5 (29) (24)
Balance at December 31, 2018(after deducting 46,292,384
common treasuryshares) . . . . . . . . . . . . . . 232,171,043 $ 232 $ 2,111 $ 6,597 $ (4,076) $ 4,864 $ 206 $ 5,070
We declared and paid cash dividends of $0.58 per common share for the year ended December 31, 2018.
The accompanying notes are an integral part of these consolidated financial statements.
36
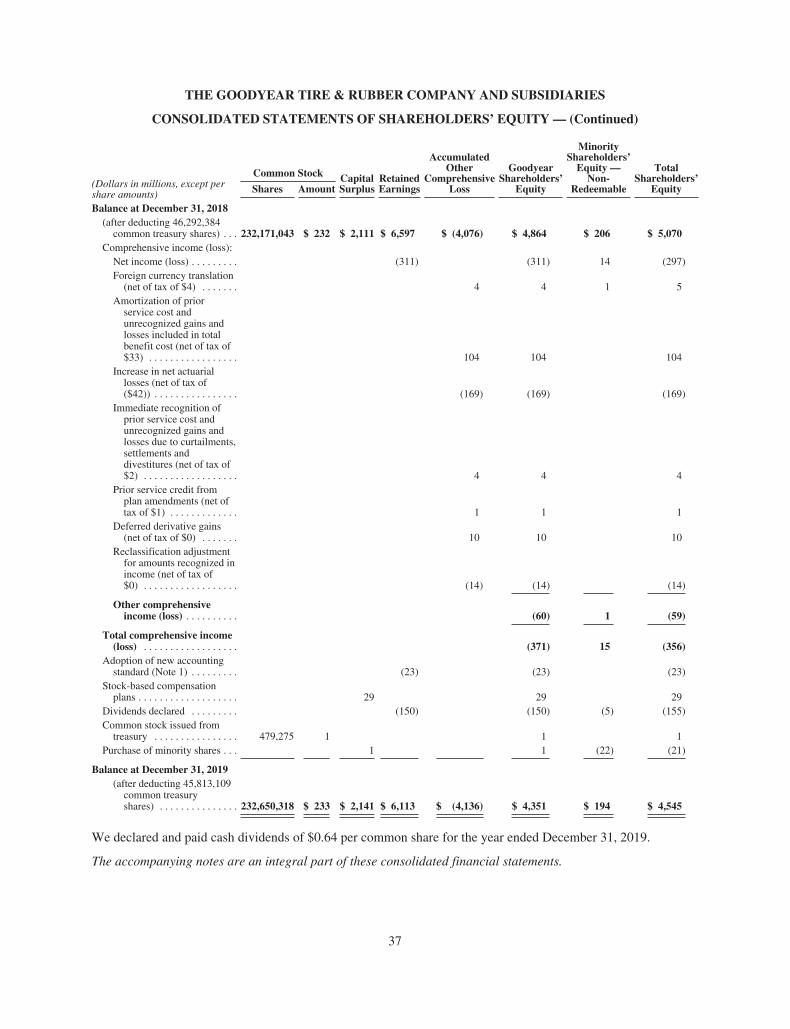
THE GOODYEAR TIRE & RUBBER COMPANY AND SUBSIDIARIES
CONSOLIDATED STATEMENTS OF SHAREHOLDERS’ EQUITY — (Continued)
(Dollars in millions, except pershare amounts)
Common Stock CapitalSurplus
RetainedEarnings
AccumulatedOther
ComprehensiveLoss
GoodyearShareholders’
Equity
MinorityShareholders’
Equity —Non-
Redeemable
TotalShareholders’
EquityShares Amount
Balance at December 31, 2018(after deducting 46,292,384
common treasury shares) . . . 232,171,043 $ 232 $ 2,111 $ 6,597 $ (4,076) $ 4,864 $ 206 $ 5,070Comprehensive income (loss):
Net income (loss) . . . . . . . . . (311) (311) 14 (297)Foreign currency translation
(net of tax of $4) . . . . . . . 4 4 1 5Amortization of prior
service cost andunrecognized gains andlosses included in totalbenefit cost (net of tax of$33) . . . . . . . . . . . . . . . . . 104 104 104
Increase in net actuariallosses (net of tax of($42)) . . . . . . . . . . . . . . . . (169) (169) (169)
Immediate recognition ofprior service cost andunrecognized gains andlosses due to curtailments,settlements anddivestitures (net of tax of$2) . . . . . . . . . . . . . . . . . . 4 4 4
Prior service credit fromplan amendments (net oftax of $1) . . . . . . . . . . . . . 1 1 1
Deferred derivative gains(net of tax of $0) . . . . . . . 10 10 10
Reclassification adjustmentfor amounts recognized inincome (net of tax of$0) . . . . . . . . . . . . . . . . . . (14) (14) (14)
Other comprehensiveincome (loss) . . . . . . . . . . (60) 1 (59)
Total comprehensive income(loss) . . . . . . . . . . . . . . . . . . (371) 15 (356)
Adoption of new accountingstandard (Note 1) . . . . . . . . . (23) (23) (23)
Stock-based compensationplans . . . . . . . . . . . . . . . . . . . 29 29 29
Dividends declared . . . . . . . . . (150) (150) (5) (155)Common stock issued from
treasury . . . . . . . . . . . . . . . . 479,275 1 1 1Purchase of minority shares . . . 1 1 (22) (21)
Balance at December 31, 2019(after deducting 45,813,109
common treasuryshares) . . . . . . . . . . . . . . . 232,650,318 $ 233 $ 2,141 $ 6,113 $ (4,136) $ 4,351 $ 194 $ 4,545
We declared and paid cash dividends of $0.64 per common share for the year ended December 31, 2019.
The accompanying notes are an integral part of these consolidated financial statements.
37
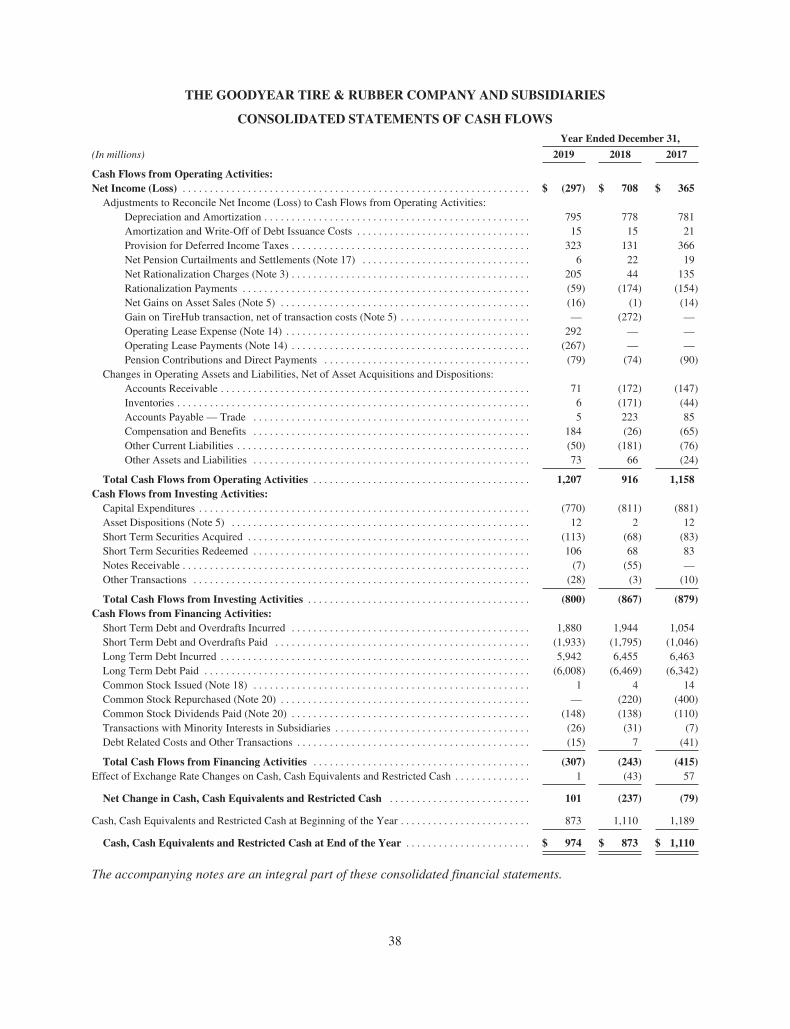
THE GOODYEAR TIRE & RUBBER COMPANY AND SUBSIDIARIES
CONSOLIDATED STATEMENTS OF CASH FLOWSYear Ended December 31,
(In millions) 2019 2018 2017
Cash Flows from Operating Activities:Net Income (Loss) . . . . . . . . . . . . . . . . . . . . . . . . . . . . . . . . . . . . . . . . . . . . . . . . . . . . . . . . . . . . . . . . $ (297) $ 708 $ 365
Adjustments to Reconcile Net Income (Loss) to Cash Flows from Operating Activities:Depreciation and Amortization . . . . . . . . . . . . . . . . . . . . . . . . . . . . . . . . . . . . . . . . . . . . . . . . . 795 778 781Amortization and Write-Off of Debt Issuance Costs . . . . . . . . . . . . . . . . . . . . . . . . . . . . . . . . 15 15 21Provision for Deferred Income Taxes . . . . . . . . . . . . . . . . . . . . . . . . . . . . . . . . . . . . . . . . . . . . 323 131 366Net Pension Curtailments and Settlements (Note 17) . . . . . . . . . . . . . . . . . . . . . . . . . . . . . . . 6 22 19Net Rationalization Charges (Note 3) . . . . . . . . . . . . . . . . . . . . . . . . . . . . . . . . . . . . . . . . . . . . 205 44 135Rationalization Payments . . . . . . . . . . . . . . . . . . . . . . . . . . . . . . . . . . . . . . . . . . . . . . . . . . . . . (59) (174) (154)Net Gains on Asset Sales (Note 5) . . . . . . . . . . . . . . . . . . . . . . . . . . . . . . . . . . . . . . . . . . . . . . (16) (1) (14)Gain on TireHub transaction, net of transaction costs (Note 5) . . . . . . . . . . . . . . . . . . . . . . . . — (272) —Operating Lease Expense (Note 14) . . . . . . . . . . . . . . . . . . . . . . . . . . . . . . . . . . . . . . . . . . . . . 292 — —Operating Lease Payments (Note 14) . . . . . . . . . . . . . . . . . . . . . . . . . . . . . . . . . . . . . . . . . . . . (267) — —Pension Contributions and Direct Payments . . . . . . . . . . . . . . . . . . . . . . . . . . . . . . . . . . . . . . (79) (74) (90)
Changes in Operating Assets and Liabilities, Net of Asset Acquisitions and Dispositions:Accounts Receivable . . . . . . . . . . . . . . . . . . . . . . . . . . . . . . . . . . . . . . . . . . . . . . . . . . . . . . . . . 71 (172) (147)Inventories . . . . . . . . . . . . . . . . . . . . . . . . . . . . . . . . . . . . . . . . . . . . . . . . . . . . . . . . . . . . . . . . . 6 (171) (44)Accounts Payable — Trade . . . . . . . . . . . . . . . . . . . . . . . . . . . . . . . . . . . . . . . . . . . . . . . . . . . 5 223 85Compensation and Benefits . . . . . . . . . . . . . . . . . . . . . . . . . . . . . . . . . . . . . . . . . . . . . . . . . . . 184 (26) (65)Other Current Liabilities . . . . . . . . . . . . . . . . . . . . . . . . . . . . . . . . . . . . . . . . . . . . . . . . . . . . . . (50) (181) (76)Other Assets and Liabilities . . . . . . . . . . . . . . . . . . . . . . . . . . . . . . . . . . . . . . . . . . . . . . . . . . . 73 66 (24)
Total Cash Flows from Operating Activities . . . . . . . . . . . . . . . . . . . . . . . . . . . . . . . . . . . . . . . . 1,207 916 1,158Cash Flows from Investing Activities:
Capital Expenditures . . . . . . . . . . . . . . . . . . . . . . . . . . . . . . . . . . . . . . . . . . . . . . . . . . . . . . . . . . . . . (770) (811) (881)Asset Dispositions (Note 5) . . . . . . . . . . . . . . . . . . . . . . . . . . . . . . . . . . . . . . . . . . . . . . . . . . . . . . . 12 2 12Short Term Securities Acquired . . . . . . . . . . . . . . . . . . . . . . . . . . . . . . . . . . . . . . . . . . . . . . . . . . . . (113) (68) (83)Short Term Securities Redeemed . . . . . . . . . . . . . . . . . . . . . . . . . . . . . . . . . . . . . . . . . . . . . . . . . . . 106 68 83Notes Receivable . . . . . . . . . . . . . . . . . . . . . . . . . . . . . . . . . . . . . . . . . . . . . . . . . . . . . . . . . . . . . . . . (7) (55) —Other Transactions . . . . . . . . . . . . . . . . . . . . . . . . . . . . . . . . . . . . . . . . . . . . . . . . . . . . . . . . . . . . . . (28) (3) (10)
Total Cash Flows from Investing Activities . . . . . . . . . . . . . . . . . . . . . . . . . . . . . . . . . . . . . . . . . (800) (867) (879)Cash Flows from Financing Activities:
Short Term Debt and Overdrafts Incurred . . . . . . . . . . . . . . . . . . . . . . . . . . . . . . . . . . . . . . . . . . . . 1,880 1,944 1,054Short Term Debt and Overdrafts Paid . . . . . . . . . . . . . . . . . . . . . . . . . . . . . . . . . . . . . . . . . . . . . . . (1,933) (1,795) (1,046)Long Term Debt Incurred . . . . . . . . . . . . . . . . . . . . . . . . . . . . . . . . . . . . . . . . . . . . . . . . . . . . . . . . . 5,942 6,455 6,463Long Term Debt Paid . . . . . . . . . . . . . . . . . . . . . . . . . . . . . . . . . . . . . . . . . . . . . . . . . . . . . . . . . . . . (6,008) (6,469) (6,342)Common Stock Issued (Note 18) . . . . . . . . . . . . . . . . . . . . . . . . . . . . . . . . . . . . . . . . . . . . . . . . . . . 1 4 14Common Stock Repurchased (Note 20) . . . . . . . . . . . . . . . . . . . . . . . . . . . . . . . . . . . . . . . . . . . . . . — (220) (400)Common Stock Dividends Paid (Note 20) . . . . . . . . . . . . . . . . . . . . . . . . . . . . . . . . . . . . . . . . . . . . (148) (138) (110)Transactions with Minority Interests in Subsidiaries . . . . . . . . . . . . . . . . . . . . . . . . . . . . . . . . . . . . (26) (31) (7)Debt Related Costs and Other Transactions . . . . . . . . . . . . . . . . . . . . . . . . . . . . . . . . . . . . . . . . . . . (15) 7 (41)
Total Cash Flows from Financing Activities . . . . . . . . . . . . . . . . . . . . . . . . . . . . . . . . . . . . . . . . (307) (243) (415)Effect of Exchange Rate Changes on Cash, Cash Equivalents and Restricted Cash . . . . . . . . . . . . . . 1 (43) 57
Net Change in Cash, Cash Equivalents and Restricted Cash . . . . . . . . . . . . . . . . . . . . . . . . . . 101 (237) (79)
Cash, Cash Equivalents and Restricted Cash at Beginning of the Year . . . . . . . . . . . . . . . . . . . . . . . . 873 1,110 1,189
Cash, Cash Equivalents and Restricted Cash at End of the Year . . . . . . . . . . . . . . . . . . . . . . . $ 974 $ 873 $ 1,110
The accompanying notes are an integral part of these consolidated financial statements.
38

THE GOODYEAR TIRE & RUBBER COMPANY AND SUBSIDIARIES
NOTES TO CONSOLIDATED FINANCIAL STATEMENTS
Note 1. Accounting Policies
A summary of the significant accounting policies used in the preparation of the accompanying consolidatedfinancial statements follows:
Basis of Presentation
Recently Adopted Accounting Standards
Effective January 1, 2019, we adopted an accounting standards update with new guidance intended to increasetransparency and comparability among organizations relating to leases. The new guidance requires lessees torecognize a liability to make lease payments and a right-of-use asset representing the right to use the underlyingasset for the lease term. The standards update retained a dual model for lease classification, requiring leases to beclassified as finance or operating leases to determine recognition in the statements of operations and cash flows;however, substantially all leases are now required to be recognized on the balance sheet. The standards updatealso requires quantitative and qualitative disclosures regarding key information about leasing arrangements. Weelected the optional transition method and applied the new guidance at the date of adoption, without adjusting thecomparative periods presented. We also elected the practical expedients permitted under the transition guidancethat retain the lease classification and initial direct costs for any leases that existed prior to adoption of thestandard, and we have elected to not evaluate land easements that existed as of, or expired before, adoption of thenew standard. In addition, we did not reassess whether any contracts entered into prior to adoption are leases.
The adoption of this standards update had a material impact on our Consolidated Balance Sheets and relateddisclosures. In addition to recognizing right-of-use assets and lease liabilities for our operating leases, werecorded $23 million as a cumulative effect adjustment to decrease Retained Earnings as a result of using themodified retrospective adoption approach. The adoption of this standards update did not have a material impacton our results of operations or cash flows.
The cumulative effect of the changes made to our January 1, 2019 balance sheet for the adoption of the standardsupdate was as follows:
(In millions)
Balance atDecember 31,
2018
Adjustmentfor New
Standard
Balance atJanuary 1,
2019
Deferred Income Taxes — Asset . . . . . . . . . . . . . . . . . . . . . . . . . . . . . . . $ 1,847 $ 7 $ 1,854
Operating Lease Right-of-Use Assets . . . . . . . . . . . . . . . . . . . . . . . . . . . — 882 882
Property, Plant and Equipment, less Accumulated Depreciation . . . . . . 7,259 (16) 7,243
Operating Lease Liabilities due Within One Year . . . . . . . . . . . . . . . . . . — 204 204
Operating Lease Liabilities . . . . . . . . . . . . . . . . . . . . . . . . . . . . . . . . . . . — 684 684
Long Term Debt and Finance Leases . . . . . . . . . . . . . . . . . . . . . . . . . . . 5,110 14 5,124
Other Long Term Liabilities . . . . . . . . . . . . . . . . . . . . . . . . . . . . . . . . . . 471 (6) 465
Retained Earnings . . . . . . . . . . . . . . . . . . . . . . . . . . . . . . . . . . . . . . . . . . 6,597 (23) 6,574
Effective January 1, 2019, we adopted an accounting standards update, intended to reduce complexity in hedgeaccounting and make hedge results easier to understand. This includes simplifying how hedge results arepresented and disclosed in the financial statements, expanding the types of hedging strategies allowed andproviding relief around the documentation and assessment requirements. The adoption of this standards updatedid not materially impact our consolidated financial statements.
Effective January 1, 2019, we adopted an accounting standards update that allows an optional one-timereclassification from Accumulated Other Comprehensive Income (Loss) (“AOCL”) to Retained Earnings for thestranded tax effects resulting from the new corporate tax rate under the Tax Cuts and Jobs Act (the “Tax Act”)that was enacted on December 22, 2017 in the United States. We have elected not to reclassify the income tax
39
THE GOODYEAR TIRE & RUBBER COMPANY AND SUBSIDIARIES
effects of the Tax Act from AOCL to Retained Earnings. As such, the adoption of this standards update did notimpact our consolidated financial statements. Our policy is to utilize an item-by-item approach to releasestranded income tax effects from AOCL. Under this approach, the stranded income tax effects are released fromAOCL when the related item ceases to exist.
Effective October 31, 2019, in conjunction with our annual impairment testing, we early adopted an accountingstandards update with new guidance intended to simplify the subsequent measurement of goodwill. The standardsupdate eliminates the requirement for an entity to calculate the implied fair value of goodwill to measure agoodwill impairment charge. Instead, an entity will perform its annual, or interim, goodwill impairment testingby comparing the fair value of a reporting unit with its carrying amount and recording an impairment charge forthe amount by which the carrying amount exceeds the fair value, not to exceed the total goodwill allocated to thatreporting unit. The adoption of this standards update did not impact our consolidated financial statements.
Recently Issued Accounting Standards
In January 2020, the Financial Accounting Standards Board (“FASB”) issued an accounting standards updatewith clarifying guidance on the application of the measurement alternative for certain equity securities and thescoping assessment for forward contracts and purchased options on certain securities. The standards update iseffective prospectively for fiscal years and interim periods beginning after December 15, 2020, with earlyadoption permitted. We are currently assessing the impact of this standards update on our consolidated financialstatements.
In December 2019, the FASB issued an accounting standards update with new guidance that changes theaccounting for certain income tax transactions. The standards update is effective for fiscal years and interimperiods beginning after December 15, 2020, with early adoption permitted. The amendments in this updaterelated to separate financial statements of legal entities that are not subject to tax should be applied on aretrospective basis for all periods presented. The amendments related to changes in ownership of foreign equitymethod investments or foreign subsidiaries should be applied on a modified retrospective basis. The amendmentsrelated to franchise taxes that are partially based on income should be applied on either a retrospective basis forall periods presented or a modified retrospective basis. All other amendments should be applied on a prospectivebasis. We are currently assessing the impact of this standards update on our consolidated financial statements.
In August 2018, the FASB issued an accounting standards update with new guidance requiring a customer in acloud computing arrangement that is a service contract to follow existing internal-use software guidance todetermine which implementation costs to capitalize as an asset. The standards update is effective for fiscal yearsand interim periods beginning after December 15, 2019, with early adoption permitted, and may be appliedretrospectively or as of the beginning of the period of adoption. The adoption of this standards update will nothave a material impact on our consolidated financial statements.
In June 2016, the FASB issued an accounting standards update with new guidance on accounting for credit losseson financial instruments. The new guidance includes an impairment model for estimating credit losses that isbased on expected losses, rather than incurred losses. The standards update is effective prospectively for fiscalyears and interim periods beginning after December 15, 2019, with early adoption permitted. The adoption of thisstandards update will not have a material impact on our consolidated financial statements.
Principles of Consolidation
The consolidated financial statements include the accounts of all legal entities in which we hold a controllingfinancial interest. A controlling financial interest generally arises from our ownership of a majority of the votingshares of our subsidiaries. We would also hold a controlling financial interest in variable interest entities if weare considered to be the primary beneficiary. Investments in companies in which we do not own a majorityinterest and we have the ability to exercise significant influence over operating and financial policies areaccounted for using the equity method. Investments in other companies are carried at cost. All intercompanybalances and transactions have been eliminated in consolidation.
40
THE GOODYEAR TIRE & RUBBER COMPANY AND SUBSIDIARIES
Use of Estimates
The preparation of financial statements in conformity with generally accepted accounting principles requiresmanagement to make estimates and assumptions that affect the amounts reported in the consolidated financialstatements and related notes to the consolidated financial statements. Actual results could differ from thoseestimates. On an ongoing basis, management reviews its estimates, including those related to:
• general and product liabilities and other litigation,
• workers’ compensation,
• recoverability of intangibles and other long-lived assets,
• deferred tax asset valuation allowances and uncertain income tax positions,
• pension and other postretirement benefits, and
• various other operating allowances and accruals, based on currently available information.
Changes in facts and circumstances may alter such estimates and affect results of operations and financialposition in future periods.
Revenue Recognition and Accounts Receivable Valuation
Sales are recognized when obligations under the terms of a contract are satisfied and control is transferred. Thisgenerally occurs with shipment or delivery, depending on the terms of the underlying contract, or when serviceshave been rendered. Sales are measured as the amount of consideration we expect to receive in exchange fortransferring goods or providing services. The amount of consideration we receive and sales we recognize canvary due to changes in sales incentives, rebates, rights of return or other items we offer our customers, for whichwe estimate the expected amounts based on an analysis of historical experience, or as the most likely amount in arange of possible outcomes. Payment terms with customers vary by region and customer, but are generally 30-90days or at the point of sale for our consumer retail locations. Net sales exclude sales, value added and other taxes.Costs to obtain contracts are generally expensed as incurred due to the short term nature of individual contracts.Incidental items that are immaterial in the context of the contract are recognized as expense as incurred. We haveelected to recognize the costs incurred for transportation of products to customers as a component of cost ofgoods sold (“CGS”).
Appropriate provisions are made for uncollectible accounts based on historical loss experience, portfolioduration, economic conditions and credit risk, considering both expected future losses as well as current incurredlosses. The adequacy of the allowances are assessed quarterly.
Research and Development Costs
Research and development costs include, among other things, materials, equipment, compensation and contractservices. These costs are expensed as incurred and included as a component of CGS. Research and developmentexpenditures were $430 million, $424 million and $406 million in 2019, 2018 and 2017, respectively.
Warranty
Warranties are provided on the sale of certain of our products and services and an accrual for estimated futureclaims is recorded at the time revenue is recognized. Tire replacement under most of the warranties we offer is ona prorated basis. Warranty reserves are based on past claims experience, sales history and other considerations.Refer to Note to the Consolidated Financial Statements No. 19, Commitments and Contingent Liabilities.
Environmental Cleanup Matters
We expense environmental costs related to existing conditions resulting from past or current operations and fromwhich no current or future benefit is discernible. Expenditures that extend the life of the related property or
41
THE GOODYEAR TIRE & RUBBER COMPANY AND SUBSIDIARIES
mitigate or prevent future environmental contamination are capitalized. We determine our liability on a site bysite basis and record a liability at the time when it is probable and can be reasonably estimated. Our estimatedliability is reduced to reflect the anticipated participation of other potentially responsible parties in thoseinstances where it is probable that such parties are legally responsible and financially capable of paying theirrespective shares of the relevant costs. Our estimated liability is not discounted or reduced for possible recoveriesfrom insurance carriers. Refer to Note to the Consolidated Financial Statements No. 19, Commitments andContingent Liabilities.
Legal Costs
We record a liability for estimated legal and defense costs related to pending general and product liability claims,environmental matters and workers’ compensation claims. Refer to Note to the Consolidated FinancialStatements No. 19, Commitments and Contingent Liabilities.
Advertising Costs
Costs incurred for producing and communicating advertising are generally expensed when incurred as acomponent of selling, administrative and general expense (“SAG”). Costs incurred under our cooperativeadvertising programs with dealers and franchisees are generally recorded as reductions of sales as relatedrevenues are recognized. Advertising costs, including costs for our cooperative advertising programs with dealersand franchisees, were $353 million, $345 million and $320 million in 2019, 2018 and 2017, respectively.
Rationalizations
We record costs for rationalization actions implemented to reduce excess and high-cost manufacturing capacityand operating and administrative costs. Associate-related costs include severance, supplemental unemploymentcompensation and benefits, medical benefits, pension curtailments, postretirement benefits, and other terminationbenefits. For ongoing benefit arrangements, a liability is recognized when it is probable that employees will beentitled to benefits and the amount can be reasonably estimated. For one-time benefit arrangements, a liability isincurred and must be accrued at the date the plan is communicated to employees, unless they will be retainedbeyond a minimum retention period. In this case, the liability is calculated at the date the plan is communicatedto employees and is accrued ratably over the future service period. For voluntary benefit arrangements, a liabilityis not estimable and is not recognized until eligible associates apply for the benefit and we accept theapplications. Other costs generally include non-cancelable lease costs, contract terminations and relocation costs.A liability for these costs is recognized in the period in which the liability is incurred. Rationalization chargesrelated to accelerated depreciation and asset impairments are recorded in CGS or SAG. Refer to Note to theConsolidated Financial Statements No. 3, Costs Associated with Rationalization Programs.
Income Taxes
Income taxes are recognized during the year in which transactions enter into the determination of financialstatement income, with deferred taxes being provided for temporary differences between carrying values ofassets and liabilities for financial reporting purposes and such carrying values as measured under applicable taxlaws. The effect on deferred tax assets or liabilities of a change in the tax law or tax rate is recognized in theperiod the change is enacted. Valuation allowances are recorded to reduce net deferred tax assets to the amountthat is more likely than not to be realized. The calculation of our tax liabilities also involves consideringuncertainties in the application of complex tax regulations. We recognize liabilities for uncertain income taxpositions based on our estimate of whether it is more likely than not that additional taxes will be required and wereport related interest and penalties as income taxes. To the extent that we incur expense under the globalintangible low-taxed income provisions we will treat it as a component of income tax expense in the periodincurred. Refer to Note to the Consolidated Financial Statements No. 6, Income Taxes.
Cash and Cash Equivalents / Consolidated Statements of Cash Flows
Cash and cash equivalents consist of cash on hand and marketable securities with original maturities of threemonths or less. Substantially all of our cash and short-term investment securities are held with investment grade
42
THE GOODYEAR TIRE & RUBBER COMPANY AND SUBSIDIARIES
rated counterparties. At December 31, 2019, our cash investments with any single counterparty did not exceed$170 million.
Cash flows associated with derivative financial instruments designated as hedges of identifiable transactions orevents are classified in the same category as the cash flows from the related hedged items. Cash flows associatedwith derivative financial instruments not designated as hedges are classified as operating activities. Bankoverdrafts, if any, are recorded within Notes Payable and Overdrafts. Cash flows associated with bank overdraftsare classified as financing activities.
Customer prepayments for products and government grants received that predominately relate to operations arereported as operating activities. Government grants received that are predominately related to capitalexpenditures are reported as investing activities. The Consolidated Statements of Cash Flows are presented net offinance leases of $36 million, $6 million and $5 million originating in the years ended December 31, 2019, 2018and 2017, respectively. Cash flows from investing activities in 2019 exclude $243 million of accrued capitalexpenditures remaining unpaid at December 31, 2019, and include payment for $266 million of capitalexpenditures that were accrued and unpaid at December 31, 2018. Cash flows from investing activities in 2018exclude $266 million of accrued capital expenditures remaining unpaid at December 31, 2018, and includepayment for $265 million of capital expenditures that were accrued and unpaid at December 31, 2017. Cashflows from investing activities in 2017 exclude $265 million of accrued capital expenditures remaining unpaid atDecember 31, 2017, and include payment for $264 million of capital expenditures that were accrued and unpaidat December 31, 2016.
Restricted Cash
The following table provides a reconciliation of Cash, Cash Equivalents and Restricted Cash as reported withinthe Consolidated Statements of Cash Flows:
December 31,
(In millions) 2019 2018 2017
Cash and Cash Equivalents . . . . . . . . . . . . . . . . . . . . . . . . . . . . . . . . . . . . . . . . . . . $ 908 $ 801 $ 1,043
Restricted Cash . . . . . . . . . . . . . . . . . . . . . . . . . . . . . . . . . . . . . . . . . . . . . . . . . . . . . 66 72 67
Total Cash, Cash Equivalents and Restricted Cash . . . . . . . . . . . . . . . . . . . . . . $ 974 $ 873 $ 1,110
Restricted Cash, which is included in Prepaid Expenses and Other Current Assets in the Consolidated BalanceSheets, primarily represents amounts required to be set aside in connection with accounts receivable factoringprograms. The restrictions lapse when cash from factored accounts receivable is remitted to the purchaser ofthose receivables.
Restricted Net Assets
In certain countries where we operate, transfers of funds into or out of such countries by way of dividends, loansor advances are generally or periodically subject to various governmental regulations. In addition, certain of ourcredit agreements and other debt instruments limit the ability of foreign subsidiaries to make cash distributions.At December 31, 2019, approximately $711 million of net assets were subject to such regulations or limitations.
Inventories
Inventories are stated at the lower of cost or net realizable value. Cost is determined using the first-in, first-out orthe average cost method. Costs include direct material, direct labor and applicable manufacturing andengineering overhead. We allocate fixed manufacturing overheads based on normal production capacity andrecognize abnormal manufacturing costs as period costs. We determine a provision for excess and obsoleteinventory based on management’s review of inventories on hand compared to estimated future usage and sales.Refer to Note to the Consolidated Financial Statements No. 10, Inventories.
43
THE GOODYEAR TIRE & RUBBER COMPANY AND SUBSIDIARIES
Goodwill and Other Intangible Assets
Goodwill is recorded when the cost of acquired businesses exceeds the fair value of the identifiable net assetsacquired. Goodwill and intangible assets with indefinite useful lives are not amortized but are assessed forimpairment annually with the option to perform a qualitative assessment to determine whether furtherimpairment testing is necessary or to perform a quantitative assessment by comparing the fair value of thereporting unit or indefinite-lived intangible to its carrying amount. Under the qualitative assessment, an entity isnot required to calculate the fair value unless the entity determines that it is more likely than not that the fairvalue is less than the carrying amount. If under the quantitative assessment the fair value is less than the carryingamount, then an impairment loss will be recorded for the difference between the carrying value and the fairvalue, limited to the carrying amount of goodwill. We perform a quantitative assessment at least once every fiveyears.
In addition to annual testing, impairment testing is conducted when events occur or circumstances change thatwould more likely than not reduce the fair value of the asset below its carrying amount. Goodwill and intangibleassets with indefinite useful lives would be written down to fair value if considered impaired. Intangible assetswith finite useful lives are amortized to their estimated residual values over such finite lives, and reviewed forimpairment whenever events or circumstances warrant such a review. Refer to Note to the ConsolidatedFinancial Statements No. 11, Goodwill and Intangible Assets.
Investments
Investments in marketable securities are stated at fair value. Fair value is determined using quoted market pricesat the end of the reporting period and, when appropriate, exchange rates at that date. Unrealized gains and losseson marketable equity securities are recorded in earnings. Unrealized gains and losses on marketable debtsecurities classified as available-for-sale are recorded in AOCL, net of tax. Our investment in TireHub isaccounted for under the equity method.
We regularly review our investments to determine whether a decline in fair value below their recorded amount isother than temporary. If the decline in fair value is judged to be other than temporary, the investment is writtendown to fair value and the amount of the write-down is included in the Consolidated Statements of Operations.Refer to Notes to the Consolidated Financial Statements No. 12, Other Assets and Investments, No. 16, FairValue Measurements, and No. 21, Reclassifications out of Accumulated Other Comprehensive Loss.
Property, Plant and Equipment
Property, plant and equipment are stated at cost. Depreciation is computed using the straight-line method.Additions and improvements that substantially extend the useful life of property, plant and equipment, andinterest costs incurred during the construction period of major projects are capitalized. Government grants to usthat are predominately related to capital expenditures are recorded as reductions of the cost of the associatedassets. Repair and maintenance costs are expensed as incurred. Property, plant and equipment are depreciated totheir estimated residual values over their estimated useful lives, and reviewed for impairment whenever events orcircumstances warrant such a review. Depreciation expense for property, plant and equipment was $793 million,$776 million and $779 million in 2019, 2018 and 2017, respectively. Refer to Notes to the ConsolidatedFinancial Statements No. 4, Interest Expense, and No. 13, Property, Plant and Equipment.
Foreign Currency Translation
The functional currency for most subsidiaries outside the United States is the local currency. Financial statements ofthese subsidiaries are translated into U.S. dollars using the exchange rate at each balance sheet date for assets andliabilities and a weighted average exchange rate for each period for revenues, expenses, gains and losses. The U.S.dollar is used as the functional currency in countries with a history of high inflation and in countries that predominantlysell into the U.S. dollar export market. For all operations, gains or losses from remeasuring foreign currencytransactions into the functional currency are included in Other (Income) Expense. Translation adjustments are recordedin AOCL. Income taxes are generally not provided for foreign currency translation adjustments.
44
THE GOODYEAR TIRE & RUBBER COMPANY AND SUBSIDIARIES
Derivative Financial Instruments and Hedging Activities
To qualify for hedge accounting, hedging instruments must be designated as hedges and meet defined correlationand effectiveness criteria. These criteria require that the anticipated cash flows and/or changes in fair value of thehedging instrument substantially offset those of the position being hedged.
Derivative contracts are reported at fair value on the Consolidated Balance Sheets as Accounts Receivable, OtherAssets, Other Current Liabilities or Other Long Term Liabilities. Deferred gains and losses on contractsdesignated as cash flow hedges are recorded net of tax in AOCL.
Interest Rate Contracts — Gains and losses on contracts designated as cash flow hedges are initially deferred andrecorded in AOCL. Amounts are transferred from AOCL and recognized in income as Interest Expense in thesame period that the hedged item is recognized in income. Gains and losses on contracts designated as fair valuehedges are recognized in income in the current period as Interest Expense. Gains and losses on contracts with nohedging designation are recorded in the current period in Other (Income) Expense.
Foreign Currency Contracts — Gains and losses on contracts designated as cash flow hedges are initiallydeferred and recorded in AOCL. Amounts are transferred from AOCL and recognized in income in the sameperiod and on the same line that the hedged item is recognized in income. Gains and losses on contractsdesignated as fair value hedges, excluding premiums and discounts, are recorded in Other (Income) Expense inthe current period. Gains and losses on contracts with no hedging designation are also recorded in Other(Income) Expense in the current period. We do not include premiums or discounts on forward currency contractsin our assessment of hedge effectiveness. Premiums and discounts on contracts designated as hedges are recordedin AOCL. The amounts are recognized in the Statement of Operations on a straight-line basis over the life of thecontract on the same line that the hedged item is recognized in the Statement of Operations.
Net Investment Hedging — Nonderivative instruments denominated in foreign currencies are used from time totime to hedge net investments in foreign subsidiaries. Gains and losses on these instruments are deferred andrecorded in AOCL as Foreign Currency Translation Adjustments. These gains and losses are only recognized inincome upon the complete or partial sale of the related investment or the complete liquidation of the investment.
Termination of Contracts — Gains and losses (including deferred gains and losses in AOCL) are recognized inOther (Income) Expense when contracts are terminated concurrently with the termination of the hedged position.To the extent that such position remains outstanding, gains and losses are amortized to Interest Expense or toOther (Income) Expense over the remaining life of that position. Gains and losses on contracts that wetemporarily continue to hold after the early termination of a hedged position, or that otherwise no longer qualifyfor hedge accounting, are recognized in Other (Income) Expense. Refer to Note to the Consolidated FinancialStatements No. 15, Financing Arrangements and Derivative Financial Instruments.
Stock-Based Compensation
We measure compensation cost arising from the grant of stock-based awards to employees at fair value andrecognize such cost in income over the period during which the service is provided, usually the vesting period.We recognize compensation expense using the straight-line approach.
Stock-based awards to employees include grants of performance share units, restricted stock units and stockoptions. We measure the fair value of grants of performance share units and restricted stock units based primarilyon the closing market price of a share of our common stock on the date of the grant, modified as appropriate totake into account the features of such grants.
We estimate the fair value of stock options using the Black-Scholes valuation model. Assumptions used toestimate compensation expense are determined as follows:
• Expected term represents the period of time that options granted are expected to be outstanding based onour historical experience of option exercises;
45
THE GOODYEAR TIRE & RUBBER COMPANY AND SUBSIDIARIES
• Expected volatility is measured using the weighted average of historical daily changes in the market priceof our common stock over the expected term of the award and implied volatility calculated for ourexchange traded options with an expiration date greater than one year;
• Risk-free interest rate is equivalent to the implied yield on zero-coupon U.S. Treasury bonds with aremaining maturity equal to the expected term of the awards; and
• Forfeitures are based substantially on the history of cancellations of similar awards granted in prior years.
Refer to Note to the Consolidated Financial Statements No. 18, Stock Compensation Plans.
Earnings Per Share of Common Stock
Basic earnings per share are computed based on the weighted average number of common shares outstanding.Diluted earnings per share primarily reflects the dilutive impact of outstanding stock options and other stockbased awards. All earnings per share amounts in these notes to the consolidated financial statements are diluted,unless otherwise noted. Refer to Note to the Consolidated Financial Statements No. 7, Earnings Per Share.
Fair Value Measurements
Valuation Hierarchy
Assets and liabilities measured at fair value are classified using the following hierarchy, which is based upon thetransparency of inputs to the valuation as of the measurement date.
• Level 1 — Valuation is based upon quoted prices (unadjusted) for identical assets or liabilities in activemarkets.
• Level 2 — Valuation is based upon quoted prices for similar assets and liabilities in active markets, orother inputs that are observable for the asset or liability, either directly or indirectly, for substantially thefull term of the financial instrument.
• Level 3 — Valuation is based upon other unobservable inputs that are significant to the fair valuemeasurement.
The classification of fair value measurements within the hierarchy is based upon the lowest level of input that issignificant to the measurement. Valuation methodologies used for assets and liabilities measured at fair value areas follows:
Investments
Where quoted prices are available in an active market, investments are classified within Level 1 of the valuationhierarchy. Level 1 securities include highly liquid government bonds, certain mortgage products and exchange-traded equities. If quoted market prices are not available, fair values are estimated using quoted prices ofsecurities with similar characteristics or inputs other than quoted prices that are observable for the security, andwould be classified within Level 2 of the valuation hierarchy. In certain cases where there is limited activity orless transparency around inputs to the valuation, securities would be classified within Level 3 of the valuationhierarchy.
Derivative Financial Instruments
Exchange-traded derivative financial instruments that are valued using quoted prices would be classified withinLevel 1 of the valuation hierarchy. Derivative financial instruments valued using internally-developed modelsthat use as their basis readily observable market parameters are classified within Level 2 of the valuationhierarchy. Derivative financial instruments that are valued based upon models with significant unobservablemarket parameters, and that are normally traded less actively, would be classified within Level 3 of the valuationhierarchy. Refer to Notes to the Consolidated Financial Statements No. 15, Financing Arrangements andDerivative Financial Instruments, and No. 16, Fair Value Measurements.
46
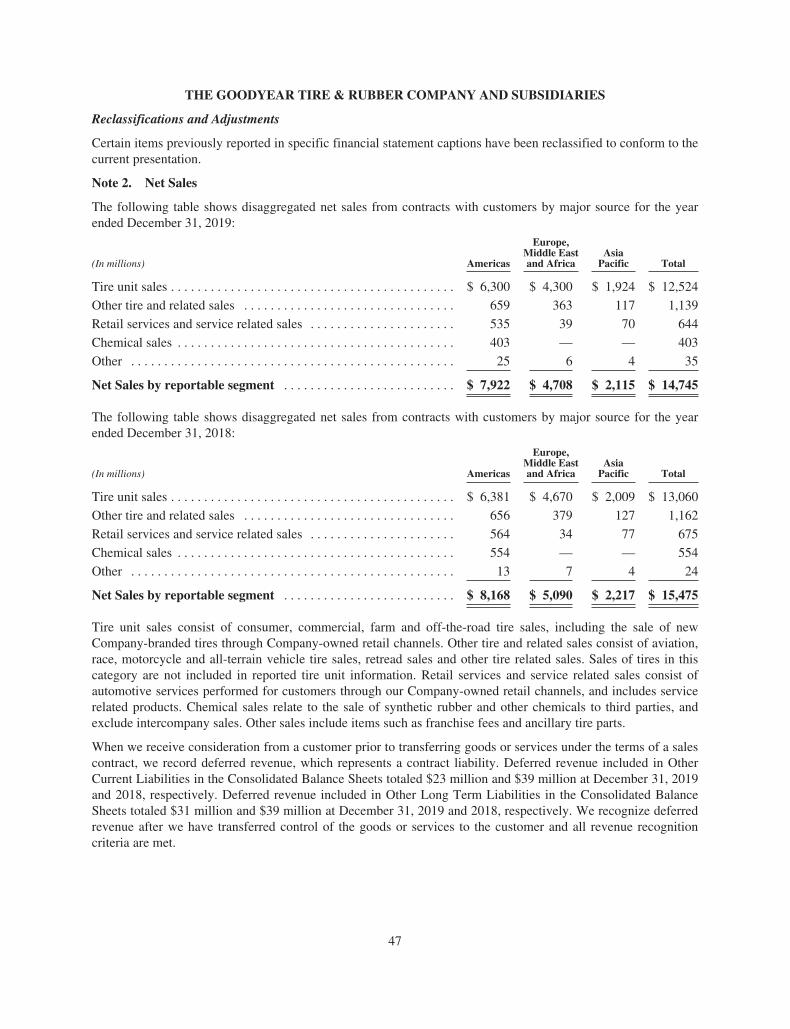
THE GOODYEAR TIRE & RUBBER COMPANY AND SUBSIDIARIES
Reclassifications and Adjustments
Certain items previously reported in specific financial statement captions have been reclassified to conform to thecurrent presentation.
Note 2. Net Sales
The following table shows disaggregated net sales from contracts with customers by major source for the yearended December 31, 2019:
(In millions) Americas
Europe,Middle Eastand Africa
AsiaPacific Total
Tire unit sales . . . . . . . . . . . . . . . . . . . . . . . . . . . . . . . . . . . . . . . . . . . $ 6,300 $ 4,300 $ 1,924 $ 12,524
Other tire and related sales . . . . . . . . . . . . . . . . . . . . . . . . . . . . . . . . 659 363 117 1,139
Retail services and service related sales . . . . . . . . . . . . . . . . . . . . . . 535 39 70 644
Chemical sales . . . . . . . . . . . . . . . . . . . . . . . . . . . . . . . . . . . . . . . . . . 403 — — 403
Other . . . . . . . . . . . . . . . . . . . . . . . . . . . . . . . . . . . . . . . . . . . . . . . . . 25 6 4 35
Net Sales by reportable segment . . . . . . . . . . . . . . . . . . . . . . . . . . $ 7,922 $ 4,708 $ 2,115 $ 14,745
The following table shows disaggregated net sales from contracts with customers by major source for the yearended December 31, 2018:
(In millions) Americas
Europe,Middle Eastand Africa
AsiaPacific Total
Tire unit sales . . . . . . . . . . . . . . . . . . . . . . . . . . . . . . . . . . . . . . . . . . . $ 6,381 $ 4,670 $ 2,009 $ 13,060
Other tire and related sales . . . . . . . . . . . . . . . . . . . . . . . . . . . . . . . . 656 379 127 1,162
Retail services and service related sales . . . . . . . . . . . . . . . . . . . . . . 564 34 77 675
Chemical sales . . . . . . . . . . . . . . . . . . . . . . . . . . . . . . . . . . . . . . . . . . 554 — — 554
Other . . . . . . . . . . . . . . . . . . . . . . . . . . . . . . . . . . . . . . . . . . . . . . . . . 13 7 4 24
Net Sales by reportable segment . . . . . . . . . . . . . . . . . . . . . . . . . . $ 8,168 $ 5,090 $ 2,217 $ 15,475
Tire unit sales consist of consumer, commercial, farm and off-the-road tire sales, including the sale of newCompany-branded tires through Company-owned retail channels. Other tire and related sales consist of aviation,race, motorcycle and all-terrain vehicle tire sales, retread sales and other tire related sales. Sales of tires in thiscategory are not included in reported tire unit information. Retail services and service related sales consist ofautomotive services performed for customers through our Company-owned retail channels, and includes servicerelated products. Chemical sales relate to the sale of synthetic rubber and other chemicals to third parties, andexclude intercompany sales. Other sales include items such as franchise fees and ancillary tire parts.
When we receive consideration from a customer prior to transferring goods or services under the terms of a salescontract, we record deferred revenue, which represents a contract liability. Deferred revenue included in OtherCurrent Liabilities in the Consolidated Balance Sheets totaled $23 million and $39 million at December 31, 2019and 2018, respectively. Deferred revenue included in Other Long Term Liabilities in the Consolidated BalanceSheets totaled $31 million and $39 million at December 31, 2019 and 2018, respectively. We recognize deferredrevenue after we have transferred control of the goods or services to the customer and all revenue recognitioncriteria are met.
47

THE GOODYEAR TIRE & RUBBER COMPANY AND SUBSIDIARIES
The following table presents the balances of deferred revenue related to contracts with customers, and changesduring the years ended December 31:(In millions) 2019 2018
Balance at January 1 . . . . . . . . . . . . . . . . . . . . . . . . . . . . . . . . . . . . . . . . . . . . . . . . . . . . . . . . $ 78 $ 121Revenue deferred during period . . . . . . . . . . . . . . . . . . . . . . . . . . . . . . . . . . . . . . . . . . . . . . . . 155 116
Revenue recognized during period . . . . . . . . . . . . . . . . . . . . . . . . . . . . . . . . . . . . . . . . . . . . . . (179) (159)
Impact of foreign currency translation . . . . . . . . . . . . . . . . . . . . . . . . . . . . . . . . . . . . . . . . . . . . — —
Balance at December 31 . . . . . . . . . . . . . . . . . . . . . . . . . . . . . . . . . . . . . . . . . . . . . . . . . . . . . $ 54 $ 78
Note 3. Costs Associated with Rationalization Programs
In order to maintain our global competitiveness, we have implemented rationalization actions over the pastseveral years to reduce high-cost and excess manufacturing capacity and associate headcount.
The following table presents the roll-forward of the liability balance between periods:
(In millions)Associate-Related
CostsOtherCosts Total
Balance at December 31, 2016 . . . . . . . . . . . . . . . . . . . . . . . . . . . . . . . . . . . $ 214 $ 5 $ 2192017 charges(1) . . . . . . . . . . . . . . . . . . . . . . . . . . . . . . . . . . . . . . . . . . . . . . . . 103 32 135
Incurred, net of foreign currency translation of $25 million and $1 million,respectively . . . . . . . . . . . . . . . . . . . . . . . . . . . . . . . . . . . . . . . . . . . . . . . . (94) (34) (128)
Reversed to the Statement of Operations . . . . . . . . . . . . . . . . . . . . . . . . . . . . (13) — (13)
Balance at December 31, 2017 . . . . . . . . . . . . . . . . . . . . . . . . . . . . . . . . . . . $ 210 $ 3 $ 2132018 charges(1) . . . . . . . . . . . . . . . . . . . . . . . . . . . . . . . . . . . . . . . . . . . . . . . . 47 17 64
Incurred, net of foreign currency translation of $(3) million and $0 million,respectively . . . . . . . . . . . . . . . . . . . . . . . . . . . . . . . . . . . . . . . . . . . . . . . . (158) (19) (177)
Reversed to the Statement of Operations . . . . . . . . . . . . . . . . . . . . . . . . . . . . (19) — (19)
Balance at December 31, 2018 . . . . . . . . . . . . . . . . . . . . . . . . . . . . . . . . . . . $ 80 $ 1 $ 812019 charges(1) . . . . . . . . . . . . . . . . . . . . . . . . . . . . . . . . . . . . . . . . . . . . . . . . 185 19 204
Incurred, net of foreign currency translation of $(2) million and $0 million,respectively . . . . . . . . . . . . . . . . . . . . . . . . . . . . . . . . . . . . . . . . . . . . . . . . (41) (20) (61)
Reversed to the Statement of Operations . . . . . . . . . . . . . . . . . . . . . . . . . . . . (4) — (4)
Balance at December 31, 2019 . . . . . . . . . . . . . . . . . . . . . . . . . . . . . . . . . . . $ 220 $ — $ 220
(1) Charges of $204 million, $64 million and $135 million in 2019, 2018 and 2017, respectively, exclude$5 million, $(1) million and $13 million, respectively, of benefit plan curtailments and settlementsrecorded in Rationalizations in the Statement of Operations.
On March 18, 2019, we approved a plan to modernize two of our tire manufacturing facilities in Germany. Theplan is in furtherance of our strategy to strengthen the competitiveness of our manufacturing footprint andincrease production of premium, large-rim diameter consumer tires. The plan will result in approximately 1,100job reductions as a result of changes to the layout of the plants, efficiency gains from new equipment and areduction in the production of tires for declining, less profitable market segments. We have $100 million accruedrelated to this plan at December 31, 2019, which is expected to be substantially paid through 2022.
On September 16, 2019, we approved a plan primarily to offer voluntary buy-outs to certain associates at ourGadsden, Alabama manufacturing facility, as part of our strategy to strengthen the competitiveness of ourmanufacturing footprint by curtailing production of tires for declining, less profitable segments of the tire market.
48
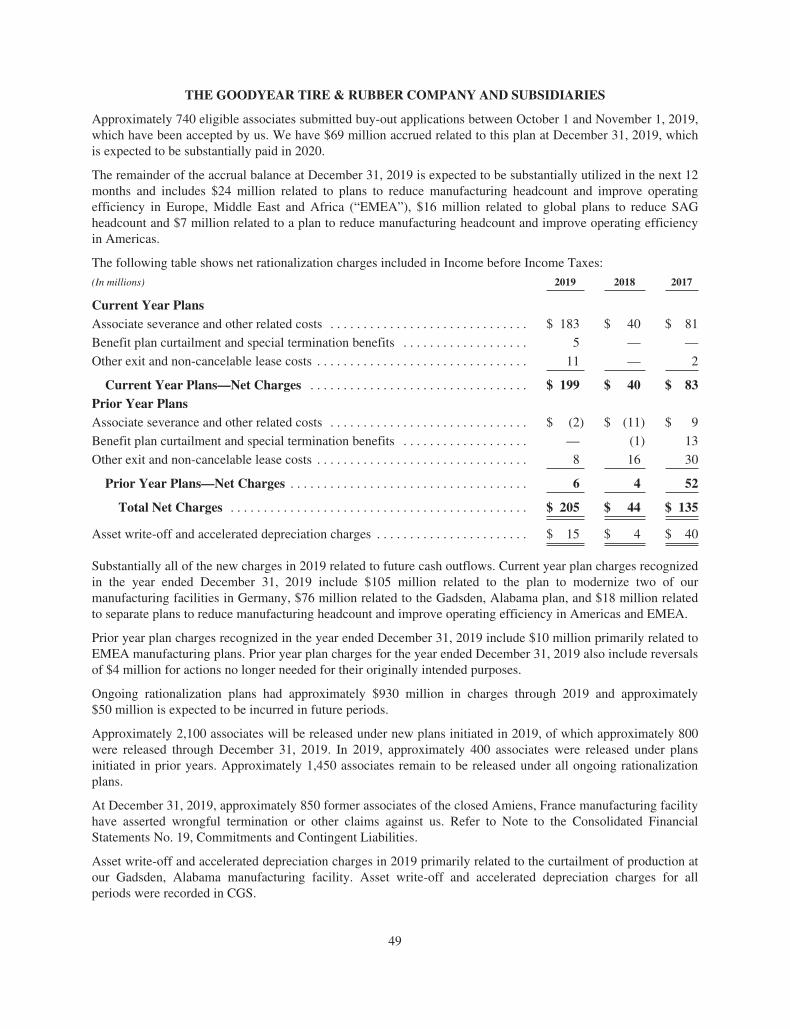
THE GOODYEAR TIRE & RUBBER COMPANY AND SUBSIDIARIES
Approximately 740 eligible associates submitted buy-out applications between October 1 and November 1, 2019,which have been accepted by us. We have $69 million accrued related to this plan at December 31, 2019, whichis expected to be substantially paid in 2020.
The remainder of the accrual balance at December 31, 2019 is expected to be substantially utilized in the next 12months and includes $24 million related to plans to reduce manufacturing headcount and improve operatingefficiency in Europe, Middle East and Africa (“EMEA”), $16 million related to global plans to reduce SAGheadcount and $7 million related to a plan to reduce manufacturing headcount and improve operating efficiencyin Americas.
The following table shows net rationalization charges included in Income before Income Taxes:
(In millions) 2019 2018 2017
Current Year PlansAssociate severance and other related costs . . . . . . . . . . . . . . . . . . . . . . . . . . . . . . $ 183 $ 40 $ 81
Benefit plan curtailment and special termination benefits . . . . . . . . . . . . . . . . . . . 5 — —
Other exit and non-cancelable lease costs . . . . . . . . . . . . . . . . . . . . . . . . . . . . . . . . 11 — 2
Current Year Plans—Net Charges . . . . . . . . . . . . . . . . . . . . . . . . . . . . . . . . . $ 199 $ 40 $ 83Prior Year PlansAssociate severance and other related costs . . . . . . . . . . . . . . . . . . . . . . . . . . . . . . $ (2) $ (11) $ 9
Benefit plan curtailment and special termination benefits . . . . . . . . . . . . . . . . . . . — (1) 13
Other exit and non-cancelable lease costs . . . . . . . . . . . . . . . . . . . . . . . . . . . . . . . . 8 16 30
Prior Year Plans—Net Charges . . . . . . . . . . . . . . . . . . . . . . . . . . . . . . . . . . . . 6 4 52
Total Net Charges . . . . . . . . . . . . . . . . . . . . . . . . . . . . . . . . . . . . . . . . . . . . . $ 205 $ 44 $ 135
Asset write-off and accelerated depreciation charges . . . . . . . . . . . . . . . . . . . . . . . $ 15 $ 4 $ 40
Substantially all of the new charges in 2019 related to future cash outflows. Current year plan charges recognizedin the year ended December 31, 2019 include $105 million related to the plan to modernize two of ourmanufacturing facilities in Germany, $76 million related to the Gadsden, Alabama plan, and $18 million relatedto separate plans to reduce manufacturing headcount and improve operating efficiency in Americas and EMEA.
Prior year plan charges recognized in the year ended December 31, 2019 include $10 million primarily related toEMEA manufacturing plans. Prior year plan charges for the year ended December 31, 2019 also include reversalsof $4 million for actions no longer needed for their originally intended purposes.
Ongoing rationalization plans had approximately $930 million in charges through 2019 and approximately$50 million is expected to be incurred in future periods.
Approximately 2,100 associates will be released under new plans initiated in 2019, of which approximately 800were released through December 31, 2019. In 2019, approximately 400 associates were released under plansinitiated in prior years. Approximately 1,450 associates remain to be released under all ongoing rationalizationplans.
At December 31, 2019, approximately 850 former associates of the closed Amiens, France manufacturing facilityhave asserted wrongful termination or other claims against us. Refer to Note to the Consolidated FinancialStatements No. 19, Commitments and Contingent Liabilities.
Asset write-off and accelerated depreciation charges in 2019 primarily related to the curtailment of production atour Gadsden, Alabama manufacturing facility. Asset write-off and accelerated depreciation charges for allperiods were recorded in CGS.
49
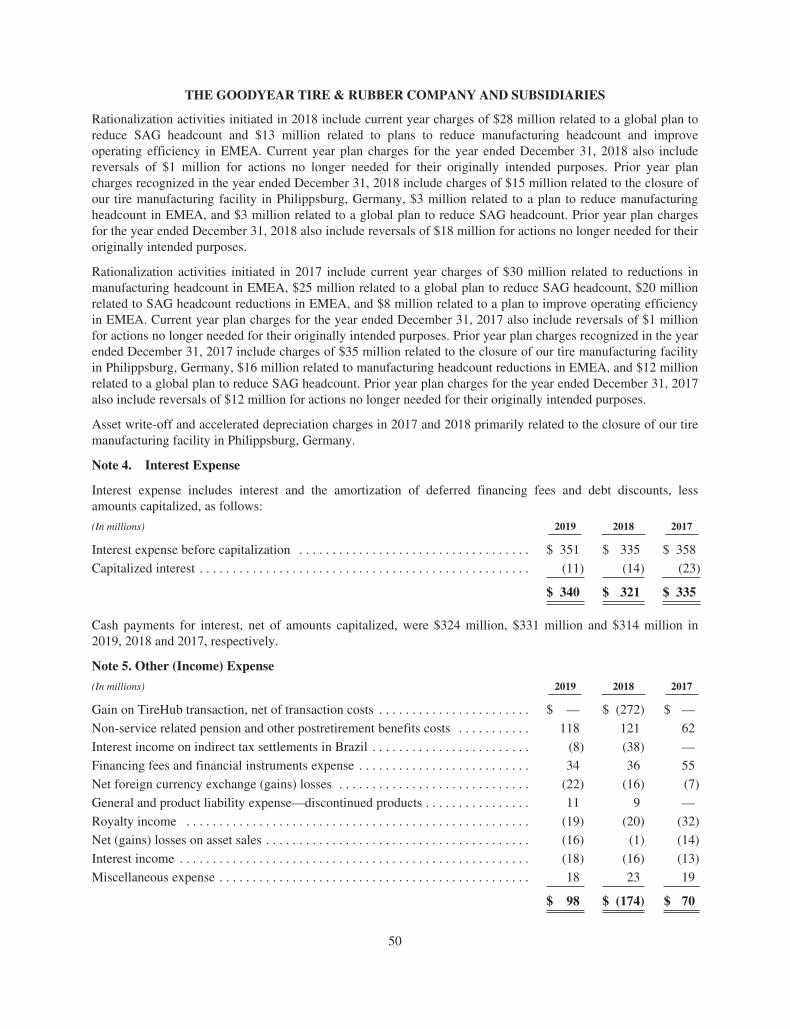
THE GOODYEAR TIRE & RUBBER COMPANY AND SUBSIDIARIES
Rationalization activities initiated in 2018 include current year charges of $28 million related to a global plan toreduce SAG headcount and $13 million related to plans to reduce manufacturing headcount and improveoperating efficiency in EMEA. Current year plan charges for the year ended December 31, 2018 also includereversals of $1 million for actions no longer needed for their originally intended purposes. Prior year plancharges recognized in the year ended December 31, 2018 include charges of $15 million related to the closure ofour tire manufacturing facility in Philippsburg, Germany, $3 million related to a plan to reduce manufacturingheadcount in EMEA, and $3 million related to a global plan to reduce SAG headcount. Prior year plan chargesfor the year ended December 31, 2018 also include reversals of $18 million for actions no longer needed for theiroriginally intended purposes.
Rationalization activities initiated in 2017 include current year charges of $30 million related to reductions inmanufacturing headcount in EMEA, $25 million related to a global plan to reduce SAG headcount, $20 millionrelated to SAG headcount reductions in EMEA, and $8 million related to a plan to improve operating efficiencyin EMEA. Current year plan charges for the year ended December 31, 2017 also include reversals of $1 millionfor actions no longer needed for their originally intended purposes. Prior year plan charges recognized in the yearended December 31, 2017 include charges of $35 million related to the closure of our tire manufacturing facilityin Philippsburg, Germany, $16 million related to manufacturing headcount reductions in EMEA, and $12 millionrelated to a global plan to reduce SAG headcount. Prior year plan charges for the year ended December 31, 2017also include reversals of $12 million for actions no longer needed for their originally intended purposes.
Asset write-off and accelerated depreciation charges in 2017 and 2018 primarily related to the closure of our tiremanufacturing facility in Philippsburg, Germany.
Note 4. Interest Expense
Interest expense includes interest and the amortization of deferred financing fees and debt discounts, lessamounts capitalized, as follows:
(In millions) 2019 2018 2017
Interest expense before capitalization . . . . . . . . . . . . . . . . . . . . . . . . . . . . . . . . . . . $ 351 $ 335 $ 358
Capitalized interest . . . . . . . . . . . . . . . . . . . . . . . . . . . . . . . . . . . . . . . . . . . . . . . . . . (11) (14) (23)
$ 340 $ 321 $ 335
Cash payments for interest, net of amounts capitalized, were $324 million, $331 million and $314 million in2019, 2018 and 2017, respectively.
Note 5. Other (Income) Expense
(In millions) 2019 2018 2017
Gain on TireHub transaction, net of transaction costs . . . . . . . . . . . . . . . . . . . . . . . $ — $ (272) $ —
Non-service related pension and other postretirement benefits costs . . . . . . . . . . . 118 121 62
Interest income on indirect tax settlements in Brazil . . . . . . . . . . . . . . . . . . . . . . . . (8) (38) —
Financing fees and financial instruments expense . . . . . . . . . . . . . . . . . . . . . . . . . . 34 36 55
Net foreign currency exchange (gains) losses . . . . . . . . . . . . . . . . . . . . . . . . . . . . . (22) (16) (7)
General and product liability expense—discontinued products . . . . . . . . . . . . . . . . 11 9 —
Royalty income . . . . . . . . . . . . . . . . . . . . . . . . . . . . . . . . . . . . . . . . . . . . . . . . . . . . (19) (20) (32)
Net (gains) losses on asset sales . . . . . . . . . . . . . . . . . . . . . . . . . . . . . . . . . . . . . . . . (16) (1) (14)
Interest income . . . . . . . . . . . . . . . . . . . . . . . . . . . . . . . . . . . . . . . . . . . . . . . . . . . . . (18) (16) (13)
Miscellaneous expense . . . . . . . . . . . . . . . . . . . . . . . . . . . . . . . . . . . . . . . . . . . . . . . 18 23 19
$ 98 $ (174) $ 70
50
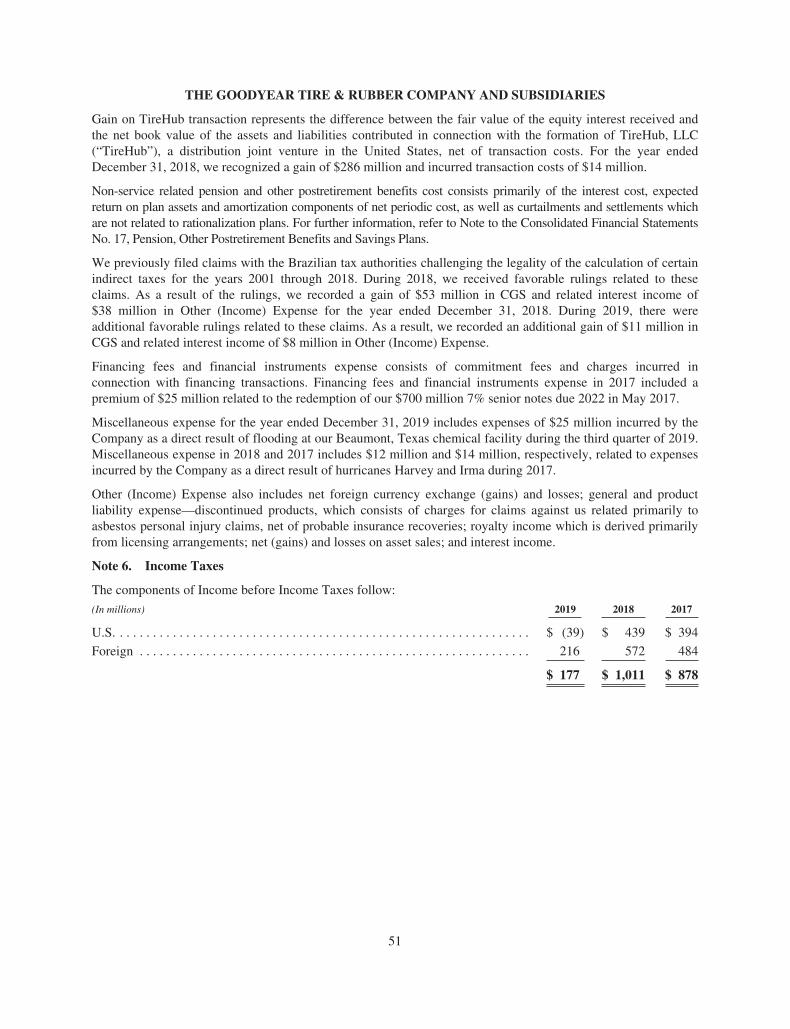
THE GOODYEAR TIRE & RUBBER COMPANY AND SUBSIDIARIES
Gain on TireHub transaction represents the difference between the fair value of the equity interest received andthe net book value of the assets and liabilities contributed in connection with the formation of TireHub, LLC(“TireHub”), a distribution joint venture in the United States, net of transaction costs. For the year endedDecember 31, 2018, we recognized a gain of $286 million and incurred transaction costs of $14 million.
Non-service related pension and other postretirement benefits cost consists primarily of the interest cost, expectedreturn on plan assets and amortization components of net periodic cost, as well as curtailments and settlements whichare not related to rationalization plans. For further information, refer to Note to the Consolidated Financial StatementsNo. 17, Pension, Other Postretirement Benefits and Savings Plans.
We previously filed claims with the Brazilian tax authorities challenging the legality of the calculation of certainindirect taxes for the years 2001 through 2018. During 2018, we received favorable rulings related to theseclaims. As a result of the rulings, we recorded a gain of $53 million in CGS and related interest income of$38 million in Other (Income) Expense for the year ended December 31, 2018. During 2019, there wereadditional favorable rulings related to these claims. As a result, we recorded an additional gain of $11 million inCGS and related interest income of $8 million in Other (Income) Expense.
Financing fees and financial instruments expense consists of commitment fees and charges incurred inconnection with financing transactions. Financing fees and financial instruments expense in 2017 included apremium of $25 million related to the redemption of our $700 million 7% senior notes due 2022 in May 2017.
Miscellaneous expense for the year ended December 31, 2019 includes expenses of $25 million incurred by theCompany as a direct result of flooding at our Beaumont, Texas chemical facility during the third quarter of 2019.Miscellaneous expense in 2018 and 2017 includes $12 million and $14 million, respectively, related to expensesincurred by the Company as a direct result of hurricanes Harvey and Irma during 2017.
Other (Income) Expense also includes net foreign currency exchange (gains) and losses; general and productliability expense—discontinued products, which consists of charges for claims against us related primarily toasbestos personal injury claims, net of probable insurance recoveries; royalty income which is derived primarilyfrom licensing arrangements; net (gains) and losses on asset sales; and interest income.
Note 6. Income Taxes
The components of Income before Income Taxes follow:
(In millions) 2019 2018 2017
U.S. . . . . . . . . . . . . . . . . . . . . . . . . . . . . . . . . . . . . . . . . . . . . . . . . . . . . . . . . . . . . . . $ (39) $ 439 $ 394
Foreign . . . . . . . . . . . . . . . . . . . . . . . . . . . . . . . . . . . . . . . . . . . . . . . . . . . . . . . . . . . 216 572 484
$ 177 $ 1,011 $ 878
51
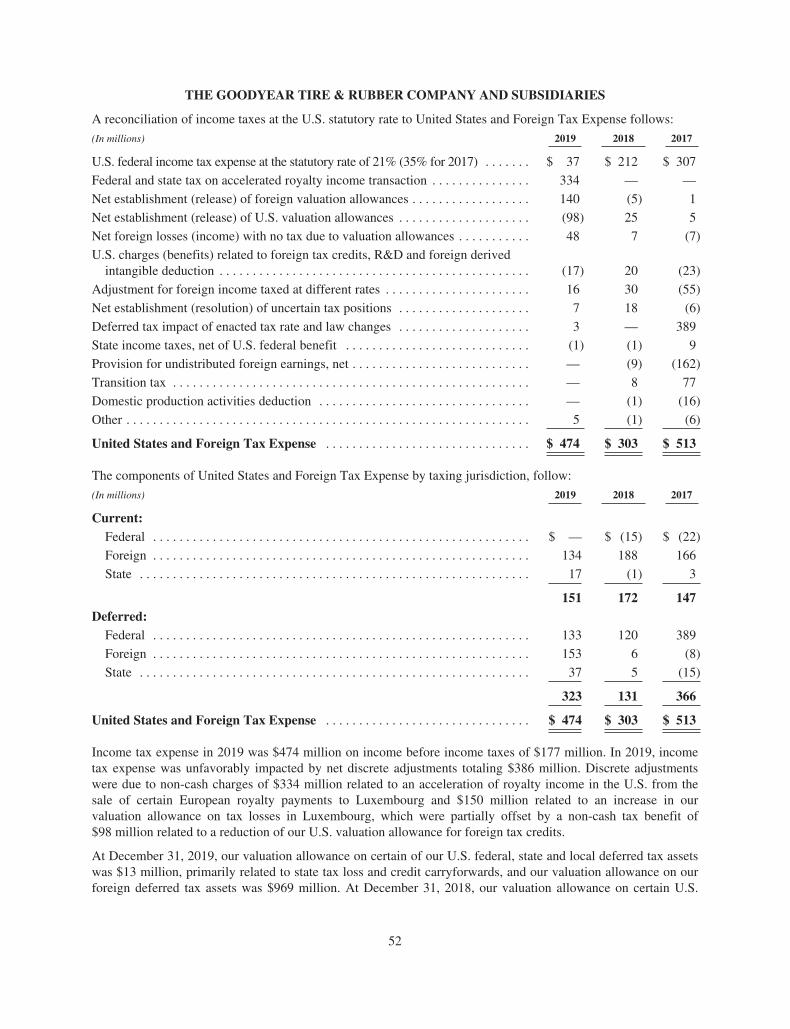
THE GOODYEAR TIRE & RUBBER COMPANY AND SUBSIDIARIES
A reconciliation of income taxes at the U.S. statutory rate to United States and Foreign Tax Expense follows:
(In millions) 2019 2018 2017
U.S. federal income tax expense at the statutory rate of 21% (35% for 2017) . . . . . . . $ 37 $ 212 $ 307
Federal and state tax on accelerated royalty income transaction . . . . . . . . . . . . . . . 334 — —
Net establishment (release) of foreign valuation allowances . . . . . . . . . . . . . . . . . . 140 (5) 1
Net establishment (release) of U.S. valuation allowances . . . . . . . . . . . . . . . . . . . . (98) 25 5
Net foreign losses (income) with no tax due to valuation allowances . . . . . . . . . . . 48 7 (7)
U.S. charges (benefits) related to foreign tax credits, R&D and foreign derivedintangible deduction . . . . . . . . . . . . . . . . . . . . . . . . . . . . . . . . . . . . . . . . . . . . . . . (17) 20 (23)
Adjustment for foreign income taxed at different rates . . . . . . . . . . . . . . . . . . . . . . 16 30 (55)
Net establishment (resolution) of uncertain tax positions . . . . . . . . . . . . . . . . . . . . 7 18 (6)
Deferred tax impact of enacted tax rate and law changes . . . . . . . . . . . . . . . . . . . . 3 — 389
State income taxes, net of U.S. federal benefit . . . . . . . . . . . . . . . . . . . . . . . . . . . . (1) (1) 9
Provision for undistributed foreign earnings, net . . . . . . . . . . . . . . . . . . . . . . . . . . . — (9) (162)
Transition tax . . . . . . . . . . . . . . . . . . . . . . . . . . . . . . . . . . . . . . . . . . . . . . . . . . . . . . — 8 77
Domestic production activities deduction . . . . . . . . . . . . . . . . . . . . . . . . . . . . . . . . — (1) (16)
Other . . . . . . . . . . . . . . . . . . . . . . . . . . . . . . . . . . . . . . . . . . . . . . . . . . . . . . . . . . . . . 5 (1) (6)
United States and Foreign Tax Expense . . . . . . . . . . . . . . . . . . . . . . . . . . . . . . . $ 474 $ 303 $ 513
The components of United States and Foreign Tax Expense by taxing jurisdiction, follow:
(In millions) 2019 2018 2017
Current:Federal . . . . . . . . . . . . . . . . . . . . . . . . . . . . . . . . . . . . . . . . . . . . . . . . . . . . . . . . . $ — $ (15) $ (22)
Foreign . . . . . . . . . . . . . . . . . . . . . . . . . . . . . . . . . . . . . . . . . . . . . . . . . . . . . . . . . 134 188 166
State . . . . . . . . . . . . . . . . . . . . . . . . . . . . . . . . . . . . . . . . . . . . . . . . . . . . . . . . . . . 17 (1) 3
151 172 147Deferred:
Federal . . . . . . . . . . . . . . . . . . . . . . . . . . . . . . . . . . . . . . . . . . . . . . . . . . . . . . . . . 133 120 389
Foreign . . . . . . . . . . . . . . . . . . . . . . . . . . . . . . . . . . . . . . . . . . . . . . . . . . . . . . . . . 153 6 (8)
State . . . . . . . . . . . . . . . . . . . . . . . . . . . . . . . . . . . . . . . . . . . . . . . . . . . . . . . . . . . 37 5 (15)
323 131 366
United States and Foreign Tax Expense . . . . . . . . . . . . . . . . . . . . . . . . . . . . . . . $ 474 $ 303 $ 513
Income tax expense in 2019 was $474 million on income before income taxes of $177 million. In 2019, incometax expense was unfavorably impacted by net discrete adjustments totaling $386 million. Discrete adjustmentswere due to non-cash charges of $334 million related to an acceleration of royalty income in the U.S. from thesale of certain European royalty payments to Luxembourg and $150 million related to an increase in ourvaluation allowance on tax losses in Luxembourg, which were partially offset by a non-cash tax benefit of$98 million related to a reduction of our U.S. valuation allowance for foreign tax credits.
At December 31, 2019, our valuation allowance on certain of our U.S. federal, state and local deferred tax assetswas $13 million, primarily related to state tax loss and credit carryforwards, and our valuation allowance on ourforeign deferred tax assets was $969 million. At December 31, 2018, our valuation allowance on certain U.S.
52
THE GOODYEAR TIRE & RUBBER COMPANY AND SUBSIDIARIES
federal, state and local deferred tax assets was $113 million and our valuation allowance on our foreign deferredtax assets was $204 million.
We consider both positive and negative evidence when measuring the need for a valuation allowance. The weightgiven to the evidence is commensurate with the extent to which it may be objectively verified. Current andcumulative financial reporting results are a source of objectively verifiable evidence. We give operating resultsduring the most recent three-year period a significant weight in our analysis. We typically only consider forecastsof future profitability when positive cumulative operating results exist in the most recent three-year period. Weperform scheduling exercises to determine if sufficient taxable income of the appropriate character exists in theperiods required in order to realize our deferred tax assets with limited lives (such as tax loss carryforwards andtax credits) prior to their expiration. We consider tax planning strategies available to accelerate taxable amountsif required to utilize expiring deferred tax assets. A valuation allowance is not required to the extent that, in ourjudgment, positive evidence exists with a magnitude and duration sufficient to result in a conclusion that it ismore likely than not that our deferred tax assets will be realized.
At December 31, 2019, our net deferred tax assets include approximately $403 million of foreign tax credits, netof a valuation allowance of $3 million, as compared to $637 million, net of a valuation allowance of$103 million, at December 31, 2018. If not utilized, these foreign tax credits will expire from 2022 to 2028.These credits were generated primarily from the receipt of foreign dividends. Our earnings and forecasts offuture profitability along with three significant sources of foreign income provide us sufficient positive evidenceto utilize these credits, despite the negative evidence of their limited carryforward periods. Those sources offoreign income are (1) 100% of our domestic profitability can be re-characterized as foreign source income undercurrent U.S. tax law to the extent domestic losses have offset foreign source income in prior years, (2) annual netforeign source income, exclusive of dividends, primarily from royalties, and (3) tax planning strategies, includingcapitalizing research and development costs, accelerating income on cross border sales of inventory or rawmaterials to our subsidiaries and reducing U.S. interest expense by, for example, reducing intercompany loansthrough repatriating current year earnings of foreign subsidiaries, all of which would increase our domesticprofitability.
Foreign source taxable income for the fourth quarter of 2019 includes accelerated royalty income in the U.S. of$2.1 billion received from Luxembourg as payment for the purchase of the right to receive technology royaltiesfrom our European operations for a period of 12 years. External specialists assisted management with thistransaction. The royalty sale transaction resulted in a U.S. tax charge of $334 million and a deferred tax asset andoffsetting valuation allowance of $576 million in Luxembourg.
Foreign source taxable income for the fourth quarter of 2019 also includes $320 million of accelerated cross-border sales of inventory from the U.S. to Canada, resulting in a U.S. tax charge of approximately $70 millionthat was offset by the establishment of a deferred tax asset.
The federal portion of the tax charges related to both the royalty acceleration and Canadian prepaymenttransactions was fully offset by the utilization of foreign tax credits of approximately $310 million. In addition,as a result of these transactions, we released an existing U.S. valuation allowance on foreign tax credits of$98 million.
We considered our current forecasts of future profitability in assessing our ability to realize our remaining netforeign tax credits. These forecasts include the impact of recent trends, including various macroeconomic factorssuch as raw material prices, on our profitability, as well as the impact of tax planning strategies. Macroeconomicfactors, including raw material prices, possess a high degree of volatility and can significantly impact ourprofitability. As such, there is a risk that future foreign source income will not be sufficient to fully utilize theseforeign tax credits. However, we believe our forecasts of future profitability along with the three significantsources of foreign income described above provide us sufficient positive evidence to conclude that it is morelikely than not that our foreign tax credits, net of remaining valuation allowances, will be fully utilized prior totheir various expiration dates.
53
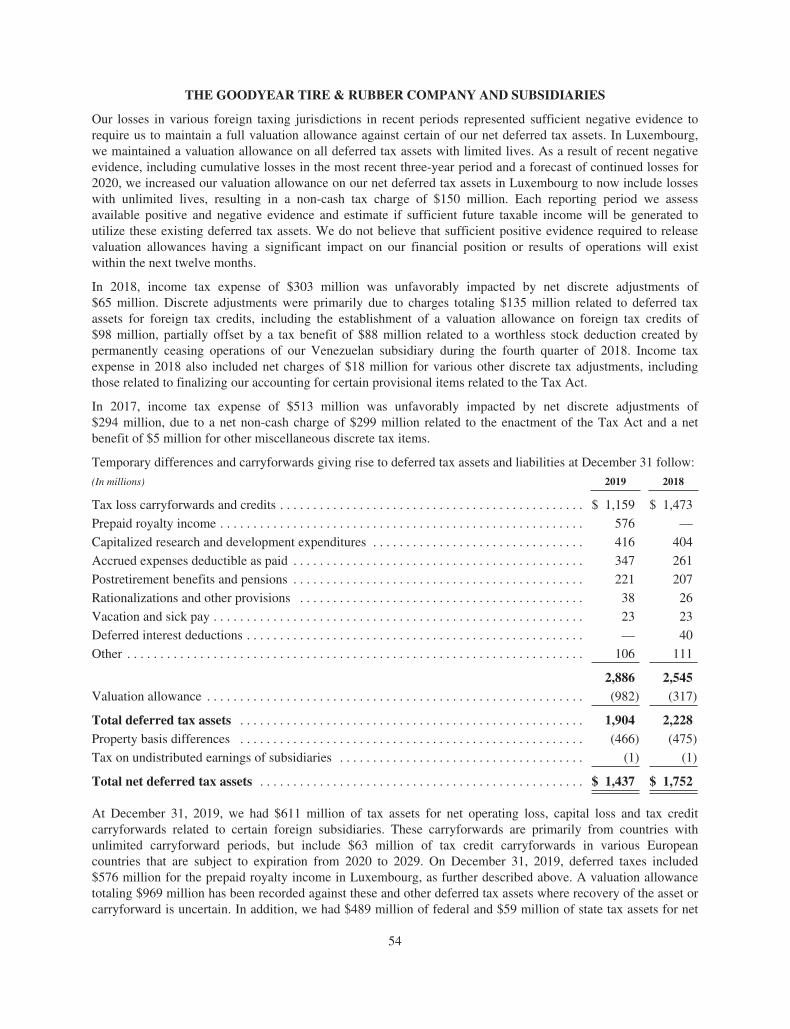
THE GOODYEAR TIRE & RUBBER COMPANY AND SUBSIDIARIES
Our losses in various foreign taxing jurisdictions in recent periods represented sufficient negative evidence torequire us to maintain a full valuation allowance against certain of our net deferred tax assets. In Luxembourg,we maintained a valuation allowance on all deferred tax assets with limited lives. As a result of recent negativeevidence, including cumulative losses in the most recent three-year period and a forecast of continued losses for2020, we increased our valuation allowance on our net deferred tax assets in Luxembourg to now include losseswith unlimited lives, resulting in a non-cash tax charge of $150 million. Each reporting period we assessavailable positive and negative evidence and estimate if sufficient future taxable income will be generated toutilize these existing deferred tax assets. We do not believe that sufficient positive evidence required to releasevaluation allowances having a significant impact on our financial position or results of operations will existwithin the next twelve months.
In 2018, income tax expense of $303 million was unfavorably impacted by net discrete adjustments of$65 million. Discrete adjustments were primarily due to charges totaling $135 million related to deferred taxassets for foreign tax credits, including the establishment of a valuation allowance on foreign tax credits of$98 million, partially offset by a tax benefit of $88 million related to a worthless stock deduction created bypermanently ceasing operations of our Venezuelan subsidiary during the fourth quarter of 2018. Income taxexpense in 2018 also included net charges of $18 million for various other discrete tax adjustments, includingthose related to finalizing our accounting for certain provisional items related to the Tax Act.
In 2017, income tax expense of $513 million was unfavorably impacted by net discrete adjustments of$294 million, due to a net non-cash charge of $299 million related to the enactment of the Tax Act and a netbenefit of $5 million for other miscellaneous discrete tax items.
Temporary differences and carryforwards giving rise to deferred tax assets and liabilities at December 31 follow:
(In millions) 2019 2018
Tax loss carryforwards and credits . . . . . . . . . . . . . . . . . . . . . . . . . . . . . . . . . . . . . . . . . . . . . . $ 1,159 $ 1,473
Prepaid royalty income . . . . . . . . . . . . . . . . . . . . . . . . . . . . . . . . . . . . . . . . . . . . . . . . . . . . . . . 576 —
Capitalized research and development expenditures . . . . . . . . . . . . . . . . . . . . . . . . . . . . . . . . 416 404
Accrued expenses deductible as paid . . . . . . . . . . . . . . . . . . . . . . . . . . . . . . . . . . . . . . . . . . . . 347 261
Postretirement benefits and pensions . . . . . . . . . . . . . . . . . . . . . . . . . . . . . . . . . . . . . . . . . . . . 221 207
Rationalizations and other provisions . . . . . . . . . . . . . . . . . . . . . . . . . . . . . . . . . . . . . . . . . . . 38 26
Vacation and sick pay . . . . . . . . . . . . . . . . . . . . . . . . . . . . . . . . . . . . . . . . . . . . . . . . . . . . . . . . 23 23
Deferred interest deductions . . . . . . . . . . . . . . . . . . . . . . . . . . . . . . . . . . . . . . . . . . . . . . . . . . . — 40
Other . . . . . . . . . . . . . . . . . . . . . . . . . . . . . . . . . . . . . . . . . . . . . . . . . . . . . . . . . . . . . . . . . . . . . 106 111
2,886 2,545Valuation allowance . . . . . . . . . . . . . . . . . . . . . . . . . . . . . . . . . . . . . . . . . . . . . . . . . . . . . . . . . (982) (317)
Total deferred tax assets . . . . . . . . . . . . . . . . . . . . . . . . . . . . . . . . . . . . . . . . . . . . . . . . . . . . 1,904 2,228Property basis differences . . . . . . . . . . . . . . . . . . . . . . . . . . . . . . . . . . . . . . . . . . . . . . . . . . . . (466) (475)
Tax on undistributed earnings of subsidiaries . . . . . . . . . . . . . . . . . . . . . . . . . . . . . . . . . . . . . (1) (1)
Total net deferred tax assets . . . . . . . . . . . . . . . . . . . . . . . . . . . . . . . . . . . . . . . . . . . . . . . . . $ 1,437 $ 1,752
At December 31, 2019, we had $611 million of tax assets for net operating loss, capital loss and tax creditcarryforwards related to certain foreign subsidiaries. These carryforwards are primarily from countries withunlimited carryforward periods, but include $63 million of tax credit carryforwards in various Europeancountries that are subject to expiration from 2020 to 2029. On December 31, 2019, deferred taxes included$576 million for the prepaid royalty income in Luxembourg, as further described above. A valuation allowancetotaling $969 million has been recorded against these and other deferred tax assets where recovery of the asset orcarryforward is uncertain. In addition, we had $489 million of federal and $59 million of state tax assets for net
54
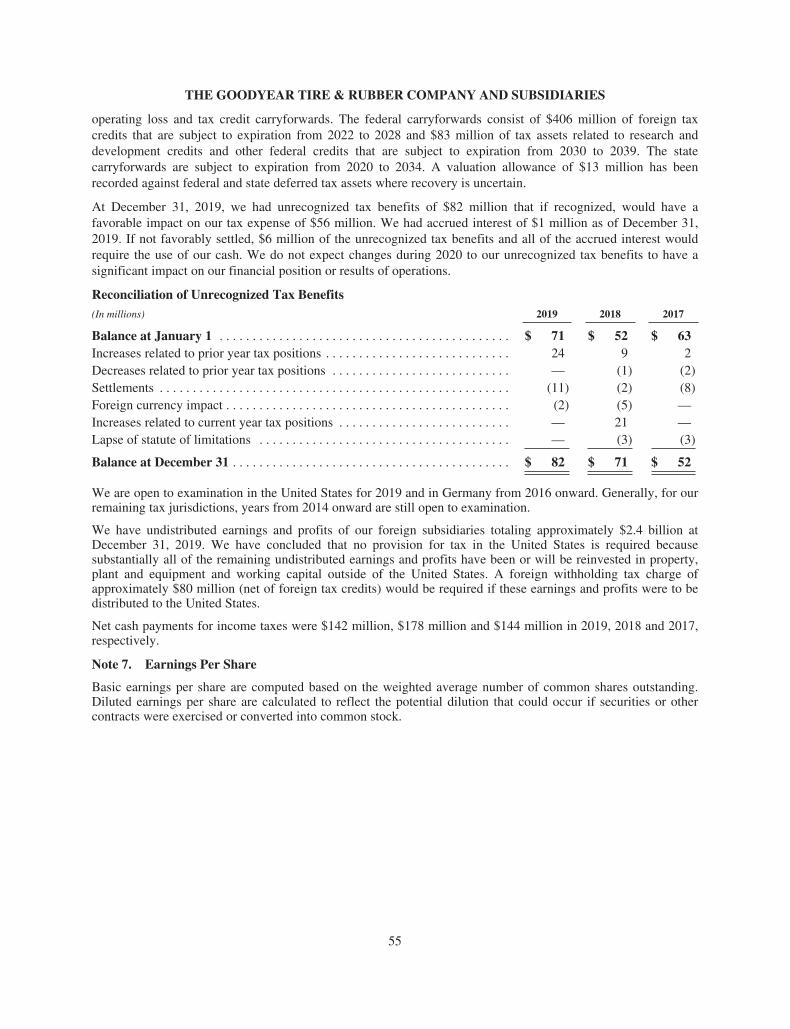
THE GOODYEAR TIRE & RUBBER COMPANY AND SUBSIDIARIES
operating loss and tax credit carryforwards. The federal carryforwards consist of $406 million of foreign taxcredits that are subject to expiration from 2022 to 2028 and $83 million of tax assets related to research anddevelopment credits and other federal credits that are subject to expiration from 2030 to 2039. The statecarryforwards are subject to expiration from 2020 to 2034. A valuation allowance of $13 million has beenrecorded against federal and state deferred tax assets where recovery is uncertain.
At December 31, 2019, we had unrecognized tax benefits of $82 million that if recognized, would have afavorable impact on our tax expense of $56 million. We had accrued interest of $1 million as of December 31,2019. If not favorably settled, $6 million of the unrecognized tax benefits and all of the accrued interest wouldrequire the use of our cash. We do not expect changes during 2020 to our unrecognized tax benefits to have asignificant impact on our financial position or results of operations.
Reconciliation of Unrecognized Tax Benefits(In millions) 2019 2018 2017
Balance at January 1 . . . . . . . . . . . . . . . . . . . . . . . . . . . . . . . . . . . . . . . . . . . . $ 71 $ 52 $ 63Increases related to prior year tax positions . . . . . . . . . . . . . . . . . . . . . . . . . . . . 24 9 2Decreases related to prior year tax positions . . . . . . . . . . . . . . . . . . . . . . . . . . . — (1) (2)Settlements . . . . . . . . . . . . . . . . . . . . . . . . . . . . . . . . . . . . . . . . . . . . . . . . . . . . . (11) (2) (8)Foreign currency impact . . . . . . . . . . . . . . . . . . . . . . . . . . . . . . . . . . . . . . . . . . . (2) (5) —Increases related to current year tax positions . . . . . . . . . . . . . . . . . . . . . . . . . . — 21 —Lapse of statute of limitations . . . . . . . . . . . . . . . . . . . . . . . . . . . . . . . . . . . . . . — (3) (3)
Balance at December 31 . . . . . . . . . . . . . . . . . . . . . . . . . . . . . . . . . . . . . . . . . . $ 82 $ 71 $ 52
We are open to examination in the United States for 2019 and in Germany from 2016 onward. Generally, for ourremaining tax jurisdictions, years from 2014 onward are still open to examination.
We have undistributed earnings and profits of our foreign subsidiaries totaling approximately $2.4 billion atDecember 31, 2019. We have concluded that no provision for tax in the United States is required becausesubstantially all of the remaining undistributed earnings and profits have been or will be reinvested in property,plant and equipment and working capital outside of the United States. A foreign withholding tax charge ofapproximately $80 million (net of foreign tax credits) would be required if these earnings and profits were to bedistributed to the United States.
Net cash payments for income taxes were $142 million, $178 million and $144 million in 2019, 2018 and 2017,respectively.
Note 7. Earnings Per Share
Basic earnings per share are computed based on the weighted average number of common shares outstanding.Diluted earnings per share are calculated to reflect the potential dilution that could occur if securities or othercontracts were exercised or converted into common stock.
55
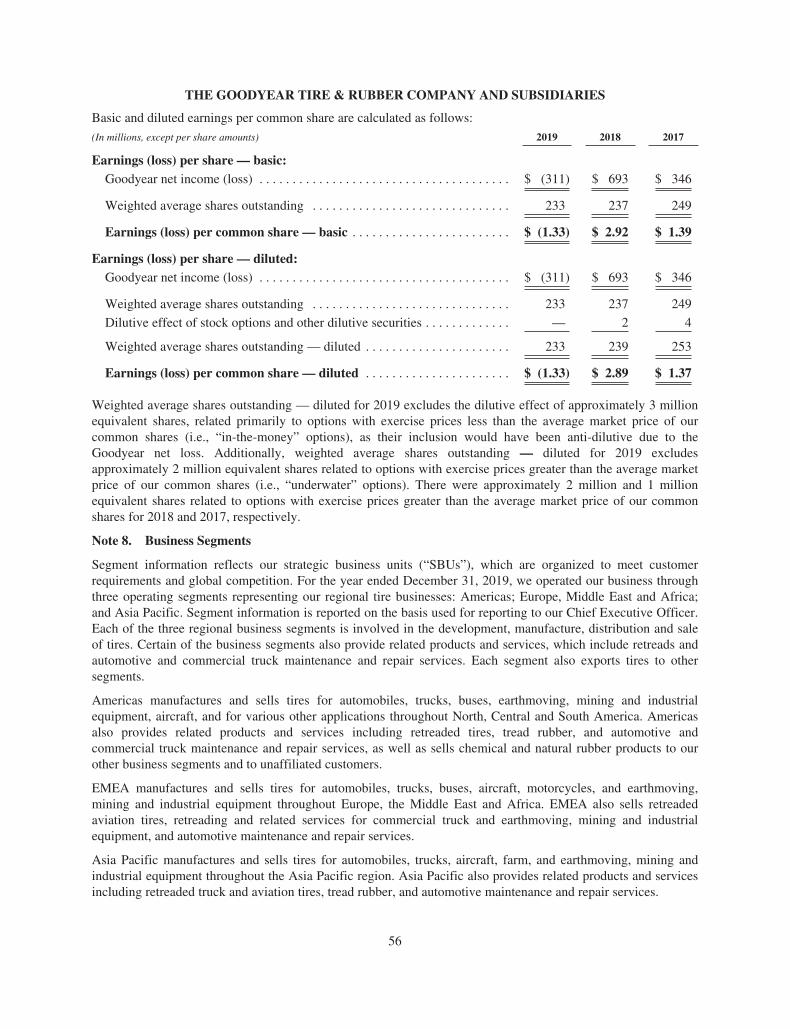
THE GOODYEAR TIRE & RUBBER COMPANY AND SUBSIDIARIES
Basic and diluted earnings per common share are calculated as follows:
(In millions, except per share amounts) 2019 2018 2017
Earnings (loss) per share — basic:Goodyear net income (loss) . . . . . . . . . . . . . . . . . . . . . . . . . . . . . . . . . . . . . . $ (311) $ 693 $ 346
Weighted average shares outstanding . . . . . . . . . . . . . . . . . . . . . . . . . . . . . . 233 237 249
Earnings (loss) per common share — basic . . . . . . . . . . . . . . . . . . . . . . . . $ (1.33) $ 2.92 $ 1.39
Earnings (loss) per share — diluted:Goodyear net income (loss) . . . . . . . . . . . . . . . . . . . . . . . . . . . . . . . . . . . . . . $ (311) $ 693 $ 346
Weighted average shares outstanding . . . . . . . . . . . . . . . . . . . . . . . . . . . . . . 233 237 249
Dilutive effect of stock options and other dilutive securities . . . . . . . . . . . . . — 2 4
Weighted average shares outstanding — diluted . . . . . . . . . . . . . . . . . . . . . . 233 239 253
Earnings (loss) per common share — diluted . . . . . . . . . . . . . . . . . . . . . . $ (1.33) $ 2.89 $ 1.37
Weighted average shares outstanding — diluted for 2019 excludes the dilutive effect of approximately 3 millionequivalent shares, related primarily to options with exercise prices less than the average market price of ourcommon shares (i.e., “in-the-money” options), as their inclusion would have been anti-dilutive due to theGoodyear net loss. Additionally, weighted average shares outstanding — diluted for 2019 excludesapproximately 2 million equivalent shares related to options with exercise prices greater than the average marketprice of our common shares (i.e., “underwater” options). There were approximately 2 million and 1 millionequivalent shares related to options with exercise prices greater than the average market price of our commonshares for 2018 and 2017, respectively.
Note 8. Business Segments
Segment information reflects our strategic business units (“SBUs”), which are organized to meet customerrequirements and global competition. For the year ended December 31, 2019, we operated our business throughthree operating segments representing our regional tire businesses: Americas; Europe, Middle East and Africa;and Asia Pacific. Segment information is reported on the basis used for reporting to our Chief Executive Officer.Each of the three regional business segments is involved in the development, manufacture, distribution and saleof tires. Certain of the business segments also provide related products and services, which include retreads andautomotive and commercial truck maintenance and repair services. Each segment also exports tires to othersegments.
Americas manufactures and sells tires for automobiles, trucks, buses, earthmoving, mining and industrialequipment, aircraft, and for various other applications throughout North, Central and South America. Americasalso provides related products and services including retreaded tires, tread rubber, and automotive andcommercial truck maintenance and repair services, as well as sells chemical and natural rubber products to ourother business segments and to unaffiliated customers.
EMEA manufactures and sells tires for automobiles, trucks, buses, aircraft, motorcycles, and earthmoving,mining and industrial equipment throughout Europe, the Middle East and Africa. EMEA also sells retreadedaviation tires, retreading and related services for commercial truck and earthmoving, mining and industrialequipment, and automotive maintenance and repair services.
Asia Pacific manufactures and sells tires for automobiles, trucks, aircraft, farm, and earthmoving, mining andindustrial equipment throughout the Asia Pacific region. Asia Pacific also provides related products and servicesincluding retreaded truck and aviation tires, tread rubber, and automotive maintenance and repair services.
56
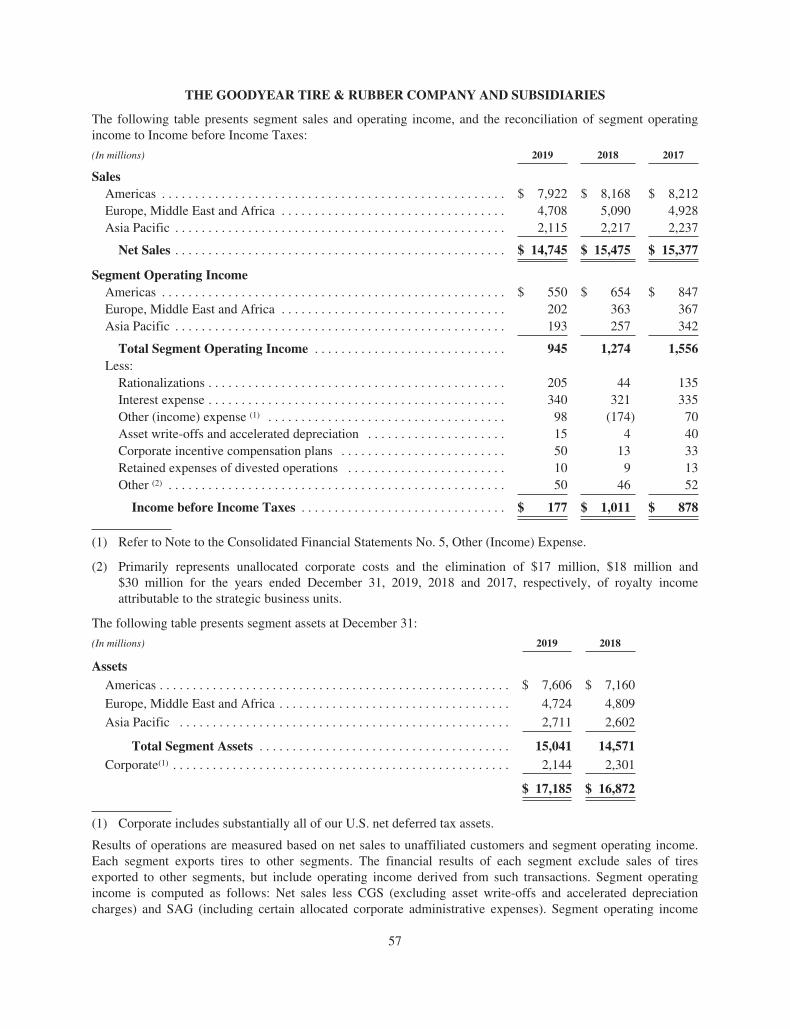
THE GOODYEAR TIRE & RUBBER COMPANY AND SUBSIDIARIES
The following table presents segment sales and operating income, and the reconciliation of segment operatingincome to Income before Income Taxes:
(In millions) 2019 2018 2017
SalesAmericas . . . . . . . . . . . . . . . . . . . . . . . . . . . . . . . . . . . . . . . . . . . . . . . . . . . . $ 7,922 $ 8,168 $ 8,212Europe, Middle East and Africa . . . . . . . . . . . . . . . . . . . . . . . . . . . . . . . . . . 4,708 5,090 4,928Asia Pacific . . . . . . . . . . . . . . . . . . . . . . . . . . . . . . . . . . . . . . . . . . . . . . . . . . 2,115 2,217 2,237
Net Sales . . . . . . . . . . . . . . . . . . . . . . . . . . . . . . . . . . . . . . . . . . . . . . . . . . $ 14,745 $ 15,475 $ 15,377
Segment Operating IncomeAmericas . . . . . . . . . . . . . . . . . . . . . . . . . . . . . . . . . . . . . . . . . . . . . . . . . . . . $ 550 $ 654 $ 847Europe, Middle East and Africa . . . . . . . . . . . . . . . . . . . . . . . . . . . . . . . . . . 202 363 367Asia Pacific . . . . . . . . . . . . . . . . . . . . . . . . . . . . . . . . . . . . . . . . . . . . . . . . . . 193 257 342
Total Segment Operating Income . . . . . . . . . . . . . . . . . . . . . . . . . . . . . 945 1,274 1,556Less:
Rationalizations . . . . . . . . . . . . . . . . . . . . . . . . . . . . . . . . . . . . . . . . . . . . . 205 44 135Interest expense . . . . . . . . . . . . . . . . . . . . . . . . . . . . . . . . . . . . . . . . . . . . . 340 321 335Other (income) expense (1) . . . . . . . . . . . . . . . . . . . . . . . . . . . . . . . . . . . . 98 (174) 70Asset write-offs and accelerated depreciation . . . . . . . . . . . . . . . . . . . . . 15 4 40Corporate incentive compensation plans . . . . . . . . . . . . . . . . . . . . . . . . . 50 13 33Retained expenses of divested operations . . . . . . . . . . . . . . . . . . . . . . . . 10 9 13Other (2) . . . . . . . . . . . . . . . . . . . . . . . . . . . . . . . . . . . . . . . . . . . . . . . . . . . 50 46 52
Income before Income Taxes . . . . . . . . . . . . . . . . . . . . . . . . . . . . . . . $ 177 $ 1,011 $ 878
(1) Refer to Note to the Consolidated Financial Statements No. 5, Other (Income) Expense.
(2) Primarily represents unallocated corporate costs and the elimination of $17 million, $18 million and$30 million for the years ended December 31, 2019, 2018 and 2017, respectively, of royalty incomeattributable to the strategic business units.
The following table presents segment assets at December 31:
(In millions) 2019 2018
AssetsAmericas . . . . . . . . . . . . . . . . . . . . . . . . . . . . . . . . . . . . . . . . . . . . . . . . . . . . . $ 7,606 $ 7,160
Europe, Middle East and Africa . . . . . . . . . . . . . . . . . . . . . . . . . . . . . . . . . . . 4,724 4,809
Asia Pacific . . . . . . . . . . . . . . . . . . . . . . . . . . . . . . . . . . . . . . . . . . . . . . . . . . 2,711 2,602
Total Segment Assets . . . . . . . . . . . . . . . . . . . . . . . . . . . . . . . . . . . . . . 15,041 14,571Corporate(1) . . . . . . . . . . . . . . . . . . . . . . . . . . . . . . . . . . . . . . . . . . . . . . . . . . . 2,144 2,301
$ 17,185 $ 16,872
(1) Corporate includes substantially all of our U.S. net deferred tax assets.
Results of operations are measured based on net sales to unaffiliated customers and segment operating income.Each segment exports tires to other segments. The financial results of each segment exclude sales of tiresexported to other segments, but include operating income derived from such transactions. Segment operatingincome is computed as follows: Net sales less CGS (excluding asset write-offs and accelerated depreciationcharges) and SAG (including certain allocated corporate administrative expenses). Segment operating income
57
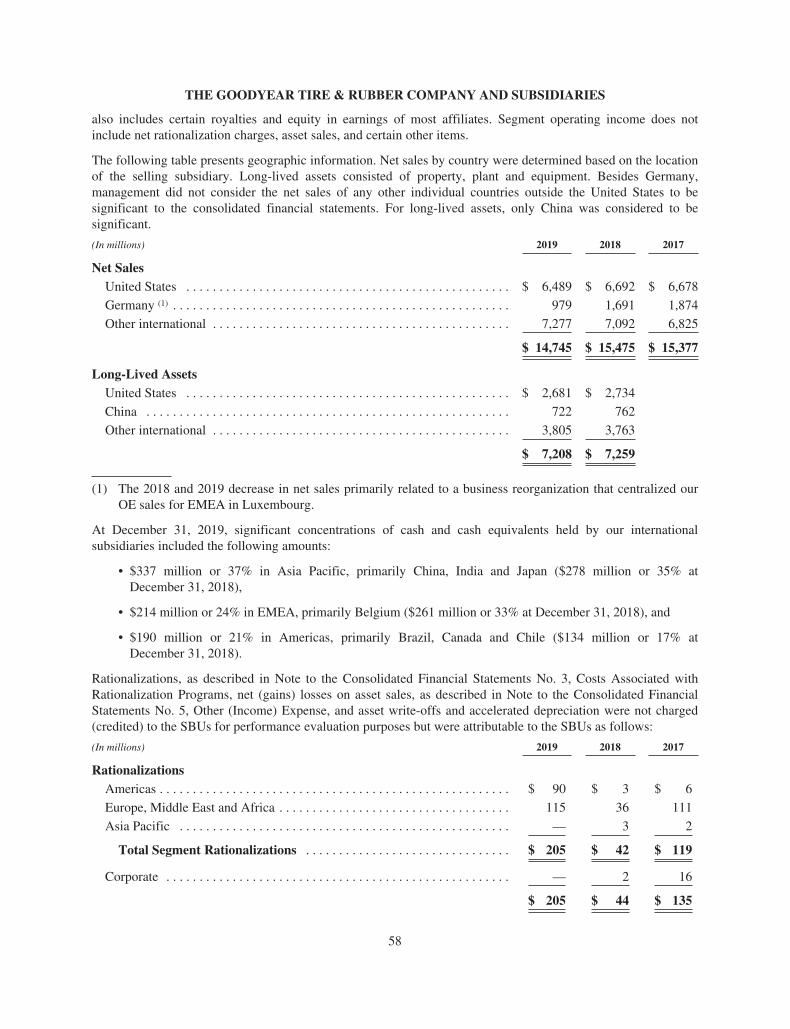
THE GOODYEAR TIRE & RUBBER COMPANY AND SUBSIDIARIES
also includes certain royalties and equity in earnings of most affiliates. Segment operating income does notinclude net rationalization charges, asset sales, and certain other items.
The following table presents geographic information. Net sales by country were determined based on the locationof the selling subsidiary. Long-lived assets consisted of property, plant and equipment. Besides Germany,management did not consider the net sales of any other individual countries outside the United States to besignificant to the consolidated financial statements. For long-lived assets, only China was considered to besignificant.
(In millions) 2019 2018 2017
Net SalesUnited States . . . . . . . . . . . . . . . . . . . . . . . . . . . . . . . . . . . . . . . . . . . . . . . . . $ 6,489 $ 6,692 $ 6,678
Germany (1) . . . . . . . . . . . . . . . . . . . . . . . . . . . . . . . . . . . . . . . . . . . . . . . . . . . 979 1,691 1,874
Other international . . . . . . . . . . . . . . . . . . . . . . . . . . . . . . . . . . . . . . . . . . . . . 7,277 7,092 6,825
$ 14,745 $ 15,475 $ 15,377
Long-Lived AssetsUnited States . . . . . . . . . . . . . . . . . . . . . . . . . . . . . . . . . . . . . . . . . . . . . . . . . $ 2,681 $ 2,734
China . . . . . . . . . . . . . . . . . . . . . . . . . . . . . . . . . . . . . . . . . . . . . . . . . . . . . . . 722 762
Other international . . . . . . . . . . . . . . . . . . . . . . . . . . . . . . . . . . . . . . . . . . . . . 3,805 3,763
$ 7,208 $ 7,259
(1) The 2018 and 2019 decrease in net sales primarily related to a business reorganization that centralized ourOE sales for EMEA in Luxembourg.
At December 31, 2019, significant concentrations of cash and cash equivalents held by our internationalsubsidiaries included the following amounts:
• $337 million or 37% in Asia Pacific, primarily China, India and Japan ($278 million or 35% atDecember 31, 2018),
• $214 million or 24% in EMEA, primarily Belgium ($261 million or 33% at December 31, 2018), and
• $190 million or 21% in Americas, primarily Brazil, Canada and Chile ($134 million or 17% atDecember 31, 2018).
Rationalizations, as described in Note to the Consolidated Financial Statements No. 3, Costs Associated withRationalization Programs, net (gains) losses on asset sales, as described in Note to the Consolidated FinancialStatements No. 5, Other (Income) Expense, and asset write-offs and accelerated depreciation were not charged(credited) to the SBUs for performance evaluation purposes but were attributable to the SBUs as follows:
(In millions) 2019 2018 2017
RationalizationsAmericas . . . . . . . . . . . . . . . . . . . . . . . . . . . . . . . . . . . . . . . . . . . . . . . . . . . . . $ 90 $ 3 $ 6
Europe, Middle East and Africa . . . . . . . . . . . . . . . . . . . . . . . . . . . . . . . . . . . 115 36 111
Asia Pacific . . . . . . . . . . . . . . . . . . . . . . . . . . . . . . . . . . . . . . . . . . . . . . . . . . — 3 2
Total Segment Rationalizations . . . . . . . . . . . . . . . . . . . . . . . . . . . . . . . $ 205 $ 42 $ 119
Corporate . . . . . . . . . . . . . . . . . . . . . . . . . . . . . . . . . . . . . . . . . . . . . . . . . . . . — 2 16
$ 205 $ 44 $ 135
58
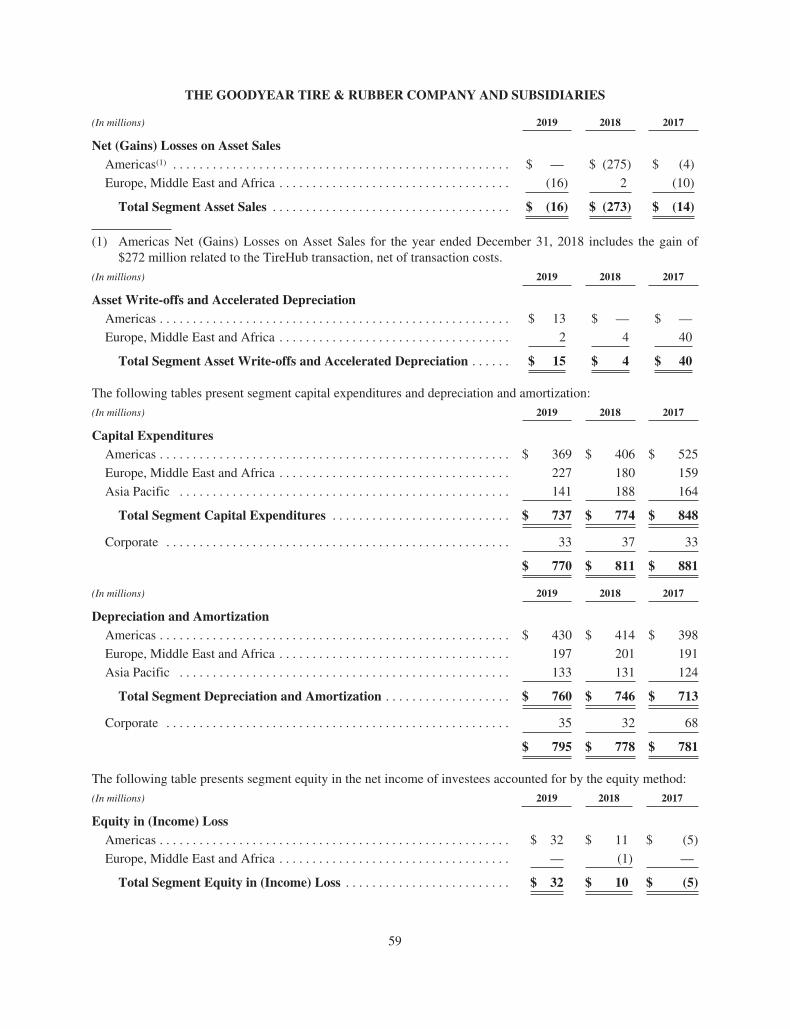
THE GOODYEAR TIRE & RUBBER COMPANY AND SUBSIDIARIES
(In millions) 2019 2018 2017
Net (Gains) Losses on Asset SalesAmericas(1) . . . . . . . . . . . . . . . . . . . . . . . . . . . . . . . . . . . . . . . . . . . . . . . . . . . $ — $ (275) $ (4)
Europe, Middle East and Africa . . . . . . . . . . . . . . . . . . . . . . . . . . . . . . . . . . . (16) 2 (10)
Total Segment Asset Sales . . . . . . . . . . . . . . . . . . . . . . . . . . . . . . . . . . . . $ (16) $ (273) $ (14)
(1) Americas Net (Gains) Losses on Asset Sales for the year ended December 31, 2018 includes the gain of$272 million related to the TireHub transaction, net of transaction costs.
(In millions) 2019 2018 2017
Asset Write-offs and Accelerated DepreciationAmericas . . . . . . . . . . . . . . . . . . . . . . . . . . . . . . . . . . . . . . . . . . . . . . . . . . . . . $ 13 $ — $ —
Europe, Middle East and Africa . . . . . . . . . . . . . . . . . . . . . . . . . . . . . . . . . . . 2 4 40
Total Segment Asset Write-offs and Accelerated Depreciation . . . . . . $ 15 $ 4 $ 40
The following tables present segment capital expenditures and depreciation and amortization:
(In millions) 2019 2018 2017
Capital ExpendituresAmericas . . . . . . . . . . . . . . . . . . . . . . . . . . . . . . . . . . . . . . . . . . . . . . . . . . . . . $ 369 $ 406 $ 525
Europe, Middle East and Africa . . . . . . . . . . . . . . . . . . . . . . . . . . . . . . . . . . . 227 180 159
Asia Pacific . . . . . . . . . . . . . . . . . . . . . . . . . . . . . . . . . . . . . . . . . . . . . . . . . . 141 188 164
Total Segment Capital Expenditures . . . . . . . . . . . . . . . . . . . . . . . . . . . $ 737 $ 774 $ 848
Corporate . . . . . . . . . . . . . . . . . . . . . . . . . . . . . . . . . . . . . . . . . . . . . . . . . . . . 33 37 33
$ 770 $ 811 $ 881
(In millions) 2019 2018 2017
Depreciation and AmortizationAmericas . . . . . . . . . . . . . . . . . . . . . . . . . . . . . . . . . . . . . . . . . . . . . . . . . . . . . $ 430 $ 414 $ 398
Europe, Middle East and Africa . . . . . . . . . . . . . . . . . . . . . . . . . . . . . . . . . . . 197 201 191
Asia Pacific . . . . . . . . . . . . . . . . . . . . . . . . . . . . . . . . . . . . . . . . . . . . . . . . . . 133 131 124
Total Segment Depreciation and Amortization . . . . . . . . . . . . . . . . . . . $ 760 $ 746 $ 713
Corporate . . . . . . . . . . . . . . . . . . . . . . . . . . . . . . . . . . . . . . . . . . . . . . . . . . . . 35 32 68
$ 795 $ 778 $ 781
The following table presents segment equity in the net income of investees accounted for by the equity method:
(In millions) 2019 2018 2017
Equity in (Income) LossAmericas . . . . . . . . . . . . . . . . . . . . . . . . . . . . . . . . . . . . . . . . . . . . . . . . . . . . . $ 32 $ 11 $ (5)
Europe, Middle East and Africa . . . . . . . . . . . . . . . . . . . . . . . . . . . . . . . . . . . — (1) —
Total Segment Equity in (Income) Loss . . . . . . . . . . . . . . . . . . . . . . . . . $ 32 $ 10 $ (5)
59
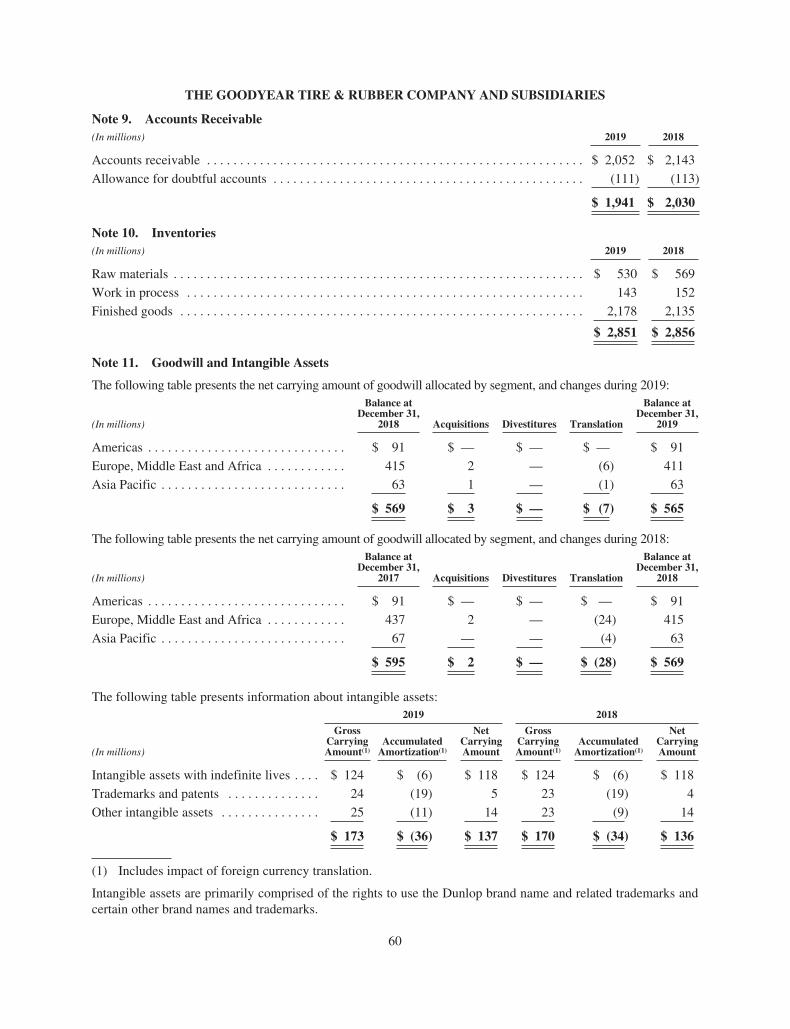
THE GOODYEAR TIRE & RUBBER COMPANY AND SUBSIDIARIES
Note 9. Accounts Receivable(In millions) 2019 2018
Accounts receivable . . . . . . . . . . . . . . . . . . . . . . . . . . . . . . . . . . . . . . . . . . . . . . . . . . . . . . . . . $ 2,052 $ 2,143
Allowance for doubtful accounts . . . . . . . . . . . . . . . . . . . . . . . . . . . . . . . . . . . . . . . . . . . . . . . (111) (113)
$ 1,941 $ 2,030
Note 10. Inventories(In millions) 2019 2018
Raw materials . . . . . . . . . . . . . . . . . . . . . . . . . . . . . . . . . . . . . . . . . . . . . . . . . . . . . . . . . . . . . . $ 530 $ 569
Work in process . . . . . . . . . . . . . . . . . . . . . . . . . . . . . . . . . . . . . . . . . . . . . . . . . . . . . . . . . . . . 143 152
Finished goods . . . . . . . . . . . . . . . . . . . . . . . . . . . . . . . . . . . . . . . . . . . . . . . . . . . . . . . . . . . . . 2,178 2,135
$ 2,851 $ 2,856
Note 11. Goodwill and Intangible Assets
The following table presents the net carrying amount of goodwill allocated by segment, and changes during 2019:
(In millions)
Balance atDecember 31,
2018 Acquisitions Divestitures Translation
Balance atDecember 31,
2019
Americas . . . . . . . . . . . . . . . . . . . . . . . . . . . . . . $ 91 $ — $ — $ — $ 91
Europe, Middle East and Africa . . . . . . . . . . . . 415 2 — (6) 411
Asia Pacific . . . . . . . . . . . . . . . . . . . . . . . . . . . . 63 1 — (1) 63
$ 569 $ 3 $ — $ (7) $ 565
The following table presents the net carrying amount of goodwill allocated by segment, and changes during 2018:
(In millions)
Balance atDecember 31,
2017 Acquisitions Divestitures Translation
Balance atDecember 31,
2018
Americas . . . . . . . . . . . . . . . . . . . . . . . . . . . . . . $ 91 $ — $ — $ — $ 91
Europe, Middle East and Africa . . . . . . . . . . . . 437 2 — (24) 415
Asia Pacific . . . . . . . . . . . . . . . . . . . . . . . . . . . . 67 — — (4) 63
$ 595 $ 2 $ — $ (28) $ 569
The following table presents information about intangible assets:2019 2018
(In millions)
GrossCarryingAmount(1)
AccumulatedAmortization(1)
NetCarryingAmount
GrossCarryingAmount(1)
AccumulatedAmortization(1)
NetCarryingAmount
Intangible assets with indefinite lives . . . . $ 124 $ (6) $ 118 $ 124 $ (6) $ 118
Trademarks and patents . . . . . . . . . . . . . . 24 (19) 5 23 (19) 4
Other intangible assets . . . . . . . . . . . . . . . 25 (11) 14 23 (9) 14
$ 173 $ (36) $ 137 $ 170 $ (34) $ 136
(1) Includes impact of foreign currency translation.
Intangible assets are primarily comprised of the rights to use the Dunlop brand name and related trademarks andcertain other brand names and trademarks.
60
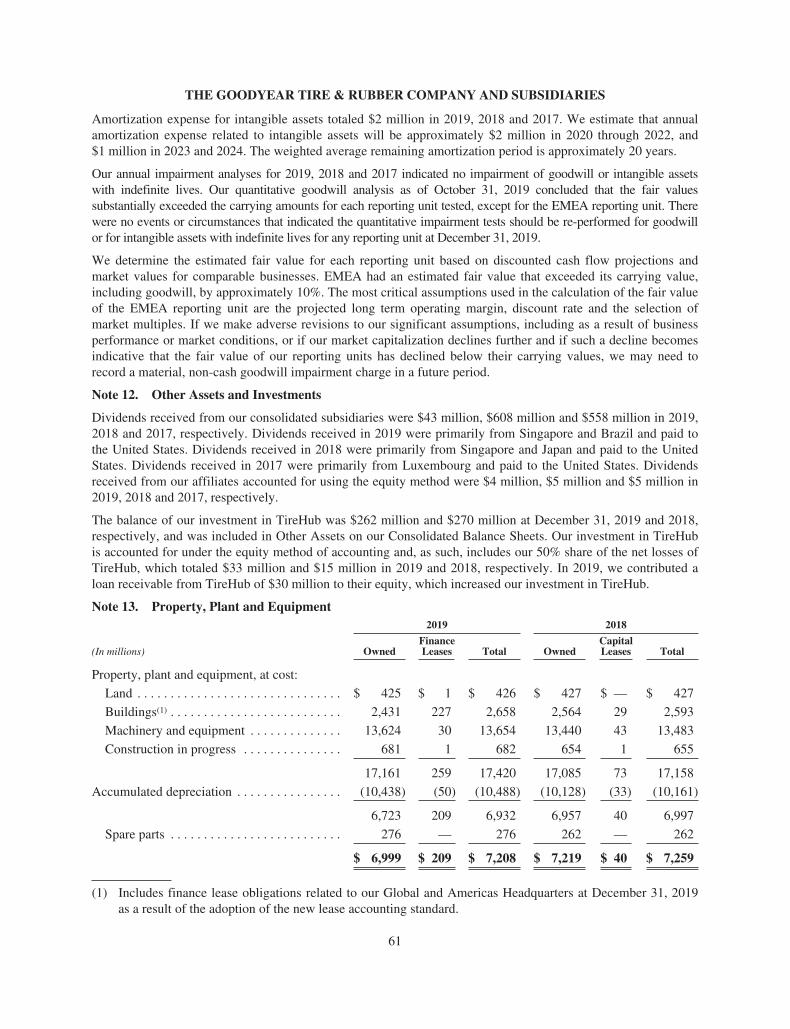
THE GOODYEAR TIRE & RUBBER COMPANY AND SUBSIDIARIES
Amortization expense for intangible assets totaled $2 million in 2019, 2018 and 2017. We estimate that annualamortization expense related to intangible assets will be approximately $2 million in 2020 through 2022, and$1 million in 2023 and 2024. The weighted average remaining amortization period is approximately 20 years.
Our annual impairment analyses for 2019, 2018 and 2017 indicated no impairment of goodwill or intangible assetswith indefinite lives. Our quantitative goodwill analysis as of October 31, 2019 concluded that the fair valuessubstantially exceeded the carrying amounts for each reporting unit tested, except for the EMEA reporting unit. Therewere no events or circumstances that indicated the quantitative impairment tests should be re-performed for goodwillor for intangible assets with indefinite lives for any reporting unit at December 31, 2019.
We determine the estimated fair value for each reporting unit based on discounted cash flow projections andmarket values for comparable businesses. EMEA had an estimated fair value that exceeded its carrying value,including goodwill, by approximately 10%. The most critical assumptions used in the calculation of the fair valueof the EMEA reporting unit are the projected long term operating margin, discount rate and the selection ofmarket multiples. If we make adverse revisions to our significant assumptions, including as a result of businessperformance or market conditions, or if our market capitalization declines further and if such a decline becomesindicative that the fair value of our reporting units has declined below their carrying values, we may need torecord a material, non-cash goodwill impairment charge in a future period.
Note 12. Other Assets and Investments
Dividends received from our consolidated subsidiaries were $43 million, $608 million and $558 million in 2019,2018 and 2017, respectively. Dividends received in 2019 were primarily from Singapore and Brazil and paid tothe United States. Dividends received in 2018 were primarily from Singapore and Japan and paid to the UnitedStates. Dividends received in 2017 were primarily from Luxembourg and paid to the United States. Dividendsreceived from our affiliates accounted for using the equity method were $4 million, $5 million and $5 million in2019, 2018 and 2017, respectively.
The balance of our investment in TireHub was $262 million and $270 million at December 31, 2019 and 2018,respectively, and was included in Other Assets on our Consolidated Balance Sheets. Our investment in TireHubis accounted for under the equity method of accounting and, as such, includes our 50% share of the net losses ofTireHub, which totaled $33 million and $15 million in 2019 and 2018, respectively. In 2019, we contributed aloan receivable from TireHub of $30 million to their equity, which increased our investment in TireHub.
Note 13. Property, Plant and Equipment2019 2018
(In millions) OwnedFinanceLeases Total Owned
CapitalLeases Total
Property, plant and equipment, at cost:
Land . . . . . . . . . . . . . . . . . . . . . . . . . . . . . . . $ 425 $ 1 $ 426 $ 427 $ — $ 427
Buildings(1) . . . . . . . . . . . . . . . . . . . . . . . . . . 2,431 227 2,658 2,564 29 2,593
Machinery and equipment . . . . . . . . . . . . . . 13,624 30 13,654 13,440 43 13,483
Construction in progress . . . . . . . . . . . . . . . 681 1 682 654 1 655
17,161 259 17,420 17,085 73 17,158
Accumulated depreciation . . . . . . . . . . . . . . . . (10,438) (50) (10,488) (10,128) (33) (10,161)
6,723 209 6,932 6,957 40 6,997
Spare parts . . . . . . . . . . . . . . . . . . . . . . . . . . 276 — 276 262 — 262
$ 6,999 $ 209 $ 7,208 $ 7,219 $ 40 $ 7,259
(1) Includes finance lease obligations related to our Global and Americas Headquarters at December 31, 2019as a result of the adoption of the new lease accounting standard.
61
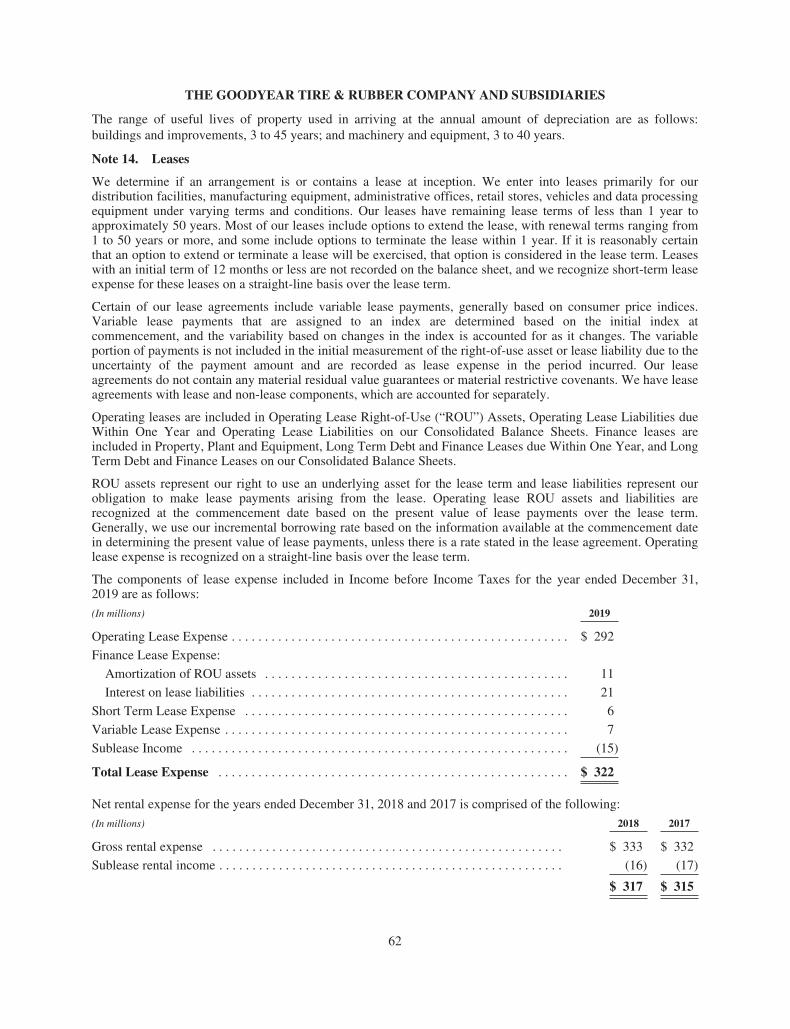
THE GOODYEAR TIRE & RUBBER COMPANY AND SUBSIDIARIES
The range of useful lives of property used in arriving at the annual amount of depreciation are as follows:buildings and improvements, 3 to 45 years; and machinery and equipment, 3 to 40 years.
Note 14. Leases
We determine if an arrangement is or contains a lease at inception. We enter into leases primarily for ourdistribution facilities, manufacturing equipment, administrative offices, retail stores, vehicles and data processingequipment under varying terms and conditions. Our leases have remaining lease terms of less than 1 year toapproximately 50 years. Most of our leases include options to extend the lease, with renewal terms ranging from1 to 50 years or more, and some include options to terminate the lease within 1 year. If it is reasonably certainthat an option to extend or terminate a lease will be exercised, that option is considered in the lease term. Leaseswith an initial term of 12 months or less are not recorded on the balance sheet, and we recognize short-term leaseexpense for these leases on a straight-line basis over the lease term.
Certain of our lease agreements include variable lease payments, generally based on consumer price indices.Variable lease payments that are assigned to an index are determined based on the initial index atcommencement, and the variability based on changes in the index is accounted for as it changes. The variableportion of payments is not included in the initial measurement of the right-of-use asset or lease liability due to theuncertainty of the payment amount and are recorded as lease expense in the period incurred. Our leaseagreements do not contain any material residual value guarantees or material restrictive covenants. We have leaseagreements with lease and non-lease components, which are accounted for separately.
Operating leases are included in Operating Lease Right-of-Use (“ROU”) Assets, Operating Lease Liabilities dueWithin One Year and Operating Lease Liabilities on our Consolidated Balance Sheets. Finance leases areincluded in Property, Plant and Equipment, Long Term Debt and Finance Leases due Within One Year, and LongTerm Debt and Finance Leases on our Consolidated Balance Sheets.
ROU assets represent our right to use an underlying asset for the lease term and lease liabilities represent ourobligation to make lease payments arising from the lease. Operating lease ROU assets and liabilities arerecognized at the commencement date based on the present value of lease payments over the lease term.Generally, we use our incremental borrowing rate based on the information available at the commencement datein determining the present value of lease payments, unless there is a rate stated in the lease agreement. Operatinglease expense is recognized on a straight-line basis over the lease term.
The components of lease expense included in Income before Income Taxes for the year ended December 31,2019 are as follows:
(In millions) 2019
Operating Lease Expense . . . . . . . . . . . . . . . . . . . . . . . . . . . . . . . . . . . . . . . . . . . . . . . . . . . $ 292
Finance Lease Expense:
Amortization of ROU assets . . . . . . . . . . . . . . . . . . . . . . . . . . . . . . . . . . . . . . . . . . . . . . 11
Interest on lease liabilities . . . . . . . . . . . . . . . . . . . . . . . . . . . . . . . . . . . . . . . . . . . . . . . . 21
Short Term Lease Expense . . . . . . . . . . . . . . . . . . . . . . . . . . . . . . . . . . . . . . . . . . . . . . . . . 6
Variable Lease Expense . . . . . . . . . . . . . . . . . . . . . . . . . . . . . . . . . . . . . . . . . . . . . . . . . . . . 7
Sublease Income . . . . . . . . . . . . . . . . . . . . . . . . . . . . . . . . . . . . . . . . . . . . . . . . . . . . . . . . . (15)
Total Lease Expense . . . . . . . . . . . . . . . . . . . . . . . . . . . . . . . . . . . . . . . . . . . . . . . . . . . . . $ 322
Net rental expense for the years ended December 31, 2018 and 2017 is comprised of the following:
(In millions) 2018 2017
Gross rental expense . . . . . . . . . . . . . . . . . . . . . . . . . . . . . . . . . . . . . . . . . . . . . . . . . . . . . $ 333 $ 332
Sublease rental income . . . . . . . . . . . . . . . . . . . . . . . . . . . . . . . . . . . . . . . . . . . . . . . . . . . . (16) (17)
$ 317 $ 315
62
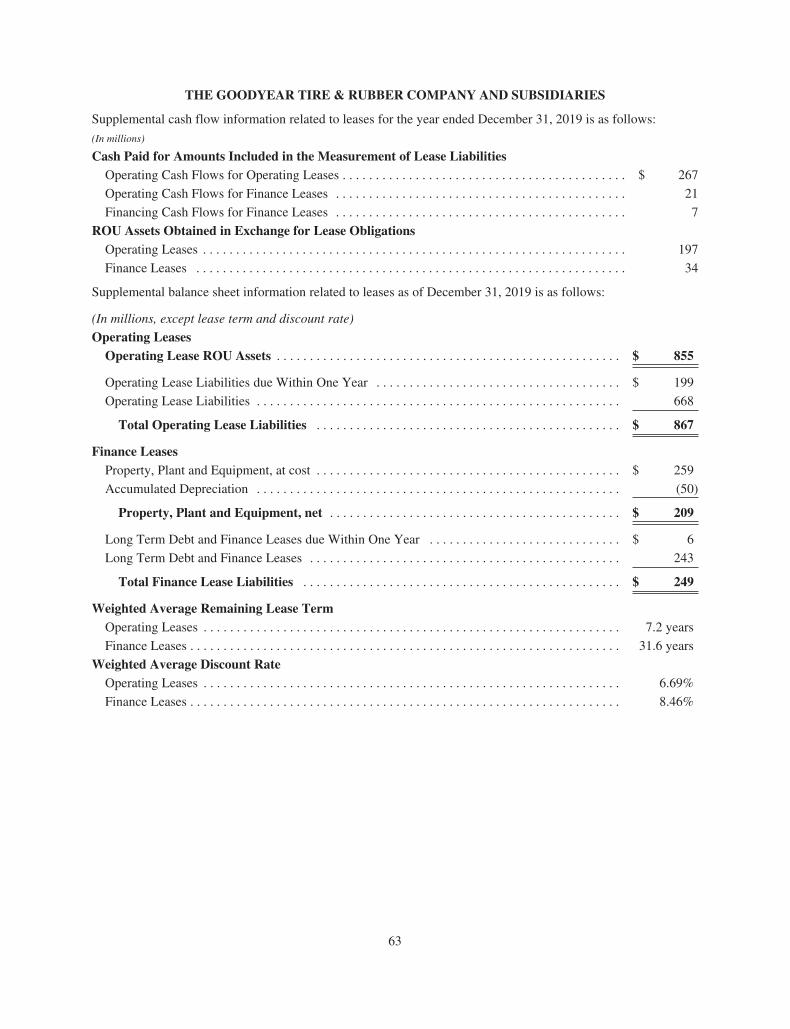
THE GOODYEAR TIRE & RUBBER COMPANY AND SUBSIDIARIES
Supplemental cash flow information related to leases for the year ended December 31, 2019 is as follows:
(In millions)
Cash Paid for Amounts Included in the Measurement of Lease LiabilitiesOperating Cash Flows for Operating Leases . . . . . . . . . . . . . . . . . . . . . . . . . . . . . . . . . . . . . . . . . . . $ 267
Operating Cash Flows for Finance Leases . . . . . . . . . . . . . . . . . . . . . . . . . . . . . . . . . . . . . . . . . . . . 21
Financing Cash Flows for Finance Leases . . . . . . . . . . . . . . . . . . . . . . . . . . . . . . . . . . . . . . . . . . . . 7
ROU Assets Obtained in Exchange for Lease ObligationsOperating Leases . . . . . . . . . . . . . . . . . . . . . . . . . . . . . . . . . . . . . . . . . . . . . . . . . . . . . . . . . . . . . . . . 197
Finance Leases . . . . . . . . . . . . . . . . . . . . . . . . . . . . . . . . . . . . . . . . . . . . . . . . . . . . . . . . . . . . . . . . . 34
Supplemental balance sheet information related to leases as of December 31, 2019 is as follows:
(In millions, except lease term and discount rate)
Operating LeasesOperating Lease ROU Assets . . . . . . . . . . . . . . . . . . . . . . . . . . . . . . . . . . . . . . . . . . . . . . . . . . . . $ 855
Operating Lease Liabilities due Within One Year . . . . . . . . . . . . . . . . . . . . . . . . . . . . . . . . . . . . . $ 199
Operating Lease Liabilities . . . . . . . . . . . . . . . . . . . . . . . . . . . . . . . . . . . . . . . . . . . . . . . . . . . . . . . 668
Total Operating Lease Liabilities . . . . . . . . . . . . . . . . . . . . . . . . . . . . . . . . . . . . . . . . . . . . . . $ 867
Finance LeasesProperty, Plant and Equipment, at cost . . . . . . . . . . . . . . . . . . . . . . . . . . . . . . . . . . . . . . . . . . . . . . $ 259
Accumulated Depreciation . . . . . . . . . . . . . . . . . . . . . . . . . . . . . . . . . . . . . . . . . . . . . . . . . . . . . . . (50)
Property, Plant and Equipment, net . . . . . . . . . . . . . . . . . . . . . . . . . . . . . . . . . . . . . . . . . . . . $ 209
Long Term Debt and Finance Leases due Within One Year . . . . . . . . . . . . . . . . . . . . . . . . . . . . . $ 6
Long Term Debt and Finance Leases . . . . . . . . . . . . . . . . . . . . . . . . . . . . . . . . . . . . . . . . . . . . . . . 243
Total Finance Lease Liabilities . . . . . . . . . . . . . . . . . . . . . . . . . . . . . . . . . . . . . . . . . . . . . . . . $ 249
Weighted Average Remaining Lease TermOperating Leases . . . . . . . . . . . . . . . . . . . . . . . . . . . . . . . . . . . . . . . . . . . . . . . . . . . . . . . . . . . . . . . 7.2 years
Finance Leases . . . . . . . . . . . . . . . . . . . . . . . . . . . . . . . . . . . . . . . . . . . . . . . . . . . . . . . . . . . . . . . . . 31.6 years
Weighted Average Discount RateOperating Leases . . . . . . . . . . . . . . . . . . . . . . . . . . . . . . . . . . . . . . . . . . . . . . . . . . . . . . . . . . . . . . . 6.69%
Finance Leases . . . . . . . . . . . . . . . . . . . . . . . . . . . . . . . . . . . . . . . . . . . . . . . . . . . . . . . . . . . . . . . . . 8.46%
63
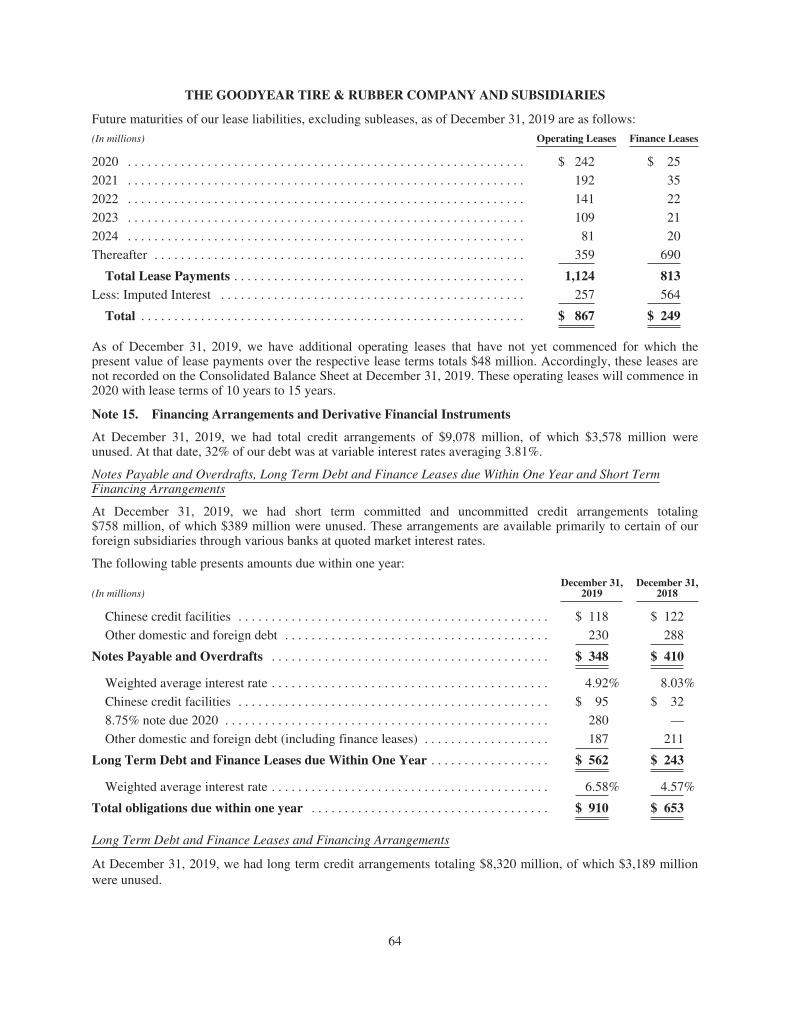
THE GOODYEAR TIRE & RUBBER COMPANY AND SUBSIDIARIES
Future maturities of our lease liabilities, excluding subleases, as of December 31, 2019 are as follows:
(In millions) Operating Leases Finance Leases
2020 . . . . . . . . . . . . . . . . . . . . . . . . . . . . . . . . . . . . . . . . . . . . . . . . . . . . . . . . . . . . $ 242 $ 25
2021 . . . . . . . . . . . . . . . . . . . . . . . . . . . . . . . . . . . . . . . . . . . . . . . . . . . . . . . . . . . . 192 35
2022 . . . . . . . . . . . . . . . . . . . . . . . . . . . . . . . . . . . . . . . . . . . . . . . . . . . . . . . . . . . . 141 22
2023 . . . . . . . . . . . . . . . . . . . . . . . . . . . . . . . . . . . . . . . . . . . . . . . . . . . . . . . . . . . . 109 21
2024 . . . . . . . . . . . . . . . . . . . . . . . . . . . . . . . . . . . . . . . . . . . . . . . . . . . . . . . . . . . . 81 20
Thereafter . . . . . . . . . . . . . . . . . . . . . . . . . . . . . . . . . . . . . . . . . . . . . . . . . . . . . . . . 359 690
Total Lease Payments . . . . . . . . . . . . . . . . . . . . . . . . . . . . . . . . . . . . . . . . . . . . 1,124 813Less: Imputed Interest . . . . . . . . . . . . . . . . . . . . . . . . . . . . . . . . . . . . . . . . . . . . . . 257 564
Total . . . . . . . . . . . . . . . . . . . . . . . . . . . . . . . . . . . . . . . . . . . . . . . . . . . . . . . . . . $ 867 $ 249
As of December 31, 2019, we have additional operating leases that have not yet commenced for which thepresent value of lease payments over the respective lease terms totals $48 million. Accordingly, these leases arenot recorded on the Consolidated Balance Sheet at December 31, 2019. These operating leases will commence in2020 with lease terms of 10 years to 15 years.
Note 15. Financing Arrangements and Derivative Financial Instruments
At December 31, 2019, we had total credit arrangements of $9,078 million, of which $3,578 million wereunused. At that date, 32% of our debt was at variable interest rates averaging 3.81%.
Notes Payable and Overdrafts, Long Term Debt and Finance Leases due Within One Year and Short TermFinancing Arrangements
At December 31, 2019, we had short term committed and uncommitted credit arrangements totaling$758 million, of which $389 million were unused. These arrangements are available primarily to certain of ourforeign subsidiaries through various banks at quoted market interest rates.
The following table presents amounts due within one year:
(In millions)December 31,
2019December 31,
2018
Chinese credit facilities . . . . . . . . . . . . . . . . . . . . . . . . . . . . . . . . . . . . . . . . . . . . . . . $ 118 $ 122
Other domestic and foreign debt . . . . . . . . . . . . . . . . . . . . . . . . . . . . . . . . . . . . . . . . 230 288
Notes Payable and Overdrafts . . . . . . . . . . . . . . . . . . . . . . . . . . . . . . . . . . . . . . . . . . $ 348 $ 410
Weighted average interest rate . . . . . . . . . . . . . . . . . . . . . . . . . . . . . . . . . . . . . . . . . . 4.92% 8.03%
Chinese credit facilities . . . . . . . . . . . . . . . . . . . . . . . . . . . . . . . . . . . . . . . . . . . . . . . $ 95 $ 32
8.75% note due 2020 . . . . . . . . . . . . . . . . . . . . . . . . . . . . . . . . . . . . . . . . . . . . . . . . . 280 —
Other domestic and foreign debt (including finance leases) . . . . . . . . . . . . . . . . . . . 187 211
Long Term Debt and Finance Leases due Within One Year . . . . . . . . . . . . . . . . . . $ 562 $ 243
Weighted average interest rate . . . . . . . . . . . . . . . . . . . . . . . . . . . . . . . . . . . . . . . . . . 6.58% 4.57%
Total obligations due within one year . . . . . . . . . . . . . . . . . . . . . . . . . . . . . . . . . . . . $ 910 $ 653
Long Term Debt and Finance Leases and Financing Arrangements
At December 31, 2019, we had long term credit arrangements totaling $8,320 million, of which $3,189 millionwere unused.
64
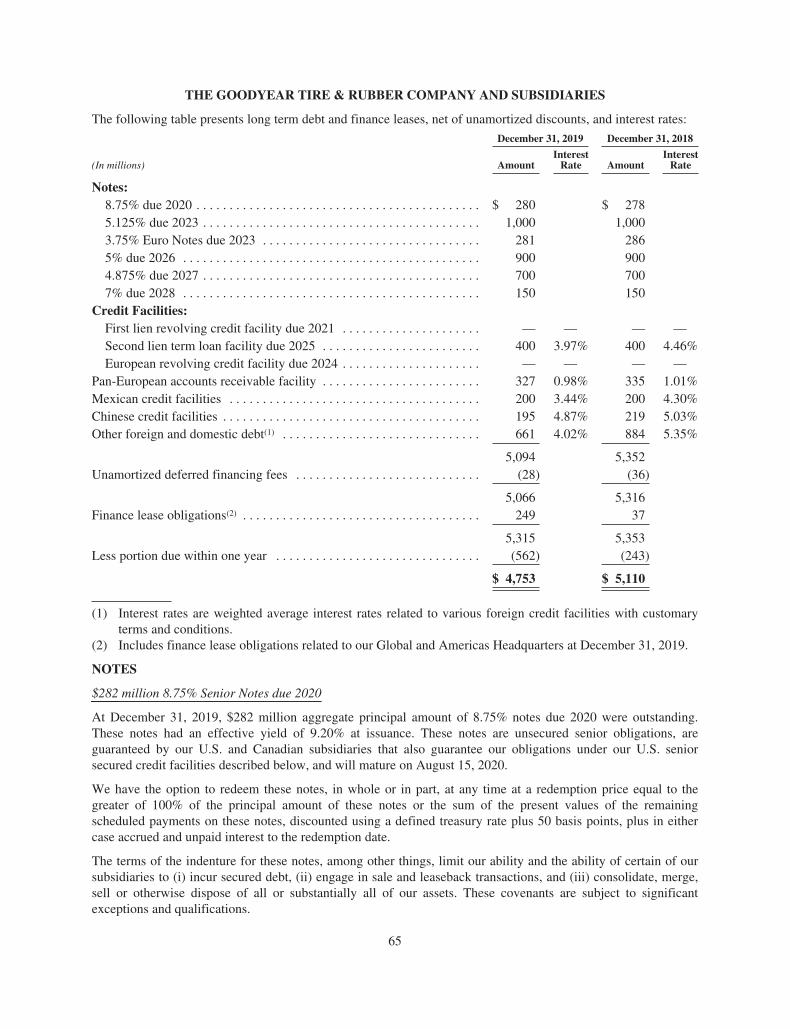
THE GOODYEAR TIRE & RUBBER COMPANY AND SUBSIDIARIES
The following table presents long term debt and finance leases, net of unamortized discounts, and interest rates:
December 31, 2019 December 31, 2018
(In millions) AmountInterest
Rate AmountInterest
Rate
Notes:8.75% due 2020 . . . . . . . . . . . . . . . . . . . . . . . . . . . . . . . . . . . . . . . . . . . $ 280 $ 2785.125% due 2023 . . . . . . . . . . . . . . . . . . . . . . . . . . . . . . . . . . . . . . . . . . 1,000 1,0003.75% Euro Notes due 2023 . . . . . . . . . . . . . . . . . . . . . . . . . . . . . . . . . 281 2865% due 2026 . . . . . . . . . . . . . . . . . . . . . . . . . . . . . . . . . . . . . . . . . . . . . 900 9004.875% due 2027 . . . . . . . . . . . . . . . . . . . . . . . . . . . . . . . . . . . . . . . . . . 700 7007% due 2028 . . . . . . . . . . . . . . . . . . . . . . . . . . . . . . . . . . . . . . . . . . . . . 150 150
Credit Facilities:First lien revolving credit facility due 2021 . . . . . . . . . . . . . . . . . . . . . — — — —Second lien term loan facility due 2025 . . . . . . . . . . . . . . . . . . . . . . . . 400 3.97% 400 4.46%European revolving credit facility due 2024 . . . . . . . . . . . . . . . . . . . . . — — — —
Pan-European accounts receivable facility . . . . . . . . . . . . . . . . . . . . . . . . 327 0.98% 335 1.01%Mexican credit facilities . . . . . . . . . . . . . . . . . . . . . . . . . . . . . . . . . . . . . . 200 3.44% 200 4.30%Chinese credit facilities . . . . . . . . . . . . . . . . . . . . . . . . . . . . . . . . . . . . . . . 195 4.87% 219 5.03%Other foreign and domestic debt(1) . . . . . . . . . . . . . . . . . . . . . . . . . . . . . . 661 4.02% 884 5.35%
5,094 5,352Unamortized deferred financing fees . . . . . . . . . . . . . . . . . . . . . . . . . . . . (28) (36)
5,066 5,316Finance lease obligations(2) . . . . . . . . . . . . . . . . . . . . . . . . . . . . . . . . . . . . 249 37
5,315 5,353Less portion due within one year . . . . . . . . . . . . . . . . . . . . . . . . . . . . . . . (562) (243)
$ 4,753 $ 5,110
(1) Interest rates are weighted average interest rates related to various foreign credit facilities with customaryterms and conditions.
(2) Includes finance lease obligations related to our Global and Americas Headquarters at December 31, 2019.
NOTES
$282 million 8.75% Senior Notes due 2020
At December 31, 2019, $282 million aggregate principal amount of 8.75% notes due 2020 were outstanding.These notes had an effective yield of 9.20% at issuance. These notes are unsecured senior obligations, areguaranteed by our U.S. and Canadian subsidiaries that also guarantee our obligations under our U.S. seniorsecured credit facilities described below, and will mature on August 15, 2020.
We have the option to redeem these notes, in whole or in part, at any time at a redemption price equal to thegreater of 100% of the principal amount of these notes or the sum of the present values of the remainingscheduled payments on these notes, discounted using a defined treasury rate plus 50 basis points, plus in eithercase accrued and unpaid interest to the redemption date.
The terms of the indenture for these notes, among other things, limit our ability and the ability of certain of oursubsidiaries to (i) incur secured debt, (ii) engage in sale and leaseback transactions, and (iii) consolidate, merge,sell or otherwise dispose of all or substantially all of our assets. These covenants are subject to significantexceptions and qualifications.
65
THE GOODYEAR TIRE & RUBBER COMPANY AND SUBSIDIARIES
$1.0 billion 5.125% Senior Notes due 2023
At December 31, 2019, $1.0 billion aggregate principal amount of 5.125% senior notes due 2023 wereoutstanding. These notes were sold at 100% of the principal amount and will mature on November 15, 2023.These notes are unsecured senior obligations and are guaranteed by our U.S. and Canadian subsidiaries that alsoguarantee our obligations under our U.S. senior secured credit facilities described below.
We have the option to redeem these notes, in whole or in part, at any time at a redemption price of 101.281% and100% during the 12-month periods commencing on November 15, 2019 and 2020 and thereafter, respectively,plus accrued and unpaid interest to the redemption date.
The terms of the indenture for these notes, among other things, limit the ability of the Company and certain of itssubsidiaries, including Goodyear Europe B.V. (“GEBV”), to (i) incur additional debt or issue redeemablepreferred stock, (ii) pay dividends, repurchase shares or make certain other restricted payments or investments,(iii) incur liens, (iv) sell assets, (v) incur restrictions on the ability of our subsidiaries to pay dividends or to makeother payments to us, (vi) enter into affiliate transactions, (vii) engage in sale and leaseback transactions, and(viii) consolidate, merge, sell or otherwise dispose of all or substantially all of our assets. These covenants aresubject to significant exceptions and qualifications. For example, if these notes are assigned an investment graderating by Moody’s and Standard and Poor’s and no default has occurred and is continuing, certain covenants willbe suspended and we may elect to suspend the subsidiary guarantees. The indenture has customary defaults,including a cross-default to material indebtedness of Goodyear and our subsidiaries.
€250 million 3.75% Senior Notes due 2023 of GEBV
At December 31, 2019, €250 million aggregate principal amount of GEBV’s 3.75% senior notes due 2023 wereoutstanding. These notes were sold at 100% of the principal amount and will mature on December 15, 2023.These notes are unsecured senior obligations of GEBV and are guaranteed, on an unsecured senior basis, by theCompany and our U.S. and Canadian subsidiaries that also guarantee our obligations under our U.S. seniorsecured credit facilities described below.
We have the option to redeem these notes, in whole or in part, at any time at a redemption price of 100.938% and100% during the 12-month periods commencing on December 15, 2019 and 2020 and thereafter, respectively,plus accrued and unpaid interest to the redemption date.
The indenture for these notes includes covenants that are substantially similar to those contained in the indenturegoverning our 5.125% senior notes due 2023, described above.
$900 million 5% Senior Notes due 2026
At December 31, 2019, $900 million aggregate principal amount of 5% senior notes due 2026 were outstanding.These notes were sold at 100% of the principal amount and will mature on May 31, 2026. These notes areunsecured senior obligations and are guaranteed by our U.S. and Canadian subsidiaries that also guarantee ourobligations under our U.S. senior secured credit facilities described below.
We have the option to redeem these notes, in whole or in part, at any time on or after May 31, 2021 at aredemption price of 102.5%, 101.667%, 100.833% and 100% during the 12-month periods commencing onMay 31, 2021, 2022, 2023 and 2024 and thereafter, respectively, plus accrued and unpaid interest to theredemption date. Prior to May 31, 2021, we may redeem these notes, in whole or in part, at a redemption priceequal to 100% of the principal amount plus a make-whole premium and accrued and unpaid interest to theredemption date.
The indenture for these notes includes covenants that are substantially similar to those contained in the indenturegoverning our 5.125% senior notes due 2023, described above.
$700 million 4.875% Senior Notes due 2027
At December 31, 2019, $700 million aggregate principal amount of 4.875% senior notes due 2027 wereoutstanding. These notes were sold at 100% of the principal amount and will mature on March 15, 2027. These
66
THE GOODYEAR TIRE & RUBBER COMPANY AND SUBSIDIARIES
notes are unsecured senior obligations and are guaranteed by our U.S. and Canadian subsidiaries that alsoguarantee our obligations under our U.S. senior secured credit facilities described below.
We have the option to redeem these notes, in whole or in part, at any time prior to their maturity. If we elect toredeem the notes prior to December 15, 2026, we will pay a redemption price equal to the greater of 100% of theprincipal amount of the notes redeemed or the sum of the present values of the remaining scheduled payments onthe notes redeemed, discounted using a defined treasury rate plus 50 basis points, plus in either case accrued andunpaid interest to the redemption date. If we elect to redeem the notes on or after December 15, 2026, we willpay a redemption price equal to 100% of the principal amount of the notes redeemed plus accrued and unpaidinterest to the redemption date.
The terms of the indenture for these notes, among other things, limit our ability and the ability of certain of oursubsidiaries to (i) incur certain liens, (ii) engage in sale and leaseback transactions, and (iii) consolidate, merge,sell or otherwise dispose of all or substantially all of our assets. These covenants are subject to significantexceptions and qualifications.
$150 million 7% Senior Notes due 2028
At December 31, 2019, $150 million aggregate principal amount of 7% notes due 2028 were outstanding. Thesenotes are unsecured senior obligations and will mature on March 15, 2028.
We have the option to redeem these notes, in whole or in part, at any time at a redemption price equal to thegreater of 100% of the principal amount thereof or the sum of the present values of the remaining scheduledpayments thereon, discounted using a defined treasury rate plus 15 basis points, plus in either case accrued andunpaid interest to the redemption date.
The terms of the indenture for these notes, among other things, limit our ability and the ability of certain of oursubsidiaries to (i) incur secured debt, (ii) engage in sale and leaseback transactions, and (iii) consolidate, merge,sell or otherwise dispose of all or substantially all of our assets. These covenants are subject to significantexceptions and qualifications.
CREDIT FACILITIES
$2.0 billion Amended and Restated First Lien Revolving Credit Facility due 2021
Our amended and restated first lien revolving credit facility is available in the form of loans or letters of credit,with letter of credit availability limited to $800 million. Subject to the consent of the lenders whose commitmentsare to be increased, we may request that the facility be increased by up to $250 million. Amounts drawn underthis facility bear interest at LIBOR plus 125 basis points, based on our current liquidity as described below.
Our obligations under the facility are guaranteed by most of our wholly-owned U.S. and Canadian subsidiaries.Our obligations under the facility and our subsidiaries’ obligations under the related guarantees are secured byfirst priority security interests in collateral that includes, subject to certain exceptions:
• U.S. and Canadian accounts receivable and inventory;
• certain of our U.S. manufacturing facilities;
• equity interests in our U.S. subsidiaries and up to 65% of the equity interests in our directly owned foreignsubsidiaries; and
• substantially all other tangible and intangible assets, including equipment, contract rights and intellectualproperty.
Availability under the facility is subject to a borrowing base, which is based primarily on (i) eligible accountsreceivable and inventory of The Goodyear Tire & Rubber Company and certain of its U.S. and Canadiansubsidiaries, after adjusting for customary factors that are subject to modification from time to time by theadministrative agent or the majority lenders at their discretion (not to be exercised unreasonably), (ii) the value of
67
THE GOODYEAR TIRE & RUBBER COMPANY AND SUBSIDIARIES
our principal trademarks, and (iii) certain cash in an amount not to exceed $200 million. Modifications are basedon the results of periodic collateral and borrowing base evaluations and appraisals. To the extent that our eligibleaccounts receivable, inventory and other components of the borrowing base decline in value, our borrowing basewill decrease and the availability under the facility may decrease below $2.0 billion. In addition, if the amount ofoutstanding borrowings and letters of credit under the facility exceeds the borrowing base, we are required toprepay borrowings and/or cash collateralize letters of credit sufficient to eliminate the excess. As ofDecember 31, 2019, our borrowing base, and therefore our availability, under this facility was $301 millionbelow the facility’s stated amount of $2.0 billion.
The facility, which matures on April 7, 2021, contains certain covenants that, among other things, limit our ability andthe ability of certain of our subsidiaries to (i) incur additional debt or issue redeemable preferred stock, (ii) paydividends, repurchase shares or make certain other restricted payments or investments, (iii) incur liens, (iv) sell assets,(v) incur restrictions on the ability of our subsidiaries to pay dividends or to make other payments to us, (vi) enter intoaffiliate transactions, (vii) engage in sale and leaseback transactions, and (viii) consolidate, merge, sell or otherwisedispose of all or substantially all of our assets. These covenants are subject to significant exceptions and qualifications.In addition, in the event that the availability under the facility plus the aggregate amount of our Available Cash is lessthan $200 million, we will not be permitted to allow our ratio of EBITDA to Consolidated Interest Expense to be lessthan 2.0 to 1.0 for any period of four consecutive fiscal quarters. “Available Cash,” “EBITDA” and “ConsolidatedInterest Expense” have the meanings given them in the facility.
The facility has customary representations and warranties including, as a condition to borrowing, that all suchrepresentations and warranties are true and correct, in all material respects, on the date of the borrowing,including representations as to no material adverse change in our business or financial condition sinceDecember 31, 2015. The facility also has customary defaults, including a cross-default to material indebtednessof Goodyear and our subsidiaries.
If Available Cash (as defined in the facility) plus the availability under the facility is greater than $1.0 billion,amounts drawn under the facility will bear interest, at our option, at (i) 125 basis points over LIBOR or (ii) 25basis points over an alternative base rate (the higher of (a) the prime rate, (b) the federal funds effective rate orthe overnight bank funding rate plus 50 basis points or (c) LIBOR plus 100 basis points), and undrawn amountsunder the facility will be subject to an annual commitment fee of 30 basis points. If Available Cash plus theavailability under the facility is equal to or less than $1.0 billion, then amounts drawn under the facility will bearinterest, at our option, at (i) 150 basis points over LIBOR or (ii) 50 basis points over an alternative base rate, andundrawn amounts under the facility will be subject to an annual commitment fee of 25 basis points.
At December 31, 2019 and 2018, we had no borrowings and $37 million of letters of credit issued under therevolving credit facility.
Amended and Restated Second Lien Term Loan Facility due 2025
Our amended and restated second lien term loan facility matures on March 7, 2025. The term loan bears interest,at our option, at (i) 200 basis points over LIBOR or (ii) 100 basis points over an alternative base rate (the higherof (a) the prime rate, (b) the federal funds effective rate or the overnight bank funding rate plus 50 basis points or(c) LIBOR plus 100 basis points). In addition, if the Total Leverage Ratio is equal to or less than 1.25 to 1.00, wehave the option to further reduce the spreads described above by 25 basis points. “Total Leverage Ratio” has themeaning given it in the facility.
Our obligations under our second lien term loan facility are guaranteed by most of our wholly-owned U.S. andCanadian subsidiaries and are secured by second priority security interests in the same collateral securing the$2.0 billion first lien revolving credit facility.
The facility contains covenants, representations, warranties and defaults similar to those in the $2.0 billion firstlien revolving credit facility. In addition, if our Pro Forma Senior Secured Leverage Ratio (the ratio ofConsolidated Net Secured Indebtedness to EBITDA) for any period of four consecutive fiscal quarters is greater
68
THE GOODYEAR TIRE & RUBBER COMPANY AND SUBSIDIARIES
than 3.0 to 1.0, before we may use cash proceeds from certain asset sales to repay any junior lien, seniorunsecured or subordinated indebtedness, we must first offer to use such cash proceeds to prepay borrowingsunder the second lien term loan facility. “Pro Forma Senior Secured Leverage Ratio,” “Consolidated Net SecuredIndebtedness” and “EBITDA” have the meanings given them in the facility.
At December 31, 2019 and 2018, the amounts outstanding under this facility were $400 million.
€800 million Amended and Restated Senior Secured European Revolving Credit Facility due 2024
On March 27, 2019, we amended and restated our European revolving credit facility. Significant changes to theEuropean revolving credit facility include extending the maturity to March 27, 2024, increasing the availablecommitments thereunder from €550 million to €800 million, decreasing the interest rate margin by 25 basispoints and decreasing the annual commitment fee by 5 basis points to 25 basis points. Loans will now bearinterest at LIBOR plus 150 basis points for loans denominated in U.S. dollars or pounds sterling and EURIBORplus 150 basis points for loans denominated in euros.
The European revolving credit facility consists of (i) a €180 million German tranche that is available only toGoodyear Dunlop Tires Germany GmbH (“GDTG”) and (ii) a €620 million all-borrower tranche that is availableto GEBV, GDTG and Goodyear Dunlop Tires Operations S.A. Up to €175 million of swingline loans and€75 million in letters of credit are available for issuance under the all-borrower tranche. Subject to the consent ofthe lenders whose commitments are to be increased, we may request that the facility be increased by up to€200 million.
GEBV and certain of its subsidiaries in the United Kingdom, Luxembourg, France and Germany provideguarantees to support the facility. GEBV’s obligations under the facility and the obligations of its subsidiariesunder the related guarantees are secured by security interests in collateral that includes, subject to certainexceptions:
• the capital stock of the principal subsidiaries of GEBV; and
• a substantial portion of the tangible and intangible assets of GEBV and certain of its subsidiaries in theUnited Kingdom, Luxembourg, France and Germany, including real property, equipment, inventory,contract rights, intercompany receivables and cash accounts, but excluding accounts receivable andcertain cash accounts in subsidiaries that are or may become parties to securitization or factoringtransactions.
The German guarantors secure the German tranche on a first-lien basis and the all-borrower tranche on a second-lien basis. GEBV and its other subsidiaries that provide guarantees secure the all-borrower tranche on a first-lienbasis and generally do not provide collateral support for the German tranche. The Company and its U.S. andCanadian subsidiaries that guarantee our U.S. senior secured credit facilities described above also provideunsecured guarantees in support of the facility.
The facility contains covenants similar to those in our first lien revolving credit facility, with additionallimitations applicable to GEBV and its subsidiaries. In addition, under the facility, GEBV’s ratio of ConsolidatedNet GEBV Indebtedness to Consolidated GEBV EBITDA for a period of four consecutive fiscal quarters is notpermitted to be greater than 3.0 to 1.0 at the end of any fiscal quarter. “Consolidated Net GEBV Indebtedness”and “Consolidated GEBV EBITDA” have the meanings given them in the facility.
The facility has customary representations and warranties including, as a condition to borrowing, that all suchrepresentations and warranties are true and correct, in all material respects, on the date of the borrowing,including representations as to no material adverse change in our business or financial condition sinceDecember 31, 2018. The facility also has customary defaults, including a cross-default to material indebtednessof Goodyear and our subsidiaries.
At December 31, 2019 and 2018, there were no borrowings and no letters of credit outstanding under theEuropean revolving credit facility.
69
THE GOODYEAR TIRE & RUBBER COMPANY AND SUBSIDIARIES
Accounts Receivable Securitization Facilities (On-Balance Sheet)
GEBV and certain other of our European subsidiaries are parties to a pan-European accounts receivablesecuritization facility that expires in 2023. The terms of the facility provide the flexibility to designate annuallythe maximum amount of funding available under the facility in an amount of not less than €30 million and notmore than €450 million. For the period from October 18, 2018 through October 15, 2020, the designatedmaximum amount of the facility is €320 million.
The facility involves an ongoing daily sale of substantially all of the trade accounts receivable of certain GEBVsubsidiaries. These subsidiaries retain servicing responsibilities. Utilization under this facility is based on eligiblereceivable balances.
The funding commitments under the facility will expire upon the earliest to occur of: (a) September 26, 2023, (b) thenon-renewal and expiration (without substitution) of all of the back-up liquidity commitments, (c) the early terminationof the facility according to its terms (generally upon an Early Amortisation Event (as defined in the facility), whichincludes, among other things, events similar to the events of default under our senior secured credit facilities; certaintax law changes; or certain changes to law, regulation or accounting standards), or (d) our request for early terminationof the facility. The facility’s current back-up liquidity commitments will expire on October 15, 2020.
At December 31, 2019, the amounts available and utilized under this program totaled $327 million (€291million). At December 31, 2018, the amounts available and utilized under this program totaled $335 million(€293 million). The program does not qualify for sale accounting, and accordingly, these amounts are included inLong Term Debt and Finance Leases.
Accounts Receivable Factoring Facilities (Off-Balance Sheet)
We have sold certain of our trade receivables under off-balance sheet programs. For these programs, we haveconcluded that there is generally no risk of loss to us from non-payment of the sold receivables. At December 31,2019 and 2018, the amount of receivables sold was $548 million and $568 million, respectively.
Other Foreign Credit Facilities
A Mexican subsidiary and a U.S. subsidiary have a revolving credit facility in Mexico. At December 31, 2019,the amounts available and utilized under this facility was $200 million. The facility ultimately matures in 2022,has covenants relating to the Mexican and U.S. subsidiary, and has customary representations and warranties anddefault provisions relating to the Mexican and U.S. subsidiary’s ability to perform its respective obligationsunder the facility. At December 31, 2018, the subsidiaries had several financing arrangements in Mexico, and theamounts available and utilized under these facilities were $340 million and $200 million, respectively.
A Chinese subsidiary has several financing arrangements in China. At December 31, 2019 and 2018, the amountsavailable under these facilities were $735 million and $672 million, respectively. At December 31, 2019, theamount utilized under these facilities was $313 million, of which $118 million represented notes payable and$195 million represented long term debt. At December 31, 2019, $95 million of the long term debt was duewithin a year. At December 31, 2018, the amount utilized under these facilities was $341 million, of which$122 million represented notes payable and $219 million represented long term debt. At December 31, 2018,$32 million of the long term debt was due within a year. The facilities contain covenants relating to the Chinesesubsidiary and have customary representations and warranties and defaults relating to the Chinese subsidiary’sability to perform its obligations under the facilities. Certain of the facilities can only be used to finance theexpansion of our manufacturing facility in China and, at December 31, 2019 and 2018, the unused amountsavailable under these restricted facilities were $106 million and $116 million, respectively.
Debt Maturities
The annual aggregate maturities of our debt (excluding the impact of deferred financing fees and unamortizeddiscounts) and finance leases for the five years subsequent to December 31, 2019 are presented below. Maturities
70
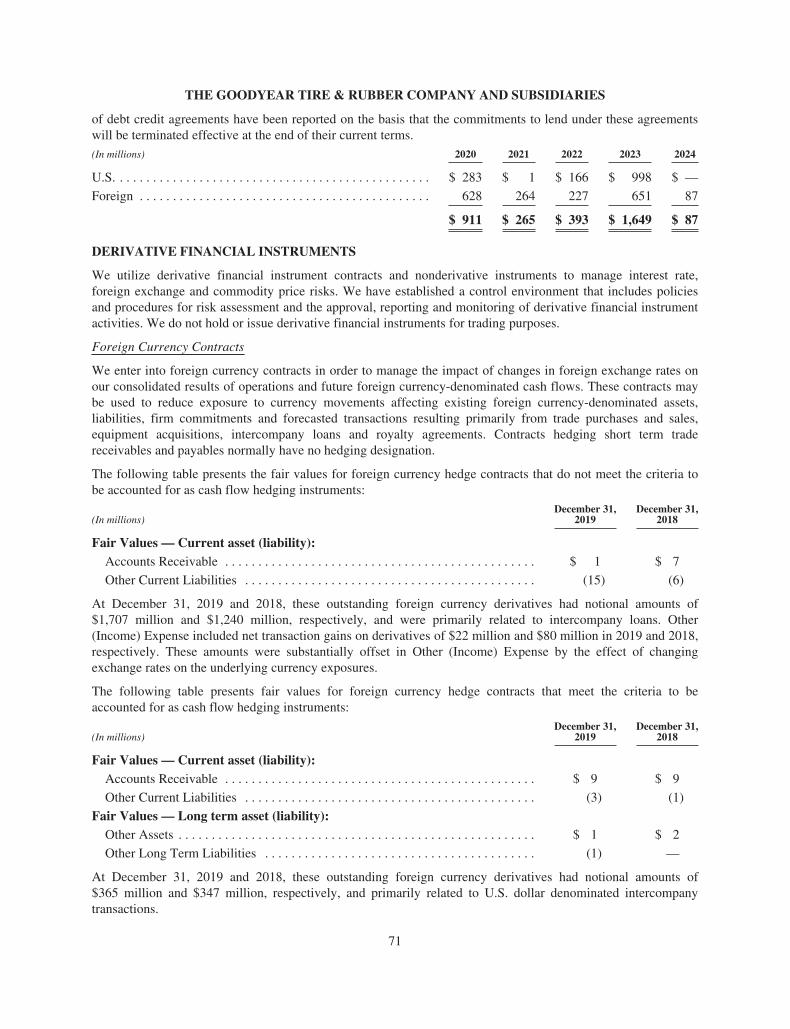
THE GOODYEAR TIRE & RUBBER COMPANY AND SUBSIDIARIES
of debt credit agreements have been reported on the basis that the commitments to lend under these agreementswill be terminated effective at the end of their current terms.(In millions) 2020 2021 2022 2023 2024
U.S. . . . . . . . . . . . . . . . . . . . . . . . . . . . . . . . . . . . . . . . . . . . . . . . $ 283 $ 1 $ 166 $ 998 $ —
Foreign . . . . . . . . . . . . . . . . . . . . . . . . . . . . . . . . . . . . . . . . . . . . 628 264 227 651 87
$ 911 $ 265 $ 393 $ 1,649 $ 87
DERIVATIVE FINANCIAL INSTRUMENTS
We utilize derivative financial instrument contracts and nonderivative instruments to manage interest rate,foreign exchange and commodity price risks. We have established a control environment that includes policiesand procedures for risk assessment and the approval, reporting and monitoring of derivative financial instrumentactivities. We do not hold or issue derivative financial instruments for trading purposes.
Foreign Currency Contracts
We enter into foreign currency contracts in order to manage the impact of changes in foreign exchange rates onour consolidated results of operations and future foreign currency-denominated cash flows. These contracts maybe used to reduce exposure to currency movements affecting existing foreign currency-denominated assets,liabilities, firm commitments and forecasted transactions resulting primarily from trade purchases and sales,equipment acquisitions, intercompany loans and royalty agreements. Contracts hedging short term tradereceivables and payables normally have no hedging designation.
The following table presents the fair values for foreign currency hedge contracts that do not meet the criteria tobe accounted for as cash flow hedging instruments:
(In millions)December 31,
2019December 31,
2018
Fair Values — Current asset (liability):Accounts Receivable . . . . . . . . . . . . . . . . . . . . . . . . . . . . . . . . . . . . . . . . . . . . . . . $ 1 $ 7
Other Current Liabilities . . . . . . . . . . . . . . . . . . . . . . . . . . . . . . . . . . . . . . . . . . . . (15) (6)
At December 31, 2019 and 2018, these outstanding foreign currency derivatives had notional amounts of$1,707 million and $1,240 million, respectively, and were primarily related to intercompany loans. Other(Income) Expense included net transaction gains on derivatives of $22 million and $80 million in 2019 and 2018,respectively. These amounts were substantially offset in Other (Income) Expense by the effect of changingexchange rates on the underlying currency exposures.
The following table presents fair values for foreign currency hedge contracts that meet the criteria to beaccounted for as cash flow hedging instruments:
(In millions)December 31,
2019December 31,
2018
Fair Values — Current asset (liability):Accounts Receivable . . . . . . . . . . . . . . . . . . . . . . . . . . . . . . . . . . . . . . . . . . . . . . . $ 9 $ 9
Other Current Liabilities . . . . . . . . . . . . . . . . . . . . . . . . . . . . . . . . . . . . . . . . . . . . (3) (1)
Fair Values — Long term asset (liability):Other Assets . . . . . . . . . . . . . . . . . . . . . . . . . . . . . . . . . . . . . . . . . . . . . . . . . . . . . . $ 1 $ 2
Other Long Term Liabilities . . . . . . . . . . . . . . . . . . . . . . . . . . . . . . . . . . . . . . . . . (1) —
At December 31, 2019 and 2018, these outstanding foreign currency derivatives had notional amounts of$365 million and $347 million, respectively, and primarily related to U.S. dollar denominated intercompanytransactions.
71
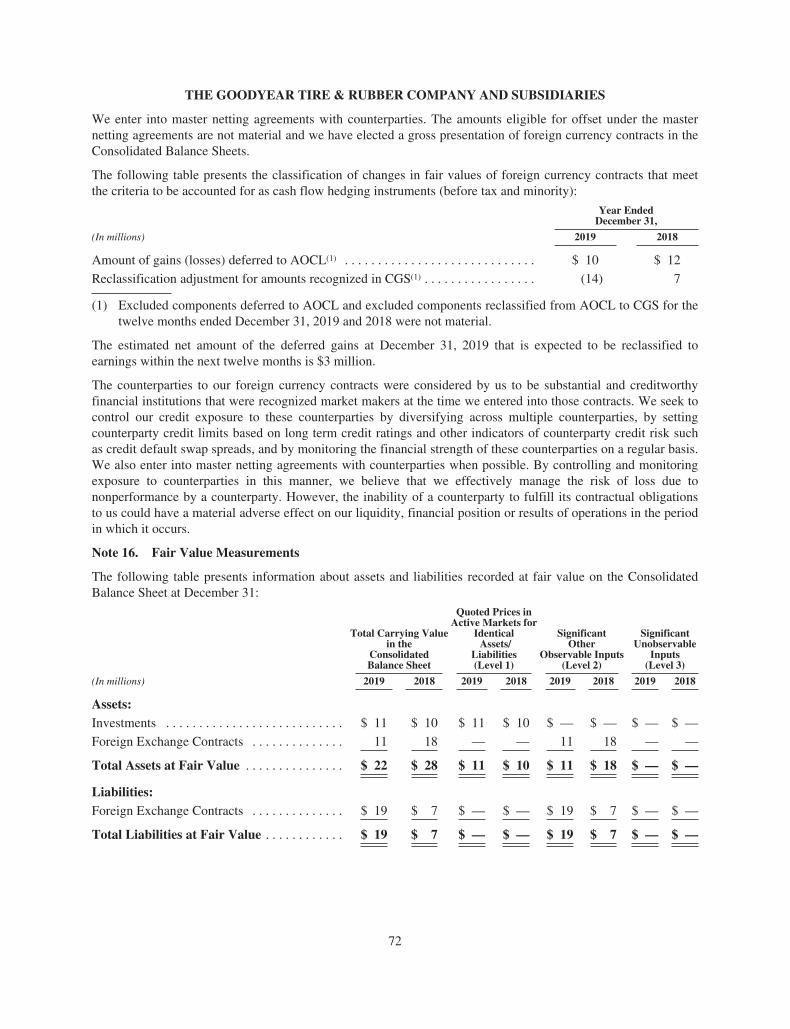
THE GOODYEAR TIRE & RUBBER COMPANY AND SUBSIDIARIES
We enter into master netting agreements with counterparties. The amounts eligible for offset under the masternetting agreements are not material and we have elected a gross presentation of foreign currency contracts in theConsolidated Balance Sheets.
The following table presents the classification of changes in fair values of foreign currency contracts that meetthe criteria to be accounted for as cash flow hedging instruments (before tax and minority):
Year EndedDecember 31,
(In millions) 2019 2018
Amount of gains (losses) deferred to AOCL(1) . . . . . . . . . . . . . . . . . . . . . . . . . . . . . $ 10 $ 12
Reclassification adjustment for amounts recognized in CGS(1) . . . . . . . . . . . . . . . . . (14) 7
(1) Excluded components deferred to AOCL and excluded components reclassified from AOCL to CGS for thetwelve months ended December 31, 2019 and 2018 were not material.
The estimated net amount of the deferred gains at December 31, 2019 that is expected to be reclassified toearnings within the next twelve months is $3 million.
The counterparties to our foreign currency contracts were considered by us to be substantial and creditworthyfinancial institutions that were recognized market makers at the time we entered into those contracts. We seek tocontrol our credit exposure to these counterparties by diversifying across multiple counterparties, by settingcounterparty credit limits based on long term credit ratings and other indicators of counterparty credit risk suchas credit default swap spreads, and by monitoring the financial strength of these counterparties on a regular basis.We also enter into master netting agreements with counterparties when possible. By controlling and monitoringexposure to counterparties in this manner, we believe that we effectively manage the risk of loss due tononperformance by a counterparty. However, the inability of a counterparty to fulfill its contractual obligationsto us could have a material adverse effect on our liquidity, financial position or results of operations in the periodin which it occurs.
Note 16. Fair Value Measurements
The following table presents information about assets and liabilities recorded at fair value on the ConsolidatedBalance Sheet at December 31:
Total Carrying Valuein the
ConsolidatedBalance Sheet
Quoted Prices inActive Markets for
IdenticalAssets/
Liabilities(Level 1)
SignificantOther
Observable Inputs(Level 2)
SignificantUnobservable
Inputs(Level 3)
(In millions) 2019 2018 2019 2018 2019 2018 2019 2018
Assets:Investments . . . . . . . . . . . . . . . . . . . . . . . . . . . $ 11 $ 10 $ 11 $ 10 $ — $ — $ — $ —
Foreign Exchange Contracts . . . . . . . . . . . . . . 11 18 — — 11 18 — —
Total Assets at Fair Value . . . . . . . . . . . . . . . $ 22 $ 28 $ 11 $ 10 $ 11 $ 18 $ — $ —
Liabilities:Foreign Exchange Contracts . . . . . . . . . . . . . . $ 19 $ 7 $ — $ — $ 19 $ 7 $ — $ —
Total Liabilities at Fair Value . . . . . . . . . . . . $ 19 $ 7 $ — $ — $ 19 $ 7 $ — $ —
72
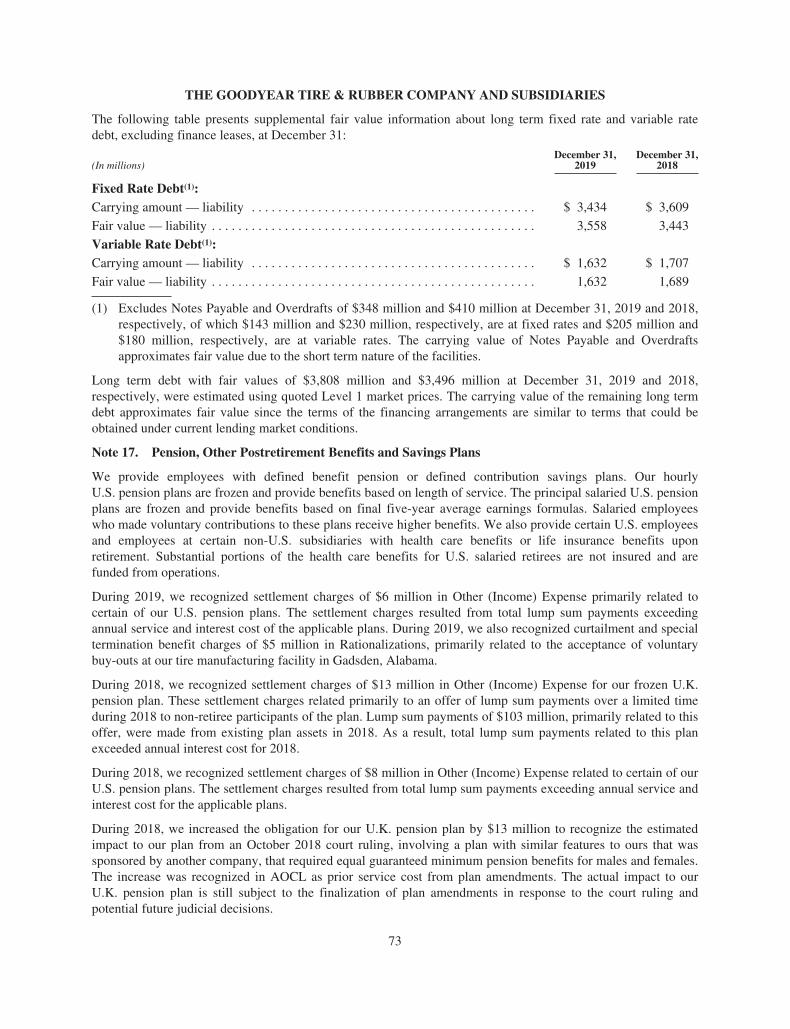
THE GOODYEAR TIRE & RUBBER COMPANY AND SUBSIDIARIES
The following table presents supplemental fair value information about long term fixed rate and variable ratedebt, excluding finance leases, at December 31:
(In millions)December 31,
2019December 31,
2018
Fixed Rate Debt(1):Carrying amount — liability . . . . . . . . . . . . . . . . . . . . . . . . . . . . . . . . . . . . . . . . . . . $ 3,434 $ 3,609
Fair value — liability . . . . . . . . . . . . . . . . . . . . . . . . . . . . . . . . . . . . . . . . . . . . . . . . . 3,558 3,443
Variable Rate Debt(1):Carrying amount — liability . . . . . . . . . . . . . . . . . . . . . . . . . . . . . . . . . . . . . . . . . . . $ 1,632 $ 1,707
Fair value — liability . . . . . . . . . . . . . . . . . . . . . . . . . . . . . . . . . . . . . . . . . . . . . . . . . 1,632 1,689
(1) Excludes Notes Payable and Overdrafts of $348 million and $410 million at December 31, 2019 and 2018,respectively, of which $143 million and $230 million, respectively, are at fixed rates and $205 million and$180 million, respectively, are at variable rates. The carrying value of Notes Payable and Overdraftsapproximates fair value due to the short term nature of the facilities.
Long term debt with fair values of $3,808 million and $3,496 million at December 31, 2019 and 2018,respectively, were estimated using quoted Level 1 market prices. The carrying value of the remaining long termdebt approximates fair value since the terms of the financing arrangements are similar to terms that could beobtained under current lending market conditions.
Note 17. Pension, Other Postretirement Benefits and Savings Plans
We provide employees with defined benefit pension or defined contribution savings plans. Our hourlyU.S. pension plans are frozen and provide benefits based on length of service. The principal salaried U.S. pensionplans are frozen and provide benefits based on final five-year average earnings formulas. Salaried employeeswho made voluntary contributions to these plans receive higher benefits. We also provide certain U.S. employeesand employees at certain non-U.S. subsidiaries with health care benefits or life insurance benefits uponretirement. Substantial portions of the health care benefits for U.S. salaried retirees are not insured and arefunded from operations.
During 2019, we recognized settlement charges of $6 million in Other (Income) Expense primarily related tocertain of our U.S. pension plans. The settlement charges resulted from total lump sum payments exceedingannual service and interest cost of the applicable plans. During 2019, we also recognized curtailment and specialtermination benefit charges of $5 million in Rationalizations, primarily related to the acceptance of voluntarybuy-outs at our tire manufacturing facility in Gadsden, Alabama.
During 2018, we recognized settlement charges of $13 million in Other (Income) Expense for our frozen U.K.pension plan. These settlement charges related primarily to an offer of lump sum payments over a limited timeduring 2018 to non-retiree participants of the plan. Lump sum payments of $103 million, primarily related to thisoffer, were made from existing plan assets in 2018. As a result, total lump sum payments related to this planexceeded annual interest cost for 2018.
During 2018, we recognized settlement charges of $8 million in Other (Income) Expense related to certain of ourU.S. pension plans. The settlement charges resulted from total lump sum payments exceeding annual service andinterest cost for the applicable plans.
During 2018, we increased the obligation for our U.K. pension plan by $13 million to recognize the estimatedimpact to our plan from an October 2018 court ruling, involving a plan with similar features to ours that wassponsored by another company, that required equal guaranteed minimum pension benefits for males and females.The increase was recognized in AOCL as prior service cost from plan amendments. The actual impact to ourU.K. pension plan is still subject to the finalization of plan amendments in response to the court ruling andpotential future judicial decisions.
73
THE GOODYEAR TIRE & RUBBER COMPANY AND SUBSIDIARIES
During 2018, the Brazil pension regulator approved our plan to replace certain benefits in our Brazil retireemedical plan with an increase in benefits in our Brazil pension plan. The changes were effective in the fourthquarter of 2019 and resulted in an increase to our pension obligation of $16 million and a decrease in our otherpostretirement benefits obligation of $14 million at December 31, 2018. The increase to the pension obligationand decrease to the other postretirement benefits obligation were recognized in AOCL as prior service cost andprior service credit, respectively.
During 2017, we recognized settlement charges of $32 million, primarily related to our frozen salaried U.S.pension plan. The settlement charges resulted from total lump sum benefit payments exceeding annual interestcost. Of the total settlement charges, $19 million was recorded in Other (Income) Expense and $13 million wasincluded in Rationalizations for employees who terminated service as a result of ongoing rationalization plans.
74
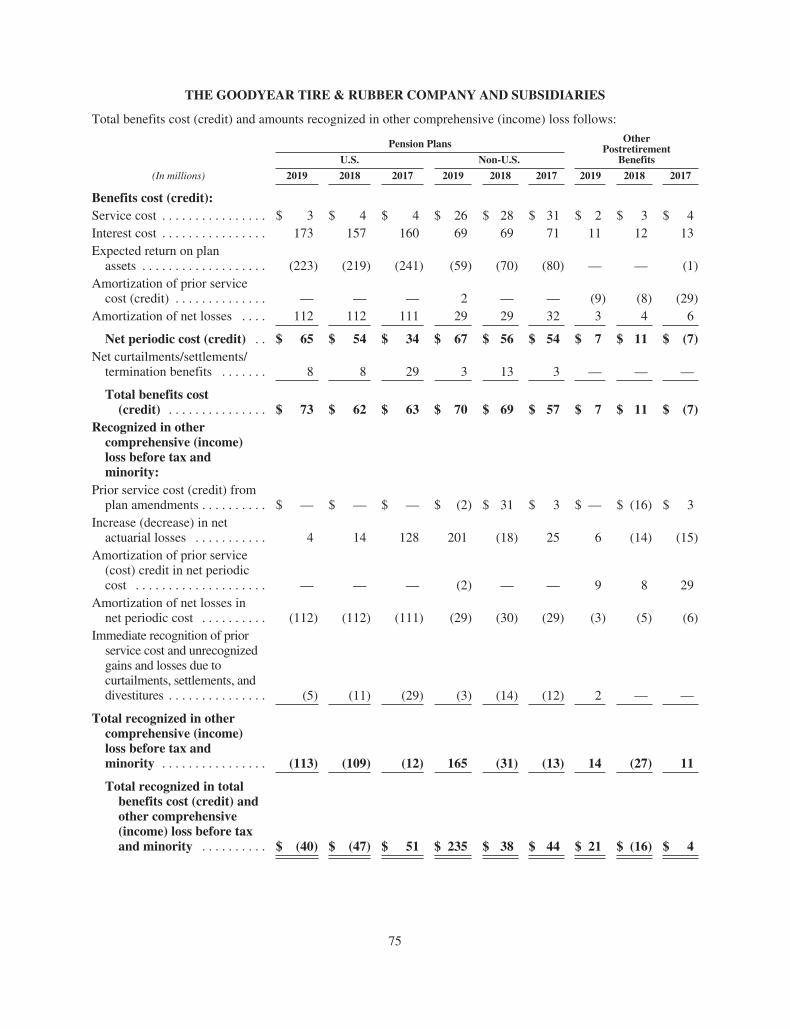
THE GOODYEAR TIRE & RUBBER COMPANY AND SUBSIDIARIES
Total benefits cost (credit) and amounts recognized in other comprehensive (income) loss follows:
Pension Plans OtherPostretirement
BenefitsU.S. Non-U.S.
(In millions) 2019 2018 2017 2019 2018 2017 2019 2018 2017
Benefits cost (credit):Service cost . . . . . . . . . . . . . . . . $ 3 $ 4 $ 4 $ 26 $ 28 $ 31 $ 2 $ 3 $ 4Interest cost . . . . . . . . . . . . . . . . 173 157 160 69 69 71 11 12 13Expected return on plan
assets . . . . . . . . . . . . . . . . . . . (223) (219) (241) (59) (70) (80) — — (1)Amortization of prior service
cost (credit) . . . . . . . . . . . . . . — — — 2 — — (9) (8) (29)Amortization of net losses . . . . 112 112 111 29 29 32 3 4 6
Net periodic cost (credit) . . $ 65 $ 54 $ 34 $ 67 $ 56 $ 54 $ 7 $ 11 $ (7)Net curtailments/settlements/
termination benefits . . . . . . . 8 8 29 3 13 3 — — —
Total benefits cost(credit) . . . . . . . . . . . . . . . $ 73 $ 62 $ 63 $ 70 $ 69 $ 57 $ 7 $ 11 $ (7)
Recognized in othercomprehensive (income)loss before tax andminority:
Prior service cost (credit) fromplan amendments . . . . . . . . . . $ — $ — $ — $ (2) $ 31 $ 3 $ — $ (16) $ 3
Increase (decrease) in netactuarial losses . . . . . . . . . . . 4 14 128 201 (18) 25 6 (14) (15)
Amortization of prior service(cost) credit in net periodiccost . . . . . . . . . . . . . . . . . . . . — — — (2) — — 9 8 29
Amortization of net losses innet periodic cost . . . . . . . . . . (112) (112) (111) (29) (30) (29) (3) (5) (6)
Immediate recognition of priorservice cost and unrecognizedgains and losses due tocurtailments, settlements, anddivestitures . . . . . . . . . . . . . . . (5) (11) (29) (3) (14) (12) 2 — —
Total recognized in othercomprehensive (income)loss before tax andminority . . . . . . . . . . . . . . . . (113) (109) (12) 165 (31) (13) 14 (27) 11
Total recognized in totalbenefits cost (credit) andother comprehensive(income) loss before taxand minority . . . . . . . . . . $ (40) $ (47) $ 51 $ 235 $ 38 $ 44 $ 21 $ (16) $ 4
75

THE GOODYEAR TIRE & RUBBER COMPANY AND SUBSIDIARIES
Service cost is recorded in CGS or SAG. Other components of net periodic cost (credit) are recorded in Other(Income) Expense. Net curtailments, settlements and termination benefits are recorded in Other (Income)Expense or Rationalizations if related to a rationalization plan.
We use the fair value of pension assets in the calculation of pension expense for all plans.
Total benefits cost (credit) for our other postretirement benefits was $3 million, $4 million and $(17) million forour U.S. plans in 2019, 2018 and 2017, respectively, and $4 million, $7 million and $10 million for ournon-U.S. plans in 2019, 2018 and 2017, respectively.
The estimated net actuarial loss and prior service cost for the defined benefit pension plans that will be amortizedfrom AOCL into benefits cost in 2020 is approximately $110 million and $0 million, respectively, for ourU.S. plans and approximately $38 million and $2 million, respectively, for our non-U.S. plans.
The estimated prior service credit and net actuarial loss for the other postretirement benefit plans that will beamortized from AOCL into benefits cost in 2020 are a benefit of $9 million and expense of $4 million,respectively.
The Medicare Prescription Drug Improvement and Modernization Act provides plan sponsors a federal subsidyfor certain qualifying prescription drug benefits covered under the sponsor’s postretirement health care plans.Our other postretirement benefits cost is presented net of this subsidy, which is less than $1 million annually.
76
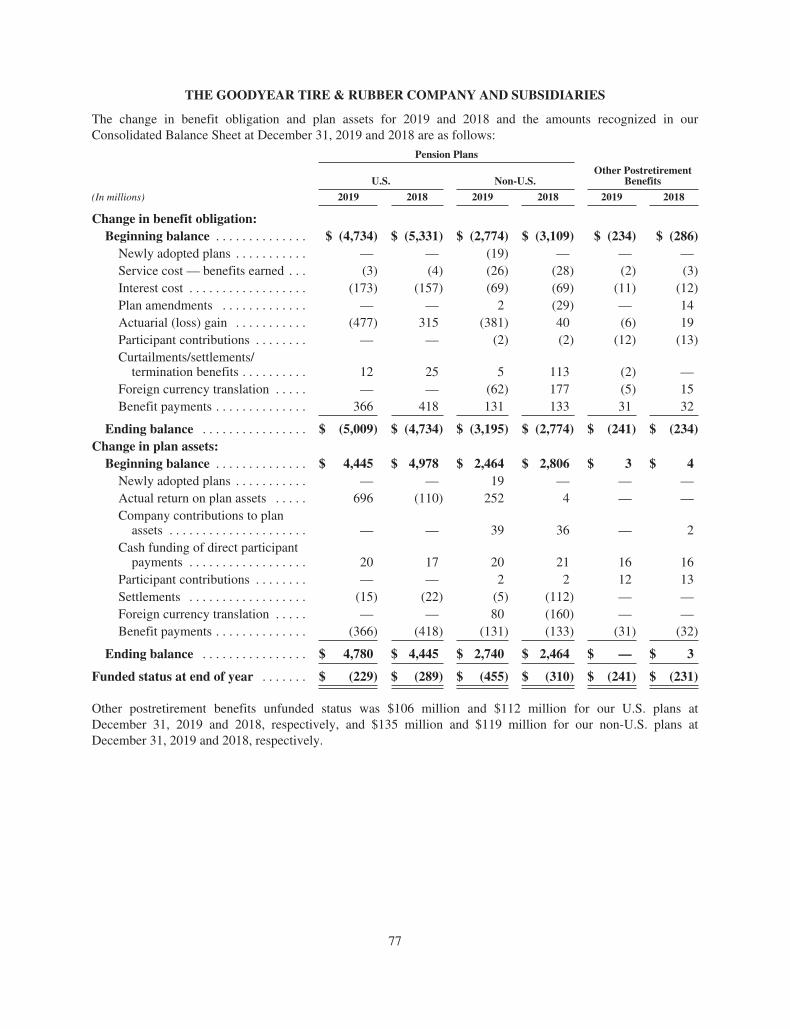
THE GOODYEAR TIRE & RUBBER COMPANY AND SUBSIDIARIES
The change in benefit obligation and plan assets for 2019 and 2018 and the amounts recognized in ourConsolidated Balance Sheet at December 31, 2019 and 2018 are as follows:
Pension Plans
U.S. Non-U.S.Other Postretirement
Benefits
(In millions) 2019 2018 2019 2018 2019 2018
Change in benefit obligation:Beginning balance . . . . . . . . . . . . . . $ (4,734) $ (5,331) $ (2,774) $ (3,109) $ (234) $ (286)
Newly adopted plans . . . . . . . . . . . — — (19) — — —Service cost — benefits earned . . . (3) (4) (26) (28) (2) (3)Interest cost . . . . . . . . . . . . . . . . . . (173) (157) (69) (69) (11) (12)Plan amendments . . . . . . . . . . . . . — — 2 (29) — 14Actuarial (loss) gain . . . . . . . . . . . (477) 315 (381) 40 (6) 19Participant contributions . . . . . . . . — — (2) (2) (12) (13)Curtailments/settlements/
termination benefits . . . . . . . . . . 12 25 5 113 (2) —Foreign currency translation . . . . . — — (62) 177 (5) 15Benefit payments . . . . . . . . . . . . . . 366 418 131 133 31 32
Ending balance . . . . . . . . . . . . . . . . $ (5,009) $ (4,734) $ (3,195) $ (2,774) $ (241) $ (234)Change in plan assets:
Beginning balance . . . . . . . . . . . . . . $ 4,445 $ 4,978 $ 2,464 $ 2,806 $ 3 $ 4Newly adopted plans . . . . . . . . . . . — — 19 — — —Actual return on plan assets . . . . . 696 (110) 252 4 — —Company contributions to plan
assets . . . . . . . . . . . . . . . . . . . . . — — 39 36 — 2Cash funding of direct participant
payments . . . . . . . . . . . . . . . . . . 20 17 20 21 16 16Participant contributions . . . . . . . . — — 2 2 12 13Settlements . . . . . . . . . . . . . . . . . . (15) (22) (5) (112) — —Foreign currency translation . . . . . — — 80 (160) — —Benefit payments . . . . . . . . . . . . . . (366) (418) (131) (133) (31) (32)
Ending balance . . . . . . . . . . . . . . . . $ 4,780 $ 4,445 $ 2,740 $ 2,464 $ — $ 3
Funded status at end of year . . . . . . . $ (229) $ (289) $ (455) $ (310) $ (241) $ (231)
Other postretirement benefits unfunded status was $106 million and $112 million for our U.S. plans atDecember 31, 2019 and 2018, respectively, and $135 million and $119 million for our non-U.S. plans atDecember 31, 2019 and 2018, respectively.
77
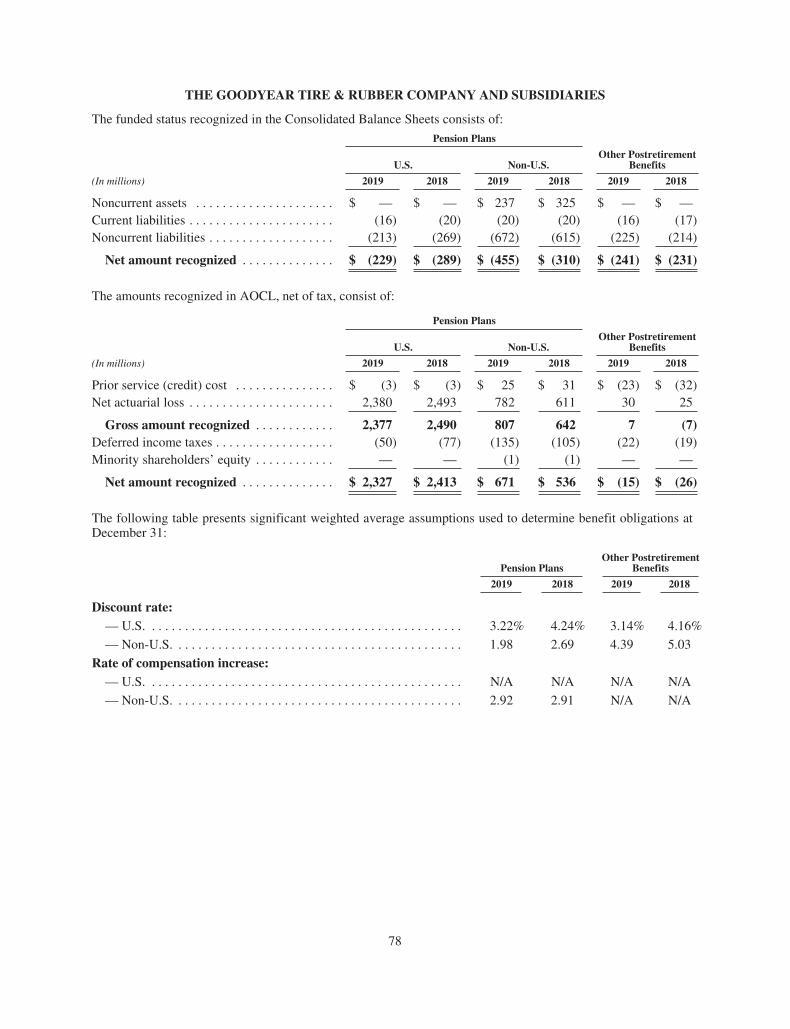
THE GOODYEAR TIRE & RUBBER COMPANY AND SUBSIDIARIES
The funded status recognized in the Consolidated Balance Sheets consists of:
Pension Plans
U.S. Non-U.S.Other Postretirement
Benefits
(In millions) 2019 2018 2019 2018 2019 2018
Noncurrent assets . . . . . . . . . . . . . . . . . . . . . $ — $ — $ 237 $ 325 $ — $ —Current liabilities . . . . . . . . . . . . . . . . . . . . . . (16) (20) (20) (20) (16) (17)Noncurrent liabilities . . . . . . . . . . . . . . . . . . . (213) (269) (672) (615) (225) (214)
Net amount recognized . . . . . . . . . . . . . . $ (229) $ (289) $ (455) $ (310) $ (241) $ (231)
The amounts recognized in AOCL, net of tax, consist of:
Pension Plans
U.S. Non-U.S.Other Postretirement
Benefits
(In millions) 2019 2018 2019 2018 2019 2018
Prior service (credit) cost . . . . . . . . . . . . . . . $ (3) $ (3) $ 25 $ 31 $ (23) $ (32)Net actuarial loss . . . . . . . . . . . . . . . . . . . . . . 2,380 2,493 782 611 30 25
Gross amount recognized . . . . . . . . . . . . 2,377 2,490 807 642 7 (7)Deferred income taxes . . . . . . . . . . . . . . . . . . (50) (77) (135) (105) (22) (19)Minority shareholders’ equity . . . . . . . . . . . . — — (1) (1) — —
Net amount recognized . . . . . . . . . . . . . . $ 2,327 $ 2,413 $ 671 $ 536 $ (15) $ (26)
The following table presents significant weighted average assumptions used to determine benefit obligations atDecember 31:
Pension PlansOther Postretirement
Benefits
2019 2018 2019 2018
Discount rate:— U.S. . . . . . . . . . . . . . . . . . . . . . . . . . . . . . . . . . . . . . . . . . . . . . . . 3.22% 4.24% 3.14% 4.16%
— Non-U.S. . . . . . . . . . . . . . . . . . . . . . . . . . . . . . . . . . . . . . . . . . . . 1.98 2.69 4.39 5.03
Rate of compensation increase:— U.S. . . . . . . . . . . . . . . . . . . . . . . . . . . . . . . . . . . . . . . . . . . . . . . . N/A N/A N/A N/A
— Non-U.S. . . . . . . . . . . . . . . . . . . . . . . . . . . . . . . . . . . . . . . . . . . . 2.92 2.91 N/A N/A
78
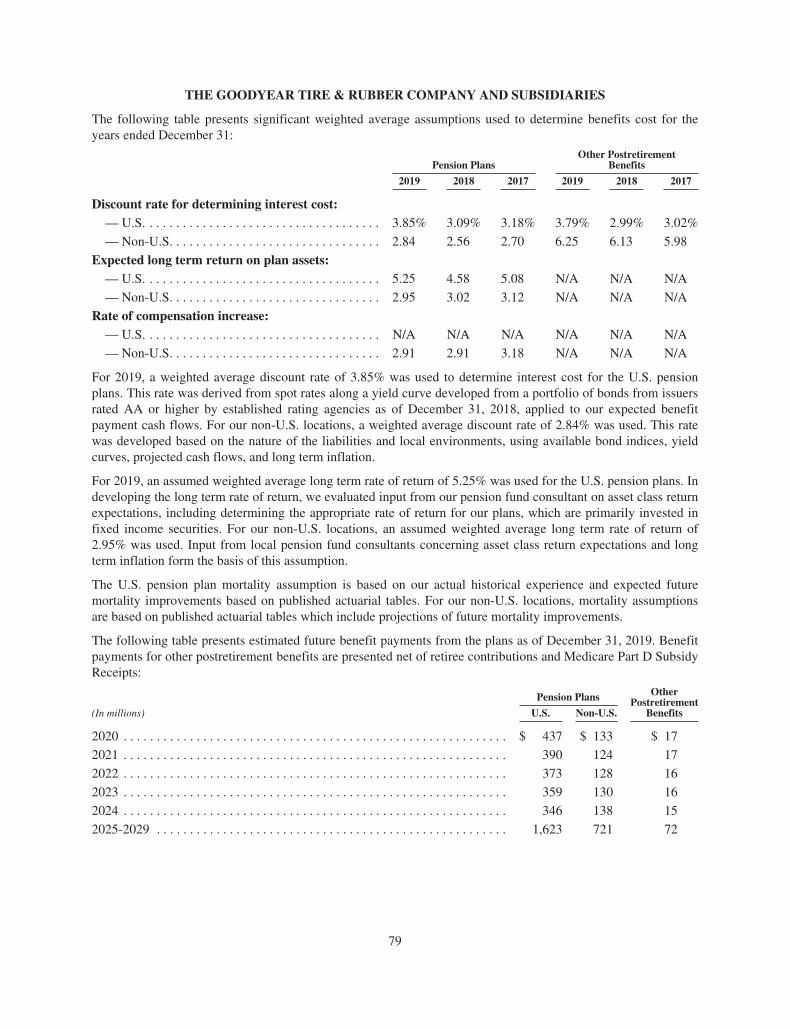
THE GOODYEAR TIRE & RUBBER COMPANY AND SUBSIDIARIES
The following table presents significant weighted average assumptions used to determine benefits cost for theyears ended December 31:
Pension PlansOther Postretirement
Benefits
2019 2018 2017 2019 2018 2017
Discount rate for determining interest cost:— U.S. . . . . . . . . . . . . . . . . . . . . . . . . . . . . . . . . . . . 3.85% 3.09% 3.18% 3.79% 2.99% 3.02%
— Non-U.S. . . . . . . . . . . . . . . . . . . . . . . . . . . . . . . . 2.84 2.56 2.70 6.25 6.13 5.98
Expected long term return on plan assets:— U.S. . . . . . . . . . . . . . . . . . . . . . . . . . . . . . . . . . . . 5.25 4.58 5.08 N/A N/A N/A
— Non-U.S. . . . . . . . . . . . . . . . . . . . . . . . . . . . . . . . 2.95 3.02 3.12 N/A N/A N/A
Rate of compensation increase:— U.S. . . . . . . . . . . . . . . . . . . . . . . . . . . . . . . . . . . . N/A N/A N/A N/A N/A N/A
— Non-U.S. . . . . . . . . . . . . . . . . . . . . . . . . . . . . . . . 2.91 2.91 3.18 N/A N/A N/A
For 2019, a weighted average discount rate of 3.85% was used to determine interest cost for the U.S. pensionplans. This rate was derived from spot rates along a yield curve developed from a portfolio of bonds from issuersrated AA or higher by established rating agencies as of December 31, 2018, applied to our expected benefitpayment cash flows. For our non-U.S. locations, a weighted average discount rate of 2.84% was used. This ratewas developed based on the nature of the liabilities and local environments, using available bond indices, yieldcurves, projected cash flows, and long term inflation.
For 2019, an assumed weighted average long term rate of return of 5.25% was used for the U.S. pension plans. Indeveloping the long term rate of return, we evaluated input from our pension fund consultant on asset class returnexpectations, including determining the appropriate rate of return for our plans, which are primarily invested infixed income securities. For our non-U.S. locations, an assumed weighted average long term rate of return of2.95% was used. Input from local pension fund consultants concerning asset class return expectations and longterm inflation form the basis of this assumption.
The U.S. pension plan mortality assumption is based on our actual historical experience and expected futuremortality improvements based on published actuarial tables. For our non-U.S. locations, mortality assumptionsare based on published actuarial tables which include projections of future mortality improvements.
The following table presents estimated future benefit payments from the plans as of December 31, 2019. Benefitpayments for other postretirement benefits are presented net of retiree contributions and Medicare Part D SubsidyReceipts:
Pension Plans OtherPostretirement
Benefits(In millions) U.S. Non-U.S.
2020 . . . . . . . . . . . . . . . . . . . . . . . . . . . . . . . . . . . . . . . . . . . . . . . . . . . . . . . . . . $ 437 $ 133 $ 17
2021 . . . . . . . . . . . . . . . . . . . . . . . . . . . . . . . . . . . . . . . . . . . . . . . . . . . . . . . . . . 390 124 17
2022 . . . . . . . . . . . . . . . . . . . . . . . . . . . . . . . . . . . . . . . . . . . . . . . . . . . . . . . . . . 373 128 16
2023 . . . . . . . . . . . . . . . . . . . . . . . . . . . . . . . . . . . . . . . . . . . . . . . . . . . . . . . . . . 359 130 16
2024 . . . . . . . . . . . . . . . . . . . . . . . . . . . . . . . . . . . . . . . . . . . . . . . . . . . . . . . . . . 346 138 15
2025-2029 . . . . . . . . . . . . . . . . . . . . . . . . . . . . . . . . . . . . . . . . . . . . . . . . . . . . . 1,623 721 72
79
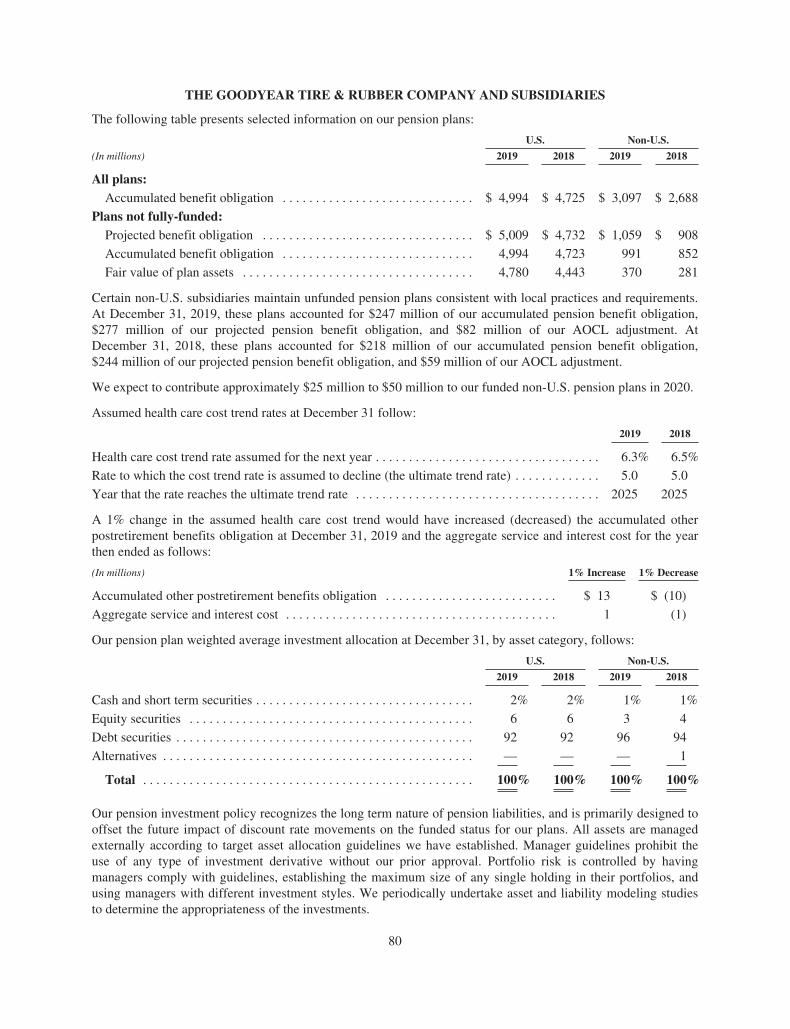
THE GOODYEAR TIRE & RUBBER COMPANY AND SUBSIDIARIES
The following table presents selected information on our pension plans:
U.S. Non-U.S.
(In millions) 2019 2018 2019 2018
All plans:Accumulated benefit obligation . . . . . . . . . . . . . . . . . . . . . . . . . . . . . $ 4,994 $ 4,725 $ 3,097 $ 2,688
Plans not fully-funded:Projected benefit obligation . . . . . . . . . . . . . . . . . . . . . . . . . . . . . . . . $ 5,009 $ 4,732 $ 1,059 $ 908
Accumulated benefit obligation . . . . . . . . . . . . . . . . . . . . . . . . . . . . . 4,994 4,723 991 852
Fair value of plan assets . . . . . . . . . . . . . . . . . . . . . . . . . . . . . . . . . . . 4,780 4,443 370 281
Certain non-U.S. subsidiaries maintain unfunded pension plans consistent with local practices and requirements.At December 31, 2019, these plans accounted for $247 million of our accumulated pension benefit obligation,$277 million of our projected pension benefit obligation, and $82 million of our AOCL adjustment. AtDecember 31, 2018, these plans accounted for $218 million of our accumulated pension benefit obligation,$244 million of our projected pension benefit obligation, and $59 million of our AOCL adjustment.
We expect to contribute approximately $25 million to $50 million to our funded non-U.S. pension plans in 2020.
Assumed health care cost trend rates at December 31 follow:
2019 2018
Health care cost trend rate assumed for the next year . . . . . . . . . . . . . . . . . . . . . . . . . . . . . . . . . . 6.3% 6.5%
Rate to which the cost trend rate is assumed to decline (the ultimate trend rate) . . . . . . . . . . . . . 5.0 5.0
Year that the rate reaches the ultimate trend rate . . . . . . . . . . . . . . . . . . . . . . . . . . . . . . . . . . . . . 2025 2025
A 1% change in the assumed health care cost trend would have increased (decreased) the accumulated otherpostretirement benefits obligation at December 31, 2019 and the aggregate service and interest cost for the yearthen ended as follows:
(In millions) 1% Increase 1% Decrease
Accumulated other postretirement benefits obligation . . . . . . . . . . . . . . . . . . . . . . . . . . $ 13 $ (10)
Aggregate service and interest cost . . . . . . . . . . . . . . . . . . . . . . . . . . . . . . . . . . . . . . . . . 1 (1)
Our pension plan weighted average investment allocation at December 31, by asset category, follows:
U.S. Non-U.S.
2019 2018 2019 2018
Cash and short term securities . . . . . . . . . . . . . . . . . . . . . . . . . . . . . . . . . 2% 2% 1% 1%
Equity securities . . . . . . . . . . . . . . . . . . . . . . . . . . . . . . . . . . . . . . . . . . . 6 6 3 4
Debt securities . . . . . . . . . . . . . . . . . . . . . . . . . . . . . . . . . . . . . . . . . . . . . 92 92 96 94
Alternatives . . . . . . . . . . . . . . . . . . . . . . . . . . . . . . . . . . . . . . . . . . . . . . . — — — 1
Total . . . . . . . . . . . . . . . . . . . . . . . . . . . . . . . . . . . . . . . . . . . . . . . . . . 100% 100% 100% 100%
Our pension investment policy recognizes the long term nature of pension liabilities, and is primarily designed tooffset the future impact of discount rate movements on the funded status for our plans. All assets are managedexternally according to target asset allocation guidelines we have established. Manager guidelines prohibit theuse of any type of investment derivative without our prior approval. Portfolio risk is controlled by havingmanagers comply with guidelines, establishing the maximum size of any single holding in their portfolios, andusing managers with different investment styles. We periodically undertake asset and liability modeling studiesto determine the appropriateness of the investments.
80
THE GOODYEAR TIRE & RUBBER COMPANY AND SUBSIDIARIES
The portfolio of our U.S. pension plan assets includes holdings of global high quality and high yield fixedincome securities, short term interest bearing deposits, and private equities. The target asset allocation of ourU.S. pension plans is 94% in duration-matched fixed income securities and 6% in equity securities. ActualU.S. pension fund asset allocations are reviewed on a periodic basis and the pension funds are rebalanced totarget ranges on an as needed basis.
The portfolios of our non-U.S. pension plans include holdings of U.S. and non-U.S. equities, global high qualityand high yield fixed income securities, hedge funds, currency derivatives, insurance contracts, repurchaseagreements, and short term interest bearing deposits. The weighted average target asset allocation of thenon-U.S. pension funds is approximately 95% fixed income and 5% equities.
81
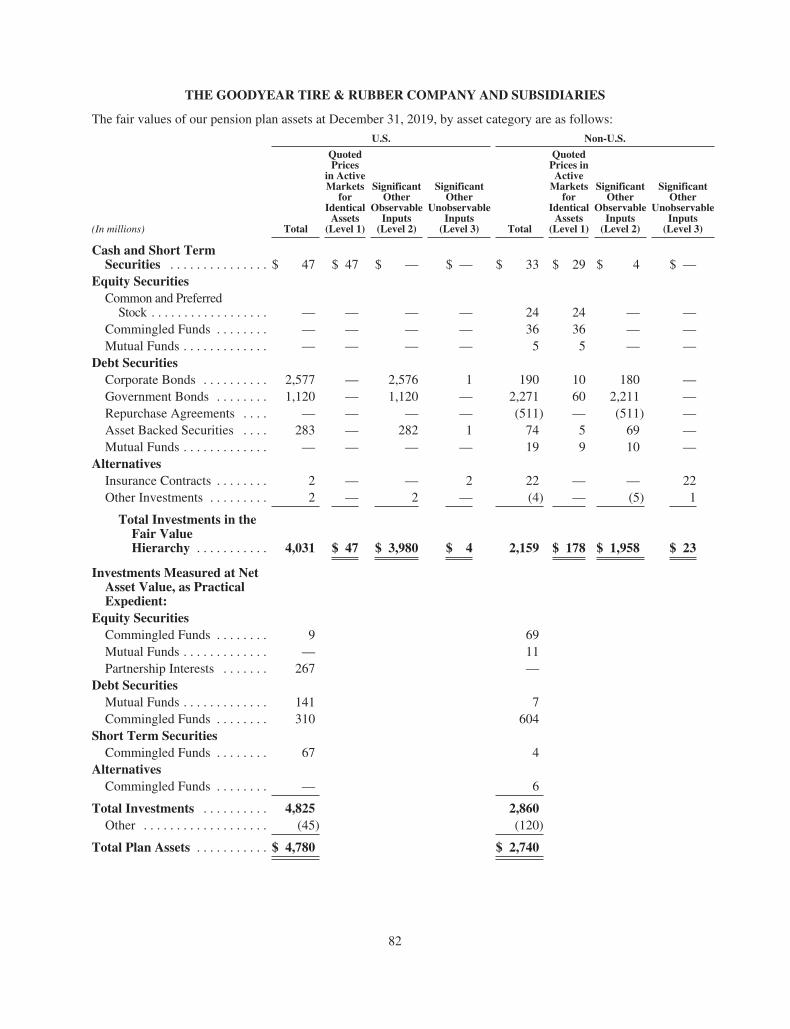
THE GOODYEAR TIRE & RUBBER COMPANY AND SUBSIDIARIES
The fair values of our pension plan assets at December 31, 2019, by asset category are as follows:
U.S. Non-U.S.
(In millions) Total
QuotedPrices
in ActiveMarkets
forIdentical
Assets(Level 1)
SignificantOther
ObservableInputs
(Level 2)
SignificantOther
UnobservableInputs
(Level 3) Total
QuotedPrices inActive
Marketsfor
IdenticalAssets
(Level 1)
SignificantOther
ObservableInputs
(Level 2)
SignificantOther
UnobservableInputs
(Level 3)
Cash and Short TermSecurities . . . . . . . . . . . . . . . $ 47 $ 47 $ — $ — $ 33 $ 29 $ 4 $ —
Equity SecuritiesCommon and Preferred
Stock . . . . . . . . . . . . . . . . . . — — — — 24 24 — —Commingled Funds . . . . . . . . — — — — 36 36 — —Mutual Funds . . . . . . . . . . . . . — — — — 5 5 — —
Debt SecuritiesCorporate Bonds . . . . . . . . . . 2,577 — 2,576 1 190 10 180 —Government Bonds . . . . . . . . 1,120 — 1,120 — 2,271 60 2,211 —Repurchase Agreements . . . . — — — — (511) — (511) —Asset Backed Securities . . . . 283 — 282 1 74 5 69 —Mutual Funds . . . . . . . . . . . . . — — — — 19 9 10 —
AlternativesInsurance Contracts . . . . . . . . 2 — — 2 22 — — 22Other Investments . . . . . . . . . 2 — 2 — (4) — (5) 1
Total Investments in theFair ValueHierarchy . . . . . . . . . . . 4,031 $ 47 $ 3,980 $ 4 2,159 $ 178 $ 1,958 $ 23
Investments Measured at NetAsset Value, as PracticalExpedient:
Equity SecuritiesCommingled Funds . . . . . . . . 9 69Mutual Funds . . . . . . . . . . . . . — 11Partnership Interests . . . . . . . 267 —
Debt SecuritiesMutual Funds . . . . . . . . . . . . . 141 7Commingled Funds . . . . . . . . 310 604
Short Term SecuritiesCommingled Funds . . . . . . . . 67 4
AlternativesCommingled Funds . . . . . . . . — 6
Total Investments . . . . . . . . . . 4,825 2,860Other . . . . . . . . . . . . . . . . . . . (45) (120)
Total Plan Assets . . . . . . . . . . . $ 4,780 $ 2,740
82

THE GOODYEAR TIRE & RUBBER COMPANY AND SUBSIDIARIES
The fair values of our pension plan assets at December 31, 2018, by asset category are as follows:
U.S. Non-U.S.
(In millions) Total
QuotedPrices
in ActiveMarkets
forIdentical
Assets(Level 1)
SignificantOther
ObservableInputs
(Level 2)
SignificantOther
UnobservableInputs
(Level 3) Total
QuotedPrices inActive
Marketsfor
IdenticalAssets
(Level 1)
SignificantOther
ObservableInputs
(Level 2)
SignificantOther
UnobservableInputs
(Level 3)
Cash and Short TermSecurities . . . . . . . . . . . . . . . $ 48 $ 48 $ — $ — $ 29 $ 26 $ 3 $ —
Equity SecuritiesCommon and Preferred
Stock . . . . . . . . . . . . . . . . . . — — — — 19 19 — —Commingled Funds . . . . . . . . — — — — 14 14 — —Mutual Funds . . . . . . . . . . . . . — — — — 4 4 — —
Debt SecuritiesCorporate Bonds . . . . . . . . . . 2,344 — 2,344 — 171 17 154 —Government Bonds . . . . . . . . 968 — 968 — 2,158 62 2,096 —Repurchase Agreements . . . . — — — — (641) — (641) —Asset Backed Securities . . . . 63 — 63 — 67 5 62 —Mutual Funds . . . . . . . . . . . . . — — — — 18 8 10 —
AlternativesInsurance Contracts . . . . . . . . 2 — — 2 19 — — 19Other Investments . . . . . . . . . — — — — 6 — 4 2
Total Investments in theFair ValueHierarchy . . . . . . . . . . . 3,425 $ 48 $ 3,375 $ 2 1,864 $ 155 $ 1,688 $ 21
Investments Measured at NetAsset Value, as PracticalExpedient:
Equity SecuritiesCommingled Funds . . . . . . . . 11 56Mutual Funds . . . . . . . . . . . . . — 7Partnership Interests . . . . . . . 247 —
Debt SecuritiesMutual Funds . . . . . . . . . . . . . 90 7Commingled Funds . . . . . . . . 603 638
Short Term SecuritiesCommingled Funds . . . . . . . . 59 7
AlternativesCommingled Funds . . . . . . . . — 5
Total Investments . . . . . . . . . . 4,435 2,584Other . . . . . . . . . . . . . . . . . . . 10 (120)
Total Plan Assets . . . . . . . . . . . $ 4,445 $ 2,464
At December 31, 2019 and 2018, the Plans did not directly hold any of our common stock.
83
THE GOODYEAR TIRE & RUBBER COMPANY AND SUBSIDIARIES
The classification of fair value measurements within the hierarchy is based upon the lowest level of input that issignificant to the measurement. Investments that are measured at Net Asset Value (“NAV”) as a practicalexpedient to estimate fair value are not classified in the fair value hierarchy. Under the practical expedientapproach, the NAV is based on the fair value of the underlying investments held by each fund less its liabilities.This practical expedient would not be used when it is determined to be probable that the fund will sell theinvestment for an amount different than the reported NAV. The fair value amounts presented in this table areintended to permit reconciliation of the fair value hierarchy to total plan assets. Valuation methodologies used forassets and liabilities measured at fair value are as follows:
• Cash and Short Term Securities: Cash and cash equivalents consist of U.S. and foreign currencies.Foreign currencies are reported in U.S. dollars based on currency exchange rates readily available inactive markets. Short term securities held in commingled funds are valued at the NAV of units held atyear end, as determined by the investment manager.
• Equity Securities: Common and preferred stock, which are held in non-U.S. companies, are valued atthe closing price reported on the active market on which the individual securities are traded. Commingledfunds are valued at the NAV of units held at year end, as determined by a pricing vendor or the fundfamily. Mutual funds are valued at the NAV of shares held at year end, as determined by the closing pricereported on the active market on which the individual securities are traded, or a pricing vendor or the fundfamily if an active market is not available. Partnership interests are priced based on valuations using thepartnership’s available financial statements coinciding with our year end and the plan’s percentownership, adjusted for any cash transactions which occurred between the date of those financialstatements and our year end.
• Debt Securities: Corporate and government bonds, including asset backed securities, are valued at theclosing price reported on the active market on which the individual securities are traded, or based oninstitutional bid evaluations using proprietary models if an active market is not available. Repurchaseagreements are valued at the contract price plus accrued interest. These secured borrowings arecollateralized by government bonds held by the non-U.S. plans and have maturities less than one year.Commingled funds are valued at the NAV of units held at year end, as determined by a pricing vendor orthe fund family. Mutual funds are valued at the NAV of shares held at year end, as determined by theclosing price reported on the active market on which the individual securities are traded, or a pricingvendor or the fund family if an active market is not available.
• Alternatives: Commingled funds are valued based on the NAV as determined by the fund manager usingthe most recent financial information available. Other investments primarily include derivative financialinstruments, which are valued using independent pricing sources which utilize industry standardderivative valuation models. Directed insurance contracts are valued as reported by the issuer.
The methods described above may produce a fair value calculation that may not be indicative of net realizablevalue or reflective of future fair values. Furthermore, while the Company believes its valuation methods areappropriate and consistent with other market participants, the use of different methodologies or assumptions todetermine the fair value of certain financial instruments could result in a different fair value measurement at thereporting date.
84
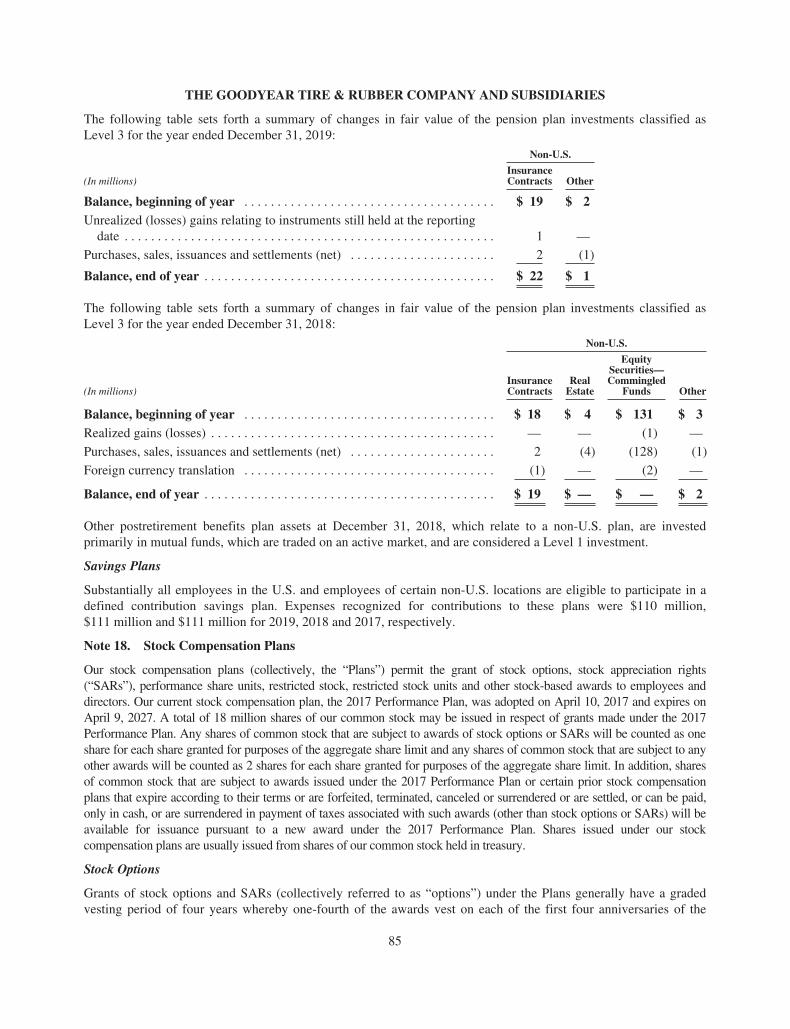
THE GOODYEAR TIRE & RUBBER COMPANY AND SUBSIDIARIES
The following table sets forth a summary of changes in fair value of the pension plan investments classified asLevel 3 for the year ended December 31, 2019:
Non-U.S.
(In millions)InsuranceContracts Other
Balance, beginning of year . . . . . . . . . . . . . . . . . . . . . . . . . . . . . . . . . . . . . . $ 19 $ 2Unrealized (losses) gains relating to instruments still held at the reporting
date . . . . . . . . . . . . . . . . . . . . . . . . . . . . . . . . . . . . . . . . . . . . . . . . . . . . . . . . 1 —
Purchases, sales, issuances and settlements (net) . . . . . . . . . . . . . . . . . . . . . . 2 (1)
Balance, end of year . . . . . . . . . . . . . . . . . . . . . . . . . . . . . . . . . . . . . . . . . . . . $ 22 $ 1
The following table sets forth a summary of changes in fair value of the pension plan investments classified asLevel 3 for the year ended December 31, 2018:
Non-U.S.
(In millions)InsuranceContracts
RealEstate
EquitySecurities—Commingled
Funds Other
Balance, beginning of year . . . . . . . . . . . . . . . . . . . . . . . . . . . . . . . . . . . . . . $ 18 $ 4 $ 131 $ 3Realized gains (losses) . . . . . . . . . . . . . . . . . . . . . . . . . . . . . . . . . . . . . . . . . . . — — (1) —
Purchases, sales, issuances and settlements (net) . . . . . . . . . . . . . . . . . . . . . . 2 (4) (128) (1)
Foreign currency translation . . . . . . . . . . . . . . . . . . . . . . . . . . . . . . . . . . . . . . (1) — (2) —
Balance, end of year . . . . . . . . . . . . . . . . . . . . . . . . . . . . . . . . . . . . . . . . . . . . $ 19 $ — $ — $ 2
Other postretirement benefits plan assets at December 31, 2018, which relate to a non-U.S. plan, are investedprimarily in mutual funds, which are traded on an active market, and are considered a Level 1 investment.
Savings Plans
Substantially all employees in the U.S. and employees of certain non-U.S. locations are eligible to participate in adefined contribution savings plan. Expenses recognized for contributions to these plans were $110 million,$111 million and $111 million for 2019, 2018 and 2017, respectively.
Note 18. Stock Compensation Plans
Our stock compensation plans (collectively, the “Plans”) permit the grant of stock options, stock appreciation rights(“SARs”), performance share units, restricted stock, restricted stock units and other stock-based awards to employees anddirectors. Our current stock compensation plan, the 2017 Performance Plan, was adopted on April 10, 2017 and expires onApril 9, 2027. A total of 18 million shares of our common stock may be issued in respect of grants made under the 2017Performance Plan. Any shares of common stock that are subject to awards of stock options or SARs will be counted as oneshare for each share granted for purposes of the aggregate share limit and any shares of common stock that are subject to anyother awards will be counted as 2 shares for each share granted for purposes of the aggregate share limit. In addition, sharesof common stock that are subject to awards issued under the 2017 Performance Plan or certain prior stock compensationplans that expire according to their terms or are forfeited, terminated, canceled or surrendered or are settled, or can be paid,only in cash, or are surrendered in payment of taxes associated with such awards (other than stock options or SARs) will beavailable for issuance pursuant to a new award under the 2017 Performance Plan. Shares issued under our stockcompensation plans are usually issued from shares of our common stock held in treasury.
Stock Options
Grants of stock options and SARs (collectively referred to as “options”) under the Plans generally have a gradedvesting period of four years whereby one-fourth of the awards vest on each of the first four anniversaries of the
85
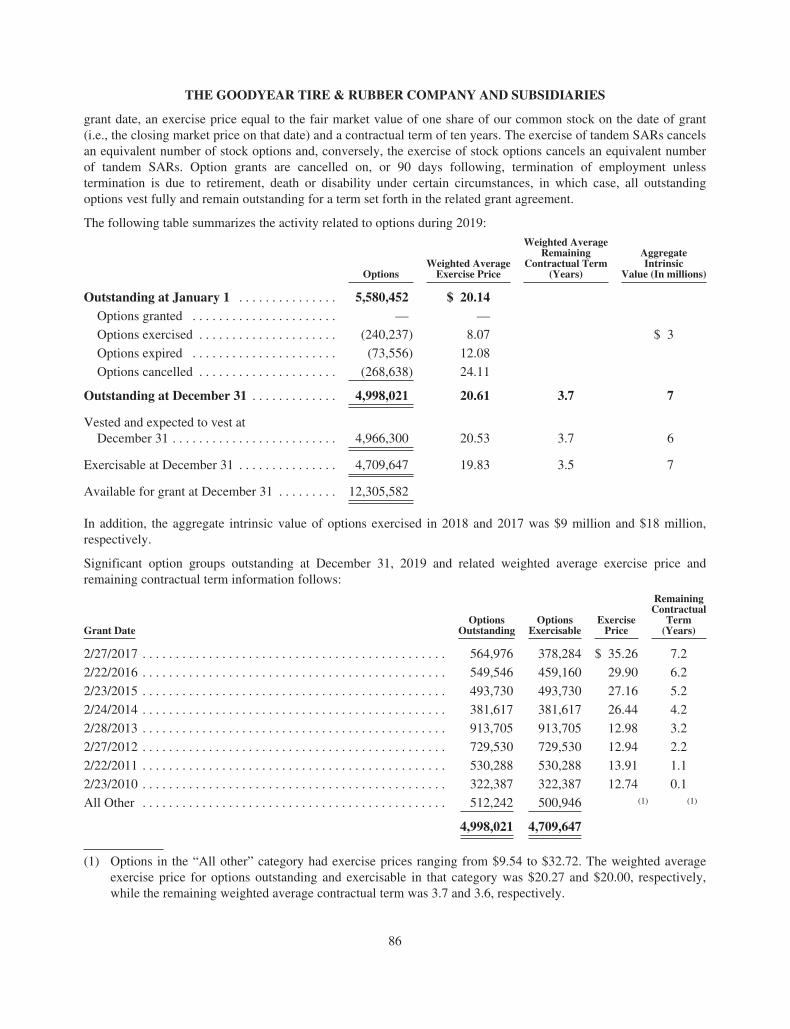
THE GOODYEAR TIRE & RUBBER COMPANY AND SUBSIDIARIES
grant date, an exercise price equal to the fair market value of one share of our common stock on the date of grant(i.e., the closing market price on that date) and a contractual term of ten years. The exercise of tandem SARs cancelsan equivalent number of stock options and, conversely, the exercise of stock options cancels an equivalent numberof tandem SARs. Option grants are cancelled on, or 90 days following, termination of employment unlesstermination is due to retirement, death or disability under certain circumstances, in which case, all outstandingoptions vest fully and remain outstanding for a term set forth in the related grant agreement.
The following table summarizes the activity related to options during 2019:
OptionsWeighted Average
Exercise Price
Weighted AverageRemaining
Contractual Term(Years)
AggregateIntrinsic
Value (In millions)
Outstanding at January 1 . . . . . . . . . . . . . . . 5,580,452 $ 20.14Options granted . . . . . . . . . . . . . . . . . . . . . . — —
Options exercised . . . . . . . . . . . . . . . . . . . . . (240,237) 8.07 $ 3
Options expired . . . . . . . . . . . . . . . . . . . . . . (73,556) 12.08
Options cancelled . . . . . . . . . . . . . . . . . . . . . (268,638) 24.11
Outstanding at December 31 . . . . . . . . . . . . . 4,998,021 20.61 3.7 7
Vested and expected to vest atDecember 31 . . . . . . . . . . . . . . . . . . . . . . . . . 4,966,300 20.53 3.7 6
Exercisable at December 31 . . . . . . . . . . . . . . . 4,709,647 19.83 3.5 7
Available for grant at December 31 . . . . . . . . . 12,305,582
In addition, the aggregate intrinsic value of options exercised in 2018 and 2017 was $9 million and $18 million,respectively.
Significant option groups outstanding at December 31, 2019 and related weighted average exercise price andremaining contractual term information follows:
Grant DateOptions
OutstandingOptions
ExercisableExercise
Price
RemainingContractual
Term(Years)
2/27/2017 . . . . . . . . . . . . . . . . . . . . . . . . . . . . . . . . . . . . . . . . . . . . . . 564,976 378,284 $ 35.26 7.2
2/22/2016 . . . . . . . . . . . . . . . . . . . . . . . . . . . . . . . . . . . . . . . . . . . . . . 549,546 459,160 29.90 6.2
2/23/2015 . . . . . . . . . . . . . . . . . . . . . . . . . . . . . . . . . . . . . . . . . . . . . . 493,730 493,730 27.16 5.2
2/24/2014 . . . . . . . . . . . . . . . . . . . . . . . . . . . . . . . . . . . . . . . . . . . . . . 381,617 381,617 26.44 4.2
2/28/2013 . . . . . . . . . . . . . . . . . . . . . . . . . . . . . . . . . . . . . . . . . . . . . . 913,705 913,705 12.98 3.2
2/27/2012 . . . . . . . . . . . . . . . . . . . . . . . . . . . . . . . . . . . . . . . . . . . . . . 729,530 729,530 12.94 2.2
2/22/2011 . . . . . . . . . . . . . . . . . . . . . . . . . . . . . . . . . . . . . . . . . . . . . . 530,288 530,288 13.91 1.1
2/23/2010 . . . . . . . . . . . . . . . . . . . . . . . . . . . . . . . . . . . . . . . . . . . . . . 322,387 322,387 12.74 0.1
All Other . . . . . . . . . . . . . . . . . . . . . . . . . . . . . . . . . . . . . . . . . . . . . . 512,242 500,946 (1) (1)
4,998,021 4,709,647
(1) Options in the “All other” category had exercise prices ranging from $9.54 to $32.72. The weighted averageexercise price for options outstanding and exercisable in that category was $20.27 and $20.00, respectively,while the remaining weighted average contractual term was 3.7 and 3.6, respectively.
86
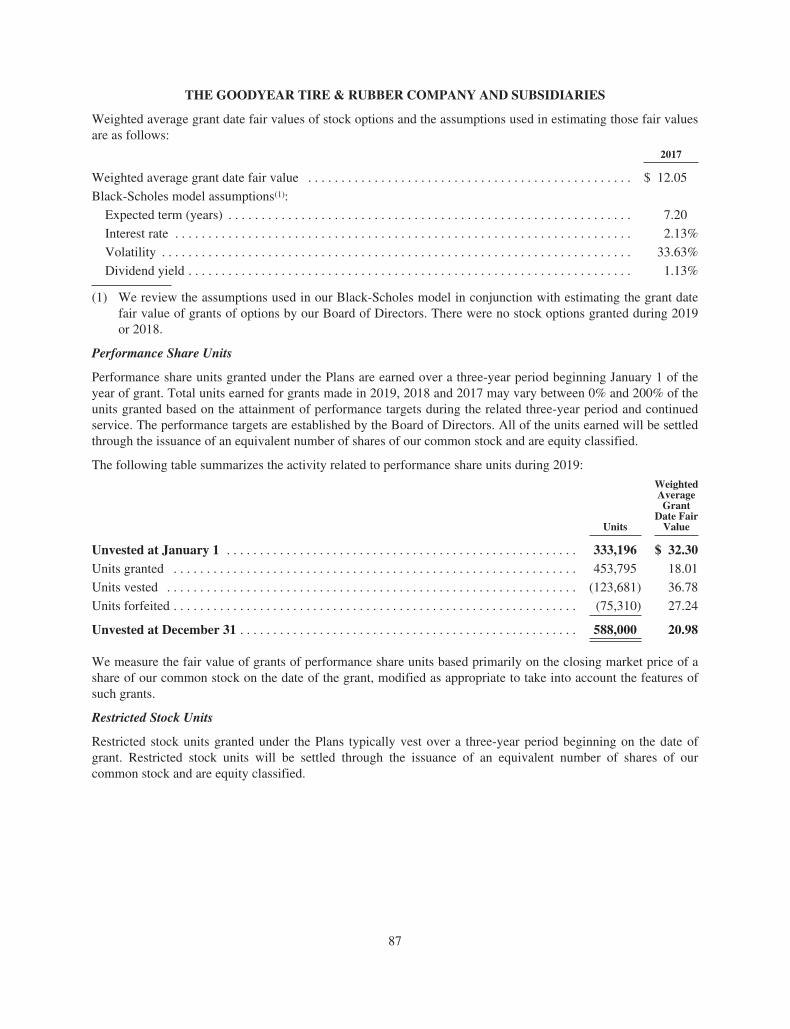
THE GOODYEAR TIRE & RUBBER COMPANY AND SUBSIDIARIES
Weighted average grant date fair values of stock options and the assumptions used in estimating those fair valuesare as follows:
2017
Weighted average grant date fair value . . . . . . . . . . . . . . . . . . . . . . . . . . . . . . . . . . . . . . . . . . . . . . . . . $ 12.05
Black-Scholes model assumptions(1):
Expected term (years) . . . . . . . . . . . . . . . . . . . . . . . . . . . . . . . . . . . . . . . . . . . . . . . . . . . . . . . . . . . . . 7.20
Interest rate . . . . . . . . . . . . . . . . . . . . . . . . . . . . . . . . . . . . . . . . . . . . . . . . . . . . . . . . . . . . . . . . . . . . . 2.13%
Volatility . . . . . . . . . . . . . . . . . . . . . . . . . . . . . . . . . . . . . . . . . . . . . . . . . . . . . . . . . . . . . . . . . . . . . . . 33.63%
Dividend yield . . . . . . . . . . . . . . . . . . . . . . . . . . . . . . . . . . . . . . . . . . . . . . . . . . . . . . . . . . . . . . . . . . . 1.13%
(1) We review the assumptions used in our Black-Scholes model in conjunction with estimating the grant datefair value of grants of options by our Board of Directors. There were no stock options granted during 2019or 2018.
Performance Share Units
Performance share units granted under the Plans are earned over a three-year period beginning January 1 of theyear of grant. Total units earned for grants made in 2019, 2018 and 2017 may vary between 0% and 200% of theunits granted based on the attainment of performance targets during the related three-year period and continuedservice. The performance targets are established by the Board of Directors. All of the units earned will be settledthrough the issuance of an equivalent number of shares of our common stock and are equity classified.
The following table summarizes the activity related to performance share units during 2019:
Units
WeightedAverageGrant
Date FairValue
Unvested at January 1 . . . . . . . . . . . . . . . . . . . . . . . . . . . . . . . . . . . . . . . . . . . . . . . . . . . . . 333,196 $ 32.30Units granted . . . . . . . . . . . . . . . . . . . . . . . . . . . . . . . . . . . . . . . . . . . . . . . . . . . . . . . . . . . . . 453,795 18.01
Units vested . . . . . . . . . . . . . . . . . . . . . . . . . . . . . . . . . . . . . . . . . . . . . . . . . . . . . . . . . . . . . . (123,681) 36.78
Units forfeited . . . . . . . . . . . . . . . . . . . . . . . . . . . . . . . . . . . . . . . . . . . . . . . . . . . . . . . . . . . . . (75,310) 27.24
Unvested at December 31 . . . . . . . . . . . . . . . . . . . . . . . . . . . . . . . . . . . . . . . . . . . . . . . . . . . 588,000 20.98
We measure the fair value of grants of performance share units based primarily on the closing market price of ashare of our common stock on the date of the grant, modified as appropriate to take into account the features ofsuch grants.
Restricted Stock Units
Restricted stock units granted under the Plans typically vest over a three-year period beginning on the date ofgrant. Restricted stock units will be settled through the issuance of an equivalent number of shares of ourcommon stock and are equity classified.
87
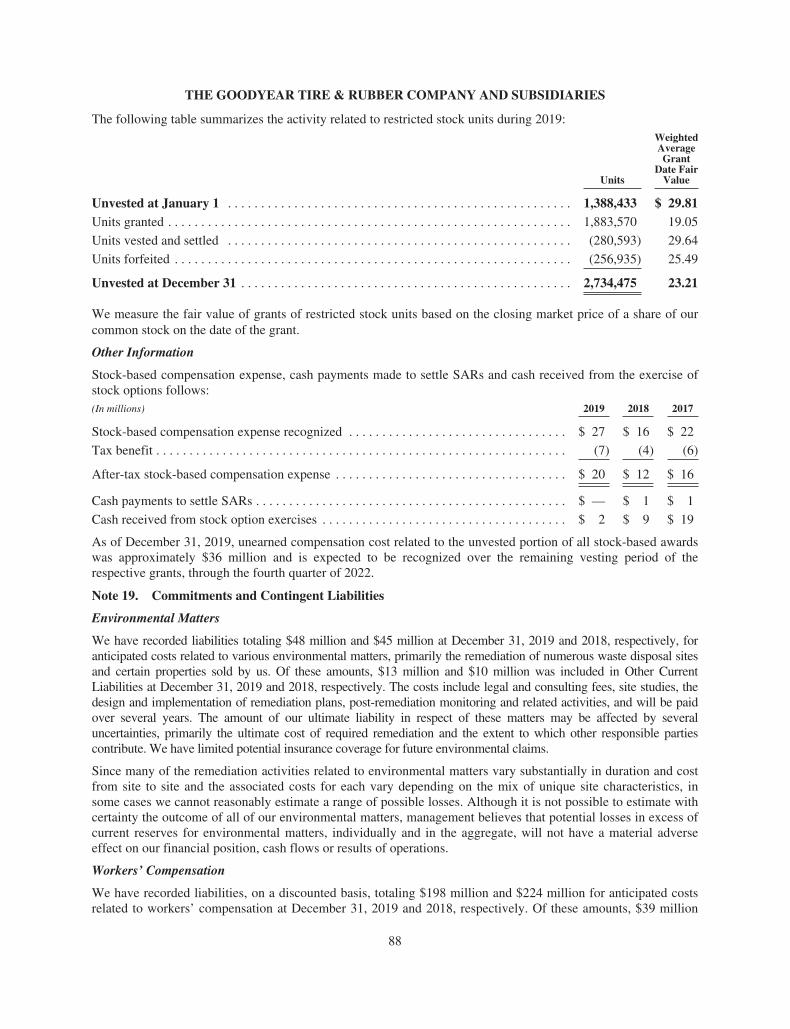
THE GOODYEAR TIRE & RUBBER COMPANY AND SUBSIDIARIES
The following table summarizes the activity related to restricted stock units during 2019:
Units
WeightedAverageGrant
Date FairValue
Unvested at January 1 . . . . . . . . . . . . . . . . . . . . . . . . . . . . . . . . . . . . . . . . . . . . . . . . . . . . 1,388,433 $ 29.81Units granted . . . . . . . . . . . . . . . . . . . . . . . . . . . . . . . . . . . . . . . . . . . . . . . . . . . . . . . . . . . . . 1,883,570 19.05
Units vested and settled . . . . . . . . . . . . . . . . . . . . . . . . . . . . . . . . . . . . . . . . . . . . . . . . . . . . (280,593) 29.64
Units forfeited . . . . . . . . . . . . . . . . . . . . . . . . . . . . . . . . . . . . . . . . . . . . . . . . . . . . . . . . . . . . (256,935) 25.49
Unvested at December 31 . . . . . . . . . . . . . . . . . . . . . . . . . . . . . . . . . . . . . . . . . . . . . . . . . . 2,734,475 23.21
We measure the fair value of grants of restricted stock units based on the closing market price of a share of ourcommon stock on the date of the grant.
Other Information
Stock-based compensation expense, cash payments made to settle SARs and cash received from the exercise ofstock options follows:(In millions) 2019 2018 2017
Stock-based compensation expense recognized . . . . . . . . . . . . . . . . . . . . . . . . . . . . . . . . . $ 27 $ 16 $ 22
Tax benefit . . . . . . . . . . . . . . . . . . . . . . . . . . . . . . . . . . . . . . . . . . . . . . . . . . . . . . . . . . . . . . (7) (4) (6)
After-tax stock-based compensation expense . . . . . . . . . . . . . . . . . . . . . . . . . . . . . . . . . . . $ 20 $ 12 $ 16
Cash payments to settle SARs . . . . . . . . . . . . . . . . . . . . . . . . . . . . . . . . . . . . . . . . . . . . . . . $ — $ 1 $ 1
Cash received from stock option exercises . . . . . . . . . . . . . . . . . . . . . . . . . . . . . . . . . . . . . $ 2 $ 9 $ 19
As of December 31, 2019, unearned compensation cost related to the unvested portion of all stock-based awardswas approximately $36 million and is expected to be recognized over the remaining vesting period of therespective grants, through the fourth quarter of 2022.
Note 19. Commitments and Contingent Liabilities
Environmental Matters
We have recorded liabilities totaling $48 million and $45 million at December 31, 2019 and 2018, respectively, foranticipated costs related to various environmental matters, primarily the remediation of numerous waste disposal sitesand certain properties sold by us. Of these amounts, $13 million and $10 million was included in Other CurrentLiabilities at December 31, 2019 and 2018, respectively. The costs include legal and consulting fees, site studies, thedesign and implementation of remediation plans, post-remediation monitoring and related activities, and will be paidover several years. The amount of our ultimate liability in respect of these matters may be affected by severaluncertainties, primarily the ultimate cost of required remediation and the extent to which other responsible partiescontribute. We have limited potential insurance coverage for future environmental claims.
Since many of the remediation activities related to environmental matters vary substantially in duration and costfrom site to site and the associated costs for each vary depending on the mix of unique site characteristics, insome cases we cannot reasonably estimate a range of possible losses. Although it is not possible to estimate withcertainty the outcome of all of our environmental matters, management believes that potential losses in excess ofcurrent reserves for environmental matters, individually and in the aggregate, will not have a material adverseeffect on our financial position, cash flows or results of operations.
Workers’ Compensation
We have recorded liabilities, on a discounted basis, totaling $198 million and $224 million for anticipated costsrelated to workers’ compensation at December 31, 2019 and 2018, respectively. Of these amounts, $39 million
88
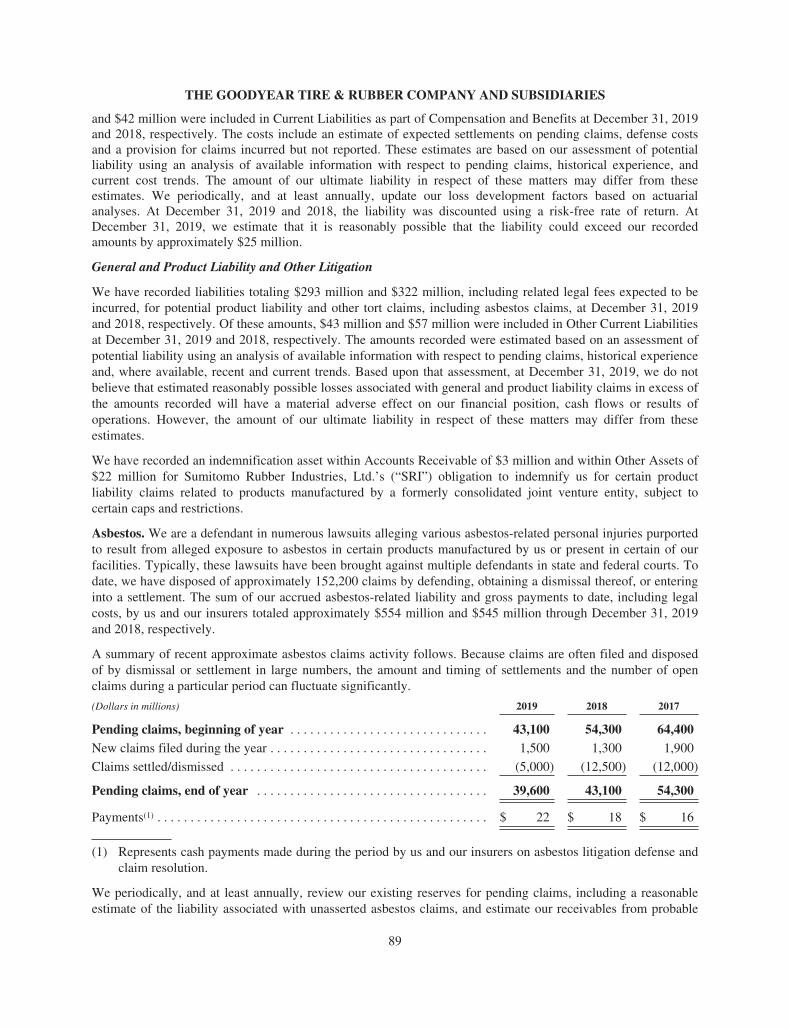
THE GOODYEAR TIRE & RUBBER COMPANY AND SUBSIDIARIES
and $42 million were included in Current Liabilities as part of Compensation and Benefits at December 31, 2019and 2018, respectively. The costs include an estimate of expected settlements on pending claims, defense costsand a provision for claims incurred but not reported. These estimates are based on our assessment of potentialliability using an analysis of available information with respect to pending claims, historical experience, andcurrent cost trends. The amount of our ultimate liability in respect of these matters may differ from theseestimates. We periodically, and at least annually, update our loss development factors based on actuarialanalyses. At December 31, 2019 and 2018, the liability was discounted using a risk-free rate of return. AtDecember 31, 2019, we estimate that it is reasonably possible that the liability could exceed our recordedamounts by approximately $25 million.
General and Product Liability and Other Litigation
We have recorded liabilities totaling $293 million and $322 million, including related legal fees expected to beincurred, for potential product liability and other tort claims, including asbestos claims, at December 31, 2019and 2018, respectively. Of these amounts, $43 million and $57 million were included in Other Current Liabilitiesat December 31, 2019 and 2018, respectively. The amounts recorded were estimated based on an assessment ofpotential liability using an analysis of available information with respect to pending claims, historical experienceand, where available, recent and current trends. Based upon that assessment, at December 31, 2019, we do notbelieve that estimated reasonably possible losses associated with general and product liability claims in excess ofthe amounts recorded will have a material adverse effect on our financial position, cash flows or results ofoperations. However, the amount of our ultimate liability in respect of these matters may differ from theseestimates.
We have recorded an indemnification asset within Accounts Receivable of $3 million and within Other Assets of$22 million for Sumitomo Rubber Industries, Ltd.’s (“SRI”) obligation to indemnify us for certain productliability claims related to products manufactured by a formerly consolidated joint venture entity, subject tocertain caps and restrictions.
Asbestos. We are a defendant in numerous lawsuits alleging various asbestos-related personal injuries purportedto result from alleged exposure to asbestos in certain products manufactured by us or present in certain of ourfacilities. Typically, these lawsuits have been brought against multiple defendants in state and federal courts. Todate, we have disposed of approximately 152,200 claims by defending, obtaining a dismissal thereof, or enteringinto a settlement. The sum of our accrued asbestos-related liability and gross payments to date, including legalcosts, by us and our insurers totaled approximately $554 million and $545 million through December 31, 2019and 2018, respectively.
A summary of recent approximate asbestos claims activity follows. Because claims are often filed and disposedof by dismissal or settlement in large numbers, the amount and timing of settlements and the number of openclaims during a particular period can fluctuate significantly.
(Dollars in millions) 2019 2018 2017
Pending claims, beginning of year . . . . . . . . . . . . . . . . . . . . . . . . . . . . . . 43,100 54,300 64,400New claims filed during the year . . . . . . . . . . . . . . . . . . . . . . . . . . . . . . . . . 1,500 1,300 1,900
Claims settled/dismissed . . . . . . . . . . . . . . . . . . . . . . . . . . . . . . . . . . . . . . . (5,000) (12,500) (12,000)
Pending claims, end of year . . . . . . . . . . . . . . . . . . . . . . . . . . . . . . . . . . . 39,600 43,100 54,300
Payments(1) . . . . . . . . . . . . . . . . . . . . . . . . . . . . . . . . . . . . . . . . . . . . . . . . . . $ 22 $ 18 $ 16
(1) Represents cash payments made during the period by us and our insurers on asbestos litigation defense andclaim resolution.
We periodically, and at least annually, review our existing reserves for pending claims, including a reasonableestimate of the liability associated with unasserted asbestos claims, and estimate our receivables from probable
89

THE GOODYEAR TIRE & RUBBER COMPANY AND SUBSIDIARIES
insurance recoveries. We recorded gross liabilities for both asserted and unasserted claims, inclusive of defensecosts, totaling $153 million and $166 million at December 31, 2019 and 2018, respectively. In determining theestimate of our asbestos liability, we evaluated claims over the next ten-year period. Due to the difficulties inmaking these estimates, analysis based on new data and/or a change in circumstances arising in the future mayresult in an increase in the recorded obligation, and that increase could be significant.
We maintain certain primary and excess insurance coverage under coverage-in-place agreements, and also haveadditional excess liability insurance with respect to asbestos liabilities. After consultation with our outside legalcounsel and giving consideration to agreements with certain of our insurance carriers, the financial viability andlegal obligations of our insurance carriers and other relevant factors, we determine an amount we expect isprobable of recovery from such carriers. We record a receivable with respect to such policies when we determinethat recovery is probable and we can reasonably estimate the amount of a particular recovery.
We recorded an insurance receivable related to asbestos claims of $95 million and $108 million at December 31,2019 and 2018, respectively. We expect that approximately 60% of asbestos claim related losses would berecoverable through insurance during the ten-year period covered by the estimated liability. Of these amounts,$13 million was included in Current Assets as part of Accounts Receivable at both December 31, 2019 and 2018.The recorded receivable consists of an amount we expect to collect under coverage-in-place agreements withcertain primary and excess insurance carriers as well as an amount we believe is probable of recovery fromcertain of our other excess insurance carriers.
We believe that, at December 31, 2019, we had approximately $555 million in excess level policy limitsapplicable to indemnity and defense costs for asbestos products claims under coverage-in-place agreements. Wealso had additional unsettled excess level policy limits potentially applicable to such costs. In addition, we hadcoverage under certain primary policies for indemnity and defense costs for asbestos products claims underremaining aggregate limits pursuant to a coverage-in-place agreement, as well as coverage for indemnity anddefense costs for asbestos premises claims pursuant to coverage-in-place agreements.
We believe that our reserve for asbestos claims, and the receivable for recoveries from insurance carriersrecorded in respect of these claims, reflects reasonable and probable estimates of these amounts. The estimate ofthe liabilities and assets related to pending and expected future asbestos claims and insurance recoveries issubject to numerous uncertainties, including, but not limited to, changes in:
• the litigation environment,
• federal and state law governing the compensation of asbestos claimants,
• recoverability of receivables due to potential insolvency of insurance carriers,
• our approach to defending and resolving claims, and
• the level of payments made to claimants from other sources, including other defendants and 524(g) trusts.
As a result, with respect to both asserted and unasserted claims, it is reasonably possible that we may incur amaterial amount of cost in excess of the current reserve; however, such amounts cannot be reasonably estimated.Coverage under insurance policies is subject to varying characteristics of asbestos claims including, but notlimited to, the type of claim (premise vs. product exposure), alleged date of first exposure to our products orpremises and disease alleged. Recoveries may also be limited by insurer insolvencies or financial difficulties.Depending upon the nature of these characteristics or events, as well as the resolution of certain legal issues,some portion of the insurance may not be accessible by us.
Amiens Labor Claims
Approximately 850 former employees of the closed Amiens, France manufacturing facility have assertedwrongful termination or other claims totaling €140 million ($157 million) against Goodyear France SAS(formerly known as Goodyear Dunlop Tires France). We intend to vigorously defend ourselves against these
90
THE GOODYEAR TIRE & RUBBER COMPANY AND SUBSIDIARIES
claims, and any additional claims that may be asserted against us, and cannot estimate the amounts, if any, thatwe may ultimately pay in respect of such claims.
Other Actions
We are currently a party to various claims, indirect tax assessments and legal proceedings in addition to thosenoted above. If management believes that a loss arising from these matters is probable and can reasonably beestimated, we record the amount of the loss, or the minimum estimated liability when the loss is estimated usinga range and no point within the range is more probable than another. As additional information becomesavailable, any potential liability related to these matters is assessed and the estimates are revised, if necessary.Based on currently available information, management believes that the ultimate outcome of these matters,individually and in the aggregate, will not have a material adverse effect on our financial position or overalltrends in results of operations.
Our recorded liabilities and estimates of reasonably possible losses for the contingent liabilities described aboveare based on our assessment of potential liability using the information available to us at the time and, whereapplicable, any past experience and recent and current trends with respect to similar matters. Our contingentliabilities are subject to inherent uncertainties, and unfavorable judicial or administrative decisions could occurwhich we did not anticipate. Such an unfavorable decision could include monetary damages, fines or otherpenalties or an injunction prohibiting us from taking certain actions or selling certain products. If such anunfavorable decision were to occur, it could result in a material adverse impact on our financial position andresults of operations in the period in which the decision occurs or in future periods.
Income Tax Matters
The calculation of our tax liabilities involves dealing with uncertainties in the application of complex taxregulations. We recognize liabilities for anticipated tax audit issues based on our estimate of whether, and theextent to which, additional taxes will be due. If we ultimately determine that payment of these amounts isunnecessary, we reverse the liability and recognize a tax benefit during the period in which we determine that theliability is no longer necessary. We also recognize income tax benefits to the extent that it is more likely than notthat our positions will be sustained when challenged by the taxing authorities. We derecognize income taxbenefits when based on new information we determine that it is no longer more likely than not that our positionwill be sustained. To the extent we prevail in matters for which liabilities have been established, or determine weneed to derecognize tax benefits recorded in prior periods, our results of operations and effective tax rate in agiven period could be materially affected. An unfavorable tax settlement would require use of our cash, and leadto recognition of expense to the extent the settlement amount exceeds recorded liabilities and, in the case of anincome tax settlement, result in an increase in our effective tax rate in the period of resolution. A favorable taxsettlement would be recognized as a reduction of expense to the extent the settlement amount is lower thanrecorded liabilities and, in the case of an income tax settlement, would result in a reduction in our effective taxrate in the period of resolution.
While the Company applies consistent transfer pricing policies and practices globally, supports transfer pricesthrough economic studies, seeks advance pricing agreements and joint audits to the extent possible and believesits transfer prices to be appropriate, such transfer prices, and related interpretations of tax laws, are occasionallychallenged by various taxing authorities globally. We have received various tax assessments challenging ourinterpretations of applicable tax laws in various jurisdictions. Although we believe we have complied withapplicable tax laws, have strong positions and defenses and have historically been successful in defending suchclaims, our results of operations could be materially adversely affected in the case we are unsuccessful in thedefense of existing or future claims.
Binding Commitments and Guarantees
At December 31, 2019, we had binding commitments for raw materials, capital expenditures, utilities and variousother types of contracts. Total commitments on contracts that extend beyond 2020 are expected to total
91
THE GOODYEAR TIRE & RUBBER COMPANY AND SUBSIDIARIES
approximately $1,600 million. In addition, we have other contractual commitments, the amounts of which cannotbe estimated, pursuant to certain long term agreements under which we will purchase varying amounts of certainraw materials and finished goods at agreed upon base prices that may be subject to periodic adjustments forchanges in raw material costs and market price adjustments, or in quantities that may be subject to periodicadjustments for changes in our or our suppliers’ production levels.
We have off-balance sheet financial guarantees and other commitments totaling approximately $74 million and$73 million at December 31, 2019 and 2018, respectively. We issue guarantees to financial institutions or otherentities on behalf of certain of our affiliates, lessors or customers. We generally do not receive a separatepremium as consideration for, and do not require collateral in connection with, the issuance of these guarantees.
In 2017, we issued a guarantee of approximately PLN 165 million ($47 million) in connection with an indirecttax assessment in EMEA. As of December 31, 2019, this guarantee amount has been increased to PLN181 million ($48 million). We have concluded our performance under this guarantee is not probable and,therefore, have not recorded a liability for this guarantee. In 2015, as a result of the dissolution of the globalalliance with SRI, we issued a guarantee of approximately $46 million to an insurance company related to SRI’sobligation to pay certain outstanding workers’ compensation claims of a formerly consolidated joint ventureentity. As of December 31, 2019, this guarantee amount has been reduced to $26 million. We have concluded theprobability of our performance to be remote and, therefore, have not recorded a liability for this guarantee. Whilethere is no fixed duration of this guarantee, we expect the amount of this guarantee to continue to decrease overtime as the formerly consolidated joint venture entity pays its outstanding claims. If our performance under theseguarantees is triggered by non-payment or another specified event, we would be obligated to make payment tothe financial institution or the other entity, and would typically have recourse to the affiliate, lessor, customer, orSRI. Except for the workers’ compensation guarantee described above, the guarantees expire at various timesthrough 2021. We are unable to estimate the extent to which our affiliates’, lessors’, customers’, or SRI’s assetswould be adequate to recover any payments made by us under the related guarantees.
At December 31, 2019, we had an agreement to provide a revolving loan commitment to TireHub of $50 million.No amounts were drawn on that commitment as of December 31, 2019.
Indemnifications
At December 31, 2019, we were a party to various agreements under which we had assumed obligations to indemnifythe counterparties from certain potential claims and losses. These agreements typically involve standard commercialactivities undertaken by us in the normal course of business; the sale of assets by us; the formation or dissolution ofjoint venture businesses to which we had contributed assets in exchange for ownership interests; and other financialtransactions. Indemnifications provided by us pursuant to these agreements relate to various matters including, amongother things, environmental, tax and shareholder matters; intellectual property rights; government regulations;employment-related matters; and dealer, supplier and other commercial matters.
Certain indemnifications expire from time to time, and certain other indemnifications are not subject to anexpiration date. In addition, our potential liability under certain indemnifications is subject to maximum caps,while other indemnifications are not subject to caps. Although we have been subject to indemnification claims inthe past, we cannot reasonably estimate the number, type and size of indemnification claims that may arise in thefuture. Due to these and other uncertainties associated with the indemnifications, our maximum exposure to lossunder these agreements cannot be estimated.
We have determined that there are no indemnifications or guarantees other than liabilities for which amounts arealready recorded or reserved in our consolidated financial statements under which it is probable that we haveincurred a liability.
Warranty
We recorded $22 million and $18 million for potential claims under warranties offered by us at December 31,2019 and 2018, respectively, the majority of which are recorded in Other Current Liabilities.
92
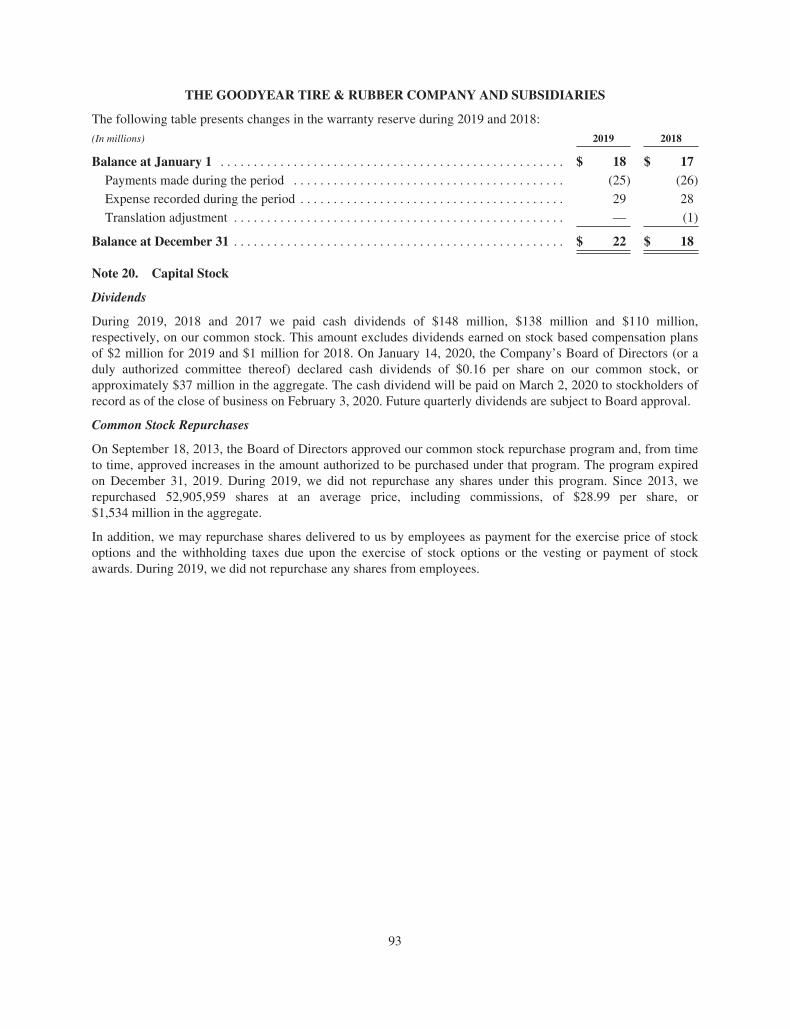
THE GOODYEAR TIRE & RUBBER COMPANY AND SUBSIDIARIES
The following table presents changes in the warranty reserve during 2019 and 2018:
(In millions) 2019 2018
Balance at January 1 . . . . . . . . . . . . . . . . . . . . . . . . . . . . . . . . . . . . . . . . . . . . . . . . . . . . $ 18 $ 17Payments made during the period . . . . . . . . . . . . . . . . . . . . . . . . . . . . . . . . . . . . . . . . . (25) (26)
Expense recorded during the period . . . . . . . . . . . . . . . . . . . . . . . . . . . . . . . . . . . . . . . . 29 28
Translation adjustment . . . . . . . . . . . . . . . . . . . . . . . . . . . . . . . . . . . . . . . . . . . . . . . . . . — (1)
Balance at December 31 . . . . . . . . . . . . . . . . . . . . . . . . . . . . . . . . . . . . . . . . . . . . . . . . . . $ 22 $ 18
Note 20. Capital Stock
Dividends
During 2019, 2018 and 2017 we paid cash dividends of $148 million, $138 million and $110 million,respectively, on our common stock. This amount excludes dividends earned on stock based compensation plansof $2 million for 2019 and $1 million for 2018. On January 14, 2020, the Company’s Board of Directors (or aduly authorized committee thereof) declared cash dividends of $0.16 per share on our common stock, orapproximately $37 million in the aggregate. The cash dividend will be paid on March 2, 2020 to stockholders ofrecord as of the close of business on February 3, 2020. Future quarterly dividends are subject to Board approval.
Common Stock Repurchases
On September 18, 2013, the Board of Directors approved our common stock repurchase program and, from timeto time, approved increases in the amount authorized to be purchased under that program. The program expiredon December 31, 2019. During 2019, we did not repurchase any shares under this program. Since 2013, werepurchased 52,905,959 shares at an average price, including commissions, of $28.99 per share, or$1,534 million in the aggregate.
In addition, we may repurchase shares delivered to us by employees as payment for the exercise price of stockoptions and the withholding taxes due upon the exercise of stock options or the vesting or payment of stockawards. During 2019, we did not repurchase any shares from employees.
93
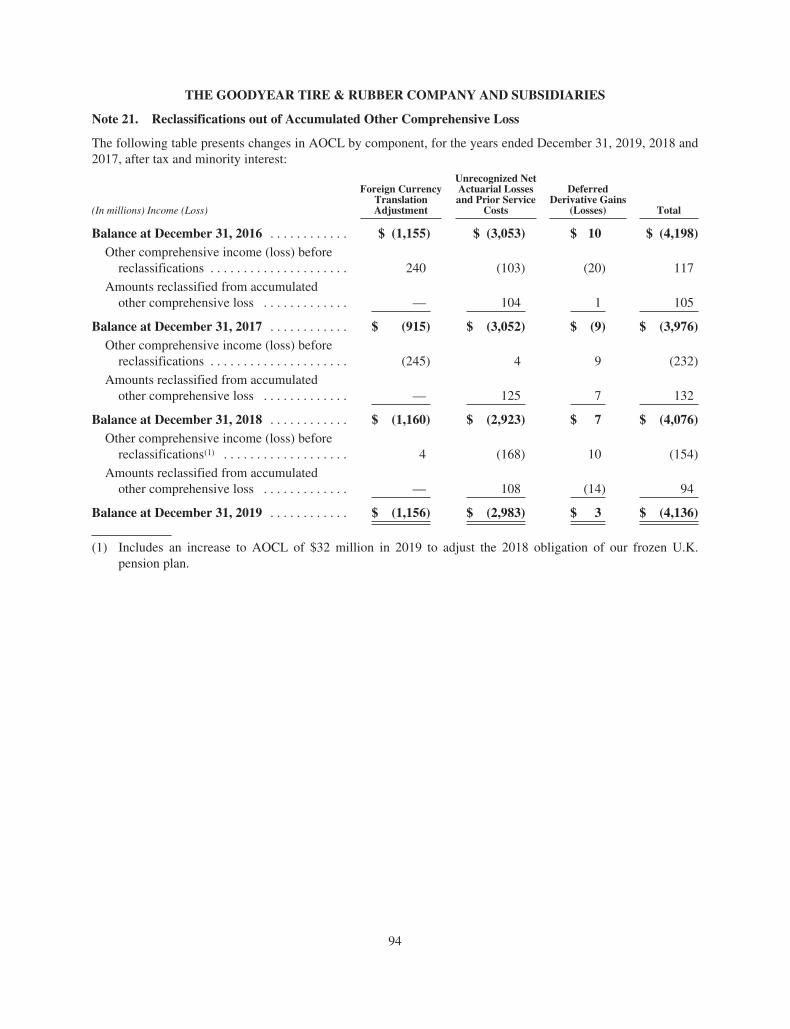
THE GOODYEAR TIRE & RUBBER COMPANY AND SUBSIDIARIES
Note 21. Reclassifications out of Accumulated Other Comprehensive Loss
The following table presents changes in AOCL by component, for the years ended December 31, 2019, 2018 and2017, after tax and minority interest:
(In millions) Income (Loss)
Foreign CurrencyTranslationAdjustment
Unrecognized NetActuarial Lossesand Prior Service
Costs
DeferredDerivative Gains
(Losses) Total
Balance at December 31, 2016 . . . . . . . . . . . . $ (1,155) $ (3,053) $ 10 $ (4,198)Other comprehensive income (loss) before
reclassifications . . . . . . . . . . . . . . . . . . . . . 240 (103) (20) 117
Amounts reclassified from accumulatedother comprehensive loss . . . . . . . . . . . . . — 104 1 105
Balance at December 31, 2017 . . . . . . . . . . . . $ (915) $ (3,052) $ (9) $ (3,976)Other comprehensive income (loss) before
reclassifications . . . . . . . . . . . . . . . . . . . . . (245) 4 9 (232)
Amounts reclassified from accumulatedother comprehensive loss . . . . . . . . . . . . . — 125 7 132
Balance at December 31, 2018 . . . . . . . . . . . . $ (1,160) $ (2,923) $ 7 $ (4,076)Other comprehensive income (loss) before
reclassifications(1) . . . . . . . . . . . . . . . . . . . 4 (168) 10 (154)
Amounts reclassified from accumulatedother comprehensive loss . . . . . . . . . . . . . — 108 (14) 94
Balance at December 31, 2019 . . . . . . . . . . . . $ (1,156) $ (2,983) $ 3 $ (4,136)
(1) Includes an increase to AOCL of $32 million in 2019 to adjust the 2018 obligation of our frozen U.K.pension plan.
94
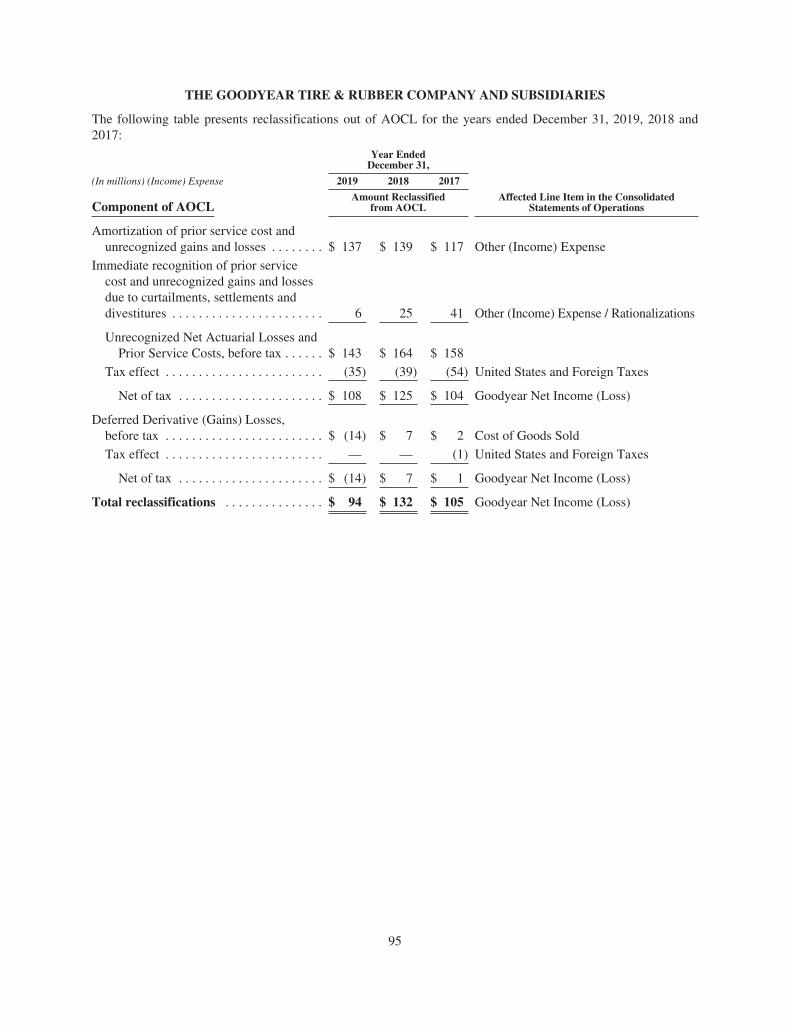
THE GOODYEAR TIRE & RUBBER COMPANY AND SUBSIDIARIES
The following table presents reclassifications out of AOCL for the years ended December 31, 2019, 2018 and2017:
Year EndedDecember 31,
(In millions) (Income) Expense 2019 2018 2017
Component of AOCLAmount Reclassified
from AOCLAffected Line Item in the Consolidated
Statements of Operations
Amortization of prior service cost andunrecognized gains and losses . . . . . . . . $ 137 $ 139 $ 117 Other (Income) Expense
Immediate recognition of prior servicecost and unrecognized gains and lossesdue to curtailments, settlements anddivestitures . . . . . . . . . . . . . . . . . . . . . . . 6 25 41 Other (Income) Expense / Rationalizations
Unrecognized Net Actuarial Losses andPrior Service Costs, before tax . . . . . . $ 143 $ 164 $ 158
Tax effect . . . . . . . . . . . . . . . . . . . . . . . . (35) (39) (54) United States and Foreign Taxes
Net of tax . . . . . . . . . . . . . . . . . . . . . . $ 108 $ 125 $ 104 Goodyear Net Income (Loss)
Deferred Derivative (Gains) Losses,before tax . . . . . . . . . . . . . . . . . . . . . . . . $ (14) $ 7 $ 2 Cost of Goods Sold
Tax effect . . . . . . . . . . . . . . . . . . . . . . . . — — (1) United States and Foreign Taxes
Net of tax . . . . . . . . . . . . . . . . . . . . . . $ (14) $ 7 $ 1 Goodyear Net Income (Loss)
Total reclassifications . . . . . . . . . . . . . . . $ 94 $ 132 $ 105 Goodyear Net Income (Loss)
95
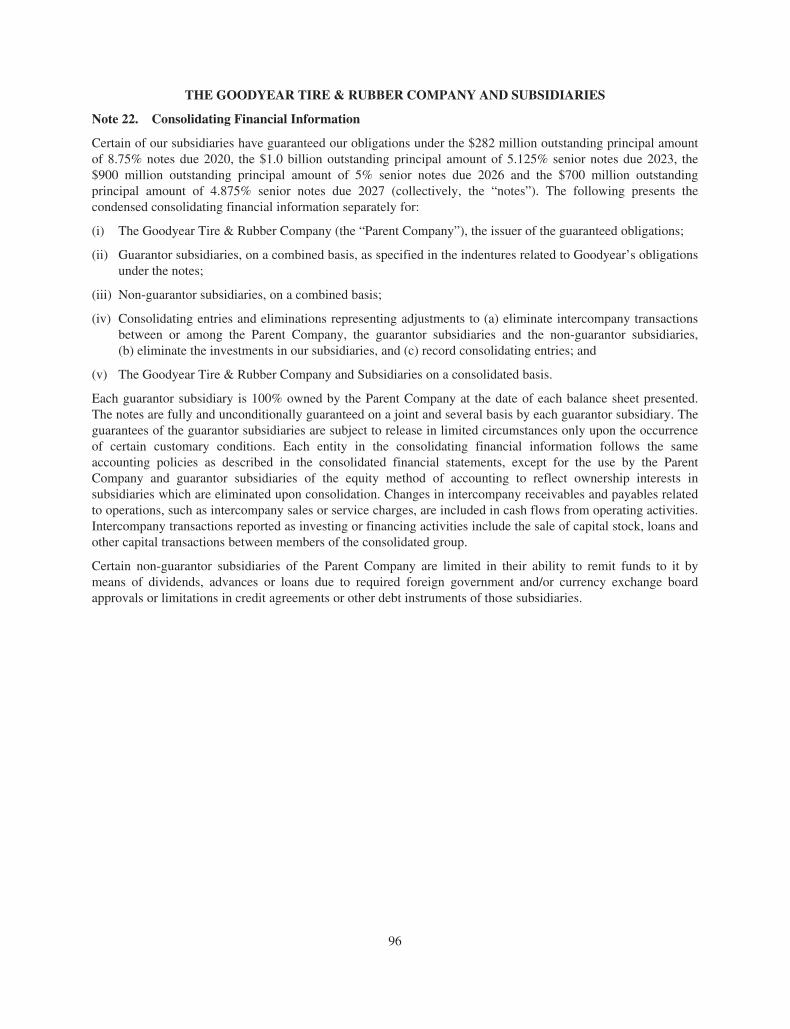
THE GOODYEAR TIRE & RUBBER COMPANY AND SUBSIDIARIES
Note 22. Consolidating Financial Information
Certain of our subsidiaries have guaranteed our obligations under the $282 million outstanding principal amountof 8.75% notes due 2020, the $1.0 billion outstanding principal amount of 5.125% senior notes due 2023, the$900 million outstanding principal amount of 5% senior notes due 2026 and the $700 million outstandingprincipal amount of 4.875% senior notes due 2027 (collectively, the “notes”). The following presents thecondensed consolidating financial information separately for:
(i) The Goodyear Tire & Rubber Company (the “Parent Company”), the issuer of the guaranteed obligations;
(ii) Guarantor subsidiaries, on a combined basis, as specified in the indentures related to Goodyear’s obligationsunder the notes;
(iii) Non-guarantor subsidiaries, on a combined basis;
(iv) Consolidating entries and eliminations representing adjustments to (a) eliminate intercompany transactionsbetween or among the Parent Company, the guarantor subsidiaries and the non-guarantor subsidiaries,(b) eliminate the investments in our subsidiaries, and (c) record consolidating entries; and
(v) The Goodyear Tire & Rubber Company and Subsidiaries on a consolidated basis.
Each guarantor subsidiary is 100% owned by the Parent Company at the date of each balance sheet presented.The notes are fully and unconditionally guaranteed on a joint and several basis by each guarantor subsidiary. Theguarantees of the guarantor subsidiaries are subject to release in limited circumstances only upon the occurrenceof certain customary conditions. Each entity in the consolidating financial information follows the sameaccounting policies as described in the consolidated financial statements, except for the use by the ParentCompany and guarantor subsidiaries of the equity method of accounting to reflect ownership interests insubsidiaries which are eliminated upon consolidation. Changes in intercompany receivables and payables relatedto operations, such as intercompany sales or service charges, are included in cash flows from operating activities.Intercompany transactions reported as investing or financing activities include the sale of capital stock, loans andother capital transactions between members of the consolidated group.
Certain non-guarantor subsidiaries of the Parent Company are limited in their ability to remit funds to it bymeans of dividends, advances or loans due to required foreign government and/or currency exchange boardapprovals or limitations in credit agreements or other debt instruments of those subsidiaries.
96
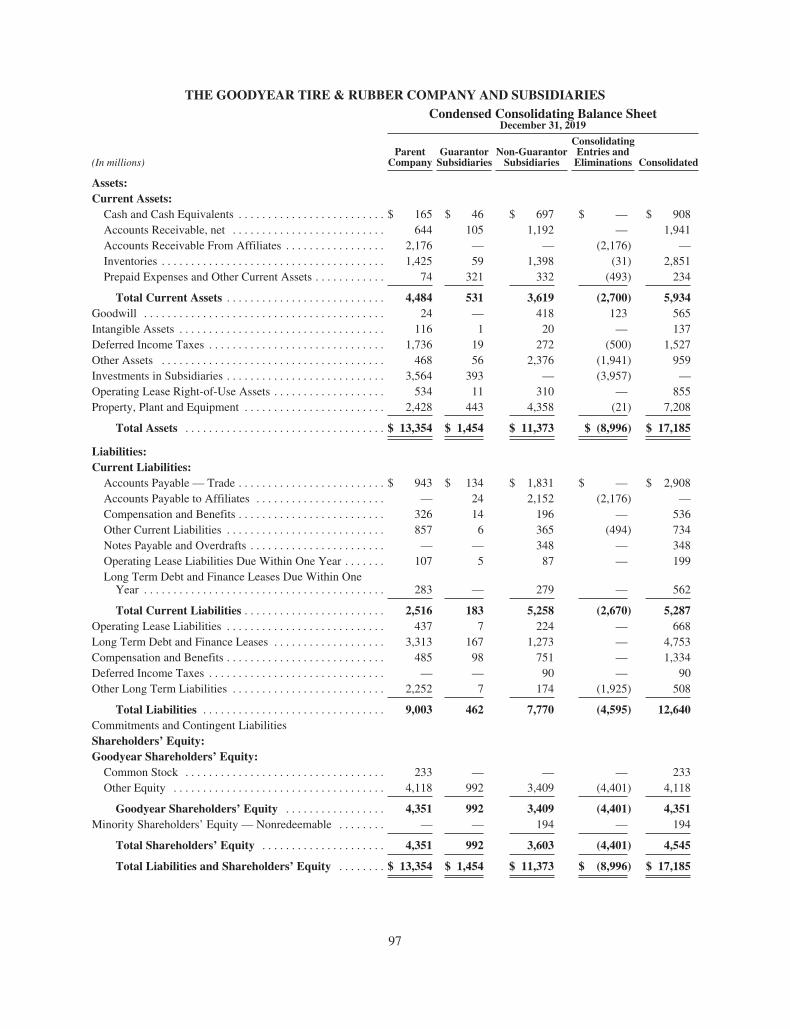
THE GOODYEAR TIRE & RUBBER COMPANY AND SUBSIDIARIESCondensed Consolidating Balance Sheet
December 31, 2019
(In millions)Parent
CompanyGuarantor
SubsidiariesNon-Guarantor
Subsidiaries
ConsolidatingEntries andEliminations Consolidated
Assets:Current Assets:
Cash and Cash Equivalents . . . . . . . . . . . . . . . . . . . . . . . . . $ 165 $ 46 $ 697 $ — $ 908Accounts Receivable, net . . . . . . . . . . . . . . . . . . . . . . . . . . 644 105 1,192 — 1,941Accounts Receivable From Affiliates . . . . . . . . . . . . . . . . . 2,176 — — (2,176) —Inventories . . . . . . . . . . . . . . . . . . . . . . . . . . . . . . . . . . . . . . 1,425 59 1,398 (31) 2,851Prepaid Expenses and Other Current Assets . . . . . . . . . . . . 74 321 332 (493) 234
Total Current Assets . . . . . . . . . . . . . . . . . . . . . . . . . . . 4,484 531 3,619 (2,700) 5,934Goodwill . . . . . . . . . . . . . . . . . . . . . . . . . . . . . . . . . . . . . . . . . 24 — 418 123 565Intangible Assets . . . . . . . . . . . . . . . . . . . . . . . . . . . . . . . . . . . 116 1 20 — 137Deferred Income Taxes . . . . . . . . . . . . . . . . . . . . . . . . . . . . . . 1,736 19 272 (500) 1,527Other Assets . . . . . . . . . . . . . . . . . . . . . . . . . . . . . . . . . . . . . . 468 56 2,376 (1,941) 959Investments in Subsidiaries . . . . . . . . . . . . . . . . . . . . . . . . . . . 3,564 393 — (3,957) —Operating Lease Right-of-Use Assets . . . . . . . . . . . . . . . . . . . 534 11 310 — 855Property, Plant and Equipment . . . . . . . . . . . . . . . . . . . . . . . . 2,428 443 4,358 (21) 7,208
Total Assets . . . . . . . . . . . . . . . . . . . . . . . . . . . . . . . . . . $ 13,354 $ 1,454 $ 11,373 $ (8,996) $ 17,185
Liabilities:Current Liabilities:
Accounts Payable — Trade . . . . . . . . . . . . . . . . . . . . . . . . . $ 943 $ 134 $ 1,831 $ — $ 2,908Accounts Payable to Affiliates . . . . . . . . . . . . . . . . . . . . . . — 24 2,152 (2,176) —Compensation and Benefits . . . . . . . . . . . . . . . . . . . . . . . . . 326 14 196 — 536Other Current Liabilities . . . . . . . . . . . . . . . . . . . . . . . . . . . 857 6 365 (494) 734Notes Payable and Overdrafts . . . . . . . . . . . . . . . . . . . . . . . — — 348 — 348Operating Lease Liabilities Due Within One Year . . . . . . . 107 5 87 — 199Long Term Debt and Finance Leases Due Within One
Year . . . . . . . . . . . . . . . . . . . . . . . . . . . . . . . . . . . . . . . . . 283 — 279 — 562
Total Current Liabilities . . . . . . . . . . . . . . . . . . . . . . . . 2,516 183 5,258 (2,670) 5,287Operating Lease Liabilities . . . . . . . . . . . . . . . . . . . . . . . . . . . 437 7 224 — 668Long Term Debt and Finance Leases . . . . . . . . . . . . . . . . . . . 3,313 167 1,273 — 4,753Compensation and Benefits . . . . . . . . . . . . . . . . . . . . . . . . . . . 485 98 751 — 1,334Deferred Income Taxes . . . . . . . . . . . . . . . . . . . . . . . . . . . . . . — — 90 — 90Other Long Term Liabilities . . . . . . . . . . . . . . . . . . . . . . . . . . 2,252 7 174 (1,925) 508
Total Liabilities . . . . . . . . . . . . . . . . . . . . . . . . . . . . . . . 9,003 462 7,770 (4,595) 12,640Commitments and Contingent LiabilitiesShareholders’ Equity:Goodyear Shareholders’ Equity:
Common Stock . . . . . . . . . . . . . . . . . . . . . . . . . . . . . . . . . . 233 — — — 233Other Equity . . . . . . . . . . . . . . . . . . . . . . . . . . . . . . . . . . . . 4,118 992 3,409 (4,401) 4,118
Goodyear Shareholders’ Equity . . . . . . . . . . . . . . . . . 4,351 992 3,409 (4,401) 4,351Minority Shareholders’ Equity — Nonredeemable . . . . . . . . — — 194 — 194
Total Shareholders’ Equity . . . . . . . . . . . . . . . . . . . . . 4,351 992 3,603 (4,401) 4,545
Total Liabilities and Shareholders’ Equity . . . . . . . . $ 13,354 $ 1,454 $ 11,373 $ (8,996) $ 17,185
97
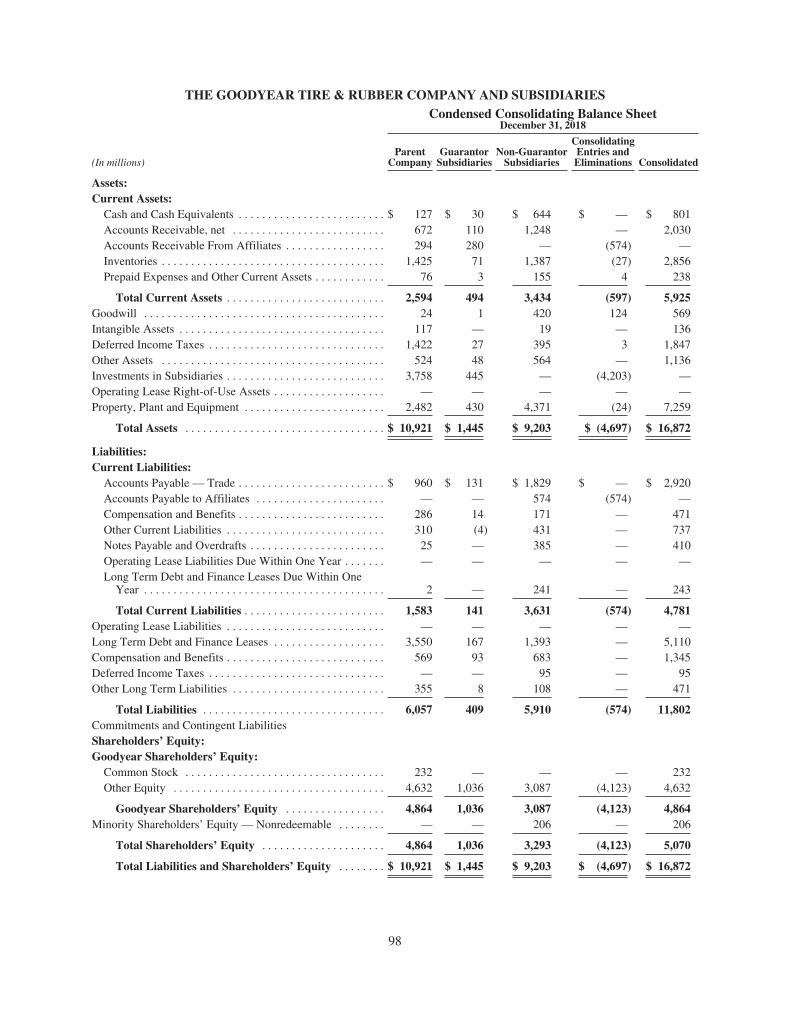
THE GOODYEAR TIRE & RUBBER COMPANY AND SUBSIDIARIESCondensed Consolidating Balance Sheet
December 31, 2018
(In millions)Parent
CompanyGuarantor
SubsidiariesNon-Guarantor
Subsidiaries
ConsolidatingEntries andEliminations Consolidated
Assets:Current Assets:
Cash and Cash Equivalents . . . . . . . . . . . . . . . . . . . . . . . . . $ 127 $ 30 $ 644 $ — $ 801Accounts Receivable, net . . . . . . . . . . . . . . . . . . . . . . . . . . 672 110 1,248 — 2,030Accounts Receivable From Affiliates . . . . . . . . . . . . . . . . . 294 280 — (574) —Inventories . . . . . . . . . . . . . . . . . . . . . . . . . . . . . . . . . . . . . . 1,425 71 1,387 (27) 2,856Prepaid Expenses and Other Current Assets . . . . . . . . . . . . 76 3 155 4 238
Total Current Assets . . . . . . . . . . . . . . . . . . . . . . . . . . . 2,594 494 3,434 (597) 5,925Goodwill . . . . . . . . . . . . . . . . . . . . . . . . . . . . . . . . . . . . . . . . . 24 1 420 124 569Intangible Assets . . . . . . . . . . . . . . . . . . . . . . . . . . . . . . . . . . . 117 — 19 — 136Deferred Income Taxes . . . . . . . . . . . . . . . . . . . . . . . . . . . . . . 1,422 27 395 3 1,847Other Assets . . . . . . . . . . . . . . . . . . . . . . . . . . . . . . . . . . . . . . 524 48 564 — 1,136Investments in Subsidiaries . . . . . . . . . . . . . . . . . . . . . . . . . . . 3,758 445 — (4,203) —Operating Lease Right-of-Use Assets . . . . . . . . . . . . . . . . . . . — — — — —Property, Plant and Equipment . . . . . . . . . . . . . . . . . . . . . . . . 2,482 430 4,371 (24) 7,259
Total Assets . . . . . . . . . . . . . . . . . . . . . . . . . . . . . . . . . . $ 10,921 $ 1,445 $ 9,203 $ (4,697) $ 16,872
Liabilities:Current Liabilities:
Accounts Payable — Trade . . . . . . . . . . . . . . . . . . . . . . . . . $ 960 $ 131 $ 1,829 $ — $ 2,920Accounts Payable to Affiliates . . . . . . . . . . . . . . . . . . . . . . — — 574 (574) —Compensation and Benefits . . . . . . . . . . . . . . . . . . . . . . . . . 286 14 171 — 471Other Current Liabilities . . . . . . . . . . . . . . . . . . . . . . . . . . . 310 (4) 431 — 737Notes Payable and Overdrafts . . . . . . . . . . . . . . . . . . . . . . . 25 — 385 — 410Operating Lease Liabilities Due Within One Year . . . . . . . — — — — —Long Term Debt and Finance Leases Due Within One
Year . . . . . . . . . . . . . . . . . . . . . . . . . . . . . . . . . . . . . . . . . 2 — 241 — 243
Total Current Liabilities . . . . . . . . . . . . . . . . . . . . . . . . 1,583 141 3,631 (574) 4,781Operating Lease Liabilities . . . . . . . . . . . . . . . . . . . . . . . . . . . — — — — —Long Term Debt and Finance Leases . . . . . . . . . . . . . . . . . . . 3,550 167 1,393 — 5,110Compensation and Benefits . . . . . . . . . . . . . . . . . . . . . . . . . . . 569 93 683 — 1,345Deferred Income Taxes . . . . . . . . . . . . . . . . . . . . . . . . . . . . . . — — 95 — 95Other Long Term Liabilities . . . . . . . . . . . . . . . . . . . . . . . . . . 355 8 108 — 471
Total Liabilities . . . . . . . . . . . . . . . . . . . . . . . . . . . . . . . 6,057 409 5,910 (574) 11,802Commitments and Contingent LiabilitiesShareholders’ Equity:Goodyear Shareholders’ Equity:
Common Stock . . . . . . . . . . . . . . . . . . . . . . . . . . . . . . . . . . 232 — — — 232Other Equity . . . . . . . . . . . . . . . . . . . . . . . . . . . . . . . . . . . . 4,632 1,036 3,087 (4,123) 4,632
Goodyear Shareholders’ Equity . . . . . . . . . . . . . . . . . 4,864 1,036 3,087 (4,123) 4,864Minority Shareholders’ Equity — Nonredeemable . . . . . . . . — — 206 — 206
Total Shareholders’ Equity . . . . . . . . . . . . . . . . . . . . . 4,864 1,036 3,293 (4,123) 5,070
Total Liabilities and Shareholders’ Equity . . . . . . . . $ 10,921 $ 1,445 $ 9,203 $ (4,697) $ 16,872
98
THE GOODYEAR TIRE & RUBBER COMPANY AND SUBSIDIARIESConsolidating Statements of Operations
Year Ended December 31, 2019
(In millions)Parent
CompanyGuarantor
SubsidiariesNon-Guarantor
Subsidiaries
ConsolidatingEntries andEliminations Consolidated
Net Sales . . . . . . . . . . . . . . . . . . . . . . . . . . . . . . . . . . . . $ 7,165 $ 1,403 $ 9,178 $ (3,001) $ 14,745
Cost of Goods Sold . . . . . . . . . . . . . . . . . . . . . . . . . . . . 5,765 1,303 7,565 (3,031) 11,602
Selling, Administrative and General Expense . . . . . . . 1,101 34 1,189 (1) 2,323
Rationalizations . . . . . . . . . . . . . . . . . . . . . . . . . . . . . . 86 — 119 — 205
Interest Expense . . . . . . . . . . . . . . . . . . . . . . . . . . . . . . 222 28 129 (39) 340
Other (Income) Expense . . . . . . . . . . . . . . . . . . . . . . . . 29 15 (18) 72 98
Income (Loss) before Income Taxes and Equity inEarnings of Subsidiaries . . . . . . . . . . . . . . . . . . . . . . (38) 23 194 (2) 177
United States and Foreign Taxes . . . . . . . . . . . . . . . . . (289) 6 254 503 474
Equity in Earnings of Subsidiaries . . . . . . . . . . . . . . . . (562) (28) — 590 —
Net Income (Loss) . . . . . . . . . . . . . . . . . . . . . . . . . . . . (311) (11) (60) 85 (297)
Less: Minority Shareholders’ Net Income (Loss) . . — — 14 — 14
Goodyear Net Income (Loss) . . . . . . . . . . . . . . . . . . . $ (311) $ (11) $ (74) $ 85 $ (311)
Comprehensive Income (Loss) . . . . . . . . . . . . . . . . . . $ (371) $ (43) $ (193) $ 251 $ (356)Less: Comprehensive Income (Loss) Attributable to
Minority Shareholders . . . . . . . . . . . . . . . . . . . . . — — 15 — 15
Goodyear Comprehensive Income (Loss) . . . . . . . . . $ (371) $ (43) $ (208) $ 251 $ (371)
99
THE GOODYEAR TIRE & RUBBER COMPANY AND SUBSIDIARIESConsolidating Statements of Operations
Year Ended December 31, 2018
(In millions)Parent
CompanyGuarantor
SubsidiariesNon-Guarantor
Subsidiaries
ConsolidatingEntries andEliminations Consolidated
Net Sales . . . . . . . . . . . . . . . . . . . . . . . . . . . . . . . . . . . . $ 7,382 $ 1,320 $ 9,567 $ (2,794) $ 15,475
Cost of Goods Sold . . . . . . . . . . . . . . . . . . . . . . . . . . . . 5,947 1,270 7,616 (2,872) 11,961
Selling, Administrative and General Expense . . . . . . . 1,042 35 1,235 — 2,312
Rationalizations . . . . . . . . . . . . . . . . . . . . . . . . . . . . . . 3 1 40 — 44
Interest Expense . . . . . . . . . . . . . . . . . . . . . . . . . . . . . . 221 23 105 (28) 321
Other (Income) Expense . . . . . . . . . . . . . . . . . . . . . . . . (320) 12 30 104 (174)
Income (Loss) before Income Taxes and Equity inEarnings of Subsidiaries . . . . . . . . . . . . . . . . . . . . . . 489 (21) 541 2 1,011
United States and Foreign Taxes . . . . . . . . . . . . . . . . . 129 (6) 179 1 303
Equity in Earnings of Subsidiaries . . . . . . . . . . . . . . . . 333 47 — (380) —
Net Income (Loss) . . . . . . . . . . . . . . . . . . . . . . . . . . . . 693 32 362 (379) 708
Less: Minority Shareholders’ Net Income (Loss) . . — — 15 — 15
Goodyear Net Income (Loss) . . . . . . . . . . . . . . . . . . . $ 693 $ 32 $ 347 $ (379) $ 693
Comprehensive Income (Loss) . . . . . . . . . . . . . . . . . . $ 593 $ 28 $ 143 $ (175) $ 589Less: Comprehensive Income (Loss) Attributable to
Minority Shareholders . . . . . . . . . . . . . . . . . . . . . — — (4) — (4)
Goodyear Comprehensive Income (Loss) . . . . . . . . . $ 593 $ 28 $ 147 $ (175) $ 593
100
THE GOODYEAR TIRE & RUBBER COMPANY AND SUBSIDIARIESConsolidating Statements of Operations
Year Ended December 31, 2017
(In millions)Parent
CompanyGuarantor
SubsidiariesNon-Guarantor
Subsidiaries
ConsolidatingEntries andEliminations Consolidated
Net Sales . . . . . . . . . . . . . . . . . . . . . . . . . . . . . . . . . . . . $ 7,378 $ 1,186 $ 9,499 $ (2,686) $ 15,377
Cost of Goods Sold . . . . . . . . . . . . . . . . . . . . . . . . . . . . 5,774 1,125 7,537 (2,756) 11,680
Selling, Administrative and General Expense . . . . . . . 980 34 1,265 — 2,279
Rationalizations . . . . . . . . . . . . . . . . . . . . . . . . . . . . . . 20 1 114 — 135
Interest Expense . . . . . . . . . . . . . . . . . . . . . . . . . . . . . . 254 10 122 (51) 335
Other (Income) Expense . . . . . . . . . . . . . . . . . . . . . . . . (60) 12 (12) 130 70
Income (Loss) before Income Taxes and Equity inEarnings of Subsidiaries . . . . . . . . . . . . . . . . . . . . . . 410 4 473 (9) 878
United States and Foreign Taxes . . . . . . . . . . . . . . . . . 417 (2) 101 (3) 513
Equity in Earnings of Subsidiaries . . . . . . . . . . . . . . . . 353 39 — (392) —
Net Income (Loss) . . . . . . . . . . . . . . . . . . . . . . . . . . . . 346 45 372 (398) 365
Less: Minority Shareholders’ Net Income (Loss) . . — — 19 — 19
Goodyear Net Income (Loss) . . . . . . . . . . . . . . . . . . . $ 346 $ 45 $ 353 $ (398) $ 346
Comprehensive Income (Loss) . . . . . . . . . . . . . . . . . . $ 568 $ 62 $ 656 $ (683) $ 603Less: Comprehensive Income (Loss) Attributable to
Minority Shareholders . . . . . . . . . . . . . . . . . . . . . — — 35 — 35
Goodyear Comprehensive Income (Loss) . . . . . . . . . $ 568 $ 62 $ 621 $ (683) $ 568
101
THE GOODYEAR TIRE & RUBBER COMPANY AND SUBSIDIARIESCondensed Consolidating Statement of Cash Flows
Year Ended December 31, 2019
(In millions)Parent
CompanyGuarantor
SubsidiariesNon-Guarantor
Subsidiaries
ConsolidatingEntries andEliminations Consolidated
Cash Flows from Operating Activities:Total Cash Flows from Operating
Activities . . . . . . . . . . . . . . . . . . . . . . . . . . . . $ 3,541 $ (273) $ 82 $ (2,143) $ 1,207Cash Flows from Investing Activities:
Capital Expenditures . . . . . . . . . . . . . . . . . . . . . . . (288) (40) (442) — (770)
Asset Dispositions . . . . . . . . . . . . . . . . . . . . . . . . . — — 12 — 12
Short Term Securities Acquired . . . . . . . . . . . . . . . — — (113) — (113)
Short Term Securities Redeemed . . . . . . . . . . . . . . — — 106 — 106
Capital Contributions and Loans Incurred . . . . . . . (3,286) — (320) 3,606 —
Capital Redemptions and Loans Paid . . . . . . . . . . . 269 — — (269) —
Notes Receivable . . . . . . . . . . . . . . . . . . . . . . . . . . (7) — — — (7)
Other Transactions . . . . . . . . . . . . . . . . . . . . . . . . . (18) — (2,110) 2,100 (28)
Total Cash Flows from InvestingActivities . . . . . . . . . . . . . . . . . . . . . . . . . . . . (3,330) (40) (2,867) 5,437 (800)
Cash Flows from Financing Activities:Short Term Debt and Overdrafts Incurred . . . . . . . 398 — 1,482 — 1,880
Short Term Debt and Overdrafts Paid . . . . . . . . . . (423) — (1,510) — (1,933)
Long Term Debt Incurred . . . . . . . . . . . . . . . . . . . . 2,981 — 2,961 — 5,942
Long Term Debt Paid . . . . . . . . . . . . . . . . . . . . . . . (2,983) — (3,025) — (6,008)
Common Stock Issued . . . . . . . . . . . . . . . . . . . . . . 1 — — — 1
Common Stock Repurchased . . . . . . . . . . . . . . . . . — — — — —
Common Stock Dividends Paid . . . . . . . . . . . . . . . (148) — — — (148)
Capital Contributions and Loans Incurred . . . . . . . — 388 3,218 (3,606) —
Capital Redemptions and Loans Paid . . . . . . . . . . . — (57) (212) 269 —
Intercompany Dividends Paid . . . . . . . . . . . . . . . . — (3) (40) 43 —
Transactions with Minority Interests inSubsidiaries . . . . . . . . . . . . . . . . . . . . . . . . . . . . . — — (26) — (26)
Debt Related Costs and Other Transactions . . . . . . (1) — (14) — (15)
Total Cash Flows from FinancingActivities . . . . . . . . . . . . . . . . . . . . . . . . . . . . (175) 328 2,834 (3,294) (307)
Effect of Exchange Rate Changes on Cash, CashEquivalents and Restricted Cash . . . . . . . . . . . . . . — 1 — — 1
Net Change in Cash, Cash Equivalents andRestricted Cash . . . . . . . . . . . . . . . . . . . . . . . . . . . 36 16 49 — 101
Cash, Cash Equivalents and Restricted Cash atBeginning of the Year . . . . . . . . . . . . . . . . . . . . . . 168 30 675 — 873
Cash, Cash Equivalents and Restricted Cash atEnd of the Year . . . . . . . . . . . . . . . . . . . . . . . . . . . $ 204 $ 46 $ 724 $ — $ 974
102

THE GOODYEAR TIRE & RUBBER COMPANY AND SUBSIDIARIESCondensed Consolidating Statement of Cash Flows
Year Ended December 31, 2018
(In millions)Parent
CompanyGuarantor
SubsidiariesNon-Guarantor
Subsidiaries
ConsolidatingEntries andEliminations Consolidated
Cash Flows from Operating Activities:Total Cash Flows from Operating
Activities . . . . . . . . . . . . . . . . . . . . . . . . . . . . $ 1,771 $ 32 $ (279) $ (608) $ 916Cash Flows from Investing Activities:
Capital Expenditures . . . . . . . . . . . . . . . . . . . . . . . (307) (61) (443) — (811)
Asset Dispositions . . . . . . . . . . . . . . . . . . . . . . . . . — 2 — — 2
Short Term Securities Acquired . . . . . . . . . . . . . . . — — (68) — (68)
Short Term Securities Redeemed . . . . . . . . . . . . . . — — 68 — 68
Capital Contributions and Loans Incurred . . . . . . . (1,205) — (283) 1,488 —
Capital Redemptions and Loans Paid . . . . . . . . . . . 282 88 430 (800) —
Notes Receivable . . . . . . . . . . . . . . . . . . . . . . . . . . (55) — — — (55)
Other Transactions . . . . . . . . . . . . . . . . . . . . . . . . . 1 — (4) — (3)
Total Cash Flows from InvestingActivities . . . . . . . . . . . . . . . . . . . . . . . . . . . . (1,284) 29 (300) 688 (867)
Cash Flows from Financing Activities:Short Term Debt and Overdrafts Incurred . . . . . . . 965 — 979 — 1,944
Short Term Debt and Overdrafts Paid . . . . . . . . . . (940) — (855) — (1,795)
Long Term Debt Incurred . . . . . . . . . . . . . . . . . . . . 3,200 15 3,240 — 6,455
Long Term Debt Paid . . . . . . . . . . . . . . . . . . . . . . . (3,260) — (3,209) — (6,469)
Common Stock Issued . . . . . . . . . . . . . . . . . . . . . . 4 — — — 4
Common Stock Repurchased . . . . . . . . . . . . . . . . . (220) — — — (220)
Common Stock Dividends Paid . . . . . . . . . . . . . . . (138) — — — (138)
Capital Contributions and Loans Incurred . . . . . . . 283 67 1,138 (1,488) —
Capital Redemptions and Loans Paid . . . . . . . . . . . (430) (77) (293) 800 —
Intercompany Dividends Paid . . . . . . . . . . . . . . . . — (65) (543) 608 —
Transactions with Minority Interests inSubsidiaries . . . . . . . . . . . . . . . . . . . . . . . . . . . . . — — (31) — (31)
Debt Related Costs and Other Transactions . . . . . . 16 — (9) — 7
Total Cash Flows from FinancingActivities . . . . . . . . . . . . . . . . . . . . . . . . . . . . (520) (60) 417 (80) (243)
Effect of Exchange Rate Changes on Cash, CashEquivalents and Restricted Cash . . . . . . . . . . . . . . — (3) (40) — (43)
Net Change in Cash, Cash Equivalents andRestricted Cash . . . . . . . . . . . . . . . . . . . . . . . . . . . (33) (2) (202) — (237)
Cash, Cash Equivalents and Restricted Cash atBeginning of the Year . . . . . . . . . . . . . . . . . . . . . . 201 32 877 — 1,110
Cash, Cash Equivalents and Restricted Cash atEnd of the Year . . . . . . . . . . . . . . . . . . . . . . . . . . . $ 168 $ 30 $ 675 $ — $ 873
103
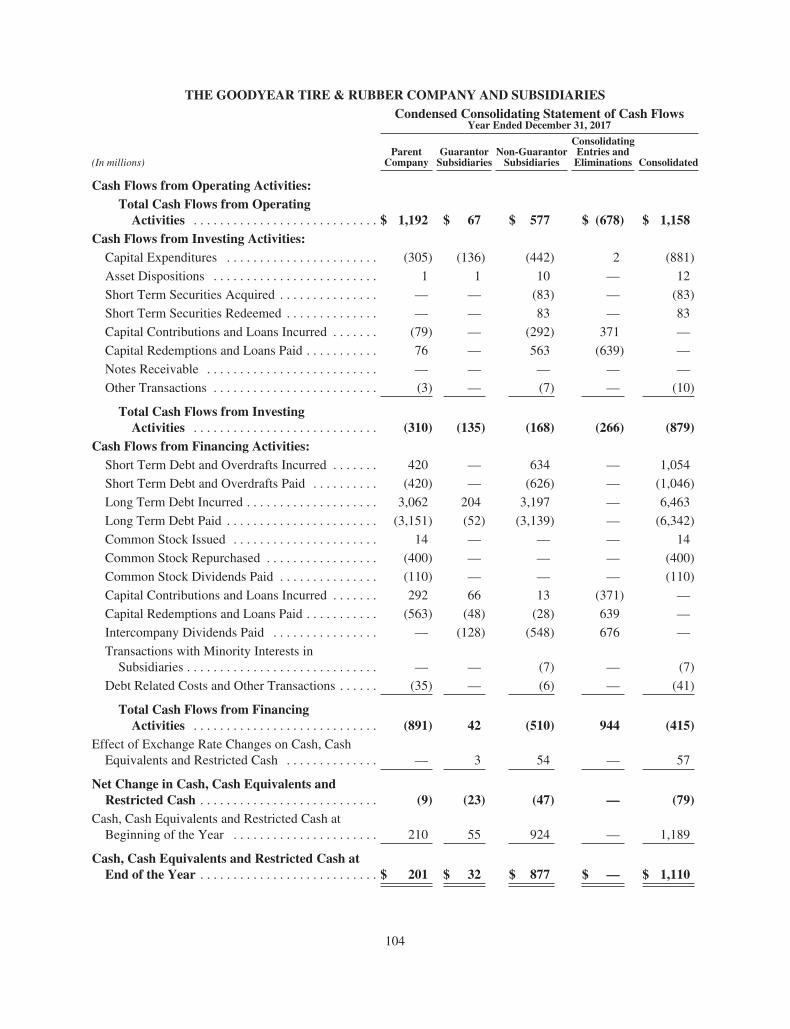
THE GOODYEAR TIRE & RUBBER COMPANY AND SUBSIDIARIESCondensed Consolidating Statement of Cash Flows
Year Ended December 31, 2017
(In millions)Parent
CompanyGuarantor
SubsidiariesNon-Guarantor
Subsidiaries
ConsolidatingEntries andEliminations Consolidated
Cash Flows from Operating Activities:Total Cash Flows from Operating
Activities . . . . . . . . . . . . . . . . . . . . . . . . . . . . $ 1,192 $ 67 $ 577 $ (678) $ 1,158Cash Flows from Investing Activities:
Capital Expenditures . . . . . . . . . . . . . . . . . . . . . . . (305) (136) (442) 2 (881)
Asset Dispositions . . . . . . . . . . . . . . . . . . . . . . . . . 1 1 10 — 12
Short Term Securities Acquired . . . . . . . . . . . . . . . — — (83) — (83)
Short Term Securities Redeemed . . . . . . . . . . . . . . — — 83 — 83
Capital Contributions and Loans Incurred . . . . . . . (79) — (292) 371 —
Capital Redemptions and Loans Paid . . . . . . . . . . . 76 — 563 (639) —
Notes Receivable . . . . . . . . . . . . . . . . . . . . . . . . . . — — — — —
Other Transactions . . . . . . . . . . . . . . . . . . . . . . . . . (3) — (7) — (10)
Total Cash Flows from InvestingActivities . . . . . . . . . . . . . . . . . . . . . . . . . . . . (310) (135) (168) (266) (879)
Cash Flows from Financing Activities:Short Term Debt and Overdrafts Incurred . . . . . . . 420 — 634 — 1,054
Short Term Debt and Overdrafts Paid . . . . . . . . . . (420) — (626) — (1,046)
Long Term Debt Incurred . . . . . . . . . . . . . . . . . . . . 3,062 204 3,197 — 6,463
Long Term Debt Paid . . . . . . . . . . . . . . . . . . . . . . . (3,151) (52) (3,139) — (6,342)
Common Stock Issued . . . . . . . . . . . . . . . . . . . . . . 14 — — — 14
Common Stock Repurchased . . . . . . . . . . . . . . . . . (400) — — — (400)
Common Stock Dividends Paid . . . . . . . . . . . . . . . (110) — — — (110)
Capital Contributions and Loans Incurred . . . . . . . 292 66 13 (371) —
Capital Redemptions and Loans Paid . . . . . . . . . . . (563) (48) (28) 639 —
Intercompany Dividends Paid . . . . . . . . . . . . . . . . — (128) (548) 676 —
Transactions with Minority Interests inSubsidiaries . . . . . . . . . . . . . . . . . . . . . . . . . . . . . — — (7) — (7)
Debt Related Costs and Other Transactions . . . . . . (35) — (6) — (41)
Total Cash Flows from FinancingActivities . . . . . . . . . . . . . . . . . . . . . . . . . . . . (891) 42 (510) 944 (415)
Effect of Exchange Rate Changes on Cash, CashEquivalents and Restricted Cash . . . . . . . . . . . . . . — 3 54 — 57
Net Change in Cash, Cash Equivalents andRestricted Cash . . . . . . . . . . . . . . . . . . . . . . . . . . . (9) (23) (47) — (79)
Cash, Cash Equivalents and Restricted Cash atBeginning of the Year . . . . . . . . . . . . . . . . . . . . . . 210 55 924 — 1,189
Cash, Cash Equivalents and Restricted Cash atEnd of the Year . . . . . . . . . . . . . . . . . . . . . . . . . . . $ 201 $ 32 $ 877 $ — $ 1,110
104

MANAGEMENT’S REPORT ON INTERNAL CONTROL OVER FINANCIAL REPORTING
Management of the Company is responsible for establishing and maintaining adequate internal control overfinancial reporting as such term is defined under Rule 13a-15(f) promulgated under the Securities Exchange Actof 1934, as amended.
Internal control over financial reporting is a process designed to provide reasonable assurance regarding thereliability of financial reporting and the preparation of the Company’s consolidated financial statements forexternal purposes in accordance with generally accepted accounting principles.
Internal control over financial reporting includes those policies and procedures that (i) pertain to the maintenanceof records that, in reasonable detail, accurately and fairly reflect the transactions and dispositions of the assets ofthe Company; (ii) provide reasonable assurance that transactions are recorded as necessary to permit thepreparation of the consolidated financial statements in accordance with generally accepted accounting principles,and that receipts and expenditures of the Company are being made only in accordance with appropriateauthorizations of management and directors of the Company; and (iii) provide reasonable assurance regardingprevention or timely detection of unauthorized acquisition, use or disposition of the Company’s assets that couldhave a material effect on the consolidated financial statements.
Because of its inherent limitations, internal control over financial reporting may not prevent or detectmisstatements. Also, projections of any evaluation of effectiveness to future periods are subject to the risk thatcontrols may become inadequate because of changes in conditions, or that the degree of compliance with thepolicies or procedures may deteriorate.
Management conducted an assessment of the Company’s internal control over financial reporting as ofDecember 31, 2019 using the framework specified in Internal Control — Integrated Framework (2013),published by the Committee of Sponsoring Organizations of the Treadway Commission. Based on suchassessment, management has concluded that the Company’s internal control over financial reporting waseffective as of December 31, 2019.
The effectiveness of the Company’s internal control over financial reporting as of December 31, 2019 has beenaudited by PricewaterhouseCoopers LLP, an independent registered public accounting firm, as stated in theirreport which is presented in this Annual Report.
105
REPORT OF INDEPENDENT REGISTERED PUBLIC ACCOUNTING FIRM
To the Board of Directors and Shareholders of The Goodyear Tire & Rubber Company
Opinions on the Financial Statements and Internal Control over Financial Reporting
We have audited the consolidated financial statements, including the related notes and financial statementschedule, of The Goodyear Tire & Rubber Company and its subsidiaries (the “Company”) as listed in the indexappearing under Item 8 (collectively referred to as the “consolidated financial statements”). We also have auditedthe Company’s internal control over financial reporting as of December 31, 2019, based on criteria established inInternal Control—Integrated Framework (2013) issued by the Committee of Sponsoring Organizations of theTreadway Commission (COSO).
In our opinion, the consolidated financial statements referred to above present fairly, in all material respects, thefinancial position of the Company as of December 31, 2019 and 2018, and the results of its operations and itscash flows for each of the three years in the period ended December 31, 2019 in conformity with accountingprinciples generally accepted in the United States of America. Also in our opinion, the Company maintained, inall material respects, effective internal control over financial reporting as of December 31, 2019, based on criteriaestablished in Internal Control—Integrated Framework (2013) issued by the COSO.
Change in Accounting Principle
As discussed in Note 1 to the consolidated financial statements, the Company changed the manner in which itaccounts for leases as of January 1, 2019.
Basis for Opinions
The Company’s management is responsible for these consolidated financial statements, for maintaining effectiveinternal control over financial reporting, and for its assessment of the effectiveness of internal control overfinancial reporting, included in the accompanying Management’s Report on Internal Control over FinancialReporting. Our responsibility is to express opinions on the Company’s consolidated financial statements and onthe Company’s internal control over financial reporting based on our audits. We are a public accounting firmregistered with the Public Company Accounting Oversight Board (United States) (PCAOB) and are required tobe independent with respect to the Company in accordance with the U.S. federal securities laws and theapplicable rules and regulations of the Securities and Exchange Commission and the PCAOB.
We conducted our audits in accordance with the standards of the PCAOB. Those standards require that we planand perform the audits to obtain reasonable assurance about whether the consolidated financial statements arefree of material misstatement, whether due to error or fraud, and whether effective internal control over financialreporting was maintained in all material respects.
Our audits of the consolidated financial statements included performing procedures to assess the risks of materialmisstatement of the consolidated financial statements, whether due to error or fraud, and performing proceduresthat respond to those risks. Such procedures included examining, on a test basis, evidence regarding the amountsand disclosures in the consolidated financial statements. Our audits also included evaluating the accountingprinciples used and significant estimates made by management, as well as evaluating the overall presentation ofthe consolidated financial statements. Our audit of internal control over financial reporting included obtaining anunderstanding of internal control over financial reporting, assessing the risk that a material weakness exists, andtesting and evaluating the design and operating effectiveness of internal control based on the assessed risk. Ouraudits also included performing such other procedures as we considered necessary in the circumstances. Webelieve that our audits provide a reasonable basis for our opinions.
Definition and Limitations of Internal Control over Financial Reporting
A company’s internal control over financial reporting is a process designed to provide reasonable assuranceregarding the reliability of financial reporting and the preparation of financial statements for external purposes inaccordance with generally accepted accounting principles. A company’s internal control over financial reporting
106

includes those policies and procedures that (i) pertain to the maintenance of records that, in reasonable detail,accurately and fairly reflect the transactions and dispositions of the assets of the company; (ii) provide reasonableassurance that transactions are recorded as necessary to permit preparation of financial statements in accordancewith generally accepted accounting principles, and that receipts and expenditures of the company are being madeonly in accordance with authorizations of management and directors of the company; and (iii) provide reasonableassurance regarding prevention or timely detection of unauthorized acquisition, use, or disposition of thecompany’s assets that could have a material effect on the financial statements.
Because of its inherent limitations, internal control over financial reporting may not prevent or detectmisstatements. Also, projections of any evaluation of effectiveness to future periods are subject to the risk thatcontrols may become inadequate because of changes in conditions, or that the degree of compliance with thepolicies or procedures may deteriorate.
Critical Audit Matters
The critical audit matters communicated below are matters arising from the current period audit of theconsolidated financial statements that were communicated or required to be communicated to the auditcommittee and that (i) relate to accounts or disclosures that are material to the consolidated financial statementsand (ii) involved our especially challenging, subjective, or complex judgments. The communication of criticalaudit matters does not alter in any way our opinion on the consolidated financial statements, taken as a whole,and we are not, by communicating the critical audit matters below, providing separate opinions on the criticalaudit matters or on the accounts or disclosures to which they relate.
Income Taxes—Utilization of Foreign Tax Credits
As described in Note 6 to the consolidated financial statements, during the fourth quarter of 2019, the Company’sforeign source income included accelerated royalty income (the “transaction”). The transaction, in combination withother tax planning, resulted in the utilization of foreign tax credits of $310 million in 2019, a significant portion ofwhich related to the transaction. Management performs scheduling exercises to determine if sufficient taxable incomeof the appropriate character exists in the periods required in order to realize these foreign tax credits prior to theirexpiration and considers tax planning strategies available to accelerate taxable amounts if required to utilize expiringforeign tax credits. The utilization of foreign tax credits requires judgment in assessing the tax consequences of eventsthat have been recognized in either the Company’s financial statements or tax returns.
The principal considerations for our determination that performing procedures relating to the utilization offoreign tax credits is a critical audit matter are there was significant judgment by management in evaluating thetax consequences of the transaction, including determining the appropriate application of tax law to thetransaction and a high degree of estimation uncertainty relative to the numerous and complex tax laws. This inturn led to a high degree of auditor judgment, subjectivity, and effort in performing procedures and evaluatingthe appropriateness of the application of tax law, including evaluating the implications of specific tax actionsexecuted to accelerate recognition of royalty income in the U.S. Also, the evaluation of audit evidence availableto support the application of tax law to the transaction is complex and required significant auditor judgment asthe nature of the evidence is often highly subjective, and the audit effort involved the use of professionals withspecialized skill and knowledge to assist in evaluating the audit evidence obtained.
Addressing the matter involved performing procedures and evaluating audit evidence in connection with formingour overall opinion on the consolidated financial statements. These procedures included testing the effectivenessof controls relating to the income tax process, specifically the controls related to management’s assessment of theutilization of foreign tax credits. These procedures also included, among others (i) testing the information used todetermine the tax gain from the transaction, including reading of intercompany agreements and (ii) evaluatingmanagement’s assessment of the technical merits of the transaction, including evaluation of external taxopinions. Professionals with specialized skill and knowledge were used to assist in evaluating the transaction andapplication of the relevant tax law.
107
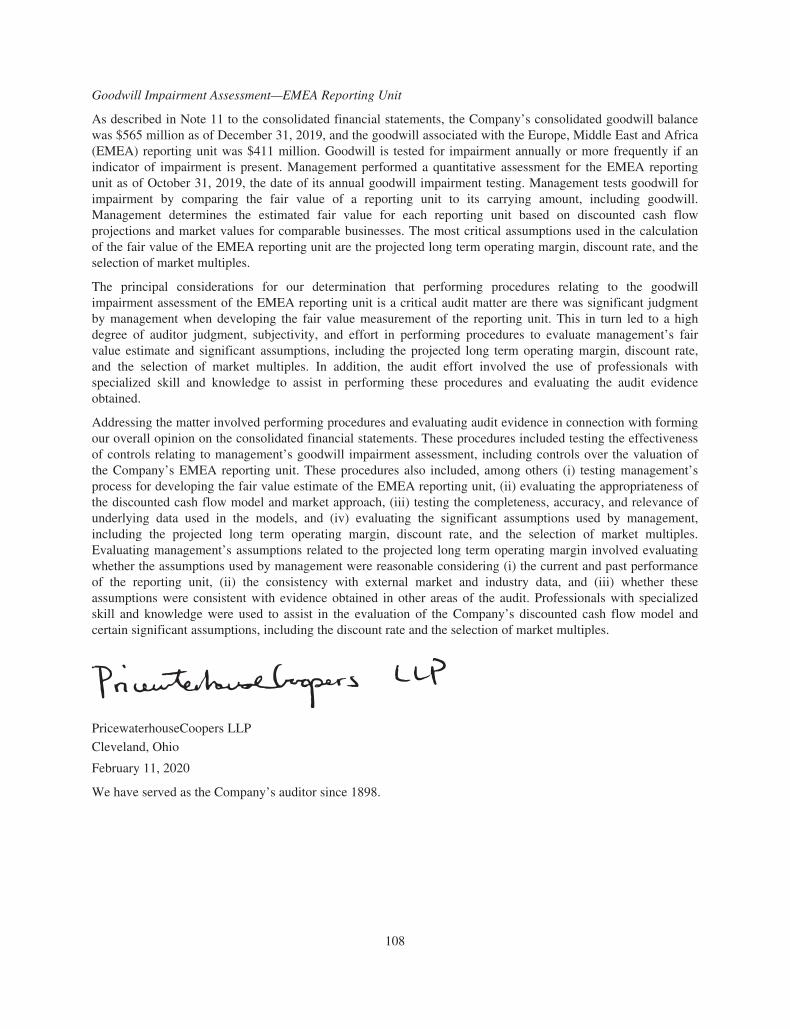
Goodwill Impairment Assessment—EMEA Reporting Unit
As described in Note 11 to the consolidated financial statements, the Company’s consolidated goodwill balancewas $565 million as of December 31, 2019, and the goodwill associated with the Europe, Middle East and Africa(EMEA) reporting unit was $411 million. Goodwill is tested for impairment annually or more frequently if anindicator of impairment is present. Management performed a quantitative assessment for the EMEA reportingunit as of October 31, 2019, the date of its annual goodwill impairment testing. Management tests goodwill forimpairment by comparing the fair value of a reporting unit to its carrying amount, including goodwill.Management determines the estimated fair value for each reporting unit based on discounted cash flowprojections and market values for comparable businesses. The most critical assumptions used in the calculationof the fair value of the EMEA reporting unit are the projected long term operating margin, discount rate, and theselection of market multiples.
The principal considerations for our determination that performing procedures relating to the goodwillimpairment assessment of the EMEA reporting unit is a critical audit matter are there was significant judgmentby management when developing the fair value measurement of the reporting unit. This in turn led to a highdegree of auditor judgment, subjectivity, and effort in performing procedures to evaluate management’s fairvalue estimate and significant assumptions, including the projected long term operating margin, discount rate,and the selection of market multiples. In addition, the audit effort involved the use of professionals withspecialized skill and knowledge to assist in performing these procedures and evaluating the audit evidenceobtained.
Addressing the matter involved performing procedures and evaluating audit evidence in connection with formingour overall opinion on the consolidated financial statements. These procedures included testing the effectivenessof controls relating to management’s goodwill impairment assessment, including controls over the valuation ofthe Company’s EMEA reporting unit. These procedures also included, among others (i) testing management’sprocess for developing the fair value estimate of the EMEA reporting unit, (ii) evaluating the appropriateness ofthe discounted cash flow model and market approach, (iii) testing the completeness, accuracy, and relevance ofunderlying data used in the models, and (iv) evaluating the significant assumptions used by management,including the projected long term operating margin, discount rate, and the selection of market multiples.Evaluating management’s assumptions related to the projected long term operating margin involved evaluatingwhether the assumptions used by management were reasonable considering (i) the current and past performanceof the reporting unit, (ii) the consistency with external market and industry data, and (iii) whether theseassumptions were consistent with evidence obtained in other areas of the audit. Professionals with specializedskill and knowledge were used to assist in the evaluation of the Company’s discounted cash flow model andcertain significant assumptions, including the discount rate and the selection of market multiples.
PricewaterhouseCoopers LLP
Cleveland, Ohio
February 11, 2020
We have served as the Company’s auditor since 1898.
108
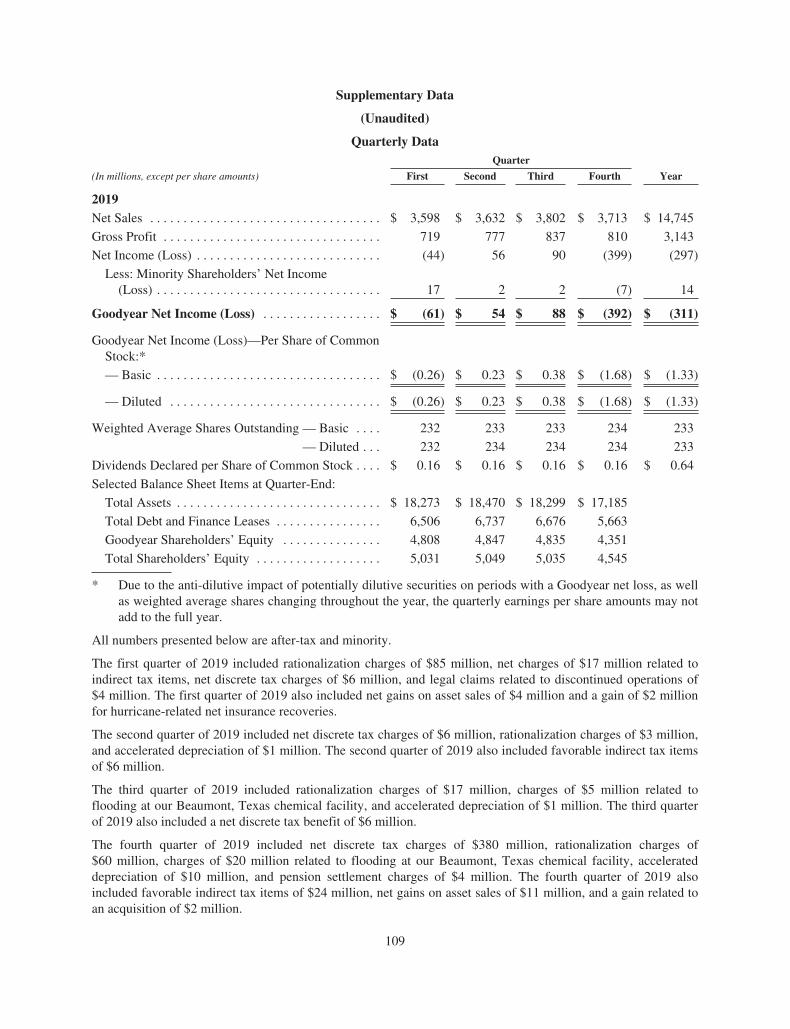
Supplementary Data
(Unaudited)
Quarterly DataQuarter
(In millions, except per share amounts) First Second Third Fourth Year
2019Net Sales . . . . . . . . . . . . . . . . . . . . . . . . . . . . . . . . . . . $ 3,598 $ 3,632 $ 3,802 $ 3,713 $ 14,745
Gross Profit . . . . . . . . . . . . . . . . . . . . . . . . . . . . . . . . . 719 777 837 810 3,143
Net Income (Loss) . . . . . . . . . . . . . . . . . . . . . . . . . . . . (44) 56 90 (399) (297)
Less: Minority Shareholders’ Net Income(Loss) . . . . . . . . . . . . . . . . . . . . . . . . . . . . . . . . . . 17 2 2 (7) 14
Goodyear Net Income (Loss) . . . . . . . . . . . . . . . . . . $ (61) $ 54 $ 88 $ (392) $ (311)
Goodyear Net Income (Loss)—Per Share of CommonStock:*
— Basic . . . . . . . . . . . . . . . . . . . . . . . . . . . . . . . . . . $ (0.26) $ 0.23 $ 0.38 $ (1.68) $ (1.33)
— Diluted . . . . . . . . . . . . . . . . . . . . . . . . . . . . . . . . $ (0.26) $ 0.23 $ 0.38 $ (1.68) $ (1.33)
Weighted Average Shares Outstanding — Basic . . . . 232 233 233 234 233
— Diluted . . . 232 234 234 234 233
Dividends Declared per Share of Common Stock . . . . $ 0.16 $ 0.16 $ 0.16 $ 0.16 $ 0.64
Selected Balance Sheet Items at Quarter-End:
Total Assets . . . . . . . . . . . . . . . . . . . . . . . . . . . . . . . $ 18,273 $ 18,470 $ 18,299 $ 17,185
Total Debt and Finance Leases . . . . . . . . . . . . . . . . 6,506 6,737 6,676 5,663
Goodyear Shareholders’ Equity . . . . . . . . . . . . . . . 4,808 4,847 4,835 4,351
Total Shareholders’ Equity . . . . . . . . . . . . . . . . . . . 5,031 5,049 5,035 4,545
* Due to the anti-dilutive impact of potentially dilutive securities on periods with a Goodyear net loss, as wellas weighted average shares changing throughout the year, the quarterly earnings per share amounts may notadd to the full year.
All numbers presented below are after-tax and minority.
The first quarter of 2019 included rationalization charges of $85 million, net charges of $17 million related toindirect tax items, net discrete tax charges of $6 million, and legal claims related to discontinued operations of$4 million. The first quarter of 2019 also included net gains on asset sales of $4 million and a gain of $2 millionfor hurricane-related net insurance recoveries.
The second quarter of 2019 included net discrete tax charges of $6 million, rationalization charges of $3 million,and accelerated depreciation of $1 million. The second quarter of 2019 also included favorable indirect tax itemsof $6 million.
The third quarter of 2019 included rationalization charges of $17 million, charges of $5 million related toflooding at our Beaumont, Texas chemical facility, and accelerated depreciation of $1 million. The third quarterof 2019 also included a net discrete tax benefit of $6 million.
The fourth quarter of 2019 included net discrete tax charges of $380 million, rationalization charges of$60 million, charges of $20 million related to flooding at our Beaumont, Texas chemical facility, accelerateddepreciation of $10 million, and pension settlement charges of $4 million. The fourth quarter of 2019 alsoincluded favorable indirect tax items of $24 million, net gains on asset sales of $11 million, and a gain related toan acquisition of $2 million.
109
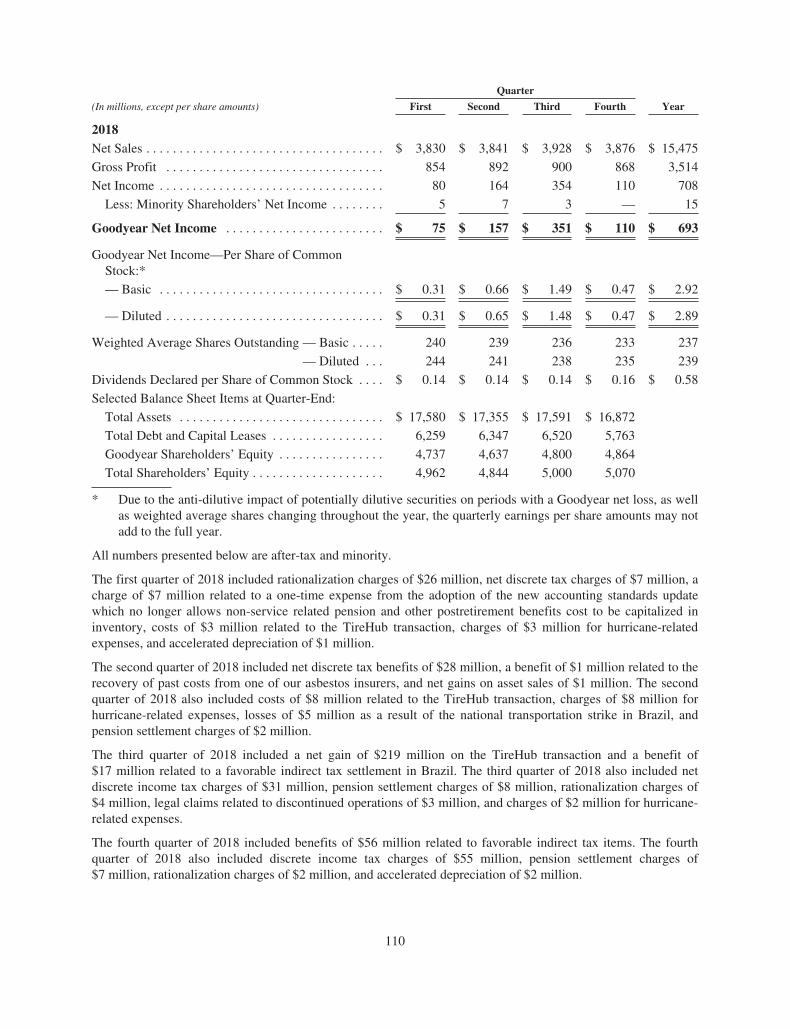
Quarter
(In millions, except per share amounts) First Second Third Fourth Year
2018Net Sales . . . . . . . . . . . . . . . . . . . . . . . . . . . . . . . . . . . . $ 3,830 $ 3,841 $ 3,928 $ 3,876 $ 15,475
Gross Profit . . . . . . . . . . . . . . . . . . . . . . . . . . . . . . . . . 854 892 900 868 3,514
Net Income . . . . . . . . . . . . . . . . . . . . . . . . . . . . . . . . . . 80 164 354 110 708
Less: Minority Shareholders’ Net Income . . . . . . . . 5 7 3 — 15
Goodyear Net Income . . . . . . . . . . . . . . . . . . . . . . . . $ 75 $ 157 $ 351 $ 110 $ 693
Goodyear Net Income—Per Share of CommonStock:*
— Basic . . . . . . . . . . . . . . . . . . . . . . . . . . . . . . . . . . $ 0.31 $ 0.66 $ 1.49 $ 0.47 $ 2.92
— Diluted . . . . . . . . . . . . . . . . . . . . . . . . . . . . . . . . . $ 0.31 $ 0.65 $ 1.48 $ 0.47 $ 2.89
Weighted Average Shares Outstanding — Basic . . . . . 240 239 236 233 237
— Diluted . . . 244 241 238 235 239
Dividends Declared per Share of Common Stock . . . . $ 0.14 $ 0.14 $ 0.14 $ 0.16 $ 0.58
Selected Balance Sheet Items at Quarter-End:
Total Assets . . . . . . . . . . . . . . . . . . . . . . . . . . . . . . . $ 17,580 $ 17,355 $ 17,591 $ 16,872
Total Debt and Capital Leases . . . . . . . . . . . . . . . . . 6,259 6,347 6,520 5,763
Goodyear Shareholders’ Equity . . . . . . . . . . . . . . . . 4,737 4,637 4,800 4,864
Total Shareholders’ Equity . . . . . . . . . . . . . . . . . . . . 4,962 4,844 5,000 5,070
* Due to the anti-dilutive impact of potentially dilutive securities on periods with a Goodyear net loss, as wellas weighted average shares changing throughout the year, the quarterly earnings per share amounts may notadd to the full year.
All numbers presented below are after-tax and minority.
The first quarter of 2018 included rationalization charges of $26 million, net discrete tax charges of $7 million, acharge of $7 million related to a one-time expense from the adoption of the new accounting standards updatewhich no longer allows non-service related pension and other postretirement benefits cost to be capitalized ininventory, costs of $3 million related to the TireHub transaction, charges of $3 million for hurricane-relatedexpenses, and accelerated depreciation of $1 million.
The second quarter of 2018 included net discrete tax benefits of $28 million, a benefit of $1 million related to therecovery of past costs from one of our asbestos insurers, and net gains on asset sales of $1 million. The secondquarter of 2018 also included costs of $8 million related to the TireHub transaction, charges of $8 million forhurricane-related expenses, losses of $5 million as a result of the national transportation strike in Brazil, andpension settlement charges of $2 million.
The third quarter of 2018 included a net gain of $219 million on the TireHub transaction and a benefit of$17 million related to a favorable indirect tax settlement in Brazil. The third quarter of 2018 also included netdiscrete income tax charges of $31 million, pension settlement charges of $8 million, rationalization charges of$4 million, legal claims related to discontinued operations of $3 million, and charges of $2 million for hurricane-related expenses.
The fourth quarter of 2018 included benefits of $56 million related to favorable indirect tax items. The fourthquarter of 2018 also included discrete income tax charges of $55 million, pension settlement charges of$7 million, rationalization charges of $2 million, and accelerated depreciation of $2 million.
110
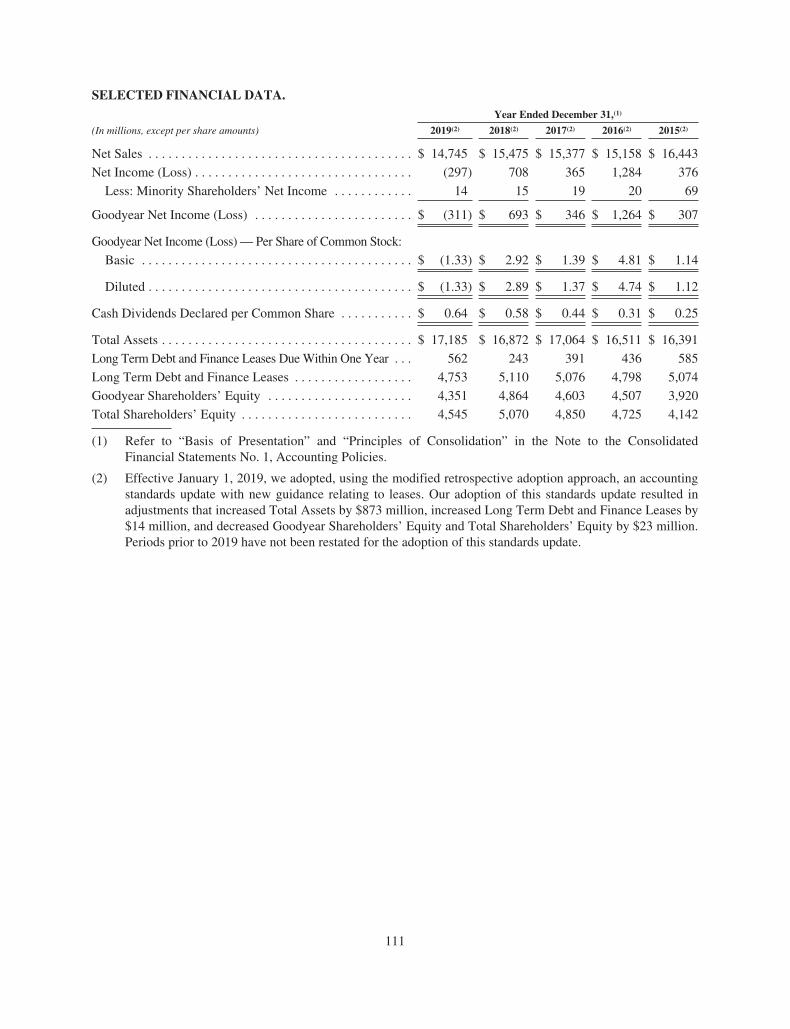
SELECTED FINANCIAL DATA.Year Ended December 31,(1)
(In millions, except per share amounts) 2019(2) 2018(2) 2017(2) 2016(2) 2015(2)
Net Sales . . . . . . . . . . . . . . . . . . . . . . . . . . . . . . . . . . . . . . . . $ 14,745 $ 15,475 $ 15,377 $ 15,158 $ 16,443
Net Income (Loss) . . . . . . . . . . . . . . . . . . . . . . . . . . . . . . . . . (297) 708 365 1,284 376
Less: Minority Shareholders’ Net Income . . . . . . . . . . . . 14 15 19 20 69
Goodyear Net Income (Loss) . . . . . . . . . . . . . . . . . . . . . . . . $ (311) $ 693 $ 346 $ 1,264 $ 307
Goodyear Net Income (Loss) — Per Share of Common Stock:
Basic . . . . . . . . . . . . . . . . . . . . . . . . . . . . . . . . . . . . . . . . . $ (1.33) $ 2.92 $ 1.39 $ 4.81 $ 1.14
Diluted . . . . . . . . . . . . . . . . . . . . . . . . . . . . . . . . . . . . . . . . $ (1.33) $ 2.89 $ 1.37 $ 4.74 $ 1.12
Cash Dividends Declared per Common Share . . . . . . . . . . . $ 0.64 $ 0.58 $ 0.44 $ 0.31 $ 0.25
Total Assets . . . . . . . . . . . . . . . . . . . . . . . . . . . . . . . . . . . . . . $ 17,185 $ 16,872 $ 17,064 $ 16,511 $ 16,391
Long Term Debt and Finance Leases Due Within One Year . . . 562 243 391 436 585
Long Term Debt and Finance Leases . . . . . . . . . . . . . . . . . . 4,753 5,110 5,076 4,798 5,074
Goodyear Shareholders’ Equity . . . . . . . . . . . . . . . . . . . . . . 4,351 4,864 4,603 4,507 3,920
Total Shareholders’ Equity . . . . . . . . . . . . . . . . . . . . . . . . . . 4,545 5,070 4,850 4,725 4,142
(1) Refer to “Basis of Presentation” and “Principles of Consolidation” in the Note to the ConsolidatedFinancial Statements No. 1, Accounting Policies.
(2) Effective January 1, 2019, we adopted, using the modified retrospective adoption approach, an accountingstandards update with new guidance relating to leases. Our adoption of this standards update resulted inadjustments that increased Total Assets by $873 million, increased Long Term Debt and Finance Leases by$14 million, and decreased Goodyear Shareholders’ Equity and Total Shareholders’ Equity by $23 million.Periods prior to 2019 have not been restated for the adoption of this standards update.
111
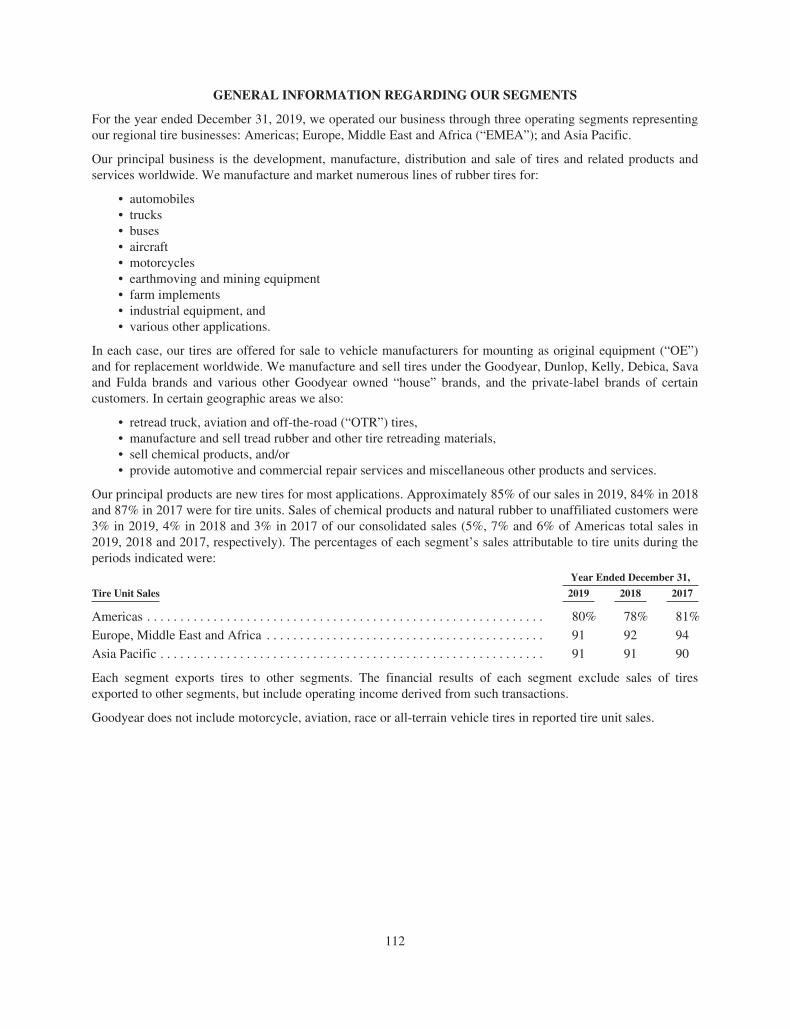
GENERAL INFORMATION REGARDING OUR SEGMENTS
For the year ended December 31, 2019, we operated our business through three operating segments representingour regional tire businesses: Americas; Europe, Middle East and Africa (“EMEA”); and Asia Pacific.
Our principal business is the development, manufacture, distribution and sale of tires and related products andservices worldwide. We manufacture and market numerous lines of rubber tires for:
• automobiles• trucks• buses• aircraft• motorcycles• earthmoving and mining equipment• farm implements• industrial equipment, and• various other applications.
In each case, our tires are offered for sale to vehicle manufacturers for mounting as original equipment (“OE”)and for replacement worldwide. We manufacture and sell tires under the Goodyear, Dunlop, Kelly, Debica, Savaand Fulda brands and various other Goodyear owned “house” brands, and the private-label brands of certaincustomers. In certain geographic areas we also:
• retread truck, aviation and off-the-road (“OTR”) tires,• manufacture and sell tread rubber and other tire retreading materials,• sell chemical products, and/or• provide automotive and commercial repair services and miscellaneous other products and services.
Our principal products are new tires for most applications. Approximately 85% of our sales in 2019, 84% in 2018and 87% in 2017 were for tire units. Sales of chemical products and natural rubber to unaffiliated customers were3% in 2019, 4% in 2018 and 3% in 2017 of our consolidated sales (5%, 7% and 6% of Americas total sales in2019, 2018 and 2017, respectively). The percentages of each segment’s sales attributable to tire units during theperiods indicated were:
Year Ended December 31,
Tire Unit Sales 2019 2018 2017
Americas . . . . . . . . . . . . . . . . . . . . . . . . . . . . . . . . . . . . . . . . . . . . . . . . . . . . . . . . . . . . 80% 78% 81%
Europe, Middle East and Africa . . . . . . . . . . . . . . . . . . . . . . . . . . . . . . . . . . . . . . . . . . 91 92 94
Asia Pacific . . . . . . . . . . . . . . . . . . . . . . . . . . . . . . . . . . . . . . . . . . . . . . . . . . . . . . . . . . 91 91 90
Each segment exports tires to other segments. The financial results of each segment exclude sales of tiresexported to other segments, but include operating income derived from such transactions.
Goodyear does not include motorcycle, aviation, race or all-terrain vehicle tires in reported tire unit sales.
112
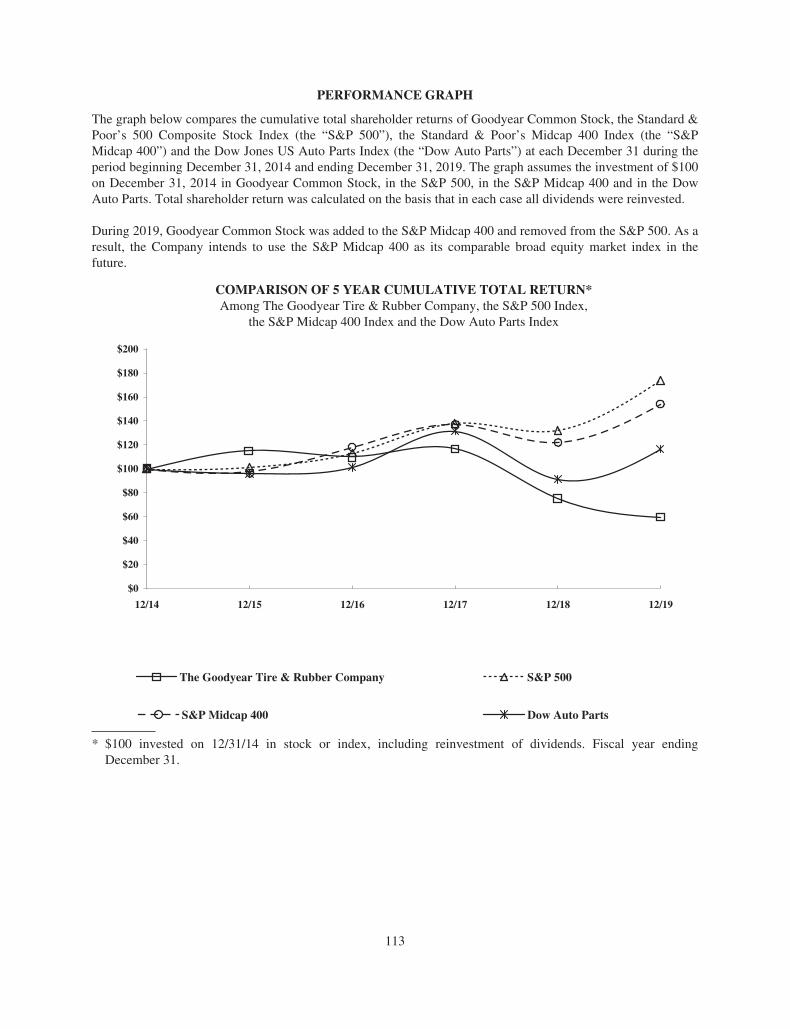
PERFORMANCE GRAPH
The graph below compares the cumulative total shareholder returns of Goodyear Common Stock, the Standard &Poor’s 500 Composite Stock Index (the “S&P 500”), the Standard & Poor’s Midcap 400 Index (the “S&PMidcap 400”) and the Dow Jones US Auto Parts Index (the “Dow Auto Parts”) at each December 31 during theperiod beginning December 31, 2014 and ending December 31, 2019. The graph assumes the investment of $100on December 31, 2014 in Goodyear Common Stock, in the S&P 500, in the S&P Midcap 400 and in the DowAuto Parts. Total shareholder return was calculated on the basis that in each case all dividends were reinvested.
During 2019, Goodyear Common Stock was added to the S&P Midcap 400 and removed from the S&P 500. As aresult, the Company intends to use the S&P Midcap 400 as its comparable broad equity market index in thefuture.
COMPARISON OF 5 YEAR CUMULATIVE TOTAL RETURN*Among The Goodyear Tire & Rubber Company, the S&P 500 Index,
the S&P Midcap 400 Index and the Dow Auto Parts Index
The Goodyear Tire & Rubber Company S&P 500
S&P Midcap 400
12/14 12/15 12/16 12/17 12/1912/18
$0
$60
$40
$20
$80
$100
$120
$140
$160
$200
$180
Dow Auto Parts
* $100 invested on 12/31/14 in stock or index, including reinvestment of dividends. Fiscal year endingDecember 31.
113
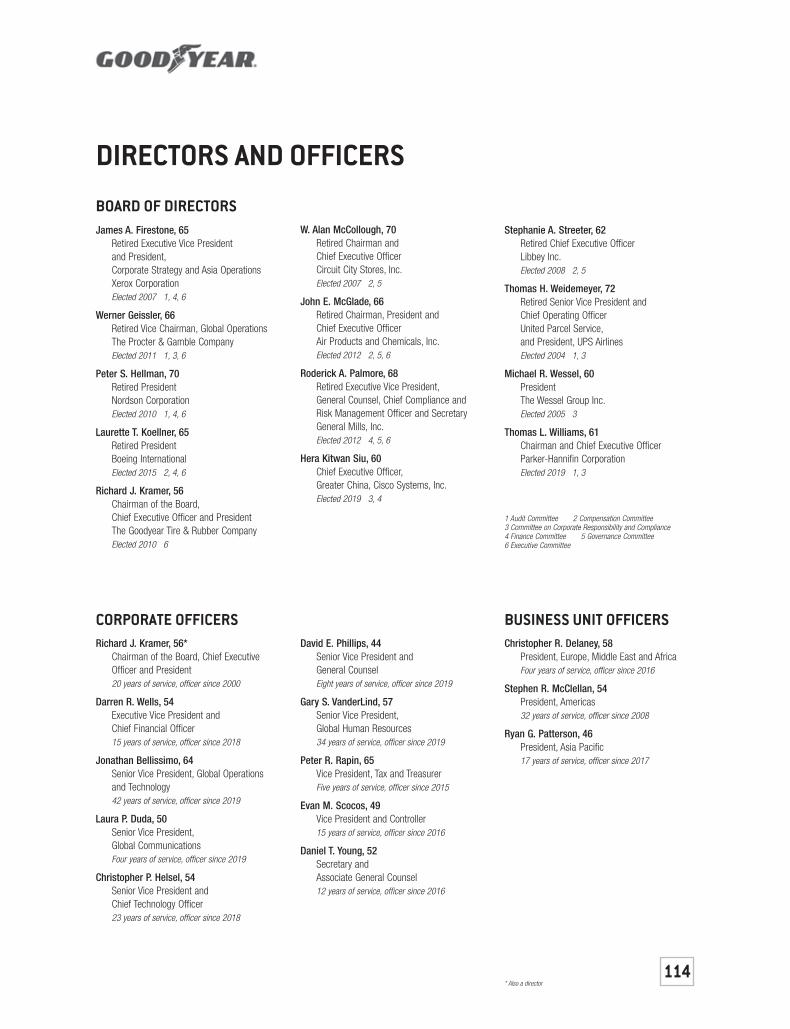
* Also a director
1 Audit Committee 2 Compensation Committee 3 Committee on Corporate Responsibility and Compliance 4 Finance Committee 5 Governance Committee6 Executive Committee
DIRECTORS AND OFFICERS
James A. Firestone, 65Retired Executive Vice President and President, Corporate Strategy and Asia OperationsXerox CorporationElected 2007 1, 4, 6
Werner Geissler, 66Retired Vice Chairman, Global OperationsThe Procter & Gamble CompanyElected 2011 1, 3, 6
Peter S. Hellman, 70Retired PresidentNordson CorporationElected 2010 1, 4, 6
Laurette T. Koellner, 65Retired PresidentBoeing InternationalElected 2015 2, 4, 6
Richard J. Kramer, 56Chairman of the Board, Chief Executive Officer and PresidentThe Goodyear Tire & Rubber CompanyElected 2010 6
W. Alan McCollough, 70Retired Chairman and Chief Executive OfficerCircuit City Stores, Inc.Elected 2007 2, 5
John E. McGlade, 66Retired Chairman, President and Chief Executive OfficerAir Products and Chemicals, Inc.Elected 2012 2, 5, 6
Roderick A. Palmore, 68Retired Executive Vice President, General Counsel, Chief Compliance and Risk Management Officer and SecretaryGeneral Mills, Inc.Elected 2012 4, 5, 6
Hera Kitwan Siu, 60Chief Executive Officer,Greater China, Cisco Systems, Inc.Elected 2019 3, 4
Stephanie A. Streeter, 62Retired Chief Executive OfficerLibbey Inc.Elected 2008 2, 5
Thomas H. Weidemeyer, 72Retired Senior Vice President and Chief Operating OfficerUnited Parcel Service, and President, UPS AirlinesElected 2004 1, 3
Michael R. Wessel, 60PresidentThe Wessel Group Inc.Elected 2005 3
Thomas L. Williams, 61Chairman and Chief Executive OfficerParker-Hannifin CorporationElected 2019 1, 3
BOARD OF DIRECTORS
CORPORATE OFFICERS BUSINESS UNIT OFFICERSRichard J. Kramer, 56*
Chairman of the Board, Chief ExecutiveOfficer and President20 years of service, officer since 2000
Darren R. Wells, 54Executive Vice President and Chief Financial Officer15 years of service, officer since 2018
Jonathan Bellissimo, 64Senior Vice President, Global Operations and Technology42 years of service, officer since 2019
Laura P. Duda, 50Senior Vice President, Global CommunicationsFour years of service, officer since 2019
Christopher P. Helsel, 54Senior Vice President and Chief Technology Officer23 years of service, officer since 2018
David E. Phillips, 44Senior Vice President andGeneral CounselEight years of service, officer since 2019
Gary S. VanderLind, 57Senior Vice President, Global Human Resources34 years of service, officer since 2019
Peter R. Rapin, 65Vice President, Tax and TreasurerFive years of service, officer since 2015
Evan M. Scocos, 49Vice President and Controller15 years of service, officer since 2016
Daniel T. Young, 52Secretary and Associate General Counsel12 years of service, officer since 2016
Christopher R. Delaney, 58President, Europe, Middle East and AfricaFour years of service, officer since 2016
Stephen R. McClellan, 54President, Americas32 years of service, officer since 2008
Ryan G. Patterson, 46President, Asia Pacific17 years of service, officer since 2017
114
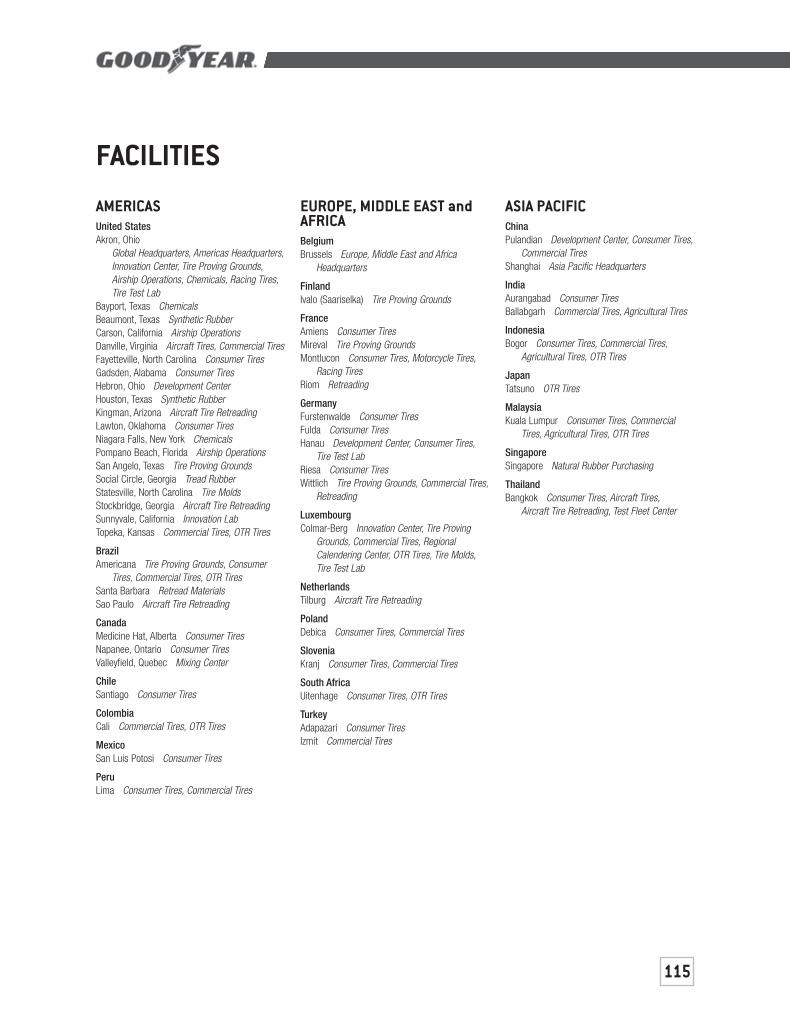
FACILITIES
AMERICASUnited StatesAkron, Ohio
Global Headquarters, Americas Headquarters,Innovation Center, Tire Proving Grounds,Airship Operations, Chemicals, Racing Tires,Tire Test Lab
Bayport, Texas ChemicalsBeaumont, Texas Synthetic RubberCarson, California Airship OperationsDanville, Virginia Aircraft Tires, Commercial TiresFayetteville, North Carolina Consumer TiresGadsden, Alabama Consumer TiresHebron, Ohio Development CenterHouston, Texas Synthetic RubberKingman, Arizona Aircraft Tire RetreadingLawton, Oklahoma Consumer TiresNiagara Falls, New York ChemicalsPompano Beach, Florida Airship OperationsSan Angelo, Texas Tire Proving GroundsSocial Circle, Georgia Tread RubberStatesville, North Carolina Tire MoldsStockbridge, Georgia Aircraft Tire RetreadingSunnyvale, California Innovation LabTopeka, Kansas Commercial Tires, OTR Tires
BrazilAmericana Tire Proving Grounds, Consumer
Tires, Commercial Tires, OTR TiresSanta Barbara Retread MaterialsSao Paulo Aircraft Tire Retreading
CanadaMedicine Hat, Alberta Consumer TiresNapanee, Ontario Consumer TiresValleyfield, Quebec Mixing Center
ChileSantiago Consumer Tires
ColombiaCali Commercial Tires, OTR Tires
MexicoSan Luis Potosi Consumer Tires
PeruLima Consumer Tires, Commercial Tires
EUROPE, MIDDLE EAST andAFRICABelgiumBrussels Europe, Middle East and Africa
Headquarters
FinlandIvalo (Saariselka) Tire Proving Grounds
FranceAmiens Consumer TiresMireval Tire Proving GroundsMontlucon Consumer Tires, Motorcycle Tires,
Racing TiresRiom Retreading
GermanyFurstenwalde Consumer TiresFulda Consumer TiresHanau Development Center, Consumer Tires,
Tire Test LabRiesa Consumer TiresWittlich Tire Proving Grounds, Commercial Tires,
Retreading
LuxembourgColmar-Berg Innovation Center, Tire Proving
Grounds, Commercial Tires, RegionalCalendering Center, OTR Tires, Tire Molds,Tire Test Lab
NetherlandsTilburg Aircraft Tire Retreading
PolandDebica Consumer Tires, Commercial Tires
SloveniaKranj Consumer Tires, Commercial Tires
South AfricaUitenhage Consumer Tires, OTR Tires
TurkeyAdapazari Consumer TiresIzmit Commercial Tires
ASIA PACIFICChinaPulandian Development Center, Consumer Tires,
Commercial TiresShanghai Asia Pacific Headquarters
IndiaAurangabad Consumer TiresBallabgarh Commercial Tires, Agricultural Tires
IndonesiaBogor Consumer Tires, Commercial Tires,
Agricultural Tires, OTR Tires
JapanTatsuno OTR Tires
MalaysiaKuala Lumpur Consumer Tires, Commercial
Tires, Agricultural Tires, OTR Tires
SingaporeSingapore Natural Rubber Purchasing
ThailandBangkok Consumer Tires, Aircraft Tires,
Aircraft Tire Retreading, Test Fleet Center
115

116
FORM 10-K AND OTHER REPORTSPaper copies of Goodyear’s Annual Report on Form 10-K are available uponrequest. Quarterly reports on Form 10-Q are also available on request.Copies of any of the above or Goodyear’s Proxy Statement may be obtainedwithout charge from:Investor Relations, Dept. 635The Goodyear Tire & Rubber Company200 Innovation WayAkron, Ohio 44316-0001(330) 796-3751
Copies of these reports may also be obtained from the company’sInvestor Website http://investor.goodyear.com.
Goodyear has included as Exhibits 31.1, 31.2 and 32.1 to its AnnualReport on Form 10-K for the year ended December 31, 2019, filed with theSecurities and Exchange Commission, certificates of Goodyear’s ChiefExecutive Officer and Chief Financial Officer with respect to the Form 10-K.
CD COPYA CD copy of the 2019 Annual Report is available for visually impairedshareholders by contacting Goodyear Investor Relations at (330) 796-3751.
COMPUTERSHARE INVESTMENT PLANComputershare sponsors and administers a direct stock purchase and dividend reinvestment plan for current shareholders and new investors inGoodyear common stock. A brochure explaining the program may beobtained by contacting: Computersharec/o Shareholder ServicesP.O. Box 505000Louisville, KY 40233-5000(800) 317-4445www.computershare.com/investor
INDEPENDENT REGISTERED PUBLICACCOUNTING FIRMPricewaterhouseCoopers LLP200 Public Square, 19th FloorCleveland, Ohio 44114-2301
OTHER INFORMATIONPersons seeking information about Goodyear’s corporate responsibility initiatives can access the company’s Corporate Responsibility Website at:www.goodyear.com/responsibility.
Persons seeking general information about Goodyear or its productscan access the company’s Corporate Website at: www.goodyear.com/corporate.
Media representatives seeking information about Goodyear or contactinformation for spokespersons can access the company’s Media Websiteat: www.goodyearnewsroom.com.
SHAREHOLDER INFORMATIONCORPORATE OFFICESThe Goodyear Tire & Rubber Company200 Innovation WayAkron, Ohio 44316-0001(330) 796-2121www.goodyear.com
GOODYEAR COMMON STOCKThe principal market for Goodyear common stock is the Nasdaq GlobalSelect Market (symbol GT).
On February 11, 2020, there were 12,280 shareholders of record ofGoodyear common stock. The closing price of Goodyear common stock on the Nasdaq Global Select Market on February 11, 2020, was $11.56.The quarterly cash dividend on our common stock is currently $0.16 per share, which represents an annual rate of $0.64 per share.
ANNUAL MEETING4:30 p.m., Monday, April 6, 2020Hilton Akron-Fairlawn3180 W. Market StreetAkron, Ohio 44333Please direct meeting inquiries to:Office of the Secretary, Dept. 822The Goodyear Tire & Rubber Company200 Innovation WayAkron, Ohio 44316-0001
SHAREHOLDER INQUIRIESTransfer Agent and Registrar:Computershare Trust Company, N.A.P.O. Box 505000Louisville, KY 40233-5000(800) 317-4445www.computershare.com
Inquiries concerning the issuance or transfer of stock certificates orshare account information should be directed to Computershare. ProvideSocial Security number, account number and Goodyear’s ID, GTR.Hearing-impaired shareholders can communicate directly withComputershare via a TDD by calling (800) 952-9245. Other shareholderinquiries should be directed to:Investor Relations, Dept. 635The Goodyear Tire & Rubber Company200 Innovation WayAkron, Ohio 44316-0001(330) 796-3751E-mail: [email protected]