
The good, the bad and the ugly of lockdowns during Covid-19
18
RESEARCH ARTICLE The good, the bad and the ugly of lockdowns during Covid-19 Talita Greyling 1☯ , Stephanie Rossouw 2☯ *, Tamanna Adhikari ID 1☯ 1 School of Economics, University of Johannesburg, Johannesburg, South Africa, 2 School of Economics, Auckland University of Technology, Auckland, New Zealand ☯ These authors contributed equally to this work. * [email protected] Abstract Amidst the rapid global spread of Covid-19, many governments enforced country-wide lock- downs, with likely severe well-being consequences. In this regard, South Africa is an extreme case suffering from low levels of well-being, but at the same time enforcing very strict lockdown regulations. In this study, we analyse the causal effect of a lockdown and consequently, the determinants of happiness during the aforementioned. A difference-in-dif- ference approach is used to make causal inferences on the lockdown effect on happiness, and an OLS estimation investigates the determinants of happiness after lockdown. The results show that the lockdown had a significant and negative impact on happiness. In ana- lysing the determinants of happiness after lockdown, we found that stay-at-home orders have positively impacted happiness during this period. On the other hand, other lockdown regulations such as a ban on alcohol sales, a fear of becoming unemployed and a greater reliance on social media have negative effects, culminating in a net loss in happiness. Inter- estingly, Covid-19, proxied by new deaths per day, had an inverted U-shape relationship with happiness. Seemingly people were, at the onset of Covid-19 positive and optimistic about the low fatality rates and the high recovery rates. However, as the pandemic pro- gressed, they became more concerned, and this relationship changed and became nega- tive, with peoples’ happiness decreasing as the number of new deaths increased. 1. Introduction In an attempt to curb the spread of Covid-19 and minimise the loss of life, governments around the world have imposed their version of mandatory self-isolation through implement- ing lockdown regulations. Unfortunately, restricting people’s mobility and depriving them of what matters most might intensify the negative effect on happiness levels. In an extreme country case, this might be amplified. In this study, we treat an extreme country as a country with very strict lockdown regulations, with likely high infection rates, amidst low levels of well-being. We define well-being as those aspects of life that society collec- tively agrees are important for a person’s quality of life, happiness and welfare. One of the dimensions of well-being, material (income) hinges on a bleak economic outlook. To this end, our primary aim in this study is to use the Gross National Happiness Index (GNH), a real-time measure of well-being, derived from Big Data, to investigate if lockdown PLOS ONE PLOS ONE | https://doi.org/10.1371/journal.pone.0245546 January 22, 2021 1 / 18 a1111111111 a1111111111 a1111111111 a1111111111 a1111111111 OPEN ACCESS Citation: Greyling T, Rossouw S, Adhikari T (2021) The good, the bad and the ugly of lockdowns during Covid-19. PLoS ONE 16(1): e0245546. https://doi.org/10.1371/journal.pone.0245546 Editor: Francesco Di Gennaro, National Institute for Infectious Diseases Lazzaro Spallanzani-IRCCS, ITALY Received: July 29, 2020 Accepted: December 30, 2020 Published: January 22, 2021 Peer Review History: PLOS recognizes the benefits of transparency in the peer review process; therefore, we enable the publication of all of the content of peer review and author responses alongside final, published articles. The editorial history of this article is available here: https://doi.org/10.1371/journal.pone.0245546 Copyright: © 2021 Greyling et al. This is an open access article distributed under the terms of the Creative Commons Attribution License, which permits unrestricted use, distribution, and reproduction in any medium, provided the original author and source are credited. Data Availability Statement: All relevant data are within the paper and its Supporting Information files. Funding: The following authors received salaries from their institutions, whom were also the funders
Transcript of The good, the bad and the ugly of lockdowns during Covid-19

RESEARCH ARTICLE
The good, the bad and the ugly of lockdowns
during Covid-19
Talita Greyling1☯, Stephanie Rossouw2☯*, Tamanna AdhikariID1☯
1 School of Economics, University of Johannesburg, Johannesburg, South Africa, 2 School of Economics,
Auckland University of Technology, Auckland, New Zealand
☯ These authors contributed equally to this work.
Abstract
Amidst the rapid global spread of Covid-19, many governments enforced country-wide lock-
downs, with likely severe well-being consequences. In this regard, South Africa is an
extreme case suffering from low levels of well-being, but at the same time enforcing very
strict lockdown regulations. In this study, we analyse the causal effect of a lockdown and
consequently, the determinants of happiness during the aforementioned. A difference-in-dif-
ference approach is used to make causal inferences on the lockdown effect on happiness,
and an OLS estimation investigates the determinants of happiness after lockdown. The
results show that the lockdown had a significant and negative impact on happiness. In ana-
lysing the determinants of happiness after lockdown, we found that stay-at-home orders
have positively impacted happiness during this period. On the other hand, other lockdown
regulations such as a ban on alcohol sales, a fear of becoming unemployed and a greater
reliance on social media have negative effects, culminating in a net loss in happiness. Inter-
estingly, Covid-19, proxied by new deaths per day, had an inverted U-shape relationship
with happiness. Seemingly people were, at the onset of Covid-19 positive and optimistic
about the low fatality rates and the high recovery rates. However, as the pandemic pro-
gressed, they became more concerned, and this relationship changed and became nega-
tive, with peoples’ happiness decreasing as the number of new deaths increased.
1. Introduction
In an attempt to curb the spread of Covid-19 and minimise the loss of life, governments
around the world have imposed their version of mandatory self-isolation through implement-
ing lockdown regulations. Unfortunately, restricting people’s mobility and depriving them of
what matters most might intensify the negative effect on happiness levels.
In an extreme country case, this might be amplified. In this study, we treat an extreme
country as a country with very strict lockdown regulations, with likely high infection rates,
amidst low levels of well-being. We define well-being as those aspects of life that society collec-
tively agrees are important for a person’s quality of life, happiness and welfare. One of the
dimensions of well-being, material (income) hinges on a bleak economic outlook.
To this end, our primary aim in this study is to use the Gross National Happiness Index
(GNH), a real-time measure of well-being, derived from Big Data, to investigate if lockdown
PLOS ONE
PLOS ONE | https://doi.org/10.1371/journal.pone.0245546 January 22, 2021 1 / 18
a1111111111
a1111111111
a1111111111
a1111111111
a1111111111
OPEN ACCESS
Citation: Greyling T, Rossouw S, Adhikari T (2021)
The good, the bad and the ugly of lockdowns
during Covid-19. PLoS ONE 16(1): e0245546.
https://doi.org/10.1371/journal.pone.0245546
Editor: Francesco Di Gennaro, National Institute for
Infectious Diseases Lazzaro Spallanzani-IRCCS,
ITALY
Received: July 29, 2020
Accepted: December 30, 2020
Published: January 22, 2021
Peer Review History: PLOS recognizes the
benefits of transparency in the peer review
process; therefore, we enable the publication of
all of the content of peer review and author
responses alongside final, published articles. The
editorial history of this article is available here:
https://doi.org/10.1371/journal.pone.0245546
Copyright: © 2021 Greyling et al. This is an open
access article distributed under the terms of the
Creative Commons Attribution License, which
permits unrestricted use, distribution, and
reproduction in any medium, provided the original
author and source are credited.
Data Availability Statement: All relevant data are
within the paper and its Supporting Information
files.
Funding: The following authors received salaries
from their institutions, whom were also the funders
regulations in itself caused a decrease in happiness. Secondly, we determine which factors mat-
ter most (factors significantly influencing happiness) to happiness under these changed cir-
cumstances. We accomplish these aims by using two econometric techniques: difference-in-
difference (DiD) and ordinary least squares (OLS).
Against this backdrop, the current study makes several contributions to the literature:
i. Determining whether lockdown regulations cause a decline in happiness–in an extreme coun-try case scenario.
ii. Investigating specifically the determinants of happiness during a lockdown, whereas other
studies have focused on mental well-being and related matters (see section 2).
iii. Being one of the few studies (see also Rossouw, Greyling and Adhikari; Greyling, Rossouw
and Adhikari [1, 2]) that investigates the effect of lockdown on happiness making use of
real-time Big Data. Other studies such as Hamermesh [3] and Brodeur et al. [4] also use
Big Data, though limited to Google Trends (see section 2).
These results give policymakers the necessary information to take action in increasing the
happiness of the nation and set the scene for increased economic, social and political well-
being. It also allows them to reflect on happiness outcomes due to their policy actions. An
additional benefit of the current study is that policymakers do not need to wait for extended
periods to see the consequences of their policies, as we are making use of real-time data, with
immediate information. Usually, policymakers can only evaluate their own decision making,
with significant time-lags, prolonging the implementation of corrective actions.
Our results indicate lockdown itself causes a decrease in happiness. Furthermore, in an
extreme country case (a country under stringent lockdown regulations coupled with low levels
of well-being) what matters most to happiness under lockdown is the factors directly linked to
the regulations that were implemented. These factors can be classified as (i) social capital
issues; lack of access to alcohol (and tobacco), increased social media usage, and more time to
spend at home, of which all are negatively related to happiness except the stay-at-home factor,
and (ii) economic issues; concerns over jobs and the threat of retrenchments, which are nega-
tively related to happiness. The finding on the stay-at-home order is interesting as even though
lockdown itself caused a decline in happiness, it seems that people adjust and over time begin
to appreciate the benefits of staying at home.
Noteworthy is that Covid-19, proxied by new deaths per day, had an inverted U-shape rela-
tionship to happiness. Seemingly people were, at the onset of Covid-19, positive and optimistic
as the fatality rate was relatively low and recovery rates high. However, as the pandemic pro-
gressed, they became more concerned, and this relationship changed and became negative,
with peoples’ happiness decreasing as the number of new Covid-19 deaths increased.
The rest of the paper is structured as follows. The next section contains a brief background
on South Africa and briefly discusses literature about happiness and studies conducted on the
impacts of pandemics and consequently lockdown regulations. Section 3 describes the data,
the selected variables and outlines the methodology used. The results follow in section 4, while
the paper concludes in section 5.
2. Background and literature review
2.1 South Africa
In this study, we focus on South Africa because it presents us with a unique case to investigate
the effect of a lockdown on happiness when levels of well-being are already low. Health and
income, two dimensions of well-being, was significantly affected, although in opposite
PLOS ONE Impact of lockdowns on well-being
PLOS ONE | https://doi.org/10.1371/journal.pone.0245546 January 22, 2021 2 / 18
of the research. 1. Prof T Greyling: University of
Johannesburg via the University Research Fund. 2.
Dr Stephanie Rossouw: Auckland University of
Technology via the Faculty of Business, Economics
and Law. The funders had no role in study design,
data collection and analysis, decision to publish, or
preparation of the manuscript.
Competing interests: The authors have declared
that no competing interests exist.

directions. Health was positively affected by the lockdown since it limited the spread of Covid-
19. At the stage of writing the paper (3 June 2020), the number of new Covid-19 cases were
nearly 120,000 (John Hopkins University [5]). On the other hand, the economic outlook of the
country, and therefore peoples’ incomes, was negatively affected. This opposite effect has led
to significant debates on the value of the implementation of the lockdown.
Furthermore, South Africa implemented one of the most stringent lockdown regulations
(comparable to the Philippines and Jordan), which exacerbated the costs to well-being and the
economy while already experiencing a severe economic downturn. Therefore, South Africa is
an example of an extreme country case which unfortunately amplifies the effects of the difficult
choices made by policymakers. Therefore, we take advantage of this unique country case and
determine how stringent lockdown regulations impact happiness during a one in 100-year
event.
In South Africa, there are five levels of differing lockdown regulations, with alert level 5
being the most stringent and alert level 1 the most relaxed. The idea behind these levels is to
curb the spread of Covid-19 and give time to South Africa’s health system to prepare itself.
Additionally, as they move down in levels, South Africans receive increasingly more of their
previous liberties back. During level 5, which was announced 23 March 2020 and implemented
on 27 March 2020, South Africans were only allowed to leave their homes to purchase or pro-
duce essential goods. All South Africans were instructed to work from home, there was no
travel allowed, the sale of alcohol and tobacco were banned, people were not allowed to exer-
cise outside their homes, and the police and defence force ensured compliance to the restric-
tions. South Africa moved to level 4 lockdown on 01 May 2020. With this move, they received
back the ability to exercise outside from 6 am—9 am, purchase more than just essential goods,
including food deliveries as long as it was within curfew.
Interestingly, the sale of alcohol and tobacco was still banned. On 01 June they moved to
level 3, allowing restricted sales of alcohol (Mondays to Thursdays) and the re-opening of cer-
tain businesses. However, the services industry, especially beauty and tourism, remained
closed. At the time of writing this paper, South Africa was still under level 3 lockdown.
Whereas everybody understands that the Covid-19 infections curve needs to be flattened,
there are grave concerns that these stringent lockdown regulations will also flatline South Afri-
ca’s well-being and economy. Before the Covid-19 lockdown, South Africa’s average happiness
levels were 6.32 compared to an average of 7.23 and 7.16 in Australia and New Zealand,
respectively (Greyling et al. [2]). Furthermore, South Africa had a 29 per cent unemployment
rate, and the gross domestic product (GDP) has been estimated to shrink by 7 per cent in 2020
(Bureau of Economic Analysis [6]). According to the South African Reserve Bank [7], an addi-
tional 3 to 7 million people can potentially become unemployed as a direct consequence of the
pandemic, thereby increasing unemployment rates to approximately 50 per cent. The coun-
try’s sovereign credit rating was downgraded to junk status in March 2020, which impacted on
political stability, the level of the national debt and debt interest payments. Add to this already
grim situation, the fact that consumption of South Africans has been declining in 2020, with a
significant decrease seen after lockdown, then one can very easily see how the well-being and
happiness levels in South Africa can plummet.
2.2 Happiness
Why should we care whether people’s happiness is adversely impacted by not only a global
pandemic but also by the response from the government? The studies of Helliwell, Layard,
Stiglitz et al., Veenhoven, Diener and Seligman and others [8–12], have shown beyond a
shadow of a doubt that if policymakers want to maximise the quality of life of their citizens,
PLOS ONE Impact of lockdowns on well-being
PLOS ONE | https://doi.org/10.1371/journal.pone.0245546 January 22, 2021 3 / 18
they need to consider subjective measures of well-being. Piekalkiewicz [13] states that happi-
ness may act as a determinant of economic outcomes: it increases productivity, predicts one’s
future income and affects labour market performance. By measuring happiness, individuals
themselves reveal their preference and assigned priority to various domains, which cannot be
identified by a measure such as GDP. As was pointed out by Layard [9], while economists use
exactly the right framework for thinking about public policy, the accounts we use of what
makes people happy are wrong. In layman’s terms, we say that utility increases with the oppor-
tunities for voluntary exchange. However, Layard [14] argues that this overlooks the signifi-
cance of involuntary interactions between people. Policymakers should formulate policy to
maximise happiness or well-being, as is the main aim of many constitutions. This can be
achieved by directing economic, social, political and environmental policy to maximise well-
being while acknowledging that people’s norms, aspirations, feelings and emotions are impor-
tant. Thereby underscoring that understanding and measuring happiness should be an integral
part of the efforts to maximise the quality of life.
On the other hand, if people’s happiness is negatively affected, such as it was in the wake of
the Covid-19 pandemic and the implementation of lockdown regulations, there are far-reach-
ing consequences.
These consequences are as follows:
i. Social capital: unhappier people display less altruistic behaviour in the long run (Dunn et al.
[15]). They are also less active, less creative, poor problem solvers, less social, and display
more anti-social behaviour (Lyubomirsky et al. [16]). If unhappier people display more
anti-social behaviour, South Africa could see an increase in behaviour such as unrests, vio-
lent strikes and perhaps higher crime rates.
ii. Health care: unhappier people are less physically healthy and die sooner (Lyubomirsky
et al. [16]). Additionally, unhappy people engage in riskier behaviour such as smoking and
drinking, thereby placing unnecessary pressure on national health systems.
iii. Economic: unhappy workers are typically less productive, in particular in jobs that require
sociability and problem solving (Bryson et al. [17]). If an economy can raise the rate of
growth of productivity, by ensuring their workers are happier, then the trend growth of
national output can pick up.
2.3 Literature on the determinants of happiness during a lockdown
Having established that policymakers should strive to maximise the happiness of their people,
it is necessary to know what determines happiness. Previous studies have investigated, at a
macro-level, what influences happiness and found that economic growth, unemployment and
inflation play a significant role (Stevenson and Wolfers, Perović, Sacks et al. [18–20]). How-
ever, these studies were conducted during ’normal’ periods and not under such conditions
that are currently plaguing the world. The current study will have the opportunity to investi-
gate this exact question, namely what determines happiness during a lockdown driven by a
global health pandemic.
Naturally, the number of studies being conducted to examine the effect of Covid-19 is
growing exponentially. This increasing interest in the effect of a global pandemic as well as the
policies implemented by governments on peoples’ well-being, come on the back of relatively
few studies conducted during prior pandemics such as SARS and the H1N1. When SARS hit
in 2002 and then again when H1N1 hit in 2009, scholars were only truly starting to understand
that for governments to formulate policies to increase well-being, you needed to measure well-
PLOS ONE Impact of lockdowns on well-being
PLOS ONE | https://doi.org/10.1371/journal.pone.0245546 January 22, 2021 4 / 18
being. Of the current studies being conducted on the effect of Covid-19 or lockdown regula-
tions on all affected domains, not many studies are in a position to use real-time Big Data,
such as we do.
In layman’s terms, Big Data is a phrase used to describe a massive volume of both struc-
tured (for example stock information) and unstructured data (for example tweets) generated
through information and communication technologies such as the Internet (Rossouw and
Greyling [1]). At the time of writing this paper, the following studies were closest aligned with
our study and focused on:
i. nationwide lockdown on institutional trust, attitudes to government, health and well-being,
using survey data collected at two points in time (December 2019 and April 2020) (1003
respondents) (Sibley et al. [21]). Their preliminary results showed a small increase in peo-
ple’s sense of community and trust. However, they also found an increase in anxiety/depres-
sion post-lockdown and hinted at longer-term challenges to mental health.
ii. the happiness of married and single people while in government-imposed lockdown by
running simulations to formulate predictions, using Google Trends data (Hamermesh [3]).
Not surprisingly, married people were more satisfied with life than single people.
iii. the timing of decision-making by politicians to release lockdown based on a comparison
of economic benefits with the social and psychological benefits versus the cost, increase in
deaths if policymakers released lockdown too early (Layard et al. [22])
iv. the stages of GNH using a Markov switching model in New Zealand (Rossouw et al. [23]).
They found that happiness was at a lower level and the unhappy state lasted longer than
was expected. Furthermore, they found that the factors important for New Zealand’s hap-
piness post-Covid-19 were related to international travel, employment and mobility.
v. exploring Covid-19 related determinants of life dissatisfaction and feelings of anxiety in a
cross-country study using survey data collected between 23 March and 30 April (de Pedraza
et al. [24]). They found that persons with poorer general health, without employment, living
without a partner, not exercising daily and those actively seeking out loneliness report
higher dissatisfaction and higher anxiety. Additionally, they found that the effect of Covid-
19 on dissatisfaction and anxiety levels off with a higher number of cases.
2.4 Literature on the causal effect of a lockdown
To the knowledge of the authors, there are only two papers that investigated the causal effect
between lockdowns and population well-being. Brodeur et al. [4] investigated the changes in
well-being (and mental health) in the United States and Europe after a lockdown was imple-
mented, using Google Trends data. They found an increase in searches for loneliness, worry
and sadness, which indicated a negative effect on mental health. Greyling et al. [2] conducted a
cross-country study investigating the effect of lockdown on happiness. They found that lock-
down caused a negative effect on happiness, notwithstanding the different characteristics of
the countries (South Africa, New Zealand and Australia), the duration and the type of lock-
down regulations. When they compared the effect size of the lockdown regulations, they
found that South Africa, with the most stringent lockdown regulations incurred the greatest
happiness costs.
Brodeur et al. [4] study analysed data from one Big Data source, Google Trends and col-
lected data for a short period between only 01 January 2019 and 10 April 2020 in countries
that had introduced a full lockdown by the end of this period. Greyling et al. [2] study used
PLOS ONE Impact of lockdowns on well-being
PLOS ONE | https://doi.org/10.1371/journal.pone.0245546 January 22, 2021 5 / 18

both Google Trends and the GNH index but did not investigate the determinants of happiness
after lockdown for an extreme country case.
In summary, taking all of the above into consideration, there is not one study which deter-
mines causality between lockdown and happiness and analyses the determinants of happiness inan extreme country case using real-time, Big Data. Therefore, our study is the first of its kind.
3. Data and methodology
3.1 Data
To estimate the causal effects of a lockdown on happiness, we use a Difference-in-Difference
(DiD) approach (see section 3.3.1). The technique compares happiness (dependent variable),
before and after the treatment (the lockdown) to a counterfactual time period in the year
before. For the control period, we select the same time period, with the same number of days
in 2019, corresponding to the number of days in 2020, thus 152 days in each year (01 January
2020 to 03 June 2020, excluding 29 February 2020). Our results should thus be interpreted as
the average impact of the lockdown on happiness, comparing pre and post-lockdown in 2020
to the same time period in 2019, which we assume had normal levels of Gross National Happi-
ness (see a discussion on the GNH in section 3.2.1). In this manner, we also account for sea-
sonal trends in happiness.
In the analyses, we make use of daily data for South Africa. As high-frequency data available
at almost real-time, is scarce, we make use of novel Big Data methodologies to harvest data.
Additionally, we use the Oxford Stringency dataset that was released in May 2020, which
includes data related to lockdown regulations, such as time-series data on the stay-at-home
index, Covid-19 cases and Covid-19 deaths (Hale et al., Roser et al. [25, 26]).
3.2 Selection of variables
The selection of the variables included in our estimations is based on the reviewed literature,
the contents of tweets related to the lockdown and data availability.
3.2.1 Gross National Happiness Index–the dependent variable. To measure happiness
(the dependent variable), we make use of the Gross National Happiness Index (GNH), which
was launched in April 2019 (Greyling, Rossouw and Afstereo [27]). This project measures the
happiness (mood) of a country’s citizens during different economic, social and political events.
Since February 2020, the researchers extended the project that initially analysed the senti-
ment of tweets, to incorporate the analysis of the emotions underpinning tweets. The team did
this to determine which emotions are most prominent on specific days or events.
To construct the GNH index, the researchers use Big Data methods and extract tweets from
the voluntary information-sharing social media platform Twitter. Big Data, such as Twitter,
provides real-time information for policymakers to assist them when facing short-term dead-
lines with imperfect information. Big Data also allows governments to ’listen’ and capture
those variables which their citizens deem to be important for their well-being, rather than rely-
ing on pre-defined economic utility theories. Big Data offers governments the opportunity to
observe people’s behaviour and not just their opinions. This approach of revealed preferences
unveils a reflexive picture of society because it allows the main concerns of citizens (and the
priority ranking of those concerns) to emerge spontaneously, and it complements as such the
information captured by gross domestic product. Lastly, Big Data does not suffer from non-
response bias (Callegaro and Yang [28]).
Greyling, Rossouw and Afstereo [27] apply sentiment analysis to a live Twitter-feed and
label every tweet as having either a positive, neutral or negative sentiment. This sentiment clas-
sification is then applied to a sentiment-balance algorithm to derive a happiness score. The
PLOS ONE Impact of lockdowns on well-being
PLOS ONE | https://doi.org/10.1371/journal.pone.0245546 January 22, 2021 6 / 18

happiness scores range between 0 and 10, with five being neutral, thus neither happy nor
unhappy.
All tweets per day are extracted, and a happiness score per hour is calculated. The index is
available live on the GNH website (Greyling, Rossouw and Afstereo [27]). In South Africa, the
average number of tweets extracted for 2020 is 68,524 per day. South Africa has approximately
11 million Twitter users, representing almost 18 per cent of the population (Omnicore [29]).
Although the number of tweets is extensive and represents significant proportions of the popu-
lations of the countries, it is not representative. However, Twitter accommodates individuals,
groups of individuals, organisations and media outlets, representing a kind of disaggregated
sample, thus giving access to the moods of a vast blend of Twitter users, not found in survey
data.
Furthermore, purely based on the vast numbers of the tweets, it seems that the GNH index
gives a remarkably robust reflection of the evaluative mood of a nation. Also, we correlate the
GNH index with ’depression’ and ’anxiety’, derived from the 'Global behaviors and perceptionsat the onset of the Covid-19 Pandemic data’ survey, for the period from 01 March 2020 (OFS
[30]). We find it negative and statistically significant related, therefore, it seems that the GNH
index derived from Big Data gives similar trends to survey data. (We would have appreciated
the opportunity to correlate the GNH to a happiness measure–but a happiness measure, as
such, was not included in the survey).
Considering the GNH index over time, we found that the index accurately reflects a
nation’s emotions, for example, when South Africa won the Rugby World Cup on 02 Novem-
ber 2019, the happiness index accurately depicted the joy experienced by South Africans (Fig
1). The hourly happiness score was 7.9 at 13:00, the highest score ever measured, at the exact
time that the final whistle was blown to announce the victory of the Springboks over England.
Also, when the famous American basketball player, Kobe Bryant and his daughter Gigi,
tragically passed away on 27 January 2020, the happiness index once again captured the
Fig 1. Hourly happiness levels of South Africans during the Rugby World Cup final match. Source: Authors’ calculations using GNH dataset (Greyling et al. [27]).
https://doi.org/10.1371/journal.pone.0245546.g001
PLOS ONE Impact of lockdowns on well-being
PLOS ONE | https://doi.org/10.1371/journal.pone.0245546 January 22, 2021 7 / 18
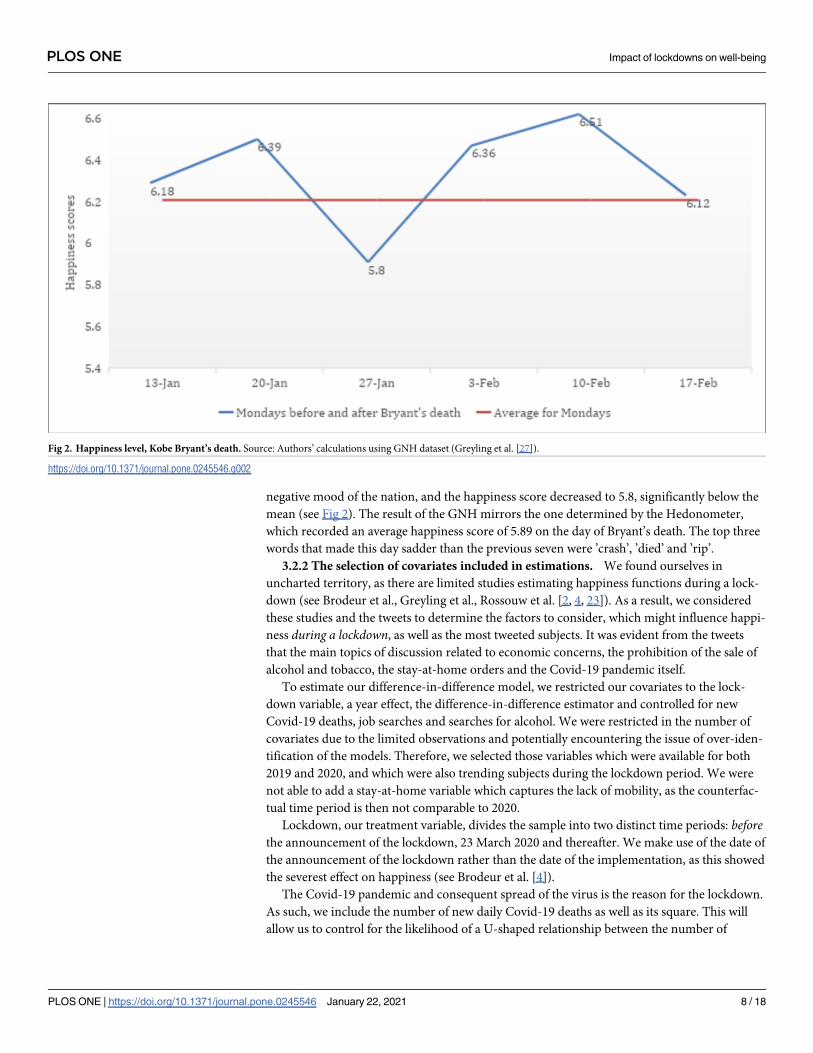
negative mood of the nation, and the happiness score decreased to 5.8, significantly below the
mean (see Fig 2). The result of the GNH mirrors the one determined by the Hedonometer,
which recorded an average happiness score of 5.89 on the day of Bryant’s death. The top three
words that made this day sadder than the previous seven were ’crash’, ’died’ and ’rip’.
3.2.2 The selection of covariates included in estimations. We found ourselves in
uncharted territory, as there are limited studies estimating happiness functions during a lock-
down (see Brodeur et al., Greyling et al., Rossouw et al. [2, 4, 23]). As a result, we considered
these studies and the tweets to determine the factors to consider, which might influence happi-
ness during a lockdown, as well as the most tweeted subjects. It was evident from the tweets
that the main topics of discussion related to economic concerns, the prohibition of the sale of
alcohol and tobacco, the stay-at-home orders and the Covid-19 pandemic itself.
To estimate our difference-in-difference model, we restricted our covariates to the lock-
down variable, a year effect, the difference-in-difference estimator and controlled for new
Covid-19 deaths, job searches and searches for alcohol. We were restricted in the number of
covariates due to the limited observations and potentially encountering the issue of over-iden-
tification of the models. Therefore, we selected those variables which were available for both
2019 and 2020, and which were also trending subjects during the lockdown period. We were
not able to add a stay-at-home variable which captures the lack of mobility, as the counterfac-
tual time period is then not comparable to 2020.
Lockdown, our treatment variable, divides the sample into two distinct time periods: beforethe announcement of the lockdown, 23 March 2020 and thereafter. We make use of the date of
the announcement of the lockdown rather than the date of the implementation, as this showed
the severest effect on happiness (see Brodeur et al. [4]).
The Covid-19 pandemic and consequent spread of the virus is the reason for the lockdown.
As such, we include the number of new daily Covid-19 deaths as well as its square. This will
allow us to control for the likelihood of a U-shaped relationship between the number of
Fig 2. Happiness level, Kobe Bryant’s death. Source: Authors’ calculations using GNH dataset (Greyling et al. [27]).
https://doi.org/10.1371/journal.pone.0245546.g002
PLOS ONE Impact of lockdowns on well-being
PLOS ONE | https://doi.org/10.1371/journal.pone.0245546 January 22, 2021 8 / 18

Covid-19 deaths and happiness. Furthermore, there is likely a lagged effect on happiness due
to Covid-19 deaths being reported in the media only the following day. Therefore, we lag these
variables by one day. We derive the data from the Oxford Stringency data set (Hale et al. and
Roser et al. [25, 26]).
To measure jobs (a proxy for future job uncertainty) and the sale of alcohol and tobacco, we
use the methodology as set out by Nuti et al. and Brodeur et al. [4, 31] and use daily searches
on Google Trends (see also Simionescu and Zimmermann [7]). We considered searches for
both the alcohol and tobacco topic; however, the variables follow the same trends during the
lockdown period and are highly correlated (r = 0.83). We are, furthermore, restricted in the
number of covariates to include in the model and decided to include only ’alcohol’ in the esti-
mations. We justify this decision since the ban of alcohol affects a larger proportion of the pop-
ulation. It is estimated that 41 per cent of males and 17.1 per cent of females consume on
average 9.3 litres of alcohol per capita annually whereas only 17.6 per cent smoke (Peltzer et al.
and Reddy et al. [32, 33]). However, as a robustness check, we also run all estimations using
the searches for tobacco.
It should be noted that when we use Google Trends data, it is expressed as an index between
0 and 100 with 0 being the "least" interest and 100 being the "most" interest shown in the topic
for the year. However, the series are not comparable across years as the underlying data is
sourced from different search requests for each of the two years. To address this, we use a scal-
ing procedure outlined in Brodeur et al. [4]. First, we generate "weekly" interest weights for
each day by expressing the average weekly score that a particular daily score fell on, as a pro-
portion of the average yearly score. Then, we multiply the daily scores with these weights to
obtain weighted search trends. Finally, we normalise these weighted search trends to render us
a score between 0 and 100, which is comparable across years.
Other topics that are trending are related to the ’stay-at-home’ orders. The Oxford Strin-
gency dataset includes a time series variable on the stay-at-home orders. It differs on a day to
day basis according to its stringency. It is an ordinal variable plus binary of geographic scope.
It takes the value 0 if there are no stay-at-home orders and 1 if the government recommends
not leaving your house. Value 2 represents people not leaving their homes with the exceptions
of daily exercise, grocery shopping, and ’essential’ trips. Not leaving your home with minimal
exceptions (e.g. allowed to leave only once a week, or only one person can leave at a time, etc.)
takes the value 3 (Hale et al. [25]).
Furthermore, we include the number of tweets per day, as it forms part of the Twitter data
extracted daily for South Africa (Greyling et al. [27]), which is a proxy for connectivity. It also
gauges the opportunity cost of not being able to have face to face interactions, which seems to be
negatively related to happiness (Chae and Wilson et al. [34, 35]). Interestingly the number of
tweets increased markedly during the lockdown period, from an average of 60,708 to 80,000
tweets per day. Table 1 provides descriptive statistics for the variables included in the estimations.
3.3 Methodology
3.3.1 Difference-in-Difference. To investigate the causal effect of the lockdown on happi-
ness, as mentioned in section 3.1, we use a Difference-in-Difference estimator (DiD) which
compares the GNH for pre and post-lockdown periods in 2020 to a time period assumed to
have normal happiness levels in 2019. Specifically, we estimate the following equation:
GNHi;t ¼ a0 þ a1lockdowni � Year þþa2NewDailyDeathsi;t� 1 þ a3NewDailyDeaths2
i;t� 1lockdowni;t þ mi
þ si þ �i;t ð1Þ
PLOS ONE Impact of lockdowns on well-being
PLOS ONE | https://doi.org/10.1371/journal.pone.0245546 January 22, 2021 9 / 18
Where GNHit is the daily happiness for South Africa at time t. The treatment variable lock-
down takes the value of 0 pre-announcement day (23 March) and one post-announcement of
lockdown in both the year of the actual lockdown (2020) as well as the year before the lock-
down (2019). Year is a dummy variable where 1 is the year 2020. We control for new deaths
per million with a one-day lag as well as the quadratic effect of new deaths per million on
GNH. Additionally, we control for the effect of job and alcohol searches. As a robustness test,
we use the number of new Covid-19 cases instead of new Covid-19 deaths (see Table 4 in S1
Appendix).
Our main coefficient of interest is the interaction between the lockdown and the year vari-
able. If it is found to be significant, it provides evidence of a causal effect of the lockdown on
the dependent variable, in the current year, notwithstanding the trend in 2019.
3.3.2 OLS regression. To determine which factors, matter to happiness after the lock-
down, we estimate the following equation:
yt ¼ a0 þ a1Xt þ mt ð2Þ
Here, yt refers to the Gross National Happiness Index (GNH) for each day and Xt is a vector
of several relevant covariates to account for the changes in the happiness levels during the lock-
down period. μt is the error term.
Due to the various factors that affect happiness, some of our independent variables may be
correlated with the error term, leading to endogeneity concerns. Depending on the direction
of the correlation between the error term and the X-variable, the coefficient could be biased
upwards or downwards. For instance, the coefficient on the indicator for jobs is likely biased
upwards as it, in all likelihood, shows the effect of concerns about jobs as well as some other
negative economic shock on happiness. In the absence of panel data or an appropriate instru-
ment, it is difficult to ascertain causality to Eq (2). However, simply correlating the covariates
and the error term we find all levels of correlation to be less than 0.3, although a very basic test,
this still indicates that the likelihood that endogeneity might bias estimations is relatively
small. A natural extension of the work, as better data becomes available with time, would be to
address these concerns.
We cannot rule out the probability of autocorrelation and heterogeneity in our data, espe-
cially due to its time-series nature. We use robust standard errors to account for this. The
choice of our controls, however, comes with a caveat. Seeing as we only have 81 daily observa-
tions using a larger battery of covariates would lead to problems arising due to overfitting of
the model. This issue is considered in Green [36], who suggests a minimum of 50 observations
for any regressions as well as an additional eight observations per additional term. As a robust-
ness test, we included tobacco rather than alcohol products (see Table 5 in S1 Appendix).
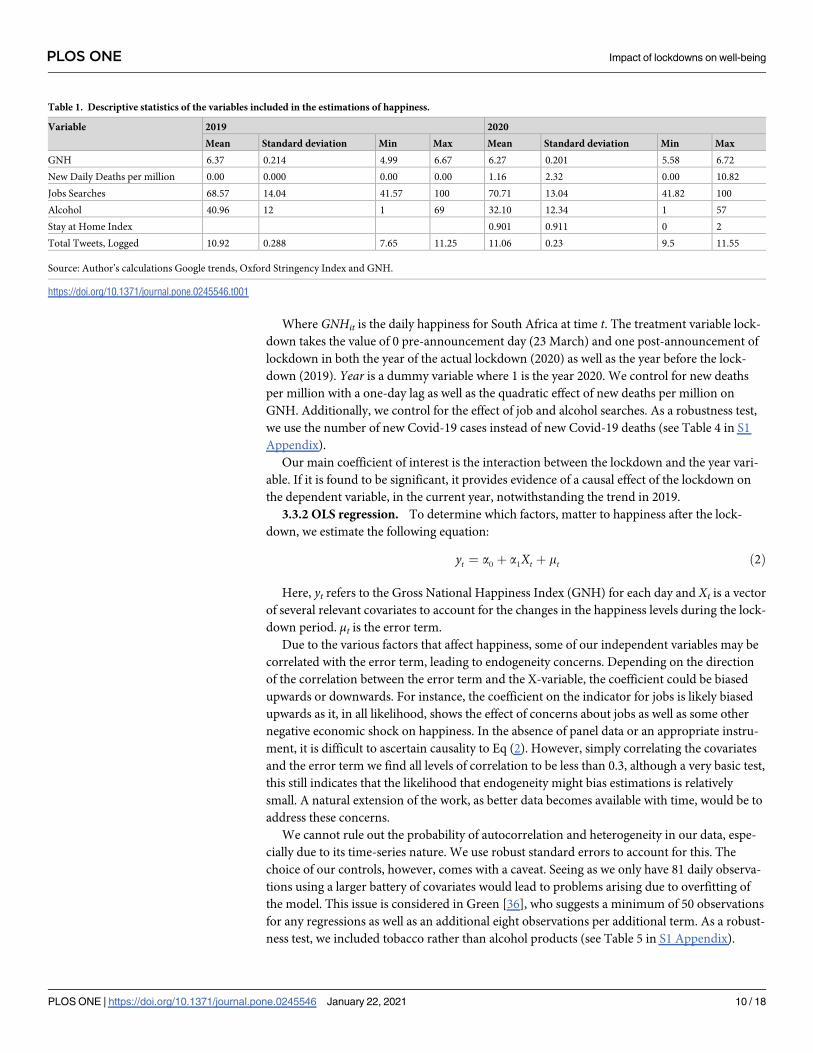
Table 1. Descriptive statistics of the variables included in the estimations of happiness.
Variable 2019 2020
Mean Standard deviation Min Max Mean Standard deviation Min Max
GNH 6.37 0.214 4.99 6.67 6.27 0.201 5.58 6.72
New Daily Deaths per million 0.00 0.000 0.00 0.00 1.16 2.32 0.00 10.82
Jobs Searches 68.57 14.04 41.57 100 70.71 13.04 41.82 100
Alcohol 40.96 12 1 69 32.10 12.34 1 57
Stay at Home Index 0.901 0.911 0 2
Total Tweets, Logged 10.92 0.288 7.65 11.25 11.06 0.23 9.5 11.55
Source: Author’s calculations Google trends, Oxford Stringency Index and GNH.
https://doi.org/10.1371/journal.pone.0245546.t001
PLOS ONE Impact of lockdowns on well-being
PLOS ONE | https://doi.org/10.1371/journal.pone.0245546 January 22, 2021 10 / 18
4. Results and analysis
4.1 Difference-in-Difference estimation
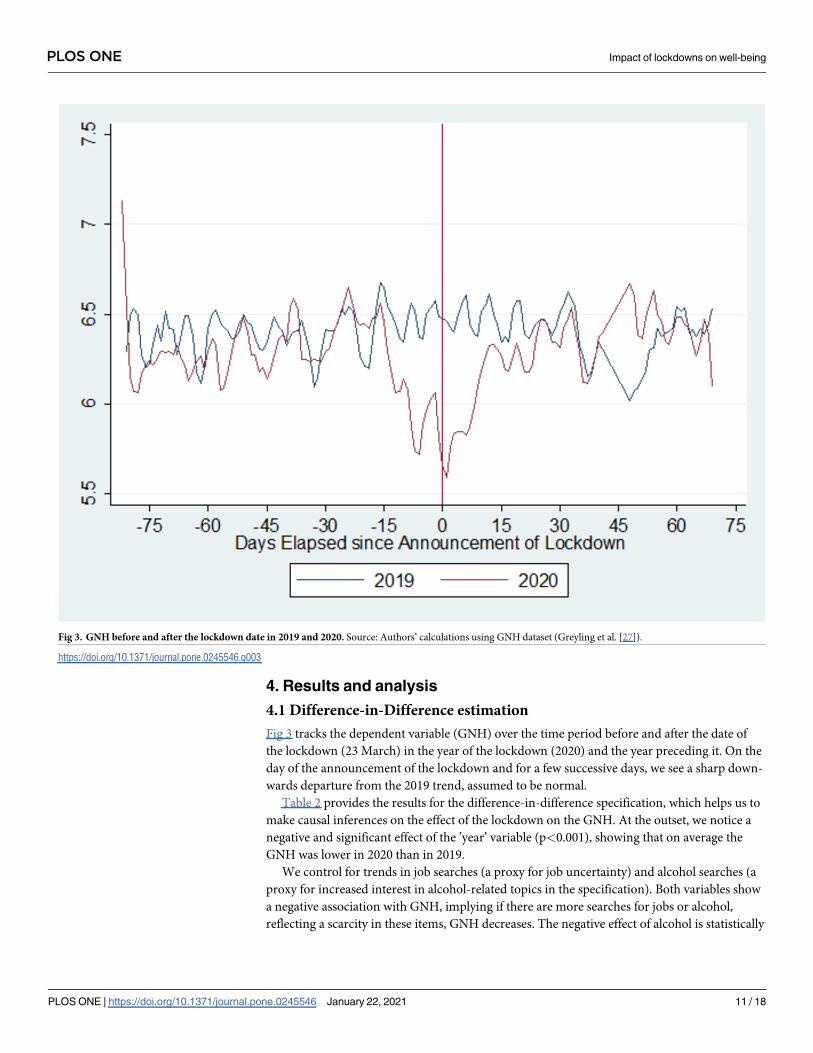
Fig 3 tracks the dependent variable (GNH) over the time period before and after the date of
the lockdown (23 March) in the year of the lockdown (2020) and the year preceding it. On the
day of the announcement of the lockdown and for a few successive days, we see a sharp down-
wards departure from the 2019 trend, assumed to be normal.
Table 2 provides the results for the difference-in-difference specification, which helps us to
make causal inferences on the effect of the lockdown on the GNH. At the outset, we notice a
negative and significant effect of the ’year’ variable (p<0.001), showing that on average the
GNH was lower in 2020 than in 2019.
We control for trends in job searches (a proxy for job uncertainty) and alcohol searches (a
proxy for increased interest in alcohol-related topics in the specification). Both variables show
a negative association with GNH, implying if there are more searches for jobs or alcohol,
reflecting a scarcity in these items, GNH decreases. The negative effect of alcohol is statistically
Fig 3. GNH before and after the lockdown date in 2019 and 2020. Source: Authors’ calculations using GNH dataset (Greyling et al. [27]).
https://doi.org/10.1371/journal.pone.0245546.g003
PLOS ONE Impact of lockdowns on well-being
PLOS ONE | https://doi.org/10.1371/journal.pone.0245546 January 22, 2021 11 / 18

significant at the 1% level (p<0.001). We also control for lagged new Covid-19 related deaths
and lagged new Covid-19 related deaths squared, both are significant (p<0.001). Interesting is
the finding of the significant inverted U-shaped relationship between new Covid-19 deaths
and happiness (Fig 4). In the earlier stages of the pandemic, with very few new Covid-19
deaths, it appears that people were positive and optimistic as the fatality rates were very low
and the recovery rates very high. However, as time progressed, the higher fatality rates turned
the relationship around so that the number of new Covid-19 cases were negatively related to
happiness.
To determine if the decrease in GNH was due to the lockdown (the treatment) specifically
and not just due to the year trend, we must consider the estimated coefficient of the interaction
variable ’lockdown and year’. We report a negative and statistically significant coefficient (p-
value 0.064) on the interaction variable, indicating that ’lockdown’ caused, on average a
decrease in GNH of 0.101 points when compared to its mean values for average 2019 values,
controlling for the general trend in the two years. Thus, we can conclude that the lockdown
caused a decline in GNH in 2020 compared to 2019. The decline of 0.101 may seem small at
first but given the low general levels of happiness in South Africa compared to other countries
(Greyling et al. [27]) the reduction is substantial.
4.2 Regression analysis
To address the second research question, namely, to determine the factors that are related to
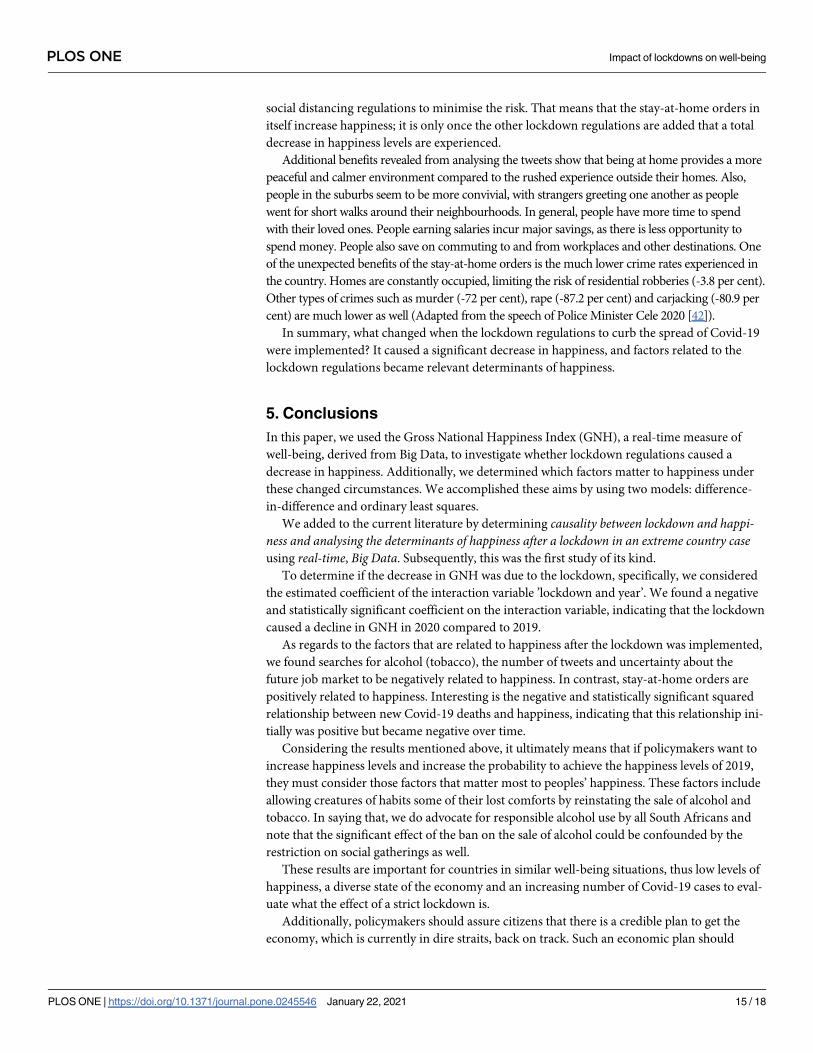
happiness after the lockdown was implemented, we consider the results of Table 3.
Table 3 shows that job searches (p-value 0.09), searches for alcohol (p-value<0.001) and the
number of tweets is negatively related to happiness. In contrast, the stay-at-home index is posi-
tively related to happiness (p-value<0.001). The squared relationship between new Covid-19
deaths and happiness is negative and statistically significant (p-value<0.001), indicating that
this relationship changed over time as was highlighted in section 4.1. Suppose we consider the
relatively low mortality rate (0.02 per cent of confirmed cases in the early stages) compared to
countries such as the USA (3.9 per cent), the U.K. (15.4 per cent) and Spain (9.4 per cent). In
that case, it could explain the initial positive relationship between the number of new Covid-19
Table 2. Difference-in-Difference estimation.
(1)
Dependent Variable: GNH Coefficient S.E.
Lockdown�Year -0.101� (0.055)
Year -0.173��� (0.027)
Job Searches -0.001 (0.0008)
Alcohol -0.003��� (0.0008)
Lagged Covid-19 Deaths per million 0.166��� (0.023)
Lagged Covid-19 Deaths per million Squared -0.016��� (0.002)
Lockdown F.E. Yes
Constant 6.60��� (0.05)
N 304
Adjusted R2 0.26
Robust Standard errors in parentheses Alcohol represents “lack of beer”
� p< 0.10
�� p< 0.05
��� p< 0.01
https://doi.org/10.1371/journal.pone.0245546.t002
PLOS ONE Impact of lockdowns on well-being
PLOS ONE | https://doi.org/10.1371/journal.pone.0245546 January 22, 2021 12 / 18
Fig 4. GNH vs deaths per million.
https://doi.org/10.1371/journal.pone.0245546.g004
Table 3. Determinants of happiness during the lockdown.
Dependent Variable: GNH Coefficient S.E.
Job Searches -0.0037� (0.002)
Alcohol -0.0040��� (0.001)
Log Tweets -0.3682��� (0.099)
Stay at Home Index 0.2186��� (0.034)
Lagged Covid-19 Deaths per million 0.0095��� (0.004)
Lagged Covid-19 Deaths per million squared -0.0002��� (0.00007)
Unhappiest Week F.E. Yes Yes
Constant 9.8720��� (1.172)
N 81
Adjusted R2 0.76
Robust Standard errors in parentheses
� p< 0.10
�� p< 0.05
��� p< 0.01
https://doi.org/10.1371/journal.pone.0245546.t003
PLOS ONE Impact of lockdowns on well-being
PLOS ONE | https://doi.org/10.1371/journal.pone.0245546 January 22, 2021 13 / 18

deaths and happiness. Although as time passed and the death rate increased (currently, the
mortality rate is at 1.5 per cent of confirmed cases), this relationship became negative. As a
robustness test, we used the number of new Covid-19 cases and its square instead of the new
Covid-19 deaths and found similar results (see Table 4 in S1 Appendix).
As expected, job searches, a proxy for uncertainty about the future job market is negatively
related to happiness (p-value<0.001). Analysing the tweets, we realised that this is a major
concern, which is closely related to economic concerns. The economic performance of South
Africa in the last year has been weak with high levels of unemployment (increase to 50 per
cent), low growth rates (GDP is expected to contract with 7 per cent in 2020) and high debt to
income ratios (government debt as a percentage of GDP– 80 per cent). In a recent survey con-
ducted by Statistics South Africa on behavioural and health impacts of the Covid-19 pandemic
(Statistics South Africa [37]), it was found that 95 per cent of the respondents were very con-
cerned about the economy. In contrast, only 60 per cent was concerned about the Covid-19
pandemic itself. This supports our current findings in that economic factors matter more to
South Africans happiness levels than Covid-19 itself.
Alcohol-related searches are also found to be negatively related to happiness (p-
value<0.001). Considering the close correlation between alcohol and tobacco products, we
can assume that what holds for alcohol products, also holds for tobacco products. As a robust-
ness test, we excluded the alcohol variable and included searches for tobacco variable and
found very similar results (see Table 5 in S1 Appendix). South Africa is one of the very few
countries globally that have banned alcohol and tobacco sales during the Covid-19 pandemic.
It is argued that these products contribute to the negative effects of the virus. The banning of
these products had severe implications on different levels of society. Individuals see this as a
major infringement of their human rights, negatively affecting their happiness. Furthermore,
research done by Sommer et al. [38] proved that because of the presence of hordenine in beer,
it significantly contributes to mood-elevation. In South Africa, which is well-known for its
high per capita beer and alcohol consumption (Statistics South Africa [39]), also related to
’socialising’, the ban on these products had a severe negative effect on happiness. Even in level
3, when the ban on alcohol sales was lifted, but still restricted, we found this negative
relationship.
The restricted sale of alcohol and tobacco has indirect consequences for South Africans
happiness via the economic impact since these industries are two of the largest industries in
South Africa. They employ people across the whole supply chain from production to retail.
Due to the ban on these industries, people can potentially lose their jobs. Lastly, the govern-
ment sector forgoes all taxes on these products. This is against the backdrop of the recent
downgrade of South Africa’s debt rating to junk status in an already very uncertain fiscal envi-
ronment. If all of these factors are aggregated, we can understand that the cumulative effect of
the banning and restriction of sales of these products severely decreases the happiness levels.
In Table 5 in S1 Appendix, we use tobacco searches instead of alcohol to estimate the determi-
nants of happiness, which gives us results that are qualitatively similar to Table 3.
The number of tweets is negatively related to happiness (p-value<0.001). Previous research
has shown that increases in the use of social media are negatively related to happiness (Rolland
et al., Chae and Wilson et al. [34, 40, 41]). Noteworthy is that the number of tweets during the
lockdown period increased significantly from an average of 60,708 per day before the lock-
down to 80,000 per day after the lockdown indicating that more people used social media dur-
ing the lockdown period.
Interesting is the result of the stay-at-home orders being positively related to happiness (p-
value<0.001). On analysing the contents of the tweets, we find the following. South Africans
are wary of contracting Covid-19, and therefore, they abide by the stay-at-home orders and
PLOS ONE Impact of lockdowns on well-being
PLOS ONE | https://doi.org/10.1371/journal.pone.0245546 January 22, 2021 14 / 18
social distancing regulations to minimise the risk. That means that the stay-at-home orders in
itself increase happiness; it is only once the other lockdown regulations are added that a total
decrease in happiness levels are experienced.
Additional benefits revealed from analysing the tweets show that being at home provides a more
peaceful and calmer environment compared to the rushed experience outside their homes. Also,
people in the suburbs seem to be more convivial, with strangers greeting one another as people
went for short walks around their neighbourhoods. In general, people have more time to spend
with their loved ones. People earning salaries incur major savings, as there is less opportunity to
spend money. People also save on commuting to and from workplaces and other destinations. One
of the unexpected benefits of the stay-at-home orders is the much lower crime rates experienced in
the country. Homes are constantly occupied, limiting the risk of residential robberies (-3.8 per cent).
Other types of crimes such as murder (-72 per cent), rape (-87.2 per cent) and carjacking (-80.9 per
cent) are much lower as well (Adapted from the speech of Police Minister Cele 2020 [42]).
In summary, what changed when the lockdown regulations to curb the spread of Covid-19
were implemented? It caused a significant decrease in happiness, and factors related to the
lockdown regulations became relevant determinants of happiness.
5. Conclusions
In this paper, we used the Gross National Happiness Index (GNH), a real-time measure of
well-being, derived from Big Data, to investigate whether lockdown regulations caused a
decrease in happiness. Additionally, we determined which factors matter to happiness under
these changed circumstances. We accomplished these aims by using two models: difference-
in-difference and ordinary least squares.
We added to the current literature by determining causality between lockdown and happi-ness and analysing the determinants of happiness after a lockdown in an extreme country caseusing real-time, Big Data. Subsequently, this was the first study of its kind.
To determine if the decrease in GNH was due to the lockdown, specifically, we considered
the estimated coefficient of the interaction variable ’lockdown and year’. We found a negative
and statistically significant coefficient on the interaction variable, indicating that the lockdown
caused a decline in GNH in 2020 compared to 2019.
As regards to the factors that are related to happiness after the lockdown was implemented,
we found searches for alcohol (tobacco), the number of tweets and uncertainty about the
future job market to be negatively related to happiness. In contrast, stay-at-home orders are
positively related to happiness. Interesting is the negative and statistically significant squared
relationship between new Covid-19 deaths and happiness, indicating that this relationship ini-
tially was positive but became negative over time.
Considering the results mentioned above, it ultimately means that if policymakers want to
increase happiness levels and increase the probability to achieve the happiness levels of 2019,
they must consider those factors that matter most to peoples’ happiness. These factors include
allowing creatures of habits some of their lost comforts by reinstating the sale of alcohol and
tobacco. In saying that, we do advocate for responsible alcohol use by all South Africans and
note that the significant effect of the ban on the sale of alcohol could be confounded by the
restriction on social gatherings as well.
These results are important for countries in similar well-being situations, thus low levels of
happiness, a diverse state of the economy and an increasing number of Covid-19 cases to eval-
uate what the effect of a strict lockdown is.
Additionally, policymakers should assure citizens that there is a credible plan to get the
economy, which is currently in dire straits, back on track. Such an economic plan should
PLOS ONE Impact of lockdowns on well-being
PLOS ONE | https://doi.org/10.1371/journal.pone.0245546 January 22, 2021 15 / 18

stimulate growth, create job opportunities and increase employment rates, supply the neces-
sary infrastructure and deal with curbing vast budget deficits and debt burdens. Hopefully,
such policies will fuel the dying embers of a dying economy and increase well-being levels.
Lastly, it would be remiss of us not to note the limitations of the study. First, we were
restricted in the number of covariates we could add to our difference-in-difference model due
to the limited observations and therefore potentially overidentifying the models. Second,
regarding the inverted U-shaped relationship between new Covid-19 deaths and happiness, we
acknowledge that there might be confounding factors at play, initially seen as ‘positives’ of the
lockdown, but later turned into negatives. However, using alternative sets of covariates in the
regression analyses, the inverted U-shape between new Covid-19 deaths and happiness
remained. Therefore we trust that the revealed relationship is robust.
Supporting information
S1 Appendix. Robustness checks.
(DOCX)
S1 Data.
(DTA)
Acknowledgments
We would like to thank our colleagues Professor Emeritus John Knight from Oxford Univer-
sity and Dr Kelsey O’Connor from STATEC Luxembourg, for their generosity in providing
feedback on the study.
Author Contributions
Conceptualization: Talita Greyling, Stephanie Rossouw.
Data curation: Talita Greyling, Stephanie Rossouw, Tamanna Adhikari.
Formal analysis: Talita Greyling, Tamanna Adhikari.
Investigation: Talita Greyling, Stephanie Rossouw, Tamanna Adhikari.
Methodology: Talita Greyling, Stephanie Rossouw, Tamanna Adhikari.
Project administration: Talita Greyling, Stephanie Rossouw.
Resources: Talita Greyling.
Software: Talita Greyling, Stephanie Rossouw.
Supervision: Talita Greyling, Stephanie Rossouw.
Validation: Talita Greyling, Tamanna Adhikari.
Visualization: Talita Greyling, Tamanna Adhikari.
Writing – original draft: Talita Greyling, Stephanie Rossouw, Tamanna Adhikari.
Writing – review & editing: Talita Greyling, Stephanie Rossouw, Tamanna Adhikari.
References1. Rossouw S. & Greyling T. (2020). Big Data and Happiness. Invited chapter for the Handbook of Labor,
Human Resources and Population Economics. Edited by Zimmermann Klaus F.
PLOS ONE Impact of lockdowns on well-being
PLOS ONE | https://doi.org/10.1371/journal.pone.0245546 January 22, 2021 16 / 18
2. Greyling T, Rossouw S, Adhikari T. A tale of three countries: How did Covid-19 lockdown impact happi-
ness? GLO Discussion Paper; 2020.
3. Hamermesh DS. Lockdowns, loneliness and life satisfaction. National Bureau of Economic Research;
2020 Apr 16. https://doi.org/10.1007/s11150-020-09495-x PMID: 32837455
4. Brodeur A, Clark AE, Fleche S, Powdthavee N. Assessing the impact of the coronavirus lockdown on
unhappiness, loneliness, and boredom using Google Trends. arXiv preprint arXiv:2004. 12129. 2020
Apr 25.
5. John Hopkins University. Coronavirus Resource Centre. (2020). Available at https://coronavirus.jhu.
edu/map.html Accessed 08 May 2020.
6. Bureau of Economic Research (2020). Available from https://www.ber.ac.za/BER%20Documents/
Economic-Prospects/?doctypeid=1059 Accessed 08 June 2020
7. Simionescu M, Zimmermann KF. Big data and unemployment analysis. GLO Discussion Paper; 2017.
8. Helliwell JF. The Economics of Happiness. The National Bureau of Economic Research. 2015. Reporter
2:14–17.
9. Layard R. Happiness and public policy: A challenge to the profession. The Economic Journal. 2006 Mar
1; 116(510):C24–33.
10. Stevenson B, Wolfers J. Economic growth and subjective well-being: Reassessing the Easterlin para-
dox. National Bureau of Economic Research; 2008 Aug 29.
11. Stiglitz JE, Sen A, Fitoussi JP. Report by the commission on the measurement of economic perfor-
mance and social progress. 2009.
12. Diener E, Seligman ME. Beyond money: Toward an economy of well-being. Psychological science in
the public interest. 2004 Jul; 5(1):1–31. https://doi.org/10.1111/j.0963-7214.2004.00501001.x PMID:
26158992
13. Piekalkiewicz M. Why do economists study happiness? The Economic and Labour Relations Review.
2017 Sep; 28(3):361–77.
14. Layard R. Happiness: Lessons from a new science. Penguin UK; 2011 Apr 7.
15. Dunn EW, Aknin LB, Norton MI. Prosocial spending and happiness: Using money to benefit others pays
off. Current Directions in Psychological Science. 2014 Feb; 23(1):41–7.
16. Lyubomirsky S, Sheldon KM, Schkade D. Pursuing happiness: The architecture of sustainable change.
Review of general psychology. 2005 Jun; 9(2):111–31.
17. Bryson A, Clark AE, Freeman RB, Green CP. Share capitalism and worker wellbeing. Labour Econom-
ics. 2016 Oct 1; 42:151–8. https://doi.org/10.1016/j.labeco.2016.09.002 PMID: 28725118
18. Statistics South Africa. Behavioural and health impacts of the COVID-19 pandemic in South Africa.
2020. Available at http://www.statssa.gov.za/publications/Report-00-80-02/Report-00-80-022020.pdf
Accessed 08 June 2020
19. Perović LM. Subjective Economic Well-being in Transition Countries: Investigating the Relative Impor-
tance of Macroeconomic Variables. Financial Theory and Practice. 2008; 32(4):519–37.
20. Sacks DW, Stevenson B, Wolfers J. Subjective Well-Being, Income, Economic Development, and
Growth. In Annual World Bank Conference on Development Economics 2011: Development Chal-
lenges in a Post-crisis World 2013 Oct 11 (p. 283). World Bank Publications.
21. Sibley CG, Greaves L, Satherley N, Wilson MS, Lee C, Milojev P, et al. Short-term effects of the
COVID-19 pandemic and a nationwide lockdown on institutional trust, attitudes to government, health
and wellbeing. American Psychological Association. 2020.
22. Layard R, Clark AE, De Neve JE, Krekel C, Fancourt D, Hey N, et al. When to Release the Lockdown?
A Wellbeing Framework for Analysing Costs and Benefits. IZA Discussion Papers; 2020.
23. Rossouw S, Greyling T, Adhikari T, Morrison PS. Markov switching models for happiness during a pan-
demic: The New-Zealand experience. GLO Discussion Paper; 2020.
24. de Pedraza P, Guzi M, Tijdens K. Life Dissatisfaction and Anxiety in COVID-19 pandemic. GLO Discus-
sion Paper; 2020.
25. Hale T, Petherick A, Phillips T, Webster S. Variation in government responses to COVID-19. Blavatnik
School of Government Working Paper. 2020 May 27;31
26. Roser, M., Ritchie, H., Ortiz-Ospina, E. & Hasell, J. Coronavirus Pandemic (COVID-19) 2020. Available
at https://ourworldindata.org/coronavirus Accessed on 18 June 2020.
27. Greyling T, Rossouw S, Afstereo. Gross National Happiness Index. The University of Johannesburg
and Afstereo [producers]. 2019. Available at http://gnh.today. Accessed 08 May 2020.
28. Callegaro M, Yang Y. The role of surveys in the era of "Big Data". In The Palgrave handbook of survey
research 2018 (pp. 175–192). Palgrave Macmillan, Cham.
PLOS ONE Impact of lockdowns on well-being
PLOS ONE | https://doi.org/10.1371/journal.pone.0245546 January 22, 2021 17 / 18
29. Omnicore. Omnicore Agency. Available at https://www.omnicoreagency.com/ Accessed on 26 Febru-
ary 2020.
30. OFS. Global Behaviors and Perceptions in the COVID-19 Pandemic. 2020. Available at https://osf.io/
g7fn9/ Accessed on 08 May 2020.
31. Nuti SV, Wayda B, Ranasinghe I, Wang S, Dreyer RP, Chen SI, et al. The use of google trends in health
care research: a systematic review. PloS one. 2014 Oct 22; 9(10):e109583. https://doi.org/10.1371/
journal.pone.0109583 PMID: 25337815
32. Peltzer K, Davids A, Njuho P. Alcohol use and problem drinking in South Africa: findings from a national
population-based survey. African journal of psychiatry. 2011; 14(1). https://doi.org/10.4314/ajpsy.v14i1.
65466 PMID: 21509408
33. Reddy P, Zuma K, Shisana O, Jonas K, Sewpaul R. Prevalence of tobacco use among adults in South
Africa: results from the first South African National Health and Nutrition Examination Survey. South Afri-
can Medical Journal. 2015 Dec 9; 105(8):648–55. https://doi.org/10.7196/samjnew.7932 PMID:
26449697
34. Chae J. Reexamining the relationship between social media and happiness: The effects of various
social media platforms on reconceptualized happiness. Telematics and Informatics. 2018 Sep 1; 35
(6):1656–64.
35. Wilson RE, Gosling SD, Graham LT. A review of Facebook research in the social sciences. Perspec-
tives on psychological science. 2012 May; 7(3):203–20. https://doi.org/10.1177/1745691612442904
PMID: 26168459
36. Green SB. How many subjects does it take to do a regression analysis? Multivariate behavioral
research. 1991 Jul 1; 26(3):499–510. https://doi.org/10.1207/s15327906mbr2603_7 PMID: 26776715
37. Statistics South Africa. Beer is more popular than vegetables. 2017. http://www.statssa.gov.za/?p=
10269 Accessed 04 May 2020.
38. South African Reserve Bank (2020). Available from https://www.resbank.co.za/Research/Statistics/
Pages/Statistics-Home.aspx 08 June 2020
39. Sommer T, Hubner H, El Kerdawy A, Gmeiner P, Pischetsrieder M, Clark T. Identification of the beer
component hordenine as food-derived dopamine D2 receptor agonist by virtual screening a 3D com-
pound database. Scientific reports. 2017 Mar 10; 7:44201. https://doi.org/10.1038/srep44201 PMID:
28281694
40. Rolland B, Haesebaert F, Zante E, Benyamina A, Haesebaert J, Franck N. Global changes and factors
of increase in caloric/salty food, screen, and substance use, during the early COVID-19 containment
phase in France: a general population online survey. JMIR public health and surveillance. 2020.
41. Veenhoven R. How do we assess how happy we are? Tenets, implications and tenability of three theo-
ries. Happiness, economics and politics. 2009:45–69.
42. Crime levels before South Africa’s lockdown–and what they look like now. Business Tech. 2020 April
23. Available from https://businesstech.co.za/news/lifestyle/391877/crime-levels-before-south-africas-
lockdown-and-what-they-look-like-now/
PLOS ONE Impact of lockdowns on well-being
PLOS ONE | https://doi.org/10.1371/journal.pone.0245546 January 22, 2021 18 / 18