The Goldman Guide - baystreet.ca · The Goldman Guide Goldman Small Cap Research The Goldman Guide ...
8
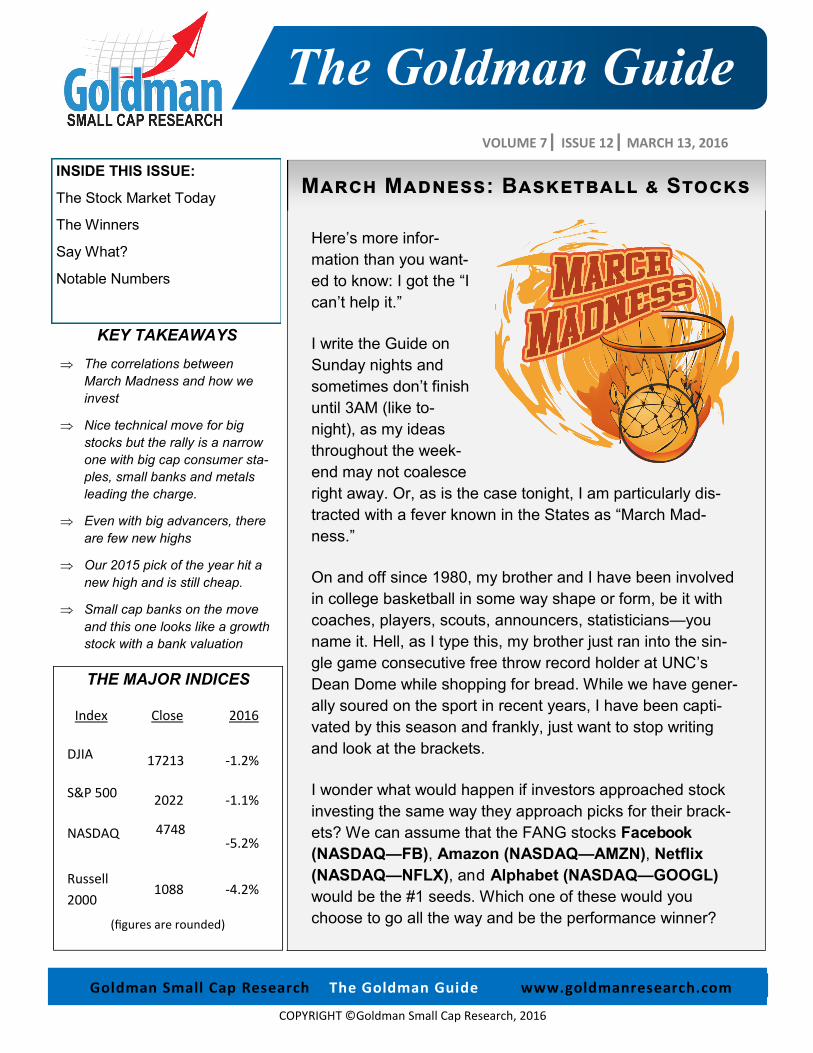
The Goldman Guide Goldman Small Cap Research The Goldman Guide www.goldmanresearch.com COPYRIGHT ©Goldman Small Cap Research, 2016 March Madness: Basketball & Stocks Here’s more infor- mation than you want- ed to know: I got the “I can’t help it.” I write the Guide on Sunday nights and sometimes don’t finish until 3AM (like to- night), as my ideas throughout the week- end may not coalesce right away. Or, as is the case tonight, I am particularly dis- tracted with a fever known in the States as “March Mad- ness.” On and off since 1980, my brother and I have been involved in college basketball in some way shape or form, be it with coaches, players, scouts, announcers, statisticians—you name it. Hell, as I type this, my brother just ran into the sin- gle game consecutive free throw record holder at UNC’s Dean Dome while shopping for bread. While we have gener- ally soured on the sport in recent years, I have been capti- vated by this season and frankly, just want to stop writing and look at the brackets. I wonder what would happen if investors approached stock investing the same way they approach picks for their brack- ets? We can assume that the FANG stocks Facebook (NASDAQ—FB), Amazon (NASDAQ—AMZN), Netflix (NASDAQ—NFLX), and Alphabet (NASDAQ—GOOGL) would be the #1 seeds. Which one of these would you choose to go all the way and be the performance winner? INSIDE THIS ISSUE: The Stock Market Today The Winners Say What? Notable Numbers VOLUME 7| ISSUE 12| MARCH 13, 2016 KEY TAKEAWAYS The correlations between March Madness and how we invest Nice technical move for big stocks but the rally is a narrow one with big cap consumer sta- ples, small banks and metals leading the charge. Even with big advancers, there are few new highs Our 2015 pick of the year hit a new high and is still cheap. Small cap banks on the move and this one looks like a growth stock with a bank valuation THE MAJOR INDICES Index Close 2016 DJIA 17213 -1.2% S&P 500 2022 -1.1% NASDAQ 4748 -5.2% Russell 2000 1088 -4.2% (figures are rounded)
Transcript of The Goldman Guide - baystreet.ca · The Goldman Guide Goldman Small Cap Research The Goldman Guide ...
The Goldman Guide
Goldman Small Cap Research The Goldman Guide www.goldmanresearch.com
COPYRIGHT ©Goldman Small Cap Research, 2016
March Madness: Basketball & Stocks
Here’s more infor-
mation than you want-
ed to know: I got the “I
can’t help it.”
I write the Guide on
Sunday nights and
sometimes don’t finish
until 3AM (like to-
night), as my ideas
throughout the week-
end may not coalesce
right away. Or, as is the case tonight, I am particularly dis-
tracted with a fever known in the States as “March Mad-
ness.”
On and off since 1980, my brother and I have been involved
in college basketball in some way shape or form, be it with
coaches, players, scouts, announcers, statisticians—you
name it. Hell, as I type this, my brother just ran into the sin-
gle game consecutive free throw record holder at UNC’s
Dean Dome while shopping for bread. While we have gener-
ally soured on the sport in recent years, I have been capti-
vated by this season and frankly, just want to stop writing
and look at the brackets.
I wonder what would happen if investors approached stock
investing the same way they approach picks for their brack-
ets? We can assume that the FANG stocks Facebook
(NASDAQ—FB), Amazon (NASDAQ—AMZN), Netflix
(NASDAQ—NFLX), and Alphabet (NASDAQ—GOOGL)
would be the #1 seeds. Which one of these would you
choose to go all the way and be the performance winner?
INSIDE THIS ISSUE:
The Stock Market Today
The Winners
Say What?
Notable Numbers
VOLUME 7| ISSUE 12| MARCH 13, 2016
KEY TAKEAWAYS
The correlations between
March Madness and how we
invest
Nice technical move for big
stocks but the rally is a narrow
one with big cap consumer sta-
ples, small banks and metals
leading the charge.
Even with big advancers, there
are few new highs
Our 2015 pick of the year hit a
new high and is still cheap.
Small cap banks on the move
and this one looks like a growth
stock with a bank valuation
THE MAJOR INDICES
Index Close 2016
DJIA 17213 -1.2%
S&P 500 2022 -1.1%
NASDAQ 4748
-5.2%
Russell
2000 1088 -4.2%
(figures are rounded)
The Goldman Guide
Goldman Small Cap Research The Goldman Guide www.goldmanresearch.com
COPYRIGHT ©Goldman Small Cap Research, 2016
March Madness (cont’d)
And if you select only #1 seeds to make it to the Final Four does that mean that you
have a preference for FANG stocks and not underdogs or microcap stocks? If your
bracket is filled with 12 seeds beating 5 seeds and 13 seeds beating 4 seeds, are you a
risk taker, a small cap or penny stock lover, or do you just root for the underdog?
Perhaps you think that the fix is in for the investment pros and that games are being
played at the expense of the little guy. After all, in this year’s NCAA Men’s National Bas-
ketball Tournament offers so many odd matchups. The Maryland Terrapins (tortoise)
play the South Dakota State Jackrabbits (hare). Venerable teams that never play each
other may be forced to next week. (See: Indiana/Kentucky, Notre Dame/Michigan.) The
University of Virginia plays Hampton. I could go on. Do these games make us watch
more? If games are played in the stock market does that move us to invest or trade
more to take advantage of or try beat the system?
We all have favorite teams and favorite stocks and our moods can change dramatically
with the rise and fall of these maddening groups. How do we distance ourselves emo-
tionally?
Look, this country was based upon the success of the little guy, the underdog and we
would happily cheer it. Unfortunately, judging by the low volumes and lagging perfor-
mance in small cap and micro cap stocks, and the interest and movement in the FANG
stocks and their brethren, it appears that we are too easily drawn to leaders just due to
name and reputation alone. The net result is biblical in nature: interest and performance
beget volume and rises in stock prices while the laggards, well, lag.
The longer the small stocks lag, the harder and longer it will take until things change,
especially if big stock performance is in the green while small stock performance is in
the red. However, all good things must come to an end and if there is one thing for cer-
tain, it is that leaders eventually lag and laggards eventually lead. The key is to follow,
root, and be ready to leave the comfortable confines of the favorites and side with the
underdogs when the tides begin to turn. And that tide may soon be upon us.
The Goldman Guide
Goldman Small Cap Research The Goldman Guide www.goldmanresearch.com
COPYRIGHT ©Goldman Small Cap Research, 2016
The Stock Market Today
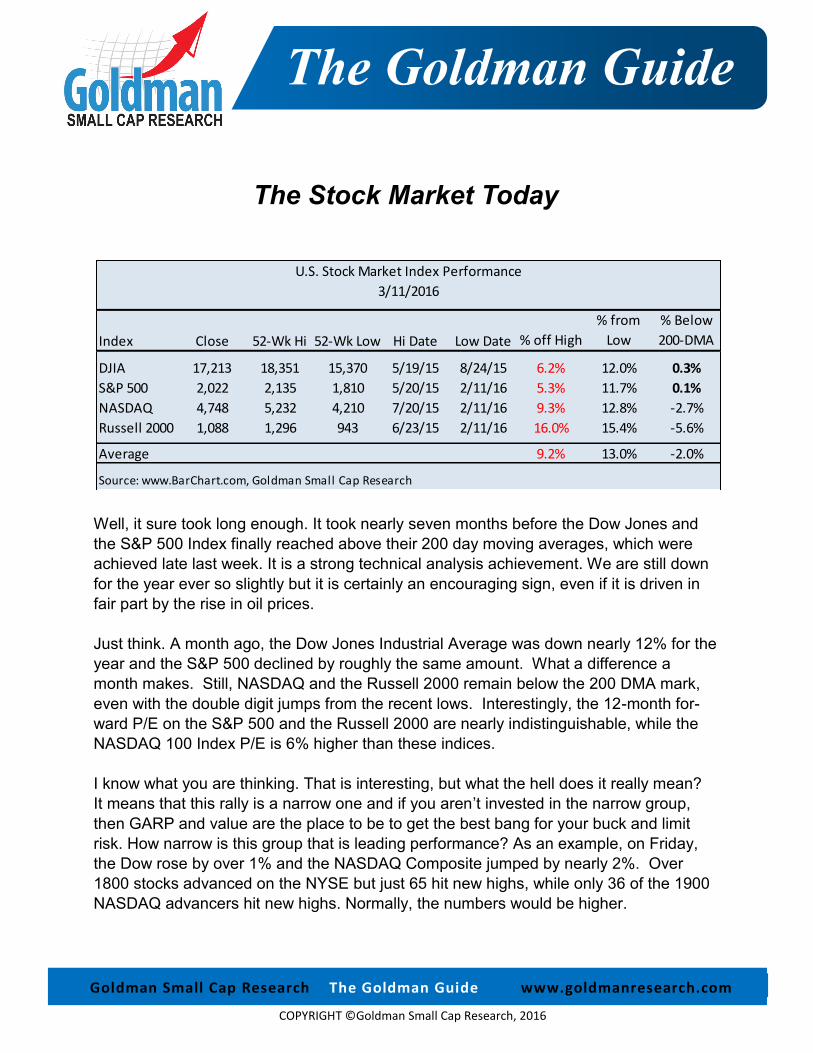
Well, it sure took long enough. It took nearly seven months before the Dow Jones and
the S&P 500 Index finally reached above their 200 day moving averages, which were
achieved late last week. It is a strong technical analysis achievement. We are still down
for the year ever so slightly but it is certainly an encouraging sign, even if it is driven in
fair part by the rise in oil prices.
Just think. A month ago, the Dow Jones Industrial Average was down nearly 12% for the
year and the S&P 500 declined by roughly the same amount. What a difference a
month makes. Still, NASDAQ and the Russell 2000 remain below the 200 DMA mark,
even with the double digit jumps from the recent lows. Interestingly, the 12-month for-
ward P/E on the S&P 500 and the Russell 2000 are nearly indistinguishable, while the
NASDAQ 100 Index P/E is 6% higher than these indices.
I know what you are thinking. That is interesting, but what the hell does it really mean?
It means that this rally is a narrow one and if you aren’t invested in the narrow group,
then GARP and value are the place to be to get the best bang for your buck and limit
risk. How narrow is this group that is leading performance? As an example, on Friday,
the Dow rose by over 1% and the NASDAQ Composite jumped by nearly 2%. Over
1800 stocks advanced on the NYSE but just 65 hit new highs, while only 36 of the 1900
NASDAQ advancers hit new highs. Normally, the numbers would be higher.
Index Close 52-Wk Hi 52-Wk Low Hi Date Low Date % off High
% from
Low
% Below
200-DMA
DJIA 17,213 18,351 15,370 5/19/15 8/24/15 6.2% 12.0% 0.3%
S&P 500 2,022 2,135 1,810 5/20/15 2/11/16 5.3% 11.7% 0.1%
NASDAQ 4,748 5,232 4,210 7/20/15 2/11/16 9.3% 12.8% -2.7%
Russell 2000 1,088 1,296 943 6/23/15 2/11/16 16.0% 15.4% -5.6%
Average 9.2% 13.0% -2.0%
Source: www.BarChart.com, Goldman Small Cap Research
U.S. Stock Market Index Performance
3/11/2016
The Goldman Guide
Goldman Small Cap Research The Goldman Guide www.goldmanresearch.com
COPYRIGHT ©Goldman Small Cap Research, 2016
The Winners
So, what kinds of stocks are hitting these new highs? They aren’t necessarily your mo-
mentum plays per se, that trade at nosebleed valuations. On the country, many are lag-
gards. For example, automated inspection technology leader Orbotech (NASDAQ—
ORBK—$23.81) one of my all-time faves and our small cap pick of the year in 2015 not
only hit a new 52-week high Friday but reached its highest point since 2007! Logic
would dictate that it means ORBK is at a high valuation. Au contraire mon frere. Even at
current levels the stock trades at less than 10x its $2.45 projected 2016 EPS estimate, a
17% rise from last year. For now, the stock looks like it can go to $28-29.
In terms of groups, we mentioned early in the year that small or regional banks would be
good plays sometime in 2016 and finally get their due. Right group, wrong time, as the
group has been on fire of late. As with ORBK, there are some enjoying huge growth
that indicate more daylight ahead, as they are behaving like growth stocks, yet trade at
favorable valuations.
A great example of this phenomenon is new 52-week high achiever Banc of California
(NASDAQ—BANC—$16.04), a bank with over 100 offices in California and the Western
states, and $8 billion in assets. Not only is the stock up 10% from a recently priced sec-
ondary offering, but the bank has redeemed high interest rate bonds, saving a chunk of
cash. If you only looked at its income statement, you would never think it is a bank. EPS
is forecast to rise 15% to $1.54 this year on a 30% jump in revenue, while EPS projec-
tions call for a 22% leap next year on a 20% increase in revenue.
At current levels, the stock trades just a hair above 10x this year’s EPS and 8.7x net
earnings per share for 2017. Plus, it pays a 3% dividend. To put this in perspective,
SHBI and FMNB, trade 17x and 13x this year ’s EPS, respectively. Granted, their EPS
growth rates are higher than the forecast for BANC. Still, BANC offers greater upside
and lower downside as typical P/Es tend to be in the mid-teens. We like the outlook for
the other stocks as well, but a 25% rise this year to $20 seems to be a safer bet to
BANC on. After all, it is like a growth stock with a bank stock valuation.
The Goldman Guide
Goldman Small Cap Research The Goldman Guide www.goldmanresearch.com
COPYRIGHT ©Goldman Small Cap Research, 2016
Say What?
Great info, insights, and hard-hitting stories make up this
week’s Say What? feature...
Bloomberg
http://www.bloomberg.com/news/articles/2016-03-13/ignored-for-years-a-radical-
economic-theory-is-gaining-converts
There is merit to this notion and I can see it impacting future policy and markets.
The Reformed Broker
http://thereformedbroker.com/2016/03/13/a-tech-powered-disinflationary-world/
Simple and accurate—and that phrase is just the beginning.
New York Post
http://nypost.com/2016/03/08/20-times-in-history-people-were-really-really-wrong-about-
technology/
This has been around for a few days but it is really amazing.
Marketwatch
http://www.marketwatch.com/story/what-investors-can-learn-from-how-they-read-the-
news-2016-03-09
Brilliant!
ZeroHedge
http://www.zerohedge.com/news/2016-03-12/visualizing-militarization-middle-east
Crazy, fascinating, and scary—all at the same time.
The Goldman Guide
Goldman Small Cap Research The Goldman Guide www.goldmanresearch.com
COPYRIGHT ©Goldman Small Cap Research, 2016
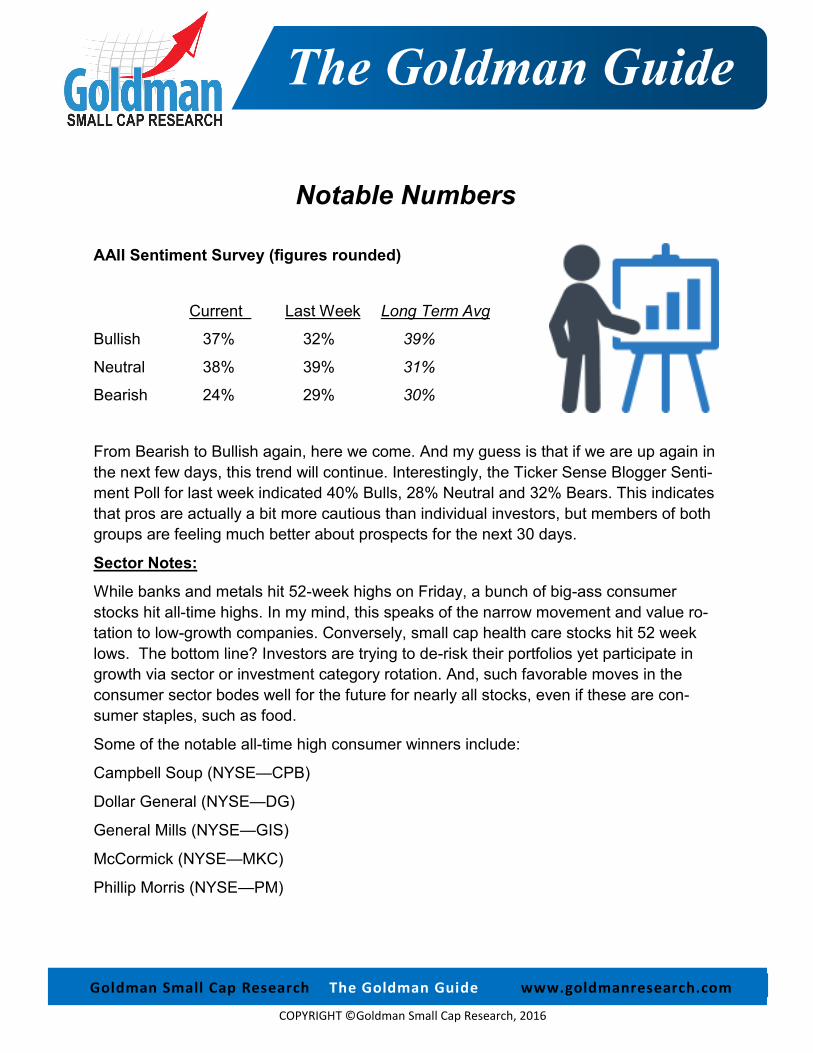
Notable Numbers
AAII Sentiment Survey (figures rounded)
Current Last Week Long Term Avg
Bullish 37% 32% 39%
Neutral 38% 39% 31%
Bearish 24% 29% 30%
From Bearish to Bullish again, here we come. And my guess is that if we are up again in
the next few days, this trend will continue. Interestingly, the Ticker Sense Blogger Senti-
ment Poll for last week indicated 40% Bulls, 28% Neutral and 32% Bears. This indicates
that pros are actually a bit more cautious than individual investors, but members of both
groups are feeling much better about prospects for the next 30 days.
Sector Notes:
While banks and metals hit 52-week highs on Friday, a bunch of big-ass consumer
stocks hit all-time highs. In my mind, this speaks of the narrow movement and value ro-
tation to low-growth companies. Conversely, small cap health care stocks hit 52 week
lows. The bottom line? Investors are trying to de-risk their portfolios yet participate in
growth via sector or investment category rotation. And, such favorable moves in the
consumer sector bodes well for the future for nearly all stocks, even if these are con-
sumer staples, such as food.
Some of the notable all-time high consumer winners include:
Campbell Soup (NYSE—CPB)
Dollar General (NYSE—DG)
General Mills (NYSE—GIS)
McCormick (NYSE—MKC)
Phillip Morris (NYSE—PM)
The Goldman Guide
Goldman Small Cap Research The Goldman Guide www.goldmanresearch.com
COPYRIGHT ©Goldman Small Cap Research, 2016
1498 Reisterstown Road, Suite 286 Baltimore Maryland 21208 Phone: 410.609.7100
[email protected] www.goldmanresearch.com
Launched in May 2010, The Goldman Guide is a free weekly publication of Goldman Small Cap Research and is written by Founder
Rob Goldman with contributions from the GSCR contributor team. This non-sponsored investment newsletter seeks to provide inves-
tors with market, economic, political and equity-specific insights via an action-oriented, straight to the point approach. No companies
mentioned in this newsletter are current sponsored research clients of the Company or its parent, unless noted, With some excep-
tions, all companies or investment ideas mentioned in this publication are publicly traded stocks listed either on the NYSE or the
NASDAQ. Goldman Small Cap Research members and contributors’ bios, certifications, and experience can be found on our web-
site: www.goldmanresearch.com .
Disclaimer
This newsletter was prepared for informational purposes only. Goldman Small Cap Research, (a division of Two Triangle Consulting
Group, LLC) produces non-sponsored and sponsored (paid) investment research. Goldman Small Cap Research is not affiliated in
any way with Goldman Sachs & Co.
The Firm’s non-sponsored research publications category, Select Research, reflects the Firm’s internally generated stock ideas, along
with economic, industry and market outlooks. In virtually all cases, stocks mentioned in Select Research offerings are listed on the
NYSE or the NASDAQ. Publications in this category include the weekly newsletter The Goldman Guide, Market Monitor blogs, Spe-
cial Reports, and premium products such as The 30-30 Report. Goldman Small Cap Research analysts are neither long nor short
stocks mentioned in this newsletter.
Opportunity Research reports, updates and Microcap Hot Topics articles reflect sponsored (paid) research but can also in-
clude non-sponsored microcap research ideas that typically carry greater risks than those stocks covered in Select Research catego-
ry. It is important to note that while we may track performance separately, we utilize many of the same coverage criteria in determining
coverage of all stocks in both research formats. Please view the company’s individual disclosures for each engagement, which can be
found in company-specific Opportunity Research reports, updates and articles.
Goldman Small Cap Research has not been compensated for any content in this issue.
All information contained in this newsletter and in our reports were provided by the companies mentioned via news releases, filings,
and their websites or generated from our own due diligence. Economic, market data and charts are provided by a variety of sources
and are cited upon publication. Stock performance data and information are derived from Yahoo! Finance and other websites or
sources, as noted. Our analysts are responsible only to the public, and are paid in advance to eliminate pecuniary interests, retain
editorial control, and ensure independence.
The information used and statements of fact made have been obtained from sources considered reliable but we neither guarantee nor
represent the completeness or accuracy. Goldman Small Cap Research did not make an independent investigation or inquiry as to
the accuracy of any information provided by the Company, other firms, or other financial news outlets. Goldman Small Cap Research
relied solely upon information provided by companies through filings, press releases, presentations, and through its own internal due
diligence for accuracy and completeness. Such information and the opinions expressed are subject to change without notice. A Gold-
man Small Cap Research report, update, article, blog, note, or newsletter is not intended as an offering, recommendation, or a solici-
tation of an offer to buy or sell the securities mentioned or discussed. This newsletter does not take into account the investment objec-
tives, financial situation, or particular needs of any particular person. This newsletter does not provide all information material to an
investor’s decision about whether or not to make any investment. Any discussion of risks in this presentation is not a disclosure of all
risks or a complete discussion of the risks mentioned. Neither Goldman Small Cap Research, nor its parent, is registered as a securi-
ties broker-dealer or an investment adviser with the FINRA or with any state securities regulatory authority. Statements herein may
contain forward-looking statements and are subject to significant risks and uncertainties affecting results.
The Goldman Guide
Goldman Small Cap Research The Goldman Guide www.goldmanresearch.com
COPYRIGHT ©Goldman Small Cap Research, 2016
1498 Reisterstown Road, Suite 286 Baltimore Maryland 21208 Phone: 410.609.7100
[email protected] www.goldmanresearch.com
Separate from the factual content of our articles about the company featured in this newsletter, we may from time to time include our own opinions about the companies profiled herein, their businesses, markets and opportunities. Any opinions we may offer about the companies are solely our own, and are made in reliance upon our rights under the First Amendment to the U.S. Constitution, and are provided solely for the general opinionated discussion of our readers. Our opinions should not be considered to be complete, precise, accurate, or current investment advice. Such information and the opinions expressed are subject to change without notice.
ALL INFORMATION IN THIS REPORT IS PROVIDED “AS IS” WITHOUT WARRANTIES, EXPRESSED OR IMPLIED, OR REPRESENTATIONS OF ANY KIND. TO THE FULLEST EXTENT PERMISSIBLE UNDER APPLICABLE LAW, TWO TRIANGLE CONSULTING GROUP, LLC WILL NOT BE LIABLE FOR THE QUALI-TY, ACCURACY, COMPLETENESS, RELIABILITY OR TIMELINESS OF THIS INFORMATION, OR FOR ANY DIRECT, INDIRECT, CONSEQUENTIAL, INCIDENTAL, SPECIAL OR PUNITIVE DAMAGES THAT MAY ARISE OUT OF THE USE OF THIS INFORMATION BY YOU OR ANYONE ELSE (INCLUDING, BUT NOT LIMITED TO, LOST PROFITS, LOSS OF OPPORTUNITIES, TRADING LOSSES, AND DAMAGES THAT MAY RESULT FROM ANY INACCURACY OR INCOMPLETENESS OF THIS INFORMATION). TO THE FULLEST EXTENT PERMITTED BY LAW, TWO TRIANGLE CONSULTING GROUP, LLC WILL NOT BE LIABLE TO YOU OR ANYONE ELSE UNDER ANY TORT, CONTRACT, NEGLIGENCE, STRICT LIABIL-ITY, PRODUCTS LIABILITY, OR OTHER THEORY WITH RESPECT TO THIS PRESENTATION OF INFOR-MATION.
For more information, visit our Disclaimer: www.goldmanresearch.com