THE GLOBAL OBSERVING SYSTEM FOR CLIMATE: …
341
THE GLOBAL OBSERVING SYSTEM FOR CLIMATE: IMPLEMENTATION NEEDS GCOS-200 (GOOS-214)
Transcript of THE GLOBAL OBSERVING SYSTEM FOR CLIMATE: …

THE GLOBAL OBSERVING
SYSTEM FOR CLIMATE:
IMPLEMENTATION NEEDS
GCOS-200(GOOS-214)
THE
GLO
BA
L O
BSE
RV
ING
SY
STEM
FO
R C
LIM
ATE
: IM
PLE
MEN
TATI
ON
NEE
DS
GCO
S-2
00
(G
OO
S-21
4)
GLOBAL CLIMATE OBSERVING SYSTEM
GCOS Secretariat | c/o World Meteorological Organization
7 bis, avenue de la Paix | P.O. Box 2300 | CH-1211 Geneva 2 | Switzerland
Tel. : +41 (0) 22 730 8275/8067 | Fax : +41 (0) 22 730 8052 | E-mail: [email protected]
http://gcos.wmo.int


THE GLOBAL OBSERVING
SYSTEM FOR CLIMATE:
IMPLEMENTATION NEEDS
GCOS-200 (GOOS-214)

©World Meteorological Organization, 2016
Approved by the GCOS Steering Committee at its 24th meeting in Guayaquil, Ecuador, in
October 2016 and submitted to the UNFCCC at COP22, Marrakesh November 2016.
NOTE
The designations employed in WMO publications and the presentation of material in this publication
do not imply the expression of any opinion whatsoever on the part of WMO concerning the legal
status of any country, territory, city or area, or of its authorities, or concerning the delimitation of its
frontiers or boundaries.
The mention of specific companies or products does not imply that they are endorsed or
recommended by WMO in preference to others of a similar nature which are not mentioned or
advertised.
The findings, interpretations and conclusions expressed in WMO publications with named authors
are those of the authors alone and do not necessarily reflect those of WMO or its Members.

GCOS 2016 Implementation Plan
- iii -
TABLE OF CONTENTS
Preface ........................................................................................................................................................ vi
Foreword ................................................................................................................................................... viii
Executive Summary ...................................................................................................................................... x
PART I. Broad context: meeting the needs of the UNFCCC, adaptation and climate services and
climate science ..............................................................................................................................1
1. INTRODUCTION ................................................................................................................................... 3
2. Implementation ................................................................................................................................... 9
3. Observations for Adaptation, Mitigation and Climate Indicators ....................................................... 21
3.1 Adaptation ....................................................................................................................................... 21
3.2 Mitigation ........................................................................................................................................ 27
3.3 Climate Indicators ............................................................................................................................ 28
4. THE BROADER RELEVANCE OF CLIMATE OBSERVATIONS ................................................................... 31
4.1. Rio Conventions ............................................................................................................................... 31
4.2. Agenda 2030 and the Sustainable Development Goals ................................................................. 32
4.3 Ramsar Convention ......................................................................................................................... 33
4.4 Sendai Framework for Disaster Risk Reduction 2015-2030 ........................................................... 34
5. CONSISTENT OBSERVATIONS ACROSS THE EARTH SYSTEM CYCLES .................................................... 36
6. CAPACITY DEVELOPMENT AND REGIONAL AND NATIONAL SUPPORT ............................................... 39
6.1 The GCOS Cooperation Mechanism ................................................................................................ 39
6.2 National coordination ..................................................................................................................... 40
6.3 Regional activities ............................................................................................................................ 41
6.4 Information and communication .................................................................................................... 42
PART II: Detailed implementation ................................................................................................ 43
1. INTRODUCTION ................................................................................................................................. 45
2. OVERARCHING AND CROSS-CUTTING ACTIONS ................................................................................. 47
2.1. Requirements for climate observations ......................................................................................... 47
2.2. Planning, review and oversight ....................................................................................................... 49
2.3 Data management, stewardship and access .................................................................................. 51
2.4 Production of Integrated ECV products .......................................................................................... 56
2.5 Ancillary and additional observations ............................................................................................ 62
3. ATMOSPHERIC CLIMATE OBSERVING SYSTEM ................................................................................... 66
3.1 Atmospheric domain – near-surface variables ............................................................................... 67
3.2 Atmospheric domain – upper-air .................................................................................................... 79
3.3 Atmospheric domain – composition ............................................................................................... 94
3.4 Atmospheric domain – scientific and technological challenges ................................................... 105
4. OCEANIC CLIMATE OBSERVING SYSTEM .......................................................................................... 108
4.1 Overview ........................................................................................................................................ 108
4.2 Oceanic domain: physical .............................................................................................................. 122
4.3 Oceanic domain: biogeochemistry ................................................................................................ 131
4.4 Oceanic domain: biology/ecosystems .......................................................................................... 139
4.5 Key elements of the sustained ocean observing system for climate .......................................... 144
5. TERRESTRIAL CLIMATE OBSERVING SYSTEM .................................................................................... 164
5.1 Introduction ................................................................................................................................... 164
5.2 General terrestrial actions ............................................................................................................ 173

GCOS 2016 Implementation Plan
- iv -
5.3 Hydrosphere .................................................................................................................................. 177
5.4 Cryosphere ..................................................................................................................................... 186
5.5 Biosphere ....................................................................................................................................... 196
5.6 Human use of natural resources ................................................................................................... 215
5.7 Potential for latent and sensible heat flux from land to be an ECV ............................................. 219
6. LIST OF ACTIONS .............................................................................................................................. 221
6.1 General, cross-cutting, actions ...................................................................................................... 221
6.2 Atmospheric Domain Actions ........................................................................................................ 229
6.3 Ocean Domain Actions .................................................................................................................. 237
6.4 Terrestrial Domain Actions............................................................................................................ 253
Annexes .................................................................................................................................... 273
ANNEX A: ECV product requirement tables .............................................................................................. 275
Appendices ............................................................................................................................... 295
APPENDIX 1: Contributors ........................................................................................................................ 297
APPENDIX 2: Glossary of Acronyms .......................................................................................................... 303


GCOS 2016 Implementation Plan
- vi -
PREFACE
The World Meteorological Organization (WMO) is a specialized agency of the United Nations and its
authoritative voice for weather, water and climate, having its headquarters in Geneva. It sponsors
and implements an integrated suite of programmes which cover all aspects of climate research,
observations, assessment, modelling and services.
This publication provides background in terms of requirements and recommendations for a
functional and robust Global Climate Observing System (GCOS). Global climate monitoring, including
water and greenhouse-gas fluxes, supports and serves the programmes of WMO and its Member
States, especially with a view towards the United Nations Sustainable Development Goals (SDGs) and
implementation of the Paris Agreement. While observations are the focus of National Meteorological
and Hydrological Services (NMHSs), aspects of climate-related policy are covered by many different
government departments. All these will benefit from the information on implementation needs
described herein, provided by GCOS.
WMO programmes provide vital information for which there is currently urgent demand with regard
to the changing Earth’s climate, both in terms of mitigation and adaptation. They assess peer-
reviewed climate science, coordinating and enhancing climate observations on a global scale,
instigating and nurturing world class climate research and assisting the most vulnerable in coping
with climate variability and the impacts of change on the operational scale. WMO strives to assist
Members in mitigating the risks of natural disasters, protecting food and water resources,
safeguarding health and advising on the smart use of energy. This is an impressive portfolio, and
I am delighted that WMO leads these activities.
Many of the proposed actions will be implemented by NMHSs. WMO supports this work through the
WMO Integrated Global Observing System (WIGOS), atmospheric constituent observing systems
managed by the Global Atmosphere Watch (GAW), the WMO Information System (WIS), the World
Hydrological Cycle Observing System (WHYCOS) and the Climate Services Information System of the
Global Framework for Climate Services (GFCS). This publication also highlights the need for capacity-
building and support to observing entities to provide both suitable data and their stewardship. It
provides an excellent basis for developing more detailed activity plans that will ensure swift and
effective support for operational services.
I congratulate the GCOS programme and the climate observation community on behalf of all
sponsors for this important and timely publication, requested by the United Nations Framework
Convention on Climate Change (UNFCCC) and its Subsidiary Body on Scientific and Technological
Advice (SBSTA), and one which will significantly contribute to the Observations and monitoring pillar
of the GFCS.
GCOS is dependent on strong partners and will need to be implemented through interrelated
physical, chemical and biological observations of the ocean, the land-surface ecosystem, the
hydrosphere and measurements of the cryosphere and also through programmes to monitor the key
physical, chemical and biological aspects of the impacts and human dimensions of climate change.

GCOS 2016 Implementation Plan
- vii -
I am taking this opportunity to urge all Parties to the Convention on Climate Change, GCOS
sponsoring organizations and relevant national and international agencies, institutions and
organizations, to collaborate and support the continued development and improvement of a Global
Climate Observing System for monitoring the baseline that we all need to build our sustainable
future development.
(Petteri Taalas)
Secretary-General

GCOS 2016 Implementation Plan
- viii -
FOREWORD
First of all, on behalf of the GCOS Steering Committee and the writing team, we would like to express
our deep gratitude to the hundreds of experts and colleagues worldwide at operational agencies,
research facilities and in scientific and technical programmes who have greatly contributed, under
tight time constraints, to this publication.
We have been much encouraged by some 2 000 helpful and constructive comments received during
our two-phase review process from June to September 2016.
This publication is again called an “Implementation Plan”, as it based on a decision of the Conference
of the Parties (COP) to the UNFCCC, in 2004, when Parties requested the GCOS Secretariat, under the
guidance of the GCOS Steering Committee, to coordinate the development of a phased 5- to
10-year Implementation Plan. We believe that the assembled scientific and technical advice in the
Plan, set out as concrete actions, will give good guidance on how to enhance and improve the system
of global climate observations.
The now famous “Climate Conference” – COP 21 – held in Paris in December 2015, not only
unanimously closed with the Paris Agreement, but also recognized in its subsidiary bodies many
other important elements which will help ensure that the Earth has a resilient, healthy climate. One
such subsidiary body of the UNFCCC is SBSTA.
In December 2015, the GCOS Secretariat submitted to SBSTA, the Status of the Global Observing
System for Climate, a report assessing the progress made against the actions set out in the former
GCOS Implementation Plan, which dated from 2010, while also providing an assessment of the
overall adequacy of the global observing system for climate. At COP 21, “SBSTA recognized the
progress made in improving observing systems for climate, as relevant to the Convention, and
encouraged GCOS to consider the outcomes of COP 21 when preparing the Implementation Plan in
2016. SBSTA also invited GCOS to collaborate with relevant partners to continue enhancing access
to, and understanding and interpretation of, data products and information to support decision-
making on adaptation and mitigation at national, regional and global scales”.
The suggested list of actions in this plan provides the basis for the improved implementation of
GCOS. It also addresses the increasing economic challenges of sustaining observing systems in times
of scarce resources, new technologies and increased demands on data generation, management and
exchange. Many of these actions are based on business as usual; others are more aspirational and
ambitious. We would hope that any of our “agents of implementation” will use it to develop their
specific implementation plans for actions which concern them.
Our aim is that if the GCOS secretariat will assess the progress made in using this plan in 5-10 years’
time, that it can report on good progress made.
We are also very much looking forward to further strengthen our partnerships with other relevant
United Nations programmes and bodies. We are deeply grateful for the engagement of the
Intergovernmental Oceanographic Commission (IOC) of the United Nations Educational, Scientific

GCOS 2016 Implementation Plan
- ix -
and Cultural Organization (UNESCO) for its enormous efforts to coordinate the Global Ocean
Observing System (GOOS). Without a strong GOOS, we would not have a strong and capable ocean
climate component of GCOS. As a matter of major concern, we are calling for the rebuilding of a
terrestrial framework for climate observations, as former sponsors withdrew from this responsibility
a while ago. We will welcome the engagement of any United Nations body with which GCOS will
have a natural alignment of objectives and capabilities and which can help by ensuring a broader
political forum for joint initiatives by bringing attention at ministerial level to the value of using
Essential Climate Variables (ECVs) to quantify the success of environmental and climate policies.
We hope that we have delivered a useful publication which will be instrumental in building a system
of systems for climate observations – a GCOS.
(Stephen Briggs)
Chairman on behalf of the GCOS
Steering Committee
(Alan Belward)
Lead Author, GCOS
Implementation Plan

GCOS 2016 Implementation Plan
- x -
EXECUTIVE SUMMARY
This plan describes the proposed implementation of a global observing system for climate, building
on current actions. It sets out a way forward for scientific and technological innovations for the Earth
observation programmes of space agencies and for the national implementation of climate observing
systems and networks.
Introduction
A system for global climate observations comprises a combination and integration of global, regional
and national observing systems delivering climate data and products. The new Implementation Plan
guides the development of such a system and sets out what is needed to meet increasing and more
diverse needs for data and information, including for improved management of the impacts and
consequences of climate variability and current and future climate change.
A wide range of studies has demonstrated the cost-effectiveness of various parts of the global
climate observing system. These studies show that there are many benefits besides those that are
directly climate-related in such diverse sectors as agriculture, natural resource management and
human health. They also show that investments in data access and stewardship significantly increase
the benefits to society.
In 1992, Parties to the UNFCCC agreed, in Articles 4 and 5, to support and develop mechanisms for
the collection and sharing of climate data. Following the Paris Agreement concluded at COP 21 in
2015, GCOS has now to consider observational requirements to monitor emissions and emission
reductions, information needs for assessing adaptation to climate change and climate resilience, data
needs for public awareness and capacity development.
Part I of this Implementation Plan describes the new and wider considerations of climate
observations and their connections with adaptation and mitigation issues, including the relationship
of ECVs to the three climate cycles of water, carbon and energy, to the Rio Conventions, other
biodiversity-related conventions, Agenda 2030 and the Sendai Framework for Disaster Reduction
2015–2030.
Part II provides the details for the observing systems, from the general requirements for climate
observations to individual actions for each ECV.
Implementation
Implementing this Plan will:
(a) Ensure that the climate system continues to be monitored;
(b) Improve global, regional and local long-term climate forecasts by: filling gaps in network
coverage, refining ECV requirements, observing additional parameters identified by the scientific
community, Improving techniques and addressing the global cycles more holistically;
(c) Support adaptation;

GCOS 2016 Implementation Plan
- xi -
(d) Improve the provision of useful information to users;
(e) Improve the communication of the state of the climate.
Observations for adaptation, mitigation and climate indicators
At the international level, the importance of high-quality, reliable and timely climate services has
been demonstrated by the establishment of the GFCS, a United Nations-led initiative instigated at
World Climate Conference-31. In its high-level plan2, a climate service is defined as “climate
information prepared and delivered to meet a user’s needs”. A climate service includes the timely
production and delivery of science-based trustworthy climate data, information and knowledge to
support policy and other decision-making processes. To be effective, climate services should be
designed in collaboration with customers and stakeholders, be based on free and open access to
essential data and include user feedback mechanisms. Resolution 39 of Seventeenth World
Meteorological Congress recognized the "fundamental importance of GCOS to the Global Framework
for Climate Services”.
Recent workshops noted that currently, the global climate models and satellite-based observing
systems were useful in supporting decisions from the national to global scales, but were inadequate
for subnational to local decision-making as the spatial resolution of their products was too coarse.
Implementing this plan will identify the requirements of such measurements and support their
observations at local and regional levels. Many of the actions in this document will support adaption
and these are described in Table A. In addition, there are specific actions on developing guidance
where this does not yet exist, and on the provision of high-resolution global or regional datasets from
satellite products or by downscaling of model results.
The estimates of national emissions and removals used by Parties to the UNFCCC in designing and
monitoring mitigation actions are produced using the Intergovernmental Panel on Climate Change
(IPCC) Guidelines for National Greenhouse Gas Inventories and its supplements from 2006.
Observations can support this process in a number of ways: satellite observations of the changes in
land cover are an important input into estimates of emissions from the "land use, land-use change
and forestry" sector; forest mitigation efforts, such as the REDD-mechanism (reducing emissions
from deforestation and forest degradation and the role of conservation, sustainable management of
forests and enhancement of forest carbon stocks in developing countries (UNFCCC)), depend on
forest monitoring that combines satellite observations with ground-based measurements. While
atmospheric concentration measurements cannot replace inventory-based estimates of emissions
and removals, they can be used to support the improvement of inventory estimates by providing
independent evidence of the completeness of the estimates and assist in their verification.
This new Implementation Plan describes a new ECV – anthropogenic greenhouse-gas fluxes. Actions
related to this ECV will promote better use of the IPCC guidelines to improve global estimates,
1 http://www.wmo.int/gfcs/wwc_3
2 Climate knowledge for action: a global framework for climate services – empowering the most vulnerable. WMO-No. 1065,
WMO, Geneva, 2011

GCOS 2016 Implementation Plan
- xii -
promote better understanding of the land sink, and support national emission inventories through
the use of atmospheric composition observations.
Specific mention is also made of the need for measurement of point source fluxes from emission
sources such as fossil fuel power plants. These measurements, made from space-borne platforms
under development at the time of publication, will augment the bottom-up approaches of the IPCC
guidelines and allow improved integrated estimates of emissions, in line with the requirements of
the Paris Agreement for a global stocktake with a five- year repeat. The first global stocktaking in
2023 will benefit from prototype systems that are expected to develop into a more operational
system thereafter.
The use of multiple ECVs may also support the planning and monitoring of mitigation, including soil
carbon, above-ground biomass, lakes and river discharge, land cover and fire disturbance.
The Paris Agreement also recognizes the importance of averting, minimizing and addressing loss and
damage associated with the adverse effects of climate change, including extreme weather events
and slow onset events, and the role of sustainable development in reducing the risk of loss and
damage. While surface temperature is the indicator fundamental to the aim of the Paris Agreement,
it has proved problematic when used alone for communicating the impacts and evolution of climate
change and does not cover the range of impacts of concern. Describing climate change in a more
holistic way demands additional indicators of ongoing change, such as heating of the ocean, sea-level
rise, increasing ocean acidity, melting glaciers, decreasing snow cover and changes in Arctic sea ice.
Such a set of indicators should be able to convey a broader understanding of the state and rate of
climate change to date and highlight its likely physical consequences. It will be equally important to
develop indicators related to future climate change: COP 21 policymakers will need reliable evidence
of the impacts of climate change on society, including the increasing risks to infrastructure, food
security, water resources and other threats to humankind. Table B links actions to parts of the Paris
Agreement.
Following the success of the Paris Agreement, policymakers will need more comprehensive and
informative indicators to understand and manage the consequences of climate change. Risk events
are of major importance and relevance to policymakers and it will become increasingly necessary to
understand their likelihood, given the prior probabilities of evolving climate scenarios.

GCOS 2016 Implementation Plan
- xiii -
Table A. Actions for adaptation
Action Description WMO Related GCOS Actions
Req
uir
emen
ts a
nd
gu
idan
ce
Define user needs
GCOS and the observation community identify and understand the needs of user communities and issues they aim to serve. GCOS should work with the user communities to define regional requirements.
GCOS Regional Workshops (G8) Development of requirements (G10) Communication Plan (G9)
Provide guidance
Produce and disseminate advice on using the global and regional requirements at national and local level and guidance and best practice on prioritization of observations, implementation, data stewardship and reporting. Promote the use of this guidance by parties and donors. Review the use of this guidance and requirements and revise as needed.
GCOS Provide advice and guidance (G10-13, Part II, Chapters 2-4) Communication Plan (G9) Regional Workshops (G8)
Acq
uir
ing
dat
a
Produce high-resolution data
Encourage satellite-based observation systems, re-analyses and global circulation models to move towards generating spatially higher-resolution products
GCOS Development of requirements (G10)
Data rescue Communicate the value of historical data as a public good and promote data rescue as an essential task. (See Part II, Section 2.4.2.)
WMO, GCOS
Data Rescue (G26-30) Communications Plan (G9)
Invest in observations
Investments are needed to improve the in situ network of stations for climate, water, greenhouse-gas fluxes, biodiversity and others (Parties should invest in their own observations: support is also needed in countries with fewer resources (see Part I, Chapter 6).
Parties GCOS Cooperation Mechanism (G6) Communication Plan (G9)
Dat
a
Improve data stewardship
Improve information on data availability, quality, traceability, uncertainty and limits of applicability and establish and improve mechanisms to provide both access to data and information regarding data contents. Improve data management (see Part II, Section 2.3).
GCOS Define and use metadata mechanism to discover data, Open data (Part II, Chapter 2.3)
Clim
ate
Serv
ices
Climate services
Present the information derived from the observations in a form that is relevant to the purposes of the diverse range of decision-makers and users addressing issues such as vulnerability and adaptation assessments, monitoring and evaluation, risk assessment and mitigation, development of early warning systems, adaptation and development planning and climate proofing strategies within and across sectors.
GFCS Indicators (Part 1, Chapter 3.3)
GFCS GFCS has a leading role in improving feedback mechanisms between data providers and users through the User Interface Platform, to inform GCOS in supporting the GFCS observations and monitoring pillar.
GFCS Refine requirements (G10)
Co
ord
inat
ion
Coordination There is a need to clarify responsibilities, define focal points for specific topics, build synergies and generally strengthen cooperation among United Nations programmes, as well as to consider how GCOS can use its reporting systems through WMO, UNFCCC, IOC and others, to reach out to different communities and to be recognized as an authoritative source of validated information that is relevant to users’ needs
GCOS, GFCS, IOC, WMO, UNFCCC, Parties
Coordination actions (role of GCOS and its science panels)
Long-term research and observations
Support research initiatives such as WCRP, UNEP’s PROVIA and the ICSU’s Future Earth as well as global and regional investments in observations likely to meet future needs for long-term data, such as the Monitoring for Environment and Security in Africa programme (MESA). Research is needed to define standards and reference-grade stations.
GCOS, ICSU, UNEP
Research Actions (several actions in Part II Chapters 2-4)

GCOS 2016 Implementation Plan
- xiv -
The broader relevance of climate observations
Global-scale systematic observations are undoubtedly a feature of other multilateral environmental
agreements and international actions. They are used to strengthen scientific understanding
underpinning the agreements and action goals, for reporting, monitoring and guiding
implementation. Whilst the specific requirements for observation may differ, a common set of
variables would improve information exchange, deliver savings (or as a minimum incur no additional
costs), allow shared capacity-building and outreach, and focus the demands made on core
“providers”, such as the space agencies and NMHSs. This new Implementation Plan highlights some
areas where commonality should be explored in the short term. In the longer term, other links will
need to be examined. Short-term coordination actions include the following.
The 17 SDGs and 169 targets adopted by the United Nation Member States in September 2015 will
frame many global policy agendas and stimulate action over the next 15 years. Acknowledging that
UNFCCC is the primary international, intergovernmental forum for negotiating the global response to
climate change, SDG 13 unequivocally states the need to take urgent action to combat climate
change and its impacts in the overall sustainable development context.
The hydrology ECVs and those relating to human use of resources are of immediate relevance to the
2016–2024 strategic plan of the Ramsar Convention on Wetlands, especially concerning, its work on
building inventories, the goals of increasing the scientific basis for advice and noting that "the critical
importance of wetlands for climate change mitigation and adaptation is understood”. Identification
of synergies is highly desirable and GCOS should establish appropriate links with the Convention to
this end.
The Sendai Framework targets "the substantial reduction of disaster risk and losses in lives,
livelihoods and health and in the economic, physical, social, cultural and environmental assets of
persons, businesses, communities and countries". The Framework recognizes the important role of
climate-related risks and specifically targets "coherence and mutual reinforcement between the
Sendai Framework for Disaster Risk Reduction 2015–2030 and international agreements for
development and climate action". GCOS recognizes the valuable role climate services can play in
understanding and managing climate-related disaster risk, as well as in enhancing disaster
preparedness. This present plan recognizes that maximizing these benefits will require linked
mechanisms for monitoring and reporting and to promote cooperation in implementation.
Consistent observations across the Earth system cycles
Current climate change is driven by the interaction of the gaseous phases of the carbon and nitrogen
cycles and radiative properties of the atmosphere.
While the original ECVs were designed largely on the basis of individual usefulness and maturity,
many people in recent years have started to use the climate records based on ECVs to close budgets
of energy, carbon and water and to study changes in growth rates of atmospheric composition or
interaction between land and atmosphere in a more integrated way. Closing the Earth's energy
GCOS 2016 Implementation Plan
- xv -
balance and the carbon and water cycles through observations remain outstanding scientific issues
that require high-quality climate records of key ECVs.
In this Implementation Plan, latent and sensible heat fluxes over the ocean are a new ECV with
actions on similar fluxes over land. Key state variables that were missing in previous plans can now
also be observed, such as surface temperature over land.
For carbon fluxes, exchanges between the ocean and atmosphere need to be estimated, as well as
those between land and atmosphere and between land and ocean through transport of organic
material by rivers. The inclusion of a new ECV on anthropogenic fluxes of GHGs provides the key
driver of changes of the carbon cycle in the form of fossil fuel combustion, cement production, land
use and land-use change. There is a clear link to fire disturbance, soil carbon, land use and above-
ground biomass ECVs.
Capacity development and regional and national support
Despite the need for local information to support adaptation planning, early warning systems and
reporting requirements, there is often a lack of equipment, funding and skills. Developed countries
and international organizations can assist through the donation of equipment, equipment
maintenance, training and awareness-raising of the importance of systematic climate observation
among governments and policymakers. For observations to be usefully combined with other data,
the data observations should comply with the GCOS monitoring requirements described in Part II,
that aim to ensure their accuracy, consistency and long-term stability.
The GCOS Cooperation Mechanism (GCM) resulted from deliberations at the 17th session of the
UNFCCC SBSTA and was formulized in a decision of UNFCCC COP 9. It was established to address the
high-priority needs for stable long-term funding for key elements of global climate observations.
The Mechanism is intended to address priority needs in atmospheric, oceanic and terrestrial
observing systems for climate, including data rescue, analysis and archiving activities. It supports:
equipping, managing, operating and maintaining observing networks; a range of data-management
activities, such as data-quality assurance, analysis and archiving; and a variety of applications of the
data and products to societal issues.
The scope of climate impacts and risks in most countries is not limited to a single agency. The risks
cover a wide range from meteorological events and extremes, such as flooding and drought, to
disruption of food supply, damage to infrastructure and health issues. Thus, GCOS activities and
interests in any nation normally cut across many departments and agencies, rather than being
limited to a sole agency such as an NMHS. It is therefore desirable and efficient for GCOS to have a
single contact in each nation who can coordinate among the relevant agencies and represent the
views of all – or at least most of them – on a regular basis. This is the role envisaged for a “GCOS
National Coordinator”.
To improve global climate observations, particularly in light of the importance of adaptation, there
should be a focus on those areas most in need: Africa; parts of Asia; South America; and Small Island
States. GCOS will hold regional workshops to identify needs and potential regional cooperation.

GCOS 2016 Implementation Plan
- xvi -
GCOS needs to improve its communication with various international and national stakeholders,
especially on needs in regions and specific developing countries.
Detailed implementation
Part II introduces the detailed Implementation Plan with the formulation of overarching and cross-
cutting actions.
A global system observing the climate that delivers useful products must address raw observations,
data recovery, processed measurements, data analysis, archiving.
As the Earth's climate enters a new era, in which it is forced by human activities, as well as natural
processes, it is critically important to sustain an observing system capable of detecting and
documenting global climate variability and change over long periods of time. The research
community, policymakers and the general public require high-quality climate observations to assess
the present state of the ocean, cryosphere, atmosphere and land and place them in context with the
past.
In general, the ECVs will be provided in the form of climate data records that are created by
processing and archiving time series of satellite and in situ measurements. To ensure that they are
sufficiently homogeneous, stable and accurate for climate purposes, they should fulfil two types of
requirement defined by GCOS: generic requirements that are applicable to all ECVs and ECV-specific
requirements.
The ECV requirements have been established for satellite observations and are being extended to all
ECV observations, both satellite and in situ. As the implementation of these requirements greatly
enhances the utility of the climate data records and improve the quality of the climate record, these
generic and ECV-specific requirements are the reference points against which the climate data
records should be assessed.
Data management, stewardship and access ensure that essential data, including fundamental climate
data records (FCDR) and the records of derived data products, are not only collected, but also
retained and made accessible for analysis and application for current and future users. Adequate
data management will ensure that data are of the required quantity and quality necessary for climate
monitoring, research and for developing high-quality climate services. Data-management systems
that facilitate access, use and interpretation of data and products should be included as essential
elements of climate-monitoring systems.
Products for specific ECVs are generated from in situ data, satellite data or a combination of the two.
The requirements of a substantial body of users are being increasingly well met by products based on
integration of data from a comprehensive mix of in situ networks and satellite systems, achieved
largely through the process known as reanalysis, but also referred to as synthesis. This involves using
a fixed data-assimilation system to process observations that extend back in time over multiple
decades, employing a model of the atmosphere, ocean or coupled climate system to spread
information in space and time and between variables and otherwise to fill gaps in the observational
record.

GCOS 2016 Implementation Plan
- xvii -
Atmospheric and ocean reanalysis provides datasets for many ECVs, but also makes use of data
products for those variables that are prescribed in the assimilating model. Existing production
streams have been prolonged, new reanalyses have been completed for atmosphere and ocean,
more refined land-surface products have been developed and producing centres have planned future
activities.
There is a requirement for local data on impacts of climate variability and change. This, in turn,
implies a requirement for climate data products with high resolution in space and time, and a
consequent need for downscaling approaches.
The priority with regard to the management of early satellite data is to ensure long-term
preservation of the raw data and level 1 data for input to FCDR production. Progress towards
preservation of historical satellite data has been made both for geostationary and polar-orbiting
meteorological satellites, but the associated critical metadata are more difficult to preserve. Landsat
is the longest running uninterrupted Earth Observation programme. Today, the Landsat archive is
geographically broader and temporally deeper than at any time and thus, as a consequence, is
valuable for characterizing change to the climate, impacts and the effectiveness of adaptation
strategies.
Data recovery remains resource-limited and fragmented in nature, despite a number of efforts being
made nationally and through coordinated international activities that are yielding worthwhile
enhancements of databases.
The WMO Commission for Climatology (CCl) has plans for better coordinating the rescue and
preservation of data through its Expert Team on Data Rescue, whose tasks include arranging the
implementation, population and maintenance of an International Data Rescue web portal, to
summarize key information and provide an analysis of gaps in international data rescue activities.
There are important, ongoing efforts, building collections of ECV-specific data on surface air
temperature and surface pressure, but keeping all atmospheric surface synoptic variables measured
at a station together for each observation time is likely to be more useful in the long run.
Data archiving and rescue and quality-control activities have been going on in the ocean for many
years. Yet, many early observations remain undigitized and require attention similar to demands in
the atmosphere and on land.
Mass transport information at appropriate spatial and temporal resolution enhances our ability to
monitor, model and predict changes in the global water cycle, including extreme events; separates
mass balance processes on the ice sheets, ultimately improving predictions of sea level; and
monitors and improves understanding of climate-related variations of ocean currents.
In addition to the geoid – the ideal surface of the oceans at rest under the sole effect of the Earth's
gravity – and its variations due to mass transport, other global models are of foundational value for
climate observations. They include, in particular, the global topography of the solid Earth, which can
be divided into terrain models for the terrestrial part and bathymetry models for the oceanic part.

GCOS 2016 Implementation Plan
- xviii -
Recently, these models have also been combined in global relief models, encompassing land
topography, ocean and lake bathymetry and bedrock information.
All atmospheric surface ECVs require topographic information to enable meaningful interpretation.
For terrestrial ECVs, the use of digital terrain models is equally essential for most ECVs. It would, for
example, be impossible to derive soil moisture or biomass information from space observations in
the absence of proper elevation information. For oceanic ECVs, the impact of bathymetry –- where
models are still affected by a basic lack of supporting observations – is fundamental for accurate
ocean circulation and mixing and is critical for climate studies since seafloor topography steers
surface currents, while the roughness controls ocean mixing rates.
For terrain models, enormous advances are being made. The situation is much less comfortable for
bathymetry models, since the majority of the open ocean remains to be observed at the required
spatial resolution.
This Plan has four long-term, overarching targets:
(a) Closing the carbon budget (greenhouse gases);
(b) Closing the global water cycle;
(c) Closing the global energy balance;
(d) Explaining changing conditions to the biosphere.
A monitoring system that achieves these targets would provide the basis for good understanding of
climate change at the global scale. Meeting user needs for planning to adapt to changes in climate
and climate variability requires more varied and local actions and the approach is summarized
herein. Actions in this plan will be developed with consideration of other multilateral environmental
agreements.
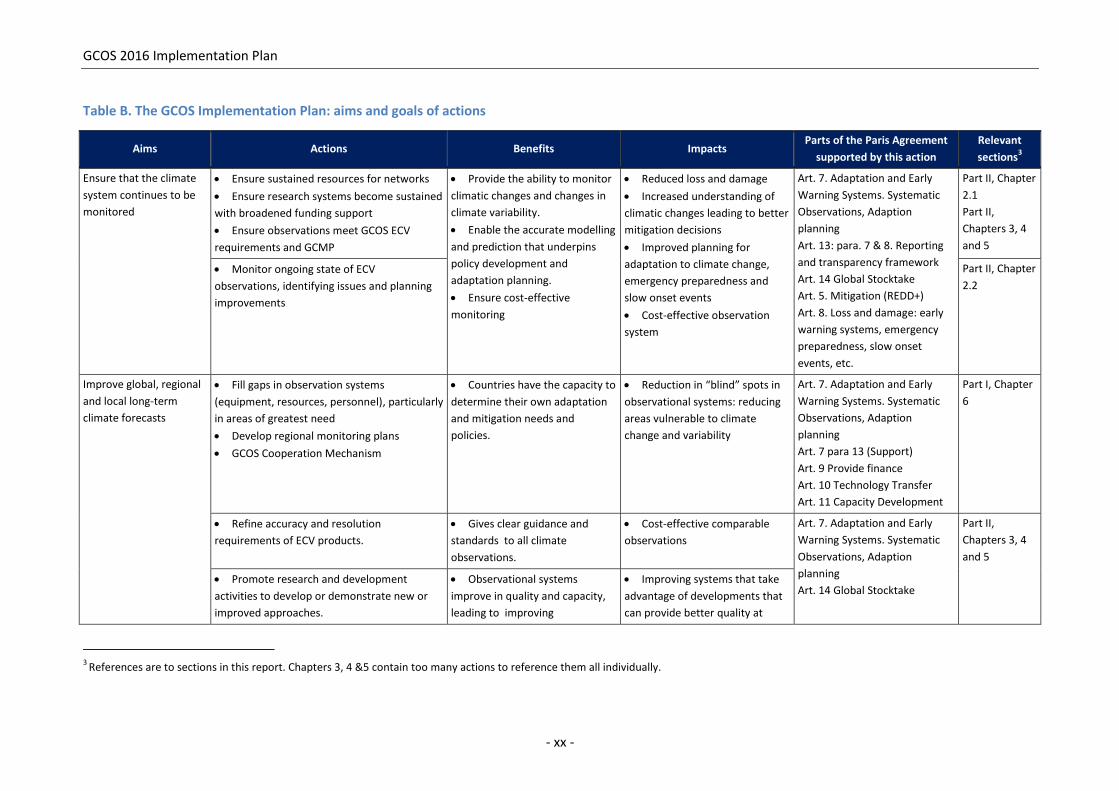
The three GCOS science panels have agreed specific actions, summarized in Table B, which are
highlighted in boxes in this plan. They are numbered and the labels indicate how they relate to the
Atmosphere, Ocean, Terrestrial Domain or to the general and cross-cutting parts of the plan. The
boxes describe what "action" is needed and what is the benefit of implementing it. The box also
gives information about "who" is supposed to act, when the action should be implemented, and how
progress in implementation could possibly be measured. The annual costs are based on estimates:
for example, for required expert time, standard meeting costs or cash investments for hardware or
software and are presented as broad ranges. For many of the cost estimates, reference can be made
to the former GCOS Implementation Plan.
The costliest item identified in this document is for the preparation and implementation of a carbon
monitoring system (US$ 10–100 billion) able to support estimates of emission and removals of
greenhouse gases. It should be noted, however, that this cost will be spread over many years: a full
system is unlikely to be operational before about 2030. This cost is spread over assorted satellite and
ground-based networks, includes development costs and the fact that some of this work has already
started.
Items in the US$ 100–300 million range are related to future satellite missions, ensuring continuity of
products on sea-surface temperature, precursors of ozone and secondary aerosols, and wind-

GCOS 2016 Implementation Plan
- xix -
profiling systems. A specific action is related to the implementation of satellite calibration missions
needed to ensure the production of climate-quality data. Finally, although these are spread across
several specific actions, support is needed by observational networks: by NMHSs, for example, for
improved precipitation measurements, automatic weather stations and monitoring needs for
adaptation.
Annex A presents requirements for products for all ECVs in this Implementation Plan. As these
requirements are for products, they are independent of the observational method, whether mainly
satellite or in situ. These requirements update the requirements for satellite-based ECV Products in
the GCOS Satellite Supplements to the Implementation Plans for 2004 and 2010. The extension to all
ECVs will give a better idea of whether or not the observing systems are achieving their goals and will
align these reviews with the overall GCOS review cycle and reporting to the UNFCCC. Merging the
ECV Product Requirements with the Implementation Plan itself has additional advantages, such as a
more direct and traceable link between the Implementation Plan actions and the product
requirements.
GCOS 2016 Implementation Plan
- xx -
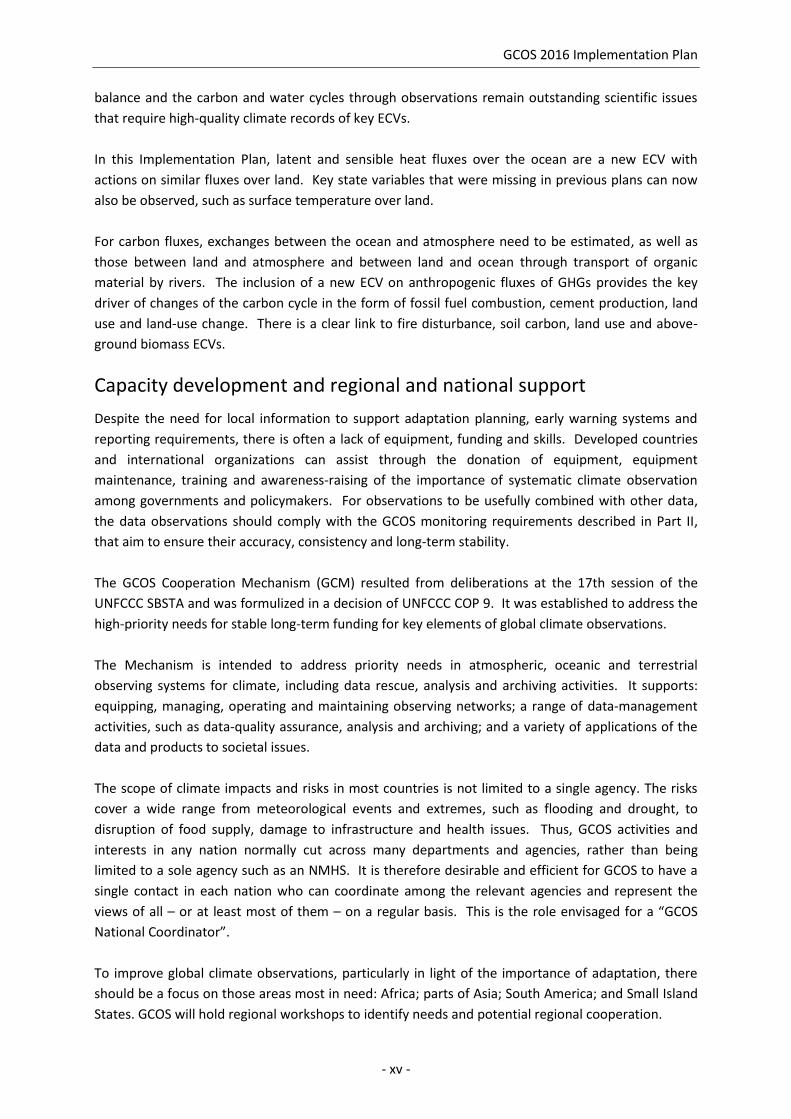
Table B. The GCOS Implementation Plan: aims and goals of actions
Aims Actions Benefits Impacts Parts of the Paris Agreement
supported by this action
Relevant
sections3
Ensure that the climate
system continues to be
monitored
Ensure sustained resources for networks
Ensure research systems become sustained
with broadened funding support
Ensure observations meet GCOS ECV
requirements and GCMP
Provide the ability to monitor
climatic changes and changes in
climate variability.
Enable the accurate modelling
and prediction that underpins
policy development and
adaptation planning.
Ensure cost-effective
monitoring
Reduced loss and damage
Increased understanding of
climatic changes leading to better
mitigation decisions
Improved planning for
adaptation to climate change,
emergency preparedness and
slow onset events
Cost-effective observation
system
Art. 7. Adaptation and Early
Warning Systems. Systematic
Observations, Adaption
planning
Art. 13: para. 7 & 8. Reporting
and transparency framework
Art. 14 Global Stocktake
Art. 5. Mitigation (REDD+)
Art. 8. Loss and damage: early
warning systems, emergency
preparedness, slow onset
events, etc.
Part II, Chapter
2.1
Part II,
Chapters 3, 4
and 5
Monitor ongoing state of ECV
observations, identifying issues and planning
improvements
Part II, Chapter
2.2
Improve global, regional
and local long-term
climate forecasts
Fill gaps in observation systems
(equipment, resources, personnel), particularly
in areas of greatest need
Develop regional monitoring plans
GCOS Cooperation Mechanism
Countries have the capacity to
determine their own adaptation
and mitigation needs and
policies.
Reduction in “blind” spots in
observational systems: reducing
areas vulnerable to climate
change and variability
Art. 7. Adaptation and Early
Warning Systems. Systematic
Observations, Adaption
planning
Art. 7 para 13 (Support)
Art. 9 Provide finance
Art. 10 Technology Transfer
Art. 11 Capacity Development
Part I, Chapter
6
Refine accuracy and resolution
requirements of ECV products.
Gives clear guidance and
standards to all climate
observations.
Cost-effective comparable
observations
Art. 7. Adaptation and Early
Warning Systems. Systematic
Observations, Adaption
planning
Art. 14 Global Stocktake
Part II,
Chapters 3, 4
and 5
Promote research and development
activities to develop or demonstrate new or
improved approaches.
Observational systems
improve in quality and capacity,
leading to improving
Improving systems that take
advantage of developments that
can provide better quality at
3 References are to sections in this report. Chapters 3, 4 &5 contain too many actions to reference them all individually.

GCOS 2016 Implementation Plan
- xxi -
Aims Actions Benefits Impacts Parts of the Paris Agreement
supported by this action
Relevant
sections3
Take advantage of new technologies. understanding and predictive
abilities.
lower cost
Improved observation of carbon, water
and energy cycles
Improved understanding of
adaptation and mitigation needs
Detection of potentially
significant changes to these
systems could be missed, leading
to unexpected loss and damage
Part I, Chapter
5.
Support adaptation4 Identify requirements for adaptation
Provide guidance for local observations
Encourage provision of high resolution
global datasets
Assist counties to identify
their priority cost-effective
monitoring needs
Ensure comparable
measurements at different
locations
Provide suitable global
datasets
Improved adaptation planning
and emergency response.
Reduced impacts, loss and
damage
Art. 7. Adaptation and Early
Warning Systems. Systematic
Observations, Adaption
planning
Part I, Chapter
3, Part II
Chapters 2, 3,
4 and 5
Improve the provision of
useful information to
users
Allow all users access to all climate data by
enabling open data, good metadata,
discoverability and long-term access.
Informed decision making
based on quality, up-to-date data
for global and national climate
change policy and for local
adaptation
Data re-used for multiple
purposes
Improved understanding of
climatic changes leading to
improved planning for
adaptation to climate change and
emergency preparedness.
Cost-effective use of
information
Art. 7. Adaptation and Early
Warning Systems. Systematic
Observations, Adaption
planning
Art. 14 Global Stocktake
Part II, Chapter
2.3
Provide processed data products, based on
observations, required information to users,
especially to support climate services such as
GFCS.
Part II, Chapter
2.4
Part II,
Chapters 3, 4
and 5
Observe additional
parameters
Quantifying anthropogenic greenhouse-gas
fluxes
Support to emission
inventories and reporting.
Improved understanding of
uncertainties.
Increased confidence in
emission and removal estimates
Art 4. Nationally determined
contribution
Art. 7. Adaptation and Early
Warning Systems. Systematic
Observations, Adaption
planning
Part I, Chapter
5
Actions T67-71
4 While these actions are specifically aimed at supporting adaptation, many of the other actions will also contribute to supporting adaptation, even though that is not their primary goal.

GCOS 2016 Implementation Plan
- xxii -
Aims Actions Benefits Impacts Parts of the Paris Agreement
supported by this action
Relevant
sections3
Art. 14 Global Stocktake
Biology (marine habitat properties and
adding lake colour to the Lake ECV) and Land
Surface Temperature
Improved monitoring and
prediction of impacts on
biological systems and changes in
carbon cycle
Monitoring of Inclusion of
important biological systems
(e.g. fisheries) in global
observation system
Art. 7. Adaptation and Early
Warning Systems. Systematic
Observations, Adaption
planning
Art. 14 Global stocktake
Part II,
Chapters 4.4
and 5.3
Lightning and two Ocean properties
(ocean surface stress, ocean surface heat flux).
Improved monitoring and
prediction of weather and storm
impacts
Improved monitoring of
extreme weather: major concern
for many countries.
Part II,
Chapters 3.2.2
and 4.2
Improve the
communication of the
state of the climate
Develop agreed list of indicators useful for
communicating climate change and adaption
needs
Better communication and
wider understanding of the full
range of the impacts and drivers
of climate change
Improved understanding of
the wide range of impacts of
climate change and need for
adaptation
Improved preparedness and
planning
Art. 12. Improve public
communications
Part I, Chapter
3.3
Develop plan that communicates need for
observations, their requirements and GCOS’s
role.
Improved support for
observations
Understand need to maintain
systems
Improved planning and
preparedness, leading to reduced
loss and damage
Art. 12. Improve public
communications
Art. 9 Provide finance
Art. 12 Capacity Development
Part I, Chapter
6.4


PART I. Broad context: meeting the needs of the
UNFCCC, adaptation and climate services and climate
science


GCOS 2016 Implementation Plan
- 3 -
1. INTRODUCTION
The World Economic Forum Global Risks Report 2016 cites the failure of climate change mitigation
and adaptation as the risk with the greatest potential impact on humanity, the first time that any
environmental risk has topped this ranking since its inception in 2006. The human population has
already passed 7.3 billion and continues to increase by well over a hundred individuals every minute
of every day. Our growing and shifting population is testing the resilience of the Earth system as
never before. The impacts of climate change on food security, water resources and extreme weather
events pose immediate threats to humanity.
The IPCC Fifth Assessment Report5 states that “human influence on the climate system is clear, and
recent anthropogenic emissions of greenhouse gases are the highest in history. Warming of the
climate system is unequivocal and, since the 1950s, many of the observed changes are
unprecedented”. Recent climate changes have had widespread impacts on human and natural
systems: “the atmosphere and ocean have warmed, the amounts of snow and ice have diminished,
and sea level has risen”. Today, more than half the land used for agriculture is moderately or
severely affected by land degradation, while demand for food is increasing.
Protecting the planet from degradation through sustainable consumption and production,
sustainably managing its natural resources and taking urgent action on climate change so that the
needs of present and future generations can be supported, are among the primary aims of the 2030
Agenda for Sustainable Development (Agenda 2030).
Observations remain crucial for monitoring, understanding and predicting the variations and changes
of the climate system. They need to be collected over substantial timescales with a high degree of
accuracy and consistency to observe directly long-term trends in climate. Informed decisions can only
be made on prevention, mitigation and adaptation strategies based on sustained, local and
comparable observations. Language on research and systematic observations was in the original
1991 report of the International Negotiating Committee for the United Nations Framework
Convention on Climate Change (UNFCCC) and was included in the text of the Convention in 1992 in
Articles 4 and 5 (Box 1) where Parties to the Convention agreed to support and develop mechanisms
for the collection and sharing of climate data.
GCOS has been recognized by UNFCCC since 1997 as the programme that leads the improvement of
systematic observations to meet the needs of the Convention (e.g. Decisions 8/CP.3, 14/CP.4,
9/CP.15). (See also unfccc.int/3581).
We have to distinguish between a system that is the combination and integration of existing global,
regional and national observing systems delivering climate data and products (the Global Observing
System for Climate) and a programme guided by an implementation plan to build such a system
(GCOS, Figures 1 and 2). GCOS supports an internationally coordinated network of observing
systems with a programme of activities that guide, coordinate and improve the network. It is
designed to meet evolving requirements for climate observations.
5 IPCC, 2014: Climate Change 2014: Synthesis Report. Contribution of Working Groups I, II and III to the Fifth Assessment
Report of the Intergovernmental Panel on Climate Change. Geneva.

GCOS 2016 Implementation Plan
- 4 -
The Global Observing System for Climate serves as the climate-observation component of the Global
Earth Observation System of Systems (GEOSS), which embraces many themes and societal areas,
including climate.
The new Implementation Plan described in the present publication sets out what is needed to
enhance the system so that it meets increasing and more varied needs for data and information,
including improved management of the impacts and consequences of climate variability and current
and future climate change.
The Paris Agreement concluded at UNFCCC COP 21 in 2015 calls for “strengthening scientific
knowledge on climate, including research, systematic observation of the climate system and early
warning systems, in a manner that informs climate services and supports decision-making” (Paris
Agreement, Article 7.7c, Adaptation). Based on this agreement, GCOS has now to consider
observational requirements to monitor emissions and emission reductions (Global Stocktaking, and
Transparency), information needs for assessing adaptation to climate change and climate resilience
(Adaptation, Mitigation and Loss and Damage), data needs for public awareness (for example,
Indicators) and capacity development (for example, GCM).
GCOS now needs to address not only the science of climate change, and how climate change can be
understood, modelled and predicted, but also the observational needs for mitigating and adapting to
climate change. Future adaptation and response to climate change will also require better
understanding of the evolution of the direct and systemic risks associated with future climate change
Box 1: United Nations Framework Convention on Climate Change (1992)
ARTICLE 4 COMMITMENTS
1. All Parties … shall:…
(g) Promote and cooperate in scientific, technological, technical, socio-economic and other research,systematic observation and development of data archives related to the climate system …
ARTICLE 5 RESEARCH AND SYSTEMATIC OBSERVATION
In carrying out their commitments under Article 4, paragraph 1(g), the Parties shall:
(a) Support and further develop, as appropriate, international and intergovernmentalprogrammes and networks or organizations aimed at defining, conducting, assessing andfinancing research, data collection and systematic observation, taking into account the needto minimize duplication of effort;
(b) Support international and intergovernmental efforts to strengthen systematic observationand national scientific and technical research capacities and capabilities, particularly indeveloping countries, and to promote access to, and the exchange of, data and analysesthereof obtained from areas beyond national jurisdiction; and
(c) Take into account the particular concerns and needs of developing countries and cooperatein improving their endogenous capacities and capabilities to participate in the effortsreferred to in subparagraphs (a) and (b) above.

GCOS 2016 Implementation Plan
- 5 -
and their management through appropriate risk reduction and resilience. This is also fundamentally
related to the structure of insurance against future risk.
Climate observations are also useful for the United Nations Convention to Combat Desertification
(UNCCD), the Convention on Biological Diversity (CBD), other MEA, Agenda 2030 and its SDGs. The
broader relation of climate observations to these agreements is set out in Part I, Chapter 4. The
interrelated water, energy and agricultural sectors are central to sustaining humanity. They are
significantly impacted by climate change and are significant contributors to climate change.
Consideration of these sectors is thus central to successful adaptation and mitigation.
Figure 1. The observing system ranges from individual observers to satellite missions costing many
billions of dollars.
Sources (left to right, top to bottom): www.carboafrica.net, CoCoRaHS, NASA Goddard Space Centre, Global Forest Observation Initiative
(GFOI), B. Longworth

GCOS 2016 Implementation Plan
- 6 -
Figure 2. The improved observations that GCOS supports lead to significant benefits.
While concerned with largely the same suite of observations as earlier GCOS plans, this new
Implementation Plan more clearly addresses the global Earth-life cycles, in particular those of energy,
carbon and water.
A range of studies have demonstrated the cost-effectiveness of various parts of GCOS.
Meteorological observations contribute to sustainable development 6 by providing services in
agriculture, water resources and the natural environment; human health; tourism and human
welfare; energy, transport and communications; urban settlements; and economics and financial
services. WMO concluded 7 that “available assessments show consistently that benefits of
6 WMO, 2009: Secure and Sustainable Living: The Findings of the International Conference on Secure and Sustainable Living:
Social and Economic Benefits of Weather, Climate and Water Services. WMO-No 1034, WMO, Geneva, 2009. 7 WMO, 2012: Conference on Social and Economic Benefits (SEB) of Weather, Climate and Water Services (Lucerne,
Switzerland, 3-4 October 2011). PWS-23/ROE-1, WMO, Geneva.

GCOS 2016 Implementation Plan
- 7 -
meteorological services far outweigh costs; also, users from different sectors confirm the benefits
even if sometimes they are hard to quantify”. For example, a recent study8 showed that the benefits
of the Chinese Public Weather Service outweighed costs by a ratio of 1:26 (accounting for 0.22% of
the Chinese gross domestic product (GDP) in 2006). Copernicus is a European system for monitoring
the Earth using both satellite (the Sentinel series) and in situ observations. A cost-benefit study9
showed that sustained investments in long-term continuity and data provision to users resulted in
the best cost-benefit ratio. Discounted costs were estimated as €11.5 billion and benefits as €30.5
billion. Climate-related benefits exceeded costs while there were other, significant, non-climate
benefits in areas such as resource management, security, humanitarian applications and industrial
development.
These studies show that investments in climate observing systems can be economically beneficial. In
addition, they also show that there are many other benefits besides those that are directly climate-
related and that investments in data access and stewardship significantly increase the benefits to
society.
Observations need to be recognized as essential public goods, where the benefits of open global
availability exceed any economic or strategic value to individual countries that might otherwise lead
them to withhold national data. GCOS aims to ensure that these observations are made and are
readily available to users.
GCOS provides requirements for climate observations. It also has established the Global Climate
Monitoring Principles (GCMP, see Part II) to ensure that climate observations are fit for purpose. The
“one system – many uses” model is fundamental to the efficient and effective operations of the
climate observing system. In addition, the plan discusses the need for potential climate indicators.
These serve two distinct purposes: to provide a broader description of the progress of climate
change to date and to monitor the progress of mitigation and adaptation.
The GCOS report Status of the Global Observing System for Climate10 has reviewed the current status
of the observing system and identified gaps and areas for improvement that are addressed in this
plan.
8 Huiling Yuan, et al., 2016, Assessment of the benefits of the Chinese Public Weather Service, Meteorol. Appl., 23: 132–139
DOI: 10.1002/met.1539. 9 Booz & Co. 2011, Cost-Benefit Analysis for GMES, European Commission: Directorate-General for Enterprise and Industry,
London, 19 September 2011. 10
GCOS, 2015: Status of the Global Observing System for Climate, GCOS-195, WMO, Geneva.

GCOS 2016 Implementation Plan
- 8 -
Box 2: The Global Climate Observing System (GCOS)
GCOS is jointly sponsored by the World Meteorological Organization (WMO), the Intergovernmental
Oceanographic Commission (IOC) of the United Nations Educational Scientific and Cultural
Organization (UNESCO), the United Nations Environment Programme (UNEP) and the International
Council for Science (ICSU).
GCOS is directed by a Steering Committee that provides guidance, coordination and oversight. Three
science panels, reporting to the Steering Committee, have been established to define the
observations needed in each of the main global domains (atmosphere, oceans, and land), prepare
specific programme elements and make recommendations for implementation:
● Atmospheric Observation Panel for Climate (AOPC);
● Ocean Observations Panel for Climate (OOPC);
● Terrestrial Observation Panel for Climate (TOPC).
The three panels gather scientific experts in the respective areas to generate inputs from these fields
to the climate observing community. Each panel:
● Liaises with relevant research and operational communities to identify measurable variables,
properties and attributes that control the physical, biological and chemical processes affecting
climate, are themselves affected by climate change, or are indicators of climate change and
provide information on the impacts of climate change;
● Defines the requirements for long-term monitoring of ECVs for climate and climate change,
maintains a set of monitoring requirements for the variables in their domain and routinely
reviews and updates these requirements;
● Assesses and monitors the adequacy of current observing networks (in situ, satellite-based),
identifies gaps, promotes and periodically revises plans for a long-term systematic observing
system that fills these gaps and makes the data openly available;
● Coordinates activities with other global observing system panels and task groups to ensure
consistency of requirements with the overall programmes.
An important feature of this Implementation Plan, compared to earlier ones, is the greater emphasis
placed on the monitoring by the panels of the performance of the observing systems and responding
to any problems identified.

GCOS 2016 Implementation Plan
- 9 -
2. IMPLEMENTATION
This new Implementation Plan identifies those actions needed to maintain and improve the GCOS to
meet the increasing requirements of science, the UNFCCC, other MEAs, adaptation and mitigation,
and the provision of climate services in general.
Table 1. Essential Climate Variables for which global observation is currently feasible and that
satisfy the requirements of the UNFCCC and broader user communities. Technical details on ECV
products for each ECV and their requirements can be found in Annex A.
Since its establishment in 1992, GCOS has adopted a three-phase approach to assuring the
availability of systematic climate observations underlying the needs of the Parties to the UNFCCC and
the IPCC:
First, GCOS establishes through its science panels the variables to be monitored (ECVs) and
the user requirements for measuring them;
Second, GCOS undertakes regular periodic reviews that monitor how these ECVs are
observed in practice. These have included two reports: Adequacy of Global Observing
Systems for Climate in Support of the UNFCCC and Status of the Global Observing System for
Climate11;
Third, GCOS prepares concrete plans to ensure continuity of the observational record while
improving it where needed. These are then submitted to key stakeholders for adoption and
implementation: this is the third such plan.
11 GCOS, 2015: Status of the Global Observing System for Climate. GCOS-195, WMO, Geneva.
http://www.wmo.int/pages/prog/gcos/Publications/GCOS-195_en.pdf
Measurement domain
Essential Climate Variables (ECVs)
Atmospheric Surface: air temperature, wind speed and direction, water vapour, pressure, precipitation, surface radiation budget Upper-air: temperature, wind speed and direction, water vapour, cloud properties, Earth radiation budget, lightning Composition: carbon dioxide (CO2), methane (CH4), other long-lived greenhouse gases, ozone, aerosol, precursors for aerosol and ozone
Oceanic Physics: temperature: sea surface and subsurface; salinity: sea surface and subsurface; currents, surface currents, sea level, sea state, sea ice, ocean surface stress, ocean surface heat flux Biogeochemistry: inorganic carbon, oxygen, nutrients, transient tracers, nitrous oxide (N2O), ocean colour Biology/ecosystems: plankton, marine habitat properties
Terrestrial Hydrology: river discharge, groundwater, lakes, soil moisture Cryosphere: snow, glaciers, Ice sheets and Ice shelves, permafrost Biosphere: albedo, land cover, fraction of absorbed photosynthetically active radiation, leaf area index, above-ground biomass, soil carbon, fire, land surface temperature Human use of natural resources: water use, greenhouse gas fluxes

GCOS 2016 Implementation Plan
- 10 -
This new Implementation Plan assures continuity of the overall observing system for climate and
builds on past achievements to ensure the system evolves as long-standing users’ needs change and
new users are established. The new plan responds to the growing need for systematic observations
and climate information expanding from science-based assessments to include adaptation and
mitigation needs (Figure 3). The plan also acknowledges that these observations are not just
relevant to the UNFCCC, but also to a broader community.
Table 2. GCOS ECVs grouped by measurement domain and area covered. The groups show how
observations across all the measurement domains are needed to capture specific phenomena or
issues. (NOTE: terrestrial latent and sensible heat fluxes are not currently an ECV but are being
considered as one).
Atmosphere Terrestrial Ocean
Energy and
temperature
Surface radiation budget,
Earth radiation budget,
surface temperature,
upper-air temperature,
surface and upper-air sind
speed
Albedo,
latent and sensible heat
fluxes, land surface
temperature
Ocean surface heat flux, sea
surface temperature,
subsurface temperature
Other physical
properties
Surface wind, upper-air
wind, pressure, lightning,
aerosol properties
Surface currents, subsurface
currents,
ocean surface stress, sea state,
transient traces
Carbon cycle and
other GHGs
Carbon dioxide,
methane, other long-lived
GHG, ozone, precursors for
aerosol and ozone
Soil carbon,
above-ground biomass Inorganic carbon, nitrous oxide
Hydrosphere
Precipitation,
cloud properties,
water vapour (surface),
water vapour (upper-air),
surface temperature,
Soil moisture,
river discharge,
lakes, groundwater,
Sea surface salinity, subsurface
salinity, sea level, sea surface
temperature
Snow and ice
Glaciers,
ice sheets and ice shelves,
permafrost, snow
Sea Ice
Biosphere
Land cover, LAI, FAPAR, fire
Plankton, oxygen,
nutrients, ocean colour, marine
habitat properties
Human use of
natural resources Water use, GHG fluxes Marine habitat properties

GCOS 2016 Implementation Plan
- 11 -
An ECV is a physical, chemical, or biological variable or a group of linked variables that critically
contributes to the characterization of the Earth’s climate12. Variables can only be ECVs if they are
both currently feasible for global implementation and contribute significantly to meeting UNFCCC
and other climate requirements (Annex A). This plan discusses ECVs according to their measurement
domain, sets out actions to support cross-domain use (for example, to close the carbon budget) and
assure relevance to the growing community of users. ECVs are listed in Table 1.
New ECVs have been agreed (lightning, land surface temperature, ocean surface stress, ocean
surface heat flux, marine habitat properties, oceanic nitrous oxide, and anthropogenic GHG fluxes).
Others have been stated with more precise terminology, but are not new. Additional products
associated with some ECVs are identified. Details are given in the domain sections.
The Plan also highlights the importance of ancillary data, such as gravity, geoid, digital elevation
models (DEM), bathymetry and orbital restitution that are required but that are not climate
observations themselves.
While, for practicality, ECVs are assigned to measurement domains, the phenomena and issues they
can address cut across such domains. Table 2 shows this for an illustrative list of phenomena,
demonstrating, for example, how hydrological measurements are needed in all domains to
understand the full hydrological cycle.
The Plan supports strategies for scientific and technological innovations for the major Earth
observation programmes of space agencies and plans for national implementation of climate
observing systems and networks.
12 Bojinski et al., 2014: The concept of essential climate variables in support of climate research, applications, and policy.
Bulletin of the American Meteorological Society, September 2014, 1432–1443
GCOS 2016 Implementation Plan
- 12 -
Figure 3. The Implementation Plan addresses the climate monitoring needs that come from a wide
range of related sources. While this plan is primarily aimed at the needs of the UNFCCC and the
scientific assessments that underpin it, other needs are considered where relevant.
Part I of this Implementation Plan describes its broader context showing the new and wider
considerations of climate services and their relationships with adaptation and mitigation issues. Part
I also sets out more clearly the relationship of ECVs to the three climate cycles of water, carbon and
energy, to the Rio Conventions, other biodiversity-related conventions, Agenda 2030 and the Sendai
Framework for Disaster Reduction 2015–2030.
Part II provides the details for the observing
systems, from the general requirements for
climate observations to individual actions for
each ECV.
The three GCOS science panels (Box 2) have
agreed on specific actions which are
highlighted in boxes in this plan. They are
numbered and the labels indicate if they relate
to the atmosphere (A), ocean (O), terrestrial
domain (T) or (G) for general cross-cutting
parts. The boxes describe what “action” is
needed, and what is the benefit of
implementing it. The box also informs about
“who” is supposed to act, when the action
0
10
20
30
40
50
60
70
80
Nu
mb
er
of
acti
on
s
Estimated cost
Figure 4. Ranges of estimated costs associated with
actions in this plan

GCOS 2016 Implementation Plan
- 13 -
should be implemented, and how progress on implementation could possibly be measured. The
annual costs are based on estimates, for example for required expert time, standard meeting costs or
cash investments for hardware or software and are presented as broad ranges (Figure 4). For many
of the cost estimates, reference can be made back to the former GCOS Implementation Plan.
The present plan is not merely an update of earlier GCOS implementation plans but addresses new
and broader activities (Figure 5). The GCOS report Status of the Global Observing System for Climate
described the status and gaps in the existing systems and reported on progress against the 2010
Implementation Plan. From these foundations, the new Implementation Plan has been written by a
team appointed by the GCOS Steering Committee. The three GCOS science panels provided the
atmospheric, ocean and terrestrial chapters. The first GCOS Science Conference introduced the draft
of the plan to the broader scientific and user communities and allowed a discussion about the way
forward, including a discussion about the state of the observing system (extensively reviewed in the
GCOS Status Report) current developments and future needs.
Following a peer review by experts and relevant organizations, the draft plan was publicly reviewed
in June 2016 to allow the widest possible range of ideas and perspectives to be accommodated.
Following its approval by the GCOS Steering Committee, the plan was submitted to UNFCCC COP 22.
GCOS would like to thank all those who have contributed to this plan as authors, experts or
reviewers.
The Plan aims to maintain the current global observing systems, while also addressing the new
demands for climate information at a regional and local level. Globally, a reliable network of
networks monitoring the climate system has supported the development of both climate science and
policy. With climate change underway, however, these changes need to be tracked, both globally
and at ever more local levels, as it is at the local level where adaption to climate change will take
place.

GCOS 2016 Implementation Plan
- 14 -
Figure 5. The Implementation Plan will achieve a number of goals supporting improved global and
local climate observations.
Implementing this Plan will (more details in are given in Table 3):
(a) Ensure that the climate system continues to be monitored. The continuing need to monitor
changes in the climate system requires that the current global climate observing system is
actively maintained. The current system has enabled significant improvements in our
understanding of climate change and its drivers. It enables projections of the impacts of a range
of future scenarios to be made and underpins climate change policy such as the UNFCCC Paris
Agreement. The system is fragile, however. Many elements are not guaranteed and some are
supported on a limited-term research basis. Continuing to support and maintain the global
system is necessary;
(b) Improve global, regional and local long-term climate forecasts. Regional and local forecasts
depend both on global models from which they are downscaled and on more detailed local
information. The Implementation Plan aims to improve observations by:
(i) Filling gaps in network coverage. The current global observing system has a number of
gaps, especially in Africa and small island developing States, but also in Asia and South
America. Filling these gaps with additional monitoring sites will both improve the global
models that regional scale forecast depend on and enable more detailed local forecasts to
be made;

GCOS 2016 Implementation Plan
- 15 -
(ii) Refining ECV requirements. In the past, GCOS has provided clear requirements (i.e.
minimum resolution and accuracy) for those ECV products derived mainly from satellite
observations to meet climate science and policy needs. This has been very successful, with
satellite agencies focusing on meeting those needs. Now GCOS is extending the list of
requirements to all ECV products. Observations that meet these requirements and the
GCOS Climate Monitoring Principles will be suitable for use in climate applications. GCOS is
also adding requirements specifically for supporting adaptation;
(iii) Improving techniques. These techniques may include better instrumentation (e.g. for
atmospheric composition), network design (e.g. new ocean networks) or analysis
techniques, such as the derivation of GHG fluxes for atmospheric composition;
(iv) Global cycles. By setting targets for the monitoring of the three major cycles – carbon,
water and energy – GCOS will promote improved monitoring and validation of the data
over the medium to long term.
(c) Support adaptation. Adaptation planning and climate services depend on observations – often
at higher resolution than those for monitoring global climate change. They may be needed to
develop an understanding of the local risks of extreme events and how this is changing or as
part of early warning systems. While GCOS cannot look at every local network that may be
needed, it will develop guidance for all such monitoring to ensure that local data are comparable
with data collected elsewhere and can be used with other global and regional observations and
modelling. GCOS will also develop requirements for high-resolution products that can be
collected globally, such as satellite observations and model and reanalysis products, that are
required to support the more detailed modelling needed at local and regional levels;
(d) Improve the provision of useful information to users. The Implementation Plan identifies
actions needed to Improve access to, and archiving of, data. In order to be useful, data need to
be made readily available to users such as climate scientists, adaption planners and
policymakers. Data should be held in a way that makes the data openly available, uses
appropriate metadata to make the data discoverable and ensures their long-term, indefinite,
archival. Currently, this system works better in some areas than others. Meteorological data
tend to be exchanged and made available, while hydrological data (e.g. lakes and rivers) is often
not made available either to international data centres or to many users;
(e) Observe additional parameters. While most of the ECVs remain unchanged, there are a few new
ECVs that are now possible to observe and add to our understanding of climate change. These
are:
(i) Quantifying anthropogenic greenhouse gas fluxes. GCOS has identified Anthropogenic
Greenhouse Gas Fluxes and oceanic N2O as new ECVs. While a complete monitoring
system for fluxes may take decades to develop and implement, atmospheric composition
measurements (ground-based and satellite) are starting to be able to support existing
emission estimates made for the UNFCCC. While they can add credibility to emission
inventories and have identified mission sources, their current accuracy and resolution are
limited. GCOS will promote and support developments of the observations and analysis
techniques to improve these flux estimates;
(ii) Lightning. It is now possible to monitor lightning in a systematic and accurate way. This is
important, as the impact of increased storms are one topic about which many countries

GCOS 2016 Implementation Plan
- 16 -
are concerned for adaptation planning. Systematic measurements will provide a baseline
and monitoring changes in storminess;
(iii) Biology (marine habitat properties and adding lake colour to the lake ECV). Given the
importance of fish (protein) to the human diet at a global level, improved monitoring of
biological systems and how they are changing is vital;
(iv) Land-surface temperature (LST). This differs from surface temperature – traditionally
measured for weather prediction and used to track climate change (which is an air
temperature about 2 m above the ground). Measured by satellite, it is the radiant surface
temperature and is important for vegetation and ecosystem modelling;
(v) Two ocean properties (ocean-surface stress, ocean-surface heat flux). These are needed
to improve the modelling of ocean systems, especially those that have a link to weather
impacts such as El Niño and storms.
(f) Improve the communication of the state of the climate. Until recently, the main parameter
used in discussions about climate change was atmospheric temperature. There are many other
issues that should also be considered alongside temperature, such as ocean heat content, snow
cover, humidity, ocean acidity, sea level and changes in ice caps, glaciers and sea ice. GCOS will
review the potential indicators and develop a short list that covers the range of climate change
impacts and will thus enable a more complete description of changes in the climate system;
(g) Improve collaboration between those of points (b), (c) and (d) and those involved in providing
better measurement standards, including the metrology community and instrument
manufacturers.
Following the completion and publication of this Plan, its implementation will rely on a broad range
of actors. GCOS itself cannot implement a global observing system for climate. Rather, GCOS
coordinates many activities that each contribute to the overall system. GCOS is the cumulative result
of the contributions of many stakeholders, including international organizations such as WMO and
IOC of UNESCO, space agencies, funding bodies supporting developing countries, national research
organizations and NMHS scientists.
The success of the Implementation Plan relies on all these parties.
The Plan identifies a wide range of actions including those:
(a) By GCOS to address the identification and specification of the current ECVs, the evolution of the
list of ECVs, monitoring of observation systems, production of improvement plans, promotion of
open access to data for all users and coordination of technical development and capacity
building;
(b) By those owning the networks and making the measurements to maintain and improve the
observations and to meet the requirements for climate observation;
(c) By those that host and make available data to make the data easily discoverable and openly
available to all users;
(d) By those that generate and make available integrated products from these data;

GCOS 2016 Implementation Plan
- 17 -
(e) By those using the observations and products, including feedback on “fitness for purpose”,
evolution and provision of new users’ requirements;
(f) By those funding observation/user/data archive, storage, dissemination to maintain and improve
their support, particularly in vulnerable areas;
(g) That improve coordination among those making or supporting observations and user
communities;
(h) By GCOS, its funding organizations and parties to the UNFCCC to support capacity-building and
outreach;
(i) To improve collaboration between those of points (b), (c) and (d) and those involved in providing
better measurement standards, including the metrology community and instrument
manufacturers.

GCOS 2016 Implementation Plan
- 18 -
Table 3. The GCOS Implementation Plan: aims and the goals of actions
Aims Actions Benefits Impacts Parts of the Paris Agreement
supported by this action
Relevant
sections13
Ensure that the
climate system
continues to be
monitored
Ensure sustained resources for networks
Ensure research systems become sustained
with broadened funding support
Ensure observations meet GCOS ECV
requirements and CMP
Provide the ability to monitor
climatic changes and changes in
climate variability
Enable the accurate modelling
and prediction that underpin policy
development and adaptation
planning.
Ensure cost-effective
monitoring
Reduced loss and damage
Increased understanding of
climatic changes leading to better
mitigation decisions
Improved planning for
adaptation to climate change,
emergency preparedness and slow
onset events
Cost-effective observation
system
Art. 7. Adaptation and Early
Warning Systems. Systematic
observations, Adaption planning
Art. 13: para. 7 & 8. Reporting
and transparency framework
Art. 14 Global Stocktake
Art. 5. Mitigation (REDD+)
Art. 8. Loss and damage: Early
warning systems, emergency
preparedness, slow onset events
etc.
Part II,
Chapter
2.1
Part II,
Chapters
3,4 & 5
Monitor ongoing state of ECV observations,
identifying issues and planning improvements
Part II,
Chapter
2.2
Improve global,
regional and local
long-term climate
forecasts
Fill gaps in observation systems, (equipment,
resources, personnel), particularly in areas of
greatest need
Develop regional monitoring plans
GCOS Cooperation Mechanism
Countries have the capacity to
determine their own adaptation
and mitigation needs and policies
Reduction of “blind” spots in
observational systems: reducing
areas vulnerable to climate change
and variability
Art. 7. Adaptation and Early
Warning Systems. Systematic
observations, Adaption planning
Art. 7 para 13 (Support)
Art. 9 Provide finance
Art. 10 Technology Transfer
Art. 11 Capacity Development
Part I,
Chapter 6
Refine accuracy and resolution requirements
of ECV products.
Gives clear guidance and
standards to all climate
observations
Cost-effective comparable
observations
Art. 7. Adaptation and Early
Warning Systems. Systematic
observations, Adaption planning
Art. 14 Global Stocktake
Part II,
Chapters
3, 4 and 5
Promote R&D activities to develop or
demonstrate new or improved approaches.
Take advantage of new technologies
Observational systems improve
in quality and capacity leading to
improving understanding and
predictive abilities.
Improving systems that take
advantage of developments that
can provide better quality at lower
costs.
Improved observation of carbon, water and
energy cycles
Improved understanding of
adaptation and mitigation needs
Detection of potentially
significant changes to these
Part I,
Chapter 5
13 References are to sections in this report. Chapters 3,4 &5 contain too many actions to individually reference them all.

GCOS 2016 Implementation Plan
- 19 -
Aims Actions Benefits Impacts Parts of the Paris Agreement
supported by this action
Relevant
sections13
systems could be missed leading to
unexpected loss and damage
Support adaptation14
Identify requirements for adaptation
Provide guidance for local observations
Encourage provision of high-resolution global
datasets
Assist counties identify their
priority cost-effective monitoring
needs
Ensure comparable
measurements at different
locations
Provide suitable global datasets
Improved adaptation planning,
and emergency response
Reduced impacts, loss and
damage
Art. 7. Adaptation and Early
Warning Systems. Systematic
observations, Adaption planning
Part I,
Chapter 3,
Part II
Chapters
2, 3, 4 and
5
Improve the
provision of useful
information to users
Allow all users access to all climate data by
enabling open data, good metadata,
discoverability and long-term access
Informed decision-making
based on quality, up-to-date data
for global and national climate
change policy and for local
adaptation
Data re-used for multiple
purposes
Improved understanding of
climatic changes leading to
improved planning for adaptation
to climate change and emergency
preparedness.
Cost-effective use of
information
Art. 7. Adaptation and Early
Warning Systems. Systematic
Observations, Adaption planning
Art. 14 Global Stocktake
Part II,
Chapter
2.3
Provide processed data products, based on
observations, required information to users,
especially to support climate services such as
GFCS
Part II
Chapter
2.4
Part II
Chapters
3,4 & 5
Observe additional
parameters
Quantifying anthropogenic greenhouse gas
fluxes
Support to emission inventories
and reporting. Improved
understanding of uncertainties
Increased confidence in
emission and removal estimates
leading
Art 4. Nationally determined
contribution
Art. 7. Adaptation and Early
Warning Systems. Systematic
Observations, Adaption planning
Art. 14 Global Stocktake
Part I
Chapter 5
Actions
T67-71
Biology (marine habitat properties and
adding Lake colour to the Lake ECV) and Land
Surface Temperature
Improved monitoring and
prediction of impacts on biological
systems and changes in carbon
cycle
Monitoring of Inclusion of
important biological systems (e.g.
fisheries) in global observation
system
Art. 7. Adaptation and Early
Warning Systems. Systematic
observations, Adaption planning
Art. 14 Global Stocktake
Part II
Chapters
4.4 & 5.3
14 While these actions are specifically aimed at supporting adaptation, many of the other actions will also contribute to supporting adaptation even though that is not their primary goal.

GCOS 2016 Implementation Plan
- 20 -
Aims Actions Benefits Impacts Parts of the Paris Agreement
supported by this action
Relevant
sections13
Lightning and two Ocean properties (ocean
surface stress, ocean surface heat flux)
Improved monitoring and
prediction of weather and storm
impacts
Improved monitoring of
extreme weather: major concern
for many countries
Part II,
Chapters
3.2.2 and
4.2
Improve the
communication of
the state of the
climate
Develop agreed list of indicators useful for
communicating climate change and adaption
needs
Better communication and
wider understanding of the full
range of the impacts and drivers of
climate change
Improved understanding of the
wide range of impacts of climate
change and need for adaptation
Improved preparedness and
planning
Art. 12. Improve public
communications
Part I,
Chapter
3.3
Develop plan that communicates need for
observations, their requirements and GCOS’s
role.
Improved support for
observations
Understand need to maintain
systems
Improved planning and
preparedness leading to reduced
loss and damage
Art. 12. Improve public
communications
Art. 9 Provide finance
Art. 12 Capacity development
Part I,
Chapter
6.4

GCOS 2016 Implementation Plan
- 21 -
3. OBSERVATIONS FOR ADAPTATION, MITIGATION AND
CLIMATE INDICATORS
3.1 Adaptation
Adaptation and mitigation are key parts of the UNFCCC Paris Agreement: GCOS considers adaptation
in many parts of this Plan and this section gives an overview of how it can support adaptation.
The last decade has seen an increasing demand for reliable climate information and services from
key sectors, including insurance, agriculture, health, water management, energy and transportation.
This demand is expected to grow further against the backdrop of a changing climate.
At the international level, the importance of high-quality, reliable and timely climate services has
been recognized in the GFCS, a UN-led initiative instigated at World Climate Conference-315. In the
GFCS high-level plan16, a climate service is defined as “climate information prepared and delivered to
meet a user’s needs”. A climate service includes the timely production and delivery of science-based
trustworthy climate data, information and knowledge to support policy- and other decision-making
processes.
To be effective, climate services should be designed in collaboration with customers and
stakeholders, be based on free and open access to essential data and include user feedback
mechanisms. By exploiting the full potential of the climate observing system, climate research
combined with improved climate modelling innovates and stimulates new areas of service
development. Thus, GFCS has five pillars (components): User Interface Platform; Climate Services
Information System; Observations and monitoring; Research, modelling and prediction; and Capacity
development.
The value of GCOS’s contribution to the Framework is clear, and its fundamental importance was
recognized by Seventeenth World Meteorological in its Resolution 39 (Cg-17).
There are already initiatives at different scales whose observation and monitoring protocol and
standards are often determined by GCOS requirements. One example is the Climate Change Service
of the European Union’s Copernicus programme. This service will give access to information for
monitoring and predicting climate change and will, therefore, help to support adaptation and
mitigation. It benefits from a sustained network of in situ17 and satellite-based observations,
reanalysis of the Earth’s climate and modelling scenarios based on a variety of climate projections.
The service will provide access to several climate indicators (temperature increase, sea level rise, ice
15
World climate conference-3, Geneva, 31 August – 4 September 2009, Conference statement and Conference declaration.
http://www.wmo.int/gfcs/wwc_3 16
WMO, 2011: Climate Knowledge for Action: a Global Framework for Climate Services – Empowering the Most Vulnerable.
WMO-No. 1065, WMO, Geneva. 17
For convenience, in situ in this publication refers to non-satellite observations, although this may include airborne and
remote, ground-based observations.

GCOS 2016 Implementation Plan
- 22 -
sheet melting, ocean warming) and climate indices (based on records of temperature, precipitation,
drought event) for both the identified climate drivers and the expected climate impacts.
Additionally, at the national level, there have been many successful developments in the last five
years. Notable examples are Climate Service UK, Deutscher Klimadienst (DKD), US National Weather
Service Climate Services and the Swiss National Centre for Climate Services. The GFCS website also
provides information about the Programme for implementing GFCS at Regional and National Scales
which aims to enhance resilience in social, economic and environmental systems to climate
variability and change. Funded by a grant from Canada, the programme will implement GFCS in the
Pacific, the Caribbean, South Asia and the Arctic. This will be achieved by providing improved climate
information, predictions, products and services to support climate risk management and adaptation
strategies, decision-making and actions at national and regional level.
To develop this Implementation Plan, at recent workshops 18 , a range of participants from
governments, international organizations, the private sector and academia have discussed
observational needs. These workshops noted a flow of information from observations that produce
data and then information which informs adaptation planning and better defines observational
needs. GCOS’s role in this chain was identified as facilitating and enhancing systematic observations.
Some of the conclusions19 were:
(a) The need to clearly describe the role of GCOS and other partners in enabling the flow of
information described above;
(b) Good, publicly available and standardized data, in particular at regional, national and local levels
on the vulnerability of key sectors to the impacts of climate change is essential. Terrestrial and
ocean observations need improvement, in particular in coastal zones and mountain regions;
(c) Adaptation planning and assessment require a combination of baseline climate data and
information, coupled with national data relevant to the specific aspects of adaptation (including
different sectors) in question;
(d) The value of observations to adaptation should be clearly articulated;
(e) One or more well-described case studies in Non-Annex I Parties could be used to demonstrate
the value of observations to adaptation;
18 The First GCOS Science Conference: Global Climate Observation: the Road to the Future. Amsterdam, Netherlands, March
2016 (http://www.gcos-science.org).
GCOS Workshop on Observations for Adaptation to Climate Variability and Change. Offenbach, Germany, 26–28 February
2013, http://www.wmo.int/pages/prog/gcos/Publications/gcos-185.pdf.
Joint GCOS/GOFC-GOLD Workshop on Observations for Climate Change Mitigation. Geneva, 5-7 May 2014
http://www.wmo.int/pages/prog/gcos/documents/GCOS-191.pdf.
GCOS Workshop on Enhancing Observation to Support Preparedness and Adaptation in a Changing Climate – Learning from
the IPCC 5th Assessment Report. Bonn, Germany, 10–12 February 2015.
http://www.wmo.int/pages/prog/gcos/Publications/gcos-166.pdf 19
See GCOS Workshop on Enhancing Observation to Support Preparedness and Adaptation in a Changing Climate (Footnote
7).

GCOS 2016 Implementation Plan
- 23 -
(f) Guidance and guidelines (or references to other sources of advice such as WMO) on data
collection and sources of products, as well as their limitations, are needed. A key role for GCOS
will be to establish and maintain requirements at a global level to support the collection and
dissemination of national observations. This material will cover specified quality standards
(including latency, resolution and uncertainties), documentation required to accompany the data
(including metadata), and the identification of where and how internationally available data can
be accessed;
(g) Coordination among observation systems at different scales from subnational to global to inform
adaptation should be promoted through relevant focal points and national coordinators, as well
as Regional Climate Coordinators and alliances;
(h) The research and development community need to support the development of indicators
linking physical and social drivers relating to exposure, vulnerability and improved resilience in
line with national requirements.
The workshops also noted that, currently, global climate models and satellite-based observing
systems are useful in supporting decisions from national to global scales, but are inadequate for
subnational to local decision-making as the spatial resolution of their products is too coarse. While in
some cases such products can be downscaled with reference to ground-based in situ stations, there
tends to be only a few, widely dispersed stations which often lack sufficiently long time series of
data. Satellite-based observation systems, reanalyses and global circulation models therefore need
to move towards generating higher spatial resolution products. Further investments are needed to
improve the in situ observations made by a range of parties: NMHSs, non-NMHS agencies such as
agricultural departments, and even the general public (citizen scientists). The focus should be on
efforts in regions where change is most rapid or variability is more pronounced and where the impact
of climate on a sector is the largest and vulnerability is the highest, such as small island States,
coastal regions and mountains.
3.1.1 Supporting adaptation
In order to improve the availability of observations for adaptation it is recommended that relevant
organizations and parties:
(a) Identify priority observational needs; focus on regions where climate change will have significant
sector effects and where there are vulnerable populations. Consider baseline climate data and
information, coupled with sector-specific and other economic demographic data at regional,
national and local scales;
(b) Provide sustainable resources to implement networks to meet the identified observational
needs;
(c) Provide public access to high quality and standardized data on the vulnerability of key sectors to
climate change impact that meets the GCOS Climate Monitoring Principles and any relevant
GCOS Guidelines or product requirements;
(d) Develop infrastructure and governance to support sustained data rescue (historical data are
highly valuable, but data rescue and distribution in accessible digital forms can potentially be
very resource-intensive);

GCOS 2016 Implementation Plan
- 24 -
(e) Review, assess and evaluate the progress, achievements and limitations encountered by the
relevant organizations in the process of improving availability of observations within specific time
frames in order to foster knowledge exchange and support implementation.
3.1.2 How GCOS will support adaptation
Addressing adaptation cuts across much of this workplan and many of the actions described in this
publication are just as appropriate for local adaptation issues as for global understanding of the
climate (e.g. data stewardship, metadata and refinement of requirements). Table 4 lists the main
actions needed to address adaptation and indicates where these are included herein. In addition,
two specific actions (See Actions G1 and G2) target adaptation in particular; the production of high-
resolution data and provision of guidance and best practice.
An important step will be defining the requirements for adaptation. Requirements are needed for
local observations, high-resolution global datasets and data produced from modelling, downscaling
and reanalysis. GCOS will adopt a staged approach to define these actions (Action G13):
(a) A survey by the GCOS secretariat will compile readily available information on observational
needs from adaptation projects and experts. GFCS should be a major contributor to this
exercise. The GCOS secretariat will compile this information identifying each variable needed, its
application area and the required accuracy. This understanding of users’ needs could also lead
into the development of guidance and best practice. This publication is intended to stimulate
discussion and not be a final product itself;
(b) A workshop will be organized to consider this compilation of adaptation needs. Participants will
be mainly from the adaptation community with some experts from the GCOS science panels to
give advice on the practicality of the demands. The output from this meeting will be a revised
document giving a first overview of observational needs for adaptation. This workshop should be
a joint exercise, perhaps with GFCS and UNFCCC;
(c) The draft will be reviewed and the panels will consider it before it is accepted by the GCOS
Steering Committee. This should be in late 2017.
This should be a living tool that will be developed over time as the understanding and needs of users
develop and observational experience and expertise increase.
Two particular areas of planned GCOS activities that have a considerable overlap with adaptation
needs are:
(a) Regional workshops and plans. GCOS organized a Regional Workshop programme from 2000 to
2005, and has been invited again by UNFCCC SBSTA to collaborate with relevant partners to
continue enhancing access to, and understanding and interpretation of, data products and
information to support decision-making on adaptation and mitigation at national, regional and
global scales. The regional work programme envisaged would be an ideal forum to discuss
adaption needs, promote guidance and best practice and design projects to improve
observational networks;
(b) Communication plan. The GCOS Steering Committee has requested a communication plan.
Topics of particular relevance to supporting adaption will be:

GCOS 2016 Implementation Plan
- 25 -
(i) Promoting the importance of observations, guidance and best practice, the role of GCOS,
the needs of countries and working with partners;
(ii) Communicating and encouraging the use of standardized metadata; and
(iii) Open access to data is an important role for GCOS.

GCOS 2016 Implementation Plan
- 26 -
Table 4. Actions for adaptation
Action Description WHO Related GCOS Actions
Req
uir
emen
ts a
nd
guid
ance
Define user needs GCOS and the observation community identify and understand the needs of user communities and issues they aim to serve. GCOS should work with user communities to define regional requirements.
GCOS Regional workshops (G8) Development of requirements (G10) Communication plan (G9)
Provide guidance Produce and disseminate advice on using the global and regional requirements at national and local level, and guidance and best practice on prioritization of observations, implementation, data stewardship and reporting. Promote the use of this guidance by parties and donors. Review the use of this guidance and requirements and revise as needed.
GCOS Provide advice and guidance (G10-13, Part II, Chapters 2–4) Communication plan (G9) Regional workshops (G8)
Acq
uir
ing
dat
a
Produce high-resolution data
Encourage satellite-based observation systems, reanalyses and global circulation models to move towards generating spatially higher-resolution products.
GCOS Development of requirements (G10)
Data rescue Communicate the value of historical data as a public good and promote data rescue as an essential task. (See Part II, Section 2.4.2).
WMO, GCOS Data Rescue (G26-30) Communication plan (G9)
Invest in observations
Investments are needed to improve the in situ network of stations for climate, water, greenhouse-gas fluxes, biodiversity and others (Parties should invest in their own observations: support is also needed in countries with fewer resources. Part I Chapter 6).
Parties GCOS cooperation mechanism (G6) Communication plan (G9)
Dat
a
Improve data stewardship
Improve information on data availability, quality, traceability, uncertainty and limits of applicability, and establish and improve mechanisms to provide both access to data and information regarding data contents. Improve data management (see Part II, Section 2.3).
GCOS Define and use metadata Mechanism to discover data, Open Data (Part II, Chapter 2.3)
Clim
ate
Serv
ices
Climate services Present the information derived from the observations in a form that is relevant to the purposes of the diverse range of decision-makers and users addressing issues such as vulnerability and adaptation assessments, monitoring and evaluation, risk assessment and mitigation, development of early warning systems, adaptation and development planning and climate-proofing strategies within and across sectors.
GFCS Indicators (Part 1 Chapter 3.3)
GFCS GFCS has a leading role in improving feedback mechanisms between data providers and users through the User Interface Platform, to inform GCOS in supporting the GFCS Observations and monitoring pillar.
GFCS Refine requirements (G10)
Co
ord
inat
ion
Coordination There is a need to clarify responsibilities, define focal points for specific topics, build synergies and generally strengthen cooperation among UN programmes, as well as to consider how GCOS can use its reporting systems through WMO, UNFCCC, IOC and others to reach out to different communities and to be recognized as an authoritative source of validated information that is relevant to users’ needs.
GCOS, GFCS, IOC, WMO, UNFCCC, Parties
Coordination actions (role of GCOS and its science panels)
Long-term research and observations
Support research initiatives such as WCRP, UNEP’s PROVIA and ICSU’s Future Earth, as well as global and regional investments in observations likely to meet future needs for long-term data, such as the Monitoring for Environment and Security in Africa programme (MESA). Research is needed to define standards and reference-grade stations.
GCOS, ICSU, UNEP
Research actions (several actions in Part II, Chapters 2-4)

GCOS 2016 Implementation Plan
- 27 -
3.2 Mitigation
Mitigation of climate change is a human intervention to reduce the sources or enhance the sinks of
greenhouse gases. Monitoring of GHG concentrations, and ocean and land sources and sinks all lead
to informing mitigation strategy and implementation. Thus, observations of the atmospheric
composition ECVs (carbon dioxide (CO2)), methane (CH4), nitrous oxide (N2O), and other long-lived
GHGs) and of ECVs monitoring other parts of the carbon cycle are also needed, such as: the ocean
carbonate system, land use and land cover, and fires.
The estimates of national emissions and removals used by Parties to the UNFCCC in designing and
monitoring mitigation actions are produced using the 2006 IPCC Guidelines for National Greenhouse
Gas Inventories and its supplements. Observations can support this process in a number of ways:
Action G1: Guidance and best practice for adaptation observations
Action Produce guidance and best practice for climate observations for adaptation. This would include advice
on using the global and regional requirements at a national and local level, and guidance and best
practice on prioritization of observations, implementation, data stewardship and reporting. Promote the
use of this guidance by parties and donors. Review the use of this guidance and requirements and revise
as needed.
Benefit Encourage high-quality, consistent and comparable observations.
Time frame Version one available in 2018, thereafter review and refine, as needed.
Who GCOS in association with users and other stakeholders
Performance
indicator
Availability and use of specifications
Annual cost US$ 10 000–100 000
Action G2: Specification of high-resolution data
Action Specify the high resolution climate data requirements:
In response to user needs for climate adaptation planning, develop high-resolution observational
requirements and guidance and distribute widely;
Promote coordination among climate observation systems at different scales from subnational to
global, particularly through relevant focal points, national coordinators and regional climate
centres and alliances;
Ensure that this work responds to other work streams under UNFCCC’s Research and Systematic
Observation agenda item and the SDGs;
Ensure these data are openly accessible to all users.
Benefit Develops a broad understanding of climate observational needs. Ensures consistency of climate
observations and thus enables their wide use.
Timeframe 2018 and ongoing thereafter
Who GCOS in association with users and other stakeholders
Performance
indicator
Availability and use of specifications
Annual cost US$ 10 000–100 000

GCOS 2016 Implementation Plan
- 28 -
(a) Satellite observations of changes in land cover are an important input into estimates of emissions
from the “land use, land-use change and forestry” LULUCF sector;
(b) Forest mitigation efforts, such as REDD+, depend on forest monitoring that combines satellite
observations with ground-based measurements (for example,see GEO’s Global Forest
Observations Initiative and the United Nations Collaborative Programme on Reducing Emissions
from Deforestation and Forest Degradation in Developing Countries (UN-REDD);
(c) While atmospheric concentration measurements cannot replace inventory-based estimates of
emissions and removals, they can be used to support the improvement of inventory estimates by
providing independent evidence of the completeness of the estimates.
This new Implementation Plan describes a new ECV – anthropogenic greenhouse-gas fluxes. Actions
related to this ECV will promote better use of the IPCC Guidelines to improve global estimates,
promote better understanding of the land and ocean sinks, and support national emission
inventories through the use of atmospheric composition observations.
Specific mention is also made of the need for support estimates of point source fluxes from emission
sources such as fossil fuel power plants and petrochemical complexes. These measurements of
downwind concentrations, to be made from space-based platforms under development at the time
of publication, will augment the bottom-up approaches of the IPCC Guidelines and allow improved
integrated estimates of emissions, in line with the requirements of the Paris Agreement for global
stocktaking with a five-year repeat. The first global stocktaking in 2023 will benefit from prototype
systems that are expected to develop into a more operational system thereafter.
The use of multiple ECVs may also support the planning and monitoring of mitigation. These include
soil carbon, above-ground biomass, land cover and fire disturbance. GCOS will ensure that all these
ECVs are monitored consistently.
3.3 Climate Indicators
3.3.1 Indicators of ongoing climate change
The Paris Agreement aims to hold “the increase in the global average temperature to well below 2°C
above pre-industrial levels and to pursue efforts to limit the temperature increase to 1.5°C above
pre-industrial levels”. It also recognizes the importance of averting, minimizing and addressing loss
and damage associated with the adverse effects of climate change, including extreme weather
events and slow onset events, and the role of sustainable development in reducing the risk of loss
and damage. This leads to a need for a new comprehensive set of climate indicators. While surface
temperature is the indicator fundamental to the aim of the Paris Agreement, it has proved
problematic when used alone for communicating the impacts and evolution of climate change and
does not cover the range of impacts of concern. The annual WMO Statement on the Status of the
Climate20 covers a number of parameters such as temperature, precipitation, snow cover, ocean heat
content, sea level and the cryosphere which are supported by GCOS.
20
For 2015, see http://library.wmo.int/pmb_ged/wmo_1167_en.pdf

GCOS 2016 Implementation Plan
- 29 -
Describing climate change in a holistic way demands indicators of ongoing change such as increasing
ocean acidity, melting glaciers, decreasing snow and changes in vegetation characteristics and
distributions and land-cover changes. Such a set of indicators should be able to convey a broader
understanding of the state and rate of climate change to date and highlight its likely physical
consequences. It will be equally important to develop indicators related to future climate change:
following COP 21, policymakers will need reliable evidence of the impacts of climate change on
society, including the increasing risks to infrastructure, food security, water resources and other
threats to humankind. These are discussed below.
Many different agencies already produce lists of climate indicators or vital signs. They are, however,
all different, often biased towards one geographical or thematic community and have different
sources or provenance. GCOS will identify a single defined list of a limited number (perhaps six)
indicators of global applicability and general interest, together with the primary reference sources
for the basic data, without setting priorities or preferences among the sources.
Action G3: Development of indicators of climate change
3.3.2 Indicators for future policy support and assessment of climate risk
Following the successful drafting of the Paris Agreement, policymakers will need more
comprehensive and informative indicators to understand and manage the consequences of climate
change. These need to go beyond the indicators of change to date, described above. They will be
based primarily on information provided through the ECVs but will require integration with further
relevant information deriving from socioeconomic, demographic and other data. They will be a
measure of progress of adaptation and will allow policymakers to understand the consequences of
the decisions taken in Paris.
Better information of this type will form the basis for improved decisions support tools. These will
provide policymakers with the means to assess the outcomes of the implementation of climate
policies to date and inform future decisions.
A better assessment of the evolution of climate risk will also be needed as an essential complement
to historical descriptors of changing climate. Climate change will increase the frequency of high-risk
events and disasters; the return risk for major events can evolve very rapidly. For example, in
Europe, the return period of a heatwave has narrowed from 52 (14–444) years in 1990–1999 to 5
Action Devise a list of climate indicators that describe the ongoing impacts of climate change in a holistic way.
Consider the work of WMO, IPCC and others. Indicators may include: heating of the ocean, rising sea
level, increasing ocean acidity, melting glaciers and decreasing snow, changes in Arctic sea ice, changes
in vegetation characteristics and distributions and land-cover changes.
Benefit Communicate better the full range of ongoing climate change in the Earth system
Time frame 2017
Who GCOS in association with other relevant parties, including WMO and IPCC
Performance
indicator
Agreed list of indicators (for example, 6 in number)
Annual cost US$10 000–100 000

GCOS 2016 Implementation Plan
- 30 -
(2.7–11) years in 2003–201221. Such events are of major practical importance and relevance to
policymakers. It will become increasingly necessary to be able to understand their likelihood given
the prior probabilities of evolving climate scenarios. This will be particularly important in the case of
systemic risk22 as defined by King et al. by comparison with the direct risks of climate change23.
21
Christidis, N., G.S. Jones and P.A. Stott, 2014: Dramatically increasing chance of extremely hot summers since the 2003
European heatwave. Nature Climate Change 5 pp 46-50 DOI:10.1038/NCLIMATE2468 22
Systemic risks may be simply defined as “risks that can trigger unexpected large-scale changes of a system, or imply
uncontrollable large-scale threats to it” i.e. what, in the context of a changing climate, we might do to each other – the
“systemic risks” arising from the interaction of climate change with systems of trade, governance and security. 23
King, D., D. Schrag, D. Zhou, Y. Qi and A. Ghosh, 2015: Climate Change – A Risk Assessment. Centre for Science and Policy,
Cambridge, United Kingdom.
Action G4: Indicators for adaptation and risk
Action Promote definition of, and research supporting, the development of indicators linking physical and
social drivers relating to exposure, vulnerability and improved resilience, in line with national
requirements
Benefit Tracking of progress of climate change and adaptation, improved capacity to respond and avoid loss.
Timeframe 2017
Who GCOS with relevant agencies and national bodies
Performance
indicator
Definition and development of relevant risk assessments
Annual cost US$ 10 000–100 000

GCOS 2016 Implementation Plan
- 31 -
4. THE BROADER RELEVANCE OF CLIMATE OBSERVATIONS
Loss of biodiversity and land degradation, two major environmental issues addressed by the
UNFCCC's sibling Rio Conventions, share a number of observational requirements with UNFCCC: both
biodiversity and desertification are affected by climate change and climate variability. Similar shared
observational needs also arise with the 1971 Convention on Wetlands of International Importance
(Ramsar Convention) dealing with the conservation and use of wetlands. This shares the same global
scope as the three Rio Conventions and acknowledges the importance of wetlands for climate
change mitigation and adaptation. The more recent (2015) international adoption of Agenda 2030
and its 17 Sustainable Development Goals (SDG) includes Climate Action, while the 2015–2030
Sendai Framework for Disaster Risk Reduction recognizes the importance of addressing climate-
related risks. In the spirit of the Paris Agreement this stage of GCOS’s implementation aims to
strengthen systematic observation of the climate system in a manner that informs climate services
and supports decision-making across a broad spectrum of users, including those working in related
areas of the three Rio Conventions, Agenda 2030, Ramsar and the Sendai Framework. Global-scale
systematic observations are undoubtedly a feature of other multilateral environmental agreements
(MEA) and International actions (e.g. the Washington Convention (CITES), the Antarctic Treaty,
Convention Concerning the Protection of the World Cultural and Natural Heritage and the Vienna
Convention for the Protection of the Ozone Layer), and coordination with a broader constituency of
partners will be addressed in the future.
4.1. Rio Conventions
The three Rio Conventions have distinct mandates, varied membership and follow different
processes and procedures. A Joint Liaison Group between the secretariats of CBD, UNFCCC and
UNCCD was established in 2001 with the aim of enhancing coordination between the three
Conventions and to explore options for further cooperation. The Joint Liaison Group subsequently
developed a paper setting out options for enhanced cooperation that identifies research and
systematic observation as one element where such cooperation is desirable.
The Conventions’ requirements for systematic observations differ according to whether these are
used to strengthen scientific understanding underpinning the Conventions’ goals, for reporting or for
monitoring and guiding implementation. A set of variables common to more than one Convention
would, however, improve information exchange between them, deliver savings (or as a minimum
incur no additional costs), allow shared capacity-building and outreach, and would focus the
demands made on core “providers” such as the space agencies.
All three of the Rio Conventions have made formal decisions promoting/supporting systematic
observations, and all three have developed lists endorsed by their respective scientific advisory
bodies and associated processes. As set out in this Plan, UNFCCC has 52 ECVs, some of which
encompass a number of different products. CBD has developed six classes of Essential Biodiversity
Variables (EBVs), including a subset with strong potential for measurement using satellite remote-
sensing. In particular, these offer potential for synergy with satellite-derived ECVs. CBD is also
developing a list of Indicators linked to its targets. UNCCD has six progress indicators addressing the
strategic objectives for its UNCCD 2008–2018 ten-year strategy.

GCOS 2016 Implementation Plan
- 32 -
A subset of at least 16 of the ECV corresponds to one or more of the EBVs, trends to monitor the
strategic plan for biodiversity 2011–2020 and/or a UNCCD progress indicator. Furthermore, many of
the agents for implementation engaged by the three Rio Conventions are common to all. While
WMO and GEO both have facilitative roles, NMHSs, the Committee on Earth Observation Satellites
(CEOS) and the Coordination Group for Meteorological Satellites (CGMS) are more directly involved
with implementation.
Recognition of the above mechanisms for stronger collaboration should be established while
respecting the individual mandates and independent legal status of each Convention.
4.2. Agenda 2030 and the Sustainable Development Goals
Agenda 2030 sets out a plan of action for
people, planet and prosperity. This plan is
accompanied by a set of goals (see Box 3)
that, if reached, will see significant shifts
towards the eradication of poverty and the
creation of a more equal, sustainable and
resilient world. The 17 Sustainable
Development Goals (SDGs) and 169 targets
adopted by United Nations Member States in
September 2015 will frame many global policy
agendas and stimulate action over the next
15 years. Acknowledging that UNFCCC is the
primary international, intergovernmental
forum for negotiating the global response to
climate change, Goal 13 unequivocally states
the need to take urgent action to combat
climate change and its impacts in the overall
sustainable development context.
Achieving some of the targets of the SDGs will
require systematic observations. For example,
Goal 13 includes a target to “Integrate climate
change measures into national policies,
strategies and planning”. The systematic
observations described in this Plan provide a
framework for part of such climate measures.
The Plan also has actions that contribute to
improving adaptive capacity, capacity-building
and awareness-raising. Just as ECVs are
relevant to the other Rio Conventions, so too
are they relevant to SDGs in addition to climate
(Table 5). Goals 6, 7, 11, 12, 14 and 15 are all
of immediate relevance.
Table 5. The Sustainable Development Goals linked to
the climate observations, as categorized in Table 2

GCOS 2016 Implementation Plan
- 33 -
4.3 Ramsar Convention
Wetlands are the largest terrestrial reservoir of carbon and understanding them is crucial for
understanding and predicting changes to the carbon cycle. The Ramsar Convention is an
intergovernmental treaty that provides the framework for national action and international
cooperation for the conservation and wise use of wetlands and their resources. It includes all lakes
and rivers, underground aquifers, swamps and marshes, wet grasslands, peatlands, oases, estuaries,
deltas and tidal flats, mangroves and other coastal areas, coral reefs, and all human-made sites such
as fish ponds, rice paddies, reservoirs and salt pans. The hydrology ECVs and those relating to human
Box 3: The Sustainable Development Goals
Goal 1. End poverty in all its forms everywhere
Goal 2. End hunger, achieve food security and improved nutrition and promote sustainable
agriculture
Goal 3. Ensure healthy lives and promote well-being for all at all ages
Goal 4. Ensure inclusive and equitable quality education and promote lifelong learning
opportunities for all
Goal 5. Achieve gender equality and empower all women and girls
Goal 6. Ensure availability and sustainable management of water and sanitation for all
Goal 7. Ensure access to affordable, reliable, sustainable and modern energy for all
Goal 8. Promote sustained, inclusive and sustainable economic growth, full and productive
employment and decent work for all
Goal 9. Build resilient infrastructure, promote inclusive and sustainable industrialization and foster
innovation
Goal 10. Reduce inequality within and among countries
Goal 11. Make cities and human settlements inclusive, safe, resilient and sustainable
Goal 12. Ensure sustainable consumption and production patterns
Goal 13. Take urgent action to combat climate change and its impacts
Goal 14. Conserve and sustainably use the oceans, seas and marine resources for sustainable
development
Goal 15. Protect, restore and promote sustainable use of terrestrial ecosystems, sustainably manage
forests, combat desertification, and halt and reverse land degradation and halt biodiversity
loss
Goal 16. Promote peaceful and inclusive societies for sustainable development, provide access to
justice for all and build effective, accountable and inclusive institutions at all levels
Goal 17. Strengthen the means of implementation and revitalize the global partnership for
sustainable development
GCOS 2016 Implementation Plan
- 34 -
use of resources are of immediate relevance to the Ramsar 2016–2024 strategic plan, especially
concerning trends in wetlands, its work on building inventories of wetlands, the goals of increasing
the scientific basis for advice and noting that “the critical importance of wetlands for climate change
mitigation and adaptation is understood”. Identification of synergies is again highly desirable and
GCOS should establish appropriate links with the Convention to this end.
4.4 Sendai Framework for Disaster Risk Reduction 2015-2030
The Sendai Framework is a 15-year, voluntary, non-binding agreement. It recognizes that nation
States have the primary role to reduce disaster risk but that responsibility should be shared with
other stakeholders. Its aims are “the substantial reduction of disaster risk and losses in lives,
livelihoods and health and in the economic, physical, social, cultural and environmental assets of
persons, businesses, communities and countries”.
While 49% of disasters are climate-related, they are responsible for 96% of the people affected and
76% of the value of the damage (EMdat database24, average 1980–2015).
The Framework recognizes the important role of climate-related risks and specifically targets
“coherence and mutual reinforcement between the Sendai Framework for Disaster Risk Reduction
2015–2030 and international agreements for development and climate action”. This seeks explicit
reference to the framework in international instruments. GCOS recognizes the valuable role climate
services can play in understanding and managing climate-related disaster risk, as well as in enhancing
disaster preparedness. This present Plan recognizes that maximizing these benefits will require
linked mechanisms for monitoring and reporting and to promote cooperation in implementation.
The first steps need to be taken by GCOS reaching out to counterparts in the United Nations Office
for Disaster Risk Reduction.
24 EM-DAT: Centre for Research on the Epidemiology of Disasters (CRED)/Office of Foreign Disaster Assistance (OFDA)
International Disaster Database, Université Catholique de Louvain, Brussels, Belgium (www.emdat.be)

GCOS 2016 Implementation Plan
- 35 -
Action G5: Identification of global climate observation synergies with other multilateral
environmental agreements
Action
Ensure a scientifically rigorous assessment of the exact requirements of common variables and identify
a common set of specifications between GCOS and CBD and UNCCD;ensure that maximum benefit is
taken from GCOS ECVs in implementing the SDG process, including addressing multiple-benefits across
SDG goals, fulfilling the climate specific goal (SDG-13) and providing support to transparent global
development and climate finance prioritization (SDG-17); explore how ECV data can contribute to: (a)
The Ramsar Convention; (b) the Sendai Framework for Disaster Risk Reduction; (c) other MEAs.
Benefit Improved information exchange between Conventions, cost savings, shared capacity-building and
outreach, and coordinated approaches to observation providers
Time frame Ongoing (2017 for Rio conventions, 2018 for Ramsar and Sendai)
Who GCOS, CBD Secretariat, UNCCD Secretariat and the Global Mechanism, GEO Secretariat and GEO
Biodiversity Observation Network;
GCOS and sponsors + Parties (through national statistics offices) and GEO (GEO initiative on the SDGs
(GI-18));
GCOS, Ramsar Convention, Open-ended Intergovernmental Expert Working Group on Indicators and
Terminology Relating to Disaster Risk Reduction, ICSU-ISSC-UNISDR programme IRDR, Secretariats of
other MEAs.
Performance
indicator
Climate service components optimized for disaster risk reduction
Annual cost US$ 10 000–100 000

GCOS 2016 Implementation Plan
- 36 -
5. CONSISTENT OBSERVATIONS ACROSS THE EARTH SYSTEM
CYCLES
The Earth’s energy, water and biogeochemical cycles play a fundamental role in the Earth’s climate.
Indeed, current climate change is driven by the interaction of the gaseous phases of the carbon and
nitrogen cycles and radiative properties of the atmosphere. GCOS has traditionally focused more on
state variables of the system and less on fluxes. The original ECVs in previous implementation plans
were designed largely on the basis of individual usefulness and maturity; in recent years, much use
has been made of climate records based on ECVs to close budgets of energy, carbon and water and
to study changes in growth rates of atmospheric concentrations or interaction among land, ocean
and atmosphere in a more integrated way. This new perspective on the importance of the Earth
cycles in the selection of ECVs allows us to identify gaps and where ECVs contribute to fundamental
understanding of the cycle. Closing the cycles will allow improved forecasts of the impacts of climate
change. In particular, closing the Earth’s energy balance and the carbon and water cycles through
observations is still an outstanding scientific issue that requires high-quality climate records of key
ECVs. If key pools or state variables are missing, these budgets cannot be closed. Importantly,
closing the budget of a cycle requires attention to the exchange fluxes between the domains of
atmosphere, land, ocean and ice.
The fluxes in the water and energy cycles are linked through the latent heat flux exchange between
ocean and atmosphere and land and atmosphere. In this Implementation Plan, latent and sensible
heat fluxes over the ocean are a new ECV with actions on similar fluxes over land to demonstrate the
feasibility of their observation on a global scale.
For carbon fluxes, exchanges between the ocean and atmosphere need to be estimated, as well as
those between land and atmosphere, and between land and ocean through transport of organic
material by rivers. The inclusion of a new ECV on anthropogenic fluxes of GHGs provides the key
driver of changes in the carbon cycle. These fluxes are mainly from fossil-fuel combustion, cement
production and land use and land-use change. Also significant are the fire disturbance, soil carbon,
land use and above-ground biomass ECVs.
This Plan presents four targets for overall closing of the cycles and budgets based on observations.
GCOS realizes that these targets may not be met immediately; indeed, they may take a decade or
more to achieve, but they provide an assessment of how good the overall observations should be
and should lead to improvements in individual ECV observations. These targets will eventually be
met by achieving the individual ECV requirements.
The targets for the carbon cycle are given in Box 4. Below-ground biomass is not yet an ECV; it is
currently estimated from above-ground biomass, following IPCC methods. It needs to be identified
as a separate term and may become an ECV at some stage if suitable, large-scale monitoring
methods can be identified. Another missing flux is the land-sea flux of carbon that is not currently
observed globally and is not well understood. A joint action by TOPC and OOPC may be needed to
consider this need.

GCOS 2016 Implementation Plan
- 37 -
Accumulation of carbon dioxide and other greenhouse gases in the atmosphere, such as methane, is
monitored by the atmospheric composition ECVs and in the oceans as part of the carbonate system.
Anthropogenic GHG fluxes is a new ECV in this new Implementation Plan.
Box 4: Closing the carbon budget
Targets Quantify fluxes of carbon-related greenhouse gases to +/- 10% on annual timescales Quantify changes in carbon stocks to +/- 10% on decadal timescales in the ocean and on land, and to +/- 2.5 % in the atmosphere on annual timescales
Who Operators of GCOS-related systems, including data centres Time frame Ongoing Performance indicator
Regular assessment of uncertainties in estimated fluxes and inventories
To close the water cycle, the principal requirement is the turbulent flux of latent heat (evaporation)
from ocean and land to the atmosphere. Precipitation over the oceans is also poorly understood.
Though fluxes from land are more difficult to observe on a global basis, given their heterogeneity, the
current set of ECVs, including precipitation, river discharge, water vapour, sea level, soil moisture and
groundwater, should be sufficient to close the global water cycle. Accurate measures of these ECV
are, however, needed (Box 5).
Box 5: Closing the global water cycle
Targets Close water cycle globally within 5% on annual timescales Who Operators of GCOS-related systems, including data centres Time frame Ongoing Performance indicator
Regular assessment of the uncertainties in estimated turbulent flux of latent heat
The main impact of GHGs on the Earth’s system is a reduction in energy exiting the top of the
atmosphere and increased energy storage in the Earth system, mainly in the oceans. The ability of
observations to close the energy budget of the Earth is, therefore, important. Over recent years, the
budget imbalance has amounted to 0.5-1 Wm-2 globally. Improving quantification of ocean heat
content, land surface temperature, latent and sensible heat fluxes from ocean and land to the
atmosphere should reduce the budget imbalance (Box 6).
Box 6: Closing the global energy balance
Targets Balance energy budget to within 0.1 Wm-2 on annual timescales Who Operators of GCOS-related systems, including data centres Time frame Ongoing Performance indicator
Regular assessment of imbalance in estimated global energy budget
Climate change affects the biosphere of the planet by, for example, changing oxygen, water and
nutrient supplies. An overarching aim is to quantify change in environmental conditions that directly
influence the biosphere (Box 7). Climate impacts significantly affect a wide range of factors in the
biosphere, such as:
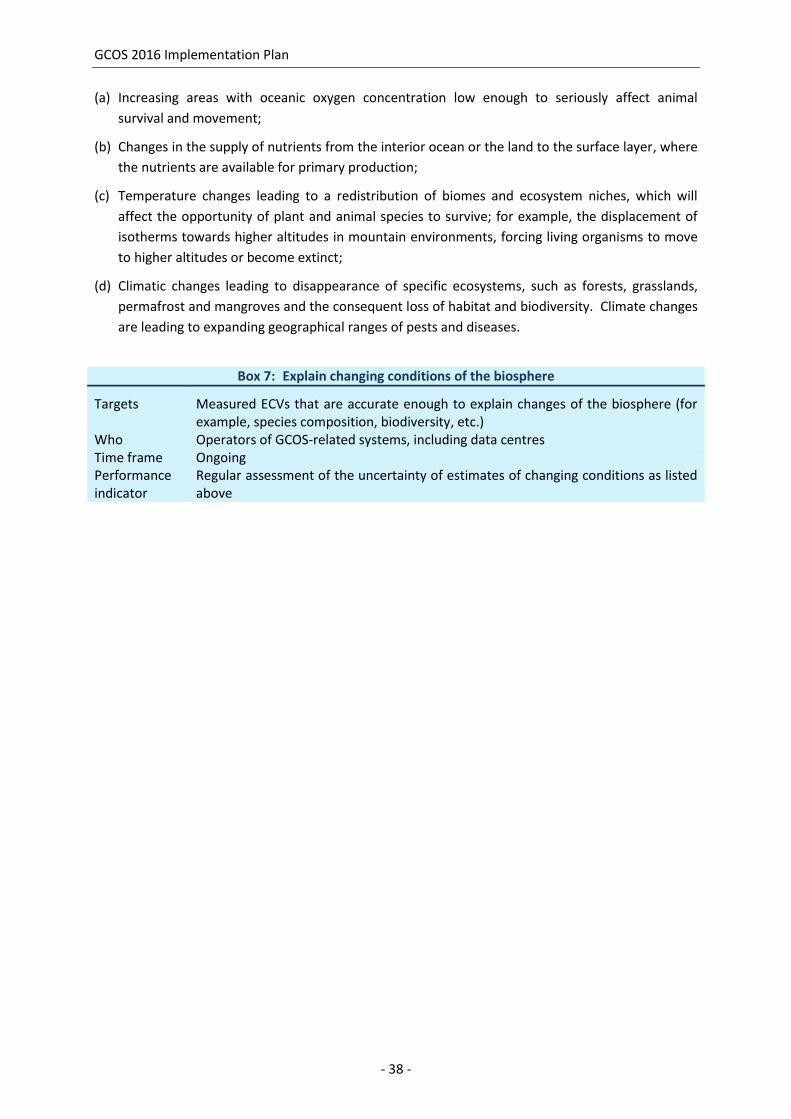
GCOS 2016 Implementation Plan
- 38 -
(a) Increasing areas with oceanic oxygen concentration low enough to seriously affect animal
survival and movement;
(b) Changes in the supply of nutrients from the interior ocean or the land to the surface layer, where
the nutrients are available for primary production;
(c) Temperature changes leading to a redistribution of biomes and ecosystem niches, which will
affect the opportunity of plant and animal species to survive; for example, the displacement of
isotherms towards higher altitudes in mountain environments, forcing living organisms to move
to higher altitudes or become extinct;
(d) Climatic changes leading to disappearance of specific ecosystems, such as forests, grasslands,
permafrost and mangroves and the consequent loss of habitat and biodiversity. Climate changes
are leading to expanding geographical ranges of pests and diseases.
Box 7: Explain changing conditions of the biosphere
Targets Measured ECVs that are accurate enough to explain changes of the biosphere (for example, species composition, biodiversity, etc.)
Who Operators of GCOS-related systems, including data centres Time frame Ongoing Performance indicator
Regular assessment of the uncertainty of estimates of changing conditions as listed above

GCOS 2016 Implementation Plan
- 39 -
6. CAPACITY DEVELOPMENT AND REGIONAL AND NATIONAL
SUPPORT
Many countries have gaps in their capacity to implement systematic, sustained climate observations.
The GCOS report Status of the Global Observing System for Climate identified significant gaps in the
global observing system in Africa, Asia, small island developing States and South America. Despite
the need for local information to support adaptation planning, early warning systems and reporting
requirements, there is often a lack of equipment, funding and skills. Developed countries and
international organizations can assist through the donation of equipment, equipment maintenance,
the training of personnel, and awareness-raising of the importance of systematic climate observation
among governments and policymakers. In particular, filling gaps in global climate observations in a
sustainable way will require significant education and training, either through bilateral partnerships
(sometimes called twinning projects), models with international partners, or on site and remote
maintenance and training, increasingly conducted through e-learning methods.
Whilst there are a number of global funding mechanisms (World Bank, Green Climate Fund), GCOS
has been helping through GCM (see section 6.1) but the amount of support it can provide is limited
by the funds available. These funding mechanisms and direct donor projects also assist in many
countries but efforts are often not well coordinated. Use of observations is often more effective
when these are combined with other data, including climate observations and socioeconomic data.
To be usefully combined with other data, data observations should comply with the GCOS monitoring
principles described in Part II, that aim to ensure accuracy, consistency and long-term stability.
6.1 The GCOS Cooperation Mechanism
The GCOS Cooperation Mechanism resulted from deliberations at the 17th session of the UNFCCC
Subsidiary Body for Science and Technology (New Delhi, 2002), and was formalized in a decision of
COP 925. It was established to address the high-priority needs for stable long-term funding for key
elements of global climate observations. It consists of:
(a) The GCOS Cooperation Board as the primary means to facilitate cooperation among donor
countries, recipient countries and existing funding and implementation mechanisms in
addressing high-priority needs for improving climate observing systems in developing countries;
and
(b) The GCOS Cooperation Fund as a means to aggregate commitments and voluntary contributions
from multiple donors (both in kind and financial) into a common trust fund.
The GCOS Cooperation Mechanism is intended to address priority needs in atmospheric oceanic, and
terrestrial observing systems for climate, including data rescue, analysis and archiving activities. The
activities that it has funded to date have been mainly in the atmospheric domain, however. It is
intended to complement and work in cooperation with, existing funding and implementation
mechanisms (for example, the WMO Voluntary Cooperation Programme (VCP), GFCS, the Global
Environment Facility (GEF), the United Nations Development Programme (UNDP) and the many
national aid agencies), many of which deal with GCOS-related activities and, in particular, support
25 For conclusions and decisions with respect to “Systematic Observations”, please refer to: unfccc.int/3581

GCOS 2016 Implementation Plan
- 40 -
capacity-building. Support needs to be focussed on those in most need and where priority
adaptation needs are identified. The success of GCM will depend critically upon donors providing
adequate resources for both technical programme management and specific network needs.
Currently, there are more proposals for projects than can be supported by available funds. If GCM is
to meet these needs, as well as expanding to fill the gaps identified in the GCOS Status Report in the
atmospheric, oceanic and terrestrial domains, additional funding will be needed. Since 2005, GCM
has received and distributed over US$ 3 million, through GCOS-managed projects and addressing a
broad range of needs and requirements.
The GCOS Cooperation Mechanism supports equipping, managing, operating and maintaining
observing networks; a range of data-management activities, such as data quality assurance,
analysisand archiving; and a variety of applications of the data and products to societal issues26. It
also addresses underlying education and training needs. Cooperation is vital, both intranationally
(among agencies within governments) and among nations, regionally and globally.
6.2 National coordination
The scope of climate impacts and risks in most countries is not limited to a single agency: the risks
cover a wide range from meteorological events and extremes, such as flooding and drought, to
disruption of food supply, damage to infrastructure and health issues. Thus, GCOS activities and
interests in any nation normally cut across many departments and agencies, rather than being
limited to any one agency such as an NMHS. It is therefore desirable and efficient for GCOS to have,
if possible, a single contact in each nation, which can coordinate amongst the relevant agencies and
represent the views of all – or at least most of them – on a regular basis. This is the role envisaged
for a GCOS National Coordinator27.
26 See http://www.wmo.ch/pages/prog/gcos/index.php?name=GCOSCooperationMechanism
27 For more information, reference is made to the GCOS brochure Implementation of the Global Climate Observing System
at the National Level (gcos.wmo.int)
Action G6: Assisting developing countries to maintain or renovate climate observation
systems and to improve climate observations networks
Action Provide financial support to GCM through its trust fund; cooperate between donors to provide targeted
support to countries to improve their observational systems; propose suitable projects for support
Benefit Targeted expert assistance to improve key monitoring networks
Time frame Continuous
Who Developed countries, developing country aid banks, WMO VCP, GEF and other funds for UNFCCC, the
United Nations Development Programme (UNDP), national aid agencies; project proposals coordinated
by GCOS panels, GCM Board and potential donor countries
Performance
indicator
Funds received by the trust sund; Increasing number of projects supporting countries
Annual cost US$ 1–10 million

GCOS 2016 Implementation Plan
- 41 -
The GCOS National Coordinator should:
(a) Provide a central contact point for GCOS, disseminating GCOS monitoring requirements and
information throughout the country;
(b) Provide feedback to GCOS on local and regional climate monitoring needs and, where
appropriate, assist in submitting potential projects for the GCOS Cooperation Mechanism
support;
(c) Encourage the use of appropriate standards in all monitoring in the country. These include the
GCOS Climate Monitoring Principles, GCOS requirements, WMO and other standards;
(d) Encourage open access to climate data for climate impact and risk assessment, adaptation to
climate change and variability and reporting to the UNFCCC;
(e) Establish a national climate observations inventory as a source of coordinated and quality-
controlled information. Standardized, long-term systematic national data and products from all
climate relevant observations are needed for national decision-makers in politics and the
economy.
6.3 Regional activities
To improve the use of existing global climate observations and fill gaps, particularly in light of the
importance of adaptation, there should be a focus on those areas identified as most in need: Africa,
parts of Asia, and Small Island Developing States. GCOS will hold regional workshops to identify
needs and potential regional cooperation. These workshops will result in regional plans that will
highlight the greatest needs and benefits of the proposed observational improvements. Donors
would be encouraged to address these needs, either through the GCM, other actors or directly.
The workshops could be held jointly with other interested stakeholders. One potential preparation
would be to cooperate with WMO Regional Climate Centres to design and run specific regional small
projects to assess existent capabilities needs in each country, identify potential opportunities of
south-south cooperation, ongoing cooperation programmes and possible involvement of
governments and the private sector.
These regional workshops will include representatives of countries in the region, potential donors
and technical experts.
Action G7: GCOS coordinator
Action Activate national coordinators
Benefit Coordinated planning and implementation of systematic climate observing systems across the many
national departments and agencies involved with their provision
Time frame Ongoing
Who Relevant division at national governmental level responsible for the coordination of climate
observation
Performance
indicator
Annual reports describing and assessing progress made in national coordination in compliance with
the coordinator’s responsibilities; establishing a national climate observations inventory and
publication of annual reports
Annual cost US$ 10 000–100 000/year/national government

GCOS 2016 Implementation Plan
- 42 -
Action G8: Regional workshops
6.4 Information and communication
Existing mechanisms, delivery pathways “on the ground” practicalities should be investigated in
terms of information and communication implementation. Many actions of this Plan are to be
implemented through national programmes. GCOS needs to improve its communication with various
international and national stakeholders, especially on needs in regions and specific developing
countries. This would:
(a) Increase the awareness of the Implementation Plan with the aim of encouraging more partner
countries to improve their monitoring following GCOS recommendations and the GCOS Climate
Monitoring Principles. The benefits, both locally and globally, of improving observational
capacity should be highlighted;
(b) Improve the donations to, and support for, GCM. Implementation of projects currently identified
is limited by the available resources. Current activities do not meet the current needs and are
limited by available funds. Adaptation needs will only increase demand;
(c) Encourage other donors and implementing agencies to follow the GCOS Climate Monitoring
Principles and ensure that observations made in their projects follow GCOS recommendations
and that their results are made openly available to all potential users;
(d) Publicize the need for sustainable climate observations, to develop an understanding of their
importance and increase awareness at all levels in governments and relevant organizations. A
factor limiting the implementation of climate observations in some countries is a lack of
understanding of the importance of the observations.
Action G9: Communication strategy
Action Hold regional workshops to identify needs and regional cooperation, starting with Africa
Benefit Improve key monitoring networks to fill gaps in regions
Time frame 2018–2020
Who GCOS secretariat in coordination with the UNFCCC Secretariat and national coordinators and the
involvement and coordination with existing capacity-building activities, for example WCRP programmes
such as CLIVAR or CORDEX)
Performance
indicator
Workshop outputs describing regional plans and priority national needs.
Annual cost US$ 1–10 million (total for six workshops)
Action Develop and implement a GCOS communication strategy
Benefit Targeted expert assistance to improve key monitoring networks
Time frame Develop strategy/plan in 2017; implement in subsequent years
Who GCOS Secretariat.
Performance
indicator
Increased monitoring and use of GCMP and monitoring of ECVs; increased donations to GCM; climate
monitoring included in national plans and/or reporting to UNFCCC; production of material and improved
website; participation in international meetings
Annual cost US$ 100 000–1 million

PART II: Detailed implementation


GCOS 2016 Implementation Plan
- 45 -
1. INTRODUCTION
As the Earth’s climate enters a new era in which it is forced by human activities as well as natural
processes, it is critically important to sustain an observing system capable of detecting and
documenting global climate variability and change over long periods of time. The research
community, policymakers and the general public require high-quality climate observations to assess
the present state of the ocean, cryosphere, atmosphere and land and place them in context with the
past. To be of large-scale societal and scientific value, these observations must capture changes in
the pattern and magnitude on both regional and global scales. This part describes how ECV
observations and products can meet these expectations.
A global system observing the climate that delivers fit-for-purpose products must address the
following:
(a) Raw observations. These may comprise in situ observations, such as sea temperature, soil
carbon, air pressure or precipitation, or remotely sensed observations such as those provided by
optical and radar satellites and ground-based weather radars. These observations should be
archived so they can be reprocessed if needed in the future as processing methods and scientific
understanding improve. They are often called fundamental climate data records (FCDR)28.
Section 2.1 below, describes the quality and requirements these observations must meet to be
suitable for climate monitoring. Some additional datasets are needed that are not climate data
themselves but are needed to process and interpret the data. Section 2.5 below discusses these
needs;
(b) Documented traceability to SI standards. Metadata are required to record the instrument used,
changes and maintenance, calibration intervals, uncertainty and procedures and any other
information needed to fully describe the measurement process. Where full traceability is not yet
possible, it should be a goal;
(c) Data recovery. There is a considerable amount of historical observational data that is not
currently easily accessible but could be extremely useful for developing long time series. Satellite
data from the 1970s are often stored in out-of-date formats and media and need to be recovered
before they are lost for good. In situ data may be stored on paper records that need to be
scanned and digitized. This is discussed in section 2.4 below;
(d) Processed measurements. Raw observations can be processed to provide variables (ECV
products) that are represented in climate models or used directly for adaptation and emergency
planning. For surface variables, satellite data first need to be processed to remove atmospheric
effects and remapped to a standard projection. They then need further processing to derive the
variables required, e.g. soil moisture from microwave data or land cover from optical data. This
may involve the use of in situ data. Surface in situ observations may also need to be processed,
although the methods are often simpler: examples are river discharge from river height
measurements and changes in glacier mass from glacier height observations. All data must be
reviewed and pass QA/QC checks. A consistent set of these processed observations are referred
28 Annex B defines CDR, FCDR and ECV products.

GCOS 2016 Implementation Plan
- 46 -
to as a climate data record (CDR)29. The requirements for these data products (accuracy,
resolution and frequency of data) are specified in Annex A and will be reviewed and updated by
GCOS. Chapters 3, 4 and 5 below discuss the requirements and actions needed in the
atmospheric, oceanic and terrestrial measurement domains for each ECV;
(e) Data analysis. To make available long time series of data and to fill gaps in existing observational
data records, further processing is often needed to integrate disparate datasets. Data
assimilation in reanalysis systems combines measurements, often of several variables, and
models to produce spatially and temporally complete datasets for each variable that are more
representative as the measurement errors are taken into account. Non-model approaches may
include gridded analysis and reconstruction. This is further discussed in section 2.4;
(f) Archiving. The datasets, which include the metadata associated with the original observations
(FCDR) and, if available, the processed data, must be archived for future climate analysis. These
datasets are collectively known as climate data records (CDR). This is often done at international
data centres or the satellite agencies that make the observations. However the datasets are
stored, they must be openly accessible to users so that they can be easily and widely exploited.
Data centres can also have a role in quality control and integrating regional data into global
datasets. Details are given in section 2.3 below.
29 Sometimes called thematic climate data records (TCDRs)

GCOS 2016 Implementation Plan
- 47 -
2. OVERARCHING AND CROSS-CUTTING ACTIONS
2.1. Requirements for climate observations
In general, ECVs will be provided in the form of CDRs that are created by the processing and archiving
of time series of satellite and in situ measurements.
To ensure that the CDRs are sufficiently homogeneous, stable and accurate for climate purposes,
they should fulfil two types of requirement as defined by GCOS:
(a) Generic requirements that are applicable to all ECVs. These are contained in the GCOS Climate
Monitoring Principles (GCMP) listed in Box 8 and the GCOS Guidelines30;
(b) ECV-product specific requirements are listed in Annex A. The requirements for many ECV
products were originally specified in the Satellite Supplement (GCOS-154) and their numerical
attributes have been reviewed for this plan and incorporated in Annex A, together with the
requirements for other ECV products not addressed in GCOS-154.
The requirements in Annex A depend on user needs and practicality. Technology improves over
time, becomes more affordable, and users’ understanding of their needs will change as climate
services develop. Thus, ECV requirements can change over time and so the GCOS Science Panels, in
addition to completing the specification of requirements for all ECVs, should regularly review and
update these requirements as appropriate. Once this process is established, the relevant
requirements will be included in the Rolling Review of Requirements (RRR) of WMO.
The Architecture for Climate Monitoring from Space31 is the overarching framework put in place by
space agencies and WMO to address gaps in the satellite-based climate record and to ensure the
sustained provision of such records to users.
Action G10: Maintain ECV requirements
Providers of CDRs responding to these requirements should also consider arrangements for
institutional support. For some ECVs (e.g. the Global Terrestrial Network for Glaciers (GTN-G) and
the networks coordinated by WMO), the collection, archiving and distribution of products are
effectively organized and implemented through global networks with a clear (if not necessarily
permanent) institutional support. In a number of cases, however, such support is entirely lacking.
30
Guidelines for the Generation of Datasets and Products Meeting GCOS Requirements (2010), GCOS-143 31
http://www.wmo.int/pages/prog/sat/documents/ARCH_strategy-climate-architecture-space.pdf
Action
Routinely maintain, review and revise list of ECV requirements. The GCOS secretariat will ensure that there is a consistent approach between panels.
Benefit Clear, consistent and complete list of ECV requirements as a basis for national and international climate observations ensures consistency between observations.
Who GCOS Panels, GCOS secretariat
Time frame Develop a systematic approach in 2017 and review every five years
Performance indicator
Annually updated list of ECV requirements.
Annual cost US$ 1 000–10 000 for experts

GCOS 2016 Implementation Plan
- 48 -
Thus, it is vital to maintain existing global networks where they exist and have demonstrated
efficiency and effectiveness, and to enable similar support for those ECVs that do not enjoy such a
privileged institutional environment.
Box 8: Global Climate Observing System climate monitoring principles
(Revised Reporting Guidelines as agreed by the UNFCCC at Bali, December 2007, decision 11/CP.13)
Effective monitoring systems for climate should adhere to the following principles:
(a) The impact of new systems or changes to existing systems should be assessed prior to implementation;
(b) A suitable period of overlap for new and old observing systems is required;
(c) The details and history of local conditions, instruments, operating procedures, data processing algorithms and other
factors pertinent to interpreting data (i.e. metadata) should be documented and treated with the same care as the
data themselves;
(d) The quality and homogeneity of data should be regularly assessed as a part of routine operations;
(e) Consideration of the needs for environmental and climate-monitoring products and assessments, such as
Intergovernmental Panel on Climate Change assessments, should be integrated into national, regional and global
observing priorities;
(f) Operation of historically-uninterrupted stations and observing systems should be maintained;
(g) High priority for additional observations should be focused on data-poor regions, poorly-observed parameters, regions
sensitive to change, and key measurements with inadequate temporal resolution;
(h) Long-term requirements, including appropriate sampling frequencies, should be specified to network designers,
operators and instrument engineers at the outset of system design and implementation;
(i) The conversion of research observing systems to long-term operations in a carefully-planned manner should be
promoted;
(j) Data management systems that facilitate access, use and interpretation of data and products should be included as
essential elements of climate monitoring systems.
Furthermore, operators of satellite systems for monitoring climate need to:
(a) Take steps to make radiance calibration, calibration-monitoring and satellite-to-satellite cross-calibration of the full
operational constellation a part of the operational satellite system;
(b) Take steps to sample the Earth system in such a way that climate-relevant (diurnal, seasonal, and long-term
interannual) changes can be resolved.
Thus satellite systems for climate monitoring should adhere to the following specific principles:
(a) Constant sampling within the diurnal cycle (minimizing the effects of orbital decay and orbit drift) should be
maintained;
(b) A suitable period of overlap for new and old satellite systems should be ensured for a period adequate to determine
inter-satellite biases and maintain the homogeneity and consistency of time-series observations;
(c) Continuity of satellite measurements (i.e. elimination of gaps in the long-term record) through appropriate launch and
orbital strategies should be ensured;
(d) Rigorous pre-launch instrument characterization and calibration, including radiance confirmation against an
international radiance scale provided by a national metrology institute, should be ensured;
(e) On-board calibration adequate for climate system observations should be ensured and associated instrument
characteristics monitored;
(f) Operational production of priority climate products should be sustained and peer-reviewed new products should be
introduced as appropriate;
(g) Data systems needed to facilitate user access to climate products, metadata and raw data, including key data for
delayed-mode analysis, should be established and maintained;
(h) Use of functioning baseline instruments that meet the calibration and stability requirements stated above should be
maintained for as long as possible, even when these exist on decommissioned satellites;
(i) Complementary in situ baseline observations for satellite measurements should be maintained through appropriate
activities and cooperation;
(j) Random errors and time-dependent biases in satellite observations and derived products should be identified.

GCOS 2016 Implementation Plan
- 49 -
2.2. Planning, review and oversight
As the compliance with the requirements in section 2.1 greatly enhances the utility of CDRs and
benefit the climate record, these generic and ECV product-specific requirements are the reference
points against which CDRs should be assessed.
To comply with these requirements is a substantial challenge that the satellite community has
already taken steps to address through the creation of a joint CEOS/CGMS Working Group on
Climate32, which has the overarching objective of aligning the CDR activities of space agencies with
the needs of GCOS.
In support of this high-level objective, a sequential process has been defined that consists of:
(a) Making available a structured, comprehensive and accessible review of which CDRs are currently
available and which are planned to exist (through the population of a CDR inventory);
(b) Performing an assessment of the degree of compliance of such records with GCOS requirements
(gap analysis), including gaps in planned missions/networks that have the potential to contribute
to ECV records;
(c) Defining a coordinated action plan to address gaps, shortfalls and improvement opportunities.
The corresponding actions on the joint CEOS/CGMS Working Group on Climate are described in G11
and G12; Annex A indicates the ECV products to be covered by these actions.
Action G11: Review of availability of climate data records
Action G12: Gap-analysis of climate data records
For “one time” research spacecraft, the principles of continuity obviously do not fully apply, but as
many of the other principles as possible (e.g. those for rigorous pre-launch instrument
32
http://ceos.org/ourwork/workinggroups/climate
Action Provide a structured, comprehensive and accessible view as to what CDRs are currently available, and what are planned to exist, together with an assessment of the degree of compliance of such records with the GCOS requirements for the ECV products indicated in Annex A
Benefit Improve planning of satellite-derived climate data acquisition
Who CEOS/CGMS Working Group on Climate for records contributing to the ECV products that are indicated in Annex.
Time frame End 2016 and updated every two years thereafter.
Performance indicator
Online availability of an inventory of current and future CDRs, together with an assessment of compliance with GCOS requirements
Annual cost Covered by CEOS and CGMS agencies
Action Establish a gap analysis process and associated actions, to: (a) address gaps/deficiencies in the current available set of CDRs; and (b) ensure continuity of records, and address gaps through the appropriate planning of future satellite missions for the ECV products indicated in Annex A
Benefit Increase the utility of the CDRs
Who CEOS/CGMS Working Group on Climate for records contributing to the ECV indicated in Annex A
Time-frame End 2017, and updated every two years thereafter.
Performance indicator
Availability of gap analysis and associated action plan
Annual cost Covered by CEOS and CGMS agencies
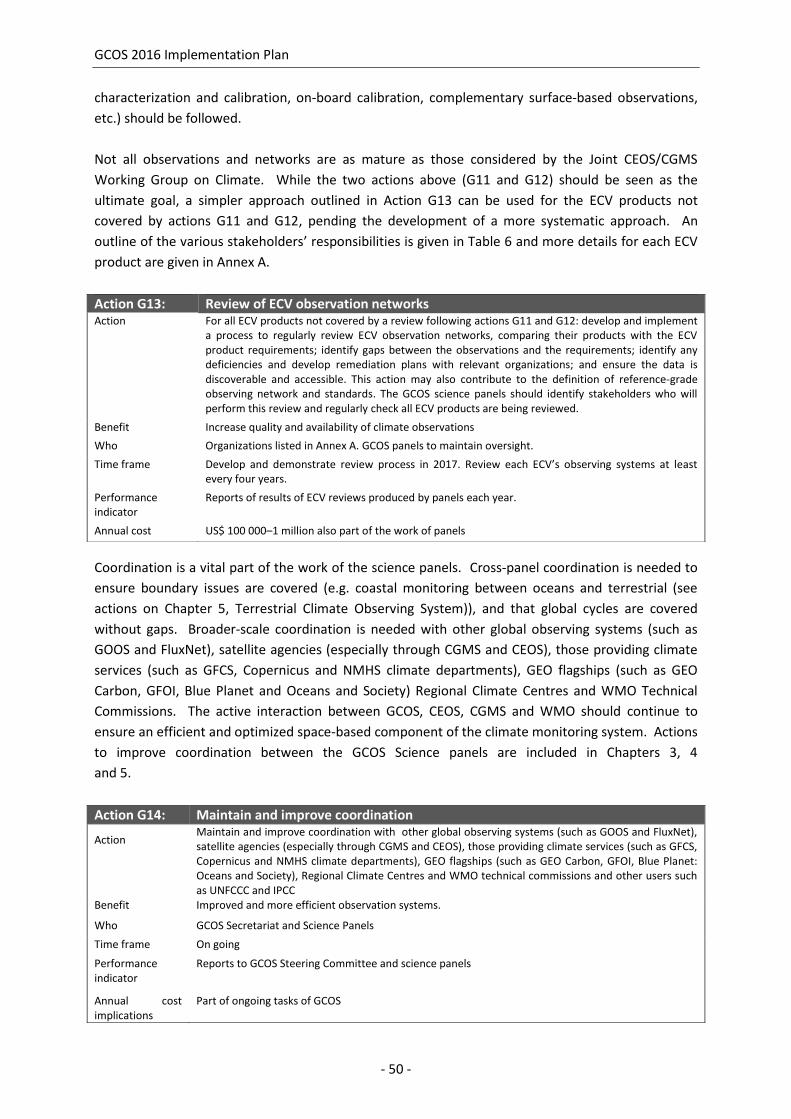
GCOS 2016 Implementation Plan
- 50 -
characterization and calibration, on-board calibration, complementary surface-based observations,
etc.) should be followed.
Not all observations and networks are as mature as those considered by the Joint CEOS/CGMS
Working Group on Climate. While the two actions above (G11 and G12) should be seen as the
ultimate goal, a simpler approach outlined in Action G13 can be used for the ECV products not
covered by actions G11 and G12, pending the development of a more systematic approach. An
outline of the various stakeholders’ responsibilities is given in Table 6 and more details for each ECV
product are given in Annex A.
Coordination is a vital part of the work of the science panels. Cross-panel coordination is needed to
ensure boundary issues are covered (e.g. coastal monitoring between oceans and terrestrial (see
actions on Chapter 5, Terrestrial Climate Observing System)), and that global cycles are covered
without gaps. Broader-scale coordination is needed with other global observing systems (such as
GOOS and FluxNet), satellite agencies (especially through CGMS and CEOS), those providing climate
services (such as GFCS, Copernicus and NMHS climate departments), GEO flagships (such as GEO
Carbon, GFOI, Blue Planet and Oceans and Society) Regional Climate Centres and WMO Technical
Commissions. The active interaction between GCOS, CEOS, CGMS and WMO should continue to
ensure an efficient and optimized space-based component of the climate monitoring system. Actions
to improve coordination between the GCOS Science panels are included in Chapters 3, 4
and 5.
Action G13: Review of ECV observation networks Action For all ECV products not covered by a review following actions G11 and G12: develop and implement
a process to regularly review ECV observation networks, comparing their products with the ECV product requirements; identify gaps between the observations and the requirements; identify any deficiencies and develop remediation plans with relevant organizations; and ensure the data is discoverable and accessible. This action may also contribute to the definition of reference-grade observing network and standards. The GCOS science panels should identify stakeholders who will perform this review and regularly check all ECV products are being reviewed.
Benefit Increase quality and availability of climate observations
Who Organizations listed in Annex A. GCOS panels to maintain oversight.
Time frame Develop and demonstrate review process in 2017. Review each ECV’s observing systems at least every four years.
Performance indicator
Reports of results of ECV reviews produced by panels each year.
Annual cost US$ 100 000–1 million also part of the work of panels
Action G14: Maintain and improve coordination
Action Maintain and improve coordination with other global observing systems (such as GOOS and FluxNet), satellite agencies (especially through CGMS and CEOS), those providing climate services (such as GFCS, Copernicus and NMHS climate departments), GEO flagships (such as GEO Carbon, GFOI, Blue Planet: Oceans and Society), Regional Climate Centres and WMO technical commissions and other users such as UNFCCC and IPCC
Benefit Improved and more efficient observation systems.
Who GCOS Secretariat and Science Panels
Time frame On going
Performance indicator
Reports to GCOS Steering Committee and science panels
Annual cost implications
Part of ongoing tasks of GCOS

GCOS 2016 Implementation Plan
- 51 -
Table 6. Entities analysing33 each ECV product. Precise allocations of each ECV product is given in
Annex A.
Essential Climate Variables (ECVs) WMO CEOS &
CGMS1 Other
Programmes Co-sponsored
Atm
osp
her
ic
Surface:
Wind speed and direction, precipitation, WIGOS WGClimate
Air temperature, water vapour, pressure, surface radiation budget
WIGOS
Upper-air:
Lightning WIGOS
Temperature, wind speed and direction, water vapour, cloud properties, Earth radiation budget
WIGOS WGClimate
Composition
Carbon dioxide (CO2), methane (CH4), other long-lived greenhouse gases, ozone, aerosol, precursors for aerosol and ozone
GAW WGClimate
Oce
anic
Physics:
Subsurface temperature, subsurface salinity, Subsurface currents, ocean surface stress, ocean-surface heat flux
GOOS/JCOMM
Sea-surface temperature, surface currents, sea-surface salinity, sea level, sea state, sea ice
GOOS/JCOMM WGClimate
Biogeochemistry: Inorganic carbon, oxygen, nutrients, transient tracers, nitrous oxide (N2O), ocean colour
GOOS IOCCP
GOOS WGClimate IOCCG Biology/ecosystems:
Plankton, marine habitat properties GOOS GEOBON
Terr
estr
ial
Hydrology: River discharge, groundwater, soil moisture WHYCOS GTN-H lakes WHYCOS HYDROLARE WGClimate
Cryosphere:
Snow, glaciers, ice sheets and ice shelves, GCW WGClimate GTN-G Permafrost GCW GTN-P
Biosphere: Albedo, land cover, fraction of absorbed photosynthetically active radiation, leaf area index, above-ground biomass, fire, land-surface temperature, soil carbon,
BSRN WGClimate FluxNet, Others
Human use of natural resources:
Water use, AQUASTAT
GHG fluxes GAW WGClimate TBD, GCP
Notes: 1) The WG-Climate works on satellite-derived data products
2.3 Data management, stewardship and access
Data management and stewardship are of vital importance for the global climate observing system.
They ensure that essential data, including FCDRs and the records of derived data products, are not
only collected, but also retained and made accessible for analysis and application for current and
future users. Adequate data management will ensure that data are of the required quantity and
quality necessary for climate monitoring, research and for developing high-quality climate services.
This will provide the capability to make informed decisions for global and national climate change
policy and for local adaptation.
This section outlines the general GCOS approach to data management. The current status and
specific actions in the different domains differ widely and are dealt with in the relevant chapters.
33
See actions G11, G12 and G13

GCOS 2016 Implementation Plan
- 52 -
The GCOS Climate Monitoring Principles emphasize the importance of data management by stating
that “Data management systems that facilitate access, use and interpretation of data and products
should be included as essential elements of climate monitoring systems". To achieve this, the
following elements, which are also part of the GEOSS Data Management Principles34, have to be
considered:
Data access;
Metadata;
Quality control;
Preservation;
Discoverability.
Data access. In order to meet GCOS objectives, climate observations should be made available to
users on a free and unrestricted basis. Many organizations, such as the International Council for
Science through its World Data System (ICSU WDS), are promoting universal and equitable access to
quality-assured scientific data, data services, products and information, with a view towards long-
term data stewardship. They have adopted data-sharing principles35 in line with the data policies of
national and international initiatives, including those of GEO. These principles are meant essentially
to ensure full and open exchange of data, metadata and products and that they will be made
available with minimum time delay, free of charge or at no more than cost of reproduction, for
research and education.
IOC Resolution XXII-6 on data policy requires timely, free and unrestricted access to all data,
associated metadata and products generated under the auspices of IOC programmes and encourages
the same principles for data from non-IOC programmes. Furthermore, WMO Resolution 60 (Cg-17)
affirms that “the GFCS relevant data and products from the WMO [….], as well as from the
framework of the GCOS ECVs (Atmospheric, Oceanic and Terrestrial), will constitute an essential
contribution to the Framework [for climate services] and therefore should be made accessible among
members, in particular through the GFCS CSIS, on a free and unrestricted basis”. In addition, WMO
Resolutions 40 (Cg-XII) and 25 (Cg-XIII) adopt the principle of free and open exchange of
meteorological and related data.
Even though these principles are clearly formulated, and despite significant improvements in some
areas, not all nations adhere to them and, as a result, open data access is still not universally
available. GCOS needs not only to ensure that data policies on open exchange are being followed
where they exist, but also advocate that these policies are put in place where they do not exist. GCOS
should also make open and free data access part of the requirements for climate observations,
therefore including regular monitoring and reporting on the status of data access as part of its
regular review of the ECV datasets.
34
https://www.earthobservations.org/documents/dswg/201504_data_management_principles_long_final.pdf 35
https://www.icsu-wds.org/services/data-sharing-principles

GCOS 2016 Implementation Plan
- 53 -
Metadata. Observations without metadata are of very limited use: it is only when accompanied by
adequate metadata (data describing the data) that their full potential can be utilized. Metadata
describe the observed variable, the conditions under which it was observed, how it was measured,
and how the data have been processed, in order to provide data users with confidence that the data
are appropriate for their application. The third GCOS Climate Monitoring Principle describes the
relevance of metadata as: “The details and history of local conditions, instruments, operating
procedures, data processing algorithms and other factors pertinent to interpreting data
(i.e. metadata) should be documented and treated with the same care as the data themselves.”.
Metadata standards exist for some ECVs and networks. There is a WMO-developed metadata
standard for all observing systems under WIGOS36. Where they do not exist, international standards
and procedures for the storage and exchange of metadata need to be extended to all ECV products
and networks.
Action G16: Metadata
Action 1. GCOS to work with WMO to ensure that the WIGOS metadata standard meets GCOS
requirements for metadata, where relevant; 2. Develop metadata standards for those observing systems where they do not exist.
Benefit Improved access and discoverability of datasets
Who Operators of GCOS.related systems, including data centres
Time frame Continuous
Performance indicator Number of ECV-related datasets accessible through standard mechanisms
Annual cost implications US$ 100 000–1 million (US$ 20 000 per data centre) (10% in non-Annex-I Parties)
Quality control. A key component of data management is close monitoring of the data streams. This
includes ongoing monitoring of the flow of data and quality control of the observations. Two-way
communication between the observing system operators and data managers is important so issues
with both random and systematic errors can be shared. Such monitoring and feedback systems are
routine data stewardship best practices and are cost-effective measures that minimize the need for
corrections at a later date. Data centres need to be adequately supported to perform data
36
Manual on the WMO Integrated Global Observing System. WMO-No. 1160
Action G15: Open data policies
Action Ensure free and unrestricted data access by encouraging that data policies facilitating the open exchange and archiving of all ECVs are followed; encouraging national parties to develop new data policies where appropriate, assessing and regularly reporting of status of data access
Benefit Access to data by all users in all countries at minimum cost
Who Parties and international agencies, appropriate technical commissions and international programmes; GCOS Secretariat.
Time frame Continuing, of high priority.
Performance indicator Number of countries adhering to data policies favouring free and open exchange of ECV data.
Annual cost implications US$ 100 000–1 million
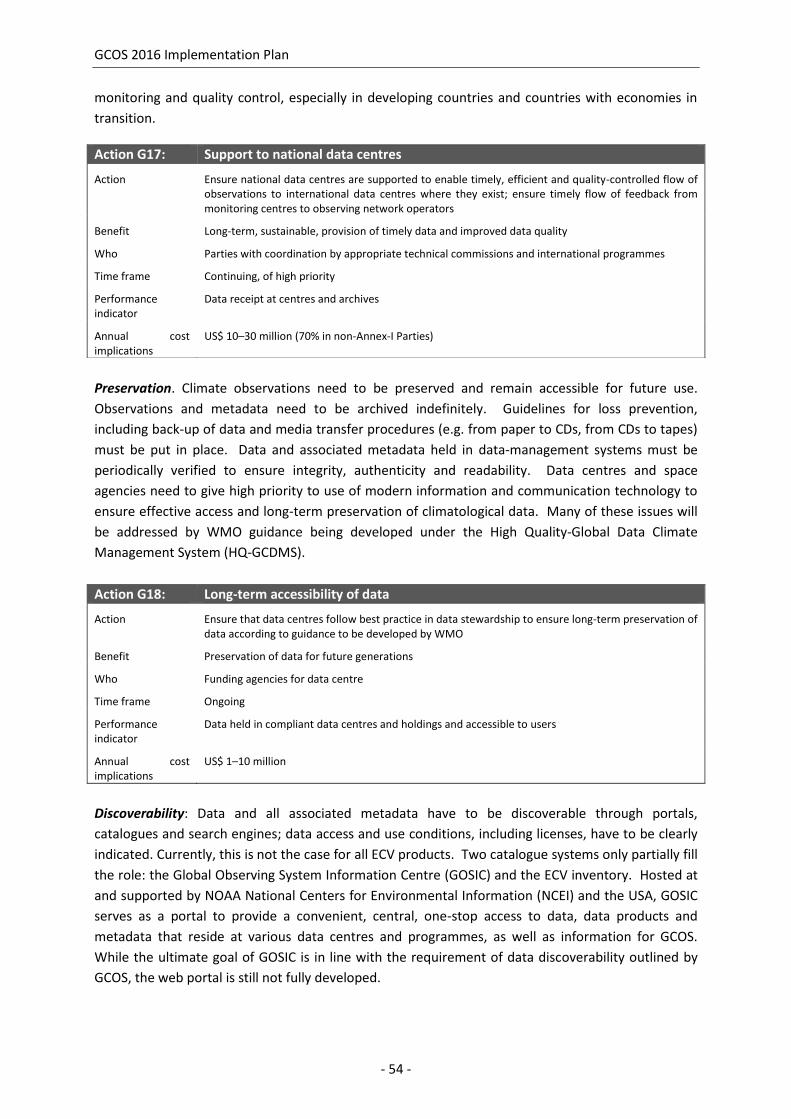
GCOS 2016 Implementation Plan
- 54 -
monitoring and quality control, especially in developing countries and countries with economies in
transition.
Preservation. Climate observations need to be preserved and remain accessible for future use.
Observations and metadata need to be archived indefinitely. Guidelines for loss prevention,
including back-up of data and media transfer procedures (e.g. from paper to CDs, from CDs to tapes)
must be put in place. Data and associated metadata held in data-management systems must be
periodically verified to ensure integrity, authenticity and readability. Data centres and space
agencies need to give high priority to use of modern information and communication technology to
ensure effective access and long-term preservation of climatological data. Many of these issues will
be addressed by WMO guidance being developed under the High Quality-Global Data Climate
Management System (HQ-GCDMS).
Action G18: Long-term accessibility of data
Action Ensure that data centres follow best practice in data stewardship to ensure long-term preservation of data according to guidance to be developed by WMO
Benefit Preservation of data for future generations
Who Funding agencies for data centre
Time frame Ongoing
Performance indicator
Data held in compliant data centres and holdings and accessible to users
Annual cost implications
US$ 1–10 million
Discoverability: Data and all associated metadata have to be discoverable through portals,
catalogues and search engines; data access and use conditions, including licenses, have to be clearly
indicated. Currently, this is not the case for all ECV products. Two catalogue systems only partially fill
the role: the Global Observing System Information Centre (GOSIC) and the ECV inventory. Hosted at
and supported by NOAA National Centers for Environmental Information (NCEI) and the USA, GOSIC
serves as a portal to provide a convenient, central, one-stop access to data, data products and
metadata that reside at various data centres and programmes, as well as information for GCOS.
While the ultimate goal of GOSIC is in line with the requirement of data discoverability outlined by
GCOS, the web portal is still not fully developed.
Action G17: Support to national data centres
Action Ensure national data centres are supported to enable timely, efficient and quality-controlled flow of observations to international data centres where they exist; ensure timely flow of feedback from monitoring centres to observing network operators
Benefit Long-term, sustainable, provision of timely data and improved data quality
Who Parties with coordination by appropriate technical commissions and international programmes
Time frame Continuing, of high priority
Performance indicator
Data receipt at centres and archives
Annual cost implications
US$ 10–30 million (70% in non-Annex-I Parties)

GCOS 2016 Implementation Plan
- 55 -
The ECV inventory37 developed by CEOS, CGMS and WMO lists the available CDRs. It currently lists
satellite-derived products but should be extended to cover in situ datasets as well.
Action G19: Data access and discoverability
Action Identify and dev elop means of discovering and accessing all relevant CDRs and other relevant products. Ensure there is access to metadata that clearly distinguishes each data product and describes its adherence to the GCMP
Benefit Increase access to CDRs
Who GCOS, GEO, US National Oceanographic and Atmospheric Administration (NOAA)
Time frame Develop plans in 2017
Performance indicator Reports of results of ECV reviews produced by panels each year
Annual cost implications US$10 000–100 000
To assist discoverability and to ensure correct citation of all data, each dataset needs a unique
permanent reference that will identify each version. Digital object identifiers (DOIs) provide this
reference and should be allocated to all data. DOIs will also, in the future, enable data usage to be
measured and thus enable estimates of the data’s impact and influence.
Action G20: Use of digital object identifiers for data records
Action GCOS to encourage international data centres to introduce DOIs for their data records of ECV and recommend datasets producers to follow this practice
Benefit Help researchers to discover relevant data more easily
Who GCOS panels
Time frame Ongoing
Performance indicator
Number of data records having an assigned DOI
Annual cost implications
Should be part of network planning and implementation.
WMO is developing guidance on climate data management to ensure high-quality, timely and
accessible data from all possible sources. This work is led by WMO’s Commission for Climatology
(CCl) involving WMO technical commissions, co-sponsored programmes and partners, including
GCOS. The effort will provide best-practice guidance on climate-focused activities such as data
rescue, preservation and archives. Through its collaboration with CCl, GCOS will ensure that this
initiative will meet GCOS requirements on climate data management and take into account systems
and approaches of observing systems that are not part of WIGOS.
37 http://ecv-inventory.com/ecv2/

GCOS 2016 Implementation Plan
- 56 -
2.4 Production of Integrated ECV products
2.4.1 Data integration and assimilation
Many users require processed data products rather than basic observations. These include long time
series where there are sufficient underlying observations: for documenting surface temperature
change since the 19th century, for example. There is also a requirement for processed datasets to
initialize forecasts or prescribe some of the non-prognostic data used by models. All this holds for
atmospheric, ocean or coupled climate applications. The use of products needs to be supported by
the provision of ancillary information, including estimates of uncertainty, evaluations against
independent data and comparisons with alternative products. Important also is assessment and
reporting of the maturity of products and production systems.
Data products may involve analysis of a single ECV or closely related set of ECVs, or analysis of a more
general set of ECVs using data assimilation, in particular through atmospheric or ocean reanalysis.
Products for specific ECVs are generated from in situ data, satellite data or a combination of the two.
In the case of satellite data, the product may be a “Level-2” retrieved geophysical variable co-located
with the original measurement, or a gridded “Level-3” set of values suitable for general use. They
may be based on data from a single instrument or generated by combining data from more than one
instrument, whether flown at the same time or sequentially.
Data integration may be as simple as combining one product over land with another over sea. The
gridded “surface temperature” products used to provide long-term measures of global change
typically combine datasets on the surface air temperature over land and the surface water
temperature of the sea, for example.
Specific requirements for particular ECV products are given in the following domain sections. Aside
from these, there is a common need to ensure continued production and development of improved
versions of established data products. Improvements can be driven by the comparison of multiple,
independent estimates of data products produced using different methods.
The requirements of a substantial body of users are being increasingly well met by products based on
integration of data from a comprehensive mix of in situ networks and satellite systems, achieved
largely through the process known as reanalysis, but also referred to as synthesis. This involves using
a fixed data-assimilation system to process observations that extend back in time over multiple
decades, employing a model of the atmosphere, ocean or coupled climate system to spread
Action G21: Collaboration with WMO CCl on climate data management
Action GCOS secretariat to engage with WMO CCl on development of regulatory and guidance on climate data management
Benefit Users to climate data will have easier access to data.
Who GCOS secretariat and WMO CCl
Time frame Ongoing until 2019
Performance indicator
Guidance material publication
Annual cost implications
None

GCOS 2016 Implementation Plan
- 57 -
information in space and time and between variables, and otherwise to fill gaps in the observational
record. The atmospheric data-assimilation systems are usually derived from those used to provide
weather or short-term climate forecasts. Some products are also produced through a statistical
synthesis approach, such as SST fields over the ocean, for which observations from different sensors
from different satellites are merged with in situ observations.
Atmospheric and ocean reanalysis provides a complete coverage in space and time within the
constraints of the resolution of the assimilating model, the range of variables whose changes are
represented in the model and the parameterisation of unresolved/unrepresented processes. It
provides datasets for many ECVs, but also makes use of data products for those variables that are
prescribed in the assimilating model. In turn, reanalysis data provide some of the supplementary
input needed to generate several of the ECV products that are based on retrieval of information from
remote-sensing.
Reanalysis has progressed considerably in recent years, although there is progress still to be made.
Existing production streams have been prolonged, new reanalyses have been completed for
atmosphere and ocean, more-refined land-surface products have been developed and producing
centres have future activities planned. Systems that couple atmosphere and ocean, or include much
more comprehensive treatments of trace constituents, have begun to be used. Atmospheric
reanalyses that cover at least the 20th century assimilating surface-pressure and, in some cases,
surface-wind observations, have proved skilful in depicting short-term climate variability, but have
been problematic in their representation of multi-annual variability and climate change. Provision of
reliable information on uncertainties is being helped by the development of ensemble approaches,
but remains a challenge. Methodological improvements have made newer atmospheric reanalyses
less prone to issues related to observational errors and limitations in observational coverage.
Joint assimilation of multiple types of observation in a reanalysis provides a basis for estimating some
of the biases in the data from particular instruments, providing an alternative or complement to the
calibration activities of space agencies. Moreover, the closeness of fit of background forecasts and
analyses to observations is an important source of information on other types of observational error
and on the quality of the assimilating model and of the reanalyses themselves. Such feedback data
have been saved by producing centres and used, for example, to assist radiosonde bias adjustment.
Although access to these data has not in general been straightforward for users, this is beginning to
change. Studies of degrees of freedom for signal and forecast sensitivity to observations using data-
assimilation systems provide a contribution to observing-system design.
Action G22: Implementation of new production streams in global reanalysis Action Continue comprehensive global reanalyses and implement planned new production streams using
improved data-assimilation systems and better collections of observations; provide information on the uncertainty of products and feedback on data usage by the assimilation systems
Benefit Improved reanalysis datasets
Who Global reanalysis production centres
Time frame Ongoing
Performance indicator
Number and specifications of global reanalyses in production; improved results from evaluations of performance; user uptake of uncertainty information; extent to which observational archives are enhanced with feedback from reanalyses
Annual cost US$ 10–30 million

GCOS 2016 Implementation Plan
- 58 -
There is a requirement for local data on impacts of climate variability and change. This, in turn,
implies a requirement for climate data products with high resolution in space and time and a
consequent need for downscaling approaches. A developing level of activity in achieving this is
through regional reanalysis.
Action G25: Implementation of regional reanalysis
2.4.2 Recovery of Instrumental data
Early satellite data
Early satellite data records can be valuable because they provide unique observations in many
regions which were not otherwise observed during the 1970s and which can be assimilated in
atmospheric reanalyses and so extend the satellite climate data records back in time. A major
problem is that archive media and human expertise related to these early satellite records are now
fading. There are now, however, more advanced techniques for exploiting satellite data, compared
with the limited processing by the small research community which was involved in the analysis of
early missions. The challenge is to rescue these data and exploit them for climate change studies.
The priority is to ensure long-term preservation of the raw data and level 1 data for input to FCDR
production. The level 2 products can always be regenerated from the archived FCDRs.
Action G23: Develop coupled reanalysis Action Further develop coupled reanalysis and improve the coupled modelling and data assimilation
methodology
Benefit Provide coupled reanalysis data sets
Who Global reanalysis production centres and other centres undertaking research in data assimilation
Time frame Ongoing
Performance indicator
Number, specification and demonstrated benefits of coupled reanalyses
Annual cost US$ 1–10 million
Action G24: Improve capability of long-range reanalysis Action Improve the capability of long-scale reanalysis using sparse observations datasets
Benefit Provide longer reanalysis datasets
Who Global reanalysis production centres and other centres undertaking research in data assimilation
Time frame Ongoing
Performance indicator
Demonstrated improvements in the representation of long-term variability and change in century-scale reanalyses
Annual cost US$ 1–10 million
Action Develop and implement regional reanalysis and other approaches to downscaling the information from global data products
Benefit Capability to capture climate variability on a regional scale
Who Dataset producers
Time frame Ongoing
Performance indicator
Number and evaluated performance of regional reanalyses and other downscaled datasets
Annual cost US$ 1–10 million

GCOS 2016 Implementation Plan
- 59 -
Progress towards preservation of historical satellite data has been made for both geostationary and
polar-orbiting meteorological satellites but the associated critical metadata are more difficult to
preserve. The latter is mainly in the form of peer review literature or other “grey literature” such as
algorithm theoretical basis documents and data format definitions, although the latter can be
difficult to access.
There are already cases of early satellite data records that are probably lost forever. For ozone, for
example, there is a gap from 1976–1978, where data from the backscatter UV sensor on the
Atmosphere Explorer-E satellite appears to have been lost during transition from one mass archive
system to another [Status report-GCOS 195]. For infrared sounding, this includes the special sensor-
H instrument flown on four Defence Meteorological Satellite Program satellites in the 1970s when all
attempts to locate these data failed.
Data from satellites underpin many of the ECVs, and their historic (and contemporary) archives are a
key part of the global climate observing system. Long time series are particularly valuable, though
computer processing has to some extent limited these to the low-spatial resolution classes of
satellite observations, typically in the 1-km pixel range, a scale that also fits with ways in which these
ECVs have been used, for example to improve surface forcing in climate models. However,
increasing availability of computer processing power and a new suite of climate application areas,
especially related to adaptation and mitigation, bring increasing attention to bear on the historic
archives of data from satellite-based global land observing programmes at higher spatial resolution.
At least 24 satellites have gathered multispectral imagery over the last three decades at resolutions
of 20–30 m from near-polar orbits, which could be used in the generation of many ECVs, especially
those from the terrestrial domain38. These are managed by at least 12 different sovereign States, a
number of which operate a full, free and open data policy. Attention is being paid to building
inventories of the data held by receiving stations around the world (both those in operation and
those that used to be, but are no longer though do hold archives). In one instance – the United States
Geological Survey (USGS) Landsat programme – the inventory is being followed up by acquisition of
historic data, their ingestion into a centralized archive and the application of a standard processing to
generate globally consistent, analysis-ready products. This initiative, the Landsat Global Archive
Consolidation (LGAC), began in 2010 and to date has more than doubled the size of the original USGS
archive through the recovery and reprocessing of over 3.2 million images39. LGAC has also identified
a further 2.3 million images, which will be added. LGAC has had the equivalent impact on the archive
of two additional satellite missions. Landsat is the longest running uninterrupted Earth observation
programme and today the Landsat archive is geographically broader, temporally deeper and now, as
a consequence, more valuable than at any time for characterizing climate change and its impacts and
the effectiveness of adaptation strategies. International cooperating stations that have worked with
LGAC in the past should continue to support the initiative, and those parties also flying global land
observing missions with similar spatial resolutions and archives should also consolidate their global
archives.
38 Belward, A.S. and J.O. Skøien, 2015: Who launched what, when and why; trends in global land-cover observation capacity
from civilian earth observation satellites, ISPRS Journal of Photogrammetry and Remote Sensing, 103: 115–128. 39
Wulder, M.A., J.C. White, T.R. Loveland, C.E. Woodcock, A.S. Belward, W.B. Cohen, E.A. Fosnight, J. Shaw, J.G. Masek and
D.P. Roy, 2016: The global Landsat archive: Status, consolidation, and direction. Remote Sensing of Environment,
http://dx.doi.org/10.1016/j.rse.2015.11.032

GCOS 2016 Implementation Plan
- 60 -
Action G26: Preservation of early satellite data
In situ data
Generation of atmospheric data products based on land and ocean in situ instrumental data would
have been limited to the past 40–50 years, had observational data originally stored on paper or
obsolete media not been converted to a modern digital format. A considerable amount of
instrumental data on air temperature, precipitation and other variables remains to be recovered
from paper or other storage formats in order to improve the records that characterize how climate
has changed over the industrial era. The term data rescue is often used for this activity, as
deterioration of the original records may soon cause some data to be lost forever. Scanning paper
records is the immediate priority, though digitization has to follow. Where this is not immediately
possible, scans should be supplied to international data centres and managed by them. Availability
of the scanned records is more generally useful, as it also aids detection and correction of digitization
errors revealed by quality-control procedures applied when using data in product generation.
Data recovery, scanning, digitization and making the data available, remain resource-limited and
fragmented in nature, despite a number of efforts being made nationally and through coordinated
international activities that are yielding worthwhile enhancements of databases. Although some
NMHSs are undertaking significant digitization of their data records and other records have at least
been scanned, this is not the case in many others and relevant records are often held by other
national agencies. Centralized registration of data-recovery projects and opportunities has been
recognized as a need. The WMO Commission for Climatology has plans for better coordination of the
rescue and preservation of data through its Expert Team on Data Rescue, whose tasks include
arranging the implementation, population and maintenance of an International data rescue web
portal to summarize key information and provide an analysis of gaps in international data-rescue
activities40. It is important that inventories of the scans are available in international data centres,
also recording whether the data have been digitized or not. Citizen science data-rescue efforts have
proved successful in some areas (e.g. ACRE41, RECLAIM42 and IEDRO43) and should be actively
encouraged.
Limited resources often result in only a subset of data being digitized from a collection of records.
The situation can be made worse when projects do not share the digitized series, as this can result in
the same data being digitized more than once. Projects that do not share the digitized series should
be actively discouraged by the Expert Team. There are important ongoing efforts building collections
40
http://www.wmo.int/pages/prog/wcp/ccl/opace/opace1/ET-DARE-1-2.php 41
http://www.met-acre.org 42
http://icoads.noaa.gov/reclaim 43
http://iedro.org
Action Ensure long-term data preservation of early satellite raw and level 1 data, including metadata
Benefit Extend CDRs back in time
Who Space agencies
Time frame Ongoing
Performance Indicator
Data archive statistics at space agencies for old satellite data
Annual Cost US$ 1–10 million

GCOS 2016 Implementation Plan
- 61 -
of ECV-specific data on surface air temperature and surface pressure, but keeping all atmospheric
surface synoptic variables measured at a station together for each observation time is likely to be
more useful in the long run. This was a recommended action item from the most recent AOPC
meeting.
With regard to data-rescue activities44, many NMHSs make much or all of their digital data holdings
available for use by scientists (both practising and citizen) around the world. Some introduce
restrictions (e.g. by registration and or restrictions on the volumes that can be downloaded), while
others make the data free for any use. A few provide data with restrictions such as prohibiting
commercial use or onward supply of data to third parties, but these are hard to enforce and prone to
cause confusion.
Data archiving and rescue and quality-control activities have been going on in the ocean for many
years. As a result, several data centres provide datasets of historic measurements, especially with
respect to temperature and salinity covering the period back to the beginning of the 20th century.
Further QC and recovery activities continue in the aim to provide fully consistent temperature and
salinity-profile data.
Many early observations remain undigitized and require attention similar to demands in the
atmosphere and on land. To some extent, it is necessary to go back to the original data suppliers as,
for example, the original data sources of some tide gauge datasets available in international data
centres in developing countries needed revisiting.
Action G27: Recovery of instrumental climate data
Action G28: Register of data-recovery activities
44
http://www.met-acre.org/
Action Continue the recovery of instrumental climate data that are not held in a modern digital format and encourage more imaging and digitization
Benefit Improve access to historical observations datasets
Who Agencies holding significant volumes of unrecovered data; specific projects focused on data recovery
Time frame Ongoing
Performance indicator
Data Increases in archive-centre holdings and data used in product generation; register entries recording data-recovery activities (see following action)
Annual Cost US$ 1–10 million
Action Populate and maintain a register or registers of data-recovery activities
Benefit Facilitate planning of data rescue
Who WMO CCl and other international bodies with related responsibilities; institutions hosting registers
Time frame Ongoing
Performance indicator
Existence and degree of population of register(s).
Annual cost US$ 1 000–10 000
GCOS 2016 Implementation Plan
- 62 -
Action G29: Scanned records
Action G30: Sharing historical data records
2.5 Ancillary and additional observations
This Plan also highlights for the first time the importance of ancillary and additional observations
such as gravity, geoid, digital elevation models (DEM), bathymetry and orbital restitution. These data
are required to derive ECV products but are not climate observations themselves.
Gravity measurements are included here. While their usefulness and importance for understanding
water mass transport have been demonstrated, gravity measurements underpin a range of other
ECVs, including changes due to surface and deep currents in the ocean; runoff and groundwater
storage on land masses; exchanges between ice sheets or glaciers and the ocean, as well as
underpinning other satellite observations through orbital restitution. These are likely to be
continued by follow-on systems but the planning and implementation of a constellation of satellites
is required to meet observational requirements and long-term climate-monitoring needs.
2.5.1 Gravity measurements
The results of space gravimetry missions flown in the last two decades have proved the potential of
mass distribution and transport information, which adds to the established uses of gravity data for,
inter alia, precise orbit restitution of climate-oriented satellites. The cross-cutting nature of mass
distribution/transport information is evident from the specific support to ECVs in the various
domains, particularly for hydrology, oceanography and cryosphere sciences, as noted in Chapters 4
and 5.
Knowledge of an accurate geoid is also a fundamental requirement for the measurement of mean
ocean topography and hence circulation. In order to monitor basin- and regional-scale ocean
dynamics and associated heat content changes, the geoid changes will need to be determined over
relevant time/spatial scales.
Action Lodge scans with an appropriate international data centre if digitization does not follow scanning; assemble classes of scanned record suitable for digitization, for example by crowdsourcing
Benefit Facilitate planning of data rescue
Who Institutions that have scanned data but not undertaken digitization; receiving data centres for assembly of records
Time frame Ongoing
Performance indicator
Statistics on holdings and organization of scanned records by data centres
Annual Cost US$ 10 000–100 000
Action Share recovered historical data records
Benefit Improved access to historical datasets to all users
Who Institutions that have recovered data records but not made them widely available.
Time frame Ongoing
Performance indicator
Number of released data records as reported in registers
Annual cost US$ 10 000–100 000

GCOS 2016 Implementation Plan
- 63 -
Closure of the water cycle implies mass conservation, but the observability of global mass flow is
limited. Mass transport information from gravimetry fills this gap. For instance, it is needed to
separate human-induced from natural changes in water use or to close the sea-level budget (It has
been shown that45, over the past decade, climate-driven groundwater uptake was of opposite sign
and of magnitude comparable with ice losses from glaciers and ice sheets and nearly twice as large as
mass losses from human-driven changes in groundwater). Satellite gravimetry is the only satellite-
based observation technique that is able to quantify groundwater changes, underlining the
uniqueness of mass transport observations.
Mass transport information at appropriate spatial and temporal resolution enables: (a) to enhance
ability to monitor, model and predict changes in the global water cycle, including extreme events; (b)
to separate mass balance processes on the ice sheets (glacial dynamics and surface mass balance),
ultimately improving predictions of sea level; and (c) to monitor and better understand climate-
related variations of ocean currents. User needs achievable with present capabilities have been
defined for the fields of hydrology, ocean, sea level, ice mass balance and glacial isostatic
adjustment. Some examples are given in Table 7, where the signal amplitude in terms of the height
of a mass-equivalent column of water per unit area (equivalent water height (EWH)), measurable
from gravity variations, is indicated as function of spatial resolution46. Mass transport observations,
currently provided by the Gravity Recovery and Climate Experiment (GRACE) mission, are expected to
continue with its follow-on mission until around 2023. Nevertheless, user needs lead to the
requirements in Table 7 that can be fulfilled with a constellation of gravity satellites.
Table 7. Requirements for gravity measurements for different uses and timescales
Signal Timescale Spatial scale Variation in EWH
Groundwater Monthly 10 km 30 cm
Yearly 100 km 5 cm
Glacier mass change Monthly 10 km 10 m
“ 200 km 1 m
Daily 10 km 1 m
“ 50 km 10 cm
Ocean mass input Long-term 1 000+ km 1 mm
Interannual “ 1 mm
Seasonal “ 10 mm
45 Reager, J.T., A.S. Gardner, J.S. Famiglietti, D.N. Wiese, A. Eicker and M.-H. Lo, 2016: A decade of sea level rise slowed by
climate-driven hydrology, Science 351, 699–703. DOI: 10.1126/science.aad8386 46
For a complete set see Pail, R., R. Bingham, C. Braitenberg, H. Dobslaw, A. Eicker, A. Güntner, M. Horwath, E. Ivins,
L. Longuevergne, I. Panet, B. Wouters, IUGG Expert Panel, 2015: Science and user needs for observing global mass
transport to understand global change and to benefit society. Surveys in Geophysics 36:743–772, DOI 10.1007/s10712-015-
9348-9.

GCOS 2016 Implementation Plan
- 64 -
2.5.2 Global topography models
Use of appropriate global terrain models of the Earth are critical to facilitate and underpin
appropriate climate change studies and observations. Establishing the shape, slope, type and
roughness of the land and seafloor are essential to support accurate model development and enable
the monitoring of change. The Earth’s surface is well understood for terrestrial areas, while the
seafloor is largely unsurveyed, with under 12% of the world’s oceans mapped to modern standards
(by multibeam sonar). As the shape of the ocean floor is intrinsically linked to ocean circulation and
mixing, effort must be directed to address the gap in this foundation dataset to support associated
climate studies. Recently, terrain and bathymetry models have also been combined in global relief
models, encompassing land topography, ocean and lake bathymetry and bedrock information, for
instance the ETOPO147 and the Earth201448 models. Applications to climate, however, typically refer
to terrain and bathymetry models separately. For completeness, it is worth mentioning that global
gravity models with very high spatial resolution (<1 km) are available from the combination of gravity
and topography data49.
For digital terrain models (DTM), the elevation is described by approximating the continuous terrain
surface by a set of discrete points with unique height values, expressed with respect to some
reference surface (e.g. geoid, reference ellipsoid) or to a geodetic datum, over 2D points. Similar
considerations apply to the seafloor elevation for bathymetry models. DTM differ from digital surface
models, where the heights of vegetation and man-made elements (e.g. buildings) are also included.
For all these global models, space techniques are unique in delivering globally uniform resolution
within reasonable time and cost (their description is beyond the scope of this document, but it is
worth noting the large commonality with observing techniques used to derive several ECVs, e.g.
altimetry).
In general, changes in the topography of the solid Earth are of great interest per se for climate
studies. For instance, any change in surface morphology will impact catchment hydrology. In the
current framework, the foundational value of these global models rests on their applications to
derive ECVs, which abound for the three ECV domains (atmospheric, oceanic, terrestrial). For
47
See, for example https://www.ngdc.noaa.gov/mgg/global/global.html 48
Pail, R., R. Bingham, C. Braitenberg, H. Dobslaw, A. Eicker, A. Güntner, M. Horwath, E. Ivins, L. Longuevergne, I. Panet,
B. Wouters, IUGG Expert Panel, 2015: Science and user needs for observing global mass transport to understand global
change and to benefit society. Surveys in Geophysics 36:743–772, DOI 10.1007/s10712-015-9348-9. 49
Hirt, C., et al., 2013: New ultra-high-resolution picture of Earth’s gravity field, Geophys. Res. Lett., 40, 4279–4283,
doi:10.1002/grl.50838.
Action G31: Improve gravimetric measurements from space
Action Prepare for satellite missions to provide continuity and consider improved performance to meet the observational requirements in Table 2
Benefit Improved monitoring of water transport and distribution.
Who Space agencies.
Time frame For 2023
Performance indicator
Published plans and agreed missions
Annual cost US$100 000–1 million

GCOS 2016 Implementation Plan
- 65 -
instance, virtually all atmospheric surface ECVs require topographic information to enable
meaningful interpretation. DTM are also necessary to retrieve the concentration of greenhouse
gases. For terrestrial ECVs, the use of DTM is equally essential for most ECVs: it would be impossible,
for example, to derive soil moisture or biomass information from space observations in the absence
of proper elevation information. For oceanic ECVs, the impact of bathymetry – where models are still
affected by a basic lack of supporting observations – is fundamental for accurate ocean circulation
and mixing and is critical for climate studies50 since seafloor topography steers surface currents,
while the roughness controls ocean mixing rates. From a technological standpoint, it can be noted
that DTM have become so essential as to be often embedded in space-borne sensors for Earth
observations, in order, for example, to enable acquiring and tracking radar signals.
Requirements for the different models vary vastly according to applications and cannot be easily
summarized. For terrain models, enormous advances are being made thanks to (synthetic aperture)
radar interferometry and LIDAR techniques, in addition to the traditional photogrammetric methods.
Models with very high spatial resolution (~10 m) and sub-metre precision are expected to be readily
available in the near future. The situation is much less comfortable for bathymetry models, as the
majority of the open ocean, particularly in the southern hemisphere, remains to be observed at the
required spatial resolution: our knowledge of ocean bathymetry is currently poorer than that of the
topographies of the Moon, Mars, and Venus.
Action G32: Improved bathymetry
50 Jayne, SR., L.C. St Laurent and S.T. Gille, 2004: Connections between ocean bottom topography and Earth’s climate,
Oceanography, 17(1), 65–74, doi:10.5670/ oceanog.2004.68.
Action Support increased level of multibeam seabed mapping both synchronously with ocean observation
initiatives and separately as dedicated basin-scale mapping initiatives
Benefit Better representation of ocean volume, improved ability to model ocean currents and mixing
Who Institutions that fund vessel-based science studies and programmes and/or have access to survey
platforms with existing multibeam survey infrastructure.
Time frame For 2023
Performance
indicator
Availability of improved bathymetry data
Annual cost US$ 30–100 million

GCOS 2016 Implementation Plan
- 66 -
3. ATMOSPHERIC CLIMATE OBSERVING SYSTEM
The overall atmospheric climate observing system comprises a complementary mix of in situ surface
and upper-air-based (including balloon-borne and aircraft) observations alongside surface
(e.g. radar) and satellite-based remote-sensing subsystems. To characterize the atmosphere at the
land and ocean surface, measurements of temperature, water vapour, wind, pressure, radiation
fields and precipitation are needed. Observations of atmospheric composition of various
constituents, such as carbon dioxide, methane and aerosols, are also required because of their
variability and impact on the radiative forcing of climate. Some ECVs, such as precipitation, are
highly variable in space and time and require high-resolution, continuous observations to create an
accurate description. Satellite observations provide global coverage of many atmospheric variables
and retrieval techniques are still being developed and tested for some. Satellite data, however, need
to be complemented, on a sustained basis, by in situ measurements, which are also required for
calibration and bias correction of the satellite measurements. Due to the radiative heterogeneity of
the land surface, the use of satellite observations of the lower part of the atmospheric column is
difficult, although ultraviolet/visible and infrared spectrum (UV/VIS) instruments provide information
on atmospheric composition there. A further limitation of satellite measurements is their generally
limited vertical resolution, especially in the boundary layer.
The in situ atmospheric observing systems are largely based on the Global Observing System of the
World Weather Watch (WWW/GOS), providing surface and upper-air observations of the
atmosphere, and on the WMO GAW networks for atmospheric composition in particular.
Based on the system of systems approach (GCOS Status Report 2015), three tiers of observing
network quality can be identified: reference, baseline and comprehensive. The GCOS
implementation strategy has placed an initial emphasis on the creation of baseline networks. These
include, as subsets of the WWW/GOS networks, the GCOS Surface Network (GSN) and the GCOS
Upper-Air Network (GUAN) for the surface and upper-air meteorological variables and the phased
establishment of GAW and other networks for all the composition variables. The latter has made
progress but still needs to be completed. Additionally, a GCOS Reference Upper-Air Network
(GRUAN51) has been established, which provides climate data of intrinsic higher value and
contributes to the calibration of data from both general in situ networks and the satellite and surface
remote-sensing subsystems.
A similar initiative for high-quality reference networks for atmospheric surface ECVs and atmospheric
composition ECVs (ozone, aerosols) is still lacking, although for composition targeted networks for
calibration and verification, such as the Total Carbon Column Observing Network (TCCON) for
satellite column greenhouse-gas observations, the Aerosol Robotic Network (AERONET) for aerosol
and water vapour column observations, and the GAW Aerosol Lidar Observations Network (GALION)
for aerosols profiles have been implemented. One possible enhancement to the atmospheric
composition networks would be to increase the atmospheric composition measurements made at
GRUAN stations.
51 www.gruan.org

GCOS 2016 Implementation Plan
- 67 -
For most atmospheric ECVs, international data centres exist which hold the basic archives (Table 8).
As documented below, however, there are several gaps and weaknesses that need to be addressed
to make access to the data easier.
Users of climate information require products that meet their requirements for accuracy and spatial
and temporal coverage. Many of these products are generated through the integration of data from
different sources. Integration of data from the complete mix of in situ networks and remote-sensing
subsystems can be achieved through the process of reanalysis, which, by consistently incorporating
historical data, provides homogeneous, consistent, multivariate products with either global or more
detailed regional coverage (see section 2.4). Use of the products of reanalysis to develop links
between meteorological conditions and socioeconomic impacts is viewed as one means to develop
the relationships needed to interpret the output of climate projection models for the purpose of
assessing needs and options for adaptation.
Some products, however, are independent of modelling frameworks and based on single or multiple
source datasets, which have been consistently processed to correct for artefacts and to provide a
continuous observational data record over space and time.
Recent engagement by the meteorological community with metrological institutes to improve
traceability of the measurements to standards and improve uncertainty estimates is welcomed and
should be maintained. National Meteorological and Hydrological Services (NMHSs) are encouraged
to retain and share parallel measurement programmes undertaken to manage changes in
measurement technology to help improve understanding of the impacts of these changes.
Comprehensive station metadata, such as accurate station heights and location coordinates, are
required, which will become easier to provide with the transition to the binary universal form for the
representation of meteorological data (BUFR) format.
This atmospheric domain chapter is divided into four separate sections in this Plan: surface ECVs
(typically within the first few metres of the atmospheric column); upper-air meteorological ECVs
(typically above the surface to the stratopause); and atmospheric composition ECVs at all levels.
There is also a section on the technological challenges required to enhance the climate observing
system for the atmosphere.
3.1 Atmospheric domain – near-surface variables
Observations at the surface of the Earth are vitally important as they characterize the climate of the
layer of the atmosphere in which we live, and where many impacts of climate change will be felt and
necessitate adaptation. Climate analysis has traditionally placed emphasis on surface temperature,
precipitation and pressure data. Temperature and precipitation have the greatest impact on natural
systems and human activities, with pressure allowing a perspective on the meteorological systems
that drive the weather. More recently, wind speed, wind direction, humidity and sunshine data have
become increasingly important as nations consider measures to mitigate or adapt to future climate
change. For example, some CDRs are used for the design of renewable energy systems, which include
wind and solar farms, as well as hydroelectric systems. Wind, water vapour, sunshine and surface
radiation are also associated with a range of direct impacts such as on human health and agriculture.
GCOS 2016 Implementation Plan
- 68 -
There is an increasing need for local, high-frequency surface atmospheric data on climate, to
characterize extremes for the purposes of monitoring and more generally to meet needs relating to
impacts, vulnerabilities and adaptive responses. National vulnerability and adaptation to climate
change, especially in the intensity and frequency of extreme events, require city-scale, local and
regional climate observing networks at a much finer spatial scale than international networks for
surface synoptic observations. The design and operational details of such fine-scale networks depend
on both climate variability and change and vulnerability in each specific case (region, province, city)
and need to be determined by appropriate observing system studies. Recent developments in low-
cost measurement technology are providing opportunities for mesonets with sub-kilometre scale and
sub-hourly sampling, which have obvious applications for monitoring the urban environment.
Opportunities are also emerging to exploit ad hoc data from non-standard networks set up in
countries (for transport, air-pollution monitoring, crowd sourced observations, etc.), but careful
study is needed to understand how to deal with their variable quality.
As networks evolve, it is important to note that the usefulness of all ECVs in the atmospheric domain
is enhanced through collocated measurements of terrestrial, ocean and ecosystem properties.
Greater efforts should be made to establish key sites in selected areas where many of the ECVs for
both the atmospheric and terrestrial domains are observed to the highest possible standard and on a
sustained basis. More attention needs to be paid to the measurement of some of the ECVs in the
urban environment where an increasing proportion of the world’s population resides and where
specific impacts and opportunities for adaptation arise.
This Plan identifies a number of actions to improve the availability of the required observations and
data products. It also identifies actions to enhance the frequency of reporting and general operation
of the WWW/GOS surface synoptic network, so that its data meet climate needs more fully.
The primary land and marine networks contributing to climate observations at the Earth’s surface
are:
(a) Over land, the WMO WWW/GOS surface synoptic observing network (~10 000 stations) provides
the major in situ observations of the following ECVs: Temperature, Air pressure, Precipitation,
Water vapour, Surface radiation (e.g. sunshine duration, solar irradiance) and Wind speed and
Direction. Included in this network is the global baseline GSN. The GSN comprises about 1 000
stations at 5-10 degree intervals of latitude and longitude that have been selected from the full
network based on past performance and their contribution towards a global representation of
the climate system. The operators of GSN stations, in particular, are encouraged to fully meet
the GCMPs for observation and for data exchange, where possible, for all surface ECVs. The GSN
data can be analysed to yield basic indicators of the global climate system52 and also provide
benchmark locations for higher-density local, regional and national networks. The AOPC, in
cooperation with the WMO Commission for Basic Systems (CBS), carries out detailed analysis of
52 Alexander, L.V., X. Zhang, T.C. Peterson, J. Caesar, B. Gleason, A.M.G. KleinTank, M. Haylock, D. Collins, B. Trewin, F.
Rahimzadeh, A. Tagipour, K. Rupa Kumar, J Revadekar, G. Griffiths, L. Vincent, D.B. Stephenson, J. Burn, E. Aguilar, M. Brunet, M.
Taylor, M. New, P. Zhai, M. Rusticucci and J.L. Vazquez-Aguirre, 2006: Global observed changes in daily climate extremes of
temperature and precipitation. Journal of Geophysical Research, 111,D05109,doi:10.1029/2005JD006290,2006.

GCOS 2016 Implementation Plan
- 69 -
the problems in the receipt of GSN observations and works with national services to resolve
them. Important contributions to regional networks are the WMO WWW Regional Basic
Climatological Networks (RBCN, total ~3 000 station subset of the WWW/GOS surface synoptic
network), established in all regions of the world including the Antarctic to support regional
representations of the climate system. It is important to note that, as part of the regional
implementation of WIGOS, a new Regional Basic Observing Network (RBON) concept is being
introduce to replace and expand on the capabilities of the existing Regional Basic Synoptic
Network (RBSN) and RBCN;
(b) Over the oceans, the in situ surface meteorological observations are provided by Voluntary
Observing Ships (VOS), including the higher-quality VOS Climate Project (VOSClim) subset, and by
moored and drifting buoys. Research vessels provide observations for remote regions where
data are sparse. The implementation of these observing systems is covered in detail in the
oceanic domain chapter. Some specific issues on observing the near-surface layer marine
meteorological fields (temperature, pressure, wind speed and direction, water vapour, surface
radiation and precipitation) are addressed here.
The observing networks and satellite data required to monitor and analyse the ECVs in the
atmospheric surface domain are listed in Table 8, together with the current status of each observing
network and system.
Table 8. Observing networks and systems contributing to the surface component of the
atmospheric domain.
Atmospheric domain – surface ECVs
Temperature Contributing networks Status GCOS Surface Network (subset of full WWW/GOS surface synoptic network) Full WWW/GOS surface synoptic network
30% more SYNOP stations in 2014 compared with 2002 and 80% more reports received. 10% of stations in 2002 no longer report. Meteorological terminal aviation routine weather report (METAR) data have enhanced the networks. Data receipt from some countries is still inadequate. Transition from CLIMAT code to BUFR is underway but lacks coordination. Many countries continue to use traditional alphanumeric codes (TAC). A new BUFR template is currently under validation for reporting daily climate quality observations required for monitoring of extremes.
Moored buoys and ships Ship observations declined over ocean basins from 2002 to 2014 but increased around coasts. Moored buoys have increased significantly. Decline in the VOS has led to a significant lack of air temperature measurements over the ocean. Availability of measurements from long-term, high-quality moorings is inadequate to evaluate the stability of SST from satellite measurements, except in the tropical Pacific.
Additional national networks (see also Oceanic section, Sea-surface temperature ECV).
More in situ air temperature measurements are needed in certain surface regimes (high altitudes, desert, high latitudes, deep forest), in order to enable the optimum use of LST to help to estimate air temperature in these places.
Contributing satellite data Status Satellites do not directly measure surface air temperature. Surface skin temperature (infrared (IR), microwave) is measured (see ocean and terrestrial domains) and has a strong influence on the analysis of air temperature over the land/ocean. Independent air surface measurements are needed for surface.
For skin temperature operationally supported satellites are in at least 2 polar and >5 geostationary orbits for IR measurements. Some uncertainty over future of microwave (MW) imagers with channels which can measure SST through cloud to provide good global coverage. An effort is needed to derive a seamless LST record from all geostationary satellites and/or Advanced Very High Resolution Radiometer (AVHRR), Moderate Resolution Imaging Spectroradiometer (MODIS), Visible Infrared Imaging Radiometer Suite (VIIRS) and Along Track Scanning Radiometer/Sea and Land Surface Temperature Radiometer (ATSR/SLSTR), consistently, as far back as possible, in order to achieve a good global monitoring dataset.

GCOS 2016 Implementation Plan
- 70 -
Pressure Contributing networks Status GCOS Surface Network (subset of full WWW/GOS surface synoptic network) Full WWW/GOS surface synoptic network Additional national networks
30% more SYNOP stations in 2014 compared with 2002 and 80% more reports received. 10% of stations in 2002 no longer reported. METAR data have enhanced network. Data receipt from some countries is still inadequate.
Drifting buoys and VO ships (VOS) Manual ship observations have reduced over ocean basins from 2002–2014 but automatic reports have increased. Surface pressure sensors are only on a limited number of drifting buoys.
Contributing satellite data Status Global Navigation Satellite System (GNSS) radio occultation (RO) measurements contribute to inferring the surface pressure but are not able to provide absolute anchor measurements at present.
Continuity for GNSS RO constellation needs to be secured as current COSMIC satellites beyond expected life and failing. COSMIC-2 is currently only guaranteed to cover tropical latitudes but several other missions do provide higher latitude RO.
Wind speed and direction Contributing networks Status GCOS Surface Network (subset of full WWW/GOS surface network) WWW/GOS surface synoptic network Additional national networks Buoys and ships (see Ocean domain section, Part II, chapter 4)
Wind is still not included in GSN.
Contributing satellite data Status Scatterometer winds over ocean
Scatterometers are now only assured in one orbital plane, limiting coverage, but other scatterometers and altimeters, contribute on an ad hoc basis.
Passive microwave for wind speed Several microwave imagers now in orbit but uncertainty over future instruments
Polarimetric microwave radiometry for wind vectors
Only one instrument in orbit with limited lifetime; helps to fill current scatterometer gaps.
Precipitation Contributing networks Status GCOS Surface Network (subset of full WWW/GOS surface synoptic network) Full WWW/GOS surface synoptic network Additional national meteorological and hydrological gauge networks; island networks.
Quality of data and quantity of reports are variable but data are analysed and archived. Limited coverage in time and space. Transition of CLIMAT to BUFR is underway. Most countries operate national high-resolution precipitation networks, but data are often not available internationally, or available only with time delay.
Surface-based radar networks. Radar data not globally exchanged but some regions now have good networks. Homogenization of radar precipitation is complex and blending radar and gauge precipitation is a long-term objective and still at a very early stage of development.
Moored buoys Very limited observations (e.g. TAO/TRITON buoys) available which were used to validate the Tropical Rainfall Measuring Mission (TRMM).

GCOS 2016 Implementation Plan
- 71 -
Contributing satellite data Status Passive microwave imagers on several polar satellites contribute. GSN/IR products from geostationary improve temporal coverage but are less accurate.
Global Precipitation Measurement (GPM) satellite, replacing TRMM, has improved coverage at high latitudes. Most microwave imagers are beyond their design lifetime and a future gap in the observing system of microwave imagers is likely.
Precipitation radar on research satellites (TRMM and GPM)
Uncertainty for continuity of precipitation radar, temporal and spatial sampling limitations
Water vapour Contributing networks Status GCOS Surface Network (subset of full WWW/GOS surface synoptic network)
Full WWW/GOS surface synoptic network
Water vapour is only partly included in CLIMAT reports and not monitored. Requirement is for synoptic data not averaged. The non-linear relationship between various indicators of water vapour (e.g. vapour pressure, dew-point temperature, relative humidity) means that monthly means of one indicator cannot be derived from monthly means of another. More issues of quality than for temperature due to wide range of instruments. Some require careful operation/maintenance, the simpler/cheaper resistance-type sensors have a tendency to drift within 6 months to a year and so require frequent calibration. Issues relating to poor ventilation in low wind speeds and ice bulb/wet bulb around freezing.
Ships and moored buoys VOSClim stable; VOS fleet declining; no measurement from drifting buoys and only from a subset of moored buoys. Additional humidity measurements are needed over the ocean in order to estimate air-sea heat flux.
Contributing satellite data Status Visible, infrared and microwave (latter over ocean) all provide water vapour profile information but sensitivity to surface layer is small so measurement is indirect inferred from deeper layer values.
Only indirect measurement and infrared coverage is clear sky only. Microwave sounders contribute but with coarser spatial resolution. The health of the global observing system with respect to microwave sounders quite good today and in the future. Three separate orbital planes are important for temporal coverage. CMA committing to the early morning orbit is an important accomplishment by WMO and CGMS and microwave sounder coverage by EUMETSAT and NOAA will provide sustained observations until at least 2040.
Surface radiation budget Contributing networks Status GCOS BSRN Coverage limited but 10 more stations added since 2009, though 2 Arctic
stations closed. Continuity needs to be secured.
WWW/GOS surface synoptic network Quality and coverage of routine radiation data (mainly incoming solar in monthly CLIMAT reports) is variable.
Additional national networks Limited availability of high-quality data in national networks
Moored buoys Solar fluxes and longwave radiation available over the ocean from some moored buoys and research vessels
Contributing satellite data Status Geostationary and polar orbiter visible and infrared data
Incident solar radiation inferred from satellite visible radiances For infrared, satellite data are used to estimate cloud and near-surface parameters and thermodynamics fields are typically taken from reanalyses.
The number of stations designated to be part of the GSN rose from 987 in 2001 to 1 017 in 2014, but
some of the original stations no longer operate. Many stations over Africa and the tropical Pacific
have ceased reporting.

GCOS 2016 Implementation Plan
- 72 -
Action A1: Near-real-time and historical GCOS Surface Network availability
A number of actions reflect the need for historic land surface station data for many atmospheric
surface ECVs. These actions for NMHSs to submit historic land data holdings reflect a more general
need to build and maintain a centralized database for land surface station data broadly similar to the
International Comprehensive Ocean Atmosphere Dataset (ICOADS). Such a land station database
would contain all land data holdings currently held by the data centres (see Table 8) for all time
resolutions (monthly, daily, sub-daily) and for all measured parameters. Following the integration of
data currently held by the data centres and the establishment of standard database formats, data
held by the reanalysis centres and NMHSs can then be added over time. Short time-delay updates to
the database can occur via the Global Telecommunications System, but the new comprehensive land
database should also take advantage of other data-sharing mechanisms, such as web services. A land
station history database, consistent with Observing Systems Capability Analysis and Review Tool
(OSCAR), would provide the station metadata necessary to support use of the integrated land surface
database.
Some progress has been made in the development of such a comprehensive database for land
surface station data through the International Surface Temperature Initiative), whose databank
currently covers monthly temperature data but is planned to extend to more variables.
While the WWW/GOS surface synoptic observing networks have been developed primarily to
support weather prediction, their high spatial density and frequent sampling means that they are of
value to the climate community also, especially for studies of extremes and impacts, vulnerabilities
and adaptation. The GCOS Steering Committee, through the WMO CBS, WMO CCl and WMO
regional associations and WMO WWW, encourages more frequent reporting for the Regional Basic
Synoptic Network (RBSN) of the WWW/GOS.
Action Improve the availability of near-real-time and historical GSN data especially over Africa and the tropical Pacific
Benefit Improved access for users to near-real-time GSN data
Who NMHSs, regional centres in coordination/cooperation with WMO CBS, and with advice from AOPC
Time frame Continuous for monitoring GSN performance and receipt of data at archive centre
Performance indicator
AOPC review of data archive statistics at the World Data Center for Meteorology at Asheville, NC, USA, annually and national communications to UNFCCC
Annual cost US$ 10–15 million
Action A2: Land database
Action Set up a framework for an integrated land database which includes all the atmospheric and
surface ECVs and across all reporting timescales
Benefit Centralized archive for all parameters. Facilitates QC among elements, identifying gaps in the data, efficient gathering and provision of rescued historical data, integrated analysis and monitoring of ECVs. Supports climate assessments, extremes, etc. Standardized formats and metadata.
Who NCEI and contributing centres
Time frame Framework agreed by 2018
Performance indicator
Report progress annually to AOPC
Annual cost US$ 100 000–1 million

GCOS 2016 Implementation Plan
- 73 -
Action A3: International exchange of SYNOP and CLIMAT reports
Many observing stations (over both land and ocean) are being transitioned from manual operation to
automatic or quasi-automatic operation. These changes have been demonstrated to import
potential inconsistencies and inhomogeneities into the climate record and are addressed as one
element of the GCMPs. Automation is also leading to the loss of some observations (e.g. some cloud
observations) and merging such datasets with newer remotely sensed datasets will be a substantial
challenge. Additional guidance on the ways and means to ensure compatible transition has been
provided by the WMO Commission for Instruments and Methods of Observation (CIMO), in
cooperation with WMO CCl and WMO CBS. Implementation of those guidelines, adherence to the
GCMPs and further assessment of the consequences of transition through national and international
studies would help to fully characterize this change in observing practices.
Action A4: Surface observing stations: transition from manual to automatic
The migration from TAC to BUFR for SYNOP and radiosonde TEMP reports started in 2014 and is still
ongoing. This has the potential to introduce breaks or inconsistent pairs of TAC/BUFR reports in the
station records where the new data formats were adopted, so timely notification of when changes
are made are needed by the data archiving centres to enable them to compare the data in both
formats to ensure consistency. More information is provided with the new BUFR messages
(e.g. better vertical resolution for profiles and station metadata) which should be exploited once
archiving of the BUFR data is assured.
The transition to daily CLIMAT messages in BUFR which allows recording of daily averages and
maximum and minimum values will allow more representative climatologies to be developed with
better estimates of extremes. This initiative is to be encouraged for all surface observations issued
as CLIMAT messages.
Action Obtain further progress in the systematic international exchange of both hourly SYNOP reports and daily and monthly CLIMAT reports from all stations
Benefit Enhanced holdings data archives
Who NMHSs, regional centres in coordination/cooperation with WMO CBS, and with advice from AOPC
Time frame Continuous, with significant improvement in receipt of RBSN synoptic and CLIMAT data by 2019
Performance indicator
Data archive statistics at data centres
Annual cost US$ 100 000–1 million
Action Follow guidelines and procedures for the transition from manual to automatic surface observing stations
Benefit More stable time series
Who Parties operating GSN stations for implementation. WMO CCl, in cooperation with WMO CIMO, WMO CBS for review
Time frame Ongoing
Performance indicator
Implementation noted in national communications and relevant information provided
Annual cost US$ 30–100 million

GCOS 2016 Implementation Plan
- 74 -
Action A5: Transition to BUFR
3.1.1 Issues for specific atmosphere-surface ECVs
ECV – Air Temperature
In addition to the land-based observations of surface air temperature, the observation of sea-surface
temperature, air temperature over the ocean (from VOS, buoys and research vessels), and sea ice
(from the Arctic and Antarctic buoy networks) is required. The polar regions have only a very sparse
surface temperature network which should be enhanced. Microwave satellite SSTs are not assured
for the future which may lead to reduced coverage of SST and inferred air temperatures over the
ocean. Not all countries share their data with global data centres (SST and LST are dealt with in the
ocean and terrestrial domain chapters).
The decline in VOS has led to a significant lack of air temperature measurements over the oceans
that are not available from any other component of the observing system. Whilst efforts are
underway – including through reanalyses to estimate air temperature over the ocean – these are
hampered by the current level of availability of VOS air-temperature measurements. More air-
temperature measurements are needed in certain surface regimes (high altitudes, deserts, high
latitudes, deep forest), where the networks tend to be sparse or non-existent.
Action A6: Air temperature measurements
ECV – Pressure
In addition to the land-based observations of pressure, pressure data over the ocean are required
from sensors mounted on drifting buoys (including sea-ice areas of the Arctic and Antarctic) from
VOS, including the higher-quality VOSClim subset, from parts of the Tropical Mooring Network and
from the Reference Buoy Network. There has been a significant increase in recent years in the
number of reports in the extra-tropics, but the tropical and sub-tropical Pacific is a data void. The
national agencies that deploy drifting buoys should endeavour to ensure that surface-pressure
Action Encourage dual transmission of TAC and BUFR for at least 6 months and longer if inconsistencies are seen (to compare the two data streams for accuracy).
Benefit Transition to BUFR does not introduce discontinuities in the datasets. BUFR allows metadata to be stored with data.
Who Parties operating GSN stations for implementation
Time frame Ongoing for implementation; review by 2018
Performance indicator
Proven capability to store BUFR messages giving same quality or better as TAC data
Annual cost US$ 100 000–1 million
Action Enhance air temperature measurements networks in remote or sparsely populated areas and over the ocean
Benefit Improved coverage for better depiction of climate system
Who National Parties and international coordination structures such as the Global Cryosphere Watch (GCW)
Time frame Ongoing
Performance indicator
Coverage of air-temperature measurements
Annual cost US$ 10–30 million
GCOS 2016 Implementation Plan
- 75 -
sensors are included as a standard component of the suite of instruments on all buoys deployed. See
also action O47 in the ocean chapter.
A significant issue – especially for measurements in developing countries – is the transition from
mercury-based instruments (barometers and thermometers) to alternative techniques imposed by
the Minamata Convention to take effect in 2020.
Action A7: Atmospheric pressure sensors on drifting buoys
ECV – Surface precipitation
Since precipitation often occurs on small space- and timescales, the density of the networks
appropriate for surface temperature and pressure is inadequate for precipitation. Many nations
have organized and operate special raingauge and radar networks devoted to the observation of
precipitation amount, type (rain, snow, etc.) and distribution on fine space- and timescales.
Hourly or more frequent data are required for studies of extremes and precipitation characteristics.
The GCOS requirements for global and regional analyses of precipitation can be more nearly met by
the incorporation of observations from these networks. Subsequently, all nations will need to
routinely provide all their current raingauge observations to the Global Precipitation Climatology
Centre (GPCC) and the global archives at WDC Asheville, as promptly as possible. Continuing
research and instrument intercomparisons are required to overcome some outstanding
measurement problems, particularly in relation to the measurements of solid precipitation, such as
wind-induced under-catch of snow.
Action A8: Provide precipitation data to the Global Precipitation Climatology Centre
Even with the efforts of many nations, precipitation observations are still not available with an
adequate density to define the distribution of precipitation in many parts of the globe, including the
oceans and many land areas. Estimates of precipitation derived from satellite observing systems
have been used to map the distribution of precipitation and have proven essential for global analyses
when combined with surface-based precipitation observations. An assured continuation and
Action Enhance to 100% the percentage of drifting buoys incorporating atmospheric pressure sensors, in particular by benefiting from barometer-upgrade programmes
Benefit Measurements over oceans of surface pressure will improve coverage.
Who Parties deploying drifting buoys and buoy-operating organizations, coordinated through JCOMM, with advice from OOPC and AOPC
Time frame Ongoing
Performance indicator
Percentage of buoys with sea-level pressure (SLP) sensors in tropics and sub-tropics
Annual cost US$ 10 000–100 000
Action Submit all precipitation data from national networks to the Global Precipitation Climatology Centre at the Deutscher Wetterdienst
Benefit Improved estimates of extremes and trends, enhanced spatial and temporal detail that address mitigation and adaptation requirements
Who NMHSs with coordination through the WMO CCl and the GFCS.
Time frame Ongoing
Performance indicator
Percentage of nations providing all their holdings of precipitation data to international data centres.
Annual cost US$ 100 000–1 million

GCOS 2016 Implementation Plan
- 76 -
enhancement of the satellite systems contributing to precipitation observations (passive MW
measurements together with active radars) is required to ensure continued global monitoring.
The Global Precipitation Climatology Project (GPCP) has devised and implemented an initial, quasi-
operational strategy, including in situ observations and estimates derived from radar and satellite
data, for providing global analyses of precipitation. This strategy must be periodically reviewed and
enhanced to take advantage of improvements in technology and data availability, to accommodate
the full suite of GCOS requirements. Improved methods for observing precipitation and deriving
global precipitation products using advances in technology should be pursued.
Some surface observations of precipitation over the oceans are particularly important for the
validation and refinement of satellite-derived precipitation products. Some research vessels
measure precipitation and OOPC will work with the Ocean Reference Mooring Network to ensure
such observations can be obtained from moored buoys, including the necessary technical
developments to enable this (see section 4.5.2 and action O44).
ECV – Wind speed and direction
Over land, the observation of wind speed and direction is accomplished largely through the
WWW/GOS surface synoptic meteorological network. Hourly data can be used for climate studies,
particularly for the renewable energy industry, although the height of the measurements above
ground may vary. There has been an increase in the exchange of three-hourly or hourly data over
the GTS, but scope remains for improvement. Action A3 calls for the more frequent reporting of
SYNOP data that is required. This is of particular importance for the characterization of extreme
weather events.
Over the oceans, the atmospheric observations from VOS, including the higher-quality VOSClim, the
Tropical Mooring Network and the Reference Buoy Network provide a sparse but vital data resource
which must be sent to the international data centres (see section 4.5.1 and action O34). Every effort
should be made to continue this unique source of in situ observations.
Spaceborne scatterometer and passive MW radiometer data are invaluable sources for wind field
information over the ocean. A sustained commitment to deployment of a two-scatterometer
constellation or equivalent wind-measuring systems is a key requirement not only for climate but
also for numerical weather prediction (NWP) and tropical cyclone forecasting. According to the
CGMS baseline for the operational contribution to the GOS, the operational space agencies have
committed to “perform on [an] operational/sustained basis” “wind scatterometry over sea surfaces
(at least two orbital planes)”.53
53 Manual on the WMO Integrated Global Observing System, WMO-No. 1160, Att. 4.1

GCOS 2016 Implementation Plan
- 77 -
ECV – Water vapour
Water-vapour (humidity) measurements are obtained from the WWW/GOS surface synoptic
observing networks over land. Over the oceans, the observations are obtained from VOS, including
the higher-quality VOSClim, the Tropical Mooring Network, and the Reference Buoy Network.
Homogeneous data with realistic uncertainties are essential for assessment of the impact of changes
of surface water vapour on natural and human systems. Continued efforts to provide historical data
to the GCOS analysis and archive centres are needed. It should be noted that the non-linear
relationship between various indicators of water vapour (vapour pressure, dew-point temperature,
relative humidity) means that monthly means of one indicator cannot be derived from monthly
means of another, thus daily instantaneous values are required.
Action A9: Submit water-vapour data
ECV – Surface Radiation Budget
The surface radiation budget is a fundamental component of the surface energy budget that is crucial
to nearly all aspects of climate and needs to be monitored systematically. The Baseline Surface
Radiation Network (BSRN) of the WCRP has established the relevant measurement techniques and is
now recognized as the GCOS Baseline Network for Surface Radiation. It provides high-quality
measurements of radiation at the surface, but has limited spatial coverage (see Figure 6). A few
more stations have been added in recent years but the network still needs to be expanded beyond
its current number of some 60 stations and adequately supported in the future.
Figure 6. Running, planned and closed BSRN stations, May 2016 stations
Action Submit water-vapour (humidity) data from national networks and marine platforms to the international data centres
Benefit Improved coverage of surface water-vapour measurements
Who NMHSs, through WMO CBS and international data centres, with input from AOPC
Time frame Ongoing
Performance indicator
Data availability in analysis centres and archive and scientific reports on the use of these data
Annual cost US$ 100 000–1 million

GCOS 2016 Implementation Plan
- 78 -
The plotting does not distinguish pairs of nearby US stations in Boulder, Colorado (USA), Oklahoma
(USA) and Dawin (Australia). It is based on information from the World Radiation Monitoring Centre,
Alfred Wegener Institute, downloaded from http://bsrn.awi.de in May 2016.
Adding net radiometer measurements to a greater number of WWW/GOS surface synoptic stations is
also desirable where the surrounding surface is sufficiently homogeneous to make the upwelling
observations representative of the larger area. At BSRN sites, downward-looking instruments should
be used instead of net radiometers.
Efforts should be made to expand downwelling radiative fluxes over the ocean. The use of research
ships and buoys is a key element in attaining global cover in surface radiation observations (see
action O45). Because the spatial coverage of BSRN and buoys and ships are poor compared with
satellite observations, monitoring surface radiation budget needs to be synergistic between radiation
observations at surface stations and estimates from satellites (GEWEX SRB, Clouds and the Earth's
Radiant Energy System (CERES) SRBAVG, ISCCP-FD, CMSAF-SARAH).
The existing extensive datasets of sunshine duration in most countries could also provide useful
historical information for climate analysis and their incorporation into GCOS analysis and archive
centres is required.
Action A10: Incorporating national sunshine records into data centres
Concerning BSRN data delivery, around one third of the stations provide values within six months of
measurement time but, as of February 2015, 12 stations had delivered no data as of 2010. The
status of some of these stations is unknown. Not all stations follow the recommended BSRN quality-
control checks, but an overall increase of data quality is clear from consistency checks of the
measurements provided. An analysis of the BSRN data to estimate global fields is not possible due to
limitations in data coverage. Documenting operating conditions that influence the quality of surface
radiation measurements is performed. This includes the type of radiometers used for the
observations, flow rate of ventilation, frequency of cleaning the instruments, description of the field-
of-view, calibration method and frequency of calibration. In addition, where major changes in
operating or surrounding conditions have occurred, the changes are documented and distributed
with the data.
Action National sunshine records should be incorporated into International Data Centres.
Benefit Better description of surface radiation fields
Who NMHSs
Time frame Implement in next 2 years
Performance indicator
Sunshine record archive established in international data centres and in analysis centres by 2018
Annual cost US$ 1–10 million

GCOS 2016 Implementation Plan
- 79 -
Action A11: Operation of the the GCOS Baseline Network for Surface Radiation
The World Radiation Data Centre holds archive data for 1 590 stations for a period since January
1964, as of March 2014. This represents a significant increase on the figure of 1 118 reported in
GCOS (2009). Some data are held for most countries, with the largest exception occurring for several
in South America. The locations of stations reporting for the period from January 2013 to August
2014 (as of September 2014) are similar to the number of about 400 stations quoted in GCOS (2009).
Action A12: Surface radiation data to the World Radiaiton Data Centre
3.2 Atmospheric domain – upper-air
Upper-air meteorological variables characterize the atmosphere above the surface of the Earth,
where dynamic, thermodynamic and constituent-transport processes occur. Measurements of
temperature, wind, water vapour and cloud are vital for initializing and verifying climate projections
and for detecting, understanding and attributing variability and change in the climate system. Data
on incoming solar radiation at the top of the atmosphere are fundamental for documenting the
external forcing of the climate system and specifying it in models, while data on the outgoing thermal
and reflected radiation are important for quantifying the energy budget and evaluating models.
Knowledge of the varying composition of the atmosphere is discussed separately in
section 3.3.
Observations from satellites have provided an increasingly important source of upper-air data for
more than 40 years. Radiosondes and commercial aircraft are also important components of the
overall observing system. Pilot balloons and ground-based profilers provide supplementary wind
information; net water-vapour content is estimated from the delay in receipt of GNSS signals by
ground-based receivers and other forms of ground-based remote-sensing play a significant and
growing role. The observing networks and their current status, together with the satellite data
required for each ECV in the atmospheric domain – upper-air, are summarized in Table 9.
Action Ensure continued long-term operation of the BSRN and expand the network to obtain globally more representative coverage and improve communications between station operators and the archive centre
Benefit Continuing baseline surface radiation climate record at BSRN sites
Who Parties’ national services and research programmes operating BSRN sites in cooperation with AOPC and the WCRP GEWEX Radiation Panel
Time frame Ongoing
Performance indicator
The number of BSRN stations regularly submitting valid data to international data centres
Annual cost US$ 100 000–1 million
Action
Submit surface radiation data with quality indicators from national networks to the WRDC; expand deployment of surface radiation measurements over ocean
Benefit Expand central archive; data crucial to constrain global radiation budgets and for satellite product validation; more data over ocean would fill an existing gap.
Who NMHSs and others, in collaboration with WRDC
Time frame Ongoing
Performance indicator
Data availability in WRDC
Annual cost US$ 1–10 million

GCOS 2016 Implementation Plan
- 80 -
Table 9. Observing networks and systems contributing to the upper-air component of the
atmospheric domain
ATMOSPHERIC DOMAIN – UPPER-AIR ECV
Temperature Contributing networks
Status
Reference network of high-quality and high-altitude radiosondes (GRUAN).
GRUAN is now well established with 22 stations participating and 7 already certified.
GCOS Upper-Air Network (subset of full WWW/GOS radiosondes network)
A 10% increase in number of 500 hPa reports and 20% increase at 30 hPa from 2002 to 2014. Improvements in data quality seen.
Full WWW/GOS radiosonde network
The move to BUFR has started but more remains to be done for all countries to be reporting. Many stations do not provide two observations each day.
Commercial aircraft The Aircraft Meteorological Data Relay (AMDAR) programme provides routine flight level and profile wind and temperature measurements. Needs expansion to include all major airlines and major airports.
Contributing satellite data
Status
Microwave and infrared sounders
Ensured continuity of Infrared Atmospheric Sounding Interferometer (IASI) and Cross-track Infrared Sounder (CrlS) and Advanced Microwave Sounding Unit (AMSU)-like radiances for 3 orthogonal polar orbits. More work needed on recovery of data from early instruments in the 1970s. Improvements expected with gradual move to geostationary infrared sounders.
GNSS RO Continuity for GNSS RO constellation needs to be secured as current COSMIC satellites beyond expected life. COSMIC-2 is currently only guaranteed to cover tropical latitudes but several other missions provide RO data. Polar constellation needs to be secured. High-latitude data are necessary for climate-quality analysis
Wind speed and direction Contributing networks
Status
GCOS Upper-Air Network (subset of full WWW/GOS radiosondes network)
About 90% of stations are reporting regularly; only two completely silent.
Full WWW/GOS radiosonde network
Same as for temperature above
PILOT balloons Typically 350 sites globally distributed
Wind profilers Profiler sites mainly over Europe, Japan and USA but latter are being phased out.
Commercial aircraft Aircraft observations limited to specific levels except near airports
Contributing satellite data
Status
Atmospheric motion vectors from geostationary and polar orbiters
Geostationary atmospheric motion vector (AMV) accuracy and spatial and temporal density improving. The poles are covered with AVHRR, VIIRS, MODIS, Multi-angle Imaging SpectroRadiometer (MISR) and Atmospheric InfraRed Sounder (AIRS) AMVs. The low Earth orbit (LEO)-GEO AMVs and Eumetsat's global Metop AVHRR have filled the long-standing gap in coverage (40°-70° N/S). New imagers, such as Himawari-8 AHI of the Japan Meteorological Agency (JMA), with better horizontal resolution, improved temporal coverage and more spectral channels are becoming available in geostationary orbit. Imagers operated by China, Republic of Korea, USA and Eumetsat will eventually have similar capabilities.
Doppler wind lidar Awaiting Atmospheric Dynamic Mission (ADM)/Aeolus demonstration; no continuity planned after this

GCOS 2016 Implementation Plan
- 81 -
Water vapour Contributing networks Status GRUAN GRUAN coverage as above for temperature; accurate references measuring upper
tropospheric and lower stratospheric humidity independently are being made.
GCOS Upper-Air Network (subset of full WWW/GOS radiosondes network)
Accuracy of water-vapour measurements is improving but is still inadequate for climate purposes in the upper troposphere and lower stratosphere.
Full WWW/GOS radiosonde network.
Ground-based GNSS receiver network.
Wider international exchange of data is still needed.
Commercial aircraft Aircraft data over the USA (E-AMDAR, Tropospheric Airborne Meteorological Data Reporting (TAMDAR) are starting to provide a regular dataset and a few flights now over Europe. Secondary Survellaince Radar Process (MODE-S) is potentially a new source of data.
Contributing satellite data Status Hyperspectral infrared sounders Will be operational in 3 orbital planes. Highly vertically resolved water-vapour
observations, especially in the lower troposphere, are crucially needed which are beyond the capabilities of these sensors.
MW imagers and sounders; infrared imagers and sounders
For MW sounders coverage as above. In addition, satellites at low latitudes provide improved tropical coverage. MW imagers provide total column amounts. Continuity uncertain for microwave imagery in 3 orbital planes. Geostationary infrared images provide high temporal resolution water-vapour data. Improvements expected with gradual move to geostationary infrared sounders.
GNSS RO Information on water vapour at all levels
Infrared and MW limb sounders and solar occultation
No continuity of current limb sounders for stratospheric water vapour
VIS/near-infrared (NIR) nadir viewing sounders/imagers
Several satellites now provide this capability of measuring total column water vapour over land during daylight hours.
Cloud properties Contributing networks Status Surface observations (GSN, WWW/GOS, VOS)
Surface observations of cloud cover provide a historical but uncertain record and continuity is a concern; reprocessing of cloud data is needed.
Cloud radar and lidar Research-based networks only
Contributing satellite data Status VIS, IR and MW radiances from geostationary and polar orbiting satellites
Cloud-top temperature, microphysical properties and coverage are all operational and have good continuity.
Cloud radar and lidar on research satellites
No continuity assured of these research satellites
Top of Atmosphere Earth Radiation Budget Contributing satellite data Status Broadband short- and longwave and total and spectral solar irradiance
National Polar-orbiting Partnership/Joint Polar Satellite System (NPP/JPSS) provides a CERES-like record from polar orbit to maintain time series. Some research satellites also contribute to the record. Geostationary Earth Radiation Budget instrument data useful for process studies, providing high time resolution but no continuity. The Total Solar Irradiance and Spectral Solar Irradiance mission maintains continuity with the Solar Radiation and Climate Experiment for total and spectral solar irradiance.
For temperature, wind speed and direction and water vapour, the WWW/GOS radiosonde network
provides the backbone of the in situ global observing system for climate. Some limitations in the
performance of the network occur because observations are not always taken owing to a lack of
resources. The data are unevenly distributed over the globe with relatively high-density coverage

GCOS 2016 Implementation Plan
- 82 -
over much of the northern hemisphere, but with much poorer coverage over the tropics and the
southern hemisphere. It is also highly desirable to have observations twice per day as this allows
radiation biases to be partly assessed. The move to BUFR format for radiosondes has been rather
patchy but is still underway and could lead potentially to identifying gaps or inconsistent pairs of
TAC/BUFR reports in the records in the same way as for the SYNOP data described in the previous
section.
The GCOS Steering Committee has designated a subset of the WWW/GOS radiosonde network as the
baseline GUAN. GUAN currently consists of some 170 radiosonde stations fairly evenly distributed
over the globe. The AOPC works with WMO CBS, WMO RAs and NMHSs to implement a programme
for the sustained operation of GUAN, together with its associated infrastructure. For some individual
stations, technical cooperation is necessary from other nations or agencies and/or GCM, to equip the
stations, provide training of operators and, in some instances, to support continuing operations by
Parties in need (e.g. provision of expendables). Prior to its 2014 meeting in Ispra, Italy, AOPC
undertook an in-depth review of GUAN, informed by expert input and a submission arising from
GRUAN. This meeting foresaw a modified GUAN remit to ensure relevance and the outcomes
needed to be implemented.
Action A13: Implement vision for future of GCOS Upper-Air Network operation
The bias between GUAN stations is not well documented. This is a problem for the interpretation of
GUAN and needs more research. The GUAN guidelines state that sites shall attain 30 hPa and should
attain 10 hPa, yet only one third of stations on average do so regularly, as shown in Figure 7. The
benefit of attaining these criteria needs to be demonstrated in a quantified manner to assure that
sites meet these requirements. If insufficient potential benefits accrue, consideration should be
given to relaxing these criteria. Many sites are launching once daily and remote sites are under
threat. The value of these observations needs to be robustly demonstrated. The value of regularly
attaining set heights, regular ascents or remote observations can be demonstrated by NWP and
reanalysis centres.
54
GCOS-182: http://www.wmo.int/pages/prog/gcos/Publications/gcos-182.pdf
Action Show demonstrable steps towards implementing the vision articulated in the GCOS Networks Meeting in 2014
54 relating to the future of GUAN operation
Benefit Improved data quality, better integrated with GRUAN and more closely aligned with WIGOS framework
Who Task team of AOPC with GCOS Secretariat in collaboration with relevant WMO commissions and WIGOS
Time frame 2019 for adoption at Nineteenth World Meteorological Congress
Performance indicator
Annual reporting in progress at AOPC of task team
Annual cost US$ 100 000–1 million

GCOS 2016 Implementation Plan
- 83 -
Figure 7. GCOS Upper-Air Network stations: number of radiosondes reaching 50 hPa and 10 hPa
Action A14: Evaluation of benefits for the GCOS Upper-Air Network
Outstanding issues concerning the quality of operational radiosonde measurements for climate
monitoring and change-detection purposes have led to the establishment of the GCOS Reference
Upper-air Network, a global network of eventually 30-40 sites that, to the extent possible, builds on
existing observational networks and capabilities. To date, there are 25 sites of which eight have
undergone a rigorous certification procedure. GRUAN measurements are of reference quality55 and
provide long-term, high-quality CDRs from the surface, through the troposphere and into the
stratosphere. These data are of sufficient quality to reliably determine trends in the upper-air
climate, constrain and calibrate data from more spatially comprehensive observing systems
(including satellites and current radiosonde networks) and fully characterize the properties of the
atmospheric column. GRUAN measurements are traceable to an SI unit or an internationally
accepted standard; comprehensive uncertainty analysis is included; all raw data are retained; the
complete measurement chain is documented in accessible literature; measurements and their
uncertainties are validated through inter-comparisons with complementary measurement systems;
and archived data include a complete metadata description.
55
Immler, F.J., J. Dykema, T. Gardiner, D.N. Whiteman, P.W. Thorne and H. Vömel, 2010: Reference quality upper-air
measurements: guidance for developing GRUAN data products. Atmos. Meas. Tech., 3, 1217–1231, 2010
www.atmos-meas-tech.net/3/1217/2010/ doi:10.5194/amt-3-1217-2010.
Action Quantify the benefits of aspects of GUAN operation including attaining 30 hPa or 10 hPa, twice-daily as opposed to daily ascents and the value of remote island GUAN sites
Benefit Better guidance to GUAN management, improved scientific rationale for decision-making
Who NWP and reanalysis centres
Time frame Completed by 2018
Performance indicator
Published analysis (in peer reviewed literature plus longer report)
Annual cost US$ 10 000–100 000
0
10
20
30
40
50
60
70
80
90
2002 2003 2004 2005 2006 2007 2008 2009 2010 2011 2012 2013 2014
Per
cen
tage
rea
chin
g th
at le
vel
Reaching 50 hPa
Reaching 10 hPa

GCOS 2016 Implementation Plan
- 84 -
GRUAN routinely takes measurements of upper-air ECVs using high-quality radiosondes, frost-point
hygrometers, ozonesondes, Global Positioning System (GPS) delay, lidars, microwave radiometers,
Fourier Transform Spectrometers and other relevant instrumentation. It is providing new
information on humidity in the upper troposphere and lower stratosphere needed to understand
better the role of water vapour in the radiation budget.
The Lead Centre for GRUAN has been established at the Lindenberg facility of the Deutscher
Wetterdienst and oversees day-to-day operations. The Working Group on GRUAN is sponsored by
AOPC with the participation of WIGOS and WMO technical commissions.
As shown in Figure 8, there is a clear need to increase the number of sites in the tropics, South
America and Africa.
Figure 8. Current status of Reference Upper-Air Network sites as of January 2016
Action A15: Implementation of Reference Upper-Air Network
Satellite radiances provide measurements of several global atmospheric upper-air variables,
temperature and water vapour in particular. They can, however, be subject to biases from
uncertainties in the sensor calibration and data pre-processing (e.g. cloud removal). The CLimate
Absolute Radiance and Refractivity Observatory (CLARREO) has been proposed as a key component
of the future climate observing system providing an absolute calibration traceable to SI standards. A
related initiative is for a complementary Traceable Radiometry Underpinning Terrestrial- and Helio-
Action Continue implementation of GRUAN metrologically traceable observations, including operational requirements and data management, archiving and analysis and give priority to implementation of sites in the tropics, South America and Africa
Benefit Reference-quality measurements for other networks, in particular GUAN, process understanding and satellite cal/val.
Who Working Group on GRUAN, NMHSs and research agencies, in cooperation with AOPC, WMO CBS and the Lead Centre for GRUAN
Time frame Implementation largely completed by 2025
Performance indicator
Number of sites contributing reference-quality data streams for archival and analysis and number of data streams with metrological traceability and uncertainty characterization; better integration with WMO activities and inclusion in the WIGOS manual.
Annual cost US$ 10–30 million

GCOS 2016 Implementation Plan
- 85 -
Studies mission (TRUTHS) to cover the visible and near-infrared part of the spectrum. They would
underfly the satellites used for climate monitoring and serve as a tool for satellite intercalibration to
provide a climate benchmark radiance dataset. The WMO Global Space-based Intercalibration
System provides an operational context to a future CLARREO/TRUTHS mission, using stable reference
instruments in the infrared (and other) spectrum. One component of CLARREO/TRUTHS involves the
measurement of spectrally resolved thermal infrared and reflected solar radiation at high absolute
accuracy. Coupled with measurements from on-board GPS RO receivers, this will provide a long-term
benchmarking data record for the detection, projection and attribution of changes in the climate
system. It will also provide a source of absolute calibration for a wide range of visible and infrared
Earth observing sensors, increasing their value for climate monitoring. The second component of
CLARREO/TRUTHS involves ensuring the continuity of measurements of incident solar irradiance and
Earth radiation budget data which is specifically addressed in A27 below.
Only slow progress has been made on the implementation of CLARREO and TRUTHS, although studies
continue and a CLARREO pathfinder for the reflected solar spectrometer will be mounted on the
international space station with launch planned for 2020. Partial mitigation of this situation is
emerging from the demonstrated stability of data provided by the satellite hyperspectral IR sounders
and GNSS RO and from the establishment of GRUAN.
Action A16: Implementation of satellite calibration missions
The full implementation and operation of the WWW/GOS radiosonde network in compliance with
the GCMPs is a desired long-term goal for climate monitoring. The AOPC works with the WMO CBS
and the RAs to ensure fuller implementation of the WWW/GOS radiosonde network in compliance
with GCMPs, together with improved reporting. The value of the observations would be enhanced
by completing the transition from the current (TEMP) coding standard to the more comprehensive
(BUFR) standard, which enables reporting of actual position and time of each measurement made
during an ascent.
Progress on the provision of data in full compliance with the BUFR coding standard has been slow
and, where action has been taken, implementation has fallen short of what is required. WMO CBS
agreed in 2010 that November 2014 was the deadline beyond which radiosonde data should be
distributed only in BUFR format, with continued exchange of data in alphanumeric code only by
bilateral agreement. By November 2014, however, only a small number of NMHSs were providing
full BUFR data in the intended way, reporting ascents at high vertical resolution with the actual time
and position specified for each observational element. Many NMHSs were sending messages in
BUFR format but with essentially the same information content as in the former TEMP alphanumeric
code, which brought no real advancement. Progress since then has been gradual. In August 2015,
only about 10% of radiosonde stations, mostly in Europe, were providing high-resolution BUFR
reports. A further 10% or so were providing native BUFR reports, but at low resolution. Around 50%
Action Implement a sustained satellite climate calibration mission or missions
Benefit Improved quality of satellite radiance data for climate monitoring
Who Space agencies
Time frame Ongoing
Performance indicator
Commitment to implement by the next status report in 2020; proof-of-concept proven on ISS pathfinder
Annual cost US$ 100–300 million

GCOS 2016 Implementation Plan
- 86 -
of stations were providing BUFR-reformatted TEMP reports. Work is continuing in order to resolve
problems in some of these BUFR reports. In the meantime, many but not all stations continue to
report their data in TEMP, as well as BUFR code. Care will be needed when building an archival
radiosonde data record for the transition period. This applies also to other types of data for which
there have been issues during the change to BUFR encoding.
The provision of metadata concerning instrumentation and data reduction and processing
procedures is crucial to utilizing radiosonde data in climate applications. The historical record of
radiosonde observations has innumerable problems relating to lack of intercomparison information
between types of sondes and sensor and exposure differences. Methods have been developed to
enable radiosonde metadata to be combined with proxy metadata derived from comparison with
reanalyses. The metadata may then be applied to homogenize radiosonde records for use in trend
estimation and future reanalyses. Special efforts are required to obtain radiosonde metadata
records and to include them as important elements in the future observing strategy.
The move to BUFR encoding of radiosonde data provides operators with the opportunity to report
much more metadata with the ascent itself, which if implemented fully, should substantially reduce
the need for separate metadata supply in the future. In addition, a task team established by the
WMO Inter-Commission Coordination Group on WIGOS has developed the WIGOS Core Metadata
Standard recently approved by Seventeenth World Meteorological Congress.
Most radiosonde data are presented as converted profile data using manufacturer-provided black-
box processing software. Substantial data processing is carried out by the black-box process to
convert the raw digital data counts received at the site into this profile information. The raw digital
counts are rarely retained, which means that the data cannot be reprocessed if new improved
instrument understanding requires it. Manufacturers and sites should work to retain and transmit
the raw data, including the raw digital counts, to enable future reprocessing, which is scientifically
substantively preferential to post hoc statistically based analysis of the processed profiles. However,
this point also relates to any and all observations that require substantive processing to convert from
the received measurement to the estimate of the ECV measurand, which applies much more broadly
than radiosondes or even the upper-air domain.
Action A17: Retain original measured values for radiosonde data
Additional data sources, such as vertically pointing radar systems (wind profilers) and data from
aircraft (both at flight level and on ascent and descent), will contribute to climate applications,
particularly for atmospheric reanalysis. Lidar measurements of wind profile from space could form
another important long-term data source; the ADM/Aeolus global vertical wind profiling satellite
Action For radiosonde data and any other data that require substantive processing from the original measurement (e.g. digital counts) to the final estimate of the measurand (e.g. T and q profiles through the lower stratosphere); the original measured values should be retained to allow subsequent reprocessing.
Benefit Possibility to reprocess data as required, improved data provenance
Who HMEI (manufacturers), NMHSs, archival centres.
Time frame Ongoing.
Performance indicator
Original measurement raw data and metadata available at recognized repositories
Annual cost US$ 100 000–1 million

GCOS 2016 Implementation Plan
- 87 -
mission should demonstrate the feasibility and usefulness of this type of measurement within the
next five years.
Reprocessed microwave radiance data from historical satellites (e.g. Microwave Sounding Unit,
AMSU, Advanced Technology Microwave Sounder and Special Sensor Microwave Image (SSM/I) are
important contributions to the historical climate record and need to be continued into the future to
sustain a long-term record. Operational meteorological satellites are expected to continue to
provide such data for the coming decades. The high-resolution infrared sounders (e.g. IASI, AIRS,
CrIS) improve the vertical resolution of satellite-derived temperature and water vapour profiles,
which significantly improves monitoring of the upper atmosphere.
Action A18: Hyperspectral radiances reprocessing
Action A19: Reprocessing of atmospheric motion vectors
3.2.1 Proposed changes to the upper atmosphere ECVs
A number of changes to the atmospheric ECVs are incorporated in this plan.
To take into account precipitation at all levels in the atmosphere, which is not easily covered within
the current ECV framework, it is proposed that the Cloud ECV should be expanded to include
hydrometeors which are being measured by satellites and radar networks and already being used for
process studies, but not yet long-term monitoring. Hydrometeors relate to processes within the
atmosphere, whereas precipitation is only that portion of hydrometeors deposited at the surface. It
is appropriate therefore to consider the upper-air component of “precipitation” as hydrometeors
which are part of cloud processes.
Measurements of lightning are currently made with surface-based networks of varying quality but
satellite measurements will soon provide a near-global view of lightning. It is proposed to add
lightning as a new atmospheric upper-air ECV and encourage space agencies and surface-based
networks to archive the data in a common format for future climate research. Lightning is a high-
Action Undertake a programme of consistent reprocessing of the satellite hyperspectral sounder radiances
Benefit Consistent time series of hyperspectral radiances for monitoring and reanalyses, improved CDRs computed from the FCDRs
Who Space agencies
Time frame Ongoing
Performance indicator
Reprocessed FCDRs available for hyperspectral sounders
Annual cost US$ 100 000–1 million
Action Continue reprocessing of AMVs derived from geostationary satellite imagery in a coordinated manner across agencies
Benefit Consistent time series of AMVs for monitoring and reanalyses, improved CDRs computed from the FCDRs
Who Space agencies
Time frame Ongoing
Performance indicator
Reprocessed FCDRs available for upper-air winds
Annual cost US$ 100 000–1 million

GCOS 2016 Implementation Plan
- 88 -
impact variable in its own right, causing many deaths a year, and may point to important changes
and variability in climatically important processes, such as the prevalence of deep convective activity.
For radiation, the incident solar spectral irradiance observations, as well as the broadband directional
measurements of reflected solar and outgoing longwave radiation (OLR) are now part of the Earth
radiation budget ECV to meet the needs of seasonal forecasting. There is also a need to measure the
profile characteristics – rather than solely top of atmosphere – for improved process understanding.
In the first instance, it is foreseen that this profile information will be measured at GRUAN sites.
3.2.2 Specific issues – Upper-air ECVs
ECV – Upper-air temperature
Radiosonde temperatures form an important climate data record, albeit requiring careful
homogenization to account for instrumental and real-time processing changes. Aircraft
temperatures are also prone to biases for which adjustments are being developed and deployed by
reanalysis centres. GRUAN is beginning to provide metrologically traceable profiles for a number of
radiosonde products and further advances are foreseen over the period of this Implementation Plan,
including data streams from lidars and upward-viewing radiometers.
The satellite sounding data play an important role, together with radiosonde and aircraft data in
reanalyses of temperature and other upper-air variables. For climate applications, the satellite
systems must be operated in adherence with the GCMPs. Work is in progress to construct FCDRs
from the MW sounder radiances enabling improved CDRs to be produced using them. Temperature
profiles derived from MW limb-sounding (MLS) also fulfil this role but these observations will not
continue in the future. Other individual research missions and ground-based remote-sensing provide
independent data for evaluating reanalyses, as well as for model evaluation. Several older satellite-
borne instruments in the 1970s (NOAA’s Interface Region Imaging Spectrograph,
Pressure Modulator Radiometer, Scanning Microwave Spectrometer and Special Sensor
Microwave/Temperature profiler) have the potential for recovery to provide input to reanalysis,
which also benefits from the recovery of early in situ upper-air data discussed in section 2.4.2.
Measurements of GPS RO provide high vertical resolution profiles of atmospheric refractive index
that relate directly to temperatures above about 5 km altitude. They provide benchmark
observations that can be used to “calibrate” the other types of temperature measurement. Climate
applications are being developed by providing consistent time series of bending angles and
refractivity profiles. More satellites are being launched with GNSS-RO capability and the introduction
of other GNSS systems (Galileo, BeiDou) offers opportunities for further improvement in coverage of
RO data, although some of the data may be available only on a commercial basis. It is GCOS’s aim
that customers’ access to data is not diminished and remains as it is currently.
ECV – Upper-air wind speed and direction
The WWW/GOS radiosonde network is the backbone of global upper-air wind observations.
Observations from commercial aircraft are also becoming more plentiful. For aircraft observations
there is significant expansion potential over Africa and South America, given the sparsity of other
conventional data (such as radiosondes). Establishing and maintaining an aircraft measurement

GCOS 2016 Implementation Plan
- 89 -
programme involving African and other commercial carriers would have substantive scientific
benefits for climate monitoring.
Action A20: Increase the coverage of aircraft observations
Another source of wind information are the AMVs obtained by tracking cloud elements between
successive satellite images and assigning their height by measuring their temperature to provide
“satellite winds”. Multi-angular instruments can add value to such estimates, since height
information is also available from the parallax in the data and does not involve assumptions about
temperature profiles. Three dimensional winds are also obtained over land areas using modern
generation doppler rain radars. These data are part of the WWW/GOS designed for weather
forecasting and will have application for climate through their incorporation in reanalysis.
The ADM/Aeolus mission has been developed to pioneer wind-lidar measurement from space. If the
data from this mission demonstrate significant value for climate purposes, careful and prompt
consideration will need to be given to the implementation of follow-on missions.
Action A21: Implementation of space-based wind-profiling system
ECV – Upper-air water vapour
Water vapour is the strongest of the greenhouse gases. In the upper troposphere and lower
stratosphere, it is a key indicator of convection and radiative forcing. In the stratosphere, water
vapour is a source gas for OH which is chemically active in the ozone budget and in the troposphere
it is important for the conversion of methane. There is recent evidence that the Brewer Dobson
circulation is changing in the tropics due to climate change, which alters the balance of water vapour
in the upper troposphere (UT) and lower stratosphere (LS) markedly and has a strong feedback on
climate change.
Broad-scale information on tropospheric water vapour is routinely provided by operational passive
microwave, infrared and UV/VIS satellite instruments. The capability to observe continuous total-
column, water-vapour data from ground-based GPS receivers is now well-established although the
network of GPS receivers should be extended across all land areas to provide global coverage and the
Action Further expand the coverage provided by AMDAR, especially over poorly observed regions such as Africa and South America
Benefit Improved coverage of upper-air wind for monitoring and reanalysis
Who NMHSs, WIGOS, RAs I and III.
Time frame Ongoing
Performance indicator
Data available in recognized archives
Annual cost US$ 1–10 million
Action Assuming the success of ADM/Aeolus, implement an operational space-based wind profiling system with global coverage
Benefit Improved depiction of upper-air windfields: improved reanalyses, 3D aerosol measurements as a byproduct
Who Space agencies
Time frame Implement once ADM/Aeolus concept is proven to provide benefit
Performance indicator
Commitment to launch ADM follow-on mission
Annual cost US$ 100–300 million

GCOS 2016 Implementation Plan
- 90 -
data should be more freely exchanged for climate purposes. A repository of CDRs from ground-
based GPS data records needs to be identified (e.g. International GNSS Service). Further work needs
to be undertaken to establish climate quality and time series of data from the vertical profile
information provided by infrared nadir sounders such as IASI and CrIS.
Accurate in situ measurements of water vapour in the upper troposphere and in the lower
stratosphere are sparse; trends and variability in this region are not well established. A long-term
sustainable strategy for accurate global measurements of water vapour in the UT/LS down to molar
mixing ratios of parts per million (ppm; 10−6) is required. Such a strategy includes the GRUAN
programme for balloon-borne instruments that are carefully intercalibrated and metrologically
characterized along with lidar, GNSS-Total Precipitable Water (TPW) and other remotely sensed
measures, as well as long-term aircraft monitoring programmes. State-of-the-art balloon-borne
sounders include frostpoint hygrometers and Fluorescent Advanced Stratospheric Hygrometer for
Balloon (FLASH-B). The frostpoint hygrometers also carry a coolant which is a minor but highly active
and long-lived GHG. These are reference-grade instruments that are very expensive and require
significant expertise to operate. To enable greater measurements of the UT/LS region, water vapour
manufacturers and national measurement institutes are strongly encouraged to develop cheaper,
easier-to-use instrumentation capable of measuring water vapour across the four orders of
magnitude seen in the profile.
Global high vertical resolution measurements of water vapour in the UT/LS by limb observations are
also essential and limb sounding yields invaluable information on ozone and other chemical
composition variables. Continuation of existing missions is highly desirable, as well as new missions
offering high vertical resolution. Action A30 calls for the required continuity of these measurements.
Divergence has been noted between MLS measurements and a range of frostpoint hygrometer-
based long-term series starting around 2009 with MLS trending to lower values than supported by
the balloon-based records. This points to the need to rely upon a mix of satellite and non-satellite
measurements on a sustained basis to ensure the continuity of the data record and to recognize and
diagnose any instrument biases.
Action A22: Develop a repository of water vapour climate data records
Action Develop and populate a globally recognized repository of GNSS zenith total delay and total column water data and metadata
Benefit Reanalyses, water vapour CDRs
Who AOPC to identify the appropriate responsible body
Time frame By 2018
Performance indicator
Number of sites providing historical data to the repository
Annual cost US$ 100 000–1 million

GCOS 2016 Implementation Plan
- 91 -
Action A23: Measure of water vapour in the upper troposphere/lower
ECV – Cloud properties and hydrometeors
Cloud feedback is considered to be one of the most uncertain aspects of future climate projections
and is responsible for much of the wide range of estimates of climate sensitivity from models.
Long-term datasets from VIS/IR imagers in geostationary and polar orbit should be reprocessed to
obtain consistent records relating to cloud parameters. High-resolution infrared and microwave
soundings can also contribute to better understanding of cloud properties with long length of
records. Actions should be taken to improve the sampling of these cloud products by using the
newer, emerging satellite systems. Because of the importance of the observation of cloud,
continued research on improving observational capabilities is required.
The effect on cloud formation and cloud lifetime of aerosols is one of the largest uncertainties in
climate modelling. Detailed measurements of cloud microphysics in combination with aerosol
measurements are needed to improve current estimates. Field campaigns jointly measuring in situ
cloud condensation nuclei and aerosol size and distribution are needed to study the atmospheric
processes of the indirect aerosol effect.
An extended role of using radar data for GCOS, given its potential to substantially increase the
geotemporal resolution of the observation of land-surface precipitation and upper-air precipitating
water, should be considered. Motivation for this lies in the better understanding of the global
precipitation trends in the context of climate change and in the increasingly improved geotemporal
resolution of weather radars compared to in situ and satellite systems. This could provide the
potential for heavy precipitation risk climatologies at a resolution that matters for the public.
Challenges associated with a global scale deployment of radar technology are substantial and
encompass, inter alia, harmonization of retrieval and calibration methods, data exchange, global
coverage, quality control and quantitative precipitation estimation methods. Initial steps to raise
awareness with all countries of the climatological potential and value of radar data with the goal to
motivate and facilitate proper and standardized storage of local radar data, should be made so it can
be re-processed even many years later, when issues on international data exchange are resolved. Up
to 15 years of reprocessed radar data are already available at the national level within Europe,
suitable for statistics on extreme precipitation events. NOAA’s NEXRAD archive constitutes a further
substantial capability and,together with capabilities in China and Japan, the time is right to initiate a
global activity.
Action Promote the development of more economical and environmentally friendly instrumentation for measuring accurate in situ water-vapour concentrations in the UT/LS
Benefit Improved UT/LS water vapour characterization, water-vapour CDRs
Who NMHSs, National measurements institutes, HMEI and GRUAN
Time frame Ongoing
Performance indicator
Number of sites providing higher-quality data to archives
Annual cost US$ 10–30 million

GCOS 2016 Implementation Plan
- 92 -
Action A24: Implementation of archive for radar reflectivities Action To implement a global historical archive of radar reflectivities (or products of reflectivities if
reflectivities are not available) and associated metadata in a commonly agreed format
Benefit Better validation of reanalyses, improved hydrological cycle understanding
Who NMHSs, data centres, WIGOS
Time frame Ongoing
Performance indicator
Data available in recognized archive, agreed data policy
Annual cost US$ 1–10 million
The current satellite missions to measure global precipitation provide snapshots of the precipitation
field several times a day but there is no long-term commitment to the provision of future satellite
precipitation missions. The advent of small satellites may allow better temporal coverage of these
measurements at reasonable cost.
Action A25: Continuity of global satellite precipitation products Action Ensure continuity of global satellite precipitation products similar to GPM
Benefit Precipitation estimates over oceans for global assessment of water-cycle elements and their trends
Who Space agencies
Time frame Ongoing
Performance indicator
Long-term homogeneous satellite-based global precipitation products
Annual cost US$ 30–100 million
Since each of the complementary techniques used to measure precipitation are insufficient to meet
ECV requirements on their own, a concerted effort to develop methods of blending raingauge, radar
and satellite precipitation in reanalysis and in specific precipitation datasets is needed.
Action A26: Development of methodology for consolidated precipitation estimates Action Develop methods of blending raingauge, radar and satellite precipitation
Benefit Better precipitation estimates
Who WMO technical commissions.
Time frame By 2020
Performance indicator
Availability of consolidated precipitation estimates
Annual cost US$ 10 000–100 000
ECV – Earth radiation budget (including profile)
The top-of-atmosphere (TOA) Earth radiation budget (ERB) is characterized by the amount and
distribution of the incoming solar radiation absorbed by the Earth and the outgoing longwave
radiation (OLR) emitted by the Earth. At a global scale, this difference provides a measure of the net
climate forcing acting on the Earth. Understanding how the Earth’s energy imbalance varies helps in
the interpretation of recent changes in global surface temperature and in constraining likely future
rates of warming. TOA radiation budget observations also provide a critical constraint on cloud
feedback, which is a primary uncertainty in determining climate sensitivity. Regional differences
between absorbed solar radiation and OLR drives the atmospheric and oceanic circulations. The TOA
ERB can only be measured from space, and continuity of observations is an essential requirement.
The satellite measurements should include solar spectral irradiance observations, as well as the
broadband directional measurements of reflected solar and OLR as this has been shown to be useful

GCOS 2016 Implementation Plan
- 93 -
for seasonal forecasting and interactions with surface vegetation. At least one dedicated satellite
ERB mission should be operating at any one time without interruption and operational plans should
provide for one year of overlap between successive ERB missions. This should be a continuing
priority for CEOS and CGMS in their planning process.
The sunspot number is also an interesting observation that correlates well with satellite total solar
irradiance as shown in Figure 29 of the GCOS Status Report (GCOS-195). Measurements go back to
the 17th century, so carefully analysis of this time series and continued monitoring of it would be
valuable for climate studies.
Action A27: Dedicated satellite Earth Radiation Budget mission Action Ensure sustained incident total and spectral solar irradiances and ERB observations, with at least one
dedicated satellite instrument operating at any one time
Benefit Seasonal forecasting, reanalyses, model validation.
Who Space agencies
Time frame Ongoing
Performance indicator
Long-term data availability at archives
Annual cost US$ 30–100 million
It has been demonstrated that radiative flux profiles can be measured with specially equipped
radiosondes from the Earth's surface to 35 km into the stratosphere. Their changes with
temperature and water vapour enable direct measurement of radiative forcing through the
atmosphere to be made. They allow important investigations of clouds and other atmospheric
constituents and their effects on the atmospheric radiative transfer and greatly facilitate improved
understanding of radiative processes.
Action A28: In situ profile and radiation
ECV – Lightning
Lightning has been added to the GCOS atmospheric ECV list in this Plan as, in recent years,
measurements of the flashes have become more extensive and new satellite instruments are about
to be launched which will further enhance measurement coverage. Lightning can be used as a proxy
for monitoring severe convection and hence precipitation, improving estimates of severe storm
intensity and ultimately these data could be assimilated in NWP and reanalyses to improve the
representation of severe storms. NWP models are now able to represent lightning as a forecast
variable which is used in aviation applications. Another direct application is related to the production
of wildfires. The IPCC Fifth Assessment Report states that there is low confidence in observed trends
in small-scale weather phenomena, such as hail and thunderstorms, because of historical data
inhomogeneities and inadequacies in monitoring systems. There is scope to increase the confidence
Action To understand the vertical profile of radiation requires development and deployment of technologies to measure in-situ profiles.
Benefit Understanding of 3D radiation field, model validation, better understanding of radiosondes
Who NMHSs, National measurements institutes, HMEI
Time-frame Ongoing
Performance indicator
Data availability in NMHSs archives
Annual cost US$ 1–10 million

GCOS 2016 Implementation Plan
- 94 -
in trends of local severe storms through reprocessing of the existing ground-based and satellite
lightning datasets and analysis of the impending new satellite monitoring data about to be launched.
The requirements for climate monitoring of lightning measurements need to be defined and a first
attempt is made in Annex A. The exploitation of these data for climate monitoring applications
remains to be demonstrated but it is now timely to produce CDRs of lightning measurements to
allow research into their application.
The measurement of lightning flashes in recent years has developed from research-based systems to
a more operational set of ground-based networks based on the detection of VHF radiation sources.
The TRMM satellite ha a 17-year data record of lightning from the Lightning Imaging Sensor from
1998 to 2015 but the data are restricted to latitudes below 35° and with coverage only a few times a
day. Mid-latitude severe storm trends have therefore not been monitored from space and there are
long time gaps over the tropics. In the near future, data will be available from several geostationary
platforms which will provide a coverage up to 52° latitude and be able to detect all significant events
with a frequent repeat cycle. The coverage of lightning measurements over the poles from satellites
remains elusive, however.
Action A29: Lightning
3.3 Atmospheric domain – composition
A number of atmospheric constituents have an important role in climate forcing and feedbacks. The
ECV list includes water vapour, CH4, CO2, O3 and aerosols. Observations of precursors of ozone and
aerosols are also included in this plan to improve the ability to detect and attribute changes in ozone
and aerosol in both the troposphere and lower stratosphere. Some precursors are also important
variables for air quality and may have a climate impact in their own right. For example, aerosol not
only represents a major source of uncertainty in climate change forcing but also constitutes a major
risk factor for human health. Uncertainties associated with aerosol radiative forcing estimates are
among the leading causes of discrepancies in climate simulations and the large uncertainties in the
total anthropogenic effective radiative forcing (see IPCC, 2013). Water vapour was considered in the
previous section. The other main groupings of atmospheric composition ECVs are listed in Table 10,
together with the observing networks and satellites involved in global measurements. This was
originally based on the detailed assessment of global atmospheric chemistry observing systems in the
IGOS Theme Report on Integrated Global Atmospheric Chemistry Observations, which outlines the
data requirements based on four issues: climate, air quality, ozone depletion, and
oxidizing efficiency. The requirements analysis is now being updated and integrated in the
OSCAR/Requirements database of the WMO RRR.
Action To define the requirement for lightning measurements, including data exchange, for climate monitoring and to encourage space agencies and operators of ground-based systems to provide global coverage and reprocessing of existing datasets
Benefit Ability to monitor trends in severe storms
Who GCOS AOPC and space agencies
Time frame Requirements to be defined by 2017
Performance indicator
Update to Annex A for lightning and commitments by space agencies to include lightning imagers on all geostationary platforms. Reprocessed satellite datasets of lightning produced.
Annual cost US$ 10–30 million
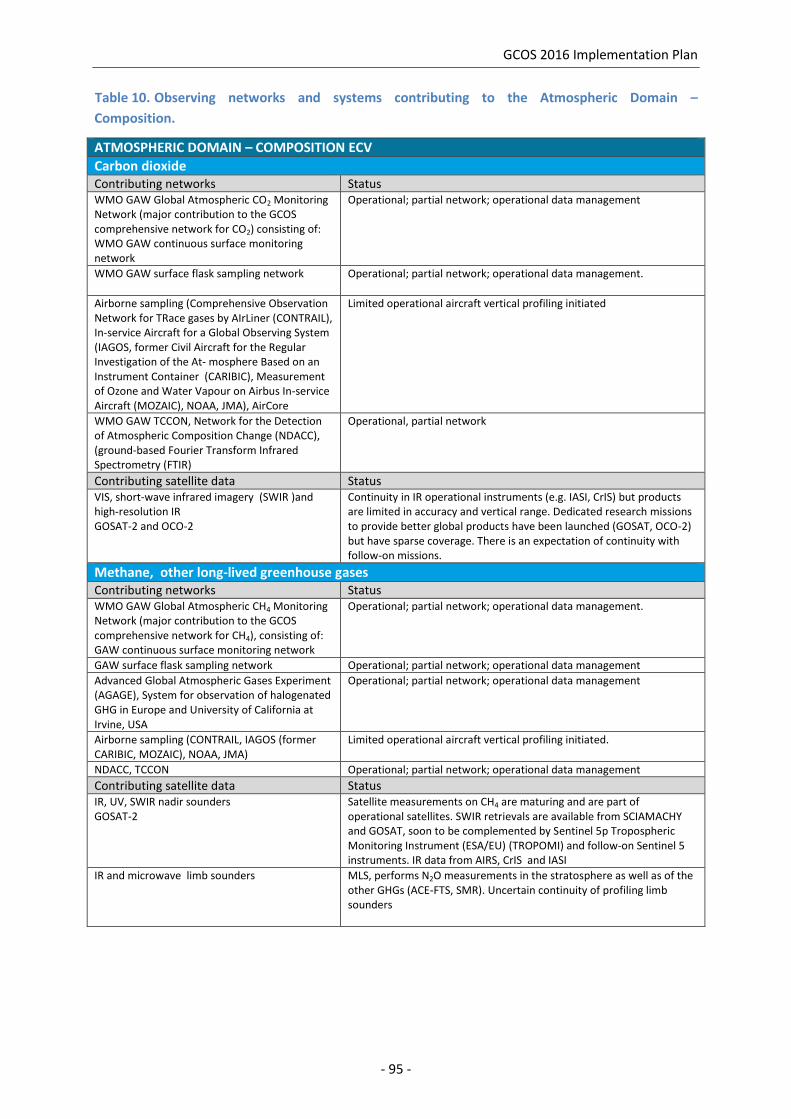
GCOS 2016 Implementation Plan
- 95 -
Table 10. Observing networks and systems contributing to the Atmospheric Domain –
Composition.
ATMOSPHERIC DOMAIN – COMPOSITION ECV
Carbon dioxide Contributing networks Status WMO GAW Global Atmospheric CO2 Monitoring Network (major contribution to the GCOS comprehensive network for CO2) consisting of: WMO GAW continuous surface monitoring network
Operational; partial network; operational data management
WMO GAW surface flask sampling network Operational; partial network; operational data management.
Airborne sampling (Comprehensive Observation Network for TRace gases by AIrLiner (CONTRAIL), In-service Aircraft for a Global Observing System (IAGOS, former Civil Aircraft for the Regular Investigation of the At- mosphere Based on an Instrument Container (CARIBIC), Measurement of Ozone and Water Vapour on Airbus In-service Aircraft (MOZAIC), NOAA, JMA), AirCore
Limited operational aircraft vertical profiling initiated
WMO GAW TCCON, Network for the Detection of Atmospheric Composition Change (NDACC), (ground-based Fourier Transform Infrared Spectrometry (FTIR)
Operational, partial network
Contributing satellite data Status VIS, short-wave infrared imagery (SWIR )and high-resolution IR GOSAT-2 and OCO-2
Continuity in IR operational instruments (e.g. IASI, CrIS) but products are limited in accuracy and vertical range. Dedicated research missions to provide better global products have been launched (GOSAT, OCO-2) but have sparse coverage. There is an expectation of continuity with follow-on missions.
Methane, other long-lived greenhouse gases Contributing networks Status WMO GAW Global Atmospheric CH4 Monitoring Network (major contribution to the GCOS comprehensive network for CH4), consisting of: GAW continuous surface monitoring network
Operational; partial network; operational data management.
GAW surface flask sampling network Operational; partial network; operational data management
Advanced Global Atmospheric Gases Experiment (AGAGE), System for observation of halogenated GHG in Europe and University of California at Irvine, USA
Operational; partial network; operational data management
Airborne sampling (CONTRAIL, IAGOS (former CARIBIC, MOZAIC), NOAA, JMA)
Limited operational aircraft vertical profiling initiated.
NDACC, TCCON Operational; partial network; operational data management
Contributing satellite data Status IR, UV, SWIR nadir sounders GOSAT-2
Satellite measurements on CH4 are maturing and are part of operational satellites. SWIR retrievals are available from SCIAMACHY and GOSAT, soon to be complemented by Sentinel 5p Tropospheric Monitoring Instrument (ESA/EU) (TROPOMI) and follow-on Sentinel 5 instruments. IR data from AIRS, CrIS and IASI
IR and microwave limb sounders MLS, performs N2O measurements in the stratosphere as well as of the other GHGs (ACE-FTS, SMR). Uncertain continuity of profiling limb sounders

GCOS 2016 Implementation Plan
- 96 -
Ozone Contributing networks Status WMO GAW GCOS Global Baseline Profile Ozone Network (GAW ozonesonde network, including NASA Southern Hemisphere Additional Ozonesondes (SHADOZ) and NDACC)
Operational balloonsonde network but numbers have reduced significantly over last 5 years.
WMO GAW GCOS Global Baseline Total Ozone Network (GAW column ozone network (filter, Dobson and Brewer stations))
Mature operational ground-based total column network but numbers reducing in last 5 years.
NDACC Operational; partial network; operational data management
Contributing satellite data Status
IR and UV nadir sounders Operational continuity for column ozone
IR and MW limb sounders Future research high vertical resolution profiling instruments are under consideration.
Aerosol properties Contributing networks Status WMO GAW aerosol network and contributing networks (GAW Precision Filter Radiometer (PFR), SKYNET)
Operational; global coordination ongoing
AERONET Operational
GALION Operational; global coordination ongoing
BSRN Operational; improved coverage required.
Contributing satellite data Status
Solar occultation VIS/IR imagers Lidar profiling UV nadir Polarimetry Multi-angular viewing Limb scattering
Planned operational continuity for column products using EU/ESA Sentinel-3 (Sea and Land Surface Temperature Radiometer (SLSTR) and Ocean and Land Colour Imager (OLCI) and NOAA’s Suomi National Polar-orbiting Partnership (SUOMI/NPP). Operational missions are planned which will provide information on aerosol type and aerosol size (e.g. multiviewing, multichannel, multipolarization imager dedicated to aerosol measurement (3MI)-global, Multi-Angle Imager for Aerosols (MAIA)-targeted). Research missions for profiling tropospheric aerosols; some aerosol layer-height information can be obtained from the current and planned operational satellites using the O2 A-band. No plans for continuity of stratospheric profiling, with the exception of NOAA’s Stratospheric Aerosol and Gas Experiment (SAGE-III) on the International Space Station (ISS).
Aerosol and ozone precursors Contributing networks Status WMO GAW observing network for CO (continuous and flasks measurements)
Operational; partial network; operational data management
WMO GAW network for reactive gases Currently in the stage of establishment, several stations worldwide
European Monitoring and Evaluation Programme (GAW contributing network)
Operational European network for monitoring primary pollutants
Research programmes using Multi-Axis Differential Optical Absorption Spectroscopy (MAXDOAS), Systeme d'Analyse par Observation Zenithale, FTIR and other techniques (for NO2)
Sparse, research-oriented; need to measure NH3 also
In situ network from environmental agencies Operational at national level
Aircraft (IAGOS, CO) Limited operational aircraft vertical profiling initiated.
NDACC Operational, partial network; operational data management.
Contributing satellite data Status UV/VIS/NIR/SWIR nadir sounders Precursors are measured currently by research satellites and
operational satellites in the future (e.g. IASI-NG and Sentinel 4 and 5) (i.e. NH3, NO2, SO2, HCHO, etc.)
Understanding the sources and sinks for CO2 and CH4 is crucial. One of the challenges is to
distinguish between natural and anthropogenic sources, for which accurate global measurements,
preferably with imaging capability at high spatial resolution, are required. To clearly separate fossil

GCOS 2016 Implementation Plan
- 97 -
fuel contributions from biospheric contributions, measurements of tracers such as 14CO2, 13CO2, CO,
and COS are needed in both process studies and long-term observations. While the atmospheric
burden of CO2 is increasing quite steadily by about 0.5% per year, the rise in methane concentration
levelled off during the last decade but is now increasing again. There are large uncertainties in the
budget of methane and observations combined with modelling are needed for better understanding
of the sources and sinks.
N2O is the third most important greenhouse gas, which originates from both natural and
anthropogenic sources including oceans (see section 3.3), soils, biomass, burning, fertilizer use and
various industrial processes. Atmospheric N2O has been increasing constantly at a growth rate over
the past 10 years of 0.87 ppb/year.
Halocarbons are potent GHGs and represent a potential long-term threat. Some of them
(chlorofluorocarbons (CFCs) and hydrochlorofluorocarbons (HCFCs)) are regulated by the Montreal
Protocol, since they are also ozone-depleting gases, but they might not be phased out before 2040
and may show increasing concentration before 2040. Others are very strong greenhouse gases but
do not deplete ozone and are therefore not governed by the Montreal Protocol. Concentrations of
some of them are increasing rapidly.
Projections of a changing climate have added a new dimension to the issue of the stratospheric
ozone layer and its recovery. Data and models have clearly demonstrated a linkage between
meteorology and ozone depletion. Consequently, understanding how climate change will affect
circulation and its concomitant influence on stratospheric ozone will impinge on future policy
decisions. Ozone-depleting chemicals and ozone itself provide positive forcing of the climate. The
reduction of ozone-depleting substances has not only helped the ozone layer but has also lessened
climate forcing. Because of the close interaction between climate and stratospheric processes there
is a continuing need to monitor vertically resolved atmospheric composition throughout the
troposphere and stratosphere. Being able to distinguish changes arising from a decrease in ozone-
depleting substances from those due to other sources of climate forcing is essential for attributions
and establishing mitigation policies.
Changes in tropospheric composition have an impact on air quality as well as climate change. Several
tropospheric trace gases and aerosols play key roles in both domains. Tropospheric ozone and
aerosols are both radiatively active and air pollutants. Other trace gases, such as NO2, SO2, CO, HCHO
and NH3, are not directly active radiatively but are precursors for tropospheric ozone and secondary
aerosols (i.e. aerosols that are formed in the atmosphere). Methane is a precursor for ozone in the
troposphere and lower stratosphere and a source of stratospheric water vapour, as well as being a
GHG. Precursors of tropospheric ozone also influence the hydroxyl radical concentration and thus
the oxidizing power of the atmosphere. Changes in hydroxide (OH) directly influence the lifetimes of
greenhouse gases such as CH4 and hydrochlorofluorocarbons (HCFCs). Observations of precursors
are needed to develop emission-based scenarios for radiative forcing (due to both anthropogenic
and natural sources) by tropospheric ozone and secondary aerosols.
The quality of estimates of anthropogenic emissions of the precursors vary according to location and
gas. Emission inventories are based on socioeconomic data (e.g. fuel use, animal numbers and
husbandry) and measurements of typical emissions. Timing of inventory data depends on user needs
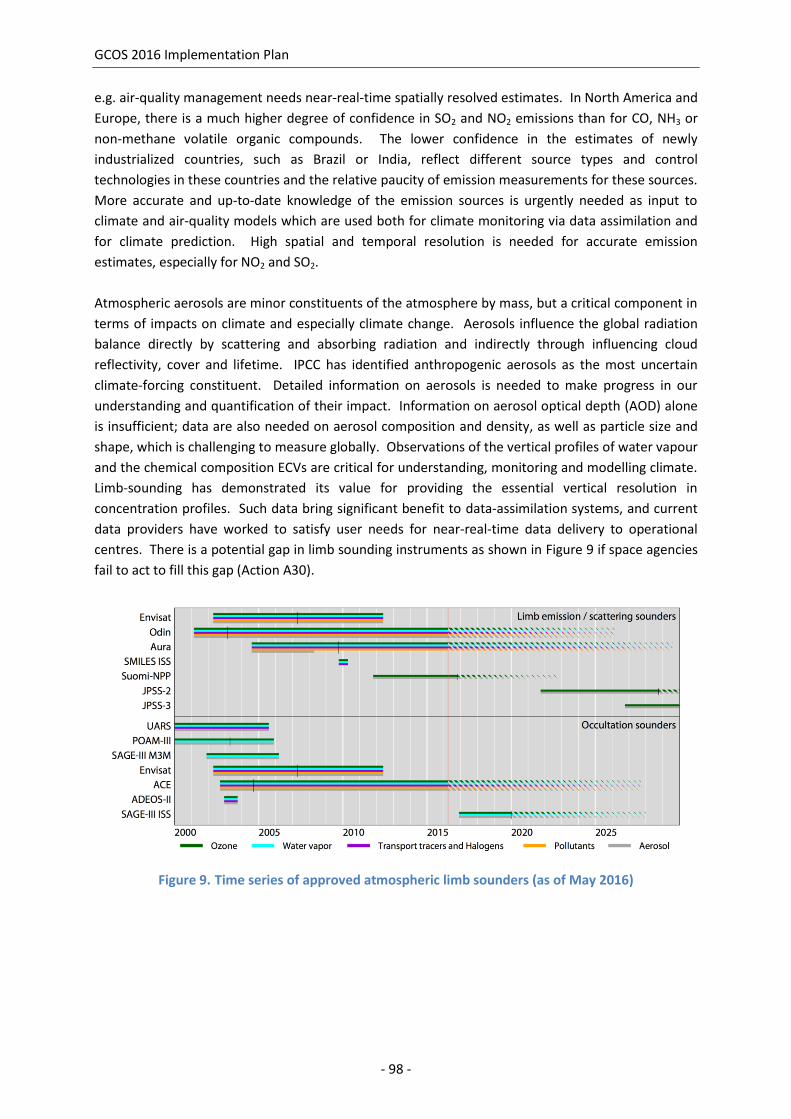
GCOS 2016 Implementation Plan
- 98 -
e.g. air-quality management needs near-real-time spatially resolved estimates. In North America and
Europe, there is a much higher degree of confidence in SO2 and NO2 emissions than for CO, NH3 or
non-methane volatile organic compounds. The lower confidence in the estimates of newly
industrialized countries, such as Brazil or India, reflect different source types and control
technologies in these countries and the relative paucity of emission measurements for these sources.
More accurate and up-to-date knowledge of the emission sources is urgently needed as input to
climate and air-quality models which are used both for climate monitoring via data assimilation and
for climate prediction. High spatial and temporal resolution is needed for accurate emission
estimates, especially for NO2 and SO2.
Atmospheric aerosols are minor constituents of the atmosphere by mass, but a critical component in
terms of impacts on climate and especially climate change. Aerosols influence the global radiation
balance directly by scattering and absorbing radiation and indirectly through influencing cloud
reflectivity, cover and lifetime. IPCC has identified anthropogenic aerosols as the most uncertain
climate-forcing constituent. Detailed information on aerosols is needed to make progress in our
understanding and quantification of their impact. Information on aerosol optical depth (AOD) alone
is insufficient; data are also needed on aerosol composition and density, as well as particle size and
shape, which is challenging to measure globally. Observations of the vertical profiles of water vapour
and the chemical composition ECVs are critical for understanding, monitoring and modelling climate.
Limb-sounding has demonstrated its value for providing the essential vertical resolution in
concentration profiles. Such data bring significant benefit to data-assimilation systems, and current
data providers have worked to satisfy user needs for near-real-time data delivery to operational
centres. There is a potential gap in limb sounding instruments as shown in Figure 9 if space agencies
fail to act to fill this gap (Action A30).
Figure 9. Time series of approved atmospheric limb sounders (as of May 2016)

GCOS 2016 Implementation Plan
- 99 -
Action A30: Water vapour and ozone measurement in upper troposphere and lower and upper stratosphere
An enhanced set of ground-based remote-sensing instruments measuring total and tropospheric
columns is needed for the validation of satellite observations and data products for the composition
ECVs, and connecting them to in situ observations. Moreover, there is a need to implement a
concerted programme for observations of the vertical profiles of water vapour, GHGs, ozone,
aerosols and precursors utilizing commercial and research aircraft, pilotless aircraft, balloon systems,
ground-based lidars, MAXDOAS and FTIR systems, exploiting the contribution that the GRUAN
(Action A15) can bring to this activity. For example, CarbonTracker (NOAA) provides boundary
conditions used to validate satellite retrievals of GHGs.
Action A31: Validation of satellite remote-sensing
With the start of the European Copernicus Observing System, the continuation of satellite
measurements for some climate records is assured for a number of years. In order to fully exploit
this capability, there is a need to continue to build and improve these CDR and FCDR (Action A32).
Action A32: Fundamental Climate Data Records and Climate Data Records for greenhouse gases and aerosols ECVs
Action Re-establish sustained limb-scanning satellite measurement of profiles of water vapour, ozone and other important species from UT/LS up to 50 km
Benefit Ensured continuity of global coverage of vertical profiles of UT/LS constituents
Who Space agencies
Time frame Ongoing, with urgency in initial planning to minimize data gap
Performance indicator
Continuity of UT/LS and upper stratospheric data records
Annual cost US$ 30–100 million
Action Engage existing networks of ground-based, remote sensing stations (e.g. NDACC, TCCON, GRUAN) to ensure adequate, sustained delivery of data from MAXDOAS, charge coupled device (CCD) spectrometers, lidar, and FTIR instruments for validating satellite remote-sensing of the atmosphere
Benefit Validation, correction and improvement of satellite retrievals
Who Space agencies, working with existing networks and environmental protection agencies
Time frame Ongoing, with urgency in initial planning to minimize data gap
Performance indicator
Availability of comprehensive validation reports and near-real-time monitoring based on data from the networks
Annual xost US$ 1–10 million
Action Extend and refine the satellite data records (FCDRs and CDRs) for GHG and aerosol ECVs
Benefit Improved record of GHG concentrations
Who Space agencies
Time frame Ongoing
Performance indicator
Availability of updated FCDRs and CDRs for GHGs and aerosols
Annual cost US$ 1–10 million

GCOS 2016 Implementation Plan
- 100 -
3.3.1 Specific issues – composition ECVs
ECVs – Carbon dioxide, methane and other greenhouse gases
The WMO GAW Global Atmospheric CO2 and CH4 monitoring networks form the basis of the GCOS
Comprehensive Networks for CO2 and CH4. Significant gaps remain to be filled in terrestrial sink
regions, as well as over the southern oceans. Sites that measure fluxes and concentrations from
major regional research projects could be added to fill some of these gaps. The NOAA Earth System
Research Laboratory (ESRL) is a contributor to the WMO GAW and a major partner in the
comprehensive network. It hosts the WMO primary standards for CO2, CH4, N2O, SF6, and CO. Many
other WMO GAW participants contribute to the comprehensive network following WMO GAW
measurement guidelines, data-quality objectives and submission of data to the World Data Centre
for Greenhouse Gases (WDCGG) in Japan. The analysis centres responsible for assembling a dataset
appropriate for inversion modelling to calculate carbon sources and sinks need to be formally
recognized and supported by GAW. The baseline and/or reference networks should be further
developed by WMO GAW.
Other in situ measurements will provide the observational resources to undertake regional analyses.
Measurement of the isotopic composition of CO2 and CH4 can help to distinguish between various
emissions and thus improve our understanding of the budgets and attribute their trends.
Action A33: Maintain WMO GAW CO2 and CH4 monitoring networks
Action A34: Requirements for in situ column composition measurements
Since COP 21 in Paris in November 2015, the need for an improved greenhouse-gas satellite mission
has become clear. Satellite measurements are emerging as potentially useful components of the
56
E.g. AirCore
Action Maintain and enhance the WMO GAW Global Atmospheric CO2 and CH4 monitoring networks as major contributions to the GCOS Comprehensive Networks for CO2 and CH4. Advance the measurement of isotopic forms of CO2 and CH4 and of appropriate tracers to separate human from natural influences on the CO2 and CH4 budgets
Benefit A well-maintained, ground-based and in situ network provides the basis for understanding trends and distributions of GHGs.
Who National Environmental Services, NMHSs, research agencies, and space agencies under the guidance of WMO GAW and its Scientific Advisory Group on Greenhouse Gases
Time frame Ongoing
Performance indicator
Data flow to archive and analysis centres
Annual cost US$ 1–10 million
Action Define the requirements for providing vertical profiles of CO2, CH4 and other GHGs, using recently emerging technology, such as balloon capture technique
56
Benefit Ability to provide widespread, accurate, in situ vertical profiles economically; an excellent tool for validating satellite retrievals and improving transport models
Who GCOS AOPC and space agencies
Time frame Requirements to be defined by 2018
Performance indicator
Update to Annex A to include vertical profiles and XCO2 (the dry-air column-averaged mole fraction of CO2)
Annual cost US$ <5 million

GCOS 2016 Implementation Plan
- 101 -
overall observing system for CO2 and CH4, and important related species such as CO. Initial
measurements of CO2 and CH4, however, have not been made accurately enough and do not have
the spatial resolution to distinguish between natural and anthropogenic sources. To this end, global
measurements are required at high accuracy, with imaging capability at high resolution, hence the
development of a new generation of satellites should be a high priority for space agencies. This
should include support for further development of the retrieval algorithms used for the existing
generation of satellites for CO2, in order to achieve the required improvements in accuracy for the
next generations.
Action A35: Space-based measurements of CO2 and CH4 implementation
The other GHGs, which include N2O, CFCs, HCFCs, hydrofluorocarbons (HFCs), sulphur hexafluoride
(SF6) and perfluorocarbons (PFCs) are generally well-mixed in the troposphere, and for trend
monitoring it is sufficient to measure them with a limited number of stations worldwide.
Observations of N2O are performed in situ at a limited number of stations and are complemented by
flask sampling and off-line analysis resulting in a total of 70 data records available at WDCGG.
Stratospheric trend monitoring of N2O is done by limb view FTIR and MLS measurements.
Tropospheric N2O can be measured using the hyperspectral IR nadir view sounders. The AGAGE
network, measuring halocarbons, comprises 10 stations and ranges from Spitsbergen in the north to
Tasmania in the south. Halocarbons and their new alternatives must be monitored closely, albeit
from a relatively small number of stations, because once they enter the atmosphere, some of them
will remain for hundreds, even thousands of years.
Action A36: N2O, halocarbon and SF6 networks/measurements
ECV – Ozone
Routine measurements of column ozone from ground-based UV spectrometers are established under
the guidance of the WMO GAW programme. Calibration of instruments is essential and efforts in
this regard should be strengthened. Coarse ozone-profile measurements are provided from these
spectrometers through the Umkehr technique. In situ ozone profiles are measured to about 30 km
Action Assess the value of the data provided by current space-based measurements of CO2 and CH4, and develop and implement proposals for follow-on missions accordingly
Benefit Provision of global records of principal greenhouse gases; informing decision-makers in urgent efforts to manage GHG emissions
Who Research institutions and space agencies
Time frame Assessments are ongoing and jointly pursued by research institutions
Performance indicator
Approval of subsequent missions to measure GHGs
Annual cost US$ 30–100 million
Action Maintain networks for N2O, halocarbon and SF6 measurements
Benefit Informs the parties to the Montreal Protocol, provides records of long-lived, non-CO2 GHGs and offers potential tracers for attribution of CO2 emissions.
Who National research agencies, national environmental services, NMHSs, through WMO GAW
Time frame Ongoing
Performance indicator
Data flow to archive and analysis centres
Annual cost US$ 30–100 million

GCOS 2016 Implementation Plan
- 102 -
using ozonesondes. The WMO GAW programme coordinates a network of about 40 ozonesonde
stations and collaborates with other networks such as SHADOZ. Recent calibration and data
protocols have significantly improved the accuracy of these data, but more needs to be done to
ensure their prompt supply in uniform code formats, as the data are important for monitoring the
quality of satellite data retrievals and products from data-assimilation systems operated in near-real
time. The number of ozonesonde ascents has decreased significantly over the past five years and a
concerted effort is required to recover the network, especially for those stations with long records.
Ground-based remote-sensing networks such as NDACC also provide profiles using lidar and
microwave techniques. These measurements still have very limited coverage in the tropics and
southern hemisphere. Both GAW profile ozone and total ozone networks have been recognized as
the GCOS Global Baseline Profile Ozone Network and the GCOS Global Baseline Total Ozone
Network. There is a serious, increasing risk of decline of these ground-based networks, due to
decreasing national contributions. The ground-based networks, in addition to their intrinsic value,
are of paramount importance in support of ozone satellite data. They are used for detecting
potential drifts and hence fofr ensuring the stability of the satellite products.
Action A37: Ozone network coverage
Action A38: Submission and dissemination of ozone data
The record of ozone observations from space extend back more than 30 years. It comprises both
nadir UV and IR measurements and limb measurements in the spectral range from the UV to the
microwave. Combining data from the nadir sounders with the higher vertical resolution data from
limb sounders provides essential information on tropospheric ozone amounts. Established capability
exists to assimilate ozone data in operational NWP and reanalysis systems. The combination of
ground-based and satellite observations has provided unique information on the evolution of the
Antarctic ozone hole and global ozone trends. These datasets, along with research-satellite
measurements of other species involved in ozone chemistry (chlorine and nitrogen compounds and
water vapour), are being used on a continuing basis in WMO/UNEP assessments supporting the
Action Urgently restore the coverage the extent possible and maintain the quality and continuity of the GCOS Global Baseline (profile, total and surface level) Ozone Networks coordinated by WMO GAW.
Benefit Provides validation of satellite retrievals and information on global trends and distributions of ozone.
Who Parties’ national research agencies and NMHSs, through WMO GAW and network partners, in consultation with AOPC
Time frame Ongoing
Performance indicator
Improved and sustained network coverage and data quality
Annual cost US$ 1–10 million
Action Improve timeliness and completeness of submission and dissemination of surface ozone, ozone column and profile data to users, WDCGG and WOUDC
Benefit Improves timeliness of satellite retrieval validation and availability of information for determining global trends and distributions of ozone.
Who Parties’ national research agencies and services that submit data to WDCGG and WOUDC, through WMO GAW and network partners.
Time frame Ongoing
Performance indicator
Network coverage, operating statistics and timeliness of delivery.
Annual cost US$ 100 000–1 million

GCOS 2016 Implementation Plan
- 103 -
Montreal Protocol and its amendments. There is an ongoing need to extend and refine the existing
data records and integrated satellite products, taking account of the biases seen between the
datasets produced from the various instruments. New developments are that ozone layer reanalyses
are being done, in which the use of 3D atmospheric chemistry data assimilation models are key. The
development of long time series of tropospheric ozone data from satellite observations is to be
encouraged.
Nadir measurements of ozone are set to continue for the foreseeable future from several
operational satellite systems, but limb view measurements of higher vertical resolution profiles is
currently fulfilled only by NASA’s Ozone Mapping Profiler Suite instrument on the JPSS mission (see
action A30). The potential gap of limb view satellite observations could threaten the ability to
observe and report on the state of the ozone layer as mandated in the Montreal Protocol and space
agencies are encouraged to pursue initiatives to fill this gap.
ECV – Aerosol properties
In situ aerosol measurements are part of the GAW programme to obtain measurements
representative of the major geographical and exposure regimes, including AERONET, GALION and
PFR sites and BSRN. Regional networks of aerosol measurements are also made for air quality and
acidification applications. Satellite measurements provide information on global AOD for several
decades, which will be extended with new satellites (e.g. Sentinel-3, JPSS, Metop-SG, Himawari-8).
Planned operational missions dedicated to aerosols will, in addition to AOD, provide information on
aerosol size, shape and composition through multi-angle polarimetric observations (e.g. 3MI, MAIA)
and on aerosol layer height through O2 A-band measurements (3MI, MAIA, Platform for Attitude
Control Experiments (PACE). Aerosol information will also be provided by GOSAT-2, extending that
from GOSAT. Further concerted action is needed to develop an aerosol layer-height product based
on existing and planned operational instruments (O2 A-band, IASI, MAIA) and investigate the
retrieval of absorbing aerosols. There is also an ongoing need for reprocessing of past satellite
observations using better calibration, cloud screening and aerosol microphysics to obtain an
improved historical record (see action A31).
More in situ and space-based measurements are needed in both the troposphere and the lower
stratosphere. A determined effort to integrate available measurements of aerosol optical properties
and to expand the measurements has begun, and may be viewed as an important step in developing
a concerted system for global aerosol monitoring. This effort is strengthened by the International
Satellite Aerosol Science Network (AERO-SAT) set up in 2013. The development and generation of
consistent products combining the various sources of data are essential. The physical and chemical
composition of aerosols needs to be routinely monitored at a selected number of globally-distributed
surface sites. The recently established SPARTAN network (Snider et al., 2015)57, a global network of
57 Snider, G., C.L. Weagle, R.V. Martin, A. van Donkelaar, K. Conrad, D. Cunningham, C. Gordon, M. Zwicker, C. Akoshile, P.
Artaxo, N.X. Anh, J. Brook, J. Dong, R.M. Garland, R. Greenwald, D. Griffith, K. He, B.N. Holben, R. Kahn, I. Koren,
N. Lagrosas, P. Lestari, Z. Ma, J. Vanderlei Martins, E.J. Quel, Y. Rudich, A. Salam, S.N. Tripathi, C. Yu, Q. Zhang, Y. Zhang,
M. Brauer, A. Cohen, M.D. Gibson and Y. Liu, 2015: SPARTAN:a global network to evaluate and enhance
satellite-based estimates of ground-level particulate matter for global health applications. Atmos.Meas.Tech.,
8, 505–521,2015.doi:10.5194/amt-8-505-2015.

GCOS 2016 Implementation Plan
- 104 -
ground-level particulate matter monitoring stations, can be used to evaluate and enhance satellite-
based estimates of ground-level particulate matter for global climate and health applications.
There is also an important source of long-term records on atmospheric aerosol abundance and
composition in glacial ice. Joint measurements of cloud and aerosol properties are required for
quantifying aerosol–cloud interactions (see ECV Cloud Properties).
Action A39: Monitoring of aerosol properties
ECV – Precursors for aerosols and ozone
Global observation of the aerosol and ozone precursors NO2, SO2, HCHO, CO and NH3 (in addition to
CH4, covered earlier) has been shown to be feasible from space. In the last 10 years, major progress
has been made in measuring these species in the troposphere and lower stratosphere using a range
of instruments. It will be possible to extend the data record forward to several decades with data
from existing and planned operational missions (e.g. Sentinel 5p/TROPOMI and later Sentinel 4
(geostationary) and Sentinel 5 (polar orbiting), as well as the geostationary satellite instruments
Tropospheric Emissions: Monitoring of Pollution (USA, 2018) and the Geostationary Environment
Monitoring Spectrometer (Republic of Korea, 2018). The availability of ground-based in situ
observations of aerosol and ozone precursors such as volatile organic compounds (VOCs) and
nitrogen oxides are limited due to the large number of compounds present in the atmosphere and
more demanding analytical requirements. Sound information on the temporal and spatial surface
distribution of individual VOCs can be retrieved, however, from the few available continuous
observations complemented by a comprehensive flask sampling network (Schultz et al., 2015)58. For
this Plan, the aerosol and ozone precursors have been designated as a separate ECV to recognize
their importance in the climate observing system.
Studies have shown that emission estimates using inverse modelling techniques and satellite data
can help to reduce the uncertainties in emission databases. First studies are being performed
58 Schultz M.G., H. Akimoto, J. Bottenheim, B. Buchmann, I.E. Galbally, S. Gilge, D. Helmig, H. Koide, A.C. Lewis, P.C. Novelli,
C. Plass-Dlmer, T.B. Ryerson, M. Steinbacher, R. Steinbrecher, O. Tarasova, K. Torseth, V. Thouret, C. Zellweger, 2015: The
Global Atmosphere Watch reactive gases measurement network, Elementa, 3, 1-23, doi:
10.12952/journal.elementa.000067.
Action Provide more accurate measurement-based estimates of global and regional direct aerosol radiative forcing (DARF) at the top of the atmosphere and its uncertainties, and determine aerosol forcing at the surface and in the atmosphere through accurate monitoring of the 3D distribution of aerosols and aerosol properties. Ensure continuity of monitoring programs based on in situ ground-based measurement of aerosol properties.
Benefit Reducing uncertainties in DARF and the anthropogenic contributions to DARF, and the uncertainty in climate sensitivity and future predictions of surface temperature.
Better constraints on aerosol type needed for atmospheric correction and more accurate ocean property retrieval than currently available.
Who Parties’ national services, research agencies and space agencies, with guidance from AOPC and in cooperation with WMO GAW and AERONET
Time frame Ongoing, baseline in situ components and satellite strategy is currently defined.
Performance indicator
Availability of the necessary measurements, appropriate plans for future
Annual cost US$ 10–30 million

GCOS 2016 Implementation Plan
- 105 -
combining precursor and aerosol data from space to obtain information on aerosol composition.
Emerging integrated data products for the ozone and aerosol ECVs from comprehensive chemical
data-assimilation systems will be improved by assimilating observations of the precursors, as this will
lead to better background model fields of ozone and aerosol. Combining observations of the
precursors with those of tropospheric ozone and aerosols will be crucial for attributing change to
natural and anthropogenic sources. High temporal and spatial resolution is needed to improve the
emission estimates, especially for short-lived trace gases with a large diurnal cycle, such as NO2 and
SO2.
In view of the need for observation constraints on the bottom up emission estimates and the
attribution to specific sources, a development in line with the high spatial resolution modelling needs
for urban air quality, there is an increasing need for even higher spatial resolution measurements on
the precursor gases (1 x 1 km2) that should be taken into account for the next-generation satellite
systems. In order to constrain secondary aerosol formation from precursors measurements,
measurements on precursor gases with similar spatial resolution as satellite aerosol measurements
are needed (1 x 1 km2). Information from ground-based and in situ observations is needed to
validate satellite data products and exploit the value of measurements of the precursors from
multiple platforms. Since the retrieval is dependent on profile assumptions, albedo and cloud,
research activities have to be undertaken to improve existing retrieval techniques, using a
combination of ground-based, satellite and model information. There is still a limited set of ground-
based measurements, not well distributed over the globe and, hence, a lack of validation
measurements for all precursor trace gases.
Action A40: Continuity of products of precursors of ozone and secondary aerosols
3.4 Atmospheric domain – scientific and technological challenges
Most of the atmospheric ECVs can be monitored using either in situ measurements or from space to
a certain level of accuracy in some, but not all, cases meeting the requirements laid out in the GCOS
requirements given in Annex A. For some ECV products, however, there outstanding issues remain
requiring the development of new measurement techniques. These include:
(a) Measurement of snowfall as distinct from rain both at the surface and in the atmosphere;
(b) Global monitoring of the composition and distribution of aerosols and their precursors from
space and linked observations with cloud for study of their interactions;
(c) Global measurements of surface pressure, especially over the oceans from space;
(d) Unbiased estimation of high temporal resolution precipitation amount, especially over the
oceans and over areas of complex orography;
Action Ensure continuity of products based on space-based, ground-based and in situ measurements of the precursors (NO2, SO2, HCHO, NH3 and CO) of ozone and secondary aerosol and derive consistent emission databases, seeking to improve spatial resolution to about 1 x 1 km
2 for air quality
Benefit Improved understanding of how air pollution influences climate forcing and how climate change influences air quality.
Who Space agencies, in collaboration with national environmental agencies and NMHSs
Time frame Ongoing
Performance indicator
Availability of the necessary measurements, appropriate plans for future missions, and derived emission databases
Annual cost US$ 100–300 million

GCOS 2016 Implementation Plan
- 106 -
(e) Development of active (lidar) and passive sensors for the estimation of column CO2 from
satellites at high spatial resolution;
(f) More reliable, lower cost and environment friendly in situ humidity-measuring instruments over
both ocean and land;
(g) More accurate and robust autonomous gas-flux sensors suitable for use on ships (and maybe
buoys);
(h) Development of cheaper, smaller satellite instruments with the same capabilities as previous,
more expensive instruments.
Technological developments should be instigated over the next five years to address these
shortcomings in measuring capabilities, which will ultimately lead to a better global climate
observing system.
Table 11. International data centres and archives59 – atmospheric domain
Network or system International data centres and archives Coordinating
body
Atmosphere Surface
GSN
GSN Monitoring Centre (DWD, JMA)
GSN Analysis Centre (NCEI)
GSN Archive (WDC Asheville)
WMO CBS GCOS Lead Centres (DWD, JMA, NCEI, Direction de la
Météorologie Nationale ((DMN), Morocco)), Instituto Nacional de
Meteorologia ((INAM), Mozambique), Islamic Republic of Iran
Meteorological Organzation (IRIMO), Dirección Meteorológica de Chile
(DMC), Bureau of Meteorology ((BoM), Australia), British Antarctic
Survey ((BAS), United Kingdom)
AOPC with WMO
CBS
Full WWW/GOS synoptic
network
Integrated Surface Database Hourly (WDC Asheville)
GPCC (DWD)
European Centre for Medium-Range Weather Forecasts (ECMWF)
Meteorological Archival and Retrieval System (MARS) database
World Radiation Data Centre (St Petersburg, Russian Federation)
WMO CBS and
WMO CAS
National surface
networks
National responsibility; submission to WDC Asheville,
GPCC (DWD)
WMO CCl, WMO
CBS and WMO RAs
Baseline Surface
Radiation Network
World Radiation Monitoring Centre (Alfred Wegener Institute,
Bremerhaven, Germany) AOPC with WCRP
Atmosphere Upper-air
GUAN
GUAN Monitoring Centres (ECMWF)
GUAN Analysis Centres, National Climatic Data Center (NCDC)
GUAN Archive (WDC Asheville)
WMO CBS GCOS Lead Centre (BAS, BOM, DMC, DMN, DWD, IRIMO,
JMA, NCDC)
AOPC with WMO
CBS
Full WWW/GOS Upper-
air Network
WWW/Global Data Processing and Forecasting Systems (GDPFS) World
Centres
WWW/GDPFS Regional/Specialized Meteorological Centres
WDC Asheville
ECMWF MARS database
WMO CBS
59 Covers mostly ground-based networks, as the datasets from satellite instruments are normally managed by the
responsible space agencies.

GCOS 2016 Implementation Plan
- 107 -
Reference network high-
altitude radiosondes GRUAN Lead Centre, Lindenberg, Germany) AOPC with WCRP
Aircraft (AMDAR etc.)
WWW/GDPFS World Centres
WWW/GDPFS Regional/Specialized Meteorological Centres
WDC Asheville
WMO CBS
Profiler (radar) network
WWW/GDPFS World Centres
WWW/GDPFS Regional/Specialized Meteorological Centres
WDC Asheville
WMO CBS
Ground-based GPS
receiver network
EIG EUMETNET GNSS water vapour programme
SuomiNet
International GNSS Service
EUMETNET
University
Corporation for
Atmospheric
Research
Atmosphere Composition
WMO GAW Global
Atmospheric CO2 and CH4
Monitoring Networks
(GAW continuous surface
monitoring network)
WDCGG (JMA)
NOAA- ESRL (Boulder)
Carbon Dioxide Information Analysis Center (Oak Ridge National
Laboratory)
WMO CAS
WMO GAW Global
Atmospheric CO2 and
CH4 Monitoring Networks
(GAW surface flask
sampling network)
WDCGG (JMA)
NOAA- ESRL (Boulder) WMO CAS
WMO GAW GCOS Global
Baseline Profile Ozone
Network, WMO GAW
GCOS Global Baseline
Total Ozone Network,
NDACC
World Ozone and Ultraviolet Radiation Data Centre (WOUDC)
(Environment Canada) Network for the Detection of Stratospheric
Change) Archive (NDACC)
SHADOZ – NASA archive
WMO CAS
Aircraft (CONTRAIL,
IAGOS, MOZAIC and
similar programmes) WDCGG (JMA)
WMO CAS
Aerosols and Precursors
AERONET AERONET archive WMO CAS
GAW Baseline Network World Data Centre for Aerosols (Norwegian Institute for Air Research) WMO CAS
GALION Several distributed data archives

GCOS 2016 Implementation Plan
- 108 -
4. OCEANIC CLIMATE OBSERVING SYSTEM
4.1 Overview
4.1.1 Role of the ocean in the climate system
The ocean is a central component of Earth’s climate system, essentially carrying the climate memory
from short to long temporal scales. In the context of climate variability and climate change, the
global ocean is singularly important due to its full-depth heat and freshwater storage capacity. The
ocean stores about 93% of the Earth’s excess heat energy (IPCC, 2015), of which 74% is stored in the
upper 2 000 m and 19% in the abyssal ocean beneath 2 000 m. More than three quarters of the total
exchange of water between the atmosphere and the Earth’s surface through evaporation and
precipitation takes place over the ocean. The ocean warming has resulted in global and regional sea-
level rise that has had a profound impact on coastal inundation and erosion.
The ocean plays a critical role in the cycling of greenhouse gases and setting the global carbon
budget. The oceans are a major sink for anthropogenic carbon dioxide and have taken up and stored
about 30% of the anthropogenic emissions of carbon dioxide since preindustrial times. The ocean
uptake along with atmospheric carbon dioxide observations are the major observational constraints
used to estimate the interannual to decadal change in the terrestrial uptake and storage of
anthropogenic carbon dioxide. While the ocean uptake of anthropogenic carbon dioxide buffers or
mitigates climate change, it comes at the cost of ocean acidification, which is likely to have a
profound impact on marine ecosystems (e.g. shifts in biodiversity, viability of coral reef ecosystems,
marine-based food security and economies).
Figure 10 from the IPCC 2015 report shows that the ocean observations of the Earth’s system cycles
discussed in Part 1 (section 5) have all increased since the 1950s: the inventory of anthropogenic CO2,
global mean sea level, upper-ocean heat content and the salinity contrast between regions of high
and low sea-surface salinity. These observed changes in the ocean underlie the fundamental role of
the ocean in the climate system and the requirement for a comprehensive and sustained ocean-
observing system.
The ability of the ocean to store vast amounts of heat and CO2 results from the large mass and heat
buffer capacity of seawater compared to the air, combined with the connection of the atmosphere to
the interior of the ocean via the ocean circulation. To understand the oceanic branch of the climate
system, we must observe the ocean properties across a large spectrum of spatial and temporal scales
to monitor the storage of heat, freshwater and carbon and other biogeochemical properties, to
observe their transport by the ocean circulation and to monitor their exchange and that of
momentum – the wind stress – across the air-sea interface.
Climate variability and change on timescales from seasons to millennia is closely linked to the ocean
through its interactions with the atmosphere and cryosphere, thus holding the climate memory. The
ocean therefore contributes strongly to our ability to develop climate predictions and projections on
timescales from weeks to decades and centuries, including delivery to climate services (through
domain-specific forecasts on timescales of seasons and longer).

GCOS 2016 Implementation Plan
- 109 -
Figure 10. Time series of changes in large-scale ocean climate properties. From top to bottom:
global ocean inventory of anthropogenic carbon dioxide, updated from Khatiwala et al. (2009);
global mean sea level, from Church and White (2011); global upper ocean heat content anomaly,
updated from Domingues et al. (2008); the difference between salinity averaged over regions
where sea-surface salinity is greater than the global mean sea-surface salinity (high salinity) and
salinity averaged over regions with values below the global mean (low salinity), from Boyer et al.
(2009).
Source: IPCC 2015
The primary requirement for the design of the ocean observing system for climate is to resolve ocean
variability at timescales from subseasonal to longer. The ocean observing system is also used to
improve numerical weather prediction and operational ocean forecasting and is frequently leveraged
for short-term, high-density process studies which then feed advanced understanding back into the
sustained observing system design. To this end, OOPC and its sibling GOOS panels work with
research groups such as the WCRP CLIVAR programme and GOOS development projects.

GCOS 2016 Implementation Plan
- 110 -
4.1.2 Observing the ocean
The Global Ocean Observing System is organized by the user-driven requirements for ECV
observations for :
(a) Monitoring the climate system;
(b) Detecting and attributing climate change;
(c) Assessing impacts of, and supporting adaptation to, climate variability and change;
(d) Application to national economic development;
(e) Research to improve understanding, modelling and prediction of the climate system.
The ECV observational requirements can be satisfied in a number of different ways using a variety of
sensors and observational platforms (Figure 11). To meet the ECV requirement and to provide the
greatest resilience of the observing system, the ocean observing system is coordinated through
global networks which are organized around a particular platform or observing approach
(Constellations, Argo Profiling Floats, OceanSITES time-series sites, etc.) and with defined missions
and implementation targets. The composite observing networks monitor ocean ECVs globally, but do
this at different temporal and spatial scales, depending on requirements and feasibility. Sustaining
observations of ECVs relies on the existence of a range of different platforms and sensors, based on
feasibility, building on the long-term existence of in situ and satellite components. The global ocean
observing system put in place for climate also supports global weather and seasonal prediction,
global and coastal ocean prediction and marine environmental monitoring. This multi-purpose
aspect of the design contributes to its sustainability.

GCOS 2016 Implementation Plan
- 111 -
Figure 11. A multi-platform approach is needed to deliver ECV requirements for observations at
the required range of scales (temporal, horizontal and vertical) and accuracy.
The overall systems-based design and evaluation of the observing system is overseen by OOPC in
consultation with the sibling GOOS panels for biogeochemistry and biology. Despite recent progress
in sustained observations of ECVs and in building ocean observing networks and analysis systems,
these are not yet adequate to meet the specific needs of the UNFCCC. Spatial and temporal sampling
requirements are not met for most ECVs and in most regions, particularly the southern hemisphere.
Table 12 outlines how the ECVs have evolved since the previous Plan, which, in part, reflects the
establishment of GOOS panels for biogeochemistry and biology and developments in both
understanding of requirements and observing technology.
There is a pressing need to expand the monitoring capabilities as specified by the OceanObs’09
Conference60 by obtaining global coverage using proven technologies and to continue to develop
novel observing technologies, to establish communications and data management infrastructure and
to enhance ocean analysis and reanalysis capacity. Attaining and sustaining global coverage is the
most significant challenge for the oceanic climate observing system. This challenge will be met only
through national commitments to the global implementation and maintenance effort and with
60 Hall, J., D.E. Harrison and D.Stammer (Eds), 2010). Proceedings of OceanObs'09: Sustained Ocean Observations and
Information for Society. Venice, Italy, 21–25 September 2009, ESA Publication WPP-306. doi:10.5270/OceanObs09

GCOS 2016 Implementation Plan
- 112 -
international coordination provided by GOOS, the Joint WMO-IOC Technical Commission for
Oceanography and Marine Meteorology (JCOMM) and other relevant bodies.
This Plan encourages the ocean observing community to adopt the Framework for Ocean Observing61
that was developed after OceanObs’09 with additional input from the ocean observing community as
a framework for planning, implementing and evaluating sustained multidisciplinary ocean observing.
This composite global ocean observing system makes best use of a mix of proven satellite and in situ
technologies and optimizes the contributions from existing observing assets and deployment
opportunities for both global surface and subsurface variables. It also builds on the mechanisms
established to foster more effective international collaborations and the demonstration of
capabilities to generate oceanic climate products, as well as the development of new technologies.
Table 13 outlines how the ECVs are measured across the satellite constellations and core sustained in
situ observing networks.
The sampling strategy of the ocean observing system for climate will evolve as we improve our
understanding of the scales that need to be resolved as technology advances and as experience
expands from users working with ocean climate products. Ocean analysis and reanalysis activities,
which may involve conventional analyses of integrated datasets (satellite and in situ), as well as
ocean data-assimilation techniques are critical to realize the value of these composite networks and
address the objectives of the global observing system for climate and the UNFCCC.
Table 12. Evolution of ECVs since the 2010 GCOS Implementation Plan
2010 ECVs 2016 ECVs Comments
Physical
Temperature Temperature
Sea-surface temperature Sea-surface temperature
Salinity Salinity
Sea-surface salinity Sea-surface salinity
Current Current
Surface current Surface current
Sea level Sea level
Sea state Sea state
Sea ice Sea ice
Ocean surface stress A new ECV to capture the wind-
driven component of ocean
circulation and processes
Ocean surface heat flux A new ECV for comprehensive
observations of all components of
the surface heat flux
61
Framework for Ocean Observing (FOO) http://www.oceanobs09.net/foo/

GCOS 2016 Implementation Plan
- 113 -
Biogeochemical
Carbon dioxide partial pressure
(surface)
Inorganic carbon Reframed to accurately reflect
current observing requirements to
characterize the carbonate system;
depending on the platform, a choice
of ideally at least 2 variables of
dissolved inorganic carbon, total
alkalinity, CO2 partial pressure
(pCO2) or pH to be observed
Carbon dioxide partial pressure
(subsurface)
Ocean acidity (surface)
Ocean acidity (subsurface)
Nutrients Nutrients Includes: nitrate, phosphate, silicate.
Oxygen Oxygen
Tracers Transient tracers Includes: sulphur hexafluoride
(SF6), CFCs, C-14, tritium, helium-3.
Nitrous oxide A new ECV to reflect the ocean’s role
for nitrogen dioxide cycling
Ocean colour Ocean colour
Biological/ecosystems
Phytoplankton Plankton Includes phytoplankton and
zooplankton.
Marine habitat properties Includes coral cover, mangroves, sea
grasses, macroalgae.
The global ocean provides an important context for the interpretation and prediction of regional
climate variability. There are particular challenges in terms of monitoring and forecasting and
validating and improving regional climate projections. Variability of the global ocean affects regional
climate in many different ways; without knowledge of the global ocean it will be impossible to
interpret regional climate information or to select appropriate national responses. In addition to
observing the physical and biogeochemical ocean variables, it is critical to have observations of
marine biodiversity and habitat properties as these are important to both support the sustainable
use of ocean resources and to monitor the impacts that climate change and other environmental
changes may produce. The regional and global ocean observing systems must develop together for
each to deliver value most effectively to the Parties.
4.1.3 Observing shelf/coastal ocean and climate
To capitalize fully on investment in global climate observations, it is imperative to extend the focus of
ECVs into the coastal zones where a large proportion of the global population lives and where
societal impacts of climate change are mostly keenly evident through sea-level rise, extreme events,
loss of ecosystem services and impacts on coastal infrastructure.
The coastal marine habitats (coral reefs, mangroves, sea-grass beds, intertidal zones, macroalgal
forests, sea ice) are extremely sensitive to the impacts of climate variability and change. In
particular, climate-related changes in sea level, temperature, salinity, precipitation, freshwater
inputs, light, nutrients, ocean acidification, wind forcing, currents and waves can all lead to significant
habitat alterations and loss of biodiversity, with a related loss in ecosystem functions and services,
especially in combination with local land and atmospheric changes. For example, changes in

GCOS 2016 Implementation Plan
- 114 -
watershed land use and global weather will alter the net volume and characteristics of variability of
river flows discharged into the coastal zone.
This requires special attention to the integration of the ocean observing system – physical,
biogeochemical and biological – due the variability of this region and immediate societal impacts.
Coastal/open-ocean exchange processes are also key controllers of coastal ocean-water properties.
Strong integration of the coastal and open-ocean observing systems is therefore required. Observing
these complex, dynamic regions, particularly from space, involves a different set of challenges than
making global and basin-scale ocean observations, including finer-resolution observations and
models, to understand complex physical/biogeochemical/biological and ecosystem processes. In
addition, it requires the coordination of more stakeholders and partners.
The GOOS regional policy62 updates the policy adopted in 2006 and outlines the roles and
responsibilities of GOOS Regional Alliances (GRAs). While heterogeneous in governance and focus,
GRAs play an important role in coordinating coastal observations at the national and regional level in
the coastal environment. Biennial meetings through the GOOS Regional Council provide them the
opportunity to collaborate with one another and plan joint activities for GOOS.
The GOOS panels and GRAs must ensure that the requirements for coastal observations of the ECVs
are taken fully into account in the implementation plan of the coastal GOOS. It is equally important
that GOOS and the GRAs encourage and ensure that regional and coastal observing contributions and
associated products are responsive to the Actions in this Plan and thus to the needs of the UNFCCC.
While each nation derives benefit from the global climate observing system, actions at the coastal
level will ensure resolution of the local ocean climate and help deliver direct and tangible benefits.
These, in particular, are improving regional and local understanding of the impacts of climate change
and informing regional mitigation and adaptation policy.
Finally, there is a need for a focused joint effort between the GOOS panels and TOPC to further
connect observational requirements at the land-ocean interface (see Action T2).
Action O1: Coordination of enhanced shelf and coastal observations for climate
62
The GOOS regional policy 2013 IOC/INF-1308
Action Assess existing international, national and regional plans that address the needs to monitor and predict
the climate of coastal regions and develop plans were they do not exist.
Benefit Detailed specific observational requirements in the coastal regions for improved understanding,
assessment and prediction of the impact of climate on the coastal environment
Time frame 2026, with interim assessment of progress by 2021
Who GOOS, GRAs, JCOMM OCG
Performance
indicator
An internationally recognized coordination activity
Annual cost US$ 10–30 million
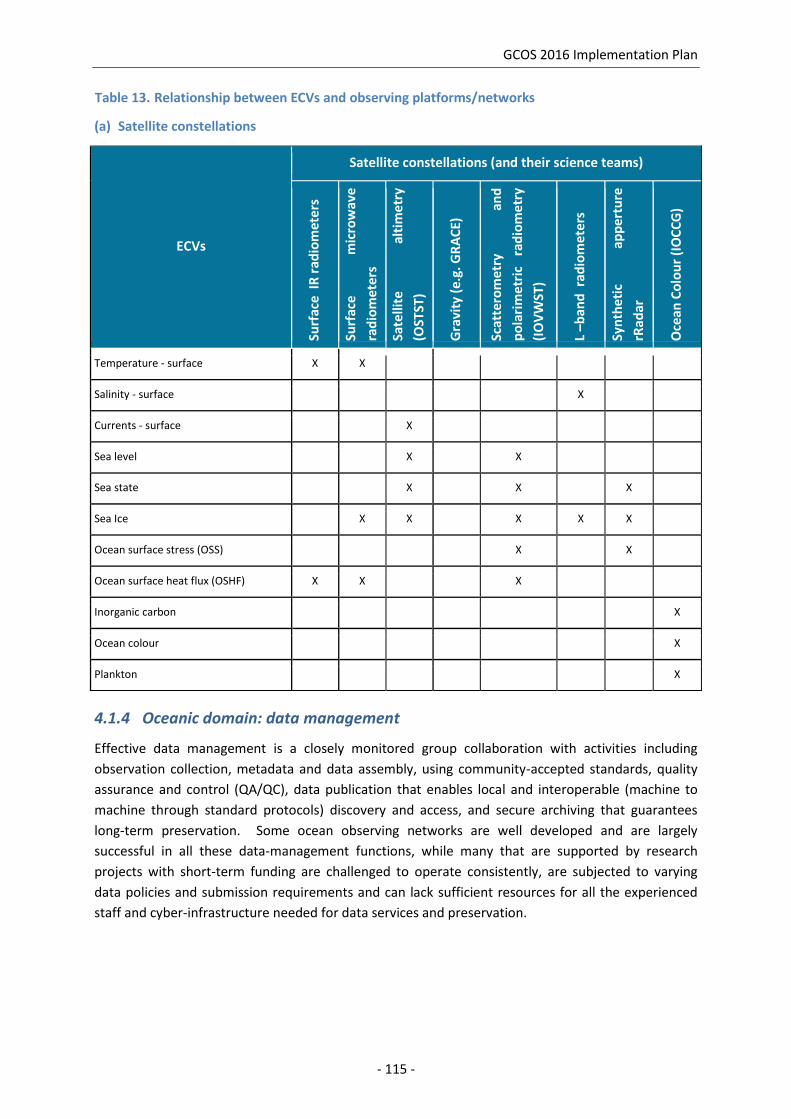
GCOS 2016 Implementation Plan
- 115 -
Table 13. Relationship between ECVs and observing platforms/networks
(a) Satellite constellations
ECVs
Satellite constellations (and their science teams)
Surf
ace
IR
rad
iom
ete
rs
Surf
ace
mic
row
ave
rad
iom
ete
rs
Sate
llite
al
tim
etr
y
(OST
ST)
Gra
vity
(e.
g. G
RA
CE)
Scat
tero
me
try
and
po
lari
me
tric
ra
dio
me
try
(IO
VW
ST)
L –b
and
rad
iom
ete
rs
Syn
thet
ic
app
ert
ure
rRad
ar
Oce
an C
olo
ur
(IO
CC
G)
Temperature - surface X X
Salinity - surface X
Currents - surface X
Sea level X X
Sea state X X X
Sea Ice X X X X X
Ocean surface stress (OSS) X X
Ocean surface heat flux (OSHF) X X X
Inorganic carbon X
Ocean colour X
Plankton X
4.1.4 Oceanic domain: data management
Effective data management is a closely monitored group collaboration with activities including
observation collection, metadata and data assembly, using community-accepted standards, quality
assurance and control (QA/QC), data publication that enables local and interoperable (machine to
machine through standard protocols) discovery and access, and secure archiving that guarantees
long-term preservation. Some ocean observing networks are well developed and are largely
successful in all these data-management functions, while many that are supported by research
projects with short-term funding are challenged to operate consistently, are subjected to varying
data policies and submission requirements and can lack sufficient resources for all the experienced
staff and cyber-infrastructure needed for data services and preservation.

GCOS 2016 Implementation Plan
- 116 -
(b) In situ ocean platforms (and coordinating networks)
ECVs
In situ ocean platforms (and coordinating networks)
Pro
filin
g fl
oat
s (A
rgo
)
Re
pe
at h
ydro
grap
hy
(GO
-SH
IP)
Tim
e s
eri
es
Sit
es
-
mo
ore
d/
Ship
(Oce
anSI
TES)
M
eto
cean
mo
ori
ngs
(DB
CP
)
Dri
fter
s –
incl
ud
ing
bu
oys
on
ice
(D
BC
P)
Vo
lun
tary
Ob
serv
ing
Ship
s (V
OS)
Ship
s o
f O
pp
ort
un
ity
(SO
OP
)
Tid
e g
auge
s (G
LOSS
)
Oce
an g
lider
s
Tagg
ed
an
imal
s
Temperature - surface X X X X X X X X X
Temperature -subsurface X X X X X X
Salinity - surface X X X X X X X X X
Salinity - subsurface X X X X X
Currents - surface X X X
Currents - subsurface X X X X
Sea level X X X
Sea state X X X X
Sea ice X X X
Ocean surface stress (OSS) X X X X
Ocean surface heat flux (OSHF) X X X
Oxygen X X X X X
Nutrients X X X X X
Inorganic carbon X X X X X
Tracers X
N2O X X
Ocean colour X X
Plankton X X
Air temperature X X X
Wind speed and direction X X X X
Water vapour X X X
Pressure X X X X
Precipitation X X X
Surface radiation budget X X
The existence of a multitude of disparate data-management infrastructure imposes problems for the
global observing system that include, but are not limited to, delayed and duplicate data receipts,
versioning issues, missing data and metadata and non-documented data-processing procedures.
Modern data-management infrastructure is therefore, needed such that all activities along the data-
flow pipeline, from data collection through assembly and to preservation, are more automated, fault-

GCOS 2016 Implementation Plan
- 117 -
tolerant, and that, progressively, the systems advance toward interoperability. Interoperability
serves both the routine data exchanges within and amongst the networks and user discovery and
access. Community standards for metadata, data formats, communication protocols and data server
software infrastructure are the foundation for interoperability. These are not new considerations for
the ocean data-management community. The technical aspects have been demonstrated and
successfully deployed in limited regions and specific parts of the global networks. Expanding on
these successes is important and is guided by various ocean observing programmes (both national
and international), as well as by coordinating WMO and IOC organizations, independently and jointly.
The time is right to improve interoperability across the observing system networks and enable
sustainable process that can create integrated datasets for the ECVs.
The Global Data Assembly Centres (GDACs) are the logical place to focus the development of
integrated ECV data access. By using multiple GDACs, the data content can be mirrored between
centres and accessed through any one, providing redundancy and resilience in the data-management
structure. Using GDACs focused on providing service on an ECV and platform basis facilitates a
rigorous QA service ensuring that: (a) data are quality-assured and controlled according to
community agreed standards; (b) direct feedback is given to the data sources as needed; (c)
duplicates are identified and resulting issues are resolved; (d) metadata are complete according to
community-agreed best practices or existing standards; (e) data and metadata are published and
available through interoperable services; (f) reports are made to IODE and JCOMM Committees on
data-management status and activities; (g) data-citation practices as outlined by the Research Data
Alliance (RDA) and DataCite are incorporated; (h) data requests and searches from users can be
reproduced; and (i) there is clear tracking of the complete data lifecycle for each ECV dataset. The
last three items are often overlooked but are becoming increasingly more important to ensure that
scientists and researchers get credit for data they create and that users/reviewers can reproduce the
exact requests for data that are referenced in scientific publications.
By providing interoperable access, and adhering to standards and conventions, this framework will
make future data-synthesis products and activities more efficient than with the current non-
integrated data-management system.
Action O2: Integration and data access
Action Improve discoverability and interoperability, comparability and traceability of ocean observations
among ocean observing networks for all ECVs (including ECVs of other domains).
Benefit Improved access to data, ease of integration across data sources
Time frame Continuous
Who Parties’ national research programmes and data-management infrastructure, OOPC, International
Ocean Carbon Coordination Project (IOCCP), the WCRP Data Advisory Council (WDAC), JCOMM Data
Management Programme Area (DMPA), GEO Blue Planet
Performance
indicator
Timely and open access to quality-controlled observational data
Annual cost US$ 1–10 million
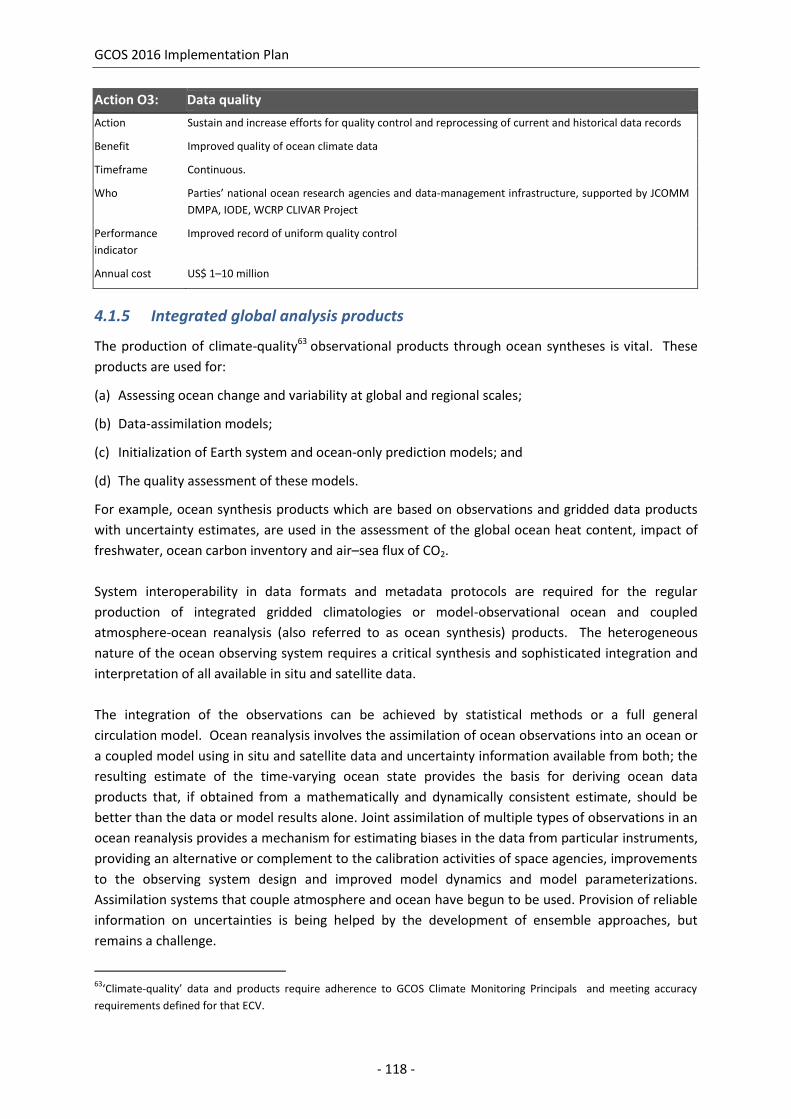
GCOS 2016 Implementation Plan
- 118 -
Action O3: Data quality
4.1.5 Integrated global analysis products
The production of climate-quality63 observational products through ocean syntheses is vital. These
products are used for:
(a) Assessing ocean change and variability at global and regional scales;
(b) Data-assimilation models;
(c) Initialization of Earth system and ocean-only prediction models; and
(d) The quality assessment of these models.
For example, ocean synthesis products which are based on observations and gridded data products
with uncertainty estimates, are used in the assessment of the global ocean heat content, impact of
freshwater, ocean carbon inventory and air–sea flux of CO2.
System interoperability in data formats and metadata protocols are required for the regular
production of integrated gridded climatologies or model-observational ocean and coupled
atmosphere-ocean reanalysis (also referred to as ocean synthesis) products. The heterogeneous
nature of the ocean observing system requires a critical synthesis and sophisticated integration and
interpretation of all available in situ and satellite data.
The integration of the observations can be achieved by statistical methods or a full general
circulation model. Ocean reanalysis involves the assimilation of ocean observations into an ocean or
a coupled model using in situ and satellite data and uncertainty information available from both; the
resulting estimate of the time-varying ocean state provides the basis for deriving ocean data
products that, if obtained from a mathematically and dynamically consistent estimate, should be
better than the data or model results alone. Joint assimilation of multiple types of observations in an
ocean reanalysis provides a mechanism for estimating biases in the data from particular instruments,
providing an alternative or complement to the calibration activities of space agencies, improvements
to the observing system design and improved model dynamics and model parameterizations.
Assimilation systems that couple atmosphere and ocean have begun to be used. Provision of reliable
information on uncertainties is being helped by the development of ensemble approaches, but
remains a challenge.
63
‘Climate-quality’ data and products require adherence to GCOS Climate Monitoring Principals and meeting accuracy
requirements defined for that ECV.
Action Sustain and increase efforts for quality control and reprocessing of current and historical data records
Benefit Improved quality of ocean climate data
Timeframe Continuous.
Who Parties’ national ocean research agencies and data-management infrastructure, supported by JCOMM
DMPA, IODE, WCRP CLIVAR Project
Performance
indicator
Improved record of uniform quality control
Annual cost US$ 1–10 million

GCOS 2016 Implementation Plan
- 119 -
In addition to syntheses of the physical ocean state, efforts are also underway to quantify the sea–air
flux of CO2 within the surface ocean pCO2 mapping intercomparison (SOCOM) project, where
observations of the oceanic and atmospheric partial pressures of CO2 are used in conjunction with a
parameterization of the gas transfer across the sea–air interface. Since the ocean is undersampled
for pCO2, interpolation methods are used to estimate values in periods and areas not directly
observed. SOCOM collates various methods that have been proposed to interpolate pCO2 data in
space and time.
The status and maturity of integrated ocean products have progressed considerably over the recent
decade. The synthesis of ocean observations and the associated delivery of high-quality data
products for climate applications have obtained a high maturity and quality and are now widely used.
Production streams for ocean-climate estimates have been established and now need to be
maintained as part of a climate observing system. The production of these products for climate and
other applications, however, are major undertakings that have been, and continue to be, under-
resourced, both financially and staff-wise.
Action O4: Development of climatologies and reanalysis products
4.1.6 Agents for implementation
The ocean and climate observing system needs to be considered as an integrated whole,
encompassing both satellite and in situ capabilities. The Framework for Ocean Observing (FOO)
brings together a suite of ideas to re-energize development of global ocean observing infrastructure.
It embraces a key request from OceanObs’09 to broaden sustained global ocean observing across
ocean-science disciplines. The Framework articulates development of subsystems in terms of
“readiness”, using assessment of feasibility and fitness-for-purpose in order to embrace emerging
research to empower sustained ocean-observing. The ocean climate observing system is
coordinated, maintained and operated by a diverse range of internationally coordinated platform
networks. Much of the investment and management of the in situ observing activities continue to be
carried out under research agency support and on research programme time limits, however.
Satellite observation activities are organized across satellite agencies and are focused around ECV-
based constellations as with the atmospheric and terrestrial domains, hence activities are well
aligned with GCOS requirements. Clearly, these need to continue. A particular concern at the time
of writing, however, is the fragility of the financial arrangements that support most of the present in
Action Maintained research and institutional support for the production of ocean gridded data products and
reanalysis products, and coordinated intercomparison actrivities
Benefit Improved quality and availability of integrated ocean products for climate change detection and
validation of climate projections and initialization of weather- and marine-forecasting models
Time frame Continuous
Who Parties’ national research programmes and operational agencies, WCRP-CLIVAR GSOP, GODAE
OceanView and the JCOMM Expert Team on Operational Ocean Forecasting (ETOOFS), IOCCP
Performance
indicator
Regular updates of global ocean synthesis products
Annual cost US$1–10 million

GCOS 2016 Implementation Plan
- 120 -
situ effort; there has been limited progress in the establishment of national ocean or climate
institutions tasked with sustaining a climate-quality ocean observing system.
The in situ observations of the ocean are implemented by formal and informal collaborations, as no
nation has a mandated responsibility for monitoring any particular region. The primary agents for
Implementation for in situ ocean observations and their analysis remain national and regional
research organizations, with their project-time-scale focus and emphasis on principal investigator-
driven activities. There are a relatively small number of nations who engage in the implementation
of global-scale sustained ocean observations and the coordinated observing networks are
encouraging new nations to join the sustained observing enterprise to reduce key dependencies and
risk. The regular reporting by Parties to the UNFCCC on systematic observation, which includes
national institutional arrangements and ocean observation activities, should be encouraged and
utilized to assess progress in national action.
The GCOS-GOOS-WCRP OOPC, in collaboration with the broader GOOS, its expert panels and regional
alliances, along with JCOMM, provides oversight and,in collaboration with research programmes,
monitoring and assessment of the evolving system and its products. The system must be responsive
to the needs of the UNFCCC but, at the same time exploit synergy and efficiencies with other users of
the observing system.
Action O5: Sustained support for ocean observations
4.1.7 Global-scale observation capabilities; scientific and technological challenges
New or improved ocean-observing satellites and in situ sensors and platforms, coupled with
advances in telecommunications, are continuously becoming available for improving the sustained
ocean climate observation system. Satellites move continually towards becoming higher resolution in
space and time, with constellation-based planning enabling diurnal temporal resolution. During the
last decade, the use of autonomous in situ platforms has revolutionized the ocean observing system,
and the fast technological advance on platforms and sensors (primarily biogeochemical sensors) will
continue to improve the system. A critical challenge is to advance technologies for the observation
of life in the ocean, including the diversity of life, abundance and distribution and how this changes
over time. Also, communications systems are under development to enable us to obtain data in real
time from remote regions, such as the deep ocean (using data pods) and under the ice (using
acoustics). In order to assure the calibration and validation for production of climate-quality data
Action Strengthen funding of the ocean observing system to move towards a more sustained long-term
funding structure and broaden support by engaging more agencies and nations in sustained ocean
observing through capacity building
Benefit A more resilient observing system that is less exposed to changes in national research priorities.
Timeframe 2026
Who Parties’ national research programmes, funding streams and operational agencies, capacity building
through the Partnership for Observations of the Global Ocean (POGO).
Performance
indicator
Observing system performance indicators continuously at or above 90%, increasing number of agencies
and nations contributing to sustained observing.
Annual cost US$30–100 million

GCOS 2016 Implementation Plan
- 121 -
and data products from satellite and in situ autonomous platforms, an integrated approach with the
mooring and ship-based reference network is necessary. Research programmes are currently the
primary source of funding for developing new methods and technologies.
Continued strong support is needed to develop and bring new technology to the pilot stage, and
eventually to a mature stage for implementation as a component of the sustained ocean climate
observing system. It is also important that developments in both satellite and in situ technology are
seen holistically, so that we can ensure we optimize the benefits of both, i.e. next-generation in situ
observations enable us to capitalize on next-generation satellites. Given the changes in observing
capability and understanding of requirements, it is important that a process is in place to provide an
ongoing evaluation of the observing system and the extent to which it meets requirements. GOOS is
developing detailed specifications for each Essential Ocean Variable (EOV), focused on the
phenomena to capture, which will be used as a basis of evaluations. Complementary network
specifications, which articulate network missions and targets, have been used to develop actions in
this publication. Existing and planned observing system development projects are injecting new
design thinking (including observing system/simulation experiments) into the observing system at a
regional or thematic level; the outcomes of these projects are expected to feed into the next GCOS
Implementation Plan (~2022).
Action O7: Observing system development and evaluation
Action O6: Technology development
Action Continued support for development of satellite capabilities, autonomous platforms and climate-quality
sensors, from pilot phase to mature stage
Benefit Continued improvements to the sustained observing system to fill gaps, take new measurements, at
lower cost per observation.
Time frame Continuous
Who National research programmes supported by the GOOS expert panels, CEOS Constellations Teams,
JCOMM OCG and user groups.
Performance
indicator
Amount of climate-quality data provided in near-real time to internationally agreed data centres
Annual cost US$ 10–30 million
Action Support and engage in systems-based observing system development projects established through
GOOS as detailed in this Plan and efforts for the ongoing evaluation of the observing system
Benefit Continued improvements to the sustained observing system ensure it is robust, integrated and meets
future needs.
Time frame Continuous
Who National research programmes supported by GOOS expert panels and regional alliances
Performance
indicator
Periodic evaluation of observing system against requirements and expansion of support for sustained
observations
Annual cost US$ 100 000–1 million (mainly to Annex I Parties).

GCOS 2016 Implementation Plan
- 122 -
4.2 Oceanic domain: physical
4.2.1 General
Sustained in situ and satellite observations of ocean physical parameters are required to answer
fundamental questions concerning the role of ocean physics on climate and vice versa. Sampling
resolution requirements of the physical ocean observations extend from hourly to monthly, 1 km to
500 km and vertical resolution of 5 m to 500 m. The broad temporal, horizontal and vertical
observational scale requirements dictate the need for the requirement of diverse observational
techniques and platforms. ECV requirements and based actions are identified in this section, whereas
specific network/satellite constellations and associated actions can be found in section 4.5.
4.2.2 Oceanic physical ECVs
ECV – Temperature - surface and subsurface
Ocean temperature has two associated ECVs: Sea-surface temperature (SST) and Subsurface ocean
temperature. Both SST and subsurface temperature measurements have shown to provide a means
to monitor and detect climate variability and change. Ocean temperature observations (SST and
subsurface temperature) are required for detection and attribution studies of ocean heat content
and sea-level rise.
Sea-surface temperature is a vital component of the climate system as it exerts a major influence on
the exchanges of energy, momentum and gases (including carbon) between the ocean and
atmosphere, and largely governs the atmospheric response to the ocean. Its gradients are coupled
with atmospheric weather patterns (each influencing the other), influencing atmospheric density and
pressure gradients. As large daily variations in SST alter the surface energy budget over the tropics
and subtropics, SST and horizontal gradients in SST are also important for coupling with the
atmosphere for accurate NWP and subseasonal to seasonal prediction timescales. The spatial
patterns of SST reveal the structure of the underlying ocean dynamics, such as ocean fronts, eddies,
coastal upwelling and exchanges between the coastal shelf and open ocean.
Subsurface temperature is required for climate detection and attribution studies of ocean heat
content and sea level and sea-level change. The global (subsurface) ocean has sequestered more
than 93% of the excess heat trapped in the Earth system in the past few decades, of which 74% is
stored in the upper 2 000 m and 19% in the abyssal ocean beneath 2 000 m. The ocean heat uptake
has led to an increase in the global ocean volume through thermal expansion and thus to a global
mean sea-level rise (about one third of the global mean sea-level rise observed in the past few
decades). Subsurface ocean temperature is a fundamental observation for many ocean phenomena
that influence climate, including ocean stratification, circulation, mixed layer, water mass and coastal
shelf–open ocean exchange.
Both SST and subsurface ocean temperature have long recorded histories over the observational
record period. In the past 30 years, near-global sampling of SST has become available on a daily to
weekly basis due to the advent of infrared and microwave radiometers on polar-orbiting satellites
and infrared radiometers on geosynchronous satellites. A gap in future microwave missions in
particular needs addressing. In situ SST observations are an important requirement for the validation

GCOS 2016 Implementation Plan
- 123 -
and calibration of satellite-based measurements and in regions where satellite observations are
limited or have large biases from sampling errors, for example in cloudy and heavy precipitation
regions.
The provision of the ongoing requirement for satellite SST products from a variety of satellite
missions and sensors is articulated in section 4.5.1.
Subsurface temperature is measured over large spatial and temporal scales. Moorings and gliders
provide temperature observations, at specific locations, at hourly resolution and at less than 50 km
resolution in boundary currents and in other highly variable oceanic environments. Ship-based
conductivity-temperature-depth (CTD) observations provided full-depth temperature observations
from boundary current scale to basin scale, depending on horizontal resolutions and tracks of
research voyages. Floats and other autonomous platforms provide temperature profiles, nominally
0-2 000 m using a globally distributed network, providing monthly to annually global maps of
temperature distribution. Cable-based observations are now being used at selected sites.
Action O8: Satellite sea-surface temperature product development
Action O9: Upper-ocean temperature observing system
Action Continue the provision of best possible SST fields based on a continuous coverage mix of polar orbiting
(including dual view) and geostationary IR measurements, combined with passive MW coverage, and
appropriate linkage with the comprehensive in situ networks
Benefit Global routine calibrated mapping of SST for climate monitoring and weather and subseasonal to
seasonal prediction systems
Time frame Continuous
Who Space agencies, coordinated through Global High Resolution Sea Surface Temperature Project
(GHRSST), CEOS, CGMS and WMO Space Programme
Performance
indicator
Agreement of plans for maintaining a CEOS Virtual Constellation for SST, ongoing satellite operation,
routine delivery of SST products
Annual cost US$ 1–10 million
Action Maintain a global upper ocean (0-2 000 m) temperature observing system for the assessment of ocean
temperature and heat content change and its contribution to sea-level rise
Benefit High-quality ocean temperature time series for accurate estimates of annual ocean heat storage as a
function of depth and its spatial distribution to assess the role on the ocean in the Earth’s energy
balance and ocean warming contribution to sea-level change
Time frame Continuous
Who Parties’ national agencies working with GOOS observational networks (Drifters, CEOS, Argo, SOOP,
OceanSITES), in cooperation with the Observations Coordination Group of JCOMM.
Performance
indicator
Spatial coverage, interoperability of observations platforms, annually updated global upper-ocean
temperature records
Annual cost US$ 30–100 million

GCOS 2016 Implementation Plan
- 124 -
Action O10: Full-depth temperature observing system
Action Develop and begin implementation of a full-depth ocean temperature observing system to support the
decadal global assessment of the total ocean heat content and thermosteric sea-level rise
Benefit High-quality, deep-ocean temperature time series for accurate estimates of biennial to decadal ocean
heat storage below 2 000 m and its spatial distribution to assess the role of the ocean in the Earths
energy balance and ocean-warming contribution to sea-level change
Time frame Observational system in place by 2026
Who Parties, national agencies working with GOOS observational networks (Argo, GO-SHIP, OceanSITES), in
cooperation with the JCOMM Observations Coordination Group
Performance
indicator
Design study completed and targeted implementation begun; spatial coverage, interoperability of
observations platforms
Annual cost US$ 30–100 million
ECV – Salinity: surface and subsurface
Ocean salinity has two associated ECVs: sea-surface salinity (SSS) and subsurface ocean salinity.
Surface and subsurface salinity observations are required to understand the ocean’s role in the
global water cycle and to further quantify changes in the hydrological cycle in response to
anthropogenic climate change.
SSS observations are a key parameter for monitoring the global water cycle (evaporation,
precipitation and glacier and river runoff). On large scales, surface salinity can be used to infer long-
term changes of the global hydrological cycle. Surface salinity, together with surface temperature
and air–sea fluxes (heat and momentum (wind)) can be used to determine the evolution of the
surface expression of fine- to large-scale ocean frontal features and eddies.
Subsurface salinity, along with coincident subsurface temperature and velocity observations, are
required to calculate in situ density and ocean freshwater transports, respectively, and coincident
subsurface observations of salinity, temperature and pressure provide an estimate of the ocean
geostrophic velocity. In addition, subsurface salinity, together with temperature and pressure and
satellite surface observations of SST, SSS and sea-surface height (SSH) are used to derive large-scale
gridded climate products, including ocean velocity, mixed-layer depth, density stratification, sea level
and indirect subsurface ocean mixing used in many weather and climate applications.
Sea-surface salinity is observed from space by satellites and in situ by water intake from research and
commercial ships, autonomous floats and drifters and unmanned surface vehicles. Satellite SSS
provides global coverage, including marginal seas and coastal oceans and better spatiotemporal
sampling of the in situ observation network. In situ, near-surface observations are an important in
situ validation and calibration of satellite observations of SSS. The recent advances in the provision
of reliable SSS observations from satellites need to maintained.
Subsurface salinity is observed using moorings and gliders, at specific locations, provide observations
at high temporal and small spatial scales in boundary currents and in other highly variable oceanic
environments. Floats and other autonomous platforms provide salinity profiles, nominally 0–2 000
m using a globally distributed network, providing monthly to annually global maps of salinity
distribution. Ship-based CTD observations provide full-depth salinity observations from boundary-
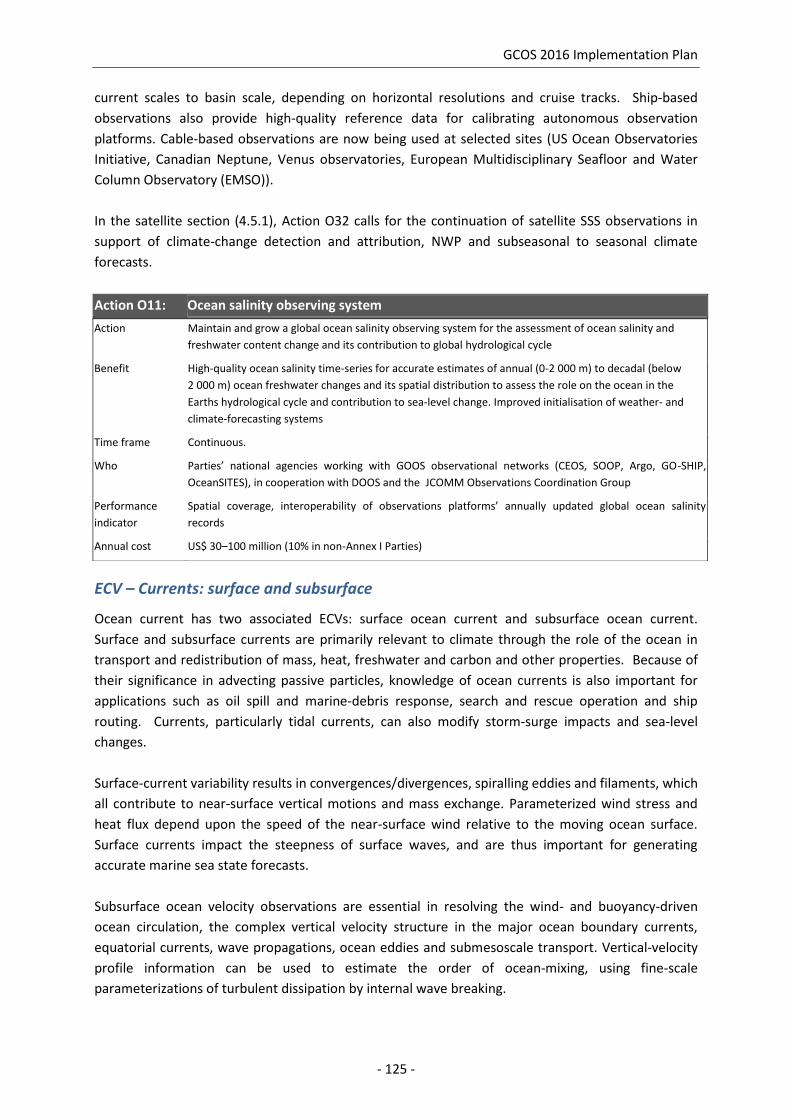
GCOS 2016 Implementation Plan
- 125 -
current scales to basin scale, depending on horizontal resolutions and cruise tracks. Ship-based
observations also provide high-quality reference data for calibrating autonomous observation
platforms. Cable-based observations are now being used at selected sites (US Ocean Observatories
Initiative, Canadian Neptune, Venus observatories, European Multidisciplinary Seafloor and Water
Column Observatory (EMSO)).
In the satellite section (4.5.1), Action O32 calls for the continuation of satellite SSS observations in
support of climate-change detection and attribution, NWP and subseasonal to seasonal climate
forecasts.
Action O11: Ocean salinity observing system
ECV – Currents: surface and subsurface
Ocean current has two associated ECVs: surface ocean current and subsurface ocean current.
Surface and subsurface currents are primarily relevant to climate through the role of the ocean in
transport and redistribution of mass, heat, freshwater and carbon and other properties. Because of
their significance in advecting passive particles, knowledge of ocean currents is also important for
applications such as oil spill and marine-debris response, search and rescue operation and ship
routing. Currents, particularly tidal currents, can also modify storm-surge impacts and sea-level
changes.
Surface-current variability results in convergences/divergences, spiralling eddies and filaments, which
all contribute to near-surface vertical motions and mass exchange. Parameterized wind stress and
heat flux depend upon the speed of the near-surface wind relative to the moving ocean surface.
Surface currents impact the steepness of surface waves, and are thus important for generating
accurate marine sea state forecasts.
Subsurface ocean velocity observations are essential in resolving the wind- and buoyancy-driven
ocean circulation, the complex vertical velocity structure in the major ocean boundary currents,
equatorial currents, wave propagations, ocean eddies and submesoscale transport. Vertical-velocity
profile information can be used to estimate the order of ocean-mixing, using fine-scale
parameterizations of turbulent dissipation by internal wave breaking.
Action Maintain and grow a global ocean salinity observing system for the assessment of ocean salinity and
freshwater content change and its contribution to global hydrological cycle
Benefit High-quality ocean salinity time-series for accurate estimates of annual (0-2 000 m) to decadal (below
2 000 m) ocean freshwater changes and its spatial distribution to assess the role on the ocean in the
Earths hydrological cycle and contribution to sea-level change. Improved initialisation of weather- and
climate-forecasting systems
Time frame Continuous.
Who Parties’ national agencies working with GOOS observational networks (CEOS, SOOP, Argo, GO-SHIP,
OceanSITES), in cooperation with DOOS and the JCOMM Observations Coordination Group
Performance
indicator
Spatial coverage, interoperability of observations platforms’ annually updated global ocean salinity
records
Annual cost US$ 30–100 million (10% in non-Annex I Parties)
GCOS 2016 Implementation Plan
- 126 -
The existing surface current observations include moorings and land-based HF-radars are local,
frequent, but limited in coverage. Surface geostrophic currents at global scale are derived from
Lagrangian drifting buoys and the combination of satellite altimeter and gravity data. Drifters give
fast timescales (hourly observations) but with irregular coverage at any time. Satellite-based
synthetic aperture radiometry (SAR) interferometry and range Doppler shift have recently
demonstrated the capability to detect the surface current.
Subsurface velocity observations are obtained via direct measurements of the ocean velocity or
indirectly from observations of temperature, salinity and pressure using geostrophic approximation.
Subsurface boundary currents, equatorial currents and other constrained intense currents are
observed directly using moored Acoustic Doppler Current Profilers (ADCP) at hourly time resolutions.
Gliders, using similar techniques, are beginning to be used for monitoring boundary currents and
ocean eddies. Shipboard ADCP and lowered ADCP provide surface and subsurface current data from
boundary current scale to basin scale, depending on horizontal resolutions and tracks of research
voyages. While the vertical shear of the component of horizontal velocity perpendicular to each
station pair of a hydrographic section is straightforward to calculate from geostrophy, determining
the absolute velocity field to sufficient accuracy for transport estimates is more problematic.
Lagrangian subsurface current measurements nominally at 1 000 dbar (100 bars), estimated from
Argo drifting profiling floats provide estimates of velocities at 1 000 m and the sea surface. These
can be combined with other ocean current observations to obtain gridded basin-scale full-depth
absolute velocity estimates.
Action O12: Ocean current gridded products
ECV – Sea-surface height
Global mean sea-level change provides a measure of the net change in ocean mass due to the
melting of glaciers and ice sheets, changes in terrestrial water resources, as well as net change in
ocean volume due to thermal expansion. The rise of sea level over the past century is known from
tide gauges to be around 1.7 +/-0.4 mm/yr. Data acquired since 1991 from the ERS-1,
TOPEX/POSEIDON, ERS-2, GFO, ENVISAT and Jason satellite radar altimeters have provided an
uninterrupted view of sea level on a global scale and reveal a global average trend estimated at 3.3
+/-0.5 mm/yr. SENTINEL-3 and Jason series will jointly continue those multi-satellite measurements.
New, high-resolution technology will be tested with NASA’s Swath Altimeter, Surface Water and
Ocean Topography (SWOT) mission (due for launch after 2020). SWOT will provide sufficient spatial
Action Maintain gridded ocean-surface and subsurface current products based on satellite, drifting-buoy and
Argo programsme, other observations and data-assimilating models
Benefit High-quality ocean-current observations for climate services and marine operational systems
Time frame Continuous
Who Parties’ national agencies working with CEOS, GOOS observational networks (SOOP, Argo, GO-SHIP,
OceanSITES, Drifters) in cooperation with the JCOMM Observations Coordination Group, Godea
OceanView and reanalysis projects
Performance
indicator
Spatial coverage, interoperability of observation platforms
Annual cost US$ 1–10 million (10% in non-Annex I Parties)

GCOS 2016 Implementation Plan
- 127 -
resolution, but insufficient temporal resolution to monitor eddy variability; will also be useful for
applications on the coast.
Global mean sea level is being measured through satellite altimetry which is a geometric
measurement of the shape of the surface relative to a reference ellipsoid. Satellite gravity
measurements are required to disaggregate sea level into changes of the ocean mass and thermal
expansion. They are also required to obtain the oceanic geoid, which is a gravitational equipotential
surface that represents the shape the ocean surface would take if it were at rest and at a standard
uniform density. The difference between the geoid and the altimetric measurements represent the
ocean circulation and changes thereof. Continued satellite gravity missions are required to extract
optimum information from altimeter data, including ocean circulation (see action G32).
Global Sea Level Observing System (GLOSS) water-level gauges measure sea level at coastlines
relative to local fixed datum or, if they are equipped with GNSS/GPS positioning, relative to the
centre of the Earth. In situ GLOSS provide calibration and validation data to complement satellite
observations. In addition, GLOSS monitors multi-decadal trends in local relative sea-level rise and
helps reconcile the sea-level signal associated with crustal displacements.
Action O31 calls for the continuous coverage from one higher-precision, medium-inclination
altimeter and two medium-precision, higher-inclination altimeters for the global routine calibrated
mapping of SSH from satellites. This action also calls for an appropriate intercalibration period
between different satellite missions.
Action O13: Sea-level observations
ECV – Sea state
Observations of sea state are required for estimates of wave and swell and air–sea fluxes. Sea state
is best known for its impacts on marine safety and transport, coastal erosion and damage to coastal
and offshore infrastructure. It is also a substantial modifier of air–sea exchanges of momentum,
kinetic energy, moisture and gases. Waves also impact beach erosion, storm-related water damage
(waves are added to storm surge), surface albedo and transport of surface particles, including larvae
and contaminants, such as oil. Waves can also modify the growth or decay of sea ice.
Sea state is typically observed locally from moored buoys and global coverage is provided by satellite
altimeters; SAR (from which a global archive of directional swell-wave spectra has been developed);
some wave information can also be inferred from coastal radar, some coastal stations and specialized
Action Maintain and develop a global sea-surface-height observing system from observational and satellite
networks for annual assessment of sea level and sea-level rise
Benefit Quality control and accurate global sea level and regional sea-level variability dataset
Time frame Continuous
Who Parties’ national agencies working with CEOS, GOOS observational networks (e.g. GLOSS), in
cooperation with the JCOMM Observations Coordination Group
Performance
indicator
Spatial coverage, interoperability of observations platforms, annually updated global sea-level data
Annual cost US$ 30–100 million

GCOS 2016 Implementation Plan
- 128 -
drifting buoys; and observations are provided from some VOSs and oil platforms. Most moored
buoys measuring waves are located in the coastal margins of North America, Europe and Australia;
other than at the Australian coast, wave measurements in the southern hemisphere are sparse.
Waves are recorded on only two of the buoys measuring eddy-covariance fluxes. Current in situ
reports are not standardized, resulting in impaired utility. As a priority, the high quality in situ
network is to ensure that “enough” observations are available to calibrate the wave models and
validate wave climatologies.
As stated, sea state is being measured as significant wave height by satellite altimeters. Action O33
calls for the improved delivery and quality of sea-state fields, based on satellite missions with
calibration and validation from the in situ networks.
Action O14: Contributing to sea-state climatologies
ECV – Sea-ice
Sea-ice variability is a key indicator of climate variability and change in the polar regions. The
primary parameters that define the state of sea ice include: concentration, area and extent, ice type,
motion, deformation, age, thickness and volume. The presence of sea ice strongly modifies surface
waves and air–sea exchanges of heat, momentum, moisture and gases. Sea ice also has a distinct
influence on the Earth’s albedo. In addition, the water masses and properties below the sea ice are
transformed through freezing and melting.
Passive microwave satellite sensors have been providing essential sea-ice extent, area and
concentration data since 1979. Automatic sea-ice classification algorithms have been taken forward
by utilization of dual polarization SAR (e.g. from ENVISAT and Radarsat) and scatterometer
backscatter since the beginning of the century. Sea-ice freeboard measurements from satellites have
been achieved using radar and laser altimetry since the 1990s. For both types of sensor, however,
estimates of snow depth and snow and sea-ice densities are needed to convert the freeboard height
into sea-ice thickness but this information is not available from satellites. Satellite passive
microwave L-band measurements used for ocean-salinity measurements (e.g. Soil Moisture and
Ocean Salinity (SMOS)) have been shown to be valuable in measuring the thickness of thin sea ice (<
0.5 m) but the continuity is not assured (see action O32). On-ice, in situ observations and subsurface
observations are currently very sparse and must be improved. This is needed to provide accurate
and reliable estimates of sea-ice thickness and hence volume. It is also essential to produce satellite-
based surface albedo for sea-ice covered area. As the albedo of sea ice cannot be derived solely on
Action Maintain and improve the global sea-state observing system from the observational networks to inform
wave models/climatologies for assessment of wave climate, its trend and variability and contribution to
extremes of sea level; expand observations on surface-reference moorings and drifters
Benefit Routine observations of wave climate and extremes in support of marine/climate services
Time frame Continuous
Who Parties’ national agencies coordinated through GOOS, OOPC, GRAs, OceanSITES, DBCP, guidance from the
JCOMM Expert Team on Waves and Coastal Hazard Forecasting Systems (ETWCH)
Performance
indicator
Number of global wave observations available routinely at International Data Centres.
Annual cost US$ 1–10 million

GCOS 2016 Implementation Plan
- 129 -
the basis of the sea-ice concentration, it is essential to produce satellite-based surface albedo also
for the sea-ice covered area, not only land area.
In the Satellite section (4.5.1), O35 calls for sustained satellite-based sea-ice products and ongoing
high-inclination satellite altimetry.
Action O15: In situ sea-ice observations
ECV – Ocean surface stress
Ocean surface stress is the two-dimensional vector drag at the bottom of the atmosphere and the
dynamical forcing at the top of the ocean. It influences the air–sea exchange of energy, water
(evaporation) and gases. Ocean surface stress vector components (u and v) are important for
determining the large-scale momentum forcing of the ocean and consequent ocean circulation,
including ocean upwelling regions. Accurate knowledge of stress magnitudes is also essential for
reliable computations of air–sea heat fluxes (e.g. sensible and latent heat fluxes) as well as air–sea
gas exchanges and mass fluxes (e.g. CO2 and freshwater). Stress is also coupled with surface waves
and is essential for marine safety.
Stress is measured directly using the covariance method as described in the section “ECV - Ocean
surface heat flux” section for sensible- and latent-heat flux. Direct measurements of the surface
wind stress are being made on buoys and ships at a limited number of locations, using fast-response,
three-dimensional wind sensors. These data, together with the observations needed to correct for
platform motion caused by the surface waves, allow direct computation of the covariance between
vertical and horizontal wind fluctuations and thus of the vertical flux of momentum. These direct
measurements of the turbulent fluxes are referred to as eddy covariance or direct flux
measurements. The common method of obtaining fluxes from mean parameters (e.g. wind speed)
and a bulk formula is an indirect estimate only and relies on the accuracy of the bulk formula chosen.
These bulk formulae are tuned against the direct covariance method and perform well in moderate
conditions, with more tuning and improvement needed in low and high winds and high sea states.
Satellite observations of OSS are often converted to wind-like variables that have been shown to
have a large impact on atmospheric weather forecast models. Stress can be linked to upper-ocean
mixing.
Action Plan, establish and sustain systematic in situ observations from sea ice, buoys, visual surveys (SOOP and
aircraft) and in-water upward-looking Sonar (ULS)
Benefit Long time series for validations of satellite data and model fields; short- and long-term forecasting of
sea-ice conditions; ocean-atmosphere-sea ice interaction and process studies
Time frame Integrated Arctic Observing System design and demonstration project funded by EU for
2017–2020
Who National and international services and research programmes, Copernicus; coordination through Arctic
Council, EU-PolarNET, Arctic-ROOS (in EuroGOOS), CLIVAR, CLIC, JCOMM, OOPC
Performance
indicator
Establishment of agreement and frameworks for coordination and implementation of sustained Arctic
(EU-PolarNet and Arctic-ROOS, which will be extended with the new funded project (see time frame))
and Southern Ocean observations (SOOS)
Annual cost US$ 30–100 million

GCOS 2016 Implementation Plan
- 130 -
In section 4.5.1, O34 calls for the improved delivery and quality of sea-surface fields, based on
satellite missions with in situ networks.
Action O16: Ocean-surface stress observations
ECV – Ocean-surface heat flux
Surface-heat flux is the exchange of heat, per unit area, crossing the surface between the ocean and
the atmosphere. It consists of the turbulent (latent and sensible) and the radiative (short- and
longwave) components. These fluxes are major contributors to the energy and moisture budgets and
are largely responsible for the thermodynamic coupling of the ocean and atmosphere at global and
regional scales; the variability of these fluxes is in part related to large-scale variability in weather
(climate) patterns. For most regions, the two major components are the net short-wave gain by the
ocean and the latent-heat-flux loss by the ocean.
Net heat flux is generally considered to be the sum at the sea surface of the net short-wave or visible
radiation, the net long-wave or infrared radiation, the latent or evaporative heat flux, and the
sensible heat flux. In some cases, the cooling due to rainfall falling at the dew-point temperature is
also added. Incoming short- and long-wave radiation is measured by radiometers, with the reflected
and outgoing components estimated by formulae. Latent and sensible heat flux, like wind stress, can
be measured directly by three-dimensional anemometry and fast-response sensors that support the
computation of the covariance between vertical velocity fluctuations in the wind and temperature
(sensible) and humidity (latent) fluctuations.
Bulk formulae for sensible-heat flux require the near-surface wind speed and air temperature at
known heights and SST; the bulk formulae for latent heat flux require near surface-wind speed and
specific humidity at known heights and the surface saturation specific humidity. Barometric
pressure, and SSS are also used in the computation of latent heat flux by the bulk formulae. Typically,
a buoy or ship equipped to observe fluxes by the bulk formulae method has an anemometer, an air-
temperature sensor, a humidity sensor, a barometric pressure sensor, a sea-surface or near-surface
ocean temperature and salinity sensor. A short- and a long-wave radiometer are needed to obtain
the radiative fluxes.
The downwelling components of the visible (short)- and infrared (long-)wave radiative fluxes are
measured directly by radiometers, with the reflected and outgoing radiative fluxes parameterized by
formulae. The turbulent heat-flux components, the sensible and latent heat fluxes, are measured by
covariance methods but also can be estimated using the bulk method. The bulk parameterizations
are tuned against covariance flux observations and are now accurate in the range of conditions over
Action Develop requirements and review system design (satellite and in situ) for observing OSS ECV and
commence implementation
Benefit Agreed plan for design of surface-stress observing system to improve ocean-surface-stress products
Time frame Internationally agreed plans published and establish GDACs by 2019
Who CEOS and in situ networks
Performance
indicator
Publication of internationally agreed plans, establishment of agreements/frameworks for coordination
according to plan
Annual cost US$ 100 000–1 million

GCOS 2016 Implementation Plan
- 131 -
which this tuning has been accomplished. The bulk method uses simpler, less expensive and more
robust systems at sea that can function well on unattended platforms for long periods. Bulk
formulae are also used with surface meteorological fields from models and remote-sensing methods
and in this case yield spatial, as well as temporal, coverage.
Direct measurements of the sensible and latent heat flux are being made on buoys and ships at a
very limited number of locations, using fast-response, three-dimensional wind sensors, together with
fast-response air-temperature and humidity sensors. These sensors, together with the observations
needed to correct for platform motion, allow direct computation of the covariance between vertical
wind fluctuations and temperature and humidity fluctuations and thus of the vertical fluxes of
temperature and humidity. These direct measurements of sensible- and latent heat flux are referred
to as eddy covariance or direct covariance flux methods.
Direct covariance flux systems are now being deployed on select long-term observing sites.
Examples are the Irminger Sea surface mooring and the Southern Ocean surface mooring in the
South Pacific of the US National Science Foundation’s Ocean Observatories Initiative. These sites are
planned for an occupation of 20-25 years with annual service. These systems have, in particular,
targeted areas in which there are extreme wind and sea-state conditions and, hence, in which the
bulk formulae have not yet been tuned and verified.
Action O17: Ocean-surface heat-flux observing system
4.3 Oceanic domain: biogeochemistry
4.3.1 General
The ocean biogeochemistry ECVs have been harmonized with the EOVs as defined by GOOS: these
have been agreed on through expert workshops and community consultations over the past few
years, drawing on the framework for ocean observing. Changes include condensing the ECVs Carbon
dioxide partial pressure and Ocean acidity in the surfaceand subsurface domains into one
ECV – Inorganic carbon, due to the strong interconnection between the measurable variables of the
carbonate system. It also involves adding nitrous oxide as an ECV due to the significant flux from the
ocean to the atmosphere of this potent greenhouse gas.
Action Develop requirements and system design for observing Ocean surface heat flux ECV (utilizing indirect
and direct methods) and commence implementation
Benefit Agreed plan for high-quality heat-flux data required to improve surface flux products
Time frame Complete programme design and begin implementation of observational system by 2019
Who GOOS observational networks (CEOS, OceanSITES, SOOP), in cooperation with the JCOMM Observations
Coordination Group
Performance
indicator
Publication of observing network plan; spatial coverage, interoperability of observation platforms
Annual cost US$ 10–30 million

GCOS 2016 Implementation Plan
- 132 -
4.3.2 Ocean biogeochemistry ECVs
ECV – Inorganic carbon
The ocean is a major component of the global carbon cycle, exchanging massive quantities of carbon
in natural cycles driven by the ocean circulation and biogeochemistry. Since seawater has high
capacity for absorbing carbon, the ocean is also a significant modulator of the rate of accumulation
of carbon dioxide in the atmosphere. The net carbon uptake of the ocean amounts to approximately
25% of each year’s total anthropogenic emissions and the ocean has sequestered ~30% of the
cumulative anthropogenic emissions since 1850. Because the net ocean carbon uptake depends on
chemical and biological activity, it may change as oceanic conditions change (pH, currents,
temperature, surface winds, and biological productivity). Due to the chemistry of the inorganic
carbon in water, this uptake is causing a decline in ocean pH, also known as ocean acidification. The
ecological consequences of ocean acidification are a focus for much of current research.
The observations required to constrain the inorganic carbon system at a point in space and time are
measurements of any two of: dissolved inorganic carbon, total alkalinity, pCO2 or pH, together with
associated physical variables (temperature, pressure and salinity). If two inorganic carbon variables
are measured, the others can be calculated based on carbonate equilibrium reactions and constants.
The inorganic carbon system is variable in time and space, such that high-accuracy observations will
continue to be required to characterize changes in the ocean inorganic carbon. Although ocean
inorganic carbon is one single ECV, the sampling strategy for the three main phenomena addressed
(air–sea flux of CO2, subsurface ocean storage of CO2, and ocean acidification) require slightly
different approaches. These are discussed below.
Surface ocean partial pressure of CO2
The surface ocean partial pressure of CO2, pCO2, is a critical parameter of the oceanic inorganic
carbon system because: (a) it determines the magnitude and direction of the exchange of CO2
between ocean and atmosphere on annual and shorter timescales; and (b) it is a good indicator for
changes in the upper-ocean carbon cycle. In addition, it is an oceanic parameter that is routinely
measured with high accuracy. The first measurements of pCO2 were made in the early 1960s, and
the sampling network has grown substantially since then. Although recent efforts to coordinate the
surface ocean pCO2 observations have been undertaken, largely led by the international Ocean
Carbon Coordination Project (IOCCP), many efforts are still driven by single or small groups of
investigators. The international network of surface pCO2 observations is developing and expanding,
although still sparse so that large areas of the ocean have never been sampled and the seasonal cycle
has only been observed in parts. New, easier-to-handle technology based on sensors rather than
instruments are being tested and deployed, expanding the capacities. Current network activities
include: SOOP CO2, of which several are doing full trans-basin sections and surface, moored time-
series stations. Deployments of automated drift buoys and unmanned surface vehicles show promise
but currently do not routinely produce climate quality data.
Surface ocean pCO2 data are being synthesized and quality controlled for annual releases of a
coherent database: the Surface Ocean CO2 Atlas (SOCAT) that provides the basis for estimating the
air-sea fluxes of CO2. To determine the flux from air-water partial pressure (or fugacity) differences,
the kinetic driving force (or gas transfer velocity) needs to be determined. Gas transfer is controlled
GCOS 2016 Implementation Plan
- 133 -
by interfacial transport processes and is often related to wind speed. Accurate wind speed and other
parameters that can be obtained at global scales from satellite sensors, such as whitecap coverage
and surface roughness, are an essential component to determined fluxes.
Recent efforts have made significant progress in using pCO2 and auxiliary data, such as satellite-
derived SST and salinity data, for objective mapping routines and interpolation techniques to
translate sparse pCO2 data to global scales through the SOCOM intercomparison project. The
observations are not sufficient to resolve global year-to-year variations, however, hence the
observation system needs to be further developed for data-constrained flux estimates.
Action O18: Surface ocean partial pressure of CO2 moorings
Subsurface ocean storage of CO2
At present, the community consensus is that the best strategy for observing the long-term
subsurface ocean (anthropogenic) carbon storage is via a global ocean carbon inventory network that
measures the state of the inorganic carbon variables dissolved inorganic carbon (DIC) and total
alkalinity (TA). The backbone of this network is the full-depth repeat hydrography survey programme
the Global Ocean Shipboard Investigations Programme (GO-SHIP). This requires firm commitments
from the participating institutions and nations executing the cruises with the required parameters
and measurement accuracy, along with timely data submission to data centres in order to facilitate
the large-scale synthesis. Subsurface ocean inorganic carbon data are being synthesized and quality-
controlled to a coherent database through the Global Ocean Data Analysis Project (GLODAP) that
provides the basis for estimating the subsurface storage of anthropogenic carbon, and the decadal
change in subsurface ocean inorganic carbon storage. The GLODAP database needs to be updated
frequently, ideally on an annual timescale, to ease climate-relevant estimates.
Results from the repeat survey indicate that the level of variability and decadal changes are higher
than originally expected from coarse resolution models, requiring a re-assessment of whether the
original plan is adequate to fully characterize the decadal time change of the oceanic inventory of
anthropogenic CO2. In addition, the sampling network is inadequate to determine early regional
responses of the oceanic carbon cycle to global climate change.
Long-lived accurate autonomous sensors for the ocean inorganic carbon system that can be deployed
on moored or profiling observing elements are under development and pilot projects are showing
the potential to significantly increase our global observing capability with sensors. A more rapid
repeat cycle for ocean survey sections and/or increased use of profiling and moored sensors will be
needed for assessing the net carbon inventory change over intervals shorter than 10 years.
Action Sustain the surface reference mooring pCO2 network and increase the number of sites to cover all major
biogeochemical regions to resolve seasonal cycle
Benefit Increased information on seasonal and longer variability in key ocean areas
Time frame Continuous
Who IOCCP, in consultation with OOPC; implementation through national services and research programmes
Performance
indicator
Flow of data of adequate quality into SOCAT
Annual cost US$ 1–10 million

GCOS 2016 Implementation Plan
- 134 -
Ocean acidification
The ongoing decrease of the pH of the ocean caused by the uptake of carbon dioxide from the
atmosphere, commonly referred to as ocean acidification, is a growing threat to marine ecosystems,
particularly to marine calcifying organisms, such as corals and calcifying plankton, with potential
feedback to climate. In order to fully characterize this chemical state of the inorganic carbon system,
two inorganic carbon variables need to be measured with high accuracy in order to characterize
important, pH-related parameters, such as the saturation state of the seawater with regard to
CaCO3. High-accuracy, instrument-based measurements have been available for all parameters for
quite some time already and recent developments on autonomous sensors for the carbonate system
are promising, although further developments are needed for these sensors to be accurate enough
to meet the observing requirements on climate relevant scales. Ocean acidification observations are
being coordinated largely by the Global Ocean Acidification Observing Network (GOA-ON) and the
observational strategy is detailed in its Requirements and Governance Plan. Although the
observational network is developing significant data coverage, gaps exist: a global network requires
adequate distribution over all sectors of the world, which is not currently achieved. To attain the
global character of the network, spatial gaps have to be filled. These elements need a globally
consistent design which must also be coordinated and implemented on a regional scale. In some
areas there is a need for significant infusion of resources and infrastructure to build the necessary
capacity. Future actions of GOA-ON include facilitating additional measurement efforts in
underrepresented geographical and sensitive areas, together with associated capacity-building,
strengthening of linkages with experimental and theoretical studies, maintaining and extending
communications with the ocean observing community, establishing effective and quality-controlled
international data management and data sharing, through distributed data centres and encouraging
the development of synthesis products based on GOA-ON measurements. This will require that the
network secures the necessary level of support and resources. The further development of GOA-ON
will require the adoption of advanced new technologies that will reliably provide the community with
the requisite biogeochemical measures necessary to track ocean acidification synoptically.
Action O19: Building multidisciplinary time series
ECV – Oxygen
Oceanic measurements of dissolved oxygen have a long history, and oxygen (O2) is the third-most
frequently measured water quantity after temperature and salinity. Oxygen is an excellent tracer for
ocean circulation and ocean biogeochemistry, but is also essential for all higher life. Because of
Action Add inorganic carbon and basic physical measurements to existing biological timeseries, considering
particularly spatial gaps in current observing system, aiming for balanced representation of the full range
of natural variability
Benefit Improved understanding of the regional effects of ocean acidification
Time frame Continuous
Who Parties’ national research programmes supported by GOA-ON, GOOS Biogeochemistry and Biology and
Ecosystems expert panels.
Performance
indicator
Flow of data of adequate quality to data centres
Annual cost US$ 1–10 million

GCOS 2016 Implementation Plan
- 135 -
technological advances in the last decade, oxygen observations are about to make the same
breakthrough regarding frequency and depth of measurements that temperature and salinity
observations made in this decade by utilizing profiling floats and other autonomous platforms. The
implementation of a full-fledged observatory of oxygen in the ocean is critical to quantify and
understand the observed (mostly) decreasing trends in oxygen concentrations over the last few
decades that have important implications for our understanding of anthropogenic climate change.
Subsurface oxygen concentrations in the ocean everywhere reflect a balance between supply
through circulation and ventilation and consumption by respiratory processes. The absolute amount
of oxygen in a given location is very sensitive to changes in either process and oceanic oxygen has
therefore been proposed as a bellwether indicator of climate change. Moreover, a global ocean O2
observing network can improve the critical atmospheric oxygen to nitrogen ratio (O2/N2) constraint
on the ocean–land partitioning of anthropogenic carbon dioxide.
The classical, discrete method to measure oxygen – the Winkler method –provides very precise
results. In recent years, autonomous sensors have made notable progress and are now regularly
being deployed on autonomous platforms, such as floats and gliders, with sufficient accuracy and
stability for climate observations, particularly if they can be calibrated in air. (See action O38
Biogeochemical Argo.)
ECV – nutrients (phosphate, nitrate, silicic acid)
Nutrients are essential for ocean life. Nutrient data provide important biogeochemical information,
as well as essential links between physical climate variability and ecosystem variability. They can
provide additional information on ocean mixing and climate-related phenomena such as changes in
primary and export production (nutrient transports regulate new production, which is correlated
with export production), eutrophication and shifts in phytoplankton community composition. It is
therefore necessary to develop accurate observations of trends in dissolved nutrients in both upper-
and deep-ocean waters. In order to observe nutrients in a consistent manner, certified reference
materials (CRMs) that have been developed are now commercially available and have proved stable
over long time periods. The GOOS Biogeochemistry panel is working with SCOR working group 147
“Towards comparability of global oceanic nutrient data" to improve nutrients data quality. Nutrient
CRMs are now regularly used on the repeat hydrographic programme and intercomparison exercises
need sustaining.
In addition to the hydrography programme, several sensors that can be used on autonomous
platforms have been developed and are being deployed on profiling floats. These sensors require
further technology development to attain climate quality accuracy. Pilot programmes are deploying
nutrients sensors in order to sample subsurface nutrient variability and to further the technology
readiness level of the sensor-based nutrient observing system.

GCOS 2016 Implementation Plan
- 136 -
Action O20: Nutrient observation standards and best practices
ECV – Transient tracers
Transient tracers are man-made chemical compounds released to the atmosphere in known
quantities that can be used in the ocean to quantify ventilation, transit time distribution (TTD) and
transport timescales. These compounds all have a well-established source function over time at the
ocean surface and are either conserved in seawater, or have well-defined decay-functions.
Measurement of transient tracers in the subsurface ocean thus provides information on the
timescales since the ocean was ventilated, i.e. in contact with the atmosphere. A combination of
these tracers provides the means to constrain the TTD of a water mass that allows inference of
concentrations or fates of other transient compounds, such as anthropogenic carbon or nitrous
oxide. Commonly measured transient tracers are the CFCs 11 and 12. More recently, the related
compound SF6 has been regularly measured, since it provides information on those parts of the
ocean which are rapidly ventilated. The radioactive isotopes 14C and tritium released during tests of
nuclear bombs in the 1950s and 1960s have a known natural decay rate and are also commonly used
as transient tracers.
Ocean tracers are essential for identifying anthropogenic carbon uptake, storage and transport in the
ocean, as well as for understanding multi-year ocean ventilation, long-term mixing and ocean
circulation and for providing validation information for ocean circulation and
climate change models. The ocean inventory of anthropogenic carbon provides the constraint that
allows closure of the global budget of anthropogenic carbon. The net land sink is known only by
difference: land uptake = emissions – ocean accumulation – atmospheric accumulation. Observations
of transient tracers allow for estimation of ocean accumulation of anthropogenic carbon. Ocean-
tracer sampling needs to increase to improve the resolution of the ventilation pathways and changes
thereof. Present technology for the most important tracers requires water samples and subsequent
processing. The primary network contributing to subsurface tracers is the Global Ocean Ship-based
Hydrographic Investigations Programme (GO-SHIP), complemented by research observations.
Action Increase the use of nutrient CRMs on ship-based hydrographic programmes
Benefit Increased accuracy of nutrient measurements
Time frame Continuous
Who IOCCP, in consultation with OOPC; implementation through national services and research programmes;
SCOR working group 147 “Towards comparability of global oceanic nutrient data"
Performance
indicator
Increased consistency of nutrient data
Annual cost US$ 1–10 million

GCOS 2016 Implementation Plan
- 137 -
Action O21: Sustaining tracer observations
ECV – Nitrous oxide
Nitrous oxide (N2O) is an important climate-relevant trace gas in the Earth’s atmosphere. In the
troposphere it acts as a strong greenhouse gas and in the stratosphere as an ozone-depleting
substance because it is the precursor of ozone-depleting nitric oxide radicals. The ocean – including
its coastal areas, such as continental shelves, estuaries and upwelling areas – contribute about 30%
to the atmospheric N2O budget. The amount of N2O produced during water column microbially
mediated processes called nitrification and denitrification strongly depends on the prevailing
dissolved O2 concentrations and is significantly enhanced under low (suboxic) O2 conditions. Thus,
significantly enhanced N2O concentrations are generally found at oxic/suboxic or oxic/anoxic
boundaries. Global maps of N2O in the surface ocean show both enhanced N2O anomalies
(supersaturation of N2O) in coastal and equatorial upwelling regions, as well as N2O near-equilibrium
in large parts of the open ocean.
The MarinE MethanE and NiTrous Oxide (MEMENTO) database (https://memento.geomar.de)
project has been launched with the aim to collect and archive N2O datasets and to provide actual
fields of surface N2O for emission estimates. The current observing network is on the repeat
hydrography programme, as well as research activities. Pilot projects to measure N2O on research
vessels and ships of opportunity are underway.
Action O22: Develop sustained N2O observations
Action Maintain capacity to measure transient tracers on the GO-SHIP network. Encourage technological
development to encompass additional tracers that provide additional information on ventilation.
Benefit Information on ocean ventilation and variability in ventilation
Time frame Continuous
Who IOCCP, in consultation with OOPC; implementation through national services and research programmes
Performance
indicator
Number of high-quality transient tracer measurements on the repeat hydrography programme
Annual cost US$ 1–10 million
Action Develop an observing network for ocean N2O observations, with particular emphasis on regions with
known high oceanic N2O production/emission rates
Benefit Improved estimate of oceanic emissions by improved spatial and temporal coverage; detecting seasonal
and interannual variability
Time frame Continuous
Who IOCCP, in consultation with OOPC; implementation through national services and research programmes,
SCOR WG 143 Dissolved N2O and CH4 measurements: working towards a global network of ocean time
series measurements of N2O and CH4
Performance
indicator
Flow of data of adequate quality into MEMENTO
Annual cost US$ 1–10 million

GCOS 2016 Implementation Plan
- 138 -
ECV – Ocean colour
Ocean-colour radiometers on satellites measure the wavelength-dependent solar energy captured by
an optical sensor looking at the sea surface. These water-leaving radiances, derived from the top-of-
atmosphere (TOA) radiances after atmospheric correction, contain information on the ocean albedo
and the constituents of the seawater, in particular, phytoplankton pigments such as chlorophyll-a.
Data analysis is not easy as satellite measurements also include radiation scattered by the
atmosphere and the ocean surface. The relatively weak water signal is only some 5–15% of the
strength of the TOA radiance measured by satellite. Since the marine ecosystems that respond to
variations in the physical environment are subject to variability at a variety of scales, including
decadal-scale oscillations, multi-decadal observations are essential to distinguish long-term trends
from oscillations with long periods. The multi-scale variability also imposes a requirement for
observations at multiple spatial scales, ranging from less than 1 km to a 1° square.
Only satellites can provide consistent data at such multiple scales and over multiple domains. It is
therefore crucial to continue global Ocean Color Radiance (OCR) satellite observations without
interruption and in a consistent manner for several decades into the future. Attaining consistency
remains a problem; most ocean-colour radiometers that have been available up to now for climate
studies have been experimental or innovative in nature, making it difficult to correct data for inter-
sensor bias before data from multiple sensors are merged to create long time series.
The most important OCR data products currently in use are chlorophyll-a concentration, coloured
dissolved organic matter, particulate organic carbon and total suspended sediments. Other products
have emerged recently, for instance, the structure of phytoplankton community according to its size
classes or functional types. OCR data products are the only measurements related to biological and
biogeochemical processes in the ocean that can be routinely obtained at ocean basin and global
ocean scales. These products are used to assess ocean ecosystem health and productivity and the
role of the oceans in the global carbon cycle, to manage living marine resources, and to quantify the
impacts of climate variability and change. They are also being used increasingly in studies of the heat
budget of the surface layers. OCR products, in particular chlorophyll-a, are also required by the
modelling community for the validation of climate models and for use in data-assimilation systems
for reanalysis and initializing forecasts.
Satellite observations are limited to a surface layer and satellites cannot resolve vertical structure in
the distribution of the ecosystem variables. Enhanced in situ sampling of optical properties,
including ocean colour and other ecosystem variables, is technically feasible and is essential to
reduce this shortcoming. Furthermore, continued and extensive in situ sampling of ecosystem
variables is necessary to improve satellite algorithms and validate products. Use of OCR data for
climate studies requires combining data from multiple sensors to create long-term time-series data
that are internally consistent. It is critically important to develop a new class of sensor of high
radiometric quality that provides high temporal resolution (weekly or better) of critical coastal ocean
and wetland environments at relatively high spatial and high spectral resolution. These sensors will
provide the data required to monitor changes in coastal resources related to both human and
climate-driven changes.
See also Action O36 for the ocean colour satellite constellation.

GCOS 2016 Implementation Plan
- 139 -
Action O23: : In situ ocean colour radiometry data
Action O24: Ocean colour algorithm development
4.4 Oceanic domain: biology/ecosystems
4.4.1 General
As climate changes occur, life within the ocean is affected, with potential consequences for the
valuable services it provides from food to the oxygen we breathe. The ocean is an important net sink
for carbon dioxide released by the burning of fossil fuels and the uptake of carbon dioxide by the
oceanic biota is related directly to the abundance of marine algae. Climate variability significantly
impacts, and will continue to impact, plankton in the ocean, both the microflora
(e.g. phytoplankton) and the microfauna (e.g. zooplankton), over both short (seasonal to interannual)
and long-term (decadal) timescales. Climate changes will also lead to important changes in the
distribution, including the range, of plankton, as well as fish, reptiles, birds and marine mammals.
Phytoplankton abundance or concentration and primary productivity are key quantities related to
both the ocean carbon cycle (including the biological carbon pump) and upper-ocean heating rates.
Changes in abundance and species composition of phytoplankton affect the extent to which solar
radiation is absorbed or reflected by the surface ocean and the associated profile of solar heating
with depth is a key determinant of physical, chemical and biological structure in the upper ocean and
an important feedback mechanism between upper-ocean physics and biology.
Action Continue and improve the generation and maintenance of climate-quality in situ OCR data. Develop new
high-resolution sensors of high radiometric quality suitable for improving satellite algorithms; validating
products; and for characterising product uncertainties, with global coverage and validity (including
coastal (Case-2) waters) and at the temporal and spatial scales required by users.
Benefit Monitoring of changes and variability in ocean colour and derived products
Time frame Implement plan beyond 2017 after completion of ESA’s OC-CCI activities
Who CEOS space agencies, in consultation with IOCCG and GEO through INSITU OCR initiative of IOCCG, and in
accordance with the recommendations contained in the IOCCG INSITU-OCR White Paper (see
http://www.ioccg.org/groups/INSITU-OCR_White-Paper.pdf).
Performance
indicator
Free and open access to up-to-date, multi-sensor global products for climate research; flow of data into
agreed archives
Annual cost US$ 30–100 million
Action Support continued research and technology development to ensure that the best and the most up-to-
date algorithms are used for processing the ocean-colour time-series data in a consistent manner for
climate research; to develop product suites suitable for application across wide ranges of water types,
including coastal water types; to study inter-sensor differences and minimize them before multi-sensor
data are merged; to provide quality assurance and uncertainty characterization of products
Benefit Improved quality of ocean colour products, particularly in coastal waters and complex water types
Time frame Implement plan as accepted by CEOS agencies in 2009
Who CEOS space agencies, in consultation with IOCCG and GEO
Performance
indicator
Improved algorithms for a range of water-property types
Annual cost US$ 100 000–1 million

GCOS 2016 Implementation Plan
- 140 -
Not all ocean life can be monitored everywhere, anytime, nor needs to be. We need continuous,
long-term observations of some essential variables to know if, and how, ocean life is responding to
climate change and is able to predict potential future changes. Time series of observations is the
best method we have to understand the impacts of climate change on the ecology of the ocean.
There are not many biological ocean time series, and in addition, those that do exist are either not
well distributed across the ocean or lack local in situ calibration. In particular, the open ocean is
under observed. At present, there is no global observing system for the pelagic and benthic ecology
of the ocean and despite there being some long-term time series, the magnitude of the climate
impacts on oceanic and coastal ecosystems is not well known.
There are several options that should be considered to resolve this challenge, including towed
samplers (e.g. Continuous Plankton Recorder (CPR)), moored sampling devices and regularly sampled
ship-based stations in addition to ocean colour data from satellite. Extending the sampling on
existing platforms to include biological samples may be one of the most efficient approaches to
support development of biological time series. Expanding use of fisheries data and fishers as
observers or collectors of additional data is another potential mechanism to increase the number
and type of biological time series.
4.4.2 Ocean biology/ecosystems ECVs
ECV – Plankton
Plankton are at the base of the marine food web and generally not fished by humans so that the
impact of climate on them is likely to be both significant and detectable. Changes in the plankton will
have impacts on the rest of the marine ecosystem, including on the carbon cycle, living marine
resources used by humans and threatened marine species, including apex predators. There will be
ecological, socioeconomic and potentially cultural implications.
Phytoplankton
Phytoplankton provide the majority of oceanic primary production and are therefore critical for all
higher trophic levels. Satellite-derived observations can provide information on standing stocks and,
using further algorithms, some estimates of community composition and productivity, or changes in
these properties. Advances in in situ sampling, including flow cytometry, genetic and automated
imaging-based methods, are providing quantitative characterization of the plankton community.
Obtaining data on the full suite of species and abundance from pico-sized organisms to the largest
chain-forming diatoms and dinoflagellates over large spatial scales will be challenging and require
close coordination between the remote-sensing and in situ communities.
Harmful algal-bloom incidence and severity may also be a consequence of climate change. Bloom
events directly impact ecosystem health, human health and food and water security.
A globally coordinated approach to improving the validation of the algorithms and models used to
convert satellite signals to useful products (e.g. phytoplankton biomass, or taxonomic composition) is
needed along with sampling by ships (potentially gliders) in regions where persistent cloud
significantly restricts satellite coverage (including the Satellite Phytoplankton Functional Type (PFT)
Algorithm Intercomparison project). Additional sampling efforts to support regional in situ validation

GCOS 2016 Implementation Plan
- 141 -
and direct observations need to be prioritized for the most poorly sampled regions (central ocean
basins of the Indian, South Pacific and South Atlantic). Vertical profiles of fluorescence would add a
valuable third dimension. Initially, this third dimension could be created from long-term means (e.g.
regional climatologies) but adding fluorometers to existing platforms with subsurface sampling
capability (e.g. profiling floats, CPR, GO-SHIP Repeat Hydrography, OceanSITES time-series sites)
could eventually provide sufficient data to detect significant temporal changes associated with
climate.
Contributing in situ networks and satellite observations include: International Group for Marine
Ecological Time Series (IGMETS, Ocean Colour Radiances observed by satellites, OceanSITES
reference moorings and CPR tows (especially for larger taxa). International coordination of coastal
monitoring sites under the auspices of SCOR Working Group 137 may be continued under IOC.
Action O25: Satellite-based phytoplankton biomass estimates
Zooplankton
The abundance and functional types of zooplankton, their presence or absence or size structure and
the timing of seasonal population growth, are believed to be sensitive to climate. Changes in the
distribution and phenology of zooplankton are faster and greater than those observed for terrestrial
groups and changes in the zooplankton community may be a more sensitive indicator of change than
the underlying physical variables as non-linear responses expressed through short generation times
amplify underlying changes. For instance, CPR data from the North-east Atlantic over the last 50
years show a poleward movement of warm water copepods.
Observation and measurement of zooplankton is standardized quasi-globally, e.g. CPR surveys
through the Global Alliance of CPR Surveys, take place occur in many temperate and polar regions
but are only just beginning in sub-tropical areas. Net tow sampling is conducted in extensive and
long-standing projects by various regional fisheries and oceanography surveys, some of which are
part of regional ocean observing systems. Advances in genomics and more recent digital
technologies for sampling zooplankton also offer the possibility of extending the network of
observations albeit at a local scale (e.g. acoustic and optical methods such as the Zooplankton
Acoustic Profiler, Laser Optical Plankton Counter, Video Plankton Recorder including automated
Action Establish a plan to improve and test regional algorithms to convert satellite observations to water-
column integrated phytoplankton biomass through implementing an in situ phytoplankton monitoring
programme. Estimates of uncertainty should be a standard output associated with improved algorithms.
Wherever possible, a time series of phytoplankton should be collected simultaneously with the
measurement of other important physical and biogeochemical variables.
Benefit Baseline information on plankton
Time frame Implementation build-up to 2020
Who CEOS space agencies, in consultation with IOCCG, including Satellite PFT Intercomparison Project,
parties’ national research agencies, working with SCOR and GOOS
Performance
indicator
Publication of internationally agreed plans; establishment of agreements/frameworks for coordination
of a sustained global phytoplankton observing system with consistent sensors and a focused global
program of in situ calibration implementation according to plan, flow of data into agreed archives,
summary interpreted data products available as well as original data.
Annual cost US$ 100 000–1 million

GCOS 2016 Implementation Plan
- 142 -
imaging). With respect to specific methods/tools, however, there is a need for coordination and
standardization of data for global comparisons and extension to currently undersampled areas and
data assimilation.
Issues to address include the development of standards for species identification and optical
characteristics. The importance of species-level information as a sensitive indicator to climate
change should be stressed and the implications assessed for areas or techniques where it is lacking.
Action O26: Expand Continuous Plankton Recorder and supporting observations
ECV – Marine habitat properties
Marine coastal regions are among the most productive systems of the planet, yet they are
undergoing rapid transformations in response to intensifying human activities and global change.
Regime shifts, abrupt transitions between alternative states, are increasingly observed in a wide
range of coastal systems, including coral reefs, macroalgal forests, seagrasses and mangroves. These
non-linear responses to deteriorating environmental conditions often result in considerable loss of
ecosystem functions and services. Improving the ability to prevent undesired transitions has
therefore profound implications for the management and conservation of these unique coastal
marine ecosystems.
Many attributes in the coastal zone (SST, salinity, light, nutrients, pH) are highly variable and this has
important implications for ecosystem processes: vulnerability of coral reefs to temperature and
salinity fluctuations, high nutrients, etc. Greater attention to coastal zone variability and extreme
events will lead to greater relevance of the ocean and climate (and coastal) observing systems to
society. Contributing networks will allow real-time surveillance and risk assessment of regime shifts
along the world’s coastal ecosystems.
Issues and needs relative to observation of marine habitats include:
(a) In situ networks do not provide adequate coverage or sampling relative to the required space-
and time-scales;
(b) Need to improve connections between global, regional and local observing and sampling efforts,
and improve coordination and information flow among remote sensing, in situ monitoring and
modelling efforts;
(c) Need to develop and expand local research and monitoring capacity;
Action Establish plan for, and implement, global CPR surveys, including extension to (sub) tropical areas and
integration of data from supporting observation programmes
Benefit Information on variability and trends in plankton
Time frame Internationally agreed plans published by end 2019; implementation build-up to 2024
Who Parties’ national research agencies, working with SCOR and GOOS Biology and Ecoystems Panel, IGMETS,
Global Alliance of CPR Surveys, OceanSITES
Performance
indicator
Publication of internationally agreed plans; establishment of agreements/frameworks for coordination
of sustained global CPR surveys supported by repeated surveys at fixed locations; implementation
according to plan; flow of data into agreed archives, summary of interpreted data products available
Annual cost US$ 10–30 million

GCOS 2016 Implementation Plan
- 143 -
(d) Ecological monitoring needs to be accompanied by socioeconomic monitoring towards improved
coordinated management efforts;
(e) Improved data management and exchange mechanisms are needed, particularly across the land–
sea interface;
(f) Develop capacity in remote-sensing and in situ monitoring to respond rapidly to reporting of
extreme, unusual or anomalous events on coral reefs;
(g) Develop and sustain a high spatial and spectral resolution capacity to assess coral reef and other
marine habitat changes, particularly hyperspectral satellite observations.
Coral reefs
Live coral cover is the principal measure of biomass of living reef-building corals. As the architects of
coral reefs, live corals are the foundation for the habitat, food and space that supports the high
biodiversity and productivity of coral-reef systems. Coral reefs are among the most threatened of
marine ecosystems worldwide as well as being the most biodiverse and are highly valuable for their
ecosystem good and services. Increased coral-reef bleaching due to the increased frequency of
warm-water events is compromising the resilience of coral reefs to the many pressures that they
face. A reduced recovery interval between bleaching events is expected to lead to the loss of many
coral reefs worldwide.
Many people that depend on coral reefs live in low-income tropical countries, thus healthy reefs are
a foundation for their livelihood and food security. Climate change, ocean acidification, fisheries,
pollution and coastal development are all significant threats to coral reefs, in particular to hard
corals. Thus, the biomass or cover of hard corals on a reef is a direct indicator of the health of a reef
and its ability to sustain species, productivity and valuable ecosystem services. Live coral cover is a
direct measure of the biomass (areal cover) of hard corals and is the most important single indicator
of whether a reef is in a coral-dominated state or not.
Issues to address coral-reef assessment and monitoring include providing the technical foundation
for identifying Essential Variables that describe the status and trends of coral reefs, and build
capacity in the Global Coral Reef Monitoring Network (GCRMN) to provide regionally and globally
consistent data and indicators on reefs. This will help to consolidate and advance research on reef
processes and futures, support management and decision-making to conserve reefs from local to
global levels, and integrate GCRMN into international reporting mechanisms. Such integration will
also support capacity-building in the monitoring teams and regional networks of developing
countries. Specific actions include:

GCOS 2016 Implementation Plan
- 144 -
Action O27: Strengthened network of coral reef observation sites
Mangrove forests, seagrass beds, macroalgal communities
These three important habitats support many coastal resources, providing a source of primary
production, protection for juvenile stages of many vertebrate and invertebrate species important to
commercial, recreational and subsistence fishing and a feeding habitat for endangered species,
including birds and marine mammals. They also provide physical protection against storm events by
dissipating wave energy, as well as fuel and pharmaceuticals, and support tourism.
Issues to address include the development of reliable sustained observing technologies that
encompass remote, scientific and citizen contributions. Global networks driving the coordination
and expansion of existing local activities need to be developed to drive the development of
systematic, sustained and consistent observing systems.
Action O28: Global networks of observation sites for mangroves, seagrasses, macroalgae
4.5 Key elements of the sustained ocean observing system for climate
The sustained ocean observing system for climate comprises a set of core observing satellite and in
situ networks which measure the ocean ECVs. While many of the networks measure multiple ECVs
and vice versa, they all occupy different niche roles in delivering the space/time and regionally
varying sampling requirements.
Action Strengthen the global network of long-term observation sites covering all major coral-reef habitats
within interconnected regional hubs, encourage collection of physical, biogeochemical, biological and
ecological measurements, following common and intercalibrated protocols and designs, and implement
capacity-building workshops
Benefit Accurate global monitoring of changes in coral-reef cover, health and pressures
Time frame 2016–2020
Who Parties’ national research and operational agencies, supported by GCRMN, GOOS Biology and
Ecosystems Panel, GRAs and other partners
Performance
indicator
Reporting on implementation status of network
Annual cost US$ 30–100 million
Action Advance the establishment of global networks of long-term observation sites for seagrass beds,
mangrove forests and macroalgal communities (including kelp forests) and encourage collection of
physical, biogeochemical, biological and ecological measurements, following common and
intercalibrated protocols and designs and implement capacity-building workshops
Benefit Accurate global monitoring of changes in mangroves, seaglasses and macroalgae cover
Time frame 2016–2020.
Who Parties’ national research and operational agencies, supported by GOOS Biology and Ecosystems Panel,
GRAs and other partners in consultation with CBD and Ramsar Convention on Wetlands
Performance
indicator
Reporting on implementation status of network.
Annual cost US$ 30–100 million

GCOS 2016 Implementation Plan
- 145 -
4.5.1. Satellite constellations
Satellite observations are a fundamental component of ocean climate observing systems. They now
provide routine global observations of numerous ECVs and essential supporting data for others.
Satellite-derived ocean ECV observations include SST and SSH, sea state, ocean colour, sea-ice
parameters, wind stress (momentum flux) and components of surface-heat fluxes and surface
freshwater fluxes. Satellite-derived SSS observations are showing promise following two
experimental missions. Surface currents can also be derived from SSH. The operation of
constellations of similar sensors extends the space and timescales resolved by individual satellites
and sensors on board multiple satellites are frequently complementary for correcting for
atmospheric effects in the field of view. Ocean in situ observations for calibration and validation of
satellite data are essential. Planning, development and prioritization of both satellite and in situ
components therefore need to be considered in concert.
Figure 12. A schematic of the satellite constellation for sea-surface temperature (1-7 Low Earth
Orbiting Satellites, their SST sensors and Space Agencies; 8-10 Geostationary Satellites, their SST
sensors and Space Agencies) Source: CEOS
GCOS 2016 Implementation Plan
- 146 -
Action O29: In situ data for satellite calibration and validation
Satellite sea-surface temperature
Sea-surface temperature measurements are among the longest records of ocean measurements
from satellites, providing continuous data since 1978 on NOAA and (from 1987) EUMETSAT
platforms. Traditionally, SST has been inferred using infrared channels. To correct the influence of
atmospheric constituents, including dust and aerosols, dual-view ATSR technology was deployed by
the European Space Agency (ESA) from 1991. More recently, passive microwave measurements
were also used to observe SST for rain-free weather conditions. Today, an SST analysis assimilating
data from both measurement technologies is the most accurate product. The future of passive
microwave missions is not secure, however, and an impending gap in mission planning needs to be
addressed by space agencies; continued efforts are also needed to eliminate disruptive radio-
frequency interference. The Group for high-resolution sea-surface temperature provides scientific
oversight for the development of best possible SST products.
Action O30: : Satellite sea-surface temperature
Satellite sea-surface height
Since the launch of TOPEX/POSEIDON in 1992, continuous and high-quality altimetric SSH
observations have been available, globally and measurements are now being continued through the
Jason series. Those measurements are merged with those from other altimeters (European Remote-
Sensing ERS, ENVISAT, Altika, etc.) to provide best possible information about sea level, ocean eddies
and surface currents. The SENTINEL-3 and Jason series will jointly continue those multi-satellite
measurements. A new, high-resolution technology will be tested with NASA’s SWOT mission (due for
launch after 2020). SWOT will provide sufficient spatial resolution – but insufficient temporal
Action Maintain in situ observations of surface ECV measurements from existing observations networks
(including surface drifting buoys, SOOP ships, tropical moorings, reference moorings, Argo drifting floats,
and research ships) for calibration and validation of satellite data; undertake a review of requirements of
observations
Benefit Comprehensive in situ observations for calibration and validation of satellite data
Time frame Continuous, review by 2020
Who Parties’ national services and ocean research programmes, through GOOS, IODE and JCOMM, in
collaboration with WRCP/CLIVAR and CEOS
Performance
indicator
Data availability at international data centres
Annual cost US$ 1–10 million
Action Secure future passive microwave missions capable of SST measurements
Benefit Ensure SST coverage in regions of high cloud coverage
Time frame Continuous
Who Space agencies, coordinated through CEOS, CGMS, and WMO Space Programme in consultation with the
Global High Resolution Sea Surface Temperature Project (GHRSST)
Performance
indicator
Agreement of plans for maintaining required microwave SST missions
Annual cost US$ 100–300 million (for securing needed missions)

GCOS 2016 Implementation Plan
- 147 -
resolution – to monitor eddy variability and will also be useful for applications on the coast.
Continued satellite gravity missions are required to extract optimum information from altimeter
data, including ocean circulation (see action G32). Scientific oversight of the constellation of
altimeters is provided by the Ocean Surface Topography Science Team (OSTST).
Action O31: Satellite sea-surface height
Satellite sea-surface salinity
Sea-surface salinity measurements depend on the sensitivity of the ocean-surface emissivity to
salinity at frequencies around 1.4 GHz (L-band microwave). They are retrieved from the
measurements of ocean-surface brightness temperature at L-band after correction of the effects due
to ocean-surface roughness, SST and the atmosphere. Even though the measurement technology
was successfully demonstrated through the pathfinder missions such as ESA SMOS and the
NASA/Argentine Aquarius/SAC-D, long-term space-based observations are not secured. The
complementarity of the satellite SSS with in situ salinity observations and the advantages of satellite
SSS (global coverage, including marginal seas and coastal oceans, better spatiotemporal sampling)
demonstrated by existing research call for the continuity of the time series to provide global SSS
measurements with sufficient spatiotemporal sampling to resolve SSS features important to ocean
circulation and marine biogeochemistry and linkages with climate variability and the water cycle.
Scientific oversight is provided by the Ocean Surface Salinity Science Team (OSSST).
Action O32: Satellite sea-surface salinity
Action Ensure continuous coverage from one higher-precision, medium-inclination altimeter and two medium-
precision, higher-inclination altimeters, including a satellite altimetry reference mission with no
discontinuity between each satellite to ensure that each mission following another has an overlap period
(6–9 months) to intercalibrate onean other (example of TOPEX/Poseidon and Jason missions)
Benefit Global routine calibrated mapping of SSH; intercalibration period between difference satellite missions
Time frame Continuous
Who Space agencies, with coordination through the OSTST, CEOS Constellation for Ocean Surface
Topography, CGMS and the WMO Space Programme.
Performance
indicator
Satellites operating; provision of data to analysis centres
Annual cost US$ 30–100 million
Action Ensure the continuity of space-based SSS measurements
Benefit Continue satellite SSS record to facilitate research (ocean circulation, climate variability, water cycle, and
marine biogeochemistry), operation (seasonal climate forecast, short-term ocean forecast, ecological
forecast) and linkages with the water cycle
Time frame Continuous
Who Space agencies, coordinated through OSSST, CEOS, CGMS and WMO Space Programme and in situ
network
Performance
indicator
Agreement of plans for maintaining a CEOS virtual constellation for SSS, ongoing satellite operation,
routine delivery of SSS products
Annual cost US$ 30–100 million (for securing needed missions)

GCOS 2016 Implementation Plan
- 148 -
Satellite observations of sea state
Sea state is measured as significant wave height by satellite altimeters. The measurements have
existed as a continuous time series since the launch of TOPEX/Poseidon and ERS-1 on the same
space/time resolution as altimeter data. Sea state can also be measured using SAR; due to the very
high resolution of the data and subsequent data volumes, SAR data are usually restricted to small-
area images, rather than routine global coverage.
Action O33: Satellite sea state
Satellite ocean surface stress
Surface wind stress can be measured as a two-dimensional vector using scatterometry technology.
The respective technology has been proven and is now used on a continuous basis to measure
surface stress on a global basis and with roughly 20 km spatial resolution. The time series are being
continued through EUMETSAT and the Indian Space Research Organisation. Scientific oversight is
provided by the Ocean Vector Stress Science Team (OVSST). See also discussion in section 3.1 on
atmospheric ECV: wind speed and direction.
Action O34: Satellite ocean surface stress
Satellite observations of sea ice
Sea-Ice extent and concentration have been measured by multichannel passive microwave remote-
sensing since 1979. Sea-ice classification has also been achieved utilizing dual polarization SAR
backscatter from ENVISAT and Radarsat and backscatter from scatterometers. Sea-ice thickness
from satellites has been achieved using radar and laser altimetry. For both types of sensor, however,
snow depth, as well as snow and sea-ice densities, are needed to convert sea-ice freeboard into ice
Action Continue to improve the delivery and quality of sea-state fields, based on satellite missions with in situ
networks
Benefit Global routine calibrated mapping of sea state
Time frame Continuous
Who Space agencies, coordinated through CEOS, CGMS, and WMO Space Programme and in situ network
Performance
indicator
Agreement of plans for maintaining a CEOS virtual constellation for sea state
Annual cost US$ 1–10 million (for generation of datasets)
Action Continue to improve the delivery and quality of ocean-surface stress fields based on satellite missions
with the comprehensive in situ networks (e.g. metocean moorings); improve resolution with the benefit
of near coastal data; improved coverage of the diurnal and semi-diurnal cycles.
Benefit Global routine calibrated mapping of ocean-surface stress
Time frame Continuous
Who Space agencies, coordinated through OVSST, CEOS, CGMS and WMO Space Programme and in situ
network
Performance
indicator
Agreement of plans for maintaining a CEOS virtual constellation for ocean-surface stress
Annual cost US$ (1–10 million for generation of datasets)

GCOS 2016 Implementation Plan
- 149 -
thickness. Passive microwave satellite data product (sea-ice extent and concentration) such as from
DMSP SSM/I and GCOM-W AMSR2 are nowadays assimilated into operational coupled ocean–sea-ice
model systems. Similarly, there is a growing number of coupled systems that assimilate sea-ice
thickness data from radar altimeters and L-Band microwave radiometer measurements (e.g. Cryosat,
SMOS) to derive more accurate ice-volume estimates.
Action O35: Satellite sea ice
Satellite observations of heat fluxes
Surface-heat and freshwater fluxes cannot be observed directly by satellite, but are rather estimated
from state variables using bulk formulae. These estimates are subject to very large errors due to the
uncertainties of the state variables, as well as transfer coefficients. The spatial and temporal scales of
observations are often not well enough resolved to confidently calculate fluxes that depend on
several variables at once. Challenges are compounded by lack of satellite measurements for surface
air temperature and relative humidity. The development of the Ocean heat flux ECV will enable
requirements for heat-flux observations and the satellite and in situ observing system design to be
developed in order to meet requirements. See Action O17 – Ocean heat flux.
Satellite observations of ocean colour
Continuous climate-quality ocean colour radiance (OCR) measurements have been available for
almost two decades, since 1997. These include data from:
(a) Polar-orbiting global OCR satellite missions, particularly SeaWiFS, MERIS, MODIS-Aqua and VIIRS,
and the recently-launched Ocean and Land Colour Imager (OLCI) on Sentinel-3A;
(b) Various bio-optical fixed sites (such as the Marine Optical Buoy (MOBY), the Buoy for the
Acquisition of Long-term Optical Time Series (BOUSSOLE) and AERONET-OC) and mobile surface
and subsurface platforms, for calibration, validation and product development.
Sensors on global missions scheduled to be launched over the next few years include Sentinel-2 (B, C,
D), Sentinel-3 (B, C, D), the NASA Pre-Aerosol, Clouds and Ocean Ecosystem (PACE) mission and the
Second Generation Global Imager (SGLI) on JAXA’s Global Change Observation Mission-Climate
(GCOM-C), as well as future instruments under consideration by various agencies. This represents a
major advance in ocean-colour data continuity for the near to medium term.
Action Ensure sustained satellite-based (microwave radiometry, SAR, altimetry, visible and IR) sea-ice
products; high-inclination altimetry (e.g. Cryosat follow-on) also desired
Benefit Global, routine, calibrated mapping of sea ice
Time frame Continuous
Who Parties’ national services, research programmes and space agencies, coordinated through the WMO
Space Programme and Global Cryosphere Watch, CGMS and CEOS; national services for in situ systems,
coordinated through WCRP CliC and JCOMM
Performance
indicator
Sea-ice data in international data centres
Annual cost US$ 1 -10 million (for generation of datasets)

GCOS 2016 Implementation Plan
- 150 -
Key factors essential for successful development of a coordinated and sustained OCR observing
system includes continuity of climate-research-quality OCR observations and free and timely access
to, and sharing of, OCR data. A suite of climate-quality operational ocean-colour missions with
sensor characteristics consistent with each other can provide long-term uninterrupted observations
against which other sensors can be compared. At least two sensors in orbit at the same time is
essential to provide global daily coverage with minimal gaps and to establish inter-sensor calibrations
for continuous climate-quality products. Development and sharing of in situ databases and derived
products of sufficient quality to use for calibrating and validating satellite data products are essential.
Generation of long-term, multi-sensor climate-quality OCR time series that are corrected for inter-
sensor bias is needed. Continued research and technology development in parallel with operational
missions is needed to provide new and improved OCR data streams, algorithms and products,
particularly for complex waters where optical properties are not dominated by phytoplankton. It is
important to develop a new class of sensors of high radiometric quality that provide high temporal
resolution (weekly or better) of critical coastal ocean and wetland environments at relatively high
spatial resolution and spectral resolution. These will provide the data required to monitor changes in
coastal resources related to both human- and climate-driven changes.
To address the issues raised in section 4.3 for the Ocean colour ECV, GCOS and GOOS supported the
plans being developed through participating CEOS space agencies to implement an Ocean Colour
Radiometry Virtual Constellation (IP-10 Action O15, reviewed in Appendix 1). The International
Ocean-Colour Coordinating Group (IOCCG) has provided oversight to ensure that the measurements
are implemented in accordance with GCMPs and the requirements outlined by the GCOS (2006)
report, as well as to promote associated research.
Action O36: Satellite ocean colour
4.5.2. In situ observing networks
The core in situ networks which deliver to multiple ECVs are outlined below. Systems-based design
and associated network targets are discussed at OOPC, in consultation with the JCOMM Observation
Coordination Group, which comprises the chairs of the major observing networks.
Action Support generation of long-term multi-sensor climate-quality OCR time series that are corrected for
inter-sensor bias as needed and that have quantitative uncertainty characterization, with global
coverage and validity, including coastal (Case-2) waters, and capable of dealing with user requirements
for products at a variety of space and timescales.
Benefit Global routine calibrated mapping of ocean colour, including coastal (Case-2) regions
Time frame Implement plan beyond 2017
Who CEOS space agencies, in consultation with IOCCG and GEO; agencies responsible for operational Earth
observations, such as NOAA in the USA and Copernicus in the European Union
Performance
iIndicator
Free and open access to up-to-date, multi-sensor global products for climate research; flow of data into
agreed archives
Annual cost US$ 1–10 million (for generation of datasets)

GCOS 2016 Implementation Plan
- 151 -
Figure 13. Coverage of the core elements of the ocean observing system for climate
Profiling floats (Argo)
The broad-scale global array of temperature/salinity profiling floats, known as Argo, is a major
component of the ocean observing system, complementing satellite observations of SSH. Argo
exemplifies international collaboration (with 31 nations contributing floats at the time of writing) and
data management, as well as offering a new paradigm for data collection. Deployments began in
2000 and continue today at the rate of about 800 per year. The design of the Argo network is based
on experience from the present observing system, on knowledge of ocean variability observed by
satellite altimeter and on the requirements for climate and high-resolution ocean models. The array
of almost 4 000 floats provides 140 000 temperature/salinity (T/S) profiles and velocity
measurements per year distributed over the global ocean at an average 3° spacing, including the
seasonal ice zone. Argo park depth is 1 ,000 db where they drift for nine days, descending to 2 000
db to begin the full 2 000 db ascent profile. The floats cycle to the surface every 10 days to measure
vertical T/S profiles and to telemeter the data, with 4-5 year lifetimes (typically) for individual
instruments. Higher-resolution profiles are now available from floats which utilize iridium
communications (as opposed to Argos). The Argo Steering Team recommends the CTD float be
turned off at 2 db, so that the data can be used for satellite calibration and validation.
Pilot projects or design experiments are underway for enhanced observations in the equatorial and
boundary current regions, as well as for a deep Argo array and a biogeochemical Argo array. Regional
pilot deployments are underway for both deep Argo and biogeochemical Argo for verification of
sampling regime and data streams. The community plans to move towards global implementation in
the coming three to five years.

GCOS 2016 Implementation Plan
- 152 -
Action O37: Argo array
Action O38: Development of a biogeochemical Argo array
Action O39: Development of a deep Argo array
Repeat hydrography (GO-SHIP)
GO-SHIP, building on previous global-scale hydrography efforts, is the systematic and global survey of
selected hydrographic sections, carried out by an international consortium of 16 countries (at the
time of writing) and laboratories. GO-SHIP sections span all the major ocean basins and the full-
depth water column. At present and for the foreseeable future, ship-based hydrography is the only
method for obtaining coincident high-quality, high spatial and vertical resolution measurements of a
suite of physical, chemical and biological parameters over the full water column.
Action Sustain and expand the Argo profiling float network of at least one float every 3° x 3° in the ocean,
including regional seas and the seasonal ice zone (approximately 3 800 floats)
Benefit Global climate-quality observations of the broadscale subsurface global ocean temperature and salinity
down to 2 000 m
Time frame Continuous
Who Parties participating in the Argo programme and in cooperation with the JCOMM Observations
Coordination Group
Performance
indicator
Spatial coverage and number of active floats
Annual cost US$ 30 million
Action Deploy a global array of 1 000 profiling floats (~6°x ~6°) equipped with pH, oxygen, nitrate, chlorophyll
fluorescence, backscatter and downwelling irradiance sensors, consistent with the Biogeochemical Argo
Science and Implementation Plan
Benefit Global observations of the broadscale subsurface global ocean biogeochemistry down to 2 000 m
Time frame In place by 2026; review progress in 2021
Who Parties, in cooperation with the Argo Project and the JCOMM Observations Coordination Group
Performance
indicator
Number of floats reporting oxygen and biogeochemical variables
Annual cost US$ 25 million
Action Deploy a global array of approximately 1 230 deep Argo floats at 5° x 5° spacing, covering all ocean
regions deeper than 2 000 m
Benefit Global climate-quality observations of the broad-scale subsurface global ocean temperature and salinity
below 2 000 m
Time frame Array in place and maintained by 2026; review progress in 2021
Who Parties participating in the Argo programme and in cooperation with the JCOMM Observations
Coordination Group
Performance
indicator
Spatial coverage and number of active deep floats
Annual cost US$ 20 million

GCOS 2016 Implementation Plan
- 153 -
GO-SHIP’s unique contributions to the observing system are:
(a) Coast-to-coast, top-to-bottom, near-synoptic-section observation resolving boundary currents;
(b) Highly accurate measurements of a full suite of water properties (salinity, oxygen, nutrients,
carbon parameters, CFCs, isotopes, turbulence and more) to detect subtle changes in the full
ocean depth;
(c) Provision of high-quality reference observations to other components of GCOS/GOOS that use
autonomous observing platforms (e.g. Argo and SOOP) and supports validation and development
of regional and global climate models;
(d) A platform for testing new ocean-observing technologies.
GO-SHIP data are freely available in a timely manner to the scientific and general community from a
number of data servers. GO-SHIP provides changes in inventories of heat, freshwater, carbon,
oxygen, nutrients, transient tracers and other ocean properties at approximately decadal resolution.
The GO-SHIP data are used for major assessments of the role of the ocean in mitigating climate
change, research publications, atlases and other climate products and outreach materials.
Action O40: GO-SHIP
Moored/ship-based timeseries (OceanSITES)
OceanSITES oversees a worldwide system of long-term, open-ocean time-series stations measuring
dozens of variables and monitoring the full depth of the ocean from air–sea interactions down to the
sea floor. It is a network of stations or observatories measuring many aspects of the ocean's surface
and water column using, where possible, automated systems with advanced sensors and
telecommunications systems, yielding high time resolution, often in real time, while building a long
record. Observations cover meteorology, physical oceanography, transport of water,
biogeochemistry and parameters relevant to the carbon cycle, ocean acidification, the ecosystem
and geophysics.
Most of the stations are occupied with moorings that allow high-resolution temporal and vertical
sampling. OceanSITES comprises air-sea flux moorings, transport arrays, the Tropical Moored Buoy64
array and multidisciplinary time series sites. In some cases, these are individual moorings in a region
of high interest. In other cases, multiple moorings are used in an array to measure transport, for
64
TAO/TRITON (in the Pacific), RAMA (in the Indian Ocean), PIRATA (in the Atlantic)
Action Maintain a high-quality, full-depth, multi-disciplinary ship-based decadal survey of the global ocean
(approximately 60 sections) and provide a platform to deploy autonomous components of the ocean-
observing system and test new technology
Benefit Global, comprehensive, full-depth, decadal ocean inventory of ECVs
Time frame Continuous
Who National research programmes supported by the GO-SHIP project, JCOMM Ocean Coordination Group
and GOOS
Performance
indicator
Percentage coverage of the sections and completion of Level-1 measurements
Annual cost US$ 10–30 million

GCOS 2016 Implementation Plan
- 154 -
example to observe boundary-current transport or to observe basin-scale meridional transports.
Additionally, several time series are based on regular repeats from ships which allows for a wider
spectrum of ECVs measured in situ that cannot be measured with autonomous sensors.
While most moorings carry instrumentation that records data internally, technical advances are
increasing the real-time availability of OceanSITES data. Surface buoys allow satellite data telemetry,
and subsurface data are brought to the surface by inductive, acoustic or hardwire links. At some
sites, ocean gliders are now used to acquire the data from subsurface moored instrumentation via
acoustic modems and then transmit the data via iridium when they surface. Other sites use data
capsules that are periodically released from the mooring to float to the surface and pass on
subsurface data.
Action O41: Develop fixed-point time series
Action O42: Maintain the Tropical Moored Buoy system
Action Build and maintain a globally distributed network of multi-disciplinary, fixed-point surface and
subsurface time series, using mooring, ship and other fixed instruments
Benefit Comprehensive high temporal resolution time series characterizing trends and variability in key ocean
regimes
Time frame Continuous
Who Parties’ national services and ocean research agencies responding to the OceanSITES plan working with
GOOS panels and GRAs
Performance
indicator
Moorings operational and reporting to archives
Annual cost US$ 30–100 million
Action Maintain the Tropical Moored Buoy system
Benefit Contributes to observing state of the tropical ocean climate, particularly focused on coupled air–sea
processes and high frequency variability and for prediction of ENSO events
Time frame Continuous
Who Parties’ national agencies, coordinated through the JCOMM Tropical Moored Buoy Implementation
Panel, following guidance from scientific development projects (e.g. TPOS 2020, IIOE-II, AtlantOS)
Performance
indicator
Data acquisition at international data centres and robust design requirements articulated
Annual cost US$ 30–100 million

GCOS 2016 Implementation Plan
- 155 -
Action O43: Develop time-series-based biogeochemical data
Meteorological moorings (Data Buoy Cooperation Panel)
Marine meteorological moored buoys are deployed, operated, and maintained by various NMHSs
within the framework WMO and complement other sources of synoptic surface marine
meteorological observations in coastal areas and the high seas. There is no single network of
moored buoys but rather a “network of networks”. They provide data in support of marine services,
such as marine weather (and wave) forecasts, provision of maritime safety information to end users,
and are assimilated into high-resolution and global NWP models. Capabilities vary from country to
country, with most (if not all) buoys measuring meteorological variables and some networks also
measuring oceanographic variables. Many of these networks have been in place for some 20 years
and deliver data for weather and ocean state prediction, as well as providing time series for marine
climate studies, in particular for wave climate. Use of data from the moored meteorological buoys
for climate applications requires observational metadata to provide information on, for example,
changing buoy types and instrument heights and types. Availability of moored buoy metadata for
the full observational time period will significantly improve the quality and consistency of the record.
Action O44: : Meteorological moorings
Action Establish a coordinated network of ship-based multidisciplinary time series that is geographically
representative; initiate a global data product of time-series-based biogeochemical data
Benefit Provision of comprehensive regular observations of ocean biogeochemistry, complementary to the
GO-SHIP decadal survey
Time frame Internationally agreed plans published by end 2018; implementation build-up to 2020
Who Parties’ national research agencies, working with IOCCP and user groups, such as IGMETS
Performance
indicator
Publication of internationally agreed plans; timely availability of data in internationally agreed on data
centres
Annual cost US$ 10–30 million
Action Maintain measurements on surface moored buoys of meteorological parameters (air temperature,
humidity, SST, wind speed and direction) and expand range of parameters measured (surface pressure,
waves, precipitation and radiation); ensure observational metadata are available for all moored buoy
observations, both for current data and for the historical archive
Benefit Comprehensive marine meteorological observation delivery
Time frame Continuous
Who Parties’ national services and ocean research agencies, DBCP, OceanSITES
Performance
indicator
Moorings operational and reporting to archives
Annual cost US$ 30–100 million

GCOS 2016 Implementation Plan
- 156 -
Action O45: Wave measurements on moorings
Observations on and below the sea ice (DBCP)
Standard drifters and ice buoys are deployed in both the Arctic and Antarctic Oceans to provide
meteorological and oceanographic data for real-time operational requirements and research
purposes, including support to the World Climate Research Programme (WCRP) and the World
Weather Watch (WWW) Programme. These are managed through the International Arctic Buoy
Programme (IABP) and the International Programme for Antarctic Buoys (IPAB).
Action O46: Observations of sea ice from buoys and visual survey
Drifters (DBCP Global Drifter Array)
The objectives of the Global Drifter Array are to maintain a global 5° x 5° array of satellite-tracked
surface drifting buoys (excluding marginal seas, latitudes > 60N/S and those areas with high drifter
“death” rates) to meet the need for an accurate and globally dense set of in situ observations of
mixed layer currents, SST, atmospheric pressure, winds and salinity, and provide a data-processing
system to deliver the data to operational (via the WMO GTS) and research users. Data from the
Global Drifter Array make a valuable contribution to short-term NWP (often identified as the most
cost-effective data stream), longer-term (seasonal to interannual) climate predictions, as well as
climate research and monitoring. They are also used to validate satellite-derived SST products.
Surface Velocity Programme drifters were standardized in 1991, with drogues centred at 15 m below
the surface. In 1993, drifters with barometer ports, called SVPB drifters were tested in the high seas
and proven reliable. Previous issues highlighted in the GCOS Status Report (GCOS-195) regarding a
drop in the lifetime of drifters have been addressed by engaging directly with manufacturers. Recent
analysis has refined the array target to improve global coverage, including marginal seas. More
Action Develop a strategy and implement a wave measurement component as part of the Surface Reference
Mooring Network (DBCP and OceanSITES)
Benefit Comprehensive in situ reference observations of wave parameters.
Time frame Complete plan and begin implementation by 2020
Who Parties operating moorings, DBCP, OceanSITES, coordinated through the JCOMM Expert Team on Waves
and Coastal Hazards
Performance
indicator
Sea-state measurement at the international data centres
Annual cost US$ 1–10 million
Action Establish and sustain systematic in situ observations from sea-ice buoys, visual surveys (SOOP and
Aircraft) and ULS in the Arctic and Antarctic
Benefit Enables tracking of variability in ice thickness and extent
Time frame Continuous
Who Arctic Party research agencies, supported by the Arctic Council; Party research agencies, supported by
CLIVAR Southern Ocean Panel; JCOMM, working with CliC and OOPC
Performance
indicator
Establishment of agreements/frameworks for coordination of sustained Arctic and Southern Ocean
observations, implementation according to plan
Annual cost Plan and agreement of frameworks: US$ 100 000–1 million
Implementation: US$ 10–30 million

GCOS 2016 Implementation Plan
- 157 -
accurate thermistors for high-resolution SST have been deployed and are being evaluated for impact
on satellite SST calibration and validation. The archive of quality-controlled drifter data is updated
quarterly (see also Atmospheric action A7).
Action O47: Sustain drifter array
Underway observations from ships (Ship Observations Team – VOS and SOOP)
Observations are being taken from underway vessels for a variety of observation programmes, which
require different levels of engineering and human intervention on the ship. Vessels used include
commercial ships, ferries, as well as research and supply vessels. Some of the programmes require
repeat transect observations, while others are focused on broader-scale observations. Research
vessels and those servicing moorings (such as the Tropical Moored Buoy array) provide the added
benefit of delivering comprehensive, high-quality underway observations. Such observations should
be considered an integrated component of the observing system. Challenges are being faced related
to changes in the operations of the shipping community, which are focusing on a smaller number of
routes and close to the coast. Ships are also moved between routes more frequently, making
repeated sections more challenging. Looking to the future, unmanned surface vehicles may improve
coverage of underway observations (see also section 4.1.7, Action O6).
Action O48: Underway observations from research and servicing vessels
Action Sustain global coverage of the drifting buoy array (at least 1 300 drifting buoys to cover oceans in the
latitudes between 60S and 60N, excluding marginal seas, plus additional coverage for these areas) with
ocean temperature sensors and atmospheric pressure sensors on all drifting buoys
Benefit Routine broad-scale observations of surface temperature and sea-level pressure in support of NWP;
climate-data products (e.g. SST) and VOSClim for climate-quality flux estimates
Time frame Continuous
Who Parties’ national services and research programmes through JCOMM, DBCP and the Ship Observations
Team (SOT)
Performance
indicator
Data submitted to analysis centres and archives
Annual cost US$ 1–10 million
Action Ensure where possible that ancillary underway observations are collected during research voyages and
routine mooring servicing cruises
Benefit Improved coverage of underway observations, particularly in data-sparse, open oceans, and
complementary to moored buoy arrays
Time frame Continuous.
Who National research agencies in consultation with the JCOMM Ship Observations Team and GO-SHIP
Performance
indicator
Improved observations from research vessels
Annual cost US$ 1–10 million

GCOS 2016 Implementation Plan
- 158 -
Vountary Observing Ships
Voluntary Observing Ships (VOS) are recruited and operated by NMHSs within the framework of the
JCOMM Ship Observations Team (SOT) to complement other sources of synoptic surface marine
meteorological observations in coastal areas and the high seas. They essentially support global NWP,
climate applications and marine services activities such as marine forecasts and the provision of
maritime safety information to the maritime industry and port authorities. VOS data are also used in
climate research and reanalysis. VOS provide most of the air-temperature and humidity observations
over the ocean. They remain an important contribution to the SST observing system, particularly in
divergence regions. Their pressure and temperature observations are important for reanalysis. The
development of satellite products for near-surface air temperature and humidity over the ocean
needs more VOS observations. Due to changes in ship operations, observations have increased close
to the coast, whereas there has been a decline in the number of observations in the open ocean. VOS
network objectives are to sustain a network of vessels that provide weather and ocean observations
via both automated systems and human (manual) observations. There are currently over 3 000
active VOS, which submit nearly 2 million observations each year.
Action O49: Improve measurements from Voluntary Observing Ships
VOS underway thermosalinograph observations
Thermosalinographs collect underway temperature and salinity data from the engine intake on
vessels, usually complementary to other data streams such as on research vessels, VOS and as part of
the underway CO2 observations (see details below). These observations are collated and quality-
controlled as part of the Global Ocean Surface Underway Data (GOSUD) Project.
Action Improve the quality and spatial coverage of VOS observations, by working collaboratively with
stakeholders having interests in the maritime transportation industry; continue efforts to validate utility
of VOS observations for a range of applications, including NWP, marine climate, reanalysis and validation
of remotely sensed observations. Improve metadata acquisition and management for as many VOS as
possible through VOSClim, together with improved measurement systems
Benefit Improved coverage of routine marine meteorology observations in support of NWP
Time frame Continuous
Who National meteorological agencies and climate services, with commercial shipping companies in
consultation with the JCOMM Ship Observations Team
Performance
indicator
Increased quantity and quality of VOS reports
Annual cost US$1–10 million

GCOS 2016 Implementation Plan
- 159 -
Action O50: Improve measurements of underway thermosalinograph data
Soop XBTV
An expendable bathythermograph (XBT) is a probe that is dropped from a ship and measures the
temperature as it falls through the water. The core XBT mission is to obtain multi-decadal upper-
ocean, temperature-profile data along specific transects that typically span ocean basins. The XBT
observations constitute a large fraction of the archived ocean thermal data between 1970–1992.
Until the full implementation of the Argo array, XBTs constituted 50% of global ocean thermal
observations, providing sampling initially during regional research cruises and later along major
shipping lines but with a broad-scale spatial sampling strategy. Currently, XBT observations represent
approximately 15% of temperature-profile observations and are the main practical system used for
monitoring transports in boundary currents, eddies and fronts by repeat sampling across fixed
transects, some of which now have 30-year time series.
XBT observations are complementary to other ocean-observation systems and transects are
maintained in locations that maximize the scientific value of the observations. The typical sampling
depth of XBTs is 800 m. Fixed transects (30–35) are maintained by the scientific community in either
high-density or frequently repeated modes. High-density transects (occupied at least four times per
year, with profiles at approximately 25–50 km intervals along the ship track and finer resolution of
approximately 10 km across the Equator and in boundary currents, enable the calculation of heat and
mass fluxes of boundary currents and the closing of gyre-scale heat and mass budgets of ocean
basins. Frequently repeated transects (12–18 times per year, 100–150 km intervals) are positioned in
areas of high temporal variability and enable studies of long-term means, seasonal cycles and large-
scale ocean circulation.
Action Improve the quality and spatial coverage of underway temperature and salinity data; ensure
observations are archived and quality-controlled when collected complementary to other observing
programmes
Benefit Improved coverage of surface temperature and salinity observations
Time frame Continuous
Who National meteorological agencies and climate services, research agencies with the commercial shipping
companies in consultation with the JCOMM Ship Observations Team
Performance
indicator
Increased quantity and quality of VOS reports
Annual cost US$ 1–10 million

GCOS 2016 Implementation Plan
- 160 -
Action O51: Sustain ship-of-opportunity expendable bathyghermograph/expendable
conductivity temperature depth
SOOP CO2
Surface-water partial pressure of carbon dioxide (pCO2) is measured from ships-of-opportunity to
quantify the spatial and temporal (seasonal, interannual, decadal) patterns of carbon uptake and
release. These ships are fitted with automated carbon dioxide instruments and thermosalinographs
to measure the temperature, salinity and pCO2 in surface water and air to determine the carbon
exchange between the ocean and atmosphere. Additional relevant information can be gathered by
adding an additional inorganic carbon parameter or other ECVs such as nutrients and oxygen (this is
implemented regionally as Ferrybox).
Action O52: Coordination of underway pCO2 observations and agreed best practices
Action Sustain the existing, multi-decadal, ship-of-opportunity XBT/XCTD transoceanic network in areas of
significant scientific value
Benefit Eddy-resolving transects of major ocean basins, enabling basin-scale heat fluxes to be estimated and
forming a global underpinning boundary- current observing system
Time frame Continuous
Who Parties' national agencies, coordinated through JCOMM-SOT
Performance
indicator
Data submitted to archive; percentage coverage of the sections
Annual cost US$ 1–10 million
Action Improve coordination, outreach and tracking of implementation and measurements of a global surface
water CO2 observing system; implement an internationally agreed strategy for measuring surface pCO2
on ships and autonomous platforms and improve coordination of network, timely data submission to the
SOCAT data portal
Benefit Delivery of a high-quality global dataset of surface-ocean pCO2, enabling accurate estimates of ocean
fluxes of carbon dioxide
Time frame Establishment of global monitoring group by 2018; continuous, coordinated network by 2020
Who IOCCP in coordination with OOPC, JCOMM OCG and JCOMMOPS; implementation through Parties’
national services and research agencies
Performance
indicator
Tracking assets within 3 months of completion of voyage; data delivery to SOCAT.
Annual cost US$ 10–30 million

GCOS 2016 Implementation Plan
- 161 -
Action O53: Underway biogeochemistry observations
SOOP continuous plankton recorder
An international SOOP CPR programme is coordinated through GACS (see
http://www.globalcpr.org/). While a CPR programme had been operating in the North Atlantic since
the 1930s, it was decided after the OceanObs’09 conference that efforts should focus on developing
a global CPR programme. CPR is a self-contained mechanical automatic sampler which is towed
behind the ship,trapping water and plankton on silk along the way. On some vessels, underway
oceanographic and environmental data are recorded at the same time. In the laboratory, the silk is
usually processed in sections equivalent to 10 nautical miles. They are graded for "greenness" as a
quick indicator of the amount of phytoplankton. All phytoplankton and zooplankton are identified
and counted.
Action O54: Continuous plankton recorder surveys
Tide Gauge Network (GLOSS)
GLOSS aims at the establishment of high-quality global and regional sea-level networks for
application to climate, oceanographic and coastal sea-level research. The network comprises
approximately 300 sea- level/tide-gauge stations around the world for long-term climate change and
oceanographic sea-level monitoring, which conform to requirements for representativeness of
regional conditions, a core set of observations and data delivery/availability. The Core Network is
designed to provide an approximately evenly distributed sampling of global coastal sea-level
variations. The final repository for GLOSS data is delivered to the Permanent Service for Mean Sea
Level (PSMSL), which is the preeminent global databank for long-term sea-level change information
from tide gauges.
Action Sustain current trans-basin sampling lines of pCO2 and extend the coverage to priority areas by starting
new lines (see GCOS-195, page 137); implement routine pCO2 measurements on research vessels;
develop and deploy a global ship-based reference network of robust autonomous in situ
instrumentation for Ocean biogeochemical ECVs
Benefit Enables routine observations of multiple surface Ocean biogeochemical ECVs, leading to improved
coverage
Time frame Plan and implement a global network of SOOP vessels equipped with instrumentation by 2020
Who Parties’ national ocean research agencies in association with the GOOS Biogeochemistry Panel, IOCCP, in
consultation with JCOMM OCG.
Performance
indicator
Improved flow of data to SOCAT; pilot project implemented; progress towards global coverage with
consistent measurements as determined by number of ships with calibrated sensors providing quality
data
Annual cost US$ 10–30 million
Action Implement, global CPR surveys
Benefit Towards global transects of surface zooplankton, plankton species diversity and variability, plus an
indicator of phytoplankton productivity
Time frame 2026, review progress by 2021
Who Parties’ national research agencies, through GACS and the GOOS Biology and Ecosystems Panel
Performance
Indicator
Continuation and of sustained global CPR according to plan
Annual cost US$ 10–30 million

GCOS 2016 Implementation Plan
- 162 -
Action O55: Maintain tide gauges
Ocean gliders
Autonomous underwater gliders have developed over the last several years and are now operated
routinely, offering sustained, fine-resolution observations of the coastal ocean, from the shelf to the
open ocean. Long-term, repeat sections can be carried out with gliders which can be considered as
steerable profiling floats, allowing oceanic measurements to be maintained over the water column in
regions of interest. A global glider programme is being established as part of GOOS to provide
international coordination and scientific oversight to consider the role of gliders in the sustained
observing system; focus will likely be on the ocean-boundary circulation area that links the coastal
ocean and the open sea (see also Action O1).
Action O56: Developing a global glider observing system
Tagged animals
Tagged animals, particularly CTD.tagged pinnipeds (such as seals and sea lions), fill a critical gap in
the observing system by providing profile data in the high-latitude ocean, including under the ice.
Activity peaked during the international Polar year (2007–2009). The primary motivation for tagging
pinnipeds being for ecosystem monitoring, coordination is needed to ensure that deployments
provide information for biological and physical applications. Coordination is generally
regional/project-based and there would be benefit in moving towards global coordination of
observations, including tagging locations, species and their ranges and particularly in the
Action Implement and maintain a set of gauges based on the GLOSS Core Network (approximately 300 tide
gauges) with geocentrically located, high-accuracy gauges; ensure continuous acquisition, real-time
exchange and archiving of high-frequency data; build a consistent time series, including historical sea-
level records, with all regional and local tide-gauge measurements referenced to the same global
geodetic reference system
Benefit The GLOSS Core Network is the backbone serving the multiple missions that GLOSS is called on to serve.
Not all core stations serve every mission and not all stations for a given mission are part of the core. The
Core Network serves to set standards and is intended to serve as the example for the development of
regional networks. The GLOSS climate set serves to put the short altimetry record into a proper context,
serves as the ground truth for the developing satellite dataset, and also provides continuity if climate
capable altimetry missions have interruptions in the future.
Time frame Continuous.
Who Parties’ national agencies, coordinated through JCOMM-GLOSS of
Performance
indicator
Data availability at international data centres, global coverage, number of capacity-building projects
Annual cost US$ 1–10 million
Action Design and begin implementation of a globally distributed network of multi-disciplinary glider missions
across the continental shelf seas to the open ocean as part of a glider reference coastal–open ocean
observation network
Benefit Multi-disciplinary, high-frequency observations enabling the linkage of open ocean and coastal
environments and cross-shelf exchange of properties
Time frame Framework and plan developed by 2020
Who National research programmes coordinated by the global glider programme and GOOS
Performance
indicator
Published, internationally agreed plan and implementation of sustained coastal boundary–open ocean
sections
Annual cost US$ 10–30 million

GCOS 2016 Implementation Plan
- 163 -
coordination of QA/QC for climate applications. Such global coordination would also facilitate
systematic expansion and integration of T/S profile collection from other species.
Action O57: Developing a global animal-tagging observing system
Action Move towards global coordinatinon of pinniped tagging for ecosystem and climate applications,
including the coordination of deployment locations/species and QA/QC of resultant data
Benefit High-frequency T/S profile data in polar regions and in the ice zone, filling a critical gap in the observing
system; high-frequency T/S profile data in other regions providing complementary data to other
observing systems and likely high-frequency sampling of physical features of interest to foraging animals
such as fronts and eddies
Time frame Framework and plan developed by 2020
Who National research programmes coordinated through SOOS, SAEON, GOOS
Performance
indicator
An internationally recognized coordination activity, and observing plan.
Annual cost US$ 10–30 million

GCOS 2016 Implementation Plan
- 164 -
5. TERRESTRIAL CLIMATE OBSERVING SYSTEM
5.1 Introduction
The GCOS terrestrial ECVs provide the basis for quantifying and monitoring changes to the
hydrological cycle, the cryosphere, surface energy fluxes and changes to the biosphere and carbon
stocks (see Box 4). For convenience, this Plan separates terrestrial observations into hydrological,
cryospheric, biospheric and anthropogenic groups, although this is somewhat arbitrary and there are
considerable overlaps.
As detailed in the 2015 GCOS Status Report there have been significant improvements in the
observation of terrestrial ECVs, especially due to satellite observations where routine, operational
production of ECV products is now in place for several ECVs. Many parts of the in situ observing
networks and the space-based observing components of the terrestrial domain ECVs have been
strengthened, such as FluxNet, which coordinates terrestrial energy, water and carbon fluxes, but,
with the exception of the hydrological networks, overall coordination between terrestrial in situ
networks is poor or lacking. WMO’s Global Cryosphere Watch aims to provide some coordination of
the varied cryospheric observations and networks. Some gaps and areas for improvement have been
identified and this chapter provides actions to address these issues in the terrestrial domain.
Since the 2010 Implementation Plan, the list of ECVs has been reviewed, in light of the use of the
ECVs and developing capabilities. Table 14 lists the changes. Of the original 18 terrestrial ECVs, most
are unchanged: six are clarified with additional parameters identified and two additional ECVs are
identified.
This Plan covers a number of key topics for the terrestrial domain:
(a) Improving the reporting and dissemination of hydrological data. Much observational data on
hydrological ECVs, such as rivers, lakes and groundwater, are not reported internationally. Under
WMO Resolutions 25, 40 and 60, such data should be freely exchanged for climate uses. Actions
T7, T9, T13 and T21 address this issue;
(b) Global, satellite-based products need to be produced operationally for many ECVs. Recent
developments in the operational production of satellite-based products, such as FAPAR, LAI,
Albedo, Groundwater, Lakes and Fire, have greatly improved the understanding of the biosphere.
These need to be continued. In addition, the consistency of these products should be improved
and operational production should be extended to other ECVs and associate products, such as
water mass transport. Ensuring the continuity for these products is important;
(c) Terrestrial observations (both satellite and ground-based) are important for many purposes,
including sustainable management of natural resources and biodiversity; improving the
coordination of terrestrial observations will thus enhance the efficiency and coverage of
observations. WMO provides some coordination of the hydrosphere and cryosphere but that
across the terrestrial domain and between ECVs is lacking;
(d) Coordination between TOPC and OOPC is vital to understand and observe the coastal zone and
land–sea fluxes;

GCOS 2016 Implementation Plan
- 165 -
(e) TOPC will prepare specifications and requirements for all the terrestrial ECVs. This will complete
the information contained in Annex A;
(f) The plan identifies a number of actions, listed in Table 15, to improve monitoring of ECVs or to
set research tasks needed to underpin future improvements.
Table 14. Changes to ECVs since the 2010 GCOS Implementation Plan
ECV Name in 2010
Implementation
Plan
Comment
Snow Snow cover Name changed to better reflect the ECV requirements
Anthropogenic
water use
Water use ECV definition clarified: Water used by humans for drinking-water,
reservoir storage and agriculture or industrial purposes. Renamed
to clarify that it is more than just irrigation water and so more
linked to water security and impacts of climate change
Glaciers Glaciers and ice
caps
Renamed for clarity; no change to the ECV
Ice sheets Ice sheets Renamed for clarity; no change to the ECV
Additional new variables:
Ice shelves: Grounding line location
Ice shelves: Ice shelf thickness
Lakes Lakes
The existing variables are unchanged with additional items to be
observed.
Variables in
IP-10
Additional new variables
Lake area
Lake level
Lake water temperature
Lake ice thickness/cover
Lake surface water temperature
Lake water-leaving Reflectance (colour)
Soil moisture Soil moisture The existing products are unchanged, with additional items to be
observed: surface inundation and root-zone soil moisture
Soil carbon Soil carbon
Observations identified as:
% carbon in soil (to 30 cm and 1 m)
Mineral soil bulk density to 30 cm and 1 m
Peatland total depth of profile
Land-surface
temperature
A new ECV Land-surface temperature to support generation of land ECVs: this
is based on satellite data (rather than in situ measurements) and is
a radiative skin temperature.
Anthropogenic
GHG Fluxes
A new ECV Anthropogenic GHG fluxes are needed for:
supporting the UNFCCC and its Paris Agreement; understanding
and closing the carbon cycle and thus improving forecasts. They
are estimated both globally and nationally for many countries.

GCOS 2016 Implementation Plan
- 166 -
Land latent and
sensible heat
flux
Has been
proposed as an
emerging ECV
but not
accepted as an
ECV at this
stage
Global estimates of land latent and sensible heat are now possible
and are needed to achieve closure of the Earth’s energy budget.
This Implementation Plan includes an action to review the
potential of land latent and sensible heat flux being an ECV.
TOPC has an important role in setting the requirements for ECVs, reviewing the observational
systems and assisting in their improvement as indicated in Part I, Box 2. The role of TOPC is described
in Part I, Chapter 1 and in the actions below. These actions address the overall coordination of
terrestrial observations (section 5.2.1), terrestrial reference sites (section 5.2.2), guidance and
standards (section 5.2.3), data stewardship (section 2.3) and support to national monitoring (Part I,
Chapter 6 and section 5.2.4). The subsequent sections, 5.3–5.6, describe the specific needs, ECV by
ECV: these are summarized in Table 15.
Table 15. Summary of Terrestrial ECV actions.
Name Continue existing
observations
Improve existing
networks
Improve data
stewardship
Research for future
observations
River discharge T11 T11, T12 T7
Groundwater T13 T13 T7 T14
Lakes T9 T8, T10 T7
Soil moisture T15, T16, T17 T18 T18
Snow T28 T28 T29
Glaciers T19, T23, T26 T19, T22, T25, T26 T20, T21 T24, T27
Ice sheets T30, T32 T31
Permafrost T33 T33, T34 T33 T34
Albedo T40 T35, T38, T39 T36, T41
FAPAR T40 T35, T37 T36, T41
LAI T40 T35, T37 T36, T41
Land-surface
temperature T43
T35, T42, T44, T45,
T46 T36
Land cover T48, T49 T50, T51 T37, T47
Above-ground
biomass T52 T52, T53, T54, T55, T56 T36
Soil carbon T57 T58, T59 T36
Fire T61, T62, T63 T35, T60 T36, T64
Anthropogenic water
use T65 T65 T65 T36, T66
Anthropogenic GHG
fluxes T67 T67, T68, T70 T36 T66, T69, T71
GCOS 2016 Implementation Plan
- 167 -
Box 9: Terrestrial climate observations
Human beings depend on resources provided by terrestrial ecosystems, such as food, fibre, forest
products, shelter and water. At the same time, variability and changes of the hydrological and
biogeochemical cycles are coupled with the climate system and impact human health, infrastructure
and most economic sectors, including, for example, banking and investments, agriculture, forestry,
tourism and trade. The primary ways in which the terrestrial domain is linked to climate variability
and change is through changes in the carbon, energy and water cycles, responses to climatic
changes, such as temperature and extreme weather events, and changes to the biosphere and
ecosystems. These effects interact: for example, anthropogenic changes to the carbon cycle are a
major driver of climate change, while climate change influences terrestrial carbon storage.
Land is often covered by vegetation; currently, almost 40% of the Earth’s land surface is under some
form of management. Land use modifies the characteristics of the land surface and can thus induce
important local climate effects, especially through changes in albedo, roughness, soil moisture and
evapotranspiration. When large areas are concerned (as in tropical deforestation) regional and even
global climate may be affected. Disturbances to land cover (vegetation change, fire, disease and
pests) and soils (e.g. permafrost degradation ) have the capacity to alter climate but also to respond
to climate in a complex manner. Precise quantification of the rates of change of several land
components is important to determine whether feedback or amplification mechanisms through
terrestrial processes are operating within the climate system, such as positive feedback between
temperature rise and the carbon cycle. Increasing significance is being placed on terrestrial data for
both fundamental climate understanding and for use in impact and mitigation assessments.
Some land is covered by snow and ice on a permanent or seasonal basis, with associated features
such as glaciers, ice sheets, permafrost and frozen lakes. Snow and ice albedo play an important role
in the feedback to climate. In addition, melting of land-based ice, such as glaciers, affects rivers and
contributes directly to sea-level rise. Due to their enormous volume of frozen water, ice sheets will
affect sea level significantly under a warming climate. Snowmelt is an important source of
freshwater in some parts of the world.
The increase in atmospheric CO2 is a global phenomenon, while natural carbon sources, sinks, stocks
and human interventions in the carbon cycle vary profoundly within and between regions.
Assessments of regional carbon budgets help to identify the processes responsible for controlling
larger-scale fluxes. It is possible to compare “top–down” atmospheric inversion estimates based on
satellite and ground-based concentration measurements with land-based or ocean-based “bottom–
up” direct observations of localized carbon fluxes. On land, as well as in the oceans, the basic
components of such budgets include measurements of changes in carbon stocks and exchanges with
the atmosphere. There is still great uncertainty in such comparisons, however, and ECVs, up to now,
have mainly concentrated on stocks, rather than fluxes. Better observations of the terrestrial carbon-
related variables have gained greatly increased relevance following the Paris Agreement.

GCOS 2016 Implementation Plan
- 168 -
Table 16. Sources of Terrestrial Domain ECVs
Name Quantities measured Measurements Appicable
standards
Sources of Data
HYD
RO
LOG
ICA
L
River discharge Mean daily discharge data from all major river
basins draining into the world’s oceans are
required. Measured parameters are:
River discharge (m3/day)
Water level (m)
Flow velocity (m/s)
Cross-section (m2)
Satellite microwave altimeters
National In situ observations according to WMO standards. GTN-R
ISO/TC 113:
WMO (2010)
WMO (2008a)
WMO (2009)
GTN-R data centre:
Global Runoff Data
Centre
Satellite data centre:
Hydroweb at
LEGOS/CNES
Groundwater Groundwater volume change (m3/month)
Groundwater level (m):
Groundwater recharge (m3/s):
Groundwater discharge (m3/s):
Wellhead level (m):
Water quality
Gravity measurements have been used to estimate changes of
groundwater at a very coarse scale globally (about that of the largest
aquifers). Satellite gravity missions need to be operationalized.
National In situ observations
ISO/TC 147/SC 6 N
120,
ISO 5667-18:2001
Part I8
Data centre:
International Ground
Water Resources
Assessment Centre
(IGRAC)
Lakes Lake water level (cm)
Water extent (m2)
Lake surface water temperature (C⁰)
Lake ice cover (m2)
Lake ice thickness (m)
Lake colour (Lake water leaving reflectance)
Satellite microwave altimeters for lake level
Multi-spectral optical and thermal sensors for water extent, water
temperature, water colour and ice cover
SAR for water extent and ice cover
National In situ observations according to WMO standards. Global
Terrestrial Network- Lakes (GTN-L)
WMO (2006)
WMO (2008(a))
Data centre:
HYDROLARE
Satellite data centre:
Hydroweb
Copernicus Global
Land Service / CEOS,
ESA CCI, GloboLakes
Soil moisture Surface soil moisture content (m3/m
3)
Freeze/thaw status (yes/no)
Surface inundation (m2)
Vegetation optical depth (dimensionless)
Root-zone soil moisture content (m3/m
3)
Microwave radiometers, scatterometers and synthetic aperture radars
in 1–10 GHz range (L, C and X-band), complemented by medium-
resolution optical and thermal sensors
International Soil Moisture Network (ISMN) as part of GTN-H
WMO (2008(b)) ESA CCI Soil Moisture
Copernicus Climate
Change Service

GCOS 2016 Implementation Plan
- 169 -
C
RYO
SPH
ERE
Snow Spatial and temporal variation in the
following:
Spatial extent of snow (m2)
Fractional snow cover (viewable and
canopy-adjusted)
Snow depth (m)
Snow water equivalent (kg/m2)
Grain size (m)
Radiative forcing by Impurities
Optical and microwave satellite data for snow cover extent and duration
Lidar and microwave for depth and water equivalent
measurements according to WMO guidelines. WWW/GOS surface synoptic
networks (depth); national and regional networks (depth and water equivalent),
manual and automated
Global Cryosphere Watch
WMO (2008(b))
IGOS (2007)
Data centre: NSIDC
NRCS SNOTEL
NASA JPL
Glaciers Area (m2)
Elevation change (m/decade)
Glacier mass change (kg/m2/year)
Glacier topography
Optical data for glacier area; stereo image, radar topography missions and laser
altimetry and scanner for elevation change;
in situ measurements for mass balance (current gravity missions too coarse for
resolving individual glaciers); national in situ data; GTN-G coordinates national
monitoring networks, mainly research-based
Airborne sensors (e.g. IceBridge; national photogrammetry and LiDAR surveys)
Spaceborne sensors (e.g. LandsatTM, ASTER, Spot)
IGOS (2007)
Paul, F., Barry et al.
(2009):
Zemp et al. (2013)
Data centre: WGMS,
Univ. Zurich (CH)
and NSIDC, CIRES,
USA,
CCI
Ice sheets Covers ice sheets and ice shelves:
Surface elevation change (m/(30
days))
Ice velocity (m/(30 days))
Mass balance (kg/(30 days))
groundling line location
Ice shelf thickness (m)
Topography is also required
Gravity mission, Synthetic Aperture Radar and laser altimetry
Aircraft observations such as IceBridge
In situ data from specific missions and projects. Programme for Arctic Regional
Climate Assessment; Antarctic Climate Change in the 21st century (AntClim21)
IGOS (2007) Data Centre: NSIDC
CCI
Permafrost Depth of active layer (m)
Permafrost temperature (K)
Derived near-surface temperature and moisture (e.g. from ERS/Radarsat, MODIS,
AMSR-2 but no sensors able to directly detect permafrost
National networks of in situ observations being developed by GTN-P
A glossary of terms
has been
developed.
GTN-P coordinates
national monitoring
networks
Data centre: GTN-P

GCOS 2016 Implementation Plan
- 170 -
BIO
SPH
ERE
Albedo Bidirectional reflectance factors
(BRF), Reflectance anisotropy
(bidirectional reflectance distribution
function (BRDF) model parameters),
bidirectional hemispherical
reflectance under isotropic
illumination or white-sky albedo
(BHRiso), directional hemispherical
reflectance or black-sky albedo (DHR)
and bidirectional hemipherical
reflectance or blue-sky albedo (BHR)
for modelling and adaptation
Daily to monthly measurements of both black-sky and white-sky albedo in spectral
bands and visible, near-infrared, and shortwave broadband
Use of operational geostationary satellites (SCOPE-3M Project ) and moderate
resolution optical polar orbiters (SCOPE-CM-02, MODIS, MISR, VIIRS, AVHRR, Metop,
MERIS, Sentinel-3, SPOT-VGT, PROBA-V)
In situ data for calibration/validation, Baseline Surface Radiation Network (BSRN) –
augmented with International Fluxnet station data and Aeronet optical depth data
CEOS/WGCV/LPV; NASA-Modland
Atmospheric radiation measurement sites
Copernicus Climate
Change Service,
Copernicus Global
Land Service,
NASA/LPDAAC,
EUMETSAT CM SAF,
EUMETSAT LSA SAF
FAPAR Fraction of incoming solar radiation
at the top of the vegetation canopy
that contributes to photosynthesis.
In situ data for calibration/validation. No designated baseline network exists.
CEOS WGCV;FLUXNET; TERN,EnviroNet
NEON,ICOS
Copernicus Climate
Change Service,
Copernicus Global
Land Service,
NASA/LPDAAC,
EUMETSAT CM SAF,
EUMETSAT LSA SAF
LAI One half of the total leaf area per
unit ground area
Optical, multi-spectral and multi-angular observations
No designated baseline network exists.
CEOS WGCV; FLUXNET;
Long-term infrastructural networks, e.g. TERN, NEON, ICOS
Copernicus Climate
Change Service,
Copernicus Global
Land Service,
NASA/LPDAAC,
EUMETSAT CM SAF,
EUMETSAT LSA SAF
Land-surface
temperature
Land-surface skin temperature Thermal infrared data data, Copernicus Global Land Service, NASA/LPDAAC,
EUMETSAT LSA SAF
Land cover
(including vegetation
type)
Land cover classes Column measurements: 300-m resolution satellite imagery
10–30 m resolution satellite imagery
European Copernicus program and Landsat continuity mission
National maps
No designated reference network
No agreed
standards but see
GLCN (2014),
GOFC-GOLD
(2015a), and
LCCS/LCML
ESA LC-CCI, NGCC.
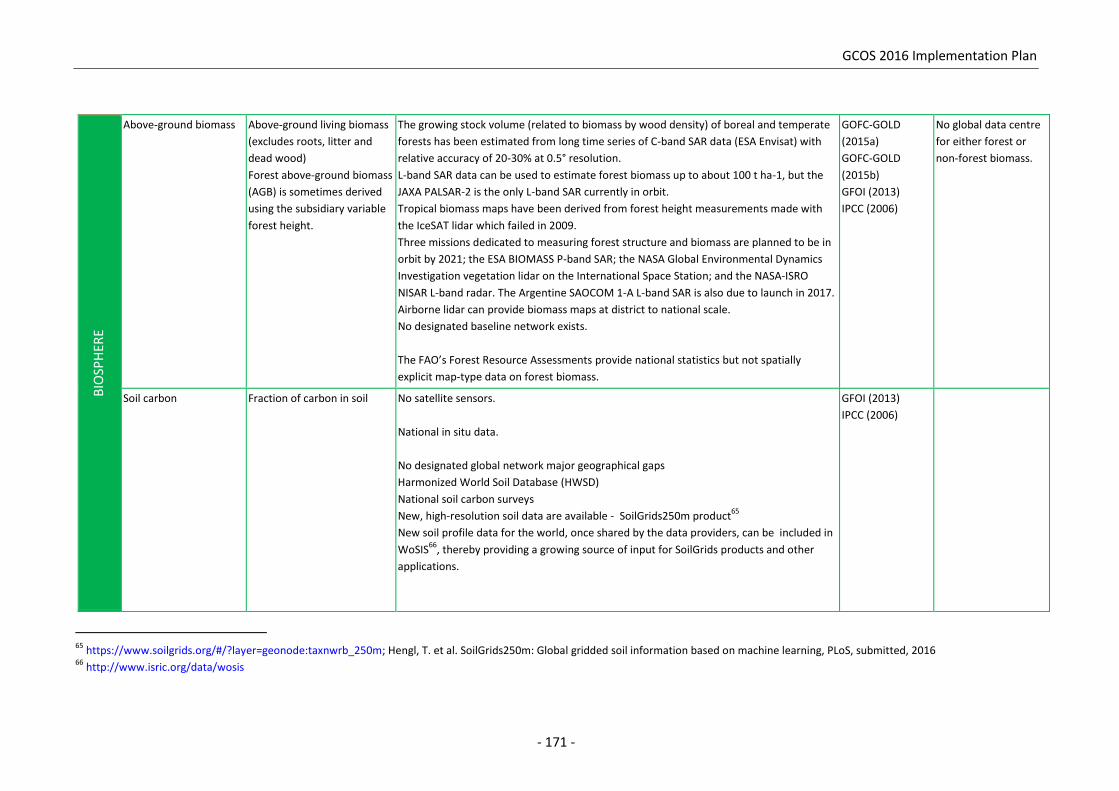
GCOS 2016 Implementation Plan
- 171 -
65
https://www.soilgrids.org/#/?layer=geonode:taxnwrb_250m; Hengl, T. et al. SoilGrids250m: Global gridded soil information based on machine learning, PLoS, submitted, 2016 66
http://www.isric.org/data/wosis
BIO
SPH
ERE
Above-ground biomass Above-ground living biomass
(excludes roots, litter and
dead wood)
Forest above-ground biomass
(AGB) is sometimes derived
using the subsidiary variable
forest height.
The growing stock volume (related to biomass by wood density) of boreal and temperate
forests has been estimated from long time series of C-band SAR data (ESA Envisat) with
relative accuracy of 20-30% at 0.5° resolution.
L-band SAR data can be used to estimate forest biomass up to about 100 t ha-1, but the
JAXA PALSAR-2 is the only L-band SAR currently in orbit.
Tropical biomass maps have been derived from forest height measurements made with
the IceSAT lidar which failed in 2009.
Three missions dedicated to measuring forest structure and biomass are planned to be in
orbit by 2021; the ESA BIOMASS P-band SAR; the NASA Global Environmental Dynamics
Investigation vegetation lidar on the International Space Station; and the NASA-ISRO
NISAR L-band radar. The Argentine SAOCOM 1-A L-band SAR is also due to launch in 2017.
Airborne lidar can provide biomass maps at district to national scale.
No designated baseline network exists.
The FAO’s Forest Resource Assessments provide national statistics but not spatially
explicit map-type data on forest biomass.
GOFC-GOLD
(2015a)
GOFC-GOLD
(2015b)
GFOI (2013)
IPCC (2006)
No global data centre
for either forest or
non-forest biomass.
Soil carbon Fraction of carbon in soil No satellite sensors.
National in situ data.
No designated global network major geographical gaps
Harmonized World Soil Database (HWSD)
National soil carbon surveys
New, high-resolution soil data are available - SoilGrids250m product65
New soil profile data for the world, once shared by the data providers, can be included in
WoSIS66
, thereby providing a growing source of input for SoilGrids products and other
applications.
GFOI (2013)
IPCC (2006)

GCOS 2016 Implementation Plan
- 172 -
Fire Burnt area (m2), fire radiative
power (FRP, Watts)
Optical, middle infrared and thermal infrared
Geostationary and moderate to high-resolution optical systems continuity required.
Daily detection of burnt area with horizontal resolution of 250 m and accuracy of 15%
FRP horizontal resolutions of 1 km to 0.25 km, time resolution of 30 minutes, with
accuracy of 25%
GOFC regional
networks,
GFMC
ESA CCI
GFED
Copernicus
LPDAAC
GOFC regional
networks, GFMC
HU
MA
N D
IMEN
SIO
N
Anthropogenic water
use
Water used by humans for
drinking water, reservoir
storage and agricultural or
industrial purposes
None
Areas of irrigated land can be estimated from land-use information; other information
from census data
No network, but a single georeferenced database (AQUASTAT) for irrigation exists based
on national data reported to FAO. Several datasets are available to be merged into one
single dataset indicating water use and availability
AQUASTAT
UN Water
http://www.unwater.
org/statistics/en/
Anthropogenic
greenhouse gas fluxes
Emissions from fossil-fuel
use, industry, agriculture and
waste sectors
Estimated from fuel and activity statistics
CDIAC, BP, IEA for global estimates, national reporting to UNFCCC
IPCC (2006)
IPCC (2013)
GFOI (2014)
National reporting to
UNFCCC
CDIAC
Global Carbon Project
Emissions/removals by land-
use sectors
Estimated by IPCC methods using statistics and satellite observations of changes in land
cover (see ECV land cover and above ground biomass)
National reporting to UNFCCC
Emissions/removals by “land
sink”
Improved knowledge on afforestation, reforestation and forest growth rates
Direct measurements of fluxes such as FluxNet
Global Carbon Project
Estimated fluxes by
inversions of observed
atmospheric composition
Observations of atmospheric composition, in situ and satellite; modelling of atmospheric
transport and processes in a data-assimilation scheme
GAW, IG3IS, GEOCarbon, ICOS, CEOS Carbon Observations Strategy, Copernicus
C3S/CAMS, Global Carbon Project
Global Carbon Project

GCOS 2016 Implementation Plan
- 173 -
5.2 General terrestrial actions
5.2.1 Coordination
There is no overall coordination of terrestrial observations: the Global Terrestrial Observing System
(GTOS) aimed to do this but is no longer operational. GTOS was set up to provide overall
coordination of terrestrial observations, including identifying users’ needs, defining observational
requirements and coordinating observations across different themes, e.g. climate change,
biodiversity loss, preserving ecosystems, agriculture and water. The need for cooperation continues,
especially within the framework of the implementation of Agenda 2030, the Sendai Framework for
Disaster Risk Reduction, the Aichi Targets and the upcoming New Urban Agenda.
In the atmosphere and ocean domains, coordination is well established. WMO coordinates
atmospheric measurements as part of its role to maintain and improve measurements related to
weather, climate and atmospheric chemistry. WMO also has a mandate to coordinate relevant
hydrological measurements. In the ocean domain, the Framework for Ocean Observations (FOO) has
been agreed and JCOMM and GOOS aim to coordinate all observations through the OOPC, which
deals with climate variables for GCOS and other ocean physics variables for GOOS. No similar
mechanism exists for terrestrial observations, however.
There is some coordination of terrestrial hydrological observations. The WMO Commission for
Hydrology (CHy) has produced observation standards, metadata and data standards. The Global
Terrestrial Network-Hydrology (GTN-H) coordinates observation networks for these variables (and an
isotope monitoring network for the International Atomic Energy Agency. For other variables, there
are a considerable number of networks (GTN-R, GTN-P, GTN-G, etc.), institutions and organizations
involved, both for in situ and remote-sensing (mainly satellite) observations. WMO has established
the Global Cryosphere Watch, which should bring together the different networks observing the
cryosphere. Coordinating in situ monitoring includes coordinating field sites and measurement
methods.
There is some developing coordination with respect to biodiversity-related observations via GEO and
the GEO-BON whose mission is to “Improve the acquisition, coordination and delivery of biodiversity
observations and related services to users, including decision-makers and the scientific community”
and whose vision is “a global biodiversity observation network that contributes to effective
management policies for the world’s biodiversity and ecosystem services”.67
GCOS reviews and maintains the list of ECVs covering all domains. More recently, the idea of
essential variables has been expanded by various groups to help define and guide global
observations. Essential Ocean Variables and Essential Biodiversity Variables (EBVs) have been, or are
being, developed. There have even been discussions of more broadly defined Essential Observations.
There is little coordination between these efforts, however, and there is a significant overlap of
definitions and their underlying observations.
Space agencies (coordinated through CEOS and CGMS) will need clear requirements: if each
discipline comes to them separately with similar but not identical requirements, they will likely
67
See http://geobon.org/ with further infomation at https://www.earthobservations.org/area.php?id=bes

GCOS 2016 Implementation Plan
- 174 -
respond negatively. Different groups have divergent needs but the importance of full convergence of
requirements decreases as one moves from observations to derived products. It is essential to have
common observations and common, low-level products because of the cost of producing and
processing large amounts of satellite data. Even for highly derived products, where requirements
tend to diverge, it would be useful to strive for consistency, e.g. in assumptions and inputs.
There is a wide variety of terrestrial monitoring sites established for a range of purposes, such as the
national and international networks FLUXNET, LTER, TERN, NEON and BSRN. In the past, there was a
database (Terrestrial Ecosystem Monitoring Sites [TEMS] database) listing sites and associated
metadata but it is no longer available. Opportunities for co-location may exist and should be
explored. Easier discoverability of the available data would greatly assist potential users.
Terrestrial observations should be better coordinated to improve their consistency, comparability
and traceability and to reduce duplication and waste and provide clear, unambiguous requirements
to those providing the observations. A number of actions need to be performed:
(a) Review various needs (ECV, EBV, etc.) to check for overlap and try to agree common
observational requirements;
(b) Ensure there are no temporal gaps between systems providing the same variable and that data
from different observing systems (e.g. climate and biodiversity) are consistent;
(c) Advocate improved data stewardship, including free and open access to data and for simple
discovery thereof, together with the correct and adequate referencing and crediting creators of
datasets by users;
(d) Promote the need for global coordination of terrestrial observations;
(e) Provide a forum where users can explain and discuss their needs and agree where a common
approach is required;
(f) Promote good practice in documenting traceability to standards, definition and identification of
reference grade measurements, adoption of certified calibration, evaluation of uncertainties in
measurements.
GCOS does this for climate observations but wider cooperation is lacking. GCOS should, in
partnership with relevant bodies and organizations, design a way forward to fulfil these needs.

GCOS 2016 Implementation Plan
- 175 -
Action T1: Improve coordination of terrestrial observations
Fluxes of carbon and water between the land and oceans are important for understanding many
issues, such as the carbon cycle, nutrient flows from land to the sea and freshwater flows into the
ocean. Sea-ice interactions are also very important in monitoring change due to climate change.
Mangroves and sea grass may be considered part of the coastal ecosystems but are also part of the
terrestrial reporting of GHGs to the UNFCCC. Coastal areas therefore need to be considered carefully
by both OOPC and TOPC to ensure that the observations across the domains are consistent. The
development of joint plans to cover coastal zones is therefore needed.
Action T2: Develop joint plans for coastal zones
5.2.2 Monitoring at terrestrial reference sites
Observations of ECVs are undertaken at a range of in situ sites around the world. There are also
many observations of ecosystems, physical properties and fluxes undertaken at sites that form part
of international networks such as FLUXNET and ILTER. Networks of terrestrial monitoring sites have
been established for a range of purposes, including ecosystem and biodiversity monitoring, flux
monitoring, and satellite validation. While some national registers exist, there is no international
central index of sites or their data.
Action Establish mechanism to coordinate terrestrial observations: this will be particularly important for climate
change impacts and adaptation where local information will be critical and will not be provided through
GCOS directly. It includes biodiversity and natural resources information and could also incorporate
socio-economic components (e.g. health) so as to become fine-tuned with post-2015 frameworks. This
would be based on discussions with stakeholders and could include a formal framework or regular
meetings to exchange ideas and coordinate observational requirements.
Benefit Efficient observing systems with minimal duplication, delivering consistent and comparable data to a
range of different users
Time frame 2017: Hold workshops to discuss way forward
2019: Mechanism in place.
Who All involved in terrestrial observations. Initially TOPC, GEO, ICSU, GOFC-GOLD, FluxNet, NEON
Performance
indicator
Presence of active mechanism
Annual cost US$ 100 000–1 million
Action Jointly consider observations of coastal zones (including sea ice, mangroves and sea grass, river and
groundwater flows, nutrients, etc.) to ensure the seamless coverage of ECVs and the global cycles in
these areas
Benefit Consistent, accurate and complete monitoring of coastal zones
Time frame 2017: joint meetings
2019: agreed plans
Who All involved in coastal observations. Initially TOPC, OOPC
Performance
indicator
Plan completed
Annual cost US$ 1 000–10 000

GCOS 2016 Implementation Plan
- 176 -
Action T3: Terrestrial monitoring sites
5.2.3 Monitoring guidance and standards
WMO has produced standards for hydrological ECVs and additional guidance is available for some
other ECVs (see Table 16) but this is not the case for all ECVs. Many organizations make terrestrial
observations for a wide range of purposes. As a result, the same variable may be measured by
different organizations using different measurement protocols. The resulting lack of homogeneous
observations hinders many terrestrial applications and limits the capacity to monitor the changes
relevant to climate and to determine causes of land-surface changes. In some cases, there are
different approaches and regulations and standards or methods are developing rapidly, so that
imposition of uniform standards may not be possible. As discussed in Part I, Chapter 5, however, all
measurements should abide by the GCMP and by the ECV requirements in annex A. These ECV
requirements need to be met for all observations.
TOPC should ensure there is appropriate guidance material for each ECV. This will include a
statement of the ECV and the parameters to be measured and the accuracy, spatial and temporal
resolution, frequency and long term stability of the data that are required to meet user needs. These
may differ according to the individual application. The guidance should also describe how the data
should be derived and may include some of the following:
(a) A formal measurement standard approved by a body such as WMO or ISO;
(b) A glossary of terms to ensure clear understanding of the approach used;
(c) References to the different measurement standards and protocols available;
(d) Descriptions of applicable best practices;
(e) Lists of algorithms used to produce ECV products;
(f) A documented traceability to standards, defined instrument-calibration procedures and
evaluation of measurement uncertainty.
ECV data should be accompanied by metadata that clearly indicate the measurement approach and
standards used (if any), the QA/QC applied, validation, the expected accuracy and resolution and
data archiving.
Action Review the need for establishing a public database of sites that aim to record climate-relevant data and
their data. Consider the usefulness of establishing a set of GCOS terrestrial monitoring sites that aim to
monitor at least one ECV according to the GCMP.
Benefit Improved access to monitoring and increased use of the data
Time frame One year for review
Who GCOS
Performance
indicator
Report on GCOS terrestrial monitoring sites
Annual cost US$ 10 000–100 000
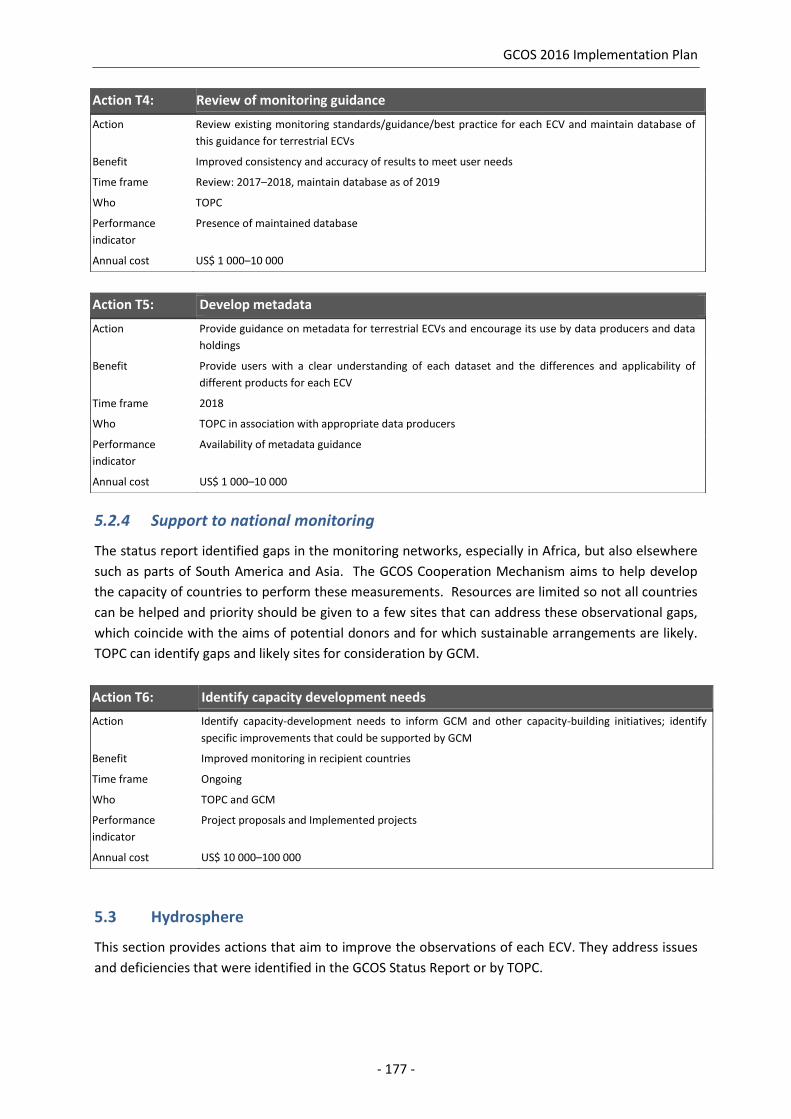
GCOS 2016 Implementation Plan
- 177 -
Action T4: Review of monitoring guidance
Action T5: Develop metadata
5.2.4 Support to national monitoring
The status report identified gaps in the monitoring networks, especially in Africa, but also elsewhere
such as parts of South America and Asia. The GCOS Cooperation Mechanism aims to help develop
the capacity of countries to perform these measurements. Resources are limited so not all countries
can be helped and priority should be given to a few sites that can address these observational gaps,
which coincide with the aims of potential donors and for which sustainable arrangements are likely.
TOPC can identify gaps and likely sites for consideration by GCM.
Action T6: Identify capacity development needs
5.3 Hydrosphere
This section provides actions that aim to improve the observations of each ECV. They address issues
and deficiencies that were identified in the GCOS Status Report or by TOPC.
Action Review existing monitoring standards/guidance/best practice for each ECV and maintain database of
this guidance for terrestrial ECVs
Benefit Improved consistency and accuracy of results to meet user needs
Time frame Review: 2017–2018, maintain database as of 2019
Who TOPC
Performance
indicator
Presence of maintained database
Annual cost US$ 1 000–10 000
Action Provide guidance on metadata for terrestrial ECVs and encourage its use by data producers and data
holdings
Benefit Provide users with a clear understanding of each dataset and the differences and applicability of
different products for each ECV
Time frame 2018
Who TOPC in association with appropriate data producers
Performance
indicator
Availability of metadata guidance
Annual cost US$ 1 000–10 000
Action Identify capacity-development needs to inform GCM and other capacity-building initiatives; identify
specific improvements that could be supported by GCM
Benefit Improved monitoring in recipient countries
Time frame Ongoing
Who TOPC and GCM
Performance
indicator
Project proposals and Implemented projects
Annual cost US$ 10 000–100 000

GCOS 2016 Implementation Plan
- 178 -
Table 17. Issues identified with hydrological observations
ECV Significant findings in the 2015 Status Report
River discharge Need to improve reporting to data centres and access to data (some data are not
available or arrive many years too late). Observational requirements for a
significant number of countries are poorly documented. Future potential of
satellites is being explored. Sharing of historic data should be improved.
Groundwater The Global Groundwater Monitoring Information System (GGMS) has been
established but more countries need to be included in the system. While the
usefulness of satellite gravity measurements has been demonstrated, it is not
yet an operational product. Operational satellite-based observations of gravity
are needed. Attribution of observed changes in groundwater level, storage and
discharge to climate change requires further research.
Lakes More WMO Member need to transmit their in situ hydrological data to
HYDROLARE.
Satellite-based altimetry observations need to be continuously updated. The
accuracy of satellite-based water-level observations requires further
improvement. In situ validation of satellite-based water-level observations is of
critical importance.
Soil moisture The International Soil Moisture Network (ISMN) has been established and needs
to be strengthened. Lack of standards and formal exchange of data. Global
satellite products available. There are very few in situ networks that provide
long-term and consistent soil-moisture-data records. Models need improvement.
An issue identified in several areas is the poor exchange of reporting or submission of data to
international data centres. WMO Resolutions 25 (Cg-XIII), 40 (Cg-XII) and 60 (Cg-17) call for the
exchange of such data. The result of this is that there are significant gaps in coverage and many data
holdings are not up to date. For many applications, the needs for water data are regional and can
extend across countries – to cover an entire catchment area, for example.
Through its Commission for Hydrology, WMO has requested that NMHSs submit daily discharge data
to the Global Runoff Data Centre (GRDC) within one year of observation. Important as this is, it is
seen as a necessary step towards the ultimate goal of near-real-time receipt from as many stations as
possible on all significant rivers. This may be realised through implementation of new standards for
exchange of hydrological data. Since 2009, WMO and the Open Geospatial Consortium (OGC) have
jointly developed a number of standards for the representation and exchange of hydrological data,
including both surface- and groundwater information. Implementation of the WMO Hydrological
Observing System (WHOS) provides an opportunity for NMHSs to use these standards to provide
improved access to near-real-time and historical hydrological data.68
68http://www.opengeospatial.org/standards/waterml, http://www.wmo.int/pages/prog/hwrp/chy/whos/ and
http://www.whycos.org/wordpress/?page_id=896.

GCOS 2016 Implementation Plan
- 179 -
Figure 14. GTN-R - Unrestricted daily river-discharge data available via the GEOSS portal, indicating
the lack of up-to-date data
Source: GRDC, http://www.bafg.de/GRDC/EN/04_spcldtbss/44_GTNR/gtnr_node.html
Action T7: Exchange of hydrological data
Action In line with WMO Resolutions 25 (Cg-XIII) and 40 (Cg-XII), improve the exchange hydrological data
and delivery to data centres of all networks encompassed by GTN-H, in particular the GCOS baseline
networks, and facilitate the development of integrated hydrological products to demonstrate the
value of these coordinated and sustained global hydrological networks.
Benefit Improved reporting filling large geographic gaps in datasets
Time frame Continuing; 2018 (demonstration products)
Who GTN-H partners in cooperation with WMO and GCOS
Performance
indicator
Number of datasets available in international data centres; number of available demonstration
products
Annual cost US$ 100 000–1 milion

GCOS 2016 Implementation Plan
- 180 -
Figure 15. Spatial and temporal scales of the hydrological and cryosphere ECV requirements
Lakes
Compared to the 2010 GCOS Implementation plan, a number of additional ECV products have been
added to the Lakes ECV in this present Implementation Plan. These include Lake surface water
temperature, Lake ice coverage and Lake water-leaving reflectance (Lake colour). These products are
also amenable to satellite retrieval and substantial efforts are already underway to build up
substantial data records for these ECV products.
Two international databases hold water-level and surface-area data for world lakes and reservoirs:
the International Data Centre on Hydrology of Lakes and Reservoirs (HYDROLARE) at the State
Hydrological Institute, St. Petersburg, Russian Federation, holds in situ data; HYDROWEB, contains
remotely sensed lake and reservoir data and is managed by LEGOS (Laboratory of studies on Spatial
Geophysics and Oceanography). Both databases hold mean monthly water levels of lakes and
reservoirs. The HYDROWEB database also contains lake-surface-area data derived from satellite
observations. In 2015, HYDROLARE started to include data on lake-water temperature.
In the future, additional products will include ice thickness, ice extent and lake-water colour.
HYDROLARE is already planning to prepare in situ ice-thickness data for upload. HYDROWEB will be
enhanced by adding satellite-based data on ice-cover dynamics and lake colour (lake-water-leaving
reflectance). Additionally for satellite retrievals of the new ECV products mentioned above) a
number of space agencies (e.g. ESA CCI) and the Copernicus Global Land Service are planning to
generate these products systematically and dedicated databases will be available.

GCOS 2016 Implementation Plan
- 181 -
Action T8: Lakes and reservoirs: compare satellite and in situ observations
Action T9: Submit historical and current monthly lake-level data
Action T10: Establish sustained production and improvement for the Lake ECV products
River discharge
River-discharge measurements have both short-term uses (e.g. for water management and flood
protection) and longer-term uses (e.g. to monitor the flow of freshwater from rivers into the oceans
and how this reduces ocean salinity and possibly changes the thermohaline circulation). Both timely
data exchange and long-time series are needed.
In the future, additional parameters may need to be considered. Rivers play a role in transporting
carbon, nitrogen, nutrients and suspended sediments that influence the quality and biodiversity of
surface waters, riparian environments and the functioning of coastal zones. Rivers are also
Action Assess accuracy of satellite water-level measurements by a comparative analysis of in situ and satellite
observations for selected lakes and reservoirs
Benefit Improved accuracy
Time frame 2017–2020
Who Legos/CNES, HYDROLARE
Performance
indicator
Improving accuracy of satellite water-level measurements
Annual cost US$ 10 000–100 000
Action Continue submitting to HYDROLARE historical and current monthly lake-level data for GTN-L lakes and
other lakes, as well as weekly/monthly water-temperature and ice-thickness data for GTN-L
Benefit Maintain data record
Time frame Continuous
Who National Hydrological Services through WMO CHy and other institutions and agencies providing and
holding data
Performance
indicator
Completeness of database
Annual cost US$ 100 000–1 million (40% in non-Annex-1 Parties)
Action Establish satellite-based ECV data records for Lake-surface water temperature, Lake ice coverage and
Lake water-leaving reflectance (Lake colour);Implement and sustain routine production of these new
satellite based products;
Sustain sustain efforts on improving algorithms, processing chains and uncertainty assessments for
these new ECV products, including systematic in situ data sharing and collection in support of ECV
validation;
Develop additional products derived from Lake water-leaving reflectance for turbidity, chlorophyll and
coloured dissolved organic matter
Benefit Add additional Lake ECV products for extended data records; provide a more comprehensive
assessment of climate variability and change in lake systems
Time frame Continuous.
Who Space agencies and CEOS, Copernicus Global Land Service, GloboLakes and ESA CCI
Performance
indicator
Completeness of database
Annual Cost 1–10M US$ (40% in non-Annex-1 Parties)

GCOS 2016 Implementation Plan
- 182 -
extensively used in industry, especially for cooling, which increases the need to monitor river
temperature.
Most countries monitor river discharge, but many are reluctant to release their data. Additional
difficulties arise because data are organized in scattered and fragmented ways, with data often
managed at subnational levels, in different sectors and using different archival systems. Even for
those data providers that do release their data, delays of a number of years can occur before quality-
assured data are delivered to international data centres such as the GRDC. In addition to the need
for better access to existing data, the tendency for observing networks to shrink in some countries,
especially the closing of stations with long records, needs to be reversed.
Implementation of OGC data services and new hydrological data transfer standards have the
potential to improve global access to hydrological data and can support regional, national or
subnational approaches to data management and provision to international data centres.
Research and development of interferometric and altimetric approaches to monitoring river-water
level and discharge from satellites are being undertaken by space agencies and their partners. One
goal of NASA’s SWOT mission being developed for launch in 2020, for example, is to use a radar
interferometer to determine the height (to 10-cm accuracy) and slope (to 1 cm km−1) of terrestrial
water masses, resolving rivers with widths greater than 100 m and other water bodies with areas
greater than 250 m².
Nevertheless, with current technology, in situ systems offer the most complete basis for river-
discharge monitoring. Based on past availability of data, GRDC has proposed a baseline network of
river-discharge stations near the mouths of the largest rivers of the world, as ranked by their long-
term average annual volumes. These stations, a subset of existing gauging stations around the world,
collectively form a GCOS baseline network, the Global Terrestrial Network for River Discharge (GTN-
R). The locations of the stations are shown in Figure 16. Data there from capture about 70% of the
global freshwater flux from rivers into the oceans.
Figure 16. Priority reference stations of the Global Terrestrial Network for River Discharge, a GCOS
baseline network
Source: Global Runoff Data Centre

GCOS 2016 Implementation Plan
- 183 -
Long-term, regular measurements of upstream river discharge on a more detailed spatial scale than
GTN-R within countries and catchment areas are necessary to assess potential impacts of climate
change on river discharge in terms of river management, water supply, transport and ecosystems. A
parallel project to GTN-R is the WMO CHy “Climate-sensitive stations” network, comprising stations
with minimum human impact that can be used as reference stations to detect change signals. This
relates to Action T7 in the 2010 GCOS Implementation Plan concerning assessment of national needs
for river gauges to support impact assessments and adaptation.
GRDC has a mandate to collect and redistribute river-discharge data from all WMO Members, in
accordance with Resolution 25 of thirteenth World Meteorological Congress (WMO, 1999), which
called on Members to provide hydrological data and products with free and unrestricted access to
the research and education communities for non-commercial purposes.
Action T11: Confirm Global Terrestrial Network for River Discharge sites
Action T12: National needs for river gauges
Groundwater
Nearly 30% of the world’s total freshwater resources (including snow and ice) is estimated to be
stored as groundwater. Today, groundwater is the source of about one third of global water
withdrawals. Estimates of the number of people who depend on groundwater supplies for drinking
range from 1.5 billion to 3 billion. Global groundwater abstraction, particularly in Asia, grew ten-fold
in the last 50 years, with agriculture responsible for approximately 90% of this growth.
Groundwater storage, recharge, and discharge are important aspects of climate change impacts and
adaptation assessments. Over the past several years, important progress has been made, facilitated
by the International Groundwater Resources Assessment Centre (IGRAC), in global-scale
groundwater monitoring with in situ well observations as a foundation, and more is expected over
the next decade through the establishment of a GGMS. In particular, the feasibility of satellite
Action Confirm locations of GTN-R sites; determine operational status of gauges at all GTN-R sites; ensure that
GRDC receives daily river discharge data from all priority reference sites within one year of observation
(including measurement and data transmission technology used)
Benefit Up-to-date data for all areas
Time frame 2019
Who National Hydrological Services, through WMO CHy in cooperation with TOPC, GCOS and GRDC
Performance
indicator
Reports (made In cooperation with GTN-H partners) to TOPC, GCOS and WMO CHy on the
completeness of the GTN-R record held in GRDC, including the number of stations and nations
submitting data to GRDC, National Communication to UNFCCC
Annual cost US$ 1–10 million (60% in non-Annex I Parties)
Action Assess national needs for river gauges in support of impact assessments and adaptation and consider
the adequacy of those networks
Benefit Prepare for improvement proposals
Time frame 2019
Who National Hydrological Services, in collaboration with WMO CHy and TOPC
Performance
indicator
National needs identified; options for implementation explored
Annual cost US$ 10–30 million (80% in non-Annex I Parties)

GCOS 2016 Implementation Plan
- 184 -
observation of groundwater storage variations using the Gravity Recovery and Climate Experiment
(GRACE) mission has been demonstrated and an operational constellation of satellite gravity missions
is needed. The representation of groundwater storage in land-surface models has advanced
significantly and new standards for exchange of groundwater information have been developed
which can be used to deliver data to IGRAC GGMS69.
Action T13: Establish a full-scale Global Groundwater Monitoring Information System (GGMS)
Action T14: Operational groundwater monitoring from gravity measurements
Soil moisture
Soil moisture has an important influence on land–atmosphere feedbacks at climate timescales, in
particular because it has a major effect on the partitioning of incoming radiation into latent and
sensible heat fluxes and on the allocation of precipitation into evapotranspiration, runoff, subsurface
flow and infiltration. Changes in soil moisture may have serious impacts on agricultural productivity,
forestry and ecosystem health. Monitoring soil moisture is critical for managing these resources and
for planning climate change mitigation and adaptation measures. As noted in the last GCOS Status
Report (GCOS-195), there has been significant progress in the implementation of this ECV. Its two
related actions, namely Action T1370 (Development of a globally gridded near-surface soil moisture
data from satellites) and Action T14 (Develop a Global Terrestrial Network for Soil Moisture), have
been largely completed according to or even exceeding expectations. The main implementation
mechanisms have been the ESA Climate Change Initiative71 (CCI) for Action T13 and the ESA-funded
International Soil Moisture Network72 for Action T14. As continued operation has not yet been
69
http://www.opengeospatial.org/standards/requests/153 70
References in this paragraph are to the GCOS Status Report (GCOS-195), not to actions in this document. 71
http://www.esa-soilmoisture-cci.org/ 72
http://ismn.geo.tuwien.ac.at/
Action Complete the establishment of a full-scale GGMS as a web portal for all GTN-GW datasets; continue
existing observations and deliver readily available data and products to the information system
Benefit Global, consistent and verified datasets available to users
Time frame 2019
Who IGRAC, in cooperation with GTN-H and TOPC
Performance
indicator
Reports to UNESCO IHP and WMO CHy on the completeness of the GTN-GW record held in GGMS,
including the number of records in, and nations submitting data to, GGMS; web-based delivery of
products to the community
Annual cost US$ 1–10 million
Action Develop an operational groundwater product, based on satellite observations
Benefit Global, consistent and verified datasets available to users
Time frame 2019
Who Satellite agencies, CEOS, CGMS
Performance
indicator
Reports to UNESCO IHP and WMO CHy on the completeness of the GTN-GW record held in GGMS,
including the number of records in, and nations submitting data to, GGMS; web-based delivery of
products to the community.
Annual Cost US$ 1–10 million

GCOS 2016 Implementation Plan
- 185 -
secured, the main tasks for the next implementation period will be to ensure the sustainability of the
climate services developed within the last period and to improve them step by step, according to
user requirements. As regards the sustainability issue, the potential inclusion of soil moisture as one
of the variables of the Copernicus Climate Change Service would be an important step in
guaranteeing the sustainability of a satellite-based soil-moisture climate service. Unfortunately, the
sustainability of the International Soil Moisture Network is at present not clear, given that no
operational home for this service has yet been found. With regard to user requirements, there is a
clear need to complement the remotely sensed soil-moisture data with subsidiary variables
(freeze/thaw, surface inundation, vegetation optical depth) that provide important information
about the validity and quality of the observed soil moisture data. Additionally, users of the ESA CCI
soil-moisture data records have expressed their interest in estimates of the root-zone soil-moisture
content, and for soil-moisture data at much finer spatial scales than currently available. These
requirements can potentially be met by exploiting the synergies of coarse-resolution microwave
sensors (radiometers, scatterometers) with finer-resolution SAR and optical/thermal sensors,
although the feasibility of a long-term, finer-resolution product still needs to be assessed.
Action T15: Satellite soil-moisture data records
Action T16: Multi-satellite, soil-moisture data services
Action T17: International soil-moisture network
Action Regularly update individual microwave sensor (SMOS, SMAP, ASCAT, AMSR-E …) soil-moisture data
records, including the subsidiary variables (freeze/thaw, surface inundation, vegetation optical depth,
root-zone soil moisture)
Benefit Time series of data to identify trends over time
Time frame Continuing
Who Space agencies (ESA, EUMETSAT, NASA, NOAA, JAXA …) and Earth observation service providers
Performance
indicator
Availability of free and open global soil-moisture data records for individual microwave missions
Annual cost US$ 10–30 million
Action Regularly update of merged multi-sensor, soil-moisture data records, including the subsidiary
variables (freeze/thaw, surface inundation, vegetation optical depth, root-zone soil moisture)
Benefit High-quality, soil moisture CDR for users
Time frame Continuing
Who Copernicus, NOAA, Earth observation data providers
Performance
indicator
Availability of free and open merged multi-sensor data records (merged passive, merged active and
merged active-passive data)
Annual cost US$ 1–10 million
Action Operate, provide user services and expand the International Soil Moisture Network (ISMN), which is
part of the GTN-H.
Benefit Coordinated in situ soil moisture data for users and calibration/validation
Time frame Continuing
Who Vienna Technical University, supported by national data providers, ESA, GEWEX, CEOS and GEO
Performance
indicator
Availability of harmonized and quality-controlled in situ soil-moisture data provided by network
operators to ISMN
Annual cost US$ 100 000–1 million (includes only central services of the ISMN data centre)

GCOS 2016 Implementation Plan
- 186 -
Action T18: Regional high-resolution soil-moisture data record
5.4 Cryosphere
Table 18. Issues identified in cryospheric observations
ECV Significant findings in the 2015 Status Report
Snow Improvements to reporting underway. Access to historic archives should be
improved. Cloud cover represents the primary source of uncertainty for
remotely sensed products but is mitigated in some products through gap-filling
(for example, the MODIS cloud gap filled product) or subjective estimates by
trained analysts (for example the NOAA IMS product). Dark polar night
season/area is missing data.
Glaciers World Glacier Monitoring Service (WGMS) successful but still some regional
data not loaded into international databases. Randolph Glacier Inventory
accomplished but regional quality issues exist and improvement is needed.
Ice sheets Satellite-based products integrating in situ and airborne observations now
available but do not yet have the multiple decades of data required. There are
large uncertainties in mass balances and dynamics and ocean-ice interaction is
a major weakness. There is no overall network. Need to establish long-term
continuity.
Permafrost Coverage by GTN-P incomplete with some additional sites needed to ensure
regional coverage. Need to develop reference sites. Standards need more
work. The current set of permafrost stations is not very representative and
relatively few of them have long time series to investigate trends.
Glaciers
There are fundamental differences in space- and timescales, as well as in processes involved
between glaciers and (continental) ice sheets. Due to the large volumes and areas, the two
continental ice sheets actively influence the global climate over timescales of months to millennia.
Glaciers and ice caps, with their smaller volumes and areas, react to climatic forcing at typical
timescales from years to a few decades. Ice shelves can be found attached to both glaciers and ice
sheets and have strong influences on their dynamics and stability.
Glacier changes are recognized as independent and high-confidence natural evidence of climate
change. Past, current and future glacier changes have an impact on global sea level, the regional
water cycle and local hazard situations.
Action Develop high-resolution soil-moisture data records for climate change adaptation and mitigation by
exploiting microwave and thermal remote-sensing data
Benefit Availability of data suitable for adaptation
Time frame 2017–2020
Who NASA Soil Moisture Active-Passive Programme, ESA Climate Change Initiative, Copernicus Evolution
Activities in cooperation with identified universities and research organizations
Performance
indicator
Public releases of experimental multi-year (> 10 years) high-resolution, soil-moisture data records
Annual cost US$ 10–30 million

GCOS 2016 Implementation Plan
- 187 -
The main variable currently observed in standardized formats are glacier distribution (mainly glacier
area and related length, elevation range, hypsometry; ideally also mean and maximum glacier
thickness) and glacier changes in mass, volume, area and length. The GTN-G website73 provides an
overview on, and access to, all data products.
Glacier inventories derived from satellite remote-sensing and digital terrain information should be
repeated at time intervals of a few decades (GTN-G, Tier 5): the typical response time of glaciers to
climate change. Current efforts for this activity depend mainly on processing of Landsat Thematic
Mapper (TM)/ETM+ and ASTER (Advanced Spaceborne Thermal Emission and Reflection Radiometer)
data following the guidelines provided by Global Land Ice Measurements from Space (GLIMS). An
important incentive for the completion of a detailed global glacier inventory comes from the recent
opening of the USGS Landsat archive and the free availability of global DEMs from the Shuttle Radar
Topography Mission (SRTM) and ASTER. Further activities from space agencies moving in this
direction, including the use of SAR data and access arrangements by data holders, are strongly
encouraged. A high-resolution (30 m or better) and accurate DEM is required to derive hydrological
divides for separation of contiguous ice masses into glacier entities and subsequently to obtain
topographic information (e.g. mean elevation) for each glacier entity.
Changes in glacier length, area, volume and mass are observed, using in situ and remote-sensing
methods. Glaciological mass balance results from ablation-stake and snow-pit measurements provide
seasonal-to-annual information on glacier contribution to runoff. Geodetic methods from in situ, air-
and space-borne platforms provide multi-annual to decadal information on glacier volume changes.
Based on assumptions on the density of snow, ice and firn, the observed geodetic volume changes
can be converted to mass balance and runoff contribution. Glacier volume change and mass balance
are a relatively direct reaction to the atmospheric conditions. Glacier front variations – from both in
situ and remotely sensed observations – are an indirect and delayed reaction to climatic changes but
allow extending the observational series back into the Little Ice Age period.
In addition, glacier surface-flow velocity is a supplementary variable to determine ice dynamics and
helps to estimate mass flux and thus the contribution of tidewater and lacustrine glaciers to
sea-level. Changes in surface-flow velocity (as derived from optical and microwave sensors) can be
used as an indicator of glacier health and provide information about glacier surge and calving
dynamics.
Remaining key uncertainties include observational uncertainties (point reading, inter-/extrapolation),
density conversion uncertainties (from volume change to mass balance), radar penetration depth in
snow and firn leading to systematic errors of DEMs in accumulation areas, sample uncertainties
(representativeness of observation series for entire glacierization) and uncertainties related to the
mass loss contribution from floating ice tongues. In view of glacier-by-glacier change assessments,
current satellite altimetry and gravimetry approaches are subject to severe scale issues (altimetry:
point data only; gravimetry: coarse resolution) and both suffer from uncertainty in the determination
of glacial isosatatic adjustments based on current and paleo ice-mass changes.
73
http://www.gtn-g.org

GCOS 2016 Implementation Plan
- 188 -
In the coming decade, it is essential to continue the long-term monitoring programmes and extend
the in situ network into regions with poor data coverage. Systematic use of air- and spaceborne
high-resolution optical images will allow the compilation of a truly global multi-temporal glacier
inventory. Differencing high-resolution DEMs (such as from SRTM and, TanDEM-X, WorldView and
the new CNES Pleiades Space borne Glacier Observatory project) has the potential to assess decadal
thickness and volume changes for thousands of individual glaciers over entire mountain ranges.
Provided that resources for corresponding glacier-monitoring activities are made available (within or
outside the scientific funding system), these tasks together will boost the scientific capacity to
address the grand challenges from climate-induced glacier changes and related secondary impacts.
Action T19: Maintain and extend the in situ mass balance network
Action T20: Improve the funding situation for international glacier data centres
Action Maintain and extend the in situ mass balance network, especially within developing countries and
High Mountain Asia (Himalaya, Karakorum, Pamir) (e.g. using capacity-building and twinning
programmes)
Benefit Maintain a critical climate record
Time frame Ongoing
Who Research community, national institutions and agencies
Performance
indicator
Number of observation series submitted to WGMS
Annual cost US$ 100 000–1 million
Action Improve the funding situation for international glacier data centres and services as well as for long-
term glacier-monitoring programmes. Integrated and international availability of funding for
sustaining programme, expecting also private sector contributions
Benefit Secure long-term monitoring and data availability
Time frame 2020
Who National and international funding agencies
Performance
indicator
Resources dedicated to glacier-database management at WGMS and NSIDC; number of reference
glaciers with more than 30 years of continued observations
Annual cost US$ 1–10 million
Action T21: Encourage and enforce research projects to make their ECV-relevant
observations available through the dedicated international data centres
Action Encourage and enforce research projects to make their ECV-relevant observations available through
the dedicated international data centres (e.g. through dedicated budget lines and the use of digital
object identifiers for datasets).
Benefit Open and long-term availability of data for users
Time frame Ongoing
Who National funding agencies
Performance
indicator
Number of datasets submitted to dedicated international data centres
Annual cost US$ 100 000–1 million

GCOS 2016 Implementation Plan
- 189 -
Action T22: Global glacier inventory
Action T23: Multi-decadal glacier inventories
Action T24: Allocate additional resources to extend the geodetic dataset
Action T25: Extend the glacier-front variation dataset both in space and in time
Action Finalize the completion of a global reference inventory for glaciers and increase its data quality
(e.g. outline, time stamp) and data richness (e.g. attribute fields, hypsometry)
Benefit Improved data quality on glaciers
Time frame 2020
Who NSIDC and WGMS with GLIMS research community and space agencies
Performance
indicator
Data coverage in GLIMS database
Annual cost US$ 100 000–1 million
Action Continue to produce and compile repeat inventories at multi-decadal timescale
Benefit Extend the time series of glacier information
Time frame Ongoing
Who NSIDC and WGMS with GLIMS research community and space agencies.
Performance
indicator
Data coverage in GLIMS database
Annual cost US$ 1–10 million
Action Allocate additional resources to extend the geodetic dataset at national, regional and global levels:
decadal elevation change can potentially be computed for thousands of glaciers from air- and
spaceborne sensors
Benefit Improved accuracy of glacier change
Time frame Ongoing
Who WGMS with research community and space agencies
Performance
indicator
Data coverage in WGMS database
Annual cost US$ 30–100 million
Action Extend the glacier-front variation dataset both in space and back in time, using remote-sensing, in situ
observations and reconstruction methods
Benefit Understanding long-term trends in glacier extent (mass trends need additional information)
Time frame Ongoing
Who WGMS with research community and space agencies
Performance
indicator
Data coverage in WGMS database
Annual Cost US$ 10 000–100 000

GCOS 2016 Implementation Plan
- 190 -
Action T26: Glacier observing sites
Action T27: Observations of glacier velocities
Snow
Snowfall and snow cover play a part in feedback mechanisms in the climate system (albedo, runoff,
soil moisture and vegetation) and are important variables in monitoring climate change.
Many problems arise because: (a) snow-cover data are collected, even within one country, by several
agencies with differing instructions and goals; (b) funding support for snow research is fragmentary
and generally not well-coordinated; (c) budget restrictions and attempts to reduce the cost of
surface networks often result in reduced coverage or automated measurement using different
instrumentation whose compatibility is not yet determined; (d) many existing datasets are not
readily accessible; and (e) satellite retrievals of snow-water equivalent are highly uncertain in many
regions and non-existent in complex terrain. Reporting often fails to include reports of zero snow
cover, failing to distinguish zero cover from a lack of observations. This has been recognized by GCW,
which has proposed new reporting procedures and a revised BUFR template. While following these
proposals has improved reporting, they still need to be adopted by CBS and the regional associations
of WMO.
The submission of in situ snow observations from the WWW/GOS surface synoptic network has
continued to show some decline due to financial pressures in many countries that have led to
closures of remote northern observation stations. In addition, there continue to be major
observational gaps in mountainous areas and the Antarctic. Data receipt from the remaining stations
has also been an issue, with few stations including snow data in their submissions to the WMO
Global Telecommunication System (GTS) and not all providing the WMO SYNOP reports that normally
include snow parameters. Furthermore, there is no systematic global monitoring of the amount and
quality of in situ snow-related reports exchanged over the GTS. As a result, the creation of well-
calibrated satellite products has been made more difficult.
Action Maintain current glacier-observing sites and add additional sites and infrastructure in data-sparse
regions, including South America, Africa, the Himalayas, the Karakoram and Pamir mountain ranges,
and New Zealand; attribute quality levels to long-term mass-balance measurements; improve
satellite-based glacier inventories in key areas
Benefit Sustained global monitoring to understand global trends
Time frame Continuing, new sites by 2017
Who Parties’ national services and agencies coordinated by GTN-G partners, WGMS, GLIMS and NSIDC
Performance
indicator
Completeness of database held at NSIDC from WGMS and GLIMS
Annual cost US$ 10–30 million
Action Encourage observations and reporting of glacier velocities
Benefit Improve understanding of glacier dynamics and mass loss
Time frame Starting 2017
Who GTN-G partners, WGMS, GLIMS and NSIDC
Performance
indicator
Completeness of database held at NSIDC from WGMS and GLIMS
Annual cost US$ 100 000–1 million

GCOS 2016 Implementation Plan
- 191 -
Maintenance of adequate, representative surface networks of snow observations must begin with
documentation and analysis of the network densities required in different environments. Resolution
of the problem of data inaccessibility requires promoting political commitment to data-sharing,
removing practical barriers by enhancing electronic interconnectivity and metadata, and data rescue
and digitization. The provision of necessary resources to improve and make available existing
archives of snow data will require national efforts. WMO’s emerging Global Cryosphere Watch is
expected to provide facilitated access to such data. Likewise, the WMO-GEWEX International
Network for Alpine Research Catchment Hydrology (INARCH), under the WCRP arch, is a growing
programme of mountain snow measurements around the globe with reliable protocols for
understanding cryosphere changes.
There are several sources that can provide snow-related data and products, but no central archive
(especially for snow depth and snow-water equivalent) currently exists and many national databases
are not readily accessible. The US National Snow and Ice Data Center (NSIDC) has updated the
Russian station snow-depth data up to 1995 for over 200 stations and the full dataset is available
from RIHMI-WDC74. In addition, snow-water equivalent is observed in many countries by national,
state, provincial, and private networks on a 10–30 day basis. In the western USA, the Snow
Telemetry (SNOTEL) network measures and distributes daily snow-water equivalent and snow-depth
data throughout the mountains. The WWW/GOS surface synoptic reports for the USA are available
through the National Climatic Data Center (NCDC). The Canadian Meteorological Centre has
produced a global daily 1/3° snow-depth analysis since March 1998 with a northern hemisphere
subset archived at NSIDC.75 Daily snow-depth data from the WMO data stream are archived at NCEI
in the Global Summary of Day (GSOD) and Global Historical Climatology Network-Daily GHCN-D
datasets. Over the last four years, the International Snow Working Group-Remote Sensing (iSWGR)
was formed and has worked toward preparing mission concepts for the 2017–2027 Earth Science
Decadal Survey. At the time of writing, the community is responding to the US National Research
Council committees of the Decadal Survey with driving science questions and measurement
concepts. Snow-water equivalent (SWE) is the remaining missing component of water-cycle
measurements from satellite and is critically needed.
Despite net solar radiation being the dominant component of the energy balance contributing to
melt, in situ measurements of snow broadband and spectral albedo around the globe are extremely
sparse. Variation in snow albedo comes from changes in snow-grain size and content and optical
properties of absorbing impurities such as dust and black carbon. A few detailed energy balance and
radiation sites exist in the western USA that have the necessary radiation measurements with which
to determine the grain size and impurity forcing of change in albedo. Semi-quantitative retrievals for
snow-grain size and radiative forcing by impurities are currently available from the NASA MODIS
instruments in the form of the NASA/JPL MODDRFS product76. Quantitative retrievals from visible to
short-wave infrared imaging spectroscopy are needed to address science questions related to
processes that control snowmelt.
74 http://meteo.ru/english/climate/cl_data.php
75 http://nsidc.org/data/nsidc-0447
76 https://snow.jpl.nasa.gov/portal/
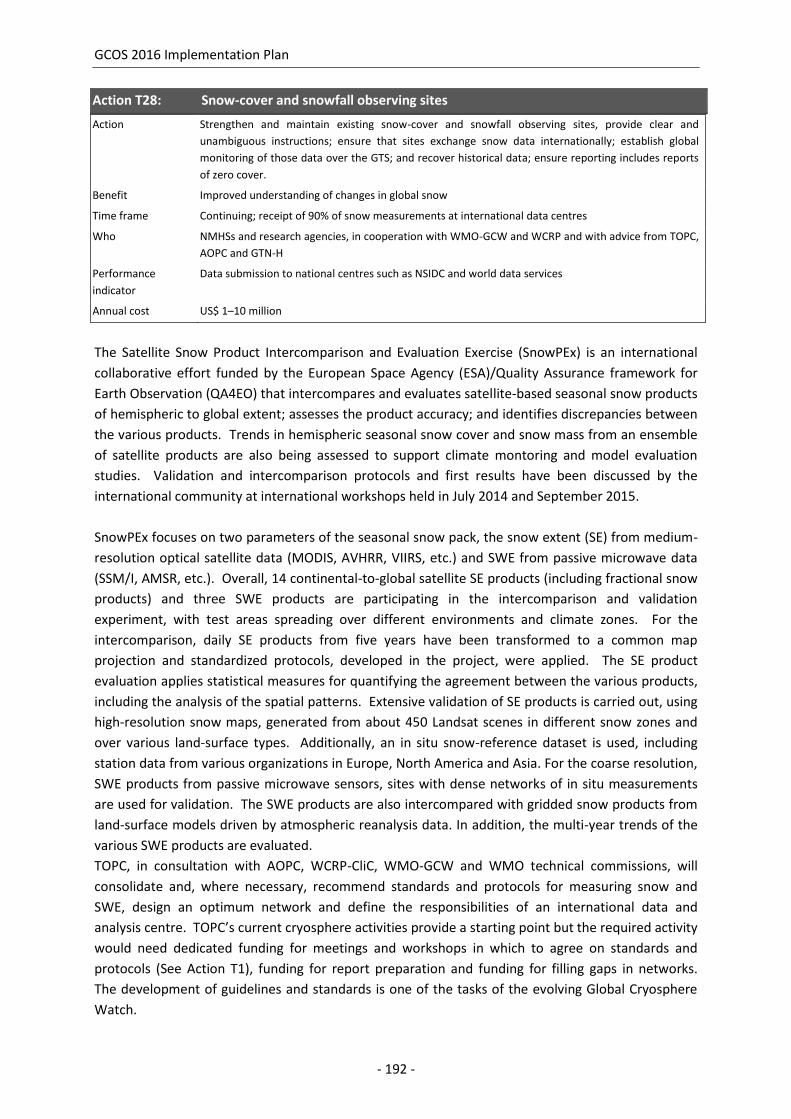
GCOS 2016 Implementation Plan
- 192 -
Action T28: Snow-cover and snowfall observing sites
The Satellite Snow Product Intercomparison and Evaluation Exercise (SnowPEx) is an international
collaborative effort funded by the European Space Agency (ESA)/Quality Assurance framework for
Earth Observation (QA4EO) that intercompares and evaluates satellite-based seasonal snow products
of hemispheric to global extent; assesses the product accuracy; and identifies discrepancies between
the various products. Trends in hemispheric seasonal snow cover and snow mass from an ensemble
of satellite products are also being assessed to support climate montoring and model evaluation
studies. Validation and intercomparison protocols and first results have been discussed by the
international community at international workshops held in July 2014 and September 2015.
SnowPEx focuses on two parameters of the seasonal snow pack, the snow extent (SE) from medium-
resolution optical satellite data (MODIS, AVHRR, VIIRS, etc.) and SWE from passive microwave data
(SSM/I, AMSR, etc.). Overall, 14 continental-to-global satellite SE products (including fractional snow
products) and three SWE products are participating in the intercomparison and validation
experiment, with test areas spreading over different environments and climate zones. For the
intercomparison, daily SE products from five years have been transformed to a common map
projection and standardized protocols, developed in the project, were applied. The SE product
evaluation applies statistical measures for quantifying the agreement between the various products,
including the analysis of the spatial patterns. Extensive validation of SE products is carried out, using
high-resolution snow maps, generated from about 450 Landsat scenes in different snow zones and
over various land-surface types. Additionally, an in situ snow-reference dataset is used, including
station data from various organizations in Europe, North America and Asia. For the coarse resolution,
SWE products from passive microwave sensors, sites with dense networks of in situ measurements
are used for validation. The SWE products are also intercompared with gridded snow products from
land-surface models driven by atmospheric reanalysis data. In addition, the multi-year trends of the
various SWE products are evaluated.
TOPC, in consultation with AOPC, WCRP-CliC, WMO-GCW and WMO technical commissions, will
consolidate and, where necessary, recommend standards and protocols for measuring snow and
SWE, design an optimum network and define the responsibilities of an international data and
analysis centre. TOPC’s current cryosphere activities provide a starting point but the required activity
would need dedicated funding for meetings and workshops in which to agree on standards and
protocols (See Action T1), funding for report preparation and funding for filling gaps in networks.
The development of guidelines and standards is one of the tasks of the evolving Global Cryosphere
Watch.
Action Strengthen and maintain existing snow-cover and snowfall observing sites, provide clear and
unambiguous instructions; ensure that sites exchange snow data internationally; establish global
monitoring of those data over the GTS; and recover historical data; ensure reporting includes reports
of zero cover.
Benefit Improved understanding of changes in global snow
Time frame Continuing; receipt of 90% of snow measurements at international data centres
Who NMHSs and research agencies, in cooperation with WMO-GCW and WCRP and with advice from TOPC,
AOPC and GTN-H
Performance
indicator
Data submission to national centres such as NSIDC and world data services
Annual cost US$ 1–10 million

GCOS 2016 Implementation Plan
- 193 -
Action T29: Integrated analyses of snow
Ice sheets
Our understanding of the timescale of ice-sheet response to climate change has changed
dramatically over recent decades. The current state of mass balance of the Greenland and Antarctic
ice sheets is strongly negative. The average ice-mass change in Greenland from the present
assessment has been –121 ± 33 Gt yr–1 (a sea-level equivalent of 0.33 ±0.09 mm yr–1) over the period
1993 to 2010, and –229 ± 73 Gt yr–1 (0.63 ±0.20 mm yr–1 sea-level equivalent) over the period
2005–2010. The mass budget method shows the overall partitioning of ice loss from the Greenland
ice sheet is about 60% surface-mass balance (runoff) and 40% discharge from ice flow across the
grounding line. There are significant differences of ice discharge and surface-mass balance in various
regions of Greenland, dynamic losses dominate in south-east, central west and north-west
Greenland, whereas, in the central north, south-west and north-east sectors, changes in surface-
mass balance appear to dominate. Over the last two decades, surface-mass balance has become
progressively negative as a result of an increase in runoff and the increased speed of some outlet
glaciers has enhanced ice discharge across the grounding line. The total surface melt area of the
Greenland ice sheet has continued to increase at the decadal scale since the beginning of the first
passive satellite measurements in 1979, whereas the surface albedo of the ice sheet has decreased
up to 18% in coastal regions, due to melting and snow metamorphism.
Antarctic ice loss appears to have increased over the last two decades, although uncertainty is
relatively large. The West Antarctic ice sheet and the Antarctic peninsula are losing mass at an
increasing rate but the East Antarctic ice sheet gained an average of +21 ± 43 Gt yr–1 between 1992
and 2011. The average rate of ice loss from the Antarctic increased from 30 ± 81 Gt yr–1 (sea-level
equivalent, 0.08 ± 0.22 mm yr–1) over the period 1992–2001, to 147 ± 90 Gt yr–1 over the period
2002–2011 (0.40 ± 0.25 mm yr–1). As much as 74% of the ice discharged from the grounded ice sheet
in the Antarctic passes through ice shelves and floating ice tongues. Ice shelves help to buttress and
restrain flow of the grounded ice, so changes in thickness of ice shelves influence current ice-sheet
change. The ice-shelf extent has been diminishing around the the for several decades with
substantial collapse of a section of Wilkins Ice Shelf. Overall, 7 of 12 ice shelves around the Peninsula
have retreated in recent decades with a total loss of 28 000 km2.
The total ice loss from both ice sheets in Greenland and the Antarctic for the 20 years 1992–2011
(inclusive) has been 4 260 ± 1 460 Gt, equivalent to 11.7 ± 4.0 mm of sea level.
Efforts should be made to: (a) understand the processes related to the increase in mass loss of both
ice sheets through improved observations and in situ measurements (see Action T30); (b) reduce
Action Obtain integrated analyses of snow over both hemispheres
Benefit Improved understanding of changes in global snow
Time frame Continuous
Who Space and research agencies in cooperation with WMO-GCW and WCRP-CliC with advice from TOPC,
AOPC and IACS
Performance
indicator
Availability of snow-cover products for both hemispheres
Annual cost US$ 1–10 million

GCOS 2016 Implementation Plan
- 194 -
uncertainties in estimates of mass balance by improving measurements of ice-sheet topography and
velocity and ice-sheet modelling to estimate future sea-level rises (see Action T31). This includes
utilizing existing satellite data to measure ice velocity, using observations of the time-varying gravity
field from satellites to estimate changes in ice sheet mass, and monitoring changes in ice sheet
topography using tools such as satellite radar and lasers (see Action T32).
Monitoring the polar regions with numerous satellites at various wavelengths is essential for
detecting change (melt area) and to understand processes responsible for the accelerated loss of ice
sheet and the disintegration of ice shelves in order to estimate future sea-level rise. Further, aircraft
observations of surface elevation, ice thickness and basal characteristics should be utilized to ensure
that such information is acquired at high spatial resolution along specific routes, such as glacier flow
lines and along transects close to the grounding lines. In situ measurements (e.g. of firn temperature
profile and surface climate) are equally important in assessing surface-mass balance and
understanding and monitor recent increases in mass loss. Finally, time-variable gravity
measurements from space can provide data on mass gain/loss of ice sheets.
Action T30: Ice-sheet measurements
Action T31: Ice-sheet model improvement
Action T32: Continuity of laser, altimetry and gravity satellite missions
Action Ensure continuity of in situ ice-sheet measurements and field experiments for improved understanding
of processes and for the better assessment of mass-loss changes
Benefit Robust data on trends in ice-sheet changes
Time frame Ongoing
Who Parties, working with WCRP-CliC, IACS and SCAR
Performance
indicator
Integrated assessment of ice sheet change supported by verifying observations.
Annual cost US$ 10–30 million
Action Research into ice-sheet model improvement to assess future sea-level rise; improving knowledge and
modelling of ice–ocean interaction, calving ice-mass discharge
Benefit Improved sea-level rise forecasting
Time frame International initiative to assess local and global sea-level rise and variability
Who WCRP-CliC sea-level cross-cut, IACS and SCAR
Performance
indicator
Reduction of sea-level rise uncertainty in future climate prediction from ice-sheet contributions
Annual cost US$ 1–10 million (mainly by Annex-I Parties)
Action Ensure continuity of laser, altimetry and gravity satellite missions adequate to monitor ice masses over
decadal timeframes
Benefit Sustain ice-sheet monitoring into the future
Time frame New sensors to be launched in 10-30 years
Who Space agencies, in cooperation with WCRP-CliC and TOPC
Performance
indicator
Appropriate follow-on missions agreed
Annual cost US$ 30–100 million

GCOS 2016 Implementation Plan
- 195 -
Permafrost
Permafrost is ground that remains frozen for at least two years (as measured by permafrost
temperatures and depth of seasonal freezing/thawing). It reacts sensitively to climate and
environmental change in high-latitude and mountainous regions. Changes may result in important
impacts on terrain stability, coastal erosion, surface and subsurface water, the carbon cycle and
vegetation development.
The Global Terrestrial Network for Permafrost (GTN-P), coordinated by the International Permafrost
Association (IPA), forms a GCOS/GTOS baseline network for these variables. The Arctic Council
maintains borehole metadata files and coordinates thermal data management and dissemination.
Every five years, NSIDC prepares and distributes a Circumpolar Active Layer Permafrost System CD
containing information and data acquired in the previous five years.
GTN-P currently comprises 16 participating countries, with hundreds of active sites in the
Circumpolar Active Layer Monitoring (CALM) network and identified boreholes for monitoring
permafrost thermal states. While some of these need to reactivate their measurement campaigns
and soil vertical displacement measurements, permafrost temperature measurements should
become a part of active layer monitoring. GTN-P has also identified new borehole and active layer
sites needed to obtain representative coverage in the Europe/Nordic region, within the Russian
Federation and within Central Asia (Mongolia, Kazakhstan and China); in the southern hemisphere
(South America, Antarctic); and in North American mountain ranges and lowlands. A few reference
sites have been recommended for development and this would establish a baseline network of
thermal state of permafrost sites within the International Network of Permafrost Observatories
(INPO).
Presently, GTN-P in situ data acquisition operates on a largely voluntary basis through individual
national and regionally sponsored programmes. Measurement and reporting standards are
emerging, but further work is needed to prepare and publish definitive reporting standards.
Upscaling techniques for research sites and permafrost networks, initially on upgraded reference
sites, are required to complement active-layer and thermal observing networks with monitoring of
active geological processes (slope processes, thermokarst and lake development, coastal dynamics,
surface terrain stability).
Action T33: Standards and practices for permafrost
Action Refine and implement international observing standards and practices for permafrost and combine
with environmental variable measurements; establish national data centres
Benefit Consistent and comparable global observations
Time frame Complete by 2018
Who Parties’ national services/research institutions and IPA
Performance
indicator
Implementation of guidelines and establishment of national centres
Annual cost US$ 100 000–1 million

GCOS 2016 Implementation Plan
- 196 -
Action T34: Mapping of seasonal soil freeze/thaw
5.5 Biosphere
A number of activities across several ECVs have been identified to improve their quality and
consistency. Several ECVs should be consistent with each other, e.g. Fire and Albedo, FAPAR, LAI and
Albedo, but this is not always the case.
Some research groups running carbon or climate models have already begun to assimilate one or
more of three satellite-derived products land ECV products (FAPAR, LAI and Albedo) and have noted
improvements in the models’ performance. Further collaboration between the scientific
communities involved is expected to result in improved methods and data for assimilation and
reanalysis purposes. This goal will also require extensive benchmarking and product-validation
activities, as well as ensuring the physical consistency between the three.
Table 19. Issues identified with terrestrial biosphere observations
ECV Significant findings in the 2015 Status Report
Albedo Satellite products available. Land-use change (land-cover change) such
as deforestation and conversion of natural covers to crops/pasture were
identified in AR5WG1 (page 54-55) as contributors to albedo variability
with large uncertainties particularly at higher latitudes due to increases
in snow cover.
FAPAR While absolute accuracy is a known issue for FAPAR, an important factor
for carbon modelling is in the capability to represent the observed
spatio-temporal changes.
LAI While absolute accuracy is a known issue for LAI, an important factor for
carbon modelling is in the capability to represent the observed spatio-
temporal changes.
Land-surface temperature
(LST)
Separation of the soil and vegetation components of the LST
measurement; this is related to surface emissivity.
Land cover (including
vegetation type)
Land-use change (mainly in the tropics) remains most uncertain flux in
global anthropogenic CO2 budget (see IPCC AR5, Table 6.1).
Above-ground biomass Widely varying national standards and no access to national inventory
data
Soil carbon Insufficient in situ measurements; approaches to monitoring change
needed
Fire Significant progress has been made with improvements in satellite
observations.
Action Implement operational mapping of seasonal soil freeze/thaw through an international initiative for
monitoring seasonally frozen ground in non-permafrost regions and active layer freeze/thaw in
permafrost regions
Benefit Improved understanding of changes in biosphere and carbon cycle
Time frame Complete by 2020
Who Parties, space agencies, national services and NSIDC, with guidance from IPA, the IGOS Cryosphere
Theme team, and WMO-GCW
Performance
indicator
Number and quality of mapping products published.
Annual cost US$ 1–10 million

GCOS 2016 Implementation Plan
- 197 -
Figure 17. Time and spatial dimensions of the selected biospheric processes (boxes) of interest
compared with the ECV requirements for the global ECV products specified in Annex A (red crosses)
Action T35: Ensure the consistency of the various radiant energy fluxes
In addition, climate change indictors should be derived from these ECVs to serve adaptation (Action
T36). These indicators should be transparent with known uncertainties.
Action T36: Climate change indicators for adaptation
Action Establish a system to ensure the consistency ECV. Initially focusing on:
(a)The various radiant energy fluxes (e.g. surface albedo and FAPAR) derived from remote-sensing
observation, and their compatibility with the specific requirements of the models, especially in the
context of climate change studies; (b) fire and surface albedo, especially in the context of climate
change studies.
Benefit Improved data leading to improved model predictions and understanding of changes in biosphere
Time frame 2020
Who CEOS WG Cal/Val, TOPC observers, CEOS/CGMS WG Climate
Performance
indicator
Documented system to ensure consistency; reports demonstrating consistency
Annual cost U US$ 100 000–1 million
Action Establish climate change indicators for adaptation issues using land ECVs at high resolution
Benefit Inputs into adaptation planning, damage limitation and risk assessments
Time frame Initial products by 2018; ongoing development and improvement
Who GCOS, GCOS Science panels, WCRP, GFCS
Performance
indicator
Availability of indicators
Annual cost US$ 100 000–1 million

GCOS 2016 Implementation Plan
- 198 -
FAPAR, LAI and Albedo
FAPAR is defined as the fraction of Photosynthetically Active Radiation (solar radiation reaching the
surface in the 0.4-0.7μm spectral region) that is absorbed by a vegetation canopy. Spatially detailed
descriptions of FAPAR provide information about the strength and location of terrestrial carbon sinks
and can be of value in verifying the effectiveness of the Kyoto Protocol’s flexible implementation
mechanisms. FAPAR can also be used for adaptation purposes, such as for food security (or crop
monitoring) that needs to be provided at a higher spatial resolution scale. GCOS encourages the
space agencies and other entities to continue generating and disseminating from 10-day to monthly
FAPAR products at various spatial resolutions, from 50 m to 5 km over the globe for serving both
adaptation applications (50 m) and carbon and climate modellers’ community (5 km). Both black-sky
(assuming only direct radiation) and white-sky (assuming that all the incoming radiation is in the form
of isotropic diffuse radiation) FAPAR values may be considered. Similarly, FAPAR can be angularly
integrated or instantaneous (at the actual sun position of measurement). FAPAR is recovered from a
range of sensors by various algorithms using the visible and near-infrared parts of the spectrum, and
the accuracy and reliability of these products is not always properly documented. The majority of
operational global FAPAR products are derived from a variety of retrieval methods that are often
dedicated for particular space mission sensors, under several assumptions, including various
radiative transfer canopy models and/or auxiliary datasets, such as land-cover type.
The LAI of a plant canopy is defined as a quantitative measure of the amount of live, green-leaf
material present in the canopy per unit ground surface. Specifically, it is defined as the total one-
sided area of all leaves in the canopy within a defined region and is a non-dimensional quantity,
although units of m2/m2 are often quoted as a reminder of its meaning. However, the definition of
LAI used in space remote-sensing science is linked to the state variable corresponding to the canopy
optical depth measured along the vertical. When LAI is retrieved from remote-sensing
measurements, by inverting a radiation transfer model, its value corresponds to an effective value
linked to the particular spatial resolution of those measurements. The conversion of geometrical
measurements to effective values is an essential step and requires additional information about the
structure and architecture of the canopy, e.g. gap-size distributions at the appropriate spatial
resolutions. As for FAPAR, there is a need to continue to generate and disseminate from 10-day to
monthly LAI products at various spatial resolutions, from 50 m to 5 km, over the globe for serving
both adaptation applications and carbon and climate modellers community applications.
Currently available products have been shown to exhibit significant differences, which may detract
from their usefulness in downstream applications. The CEOS Working Group on Calibration and
Validation (WGCV), in collaboration with GCOS, should lead the comparison and evaluation of these
LAI and FAPAR products, as well as the benchmarking of the algorithms used to generate them.
Reference sites making ground-based FAPAR and LAI observations should be fully engaged in the
validation process and it would be desirable if these sites were collocated with the terrestrial
reference sites proposed in Part II, Section 5.2.2, provided that these sites offer a reasonable degree
of spatial homogeneity over spatial scales comparable to the resolution of the sensors. WGCV is
identifying a core set of sites and measurement campaigns, which should be supported by CEOS
agencies and by national research budgets. The number of actual sites available is insufficient,
however, and the quality of ground-based measurements estimates is inadequate.

GCOS 2016 Implementation Plan
- 199 -
Action T37: Quality of ground-based reference sites for FAPAR and LAI
Surface albedo is a joint property of the land and of the overlying atmosphere; it controls the
“supply” side of the surface radiation balance and is required to estimate the net absorption and
transmission of solar radiation in the soil-vegetation system. The term “albedo” refers to a variety of
different geophysical variables which correspond to different definitions and measurements.
Broadband surface albedo is generally defined as the instantaneous ratio of surface-reflected
radiation flux to incident radiation flux over the short-wave spectral domain (dimensionless). Albedo
can be defined for broad spectral regions or for spectral bands of finite width. Albedo measures
retrieved from satellite imagery include black-sky albedo (or directional hemispherical reflectance
(DHR)) defined in the absence of a diffuse irradiance component (no atmospheric scattering), wholly
diffuse white sky albedo (or bihemispherical reflectance (BHR) under isotropic illumination) and as
actual or blue-sky BHR under ambient conditions.77 The latter is the quantity measured by ground-
based instruments and used in climate models. It can be expressed as a linear combination of the
white- and black-sky albedo. It is both a forcing variable controlling the climate and a sensitive
indicator of environmental degradation. Albedo varies in space and time as a result of both natural
processes (changes in solar position, snow cover, vegetation growth) and human activities (clearing
and planting forests, sowing and harvesting crops, burning rangeland). The surface albedo used in
climate models corresponds to the ratio of total incoming to total outgoing radiation (mainly over
the entire solar radiation (short-wave) range, in practice the 350–4 000 nm). Knowledge of surface
albedo is of critical importance to land-surface monitoring and modelling, particularly with regard to
considerations of climate and the biosphere but also the cryosphere. Its value lies primarily in its role
in energy-budget considerations within climate or weather-prediction models, in that the proportion
of (short-wave) radiation absorbed by the surface is converted to heat energy or used in biochemical
processes such as photosynthesis. It means that albedo is not only an intrinsic surface product
related to the structural scattering properties of the land surface, but is also conditioned by both the
spectral and directional nature of the overlying atmosphere and solar illumination conditions. As the
scattering of light by land surfaces (the surface anisotropy) depends on the direction of incoming
radiation and the direction of observation, various albedo definitions have been introduced.
77 Schaaf, C.B., J. Cihlar, A. Belward, E. Dutton and M. Verstraete, 2009: Albedo and Reflectance Anisotropy, ECV-T8: GTOS
Assessment of the status of the development of standards for the Terrestrial Essential Climate Variables. R. Sessa (Ed.),
FAO, Rome.
Action Improve the quality and number of ground-based reference sites for FAPAR and LAI; agree minimum
measurement standards and protocols; conduct systematic and comprehensive evaluation of
ground-based measurements for building a reference sites network
Benefit Ensure quality assurance of LAI and FAPAR products
Time frame Network operational by 2020
Who Parties’ national and regional research centres, in cooperation with space agencies and Copernicus
coordinated by CEOS WGCV, GCOS and TOPC
Performance
indicator
Data available
Annual cost US$ 1–10 million

GCOS 2016 Implementation Plan
- 200 -
The term 'albedo' refers to a variety of different geophysical variables, which correspond to different
definitions and measurements. Climate models typically require BHR in the short-wave broadband,
whereas carbon models may use the visible and near-infrared broadband values. Existing products
generated by different instruments or space agencies at spatial resolutions ranging from 1 km to 5
km lack consistency and exhibit small but consistent biases, especially for higher values (over snow
and ice) that need to be resolved.
Action T38: Improve snow and ice albedo products
This calls for comprehensive evaluation of the corresponding algorithms, the comparison of these
albedo estimates with spatially representative ground-based measurements such as those available
from FluxNet and the BSRN and the benchmarking and cross-comparison of these products. Progress
along these lines will consolidate confidence in the algorithms and justify the reprocessing of existing
archives to generate long and coherent time series of global albedo products at the best available
resolution, as well as going back to past AVHRR instruments and geostationary meteorological ones
for achieving CDRs over the last 30 years. A fully characterized global albedo product will be valuable,
not only for climate studies, but also as a reference for further studies.
Action T39: Improve in situ albedo measurements
Action Improve quality of snow (ice and sea ice) albedo products
Benefit Improve consistency of datasets
Time frame 2018
Who Space agencies and Copernicus coordinated through CEOS WGCV LPV, WMO Space Pprogramme, with
advice from GCOS and TOPC
Performance
indicator
Product available
Annual cost US$ 100 000–1 million
Action Improve quality of available in situ validation measurements and collocated albedo products, as well
as BHR factors and measures of surface anisotropy from all space agencies generating such products;
promote benchmarking activities to assess the reliability of albedo products
Benefit Improved calibration and validation
Time frame Full benchmarking/intercomparison by 2012
Who BSRN and spatially representative FLUXNET sites, space agencies in cooperation with CEOS WGCV LPV
Performance
indicator
Data available to analysis centres
Annual cost US$ 1–10 million

GCOS 2016 Implementation Plan
- 201 -
Action T40: Production of climate data records for LAI, FAPAR and Albedo
Accuracy of these past and current estimates will need to be assessed, in particular with respect to
their sensitivity to perturbing factors because major algorithms used to generate albedo products
from these systems rely typically on the accumulation of data over two weeks or more, when surface
properties can change appreciably, e.g. with the occurrence or disappearance of snow on the
ground. As the LAI and FAPAR products, surface albedo algorithms should be benchmark through a
model-based approach.
The various surface albedo products should be intercompared and evaluated with respect to albedo
measures from spatially representative towers over a range of surface-cover types. Satellite inter-
comparison and validation activities can be supported with the definition of well-characterized sites
such as the Surface Albedo Validation Sites (SAVS) database (DOI: 10.15770/EUM_SEC_CLM_1001).
BSRN data, archived at the World Radiation Monitoring Centre (Alfred Wegener Institute,
Bremerhaven, Germany) are now recognized as the GCOS baseline network for surface radiation
(GCOS 2004). The BSRN sites provide the high-quality measurements of surface radiation required,
but the network global coverage is insufficient for widespread validation of remotely sensed
products and needs to be expanded and adequately supported (GCOS, 2004; GTOS_ECV8). In
addition, other terrestrial networks contain tower sites which could provide the necessary
infrastructure to measure radiation variables for albedo calculations (human maintenance,
instrument availability, site accessibility, power needs). The challenges in these cases are to
encourage the use of best-practice measurement, calibration and archive protocols, and provide
timely access (GTOS_ECV8). To improve the spatial coverage of albedo measurements, the use of
unmanned aerial vehicles (UAV) as instrument platforms can also be considered.
Action Operationalize the generation of
10-day and monthly FAPAR and LAI products as gridded global products at 5 km spatial resolution
over time periods as long as possible;
10-day FAPAR and LAI products at 50 m spatial resolution;
Daily (for full characterization of rapidly greening and senescing vegetation, particularly over higher
latitudes with the rapid changes due to snowfall and snowmelt), 10-day and monthly surface
albedo products from a range of sensors using both archived and current Earth observation
systems as gridded global products at 1 km to 5 km spatial resolution of over time periods as long
as possible
Benefit Provide longer time records for climate monitoring
Time frame 2020
Who Space agencies, Copernicus and SCOPE-CM coordinated through CEOS WGCV LPV
Performance
indicator
Operational data providers accept the charge of generating, maintaining and distributing global
physically consistent ECV products
Annual cost US$ 100 000–1 million

GCOS 2016 Implementation Plan
- 202 -
Action T41: Evaluate LAI, FAPAR and Albedo
Land-surface temperature
Land-surface temperature is a new ECV introduced in this implementation plan.
Land-surface temperature is a measure of how hot or cold the uppermost surface of the Earth is. For
ground-based, air- and space-borne remote-sensing instruments, it is the aggregated radiometric
surface temperature of the ensemble of components within the sensor field of view. LST is an
independent temperature dataset for quantifying climate change in complimentarity to the near-
surface air temperature ECV based on in situ measurements and reanalyses.
From a climate perspective, LST is important for the evaluation of land–atmosphere exchange
processes; constraint of surface energy budgets and flux variations; and global and regional
observations of surface temperature variations.
LST can be determined from thermal emission at wavelengths in IR or MW atmospheric windows; LST
from IR is currently used more widely for climate applications, owing to a lack of long-term MW LST
estimates.
Single-sensor IR LST data products from satellite have greatly improved with IR LST data validation
showing biases < 1.0 K with an emissivity uncertainty < 0.015 (1.5%) from MODIS and Advanced
Along-Track Scanning Radiometer (AATSR). The approach to uncertainties is consistent with SST
validation. Global LST data which resolve the diurnal cycle are becoming available, merging
geostationary and low Earth orbit data, giving high spatial resolution, sub-diurnal sampling and
estimates of cloud-bias.
Current state-of-the-art LST datasets are now of sufficient quality: they have low bias, realistic
uncertainties, independence of in situ data, excellent stability/homogeneity and improving
traceability.
The International Land Surface Temperature and Emissivity Working Group (ILSTE) represents the
best available expertise in LST, emissivity data techniques and LST-related science. It acts as an
international forum for regular interactions between LST measurement teams, enabling
improvements in data algorithms and data quality and increased understandings of user
requirements and delivers a range of user-provider meetings and workshops, increasing links across
the community. ILSTE supports the alignment of LST best practice with the planned activities and
Action Promote benchmarking activities to assess reliability of FAPAR and LAI products, taking into account
their intrinsic definition and accuracy assessment against fiducial ground references and evaluate
the Albedo products with high-quality tower data from spatially representative sites
Benefit Improved accuracy of data
Timeframe Evaluation by 2019
Who Space agencies and Copernicus in relation with CEOS WGCV, GCOS/TOPC
Performance
indicator
Publish results
Benefit Recommendations after gap analysis on further actions for improving algorithms
Annual cost US$ 10 000–100 000

GCOS 2016 Implementation Plan
- 203 -
data provision of operational agencies; agrees standardized protocols for data formats and access to
data, appropriate to key sectors of the LST user community; and supports a dedicated validation
group, supporting a consistent approach to data validation, in line with CEOS-LPV best practices and
linking individual validation projects.
Table 20. Requirements of land surface temperature for climate
Item Type Value
Horizontal resolution Threshold 0.05°
Temporal resolution Threshold Day-night
Target ≤ 3-hourly
Accuracy Threshold <1 K
Precision Threshold <1 K
Stability Threshold <0.3 K per decade
Target <0.1 K per decade
Length of record Threshold 20 years
Target >30 years
In addition it is proposed that:
(a) Emissivity values are reported with ECV LST data;
(b) Land surface radiometric temperature78 (LSRT) is also reported as part of ECV LST data (although
sensor- and channel-specific).
GCOS will promote consistent, standardized protocols for LST to ensure consistent and comparable
data products. The continuing production of LST datasets using these protocols should be ensured
and existing datasets re-processed with them to allow long time series of data to be established.
Improving the in situ ground-based networks of measurement sites will improve the accuracy of the
overall results.
Action T42: Land-surface temperature: in situ protocols
78 LSRT is the observed radiometric temperature of the scene, i.e. the derived net surface emission term following
atmospheric correction of observed radiances.
Action Promote standardized data protocols for in situ LST and support the CEOS-LPV group in development
of a consistent approach to data validation, taking its LST Validation Protocol as a baseline
Benefits LST datasets will be more accessible to users, encouraging user uptake of more than one LST dataset.
This will lead to better characterisation of uncertainties and inter-dataset variability.
Time frame Network concept and approach by 2017; implementation by 2018
Who Parties’ national services and research agencies, space data providers, GOFC-GOLD, NASA LCLUC,
TOPC, CEOS WGCV/LPV
Performance
indicator
Availability of protocols and evidence of their use.
Annual cost US$ 1 000–10 000

GCOS 2016 Implementation Plan
- 204 -
Action T43: Production of land-surface temperature datasets
Action T44: Reprocessing land-surface temperature
Action T45: Land-surface temperature in situ network expansion
Action Continue the production of global LST datasets, ensuring consistency between products produced
from different sensors and by different groups
Benefits Make available long time series of LST datasets in consistent formats, enabling more widespread use
of LST for climate applications
Time frame Continual
Who Space agencies
Performance
indicator
Up-to-date production of global LST datasets
Annual cost US$ 10 000–100 000
Action Reprocess existing datasets of LST to generate a consistent long-term time series of global LST; in
particular, reprocess archives of low Earth orbit and geostationary LST observations in a consistent
manner and to community-agreed data formats
Benefits Make available long time series
Time frame Network concept and approach by 2017; implementation by 2018
Who Parties’ national services and research agencies, space data providers, GOFC-GOLD, NASA LCLUC,
TOPC, CEOS WGCV/LPV
Performance
indicator
Availability of long time series of LST datasets
Annual cost US$ 100 000–1 million
Action Expand the in situ network of permanent, high-quality IR radiometers for dedicated LST validation
Benefits LST datasets better validated and over more land-surface types; independent validation of stated
accuracies providing credibility to satellite LST products
Time frame Network concept and approach by 2017; implementation by 2018
Who Parties’ national services and research agencies, space data providers, GOFC-GOLD, NASA LCLUC,
TOPC, CEOS WGCV/LPV, ILSTE
Performance
indicator
Establishment of a comprehensive network of ground sites with high-quality in situ measurements
suitable for validating the different sensors; results from in situ radiometer intercomparison exercises
Annual cost US$ 1–10 million (10-20 sites at US$ 100 000 per site)

GCOS 2016 Implementation Plan
- 205 -
Action T46: Land-surface temperature radiometric calibration
Land cover
Land cover and its changes modify the goods and services provided to human society (the provision
of food and fibre, recreational opportunities, etc.) force climate by altering water and energy
exchanges with the atmosphere and change greenhouse gas and aerosol sources and sinks. Land-
cover distribution is partly determined by regional climate, so changes in land cover may indicate
climate change.
Currently available datasets vary in terms of data sources employed and spatial resolution and
thematic content, have different types and patterns of thematic accuracy and use different land-
cover classification systems reflecting the various user needs. There are dedicated land-cover
monitoring initiatives that directly develop land-cover products to serve the climate science
community and respond to ECV requirements (ESA land-cover CCI).
Present-day technology provides satellite-based optical systems at 10 m–30 m resolution with
temporal, spectral and data acquisition characteristics that are consistent with previous systems.
Commitments to long-term continuity of this class of observations, such as the Landsat Data
Continuity Mission and Sentinel-2, are vital. The CEOS Land Surface Imaging Constellation has been
instigated to promote the effective and comprehensive collection, distribution and application of
space-acquired imagery of the land surface.
Datasets characterizing global land cover are currently produced at resolutions of between 30 m and
1 km by several space agencies in close cooperation with the research community (especially those
research groups participating in Global Observation of Forest and Land Cover Dynamics (GOFC-
GOLD)), the NASA Land Cover Land Use Change Progam, ESA’s climate change initiative and the
National Geomatics Centre of China. A range of approaches has been adopted, including centralized
processing using a single method of image classification (MODLAND, GlobCover, Land Cover Climate
Change Initiative) and a distributed approach using a network of experts applying regionally specific
methods (e.g. GLC2000). Keeping such networks active in the long term remains a challenge (See
Action T47). Using a single source of satellite imagery and a uniform classification algorithm has
benefits in terms of consistency, but may not yield optimum results for all regions and all land-cover
types. Automated land-cover characterization and land-cover change monitoring remains a research
priority.
It is necessary that land-cover classification systems and the associated map legends adhere to
internationally agreed standards, which should be agreed upon by the UN/ISO Terrestrial
Action Radiometric calibration intercomparisons and uncertainties for LST sensors
Benefits LST datasets better calibrated and over all land-surface types for different satellite sensors;
independent calibration providing credibility and traceability of data and uncertainties
Time frame Network concept and approach by 2017; implementation by 2018
Who Coordinated by CEOS WGCV Infrared and Visible Optical Sensors subgroup/GSICS and supported by
space agencies
Performance
indicator
ECV generators taking into account radiometric calibration uncertainties, ideally with calibrations
being referenced to a common framework
Annual Cost US$ 1–10 million

GCOS 2016 Implementation Plan
- 206 -
Framework. Full benefit should be taken of existing initiatives, such as the FAO-UNEP Land Cover
Classification System/Land Cover Meta Language (LCML) for legend harmonization and translation,
and the legends published by the International Geosphere-Biosphere Programme and GOFC-GOLD.
Regarding product needs, 10 m–30 m scale land-cover maps that enable change analysis should be
produced annually (See Action T48), documenting the spatial distribution of land-cover
characteristics with attributes suitable for climate modelling, mitigation and adaptation activities,
and ecosystem models. Land-cover maps at moderate resolutions (250 m–1 km) that enable change
analysis should be developed to meet the needs of some climate change communities (See Action
T49). Grid-scale information on the percentage of tree, grass and bare soil cover should ideally also
be made available. The Global Forest Watch initiative has been providing pixel-level, tree-cover
percentage information at scale of 30 m since 2000.
Global land-cover databases must also be accompanied by a description of class-by-class
thematic/spatial accuracy to meet the transparency needs for a proper and informed use of such
datasets. The CEOS WGCV, working with GOFC-GOLD and GLCN has published agreed validation
protocols, which should be used. The current protocols base accuracy assessment on a sample of
high-resolution (1 m–30 m) satellite imagery, itself validated by in situ observations wherever
possible. To better quantify changes in land-cover characteristics, these high-resolution data should
also be used for wall-to-wall global mapping at resolutions of 10 m–30 m. The global land-cover
reference data portal of GOFC-GOLD provides an access to some reference datasets.
The global-scale sample-based FAO Forest Resource Assessment (FRA) initiative allows the
monitoring of forest cover change on a five-year basis. Some studies79 allowed the identification by
photo-interpretation of the follow-up land use after deforestation between 1990 and 2005, for which
expertise is required. This highlights the current difficulty of developing global-scale, wall-to-wall
land-use products allowing change analysis that are needed by the climate modellers and mitigation
and adaptation communities (the latter two user groups on an annual basis) (See Actions T47 and
T50).
Further work is also needed to understand how the Land cover ECV products relate to the map
products needed for forest monitoring and reporting activities as part of the REDD+ mechanism
(AFOLU sector as defined by UNFCCC). The list of map products proposed by the Global Forest
Observation Initiative (GFOI) in its Method and Guidance Document (MGD) should be used as a
reference.
79
De Sy et al., 2015Land use patterns and related carbon losses following deforestation in South America. Environmental
Research Letters, 10:12. DeSy, 2016: Remote sensing of land use and carbon losses following tropical deforestation.
Wageningen University. ISBN 9789462578036

GCOS 2016 Implementation Plan
- 207 -
Action T47: Land-cover experts
Action T48: Annual land-cover products
Action T49: Land-cover change
Action Maintain and strengthen a global network of land-cover/land-use experts to: develop and update an
independent, very high spatial-resolution reference dataset for global land-cover map accuracy
assessment;and facilitate access to land-use and management information to support the
development of global-scale land-use products
Benefits For GLC map developers, GLC map users
Time frame Network concept and approach by 2017; implementation by 2018
Who GOFC-GOLD, CEOS WGCV/LPV, Parties’ national services and research agencies, space data providers,
NASA LCLUC, TOPC
Performance
indicator
Global LC map developers using the reference data developed by the operational network
Annual cost US$ 100 000–1 million
Action Generate annual land-cover products over key regions that allow change assessment across time
(including for the six IPCC AFOLU land categories) at 10 m–30 m spatial resolutions, according to
internationally agreed standards and accompanied by statistical descriptions of their accuracy
Benefits For mitigation and adaptation communities
Time frame 2017 and beyond
Who Space agencies, GOFC-GOLD, Copernicus Land Service, USGS, University of Maryland (UMD)-
GoogleEarth
Performance
indicator
Product delivered and used by a large community; use of standard approaches for validation and
uncertainty metrics
Annual cost US$ 1–10 million
Action Generate global-scale land-cover products with an annual frequency and long-term records that allow
change assessment across time (including as much as possible for the six IPCC AFOLU land categories),
at resolutions between 250 m and 1 km, according to internationally agreed standards and
accompanied by statistical descriptions of their accuracy
Benefits To climate change modellers, others
Time frame 2017 and beyond
Who Space agencies, research institutes, GOFC-GOLD, Copernicus Land Service
Performance
indicator
Product delivered and used; use of standard approaches for validation and uncertainty metrics
Annual cost US$ 1–10 million

GCOS 2016 Implementation Plan
- 208 -
Action T50: Land-cover community consensus
Action T51: Deforestation
Above-ground biomass
Current continental- to global-scale maps of biomass are mainly based on data from sensors that are
now defunct. The maps of northern hemisphere boreal and temperate forest biomass are derived
from a long time series of C-band radar data produced by the Envisat ASAR instrument, which failed
in April 2012. Estimates of the biomass in lower biomass tropical woodlands relied on the Japanese
Space Agency (JAXA) ALOS-PALSAR L-band radar, which failed in May 2011. Existing pan-tropical
biomass maps are largely based on height measurements from the Geoscience Laser Altimeter
System onboard Icesat, which failed in 2009. There are continuing efforts to improve these maps by
employing new forest inventory data, together with data from the Sentinel-1 C-band radar satellites
and the JAXA PALSAR-2 L-band radar (e.g. ESA GlobBiomass). These efforts should be encouraged,
but a major focus in the next 5–10 years must be to prepare for, and exploit, the unprecedented
array of space missions that will be deployed between 2019–2021 to measure forest structure and
biomass. These include the ESA BIOMASS mission, a P-band radar dedicated to global forest biomass
measurements, the NASA Global Ecosystem Dynamics Investigation lidar on the International Space
Station, which aims to provide the first global, high-resolution observations of the vertical structure
of tropical and temperate forests, and the NASA-ISRO NISAR L- and S-band radar mission. In addition,
although forest biomass is not a primary mission objective, the Argentinian SAOCOM 1A L-band
satellite, scheduled for launch in 2017, will help to provide biomass estimates in lower biomass
forests.
Action Develop a community consensus strategy and priorities for monitoring to include information on land
management in current land-cover datasets and start collecting relevant datasets and observations,
building on ongoing activities
Benefits To climate change modellers, mitigation and adaptation user communities
Time frame Concept and approach by 2017; start Implementation by 2018
Who Parties’ national services and research agencies, space agencies, GOFC-GOLD, NASA LCLUC, TOPC,
UMD-GoogleEarth, CEOS, ESA, USGS, GOFC-GOLD, FAO, GEO
Performance
indicator
Product delivered and used
Annual cost US$ 100 000–1 million
Action Develop yearly deforestation (forest clearing) and degradation (partial clearing) for key regions that
allow change assessment across time at 10 m–30 m spatial resolutions, according to internationally
agreed definitions.
Benefits To provide annual monitoring of deforestation and forest degradation to support management and
reporting
Time frame Concept and approach by 2017; implementation by 2018
Who Parties’ national services and research agencies, space agencies, GOFC-GOLD, NASA LCLUC,
UMD-GoogleEarth, TOPC.
Performance
indicator
Indicators-based standard validation approach for change of forest cover and attributions associated
with deforestation and degradation; product delivered and used
Annual cost US$ 100 000–1 million

GCOS 2016 Implementation Plan
- 209 -
Underpinning all these missions is provision of in situ and airborne data for algorithm training and
validation. Because the missions overlap in time, a collaborative approach to gathering such
supporting data would be hugely advantageous and steps towards this have already been taken.
Even more fundamental is to consider combined use of the data from these sensors to optimize
biomass estimates.
The production of regional- to national-scale biomass maps from airborne lidar is a recent
development that is important in its own right and as part of the resource for training and validating
spaceborne estimates of biomass. Where possible, these data should be made available to the wider
community. Also of great importance are the high-quality reference biomass data embodied in key
in situ networks, such as Afritron (Africa), Rainfor (Amazonia) and that led by the Smithsonian’s
Center for Tropical Forest Science. These need to be extended to cover a wider range of forest types,
particularly in the tropics, where there are the greatest uncertainties in biomass and where we need
most information on emissions due to deforestation and forest degradation and uptake due to forest
regrowth.
In the interim, biomass estimates will continue to be made following IPCC methods and based on
satellite observations of land cover and forest type, in situ measurements of above-ground biomass,
forest inventories and land surveys. Data collected for the land cover ECV will aid this endeavour,
particularly 30 m resolution land-cover and forest maps.
Action T52: Collaboration on above ground biomass
Action T53: Above-ground biomass validation strategies
Action Encourage inter-agency collaboration on developing optimal methods to combine biomass estimates
from current and upcoming missions (e.g. ESA BIOMASS, NASA GEDI and NASA-ISRO NiSAR, JAXA
PALSAR, CONAE SAOCOM)
Benefits Reduced error, cross-validation, combining strengths of different sensors in different biomass ranges
Time frame Most key missions are expected to be in orbit between 2016 and 2020
Who ESA, NASA, JAXA, NASA-ISRO, CONAE
Performance
indicator
A strategy to combine biomass estimates from different sensors, together with algorithms and
processing methods
Annual cost US$ 100 000–1 million
Action Encourage inter-agency collaboration to develop validation strategies for upcoming missions aimed at
measuring biomass (e.g. ESA BIOMASS, NASA GEDI and NASA-ISRO NiSAR), to include combined use of
in situ and airborne lidar biomass measurements
Benefits Potential to produce more comprehensive validation of biomass estimates by cost-sharing. Greater
consistency between biomass estimates from different sensors because of assessment against
common reference data
Time frame From now until the operational phase of the various sensors (2016–2022).
Who ESA, NASA, JAXA, NASA-ISRO, CONAE
Performance
indicator
Formal agreement between agencies on a strategy for joint gathering and sharing of validation data,
together with funding of specific elements of the overall set of validation data
Annual cost US$ 10 000–100 000

GCOS 2016 Implementation Plan
- 210 -
Action T54: Above-ground biomass validation sites
Action T55: Above-ground biomass data access
Action T56: Above-ground biomass: forest inventories
Soil carbon
In order to know the soil carbon stocks a number of parameters need to be measured, in particular
the percentage of carbon (%C) in the soil and the bulk density (or an estimate of it from pedotransfer
functions). The depth of soil also needs to be considered. While, for mineral soils, stocks of soil
organic carbon to 1 m are sufficient (30 cm is also needed for reporting to the UNFCCC following IPCC
guidelines), for histosols (peats), the total depth of the soil is needed.
Action Develop a set of validation sites covering the major forest types, especially in the tropics, at which
high-quality biomass estimations can be made, using standard protocols developed from ground
measurements or airborne lidar techniques
Benefits Essential to give confidence in satellite-derived biomass estimates at global scale
Time frame From now up to the operational phase of the various sensors (2018–2022)
Who Space agencies working with key in situ networks (e.g. RainFor, Afritron, the Smithsonian Center for
Tropical Forest Science), GEO-GFOI
Performance
indicator
Establishment of a comprehensive network of ground sites with high-quality, in situ biomass estimates
with uncertainty assessments suitable for validating the different sensors
Annual cost US$ 30–100 million (50 tropical sites covering all forest types: US$ 20 million); estimate for temperate
and boreal sites not yet formulated
Action Promote access to well-calibrated and validated regional- and national-scale biomass maps that are
increasingly being produced from airborne lidar.
Benefits Greatly extends the representativeness of data available for validating satellite-derived biomass data,
since a much greater range of land types and forest conditions will be covered
Time frame From now until the operational phase of the various sensors (2016–2022)
Who GEO-GFOI, other national and international bodies producing biomass maps
Performance
indicator
Availability of multiple regional- to country-scale maps of biomass derived from airborne lidar; use of
standard protocols for uncertainty assessment of lidar estimation of biomass
Annual cost US$ 10 000–100 000 (does not include monitoring costs)
Action Improve access to high-quality forest inventories, especially in the tropics, including those developed
for research purposes and REDD+
Benefits Extends the data available for validating satellite-derived biomass data
Time frame From now until the operational phase of the various sensors (2016–2022)
Who GEO-GFOI, other national and international bodies producing or funding forest inventories
Performance
indicator
Access to databases of georeferenced biomass measurements derived from ground measurements for
forest-inventory purposes
Annual cost US$ 10 000–100 000

GCOS 2016 Implementation Plan
- 211 -
None of this can easily be remotely sensed. Existing efforts include the Harmonized World Soil
Database (HWSD), the Global Soil Map80 and SoilGrids250 m. 81,82
In addition, there are initiatives to map peatlands/permafrosts in the north, such as the Northern
Circumpolar Soils Database83 but other regions (such as tropical peatlands and permafrosts on the
Tibetan Plateau) are less well characterized.
A limited number only of resampling exercises track changes over time globally. Collating various
resampling data (e.g. 30 years apart) would be a useful exercise. Reconstructions of centennial- to
millennial-scale variability in carbon accumulation, such as in peatlands, can be useful to assess the
carbon cycle over longer timescales (natural, “baseline” levels).
At terrestrial sites providing data on other fluxes (e.g. Fluxnet sites), it would be useful to have five
yearly measurements of soil C (%C, bulk density, to 30 cm and to 1 m) and a record of management
activities (if any) at each site. This could provide a network of sites with which one could examine
change in soil carbon over time, perhaps complemented by coupling with existing global networks of
long-term experiments that are monitoring soil-carbon change over time in various land uses (mostly
agricultural)84.
Action T57: Soil carbon: carbon mapping
Action T58: Soil-carbon change
80
http://globalsoilmap.net/http://globalsoilmap.net/, 81
https://www.soilgrids.org/#/?layer=geonode:taxnwrb_250m 82
Available databases are listed at: http://eusoils.jrc.ec.europa.eu/ESDB_Archive/soil_data/global.htm and the World Data
Centre for Soils http://www.isric.org/content/data. 83
http://bolin.su.se/data/ncscd/http://bolin.su.se/data/ncscd/ 84
e.g.: http://iscn.fluxdata.org/Data/LTSEs/Pages/Map.aspx
Action Cooperate with the soil-carbon mapping exercises to advocate accurate maps of soil carbon
Benefit Improved data accuracy
Time frame Ongoing
Who TOPC and GCOS
Performance
indicator
Improved maps
Annual cost US$1 000–10 000
Action Encourage flux sites to measure soil carbon at five-year intervals and record soil-management
activities; use this to supplement long-term experiments that are monitoring soil carbon.
Benefit Improved in situ observations will improve accuracy.
Time frame Ongoing
Who TOPC and GCOS
Performance
indicator
Number of flux sites making measurements
Annual cost US$10 000–100 000

GCOS 2016 Implementation Plan
- 212 -
Action T59: Soil carbon – histosols
Fire
Fire disturbance is characterized by large spatial and temporal variations acting over multiple
timescales (diurnally, seasonally and inter-annually). By consuming vegetation and emitting aerosols
and trace gases, fires have large impacts on the storage and flux of carbon in the biosphere and
atmosphere, influence atmospheric composition and air quality, can cause long-term changes in land
cover and affect land-atmosphere fluxes of energy and water. Together, these and other properties
related to fire disturbance also influence the radiative forcing of climate.
In general, landscape fires are expected to become more severe and/or more frequent under a
warmer climate, depending on changes in precipitation. At the same time, some ecosystems,
particularly in the tropics and boreal zones, are increasingly subject to fire because of growing
populations and economic and land-use pressures. The amount of burned biomass in an ecosystem
can vary between years by an order of magnitude, especially between wet and dry years and these
large year-to-year differences may influence the interannual variations seen in the global
atmospheric growth rate of carbon dioxide.
Informed policy- and decision-making clearly requires timely and accurate quantification of fire
activity and its impacts nationally, regionally and globally. Burned area, active (or flaming) fire
detection and Fire Radiative Power (FRP) datasets together form the Fire ECV, and the separate
products can be combined to generate improved information, e.g. mapping of fire-affected areas to
the fullest extent, including the timing of burning of each affected grid-cell. Estimates of total dry-
matter fuel consumption (and thus carbon emission) can be calculated from combining these
products with other information, such as combustion completeness (currently not systematically
estimated from satellite data) and pre-fire biomass. By applying species-specific emissions factors to
these fuel-consumption estimates, emission totals for the various trace gases and aerosols can then
be calculated.
Fires are typically patchy and heterogeneous. Measurements of global burnt area are therefore
required at a spatial resolution of 30 m (minimum resolution of 500 m) from optical remote-sensing,
with near-daily frequency from moderate (30 m) resolution sensors and daily from coarse resolution
sensors (250 m–500 m). Measurements may be supplemented using radar remote-sensing in cloudy
areas. Detection of actively burning fires and assessment of their FRP is often adequately done at
lower spatial resolutions (e.g. 1 km) because burning fires covering only around 10–4 to 10–3 of the
pixel area can be detected using appropriately sensitive active fire-detection algorithms but higher
spatial resolutions are beneficial (e.g. 250 m–500 m), since the most frequent types of fire in many
regions are likely to be too small to be detected with 1-km data. Furthermore, for these active fire
Action Provide global maps of the extent of histosols (peatlands, wetlands and permafrost) and their depth
Benefit Improve understanding of carbon pools at risk from climate change
Time frame Ongoing
Who Research communities, ISRIC, HWSD and the Global Soil Map
Performance
indicator
Availability of maps
Annual cost US$ 10 000–100 000

GCOS 2016 Implementation Plan
- 213 -
applications, the sensor must have a mid-infrared spectral channel with a wide dynamic range to
avoid sensor saturation and also an accompanying thermal-infrared band and VIS or NIR band to
lessen the chances of false detection. Active fires should be detected from Low Earth Orbit satellites
multiple times per day, with one of the measurements being located near the peak of the daily fire
cycle (often located in the early afternoon) and their FRP should be calculated. Some geostationary
satellites allow active fire and FRP data generation at coarser spatial resolutions as rapidly as every
10 minutes and this provides the best sampling of the fire diurnal cycle and rapid changes in fire
emissions that may be required for certain applications (e.g. for temporal integration of FRP data to
estimate total carbon emissions; and to link to atmospheric chemistry models/observations).
Geostationary imagers should all be equipped in the future with mid-infrared channel to support
active fire detection and FRP generation, ideally with a wide dynamic range to avoid saturation over
even large fires and with the other long-wave infrared (LWIR) and VIS/NIR channels to support the
optimum active fire detection algorithms.
The various space-based products require validation and intercomparison. Validation of moderate
and coarse-resolution fire products involves field observations and the use of high-resolution
imagery, in collaboration with local fire-management organizations and the research community.
CEOS WGCV, working with GOFC-GOLD, is establishing internationally agreed validation protocols
that should be applied to all datasets before their release. A fully stratified sampling scheme
(designated CEOS level 3) that adequately represents the nature of fire activity over the globe is close
to being realized and work on a level-4 scheme is needed. The validation protocol for the generation
of reference data to validate burned area products, based on multi-temporal higher-resolution
reference imagery, is mature and has been documented. The active fire-detection protocol requires
simultaneous high-resolution airborne or satellite imagery, which is not readily available except for
the single-platform Terra MODIS/ASTER configuration. An effective active fire (and FRP) validation
protocol is under development. Geostationary FRP data have thus far been validated via
comparisons to simultaneous polar orbiting measures.
GCOS and TOPC will work with the CEOS WGCV, GOFC-GOLD and the space agencies to ensure that
fire-disturbance data products are easily available to users, with complete supporting documentation
and metadata. A number of fire-disturbance products are now operational. In the Copernicus
programme, for example, both burned area and FRP can be found. It is expected that this service will
continue into the future. Furthermore, GCOS strongly endorses initiatives and projects that bring the
climate-modelling and product-development communities together.
The transition of experimental fire products to the operational domain needs to be facilitated. Data
continuity for the new-generation sensors on future operational environmental satellite series needs
to be ensured and products need to be intercompared and combined to provide the best estimates
of total fuel consumption (and fire emissions), together with uncertainties over long timescales.

GCOS 2016 Implementation Plan
- 214 -
Action T60: Historic fire data
Action T61: Operational global burned area and fire radiative power
Action T62: Fire maps
Action Reanalyse the historical fire-disturbance satellite data (1982 to present)
Benefits Climate-modelling communities
Time frame By 2020
Who Space agencies, working with research groups coordinated by GOFC-GOLD-Fire By 2020
Performance
indicator
Establishment of a consistent dataset, including the globally available AVHRR data record
Annual cost US$ 1–10 million
Action Continue the production of operational, global burned area active fire (with associated FRP) products,
with metadata and uncertainty characterizations that meet threshold requirements and have
necessary product back-up to ensure operational delivery of products to users.
Benefits Climate-modelling communities, space agencies, civil protection services, fire managers, other users
Time frame Continuous
Who Space agencies, Copernicus Global Land Service, Copernicus Atmospheric Monitoring Service,
GOFC-GOLD
Performance
indicator
Availability of products that meet user needs
Annual cost US$ 1–10 million
Action Consistently map global burned area at < 100m resolution on a near-daily basis from combinations of
satellite products (Sentinel-2, Landsat, Sentinel-1, PROBA); work towards deriving consistent measures
of fire severity, fire type, fuel moisture and related plant-fuel parameters
Benefits Climate-modelling communities, space agencies, civil protection services, fire managers, other users
Time frame By 2020
Who Space agencies, research organizations, international organizations in collaboration with GOFC-GOLD-
Fire
Performance
indicator
Availability of data and products
Annual cost US$ 1–10 million

GCOS 2016 Implementation Plan
- 215 -
Action T63: Fire validation
Action T64: Fire disturbance model development
5.6 Human use of natural resources
These ECVs monitor parts of the human dimension of climate change. Anthropogenic greenhouse
gas emissions are the primary drivers of climate change, while water use has a major impact on some
ecosystems and on water scarcity, which is forecast to increase with climate change. Derivation of
these products does not depend solely on environmental observations: a range of data such as
measurements of fuel use and composition and socioeconomic information is used.
Table 21. Status of ECVs for Human Use of Natural Resources.
ECV Status
Anthropogenic water use
Information on anthropogenic water use is generally inadequate. FAO AQUASTAT is currently the only database containing information on water use for agricultural purposes.
Greenhouse gas emissions
This has not been an ECV previously but is essential to quantify the anthropogenic drivers of climate change.
Anthropogenic water use
Water is vital to humans and is used for a wide range of activities such as agriculture, drinking, food
preparation, hygiene, industry and energy production. Given the likely impacts on water availability
Action Continuation of validation activity around the detection of fire-disturbed areas from satellites to show
that threshold requirements are being met; work to reduce the errors of commission and omission;
provide better than existing uncertainty characterization of fire-disturbance products.
Benefits Climate-modelling communities.
Time frame Continuous
Who Space agencies and research organizations, supported by CEOS LPV
Performance
indicator
Publication of temporal accuracy
Annual cost US$ 1–10 million
Action Continuation of joint projects between research groups involved in the development of atmospheric
transport models, dynamic vegetation models and GHG emission models, tthe climate-modelling and
transport-modelling community and those involved in the continual algorithm development,
validation and uncertainty characterization of fire-disturbance products from satellite data (the Earth
observation and modelling community); contribute to better understanding of fire risk and fire-risk
modelling
Benefits Climate-modelling communities, Copernicus Programme
Time frame Continuous
Who Space agencies (NASA, ESA, etc.), inter-agency bodies (GOFC-GOLD, CEOS, ECMWF, Meteosat, etc.),
Copernicus Global Land Service, Copernicus Atmospheric Monitoring Service, GOFC-GOLD
Performance
indicator
Projects that engage climate and atmospheric transport modellers and product-development
community
Annual cost US$ 1–10 million

GCOS 2016 Implementation Plan
- 216 -
and scarcity due to climate change, this is an important quantity. This Plan renames the ECV Water
use to Anthropogenic water use to emphasise that this ECV refers to all human uses, not just
agriculture. It is linked to droughts and, as water-use data collection improves, consideration should
also be given to include droughts explicitly.
As noted in the Status Report, this has not been well monitored in the past so, while the AQUASTAT
database hosted by FAO needs to continue and to be improved, pilot exercises are proposed to
demonstrate the collection of data on all water uses and serve as a demonstration of how this can be
done promptly on a wider scale. In addition, UN-Water is the United Nations inter-agency
coordination mechanism for all freshwater-related issues such as freshwater resources, sanitation
and water-related disasters and provides access to data on its website. Moreover, the International
Water Management Institute (IWMI) has been doing research on water for the last 30 years. It is a
non-profit research organization whose research outputs and data are freely and openly available.
Action T65: Anthropogenic water use
Action T66: Pilot projects: anthropogenic water use
Anthropogenic greenhouse gas fluxes
Anthropogenic in this context refers to emissions and removals from all managed-land, fossil-fuel,
industrial, waste-treatment and agricultural emissions (IPCC, 2006)85.
Accurate knowledge of anthropogenic greenhouse gas fluxes is needed by Parties to the UNFCCC and
to improve the scientific understanding of the impacts of these emissions and removals on the
climate. Under the UNFCCC, Parties have to report their emissions and removals and, under the
85 This is the definition developed for greenhouse-gas emission and removal estimates by the IPCC and used by the
UNFCCC.
Action Collect, archive and disseminate information related to anthropogenic water use
Benefit Accurate and up-to-date data on water availability and stress
Time frame Continuous
Who UN-Water, IWMI and FAO through AQUASTAT in collaboration with UN Statistics Division and other
data sources
Performance
indicator
Information contained in the AQUASTAT database.
Annual cost US$ 100 000–1 million
Action Develop and implement pilot data-collection exercises for water use
Benefit Demonstrate data-collection approaches for wide implementation
Time frame 2016–2019
Who GTN-H, UN-Water, IWMI and FAO through AQUASTAT in collaboration with the Convention on the
Protection and Use of Transboundary Watercourses and International Lakes
Performance
indicator
Completed data collection in pilot areas
Annual cost US$ 100 000–1 million

GCOS 2016 Implementation Plan
- 217 -
Paris Agreement, will have to report Nationally Determined Contributions (NDC): many commitments
are in terms of emission mitigation. Monitoring these NDCs will require good inventories, which
should be reported in a transparent way following measurement, reporting and verification
requirements, and are subject to review for Annex I Parties and international consultation and
analysis for non-Annex I Parties. To date, however, there is no independent way to check
inventories, although some methods based on inverse modelling approaches have been
demonstrated.
Inventory methods must follow the IPCC 2006 guidelines and the IPCC 2013 supplement on wetlands.
Global estimates are also made with methods that follow the IPCC guidelines. Questions have
recently been raised about the falling accuracy of these estimates at global level for fossil fuel and
industrial emissions, due to the increase in emissions from countries with less accurate statistics.
Not necessarily part of the anthropogenic fluxes as defined by the UNFCCC, quantifying the land sink
is important for closing the carbon cycle overall. It is the net uptake of carbon by the land that is not
directly related to human activities. This land sink is currently estimated as residual after deducting
the atmospheric and ocean uptakes from the net emissions. Anthropogenic emissions and removals
from the Land use, Land-use change and Forestry sector are the net result of two fluxes: an emission
term due to deforestation and forest degradation (mainly in the tropics) and an uptake term due to
vegetation growth, for example forest regrowth and re-planting.86 The land sink is mainly driven by
vegetation growth not directly linked to managed land, such as recovery from deforestation events in
the distant past or increased growth through CO2 fertilization (both of which may have natural and
human components). This sink has increased roughly in proportion to the emissions in response to
human interventions on the carbon cycle and improved knowledge about this land sink would
enhance future projections and the efficacy of mitigation efforts in achieving climate goals.
As noted above, there is no independent check on the estimates reported by countries. Such an
independent check would support improved reporting by Parties to the UNFCCC by increasing the
confidence and credibility in the emission estimates and in the impacts of mitigation efforts. This can
be done with inverse modelling approaches based on atmospheric composition observations.
Currently, these approaches can give only rough, order-of-magnitude estimates but should improve
as observational networks are improved and through efforts such as WMO’s Integrated Global
Greenhouse Gas Information System (IG3IS) and GeoCARBON. Such comparisons between fluxes
derived from observations and emission inventories have been demonstrated at the national level by
the Australia, Switzerland and the United Kingdom and and for sources by monitoring oil- and gas-
production areas and agricultural soils on a wide scale. These estimates are used by the countries
themselves to guide improvements to their national inventory systems.
Looking forward, with the correct investments in observations, it should be practical to have in place
a system that could track anthropogenic emissions from fossil fuel and industry by about 2030. Such
a system would include ground-based concentration measurements and space-based measurements
able to identify plumes from major sources. In this regard, actions are needed now to demonstrate
the feasibility of developing the observational and interpretation infrastructures.
86 Net annual fluxes

GCOS 2016 Implementation Plan
- 218 -
Observations are also of great use in supporting land-based climate mitigation efforts such as REDD+.
Observations of land cover, above-ground biomass, fire and soil carbon may all be relevant and are
provided by other existing ECVs. Projects such as GFOI give guidance on how this information can be
used.
Table 22. The greenhouse gases of interest: the focus of support for observing the carbon cycle will
be on CO2 and CH4.
Gas UNFCCC reporting
CO2 Mandatory CH4 and N2O
HFCs, PFCs, SF6 and NF3 Mandatory (annex 1)
Additional GHGs, such as HFEs and PFPEs, and other gases for which 100-year global warming potential values are available from the IPCC
Strongly encouraged
Indirect greenhouse gases such as SO2, NOx, CO and NMVOC Optional
Gases controlled by the Montreal Protocol No
Aerosols
Action T67: Improve global estimates of anthropogenic greenhouse-gas emissions
Action T68: Use of satellites for Land use, land-use change and forestry emissions/removals
Action Continue to produce annual global estimates of emissions from fossil fuel, industry, agriculture and
waste; improve these estimates by following IPCC methods using Tier 2 for significant sectors; this will
require a global knowledge of fuel carbon contents and a consideration of the accuracy of the statistics
used
Benefit Improved tracking of global anthropogenic emissions
Time frame Ongoing, with annual updates
Who IEA, FAO, Global Carbon Project (GCP), Carbon Dioxide Information Analysis Centre (CDIAC), Emissions
Database for Global Atmospheric Research (EDGAR)
Performance
indicator
Availability of Improved estimates.
Annual cost US$ 10 000–100 000
Action Support the improvement of estimates of emissions and removals from Forestry and Land-use change
by using satellite data to monitor changes where ground-based data are insufficient.
Benefit Improved global and national monitoring of LULUCF
Time frame Ongoing.
Who National reporting supported by international agencies through programmes such as UNREDD and
GFOI
Performance
indicator
Availability of satellite data
Annual cost US$ 100 000–1 million

GCOS 2016 Implementation Plan
- 219 -
Action T70: Use of Inverse modelling techniques to support emission inventories
Action T71: Prepare for a carbon-monitoring system
5.7 Potential for latent and sensible heat flux from land to be an ECV
Latent and sensible heat flux from the land surface is not currently an ECV. Together with similar
fluxes over the oceans and radiant heat fluxes, it is an important parameter in closing the energy
cycle. Current observations do not totally close the energy cycle. It is, however, more difficult to
measure over wide areas of land than the ocean on a global scale as the land surface is very
inhomogeneous and the poorly measured ground heat flux over land, which is a factor contributing to
the energy imbalance in observed surface energy partitions. In order to prepare for better monitoring
of the latent and sensible heat flux from the land surface, TOPC will undertake a review of the
Action T69: Research on the land sink
Action Research to better understand the land sink, its processes and magnitudes
Benefit Better understanding of the global carbon cycle
Time frame Ongoing
Who GCP, research groups
Performance
indicator
Published results
Annual cost US$ 100 000–1 million
Action Develop inverse modelling methods to support and add credibility to emission inventories; develop
and disseminate examples for several GHGs
Benefit Added credibility of national emission/removal estimates and demonstration of inventory
completeness
Time frame Ongoing
Who National Inventory agencies, researchers
Performance
indicator
Published results
Annual cost US$ 1–10 million
Action Preparatory work to develop a carbon monitoring system to be operational by 2035;
Development development of comprehensive monitoring systems of measurements of atmospheric
concentrations and of emission fluxes from anthropogenic area and point sources to include space-
based monitoring, in situ flask and flux tower measurements and the necessary transport and
assimilation models
Benefit Improved estimates of national emissions and removals
Time frame Initial demonstration results by 2023 – complete systems unlikely before 2030
Who Space agencies
Performance
indicator
Published results
Annual cost US$ 10–100 billion

GCOS 2016 Implementation Plan
- 220 -
measurements to date and their reliability. It will then make proposals on the requirements for such
an ECV for consideration by the GCOS Steering Committee.
Action T72: Prepare for a latent and sensible heat flux ECV
Action Review the feasibility of global monitoring of latent and sensible heat fluxes form the land surface;
prepare proposals for such an ECV.
Development of comprehensive monitoring systems of measurements of atmospheric concentrations
and emission fluxes from anthropogenic point sources, to include space-based monitoring, in situ flask
and flux tower measurements and the necessary transport and assimilation models
Benefit Improve understanding of heat fluxes over land
Time frame 2017
Who TOPC
Performance
indicator
Proposals for consideration by GCOS Steering Committee
Annual cost US$10 000–100 000
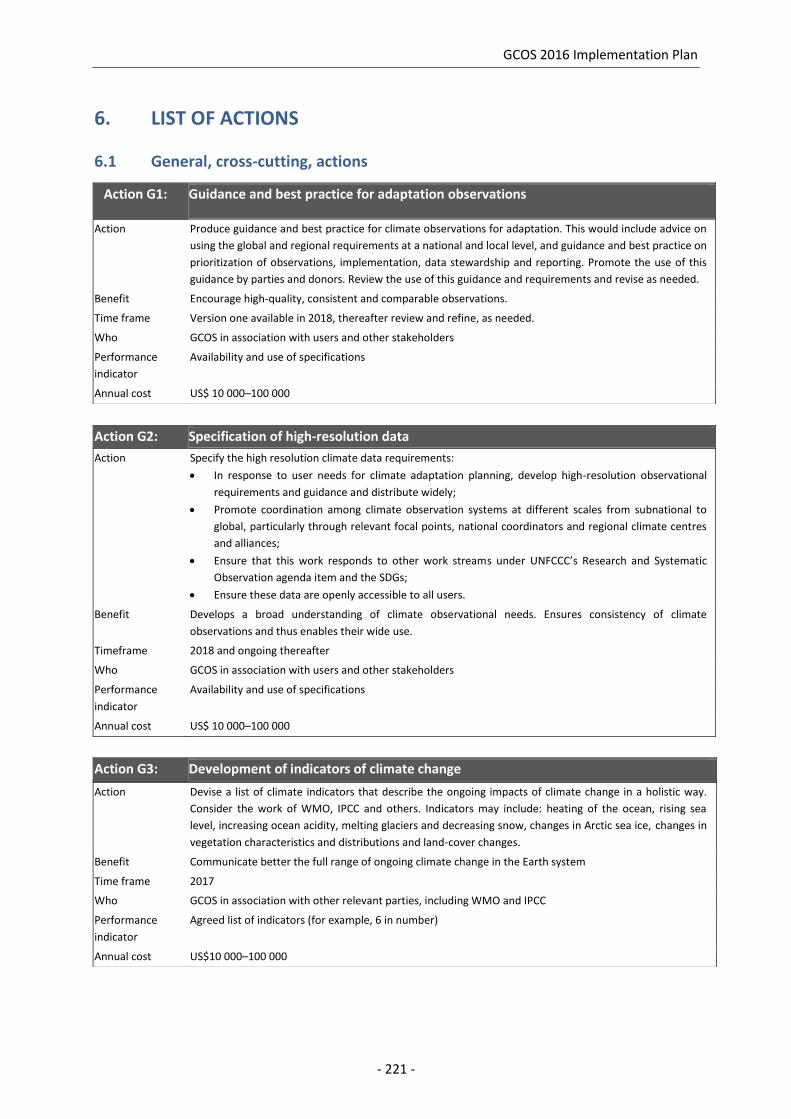
GCOS 2016 Implementation Plan
- 221 -
6. LIST OF ACTIONS
6.1 General, cross-cutting, actions
Action G3: Development of indicators of climate change
Action G1: Guidance and best practice for adaptation observations
Action Produce guidance and best practice for climate observations for adaptation. This would include advice on
using the global and regional requirements at a national and local level, and guidance and best practice on
prioritization of observations, implementation, data stewardship and reporting. Promote the use of this
guidance by parties and donors. Review the use of this guidance and requirements and revise as needed.
Benefit Encourage high-quality, consistent and comparable observations.
Time frame Version one available in 2018, thereafter review and refine, as needed.
Who GCOS in association with users and other stakeholders
Performance
indicator
Availability and use of specifications
Annual cost US$ 10 000–100 000
Action G2: Specification of high-resolution data
Action Specify the high resolution climate data requirements:
In response to user needs for climate adaptation planning, develop high-resolution observational
requirements and guidance and distribute widely;
Promote coordination among climate observation systems at different scales from subnational to
global, particularly through relevant focal points, national coordinators and regional climate centres
and alliances;
Ensure that this work responds to other work streams under UNFCCC’s Research and Systematic
Observation agenda item and the SDGs;
Ensure these data are openly accessible to all users.
Benefit Develops a broad understanding of climate observational needs. Ensures consistency of climate
observations and thus enables their wide use.
Timeframe 2018 and ongoing thereafter
Who GCOS in association with users and other stakeholders
Performance
indicator
Availability and use of specifications
Annual cost US$ 10 000–100 000
Action Devise a list of climate indicators that describe the ongoing impacts of climate change in a holistic way.
Consider the work of WMO, IPCC and others. Indicators may include: heating of the ocean, rising sea
level, increasing ocean acidity, melting glaciers and decreasing snow, changes in Arctic sea ice, changes in
vegetation characteristics and distributions and land-cover changes.
Benefit Communicate better the full range of ongoing climate change in the Earth system
Time frame 2017
Who GCOS in association with other relevant parties, including WMO and IPCC
Performance
indicator
Agreed list of indicators (for example, 6 in number)
Annual cost US$10 000–100 000

GCOS 2016 Implementation Plan
- 222 -
Action G4: Indicators for adaptation and risk
Action Promote definition of, and research supporting, the development of indicators linking physical and social
drivers relating to exposure, vulnerability and improved resilience, in line with national requirements
Benefit Tracking of progress of climate change and adaptation, improved capacity to respond and avoid loss.
Timeframe 2017
Who GCOS with relevant agencies and national bodies
Performance
indicator
Definition and development of relevant risk assessments
Annual cost US$ 10 000–100 000
Action G5: Identification of global climate observation synergies with other multilateral
environmental agreements
Action Ensure a scientifically rigorous assessment of the exact requirements of common variables and identify a
common set of specifications between GCOS and CBD and UNCCD;ensure that maximum benefit is taken
from GCOS ECVs in implementing the SDG process, including addressing multiple-benefits across SDG
goals, fulfilling the climate specific goal (SDG-13) and providing support to transparent global
development and climate finance prioritization (SDG-17); explore how ECV data can contribute to: (a) The
Ramsar Convention; (b) the Sendai Framework for Disaster Risk Reduction; (c) other MEAs.
Benefit Improved information exchange between Conventions, cost savings, shared capacity-building and
outreach, and coordinated approaches to observation providers
Time frame Ongoing (2017 for Rio conventions, 2018 for Ramsar and Sendai)
Who GCOS, CBD Secretariat, UNCCD Secretariat and the Global Mechanism, GEO Secretariat and GEO
Biodiversity Observation Network
GCOS and sponsors + Parties (through national statistics offices) and GEO (GEO initiative on the SDGs (GI-
18))
GCOS, Ramsar Convention, Open-ended Intergovernmental Expert Working Group on Indicators and
Terminology Relating to Disaster Risk Reduction, ICSU-ISSC-UNISDR programme IRDR, Secretariats of
other MEAs
Performance
indicator
Climate service components optimized for disaster risk reduction
Annual cost US$ 10 000–100 000
Action G6: Assisting developing countries to maintain or renovate climate observation systems
and to improve climate observations networks
Action Provide financial support to GCM through its trust fund; cooperate between donors to provide targeted
support to countries to improve their observational systems; propose suitable projects for support
Benefit Targeted expert assistance to improve key monitoring networks
Time frame Continuous
Who Developed countries, developing country aid banks, WMO VCP, GEF and other funds for UNFCCC, the
United Nations Development Programme (UNDP), national aid agencies; project proposals coordinated by
GCOS panels, GCM Board and potential donor countries
Performance
indicator
Funds received by the trust sund; Increasing number of projects supporting countries
Annual cost US$ 1–10 million
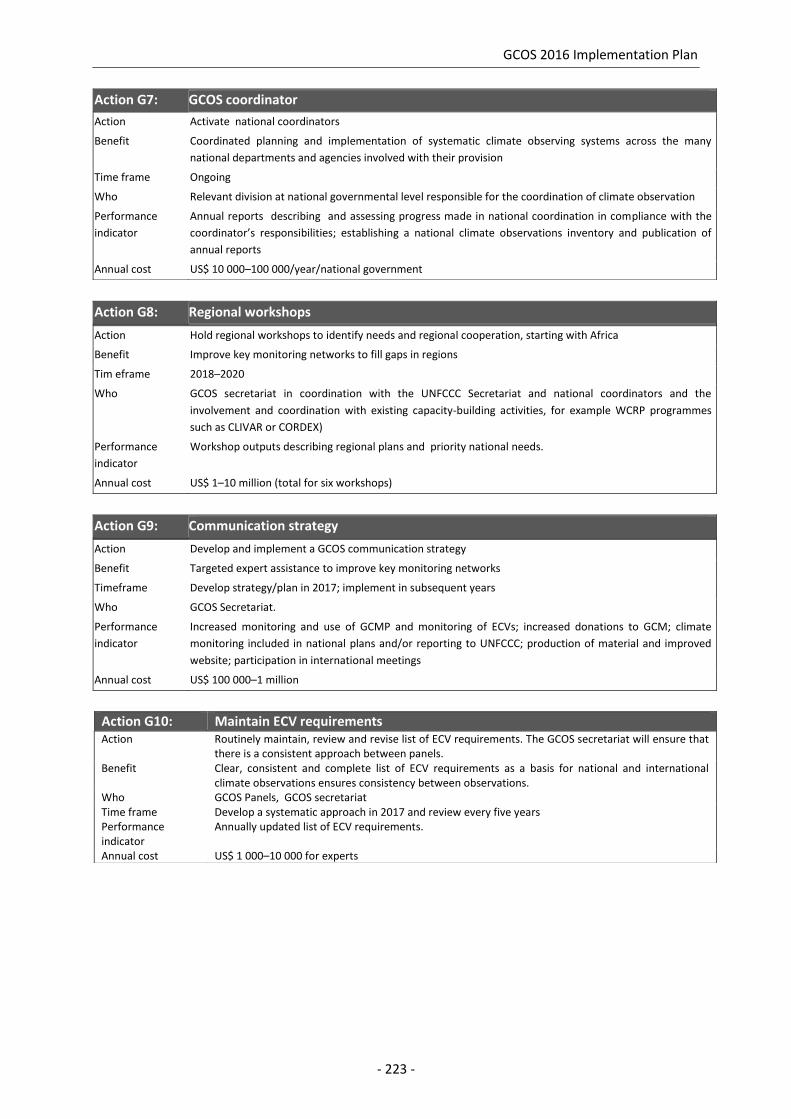
GCOS 2016 Implementation Plan
- 223 -
Action G8: Regional workshops
Action G9: Communication strategy
Action G10: Maintain ECV requirements
Action G7: GCOS coordinator
Action Activate national coordinators
Benefit Coordinated planning and implementation of systematic climate observing systems across the many
national departments and agencies involved with their provision
Time frame Ongoing
Who Relevant division at national governmental level responsible for the coordination of climate observation
Performance
indicator
Annual reports describing and assessing progress made in national coordination in compliance with the
coordinator’s responsibilities; establishing a national climate observations inventory and publication of
annual reports
Annual cost US$ 10 000–100 000/year/national government
Action Hold regional workshops to identify needs and regional cooperation, starting with Africa
Benefit Improve key monitoring networks to fill gaps in regions
Tim eframe 2018–2020
Who GCOS secretariat in coordination with the UNFCCC Secretariat and national coordinators and the
involvement and coordination with existing capacity-building activities, for example WCRP programmes
such as CLIVAR or CORDEX)
Performance
indicator
Workshop outputs describing regional plans and priority national needs.
Annual cost US$ 1–10 million (total for six workshops)
Action Develop and implement a GCOS communication strategy
Benefit Targeted expert assistance to improve key monitoring networks
Timeframe Develop strategy/plan in 2017; implement in subsequent years
Who GCOS Secretariat.
Performance
indicator
Increased monitoring and use of GCMP and monitoring of ECVs; increased donations to GCM; climate
monitoring included in national plans and/or reporting to UNFCCC; production of material and improved
website; participation in international meetings
Annual cost US$ 100 000–1 million
Action
Routinely maintain, review and revise list of ECV requirements. The GCOS secretariat will ensure that there is a consistent approach between panels.
Benefit Clear, consistent and complete list of ECV requirements as a basis for national and international climate observations ensures consistency between observations.
Who GCOS Panels, GCOS secretariat Time frame Develop a systematic approach in 2017 and review every five years Performance indicator
Annually updated list of ECV requirements.
Annual cost US$ 1 000–10 000 for experts

GCOS 2016 Implementation Plan
- 224 -
Action G11: Review of availability of climate data records
Action G12: Gap-analysis of climate data records
Action Provide a structured, comprehensive and accessible view as to what CDRs are currently available, and what are planned to exist, together with an assessment of the degree of compliance of such records with the GCOS requirements for the ECV products indicated in Annex A
Benefit Improve planning of satellite-derived climate data acquisition Who CEOS/CGMS Working Group on Climate for records contributing to the ECV products that are indicated
in Annex A. Time frame End 2016 and updated every two years thereafter. Performance indicator
Online availability of an inventory of current and future CDRs, together with an assessment of compliance with GCOS requirements
Annual cost Covered by CEOS and CGMS agencies
Action Establish a gap analysis process and associated actions, to: (a) address gaps/deficiencies in the current available set of CDRs; and (b) ensure continuity of records, and address gaps through the appropriate planning of future satellite missions for the ECV products indicated in Annex A
Benefit Increase the utility of the CDRs Who CEOS/CGMS Working Group on Climate for records contributing to the ECV indicated in Annex A Time-frame End 2017, and updated every two years thereafter. Performance indicator
Availability of gap analysis and associated action plan
Annual cost Covered by CEOS and CGMS agencies
Action G13: Review of ECV observation networks Action For all ECV products not covered by a review following actions G11 and G12: develop and implement a
process to regularly review ECV observation networks, comparing their products with the ECV product requirements; identify gaps between the observations and the requirements; identify any deficiencies and develop remediation plans with relevant organizations; and ensure the data is discoverable and accessible. This action may also contribute to the definition of reference-grade observing network and standards. The GCOS science panels should identify stakeholders who will perform this review and regularly check all ECV products are being reviewed.
Benefit Increase quality and availability of climate observations Who Organizations listed in Annex A. GCOS panels to maintain oversight. Time frame Develop and demonstrate review process in 2017. Review each ECV’s observing systems at least every
four years. Performance indicator
Reports of results of ECV reviews produced by panels each year.
Annual cost US$ 100 000–1 million also part of the work of panels
Action G14: Maintain and improve coordination Action Maintain and improve coordination with other global observing systems (such as GOOS and FluxNet),
satellite agencies (especially through CGMS and CEOS), those providing climate services (such as GFCS, Copernicus and NMHS climate departments), GEO flagships (such as GEO Carbon, GFOI, Blue Planet: Oceans and Society), Regional Climate Centres and WMO technical commissions and other users such as UNFCCC and IPCC
Benefit Improved and more efficient observation systems. Who GCOS Secretariat and Science Panels Time frame On going Performance indicator
Reports to GCOS Steering Committee and science panels
Annual cost implications
Part of ongoing tasks of GCOS

GCOS 2016 Implementation Plan
- 225 -
Action G16: Metadata Action 1. GCOS to work with WMO to ensure that the WIGOS metadata standard meets GCOS requirements
for metadata, where relevant;2. Develop metadata standards for those observing systems where they do not exist.
Benefit Improved access and discoverability of datasetsWho Operators of GCOS.related systems, including data centresTime frame ContinuousPerformance indicator
Number of ECV-related datasets accessible through standard mechanisms
Annual cost implications
US$ 100 000–1 million (US$ 20 000 per data centre) (10% in non-Annex-I Parties)
Action G18: Long-term accessibility of data Action Ensure that data centres follow best practice in data stewardship to ensure long-term preservation of
data according to guidance to be developed by WMO Benefit Preservation of data for future generations Who Funding agencies for data centre Time frame Ongoing Performance indicator
Data held in compliant data centres and holdings and accessible to users
Annual cost implications
US$ 1–10 million
Action G19: Data access and discoverability Action Identify and develop means of discovering and accessing all relevant CDRs and other relevant products.
Ensure there is access to metadata that clearly distinguishes each data product and describes its adherence to the GCMP
Benefit Increase access to CDRs Who GCOS, GEO, US National Oceanographic and Atmospheric Administration (NOAA) Time frame Develop plans in 2017 Performance indicator
Reports of results of ECV reviews produced by panels each year
Annual cost implications
US$10 000–100 000
Action G15: Open data policies Action Ensure free and unrestricted data access by encouraging that data policies facilitating the open
exchange and archiving of all ECVs are followed; encouraging national parties to develop new data policies where appropriate, assessing and regularly reporting of status of data access
Benefit Access to data by all users in all countries at minimum cost Who Parties and international agencies, appropriate technical commissions and international programmes;
GCOS Secretariat. Time frame Continuing, of high priority. Performance indicator
Number of countries adhering to data policies favouring free and open exchange of ECV data.
Annual cost implications
US$ 100 000–1 million
Action G17: Support to national data centres Action Ensure national data centres are supported to enable timely, efficient and quality-controlled flow of
observations to international data centres where they exist; ensure timely flow of feedback from monitoring centres to observing network operators
Benefit Long-term, sustainable, provision of timely data and improved data quality Who Parties with coordination by appropriate technical commissions and international programmes Time frame Continuing, of high priority Performance indicator
Data receipt at centres and archives
Annual cost implications
US$ 10–30 million (70% in non-Annex-I Parties)

GCOS 2016 Implementation Plan
- 226 -
Action G20: Use of digital object identifiers for data records Action GCOS to encourage international data centres to introduce DOIs for their data records of ECV and
recommend datasets producers to follow this practice Benefit Help researchers to discover relevant data more easily Who GCOS panels Time frame Ongoing Performance indicator
Number of data records having an assigned DOI
Annual cost implications
Should be part of network planning and implementation.
Action G22: Implementation of new production streams in global reanalysis
Action G21: Collaboration with WMO CCl on climate data management Action GCOS secretariat to engage with WMO CCl on development of regulatory and guidance on climate data
management Benefit Users to climate data will have easier access to data. Who GCOS secretariat and WMO CCl Time frame Ongoing until 2019 Performance indicator
Guidance material publication
Annual cost implications
None
Action Continue comprehensive global reanalyses and implement planned new production streams using improved data-assimilation systems and better collections of observations; provide information on the uncertainty of products and feedback on data usage by the assimilation systems
Benefit Improved reanalysis datasets Who Global reanalysis production centres Time frame Ongoing Performance indicator
Number and specifications of global reanalyses in production; improved results from evaluations of performance; user uptake of uncertainty information; extent to which observational archives are enhanced with feedback from reanalyses
Annual cost US$ 10–30 million
Action G23: Develop coupled reanalysis Action Further develop coupled reanalysis and improve the coupled modelling and data assimilation
methodology Benefit Provide coupled reanalysis data sets Who Global reanalysis production centres and other centres undertaking research in data assimilation Time frame Ongoing Performance indicator
Number, specification and demonstrated benefits of coupled reanalyses
Annual cost US$ 1–10 million
Action G24: Improve capability of long-range reanalysis Action Improve the capability of long-scale reanalysis using sparse observations datasets Benefit Provide longer reanalysis datasets Who Global reanalysis production centres and other centres undertaking research in data assimilation Time frame Ongoing Performance indicator
Demonstrated improvements in the representation of long-term variability and change in century-scale reanalyses
Annual cost US$ 1–10 million

GCOS 2016 Implementation Plan
- 227 -
Action G25: Implementation of regional reanalysis
Action G26: Preservation of early satellite data
Action G27: Recovery of instrumental climate data
Action G28: Register of data-recovery activities
Action G29: Scanned records
Action G30: Sharing historical data records
Action Develop and implement regional reanalysis and other approaches to downscaling the information from global data products
Benefit Capability to capture climate variability on a regional scale Who Dataset producers Time frame Ongoing Performance indicator
Number and evaluated performance of regional reanalyses and other downscaled datasets
Annual cost US$ 1–10 million
Action Ensure long-term data preservation of early satellite raw and level 1 data, including metadata Benefit Extend CDRs back in time Who Space agencies Time frame Ongoing Performance Indicator
Data archive statistics at space agencies for old satellite data
Annual Cost US$ 1–10 million
Action Continue the recovery of instrumental climate data that are not held in a modern digital format and encourage more imaging and digitization
Benefit Improve access to historical observations datasets Who Agencies holding significant volumes of unrecovered data; specific projects focused on data recovery Time frame Ongoing Performance indicator
Data Increases in archive-centre holdings and data used in product generation; register entries recording data-recovery activities (see following action)
Annual Cost US$ 1–10 million
Action Populate and maintain a register or registers of data-recovery activities Benefit Facilitate planning of data rescue Who WMO CCl and other international bodies with related responsibilities; institutions hosting registers Time frame Ongoing Performance indicator
Existence and degree of population of register(s).
Annual cost US$ 1 000–10 000
Action Lodge scans with an appropriate international data centre if digitization does not follow scanning; assemble classes of scanned record suitable for digitization, for example by crowdsourcing
Benefit Facilitate planning of data rescue Who Institutions that have scanned data but not undertaken digitization; receiving data centres for assembly
of records Time frame Ongoing Performance indicator
Statistics on holdings and organization of scanned records by data centres
Annual Cost US$ 10 000–100 000
Action Share recovered historical data records Benefit Improved access to historical datasets to all users Who Institutions that have recovered data records but not made them widely available. Time frame Ongoing Performance indicator
Number of released data records as reported in registers
Annual cost US$ 10 000–100 000

GCOS 2016 Implementation Plan
- 228 -
Action G32: Improved bathymetry
Action G31: Improve gravimetric measurements from space Action Prepare for satellite missions to provide continuity and consider improved performance to meet the
observational requirements in Table 2 Benefit Improved monitoring of water transport and distribution. Who Space agencies. Time frame For 2023 Performance indicator
Published plans and agreed missions
Annual cost US$100 000–1 million
Action Support increased level of multibeam seabed mapping both synchronously with ocean observation
initiatives and separately as dedicated basin-scale mapping initiatives
Benefit Better representation of ocean volume, improved ability to model ocean currents and mixing
Who Institutions that fund vessel-based science studies and programmes and/or have access to survey
platforms with existing multibeam survey infrastructure.
Time frame For 2023
Performance
indicator
Availability of improved bathymetry data
Annual cost US$ 30–100 million
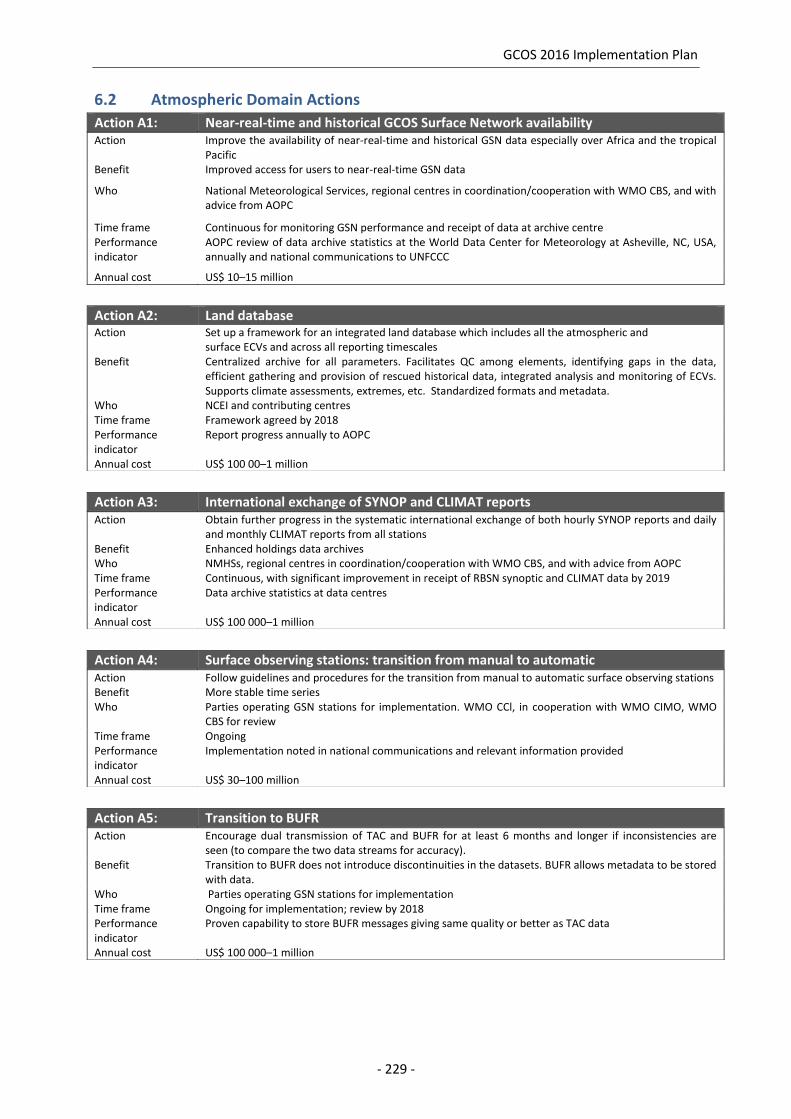
GCOS 2016 Implementation Plan
- 229 -
6.2 Atmospheric Domain Actions
Action A1: Near-real-time and historical GCOS Surface Network availability
Action A3: International exchange of SYNOP and CLIMAT reports
Action A4: Surface observing stations: transition from manual to automatic
Action A5: Transition to BUFR
Action Improve the availability of near-real-time and historical GSN data especially over Africa and the tropical Pacific
Benefit Improved access for users to near-real-time GSN data
Who National Meteorological Services, regional centres in coordination/cooperation with WMO CBS, and with advice from AOPC
Time frame Continuous for monitoring GSN performance and receipt of data at archive centre Performance indicator
AOPC review of data archive statistics at the World Data Center for Meteorology at Asheville, NC, USA, annually and national communications to UNFCCC
Annual cost US$ 10–15 million
Action A2: Land database Action Set up a framework for an integrated land database which includes all the atmospheric and
surface ECVs and across all reporting timescales Benefit Centralized archive for all parameters. Facilitates QC among elements, identifying gaps in the data,
efficient gathering and provision of rescued historical data, integrated analysis and monitoring of ECVs. Supports climate assessments, extremes, etc. Standardized formats and metadata.
Who NCEI and contributing centres Time frame Framework agreed by 2018 Performance indicator
Report progress annually to AOPC
Annual cost US$ 100 00–1 million
Action Obtain further progress in the systematic international exchange of both hourly SYNOP reports and daily and monthly CLIMAT reports from all stations
Benefit Enhanced holdings data archives Who NMHSs, regional centres in coordination/cooperation with WMO CBS, and with advice from AOPC Time frame Continuous, with significant improvement in receipt of RBSN synoptic and CLIMAT data by 2019 Performance indicator
Data archive statistics at data centres
Annual cost US$ 100 000–1 million
Action Follow guidelines and procedures for the transition from manual to automatic surface observing stations Benefit More stable time series Who Parties operating GSN stations for implementation. WMO CCl, in cooperation with WMO CIMO, WMO
CBS for review Time frame Ongoing Performance indicator
Implementation noted in national communications and relevant information provided
Annual cost US$ 30–100 million
Action Encourage dual transmission of TAC and BUFR for at least 6 months and longer if inconsistencies are seen (to compare the two data streams for accuracy).
Benefit Transition to BUFR does not introduce discontinuities in the datasets. BUFR allows metadata to be stored with data.
Who Parties operating GSN stations for implementation Time frame Ongoing for implementation; review by 2018 Performance indicator
Proven capability to store BUFR messages giving same quality or better as TAC data
Annual cost US$ 100 000–1 million

GCOS 2016 Implementation Plan
- 230 -
Action A6: Air temperature measurements
Action A7: Atmospheric pressure sensors on drifting buoys
Action A8: Provide precipitation data to the Global Precipitation Climatology Centre
Action A9: Submit water-vapour data
Action A10: Incorporating national sunshine records into data centres
Action Enhance air temperature measurements networks in remote or sparsely populated areas and over the ocean
Benefit Improved coverage for better depiction of climate system Who National Parties and international coordination structures such as the Global Cryosphere Watch (GCW) Time frame Ongoing Performance indicator
Coverage of air-temperature measurements
Annual cost US$ 10–30 million
Action Enhance to 100% the percentage of drifting buoys incorporating atmospheric pressure sensors, in particular by benefiting from barometer-upgrade programmes
Benefit Measurements over oceans of surface pressure will improve coverage. Who Parties deploying drifting buoys and buoy-operating organizations, coordinated through JCOMM, with
advice from OOPC and AOPC Time frame Ongoing Performance indicator
Percentage of buoys with sea-level pressure (SLP) sensors in tropics and sub-tropics
Annual cost US$ 10 000–100 000
Action Submit all precipitation data from national networks to the Global Precipitation Climatology Centre at the Deutscher Wetterdienst
Benefit Improved estimates of extremes and trends, enhanced spatial and temporal detail that address mitigation and adaptation requirements
Who National Meteorological and Water-resource Services, with coordination through the WMO CCl and the GFCS.
Time frame Ongoing Performance indicator
Percentage of nations providing all their holdings of precipitation data to international data centres.
Annual cost US$ 100 000–1 million
Action Submit water-vapour (humidity) data from national networks and marine platforms to the international data centres
Benefit Improved coverage of surface water-vapour measurements Who NMHSs, through WMO CBS and international data centres, with input from AOPC Time frame Ongoing Performance indicator
Data availability in analysis centres and archive and scientific reports on the use of these data
Annual cost US$ 100 000–1 million
Action National sunshine records should be incorporated into International Data Centres. Benefit Better description of surface radiation fields Who NMHSs Time frame Implement in next 2 years Performance indicator
Sunshine record archive established in international data centres and in analysis centres by 2018
Annual cost US$ 1–10 million

GCOS 2016 Implementation Plan
- 231 -
Action A11: Operation of the the GCOS Baseline Network for Surface Radiation
Action A12: Surface radiation data to the World Radiaiton Data Centre
Action A13: Implement vision for future of GCOS Upper-Air Network operation
Action A14: Evaluation of benefits for the GCOS Upper-Air Network
Action A15: Implementation of Reference Upper-Air Network
87 GCOS-182: http://www.wmo.int/pages/prog/gcos/Publications/gcos-182.pdf
Action Ensure continued long-term operation of the BSRN and expand the network to obtain globally more representative coverage and improve communications between station operators and the archive centre
Benefit Continuing baseline surface radiation climate record at BSRN sites Who Parties’ national services and research programmes operating BSRN sites in cooperation with AOPC and
the WCRP GEWEX Radiation Panel Time frame Ongoing Performance indicator
The number of BSRN stations regularly submitting valid data to international data centres
Annual cost US$ 100 000–1 million
Action Submit surface radiation data with quality indicators from national networks to the WRDC; expand deployment of surface radiation measurements over ocean
Benefit Expand central archive; data crucial to constrain global radiation budgets and for satellite product validation; more data over ocean would fill an existing gap.
Who NMHSs and others, in collaboration with WRDC Time frame Ongoing Performance indicator
Data availability in WRDC
Annual cost US$ 1–10 million
Action Show demonstrable steps towards implementing the vision articulated in the GCOS Networks Meeting in 2014
87 relating to the future of GUAN operation
Benefit Improved data quality, better integrated with GRUAN and more closely aligned with WIGOS framework Who Task team of AOPC with GCOS Secretariat in collaboration with relevant WMO commissions and WIGOS Time frame 2019 for adoption at Nineteenth World Meteorological Congress Performance indicator
Annual reporting in progress at AOPC of task team
Annual cost US$ 100 000–1 million
Action Quantify the benefits of aspects of GUAN operation including attaining 30 hPa or 10 hPa, twice-daily as opposed to daily ascents and the value of remote island GUAN sites
Benefit Better guidance to GUAN management, improved scientific rationale for decision-making Who NWP and reanalysis centres Time frame Completed by 2018 Performance indicator
Published analysis (in peer reviewed literature plus longer report)
Annual cost US$ 10 000–100 000
Action Continue implementation of GRUAN metrologically traceable observations, including operational requirements and data management, archiving and analysis and give priority to implementation of sites in the tropics, South America and Africa
Benefit Reference-quality measurements for other networks, in particular GUAN, process understanding and satellite cal/val.
Who Working Group on GRUAN, NMHSs and research agencies, in cooperation with AOPC, WMO CBS and the Lead Centre for GRUAN
Time frame Implementation largely completed by 2025 Performance indicator
Number of sites contributing reference-quality data streams for archival and analysis and number of data streams with metrological traceability and uncertainty characterization; better integration with WMO activities and inclusion in the WIGOS manual.
Annual cost US$ 10–30 million

GCOS 2016 Implementation Plan
- 232 -
Action A16: Implementation of satellite calibration missions
Action A17: Retain original measured values for radiosonde data
Action A18: Hyperspectral radiances reprocessing
Action A19: Reprocessing of atmospheric motion vectors
Action A20: Increase the coverage of aircraft observations
Action Implement a sustained satellite climate calibration mission or missions Benefit Improved quality of satellite radiance data for climate monitoring Who Space agencies Time frame Ongoing Performance indicator
Commitment to implement by the next status report in 2020; proof-of-concept proven on ISS pathfinder
Annual cost US$ 100–300 million
Action For radiosonde data and any other data that require substantive processing from the original measurement (e.g. digital counts) to the final estimate of the measurand (e.g. T and q profiles through the lower stratosphere); the original measured values should be retained to allow subsequent reprocessing.
Benefit Possibility to reprocess data as required, improved data provenance Who HMEI (manufacturers), NMHSs, archival centres. Time frame Ongoing. Performance indicator
Original measurement raw data and metadata available at recognized repositories
Annual cost US$ 100 000–1 million
Action Undertake a programme of consistent reprocessing of the satellite hyperspectral sounder radiances Benefit Consistent time series of hyperspectral radiances for monitoring and reanalyses, improved CDRs
computed from the FCDRs Who Space agencies Time frame Ongoing Performance indicator
Reprocessed FCDRs available for hyperspectral sounders
Annual cost US$ 100 000–1 million
Action Continue reprocessing of AMVs derived from geostationary satellite imagery in a coordinated manner across agencies
Benefit Consistent time series of AMVs for monitoring and reanalyses, improved CDRs computed from the FCDRs Who Space agencies Time frame Ongoing Performance indicator
Reprocessed FCDRs available for upper-air winds
Annual cost US$ 100 000–1 million
Action Further expand the coverage provided by AMDAR, especially over poorly observed regions such as Africa and South America
Benefit Improved coverage of upper-air wind for monitoring and reanalysis Who NMHSs, WIGOS, RAs I and III. Time frame Ongoing Performance indicator
Data available in recognized archives
Annual cost US$ 1–10 million

GCOS 2016 Implementation Plan
- 233 -
Action A21: Implementation of space-based wind-profiling system
Action A22: Develop a repository of water vapour climate data records
Action A23: Measure of water vapour in the upper troposphere/lower
Action A24: Implementation of archive for radar reflectivities
Action A25: Continuity of global satellite precipitation products
Action A26: Development of methodology for consolidated precipitation estimates
Action Assuming the success of ADM/Aeolus, implement an operational space-based wind profiling system with global coverage
Benefit Improved depiction of upper-air windfields: improved reanalyses, 3D aerosol measurements as a byproduct
Who Space agencies Time frame Implement once ADM/Aeolus concept is proven to provide benefit Performance indicator
Commitment to launch ADM follow-on mission
Annual cost US$ 100–300 million
Action Develop and populate a globally recognized repository of GNSS zenith total delay and total column water data and metadata
Benefit Reanalyses, water vapour CDRs Who AOPC to identify the appropriate responsible body Time frame By 2018 Performance indicator
Number of sites providing historical data to the repository
Annual cost US$ 100 000–1 million
Action Promote the development of more economical and environmentally friendly instrumentation for measuring accurate in situ water-vapour concentrations in the UT/LS
Benefit Improved UT/LS water vapour characterization, water-vapour CDRs Who NMHSs, National measurements institutes, HMEI and GRUAN Time frame Ongoing Performance indicator
Number of sites providing higher-quality data to archives
Annual cost US$ 10–30 million
Action To implement a global historical archive of radar reflectivities (or products of reflectivities if reflectivities are not available) and associated metadata in a commonly agreed format
Benefit Better validation of reanalyses, improved hydrological cycle understanding Who NMHSs, data centres, WIGOS Time frame Ongoing Performance indicator
Data available in recognized archive, agreed data policy
Annual cost US$ 1–10 million
Action Ensure continuity of global satellite precipitation products similar to GPM Benefit Precipitation estimates over oceans for global assessment of water-cycle elements and their trends Who Space agencies Time frame Ongoing Performance indicator
Long-term homogeneous satellite-based global precipitation products
Annual cost US$ 30–100 million
Action Develop methods of blending raingauge, radar and satellite precipitation Benefit Better precipitation estimates Who WMO technical commissions. Time frame By 2020 Performance indicator
Availability of consolidated precipitation estimates
Annual cost US$ 10 000–100 000
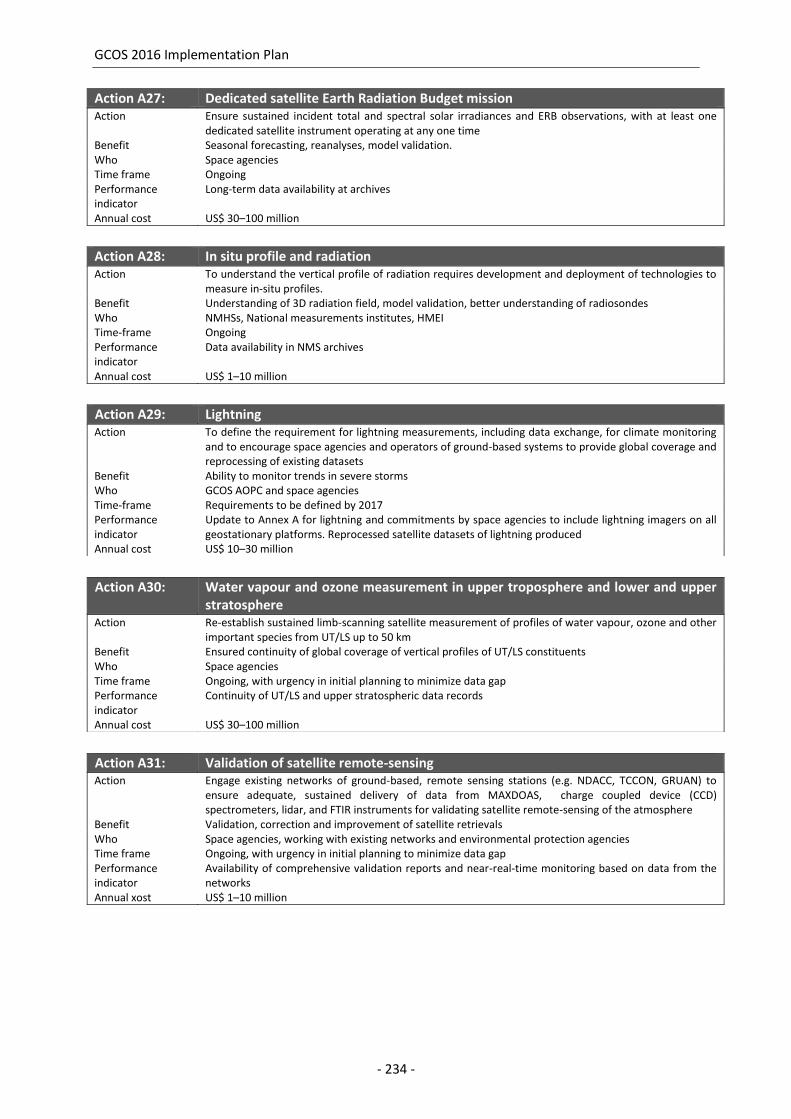
GCOS 2016 Implementation Plan
- 234 -
Action A27: Dedicated satellite Earth Radiation Budget mission
Action A28: In situ profile and radiation
Action A29: Lightning
Action A30: Water vapour and ozone measurement in upper troposphere and lower and upper stratosphere
Action A31: Validation of satellite remote-sensing
Action Ensure sustained incident total and spectral solar irradiances and ERB observations, with at least one dedicated satellite instrument operating at any one time
Benefit Seasonal forecasting, reanalyses, model validation. Who Space agencies Time frame Ongoing Performance indicator
Long-term data availability at archives
Annual cost US$ 30–100 million
Action To understand the vertical profile of radiation requires development and deployment of technologies to measure in-situ profiles.
Benefit Understanding of 3D radiation field, model validation, better understanding of radiosondes Who NMHSs, National measurements institutes, HMEI Time-frame Ongoing Performance indicator
Data availability in NMS archives
Annual cost US$ 1–10 million
Action To define the requirement for lightning measurements, including data exchange, for climate monitoring and to encourage space agencies and operators of ground-based systems to provide global coverage and reprocessing of existing datasets
Benefit Ability to monitor trends in severe storms Who GCOS AOPC and space agencies Time-frame Requirements to be defined by 2017 Performance indicator
Update to Annex A for lightning and commitments by space agencies to include lightning imagers on all geostationary platforms. Reprocessed satellite datasets of lightning produced
Annual cost US$ 10–30 million
Action Re-establish sustained limb-scanning satellite measurement of profiles of water vapour, ozone and other important species from UT/LS up to 50 km
Benefit Ensured continuity of global coverage of vertical profiles of UT/LS constituents Who Space agencies Time frame Ongoing, with urgency in initial planning to minimize data gap Performance indicator
Continuity of UT/LS and upper stratospheric data records
Annual cost US$ 30–100 million
Action Engage existing networks of ground-based, remote sensing stations (e.g. NDACC, TCCON, GRUAN) to ensure adequate, sustained delivery of data from MAXDOAS, charge coupled device (CCD) spectrometers, lidar, and FTIR instruments for validating satellite remote-sensing of the atmosphere
Benefit Validation, correction and improvement of satellite retrievals Who Space agencies, working with existing networks and environmental protection agencies Time frame Ongoing, with urgency in initial planning to minimize data gap Performance indicator
Availability of comprehensive validation reports and near-real-time monitoring based on data from the networks
Annual xost US$ 1–10 million

GCOS 2016 Implementation Plan
- 235 -
Action A32: Fundamental Climate Data Records and Climate Data Records for greenhouse gas and aerosols ECVs
Action A33: Maintain WMO GAW CO2 and CH4 monitoring networks
Action A34: Requirements for in situ column composition measurements
Action A35: Space-based measurements of CO2 and CH4 implementation
88E.g. AirCore
Action Extend and refine the satellite data records (FCDRs and CDRs) for GHG and aerosol ECVs Benefit Improved record of GHG concentrations Who Space agencies Time frame Ongoing Performance indicator
Availability of updated FCDRs and CDRs for GHGs and aerosols
Annual cost US$ 1–10 million
Action Maintain and enhance the WMO GAW Global Atmospheric CO2 and CH4 monitoring networks as major contributions to the GCOS Comprehensive Networks for CO2 and CH4. Advance the measurement of isotopic forms of CO2 and CH4 and of appropriate tracers to separate human from natural influences on the CO2 and CH4 budgets
Benefit A well-maintained, ground-based and in situ network provides the basis for understanding trends and distributions of GHGs.
Who National Environmental Services, NMHSs, research agencies, and space agencies under the guidance of WMO GAW and its Scientific Advisory Group on Greenhouse Gases
Time frame Ongoing Performance indicator
Data flow to archive and analysis centres
Annual cost US$ 1–10 million
Action Define the requirements for providing vertical profiles of CO2, CH4 and other GHGs, using recently emerging technology, such as balloon capture technique
88
Benefit Ability to provide widespread, accurate, in situ vertical profiles economically; an excellent tool for validating satellite retrievals and improving transport models
Who GCOS AOPC and space agencies Time frame Requirements to be defined by 2018 Performance indicator
Update to Annex A to include vertical profiles and XCO2 (the dry-air column-averaged mole fraction of CO2)
Annual cost US$ <5 million
Action Assess the value of the data provided by current space-based measurements of CO2 and CH4, and develop and implement proposals for follow-on missions accordingly
Benefit Provision of global records of principal greenhouse gases; informing decision-makers in urgent efforts to manage GHG emissions
Who Research institutions and space agencies Time frame Assessments are ongoing and jointly pursued by research institutions Performance indicator
Approval of subsequent missions to measure GHGs
Annual cost US$ 30–100 million

GCOS 2016 Implementation Plan
- 236 -
Action A36: N2O, halocarbon and SF6 networks/measurements
Action A37: Ozone network coverage
Action A38: Submission and dissemination of ozone data
Action A39: Monitoring of aerosol properties
Action A40: Continuity of products of precursors of ozone and secondary aerosols
Action Maintain networks for N2O, halocarbon and SF6 measurements Benefit Informs the parties to the Montreal Protocol, provides records of long-lived, non-CO2 GHGs and offers
potential tracers for attribution of CO2 emissions. Who National research agencies, national environmental services, NMHSs, through WMO GAW Time frame Ongoing Performance indicator
Data flow to archive and analysis centres
Annual cost US$ 30–100 million
Action Urgently restore the coverage the extent possible and maintain the quality and continuity of the GCOS Global Baseline (profile, total and surface level) Ozone Networks coordinated by WMO GAW.
Benefit Provides validation of satellite retrievals and information on global trends and distributions of ozone. Who Parties’ national research agencies and NMHSs, through WMO GAW and network partners, in
consultation with AOPC Time frame Ongoin. Performance indicator
Improved and sustained network coverage and data quality
Annual cost US$ 1–10 million
Action Improve timeliness and completeness of submission and dissemination of surface ozone, ozone column and profile data to users, WDCGG and WOUDC
Benefit Improves timeliness of satellite retrieval validation and availability of information for determining global trends and distributions of ozone.
Who Parties’ national research agencies and services that submit data to WDCGG and WOUDC, through WMO GAW and network partners.
Time frame Ongoing Performance indicator
Network coverage, operating statistics and timeliness of delivery.
Annual cost US$ 100 000–1 million
Action Provide more accurate measurement-based estimates of global and regional direct aerosol radiative forcing (DARF) at the top of the atmosphere and its uncertainties, and determine aerosol forcing at the surface and in the atmosphere through accurate monitoring of the 3D distribution of aerosols and aerosol properties. Ensure continuity of monitoring programs based on in situ ground-based measurement of aerosol properties.
Benefit Reducing uncertainties in DARF and the anthropogenic contributions to DARF, and the uncertainty in climate sensitivity and future predictions of surface temperature Better constraints on aerosol type needed for atmospheric correction and more accurate ocean property retrieval than currently available.
Who Parties’ national services, research agencies and space agencies, with guidance from AOPC and in cooperation with WMO GAW and AERONET
Time frame Ongoing, baseline in situ components and satellite strategy is currently defined. Performance indicator
Availability of the necessary measurements, appropriate plans for future
Annual cost US$ 10–30 million
Action Ensure continuity of products based on space-based, ground-based and in situ measurements of the precursors (NO2, SO2, HCHO, NH3 and CO) of ozone and secondary aerosol and derive consistent emission databases, seeking to improve spatial resolution to about 1 x 1 km
2 for air quality
Benefit Improved understanding of how air pollution influences climate forcing and how climate change influences air quality.
Who Space agencies, in collaboration with national environmental agencies and NMHSs Time frame Ongoing Performance indicator
Availability of the necessary measurements, appropriate plans for future missions, and derived emission databases
Annual cost US$ 100–300 million

GCOS 2016 Implementation Plan
- 237 -
6.3 Ocean Domain Actions
Action O1: Coordination of enhanced shelf and coastal observations for climate
Action O2: Integration and data access
Action O3: Data quality
Action O4: Development of climatologies and reanalysis products
Action Assess existing international, national and regional plans that address the needs to monitor and predict
the climate of coastal regions and develop plans were they do not exist.
Benefit Detailed specific observational requirements in the coastal regions for improved understanding,
assessment and prediction of the impact of climate on the coastal environment
Time frame 2026, with interim assessment of progress by 2021
Who GOOS, GRAs, JCOMM OCG
Performance
indicator
An internationally recognized coordination activity
Annual cost US$ 10–30 million
Action Improve discoverability and interoperability, comparability and traceability of ocean observations among
ocean observing networks for all ECVs (including ECVs of other domains).
Benefit Improved access to data, ease of integration across data sources
Time frame Continuous
Who Parties’ national research programmes and data-management infrastructure, OOPC, International Ocean
Carbon Coordination Project (IOCCP), the WCRP Data Advisory Council (WDAC), JCOMM Data
Management Programme Area (DMPA), GEO Blue Planet
Performance
indicator
Timely and open access to quality-controlled observational data
Annual cost US$ 1–10 million
Action Sustain and increase efforts for quality control and reprocessing of current and historical data records
Benefit Improved quality of ocean climate data
Timeframe Continuous.
Who Parties’ national ocean research agencies and data-management infrastructure, supported by JCOMM
DMPA, IODE, WCRP CLIVAR Project
Performance
indicator
Improved record of uniform quality control
Annual cost US$ 1–10 million
Action Maintained research and institutional support for the production of ocean gridded data products and
reanalysis products, and coordinated intercomparison actrivities
Benefit Improved quality and availability of integrated ocean products for climate change detection and validation
of climate projections and initialization of weather- and marine-forecasting models
Time frame Continuous
Who Parties’ national research programmes and operational agencies, WCRP-CLIVAR GSOP, GODAE OceanView
and the JCOMM Expert Team on Operational Ocean Forecasting (ETOOFS), IOCCP
Performance
indicator
Regular updates of global ocean synthesis products
Annual cost US$1–10 million

GCOS 2016 Implementation Plan
- 238 -
Action O5: Sustained support for ocean observations
Action O6: Technology development
Action Continued support for development of satellite capabilities, autonomous platforms and climate-quality
sensors, from pilot phase to mature stage
Benefit Continued improvements to the sustained observing system to fill gaps, take new measurements, at
lower cost per observation.
Time frame Continuous
Who National research programmes supported by the GOOS expert panels, CEOS Constellations Teams,
JCOMM OCG and user groups.
Performance
indicator
Amount of climate-quality data provided in near-real time to internationally agreed data centres
Annual cost US$ 10–30 million
Action O7: Observing system development and evaluation
Action O8: Satellite sea-surface temperature product development
Action Strengthen funding of the ocean observing system to move towards a more sustained long-term funding
structure and broaden support by engaging more agencies and nations in sustained ocean observing
through capacity building
Benefit A more resilient observing system that is less exposed to changes in national research priorities.
Timeframe 2026
Who Parties’ national research programmes, funding streams and operational agencies, capacity building
through the Partnership for Observations of the Global Ocean (POGO).
Performance
indicator
Observing system performance indicators continuously at or above 90%, increasing number of agencies
and nations contributing to sustained observing.
Annual cost US$30–100 million
Action Support and engage in systems-based observing system development projects established through GOOS
as detailed in this Plan and efforts for the ongoing evaluation of the observing system
Benefit Continued improvements to the sustained observing system ensure it is robust, integrated and meets
future needs.
Time frame Continuous
Who National research programmes supported by GOOS expert panels and regional alliances
Performance
indicator
Periodic evaluation of observing system against requirements and expansion of support for sustained
observations
Annual cost US$ 100 000–1 million (mainly to Annex I Parties).
Action Continue the provision of best possible SST fields based on a continuous coverage mix of polar orbiting
(including dual view) and geostationary IR measurements, combined with passive MW coverage, and
appropriate linkage with the comprehensive in situ networks
Benefit Global routine calibrated mapping of SST for climate monitoring and weather and subseasonal to seasonal
prediction systems
Time frame Continuous
Who Space agencies, coordinated through Global High Resolution Sea Surface Temperature Project (GHRSST),
CEOS, CGMS and WMO Space Programme
Performance
indicator
Agreement of plans for maintaining a CEOS Virtual Constellation for SST, ongoing satellite operation,
routine delivery of SST products
Annual cost US$ 1–10 million

GCOS 2016 Implementation Plan
- 239 -
Action O9: Upper-ocean temperature observing system
Action O10: Full-depth temperature observing system
Action Develop and begin implementation of a full-depth ocean temperature observing system to support the
decadal global assessment of the total ocean heat content and thermosteric sea-level rise
Benefit High-quality, deep-ocean temperature time series for accurate estimates of biennial to decadal ocean heat
storage below 2 000 m and its spatial distribution to assess the role of the ocean in the Earths energy
balance and ocean-warming contribution to sea-level change
Time frame Observational system in place by 2026
Who Parties, national agencies working with GOOS observational networks (Argo, GO-SHIP, OceanSITES), in
cooperation with the JCOMM Observations Coordination Group
Performance
indicator
Design study completed and targeted implementation begun; spatial coverage, interoperability of
observations platforms
Annual cost US$ 30–100 million
Action O11: Ocean salinity observing system
Action Maintain a global upper ocean (0-2 000 m) temperature observing system for the assessment of ocean
temperature and heat content change and its contribution to sea-level rise
Benefit High-quality ocean temperature time series for accurate estimates of annual ocean heat storage as a
function of depth and its spatial distribution to assess the role on the ocean in the Earth’s energy balance
and ocean warming contribution to sea-level change
Time frame Continuous
Who Parties’ national agencies working with GOOS observational networks (Drifters, CEOS, Argo, SOOP,
OceanSITES), in cooperation with the Observations Coordination Group of JCOMM.
Performance
indicator
Spatial coverage, interoperability of observations platforms, annually updated global upper-ocean
temperature records
Annual cost US$ 30–100 million
Action Maintain and grow a global ocean salinity observing system for the assessment of ocean salinity and
freshwater content change and its contribution to global hydrological cycle
Benefit High-quality ocean salinity time-series for accurate estimates of annual (0-2 000 m) to decadal (below
2 000 m) ocean freshwater changes and its spatial distribution to assess the role on the ocean in the Earths
hydrological cycle and contribution to sea-level change. Improved initialisation of weather- and climate-
forecasting systems
Time frame Continuous.
Who Parties’ national agencies working with GOOS observational networks (CEOS, SOOP, Argo, GO-SHIP,
OceanSITES), in cooperation with DOOS and the JCOMM Observations Coordination Group
Performance
indicator
Spatial coverage, interoperability of observations platforms’ annually updated global ocean salinity records
Annual cost US$ 30–100 million (10% in non-Annex I Parties)

GCOS 2016 Implementation Plan
- 240 -
Action O12: Ocean current gridded products
Action O13: Sea-level observations
Action O14: Contributing to sea-state climatologies
Action O15: In situ sea-ice observations
Action Maintain gridded ocean-surface and subsurface current products based on satellite, drifting-buoy and Argo
programsme, other observations and data-assimilating models
Benefit High-quality ocean-current observations for climate services and marine operational systems
Time frame Continuous
Who Parties’ national agencies working with CEOS, GOOS observational networks (SOOP, Argo, GO-SHIP,
OceanSITES, Drifters) in cooperation with the JCOMM Observations Coordination Group, Godea
OceanView and reanalysis projects
Performance
indicator
Spatial coverage, interoperability of observation platforms
Annual cost US$ 1–10 million (10% in non-Annex I Parties)
Action Maintain and develop a global sea-surface-height observing system from observational and satellite
networks for annual assessment of sea level and sea-level rise
Benefit Quality control and accurate global sea level and regional sea-level variability dataset
Time frame Continuous
Who Parties’ national agencies working with CEOS, GOOS observational networks (e.g. GLOSS), in cooperation
with the JCOMM Observations Coordination Group
Performance
indicator
Spatial coverage, interoperability of observations platforms, annually updated global sea-level data
Annual cost US$ 30–100 million
Action Maintain and improve the global sea-state observing system from the observational networks to inform
wave models/climatologies for assessment of wave climate, its trend and variability and contribution to
extremes of sea level; expand observations on surface-reference moorings and drifters
Benefit Routine observations of wave climate and extremes in support of marine/climate services
Time frame Continuous
Who Parties’ national agencies coordinated through GOOS, OOPC, GRAs, OceanSITES, DBCP, guidance from the
JCOMM Expert Team on Waves and Coastal Hazard Forecasting Systems (ETWCH)
Performance
indicator
Number of global wave observations available routinely at International Data Centres.
Annual cost US$ 1–10 million
Action Plan, establish and sustain systematic in situ observations from sea ice, buoys, visual surveys (SOOP and
aircraft) and in-water upward-looking Sonar (ULS)
Benefit Long time series for validations of satellite data and model fields; short- and long-term forecasting of sea-
ice conditions; ocean-atmosphere-sea ice interaction and process studies
Time frame Integrated Arctic Observing System design and demonstration project funded by EU for
2017–2020
Who National and international services and research programmes, Copernicus; coordination through Arctic
Council, EU-PolarNET, Arctic-ROOS (in EuroGOOS), CLIVAR, CLIC, JCOMM, OOPC
Performance
indicator
Establishment of agreement and frameworks for coordination and implementation of sustained Arctic
(EU-PolarNet and Arctic-ROOS, which will be extended with the new funded project (see time frame)) and
Southern Ocean observations (SOOS)
Annual cost US$ 30–100 million

GCOS 2016 Implementation Plan
- 241 -
Action O16: Ocean-surface stress observations
Action O17: Ocean-surface heat-flux observing system
Action O18: Surface ocean partial pressure of CO2,moorings
Action O19: Building multidisciplinary time series
Action Develop requirements and review system design (satellite and in situ) for observing OSS ECV and
commence implementation
Benefit Agreed plan for design of surface-stress observing system to improve ocean-surface-stress products
Time frame Internationally agreed plans published and establish GDACs by 2019
Who CEOS and in situ networks
Performance
indicator
Publication of internationally agreed plans, establishment of agreements/frameworks for coordination
according to plan
Annual cost US$ 100 000–1 million
Action Develop requirements and system design for observing Ocean surface heat flux ECV (utilizing indirect and
direct methods) and commence implementation
Benefit Agreed plan for high-quality heat-flux data required to improve surface flux products
Time frame Complete programme design and begin implementation of observational system by 2019
Who GOOS observational networks (CEOS, OceanSITES, SOOP), in cooperation with the JCOMM Observations
Coordination Group
Performance
indicator
Publication of observing network plan; spatial coverage, interoperability of observation platforms
Annual cost US$ 10–30 million
Action Sustain the surface reference mooring pCO2 network and increase the number of sites to cover all major
biogeochemical regions to resolve seasonal cycle
Benefit Increased information on seasonal and longer variability in key ocean areas
Time frame Continuous
Who IOCCP, in consultation with OOPC; implementation through national services and research programmes
Performance
indicator
Flow of data of adequate quality into SOCAT
Annual cost US$ 1–10 million
Action Add inorganic carbon and basic physical measurements to existing biological timeseries, considering
particularly spatial gaps in current observing system, aiming for balanced representation of the full range of
natural variability
Benefit Improved understanding of the regional effects of ocean acidification
Time frame Continuous
Who Parties’ national research programmes supported by GOA-ON, GOOS Biogeochemistry and Biology and
Ecosystems expert panels.
Performance
indicator
Flow of data of adequate quality to data centres
Annual cost US$ 1–10 million

GCOS 2016 Implementation Plan
- 242 -
Action O20: Nutrient observation standards and best practices
Action O21: Sustaining tracer observations
Action O22: Develop sustained N2O observations
Action O23: : In situ ocean colour radiometry data
Action Increase the use of nutrient CRMs on ship-based hydrographic programmes
Benefit Increased accuracy of nutrient measurements
Time frame Continuous
Who IOCCP, in consultation with OOPC; implementation through national services and research programmes;
SCOR working group 147 “Towards comparability of global oceanic nutrient data"
Performance
indicator
Increased consistency of nutrient data
Annual cost US$ 1–10 million
Action Maintain capacity to measure transient tracers on the GO-SHIP network. Encourage technological
development to encompass additional tracers that provide additional information on ventilation.
Benefit Information on ocean ventilation and variability in ventilation
Time frame Continuous
Who IOCCP, in consultation with OOPC; implementation through national services and research programmes
Performance
indicator
Number of high-quality transient tracer measurements on the repeat hydrography programme
Annual cost US$ 1–10 million
Action Develop an observing network for ocean N2O observations, with particular emphasis on regions with
known high oceanic N2O production/emission rates
Benefit Improved estimate of oceanic emissions by improved spatial and temporal coverage; detecting seasonal
and interannual variability
Time frame Continuous
Who IOCCP, in consultation with OOPC; implementation through national services and research programmes,
SCOR WG 143 Dissolved N2O and CH4 measurements: working towards a global network of ocean time
series measurements of N2O and CH4
Performance
indicator
Flow of data of adequate quality into MEMENTO
Annual cost US$ 1–10 million
Action Continue and improve the generation and maintenance of climate-quality in situ OCR data. Develop new
high-resolution sensors of high radiometric quality suitable for improving satellite algorithms; validating
products; and for characterising product uncertainties, with global coverage and validity (including coastal
(Case-2) waters) and at the temporal and spatial scales required by users.
Benefit Monitoring of changes and variability in ocean colour and derived products
Time frame Implement plan beyond 2017 after completion of ESA’s OC-CCI activities
Who CEOS space agencies, in consultation with IOCCG and GEO through INSITU OCR initiative of IOCCG, and in
accordance with the recommendations contained in the IOCCG INSITU-OCR White Paper (see
http://www.ioccg.org/groups/INSITU-OCR_White-Paper.pdf).
Performance
indicator
Free and open access to up-to-date, multi-sensor global products for climate research; flow of data into
agreed archives
Annual cost US$ 30–100 million

GCOS 2016 Implementation Plan
- 243 -
Action O24: Ocean colour algorithm development
Action O25: Satellite-based phytoplankton biomass estimates
Action O26: Expand Continuous Plankton Recorder and supporting observations
Action Support continued research and technology development to ensure that the best and the most up-to-
date algorithms are used for processing the ocean-colour time-series data in a consistent manner for
climate research; to develop product suites suitable for application across wide ranges of water types,
including coastal water types; to study inter-sensor differences and minimize them before multi-sensor
data are merged; to provide quality assurance and uncertainty characterization of products
Benefit Improved quality of ocean colour products, particularly in coastal waters and complex water types
Time frame Implement plan as accepted by CEOS agencies in 2009
Who CEOS space agencies, in consultation with IOCCG and GEO
Performance
indicator
Improved algorithms for a range of water-property types
Action Establish a plan to improve and test regional algorithms to convert satellite observations to water-column
integrated phytoplankton biomass through implementing an in situ phytoplankton monitoring
programme. Estimates of uncertainty should be a standard output associated with improved algorithms.
Wherever possible, a time series of phytoplankton should be collected simultaneously with the
measurement of other important physical and biogeochemical variables.
Benefit Baseline information on plankton
Time frame Implementation build-up to 2020
Who CEOS space agencies, in consultation with IOCCG, including Satellite PFT Intercomparison Project, parties’
national research agencies, working with SCOR and GOOS
Performance
indicator
Publication of internationally agreed plans; establishment of agreements/frameworks for coordination of
a sustained global phytoplankton observing system with consistent sensors and a focused global program
of in situ calibration implementation according to plan, flow of data into agreed archives, summary
interpreted data products available as well as original data.
Annual cost US$ 100 000–1 million
Action Establish plan for, and implement, global CPR surveys, including extension to (sub) tropical areas and
integration of data from supporting observation programmes
Benefit Information on variability and trends in plankton
Time frame Internationally agreed plans published by end 2019; implementation build-up to 2024
Who Parties’ national research agencies, working with SCOR and GOOS Biology and Ecoystems Panel, IGMETS,
Global Alliance of CPR Surveys, OceanSITES
Performance
indicator
Publication of internationally agreed plans; establishment of agreements/frameworks for coordination of
sustained global CPR surveys supported by repeated surveys at fixed locations; implementation according
to plan; flow of data into agreed archives, summary of interpreted data products available
Annual cost US$ 10–30 million

GCOS 2016 Implementation Plan
- 244 -
Action O27: Strengthened network of coral reef observation sites
Action O28: Global networks of observation sites for mangroves, seagrasses, macroalgae
Action O29: In situ data for satellite calibration and validation
Action O30: : Satellite sea-surface temperature
Action Strengthen the global network of long-term observation sites covering all major coral-reef habitats within
interconnected regional hubs, encourage collection of physical, biogeochemical, biological and ecological
measurements, following common and intercalibrated protocols and designs, and implement capacity-
building workshops
Benefit Accurate global monitoring of changes in coral-reef cover, health and pressures
Time frame 2016–2020
Who Parties’ national research and operational agencies, supported by GCRMN, GOOS Biology and Ecosystems
Panel, GRAs and other partners
Performance
indicator
Reporting on implementation status of network
Annual cost US$ 30–100 million
Action Advance the establishment of global networks of long-term observation sites for seagrass beds, mangrove
forests and macroalgal communities (including kelp forests) and encourage collection of physical,
biogeochemical, biological and ecological measurements, following common and intercalibrated protocols
and designs and implement capacity-building workshops
Benefit Accurate global monitoring of changes in mangroves, seaglasses and macroalgae cover
Time frame 2016–2020.
Who Parties’ national research and operational agencies, supported by GOOS Biology and Ecosystems Panel,
GRAs and other partners in consultation with CBD and Ramsar Convention on Wetlands
Performance
indicator
Reporting on implementation status of network.
Annual cost US$ 30–100 million
Action Maintain in situ observations of surface ECV measurements from existing observations networks
(including surface drifting buoys, SOOP ships, tropical moorings, reference moorings, Argo drifting floats,
and research ships) for calibration and validation of satellite data; undertake a review of requirements of
observations
Benefit Comprehensive in situ observations for calibration and validation of satellite data
Time frame Continuous, review by 2020
Who Parties’ national services and ocean research programmes, through GOOS, IODE and JCOMM, in
collaboration with WRCP/CLIVAR and CEOS
Performance
indicator
Data availability at international data centres
Annual cost US$ 1–10 million
Action Secure future passive microwave missions capable of SST measurements
Benefit Ensure SST coverage in regions of high cloud coverage
Time frame Continuous
Who Space agencies, coordinated through CEOS, CGMS, and WMO Space Programme in consultation with the
Global High Resolution Sea Surface Temperature Project (GHRSST)
Performance
indicator
Agreement of plans for maintaining required microwave SST missions
Annual cost US$ 100–300 million (for securing needed missions)

GCOS 2016 Implementation Plan
- 245 -
Action O31: Satellite sea-surface height
Action O32: Satellite sea-surface salinity
Action O33: Satellite sea state
Action O34: Satellite ocean surface stress
Action Continue to improve the delivery and quality of ocean-surface stress fields based on satellite missions
with the comprehensive in situ networks (e.g. metocean moorings); improve resolution with the benefit
of near coastal data; improved coverage of the diurnal and semi-diurnal cycles.
Benefit Global routine calibrated mapping of ocean-surface stress
Time frame Continuous
Who Space agencies, coordinated through OVSST, CEOS, CGMS and WMO Space Programme and in situ
network
Performance
indicator
Agreement of plans for maintaining a CEOS virtual constellation for ocean-surface stress
Action Ensure continuous coverage from one higher-precision, medium-inclination altimeter and two medium-
precision, higher-inclination altimeters, including a satellite altimetry reference mission with no
discontinuoity between each satellite to ensure that each mission following another has an overlap period
(6–9 months) to intercalibrate onean other (example of TOPEX/Poseidon and Jason missions)
Benefit Global routine calibrated mapping of SSH; intercalibration period between difference satellite missions
Time frame Continuous
Who Space agencies, with coordination through the OSTST, CEOS Constellation for Ocean Surface Topography,
CGMS and the WMO Space Programme.
Performance
indicator
Satellites operating; provision of data to analysis centres
Annual cost US$ 30–100 million
Action Ensure the continuity of space-based SSS measurements
Benefit Continue satellite SSS record to facilitate research (ocean circulation, climate variability, water cycle, and
marine biogeochemistry), operation (seasonal climate forecast, short-term ocean forecast, ecological
forecast) and linkages with the water cycle
Time frame Continuous
Who Space agencies, coordinated through OSSST, CEOS, CGMS and WMO Space Programme and in situ
network
Performance
indicator
Agreement of plans for maintaining a CEOS virtual constellation for SSS, ongoing satellite operation,
routine delivery of SSS products
Annual cost US$ 30–100 million (for securing needed missions)
Action Continue to improve the delivery and quality of sea-state fields, based on satellite missions with in situ
networks
Benefit Global routine calibrated mapping of sea state
Time frame Continuous
Who Space agencies, coordinated through CEOS, CGMS, and WMO Space Programme and in situ network
Performance
indicator
Agreement of plans for maintaining a CEOS virtual constellation for sea state
Annual cost US$ 1–10 million (for generation of datasets)

GCOS 2016 Implementation Plan
- 246 -
Action O35: Satellite sea ice
Action Ensure sustained satellite-based (microwave radiometry, SAR, altimetry, visible and IR) sea-ice
products; high-inclination altimetry (e.g. Cryosat follow-on) also desired
Benefit Global, routine, calibrated mapping of sea ice
Time frame Continuous
Who Parties’ national services, research programmes and space agencies, coordinated through the WMO
Space Programme and Global Cryosphere Watch, CGMS and CEOS; national services for in situ systems,
coordinated through WCRP CliC and JCOMM
Performance
indicator
Sea-ice data in international data centres
Annual cost US$ 1 -10 million (for generation of datasets)
Action O36: Satellite ocean colour
Action O37: Argo array
Action O38: Development of a biogeochemical Argo array
Action Support generation of long-term multi-sensor climate-quality OCR time series that are corrected for inter-
sensor bias as needed and that have quantitative uncertainty characterization, with global coverage and
validity, including coastal (Case-2) waters, and capable of dealing with user requirements for products at a
variety of space and timescales.
Benefit Global routine calibrated mapping of ocean colour, including coastal (Case-2) regions
Time frame Implement plan beyond 2017
Who CEOS space agencies, in consultation with IOCCG and GEO; agencies responsible for operational Earth
observations, such as NOAA in the USA and Copernicus in the European Union
Performance
iIndicator
Free and open access to up-to-date, multi-sensor global products for climate research; flow of data into
agreed archives
Annual cost US$ 1–10 million (for generation of datasets)
Action Sustain and expand the Argo profiling float network of at least one float every 3° x 3° in the ocean,
including regional seas and the seasonal ice zone (approximately 3 800 floats)
Benefit Global climate-quality observations of the broadscale subsurface global ocean temperature and salinity
down to 2 000 m
Time frame Continuous
Who Parties participating in the Argo programme and in cooperation with the JCOMM Observations
Coordination Group
Performance
indicator
Spatial coverage and number of active floats
Annual cost US$ 30 million
Action Deploy a global array of 1 000 profiling floats (~6°x ~6°) equipped with pH, oxygen, nitrate, chlorophyll
fluorescence, backscatter and downwelling irradiance sensors, consistent with the Biogeochemical Argo
Science and Implementation Plan
Benefit Global observations of the broadscale subsurface global ocean biogeochemistry down to 2 000 m
Time frame In place by 2026; review progress in 2021
Who Parties, in cooperation with the Argo Project and the JCOMM Observations Coordination Group
Performance
indicator
Number of floats reporting oxygen and biogeochemical variables
Annual cost US$ 25 million

GCOS 2016 Implementation Plan
- 247 -
Action O39: Development of a deep Argo array
Action O40: GO-SHIP
Action O41: Develop fixed-point time series
Action O42: Maintain the Tropical Moored Buoy system
Action Deploy a global array of approximately 1 230 deep Argo floats at 5° x 5° spacing, covering all ocean
regions deeper than 2 000 m
Benefit Global climate-quality observations of the broad-scale subsurface global ocean temperature and salinity
below 2 000 m
Time frame Array in place and maintained by 2026; review progress in 2021
Who Parties participating in the Argo programme and in cooperation with the JCOMM Observations
Coordination Group
Performance
indicator
Spatial coverage and number of active deep floats
Annual cost US$ 20 million
Action Maintain a high-quality, full-depth, multi-disciplinary ship-based decadal survey of the global ocean
(approximately 60 sections) and provide a platform to deploy autonomous components of the ocean-
observing system and test new technology
Benefit Global, comprehensive, full-depth, decadal ocean inventory of ECVs
Time frame Continuous
Who National research programmes supported by the GO-SHIP project, JCOMM Ocean Coordination Group
and GOOS
Performance
indicator
Percentage coverage of the sections and completion of Level-1 measurements
Annual cost US$ 10–30 million
Action Build and maintain a globally distributed network of multi-disciplinary, fixed-point surface and subsurface
time series, using mooring, ship and other fixed instruments
Benefit Comprehensive high temporal resolution time series characterizing trends and variability in key ocean
regimes
Time frame Continuous
Who Parties’ national services and ocean research agencies responding to the OceanSITES plan working with
GOOS panels and GRAs
Performance
indicator
Moorings operational and reporting to archives
Annual cost US$ 30–100 million
Action Maintain the Tropical Moored Buoy system
Benefit Contributes to observing state of the tropical ocean climate, particularly focused on coupled air–sea
processes and high frequency variability and for prediction of ENSO events
Time frame Continuous
Who Parties’ national agencies, coordinated through the JCOMM Tropical Moored Buoy Implementation
Panel, following guidance from scientific development projects (e.g. TPOS 2020, IIOE-II, AtlantOS)
Performance
indicator
Data acquisition at international data centres and robust design requirements articulated
Annual cost US$ 30–100 million

GCOS 2016 Implementation Plan
- 248 -
Action O43: Develop time-series-based biogeochemical data
Action O44: : Meteorological moorings
Action O45: Wave measurements on moorings
Action O46: Observations of sea ice from buoys and visual survey
Action Establish a coordinated network of ship-based multidisciplinary time series that is geographically
representative; initiate a global data product of time-series-based biogeochemical data
Benefit Provision of comprehensive regular observations of ocean biogeochemistry, complementary to the
GO-SHIP decadal survey
Time frame Internationally agreed plans published by end 2018; implementation build-up to 2020
Who Parties’ national research agencies, working with IOCCP and user groups, such as IGMETS
Performance
indicator
Publication of internationally agreed plans; timely availability of data in internationally agreed on data
centres
Annual cost US$ 10–30 million
Action Maintain measurements on surface moored buoys of meteorological parameters (air temperature,
humidity, SST, wind speed and direction) and expand range of parameters measured (surface pressure,
waves, precipitation and radiation); ensure observational metadata are available for all moored buoy
observations, both for current data and for the historical archive
Benefit Comprehensive marine meteorological observation delivery
Time frame Continuous
Who Parties’ national services and ocean research agencies, DBCP, OceanSITES
Performance
indicator
Moorings operational and reporting to archives
Annual cost US$ 30–100 million
Action Develop a strategy and implement a wave measurement component as part of the Surface Reference
Mooring Network (DBCP and OceanSITES)
Benefit Comprehensive in situ reference observations of wave parameters.
Time frame Complete plan and begin implementation by 2020
Who Parties operating moorings, DBCP, OceanSITES, coordinated through the JCOMM Expert Team on Waves
and Coastal Hazards
Performance
indicator
Sea-state measurement at the international data centres
Annual cost US$ 1–10 million
Action Establish and sustain systematic in situ observations from sea-ice buoys, visual surveys (SOOP and
Aircraft) and ULS in the Arctic and Antarctic
Benefit Enables tracking of variability in ice thickness and extent
Time frame Continuous
Who Arctic Party research agencies, supported by the Arctic Council; Party research agencies, supported by
CLIVAR Southern Ocean Panel; JCOMM, working with CliC and OOPC
Performance
indicator
Establishment of agreements/frameworks for coordination of sustained Arctic and Southern Ocean
observations, implementation according to plan
Annual cost Plan and agreement of frameworks: US$ 100 000–1 million
Implementation: US$ 10–30 million

GCOS 2016 Implementation Plan
- 249 -
Action O47: Sustain drifter array
Action O48: Underway observations from research and servicing vessels
Action O49: Improve measurements from Voluntary Observing Ships
Action O50: Improve measurements of underway thermosalinograph data
Action Sustain global coverage of the drifting buoy array (at least 1 300 drifting buoys to cover oceans in the
latitudes between 60S and 60N, excluding marginal seas, plus additional coverage for these areas) with
ocean temperature sensors and atmospheric pressure sensors on all drifting buoys
Benefit Routine broad-scale observations of surface temperature and sea-level pressure in support of NWP;
climate-data products (e.g. SST) and VOSClim for climate-quality flux estimates
Time frame Continuous
Who Parties’ national services and research programmes through JCOMM, DBCP and the Ship Observations
Team (SOT)
Performance
indicator
Data submitted to analysis centres and archives
Annual cost US$ 1–10 million
Action Ensure where possible that ancillary underway observations are collected during research voyages and
routine mooring servicing cruises
Benefit Improved coverage of underway observations, particularly in data-sparse, open oceans, and
complementary to moored buoy arrays
Time frame Continuous.
Who National research agencies in consultation with the JCOMM Ship Observations Team and GO-SHIP
Performance
indicator
Improved observations from research vessels
Annual cost US$ 1–10 million
Action Improve the quality and spatial coverage of VOS observations, by working collaboratively with
stakeholders having interests in the maritime transportation industry; continue efforts to validate utility
of VOS observations for a range of applications, including NWP, marine climate, reanalysis and validation
of remotely sensed observations. Improve metadata acquisition and management for as many VOS as
possible through VOSClim, together with improved measurement systems
Benefit Improved coverage of routine marine meteorology observations in support of NWP
Time frame Continuous
Who National meteorological agencies and climate services, with commercial shipping companies in
consultation with the JCOMM Ship Observations Team
Performance
indicator
Increased quantity and quality of VOS reports
Annual cost US$1–10 million
Action Improve the quality and spatial coverage of underway temperature and salinity data; ensure observations
are archived and quality-controlled when collected complementary to other observing programmes
Benefit Improved coverage of surface temperature and salinity observations
Time frame Continuous
Who National meteorological agencies and climate services, research agencies with the commercial shipping
companies in consultation with the JCOMM Ship Observations Team
Performance
indicator
Increased quantity and quality of VOS reports
Annual cost US$ 1–10 million

GCOS 2016 Implementation Plan
- 250 -
Action O51: Sustain ship-of-opportunity expendable bathyghermograph/expendable conductivity
temperature depth
Action O52: Coordination of underway pCO2 observations and agreed best practices
Action O53: Underway biogeochemistry observations
Action Sustain the existing, multi-decadal, ship-of-opportunity XBT/XCTD transoceanic network in areas of
significant scientific value
Benefit Eddy-resolving transects of major ocean basins, enabling basin-scale heat fluxes to be estimated and
forming a global underpinning boundary- current observing system
Time frame Continuous
Who Parties' national agencies, coordinated through JCOMM-SOT
Performance
indicator
Data submitted to archive; percentage coverage of the sections
Annual cost US$ 1–10 million
Action Improve coordination, outreach and tracking of implementation and measurements of a global surface
water CO2 observing system; implement an internationally agreed strategy for measuring surface pCO2 on
ships and autonomous platforms and improve coordination of network, timely data submission to the
SOCAT data portal
Benefit Delivery of a high-quality global dataset of surface-ocean pCO2, enabling accurate estimates of ocean
fluxes of carbon dioxide
Time frame Establishment of global monitoring group by 2018; continuous, coordinated network by 2020
Who IOCCP in coordination with OOPC, JCOMM OCG and JCOMMOPS; implementation through Parties’
national services and research agencies
Performance
indicator
Tracking assets within 3 months of completion of voyage; data delivery to SOCAT.
Annual cost US$ 10–30 million
Action Sustain current trans-basin sampling lines of pCO2 and extend the coverage to priority areas by starting
new lines (see GCOS-195, page 137); implement routine pCO2 measurements on research vessels; develop
and deploy a global ship-based reference network of robust autonomous in situ instrumentation for
Ocean biogeochemical ECVs
Benefit Enables routine observations of multiple surface Ocean biogeochemical ECVs, leading to improved
coverage
Time frame Plan and implement a global network of SOOP vessels equipped with instrumentation by 2020
Who Parties’ national ocean research agencies in association with the GOOS Biogeochemistry Panel, IOCCP, in
consultation with JCOMM OCG.
Performance
indicator
Improved flow of data to SOCAT; pilot project implemented; progress towards global coverage with
consistent measurements as determined by number of ships with calibrated sensors providing quality
data
Annual cost US$ 10–30 million

GCOS 2016 Implementation Plan
- 251 -
Action O54: Continuous plankton recorder surveys
Action O55: Maintain tide gauges
Action O56: Developing a global glider observing system
Action Implement, global CPR surveys
Benefit Towards global transects of surface zooplankton, plankton species diversity and variability, plus an
indicator of phytoplankton productivity
Time frame 2026, review progress by 2021
Who Parties’ national research agencies, through GACS and the GOOS Biology and Ecosystems Panel
Performance
Indicator
Continuation and of sustained global CPR according to plan
Annual cost US$ 10–30 million
Action Implement and maintain a set of gauges based on the GLOSS Core Network (approximately 300 tide
gauges) with geocentrically located, high-accuracy gauges; ensure continuous acquisition, real-time
exchange and archiving of high-frequency data; build a consistent time series, including historical sea-
level records, with all regional and local tide-gauge measurements referenced to the same global geodetic
reference system
Benefit The GLOSS Core Network is the backbone serving the multiple missions that GLOSS is called on to serve.
Not all core stations serve every mission and not all stations for a given mission are part of the core. The
Core Network serves to set standards and is intended to serve as the example for the development of
regional networks. The GLOSS climate set serves to put the short altimetry record into a proper context,
serves as the ground truth for the developing satellite dataset, and also provides continuity if climate
capable altimetry missions have interruptions in the future.
Time frame Continuous.
Who Parties’ national agencies, coordinated through JCOMM-GLOSS of
Performance
indicator
Data availability at international data centres, global coverage, number of capacity-building projects
Annual cost US$ 1–10 million
Action Design and begin implementation of a globally distributed network of multi-disciplinary glider missions
across the continental shelf seas to the open ocean as part of a glider reference coastal–open ocean
observation network
Benefit Multi-disciplinary, high-frequency observations enabling the linkage of open ocean and coastal
environments and cross-shelf exchange of properties
Time frame Framework and plan developed by 2020
Who National research programmes coordinated by the global glider programme and GOOS
Performance
indicator
Published, internationally agreed plan and implementation of sustained coastal boundary–open ocean
sections
Annual cost US$ 10–30 million

GCOS 2016 Implementation Plan
- 252 -
Action O57: Developing a global animal-tagging observing system
Action Move towards global coordinatinon of pinniped tagging for ecosystem and climate applications, including
the coordination of deployment locations/species and QA/QC of resultant data
Benefit High-frequency T/S profile data in polar regions and in the ice zone, filling a critical gap in the observing
system; high-frequency T/S profile data in other regions providing complementary data to other observing
systems and likely high-frequency sampling of physical features of interest to foraging animals such as
fronts and eddies
Time frame Framework and plan developed by 2020
Who National research programmes coordinated through SOOS, SAEON, GOOS
Performance
indicator
An internationally recognized coordination activity, and observing plan.
Annual cost US$ 10–30 million

GCOS 2016 Implementation Plan
- 253 -
6.4 Terrestrial Domain Actions
Action T1: Improve coordination of terrestrial observations
Action T2: Develop joint plans for coastal zones
Action T3: Terrestrial monitoring sites
Action Establish mechanism to coordinate terrestrial observations: this will be particularly important for climate
change impacts and adaptation where local information will be critical and will not be provided through
GCOS directly. It includes biodiversity and natural resources information and could also incorporate socio-
economic components (e.g. health) so as to become fine-tuned with post-2015 frameworks. This would
be based on discussions with stakeholders and could include a formal framework or regular meetings to
exchange ideas and coordinate observational requirements.
Benefit Efficient observing systems with minimal duplication, delivering consistent and comparable data to a
range of different users
Time frame 2017: Hold workshops to discuss way forward
2019: Mechanism in place.
Who All involved in terrestrial observations. Initially TOPC, GEO, ICSU, GOFC-GOLD, FluxNet, NEON
Performance
indicator
Presence of active mechanism
Annual cost US$ 100 000–1 million
Action Jointly consider observations of coastal zones (including sea ice, mangroves and sea grass, river and
groundwater flows, nutrients, etc.) to ensure the seamless coverage of ECVs and the global cycles in
these areas
Benefit Consistent, accurate and complete monitoring of coastal zones
Time frame 2017: joint meetings
2019: agreed plans
Who All involved in coastal observations. Initially TOPC, OOPC
Performance
indicator
Plan completed
Annual cost US$ 1 000–10 000
Action Review the need for establishing a public database of sites that aim to record climate-relevant data and
their data. Consider the usefulness of establishing a set of GCOS terrestrial monitoring sites that aim to
monitor at least one ECV according to the GCMP.
Benefit Improved access to monitoring and increased use of the data
Time frame One year for review
Who GCOS
Performance
indicator
Report on GCOS terrestrial monitoring sites
Annual cost US$ 10 000–100 000

GCOS 2016 Implementation Plan
- 254 -
Action T4: Review of monitoring guidance
Action T5: Develop metadata
Action T6: Identify capacity development needs
Action Review existing monitoring standards/guidance/best practice for each ECV and maintain database of
this guidance for terrestrial ECVs
Benefit Improved consistency and accuracy of results to meet user needs
Time frame Review: 2017–2018, maintain database as of 2019
Who TOPC
Performance
indicator
Presence of maintained database
Annual cost US$ 1 000–10 000
Action Provide guidance on metadata for terrestrial ECVs and encourage its use by data producers and data
holdings
Benefit Provide users with a clear understanding of each dataset and the differences and applicability of
different products for each ECV
Time frame 2018
Who TOPC in association with appropriate data producers
Performance
indicator
Availability of metadata guidance
Annual cost US$ 1 000–10 000
Action Identify capacity-development needs to inform GCM and other capacity-building initiatives; identify
specific improvements that could be supported by GCM
Benefit Improved monitoring in recipient countries
Time frame Ongoing
Who TOPC and GCM
Performance
indicator
Project proposals and Implemented projects
Annual cost US$ 10 000–100 000
Action T7: Exchange of hydrological data
Action In line with WMO Resolutions 25 (Cg-XIII) and 40 (Cg-XII), improve the exchange hydrological data and
delivery to data centres of all networks encompassed by GTN-H, in particular the GCOS baseline
networks, and facilitate the development of integrated hydrological products to demonstrate the value
of these coordinated and sustained global hydrological networks.
Benefit Improved reporting filling large geographic gaps in datasets
Time frame Continuing; 2018 (demonstration products)
Who GTN-H partners in cooperation with WMO and GCOS
Performance
indicator
Number of datasets available in international data centres; number of available demonstration products
Annual cost US$ 100 000–1 milion

GCOS 2016 Implementation Plan
- 255 -
Action T8: Lakes and reservoirs: compare satellite and in situ observations
Action T9: Submit historical and current monthly lake-level data
Action T10: Establish sustained production and improvement for the Lake ECV products
Action Assess accuracy of satellite water-level measurements by a comparative analysis of in situ and satellite
observations for selected lakes and reservoirs
Benefit Improved accuracy
Time frame 2017–2020
Who Legos/CNES, HYDROLARE
Performance
indicator
Improving accuracy of satellite water-level measurements
Annual cost US$ 10 000–100 000
Action Continue submitting to HYDROLARE historical and current monthly lake-level data for GTN-L lakes and
other lakes, as well as weekly/monthly water-temperature and ice-thickness data for GTN-L
Benefit Maintain data record
Time frame Continuous
Who National Hydrological Services through WMO CHy and other institutions and agencies providing and
holding data
Performance
indicator
Completeness of database
Annual cost US$ 100 000–1 million (40% in non-Annex-1 Parties)
Action Establish satellite-based ECV data records for Lake-surface water temperature, Lake ice coverage and
Lake water-leaving reflectance (Lake colour);Implement and sustain routine production of these new
satellite based products;
Sustain sustain efforts on improving algorithms, processing chains and uncertainty assessments for
these new ECV products, including systematic in situ data sharing and collection in support of ECV
validation;
Develop additional products derived from Lake water-leaving reflectance for turbidity, chlorophyll and
coloured dissolved organic matter
Benefit Add additional Lake ECV products for extended data records; provide a more comprehensive
assessment of climate variability and change in lake systems
Time frame Continuous.
Who Space agencies and CEOS, Copernicus Global Land Service, GloboLakes and ESA CCI
Performance
indicator
Completeness of database
Annual Cost 1–10M US$ (40% in non-Annex-1 Parties)

GCOS 2016 Implementation Plan
- 256 -
Action T11: Confirm Global Terrestrial Network for River Discharge sites
Action T12: National needs for river gauges
Action T13: Establish a full-scale Global Groundwater Monitoring Information System (GGMS)
Action T14: Operational groundwater monitoring from gravity measurements
Action Confirm locations of GTN-R sites; determine operational status of gauges at all GTN-R sites; ensure that
GRDC receives daily river discharge data from all priority reference sites within one year of observation
(including measurement and data transmission technology used)
Benefit Up-to-date data for all areas
Time frame 2019
Who National Hydrological Services, through WMO CHy in cooperation with TOPC, GCOS and GRDC
Performance
indicator
Reports (made In cooperation with GTN-H partners) to TOPC, GCOS and WMO CHy on the completeness
of the GTN-R record held in GRDC, including the number of stations and nations submitting data to
GRDC, National Communication to UNFCCC
Annual cost US$ 1–10 million (60% in non-Annex I Parties)
Action Assess national needs for river gauges in support of impact assessments and adaptation and consider
the adequacy of those networks
Benefit Prepare for improvement proposals
Time frame 2019
Who National Hydrological Services, in collaboration with WMO CHy and TOPC
Performance
indicator
National needs identified; options for implementation explored
Annual cost US$ 10–30 million (80% in non-Annex I Parties)
Action Complete the establishment of a full-scale GGMS as a web portal for all GTN-GW datasets; continue
existing observations and deliver readily available data and products to the information system
Benefit Global, consistent and verified datasets available to users
Time frame 2019
Who IGRAC, in cooperation with GTN-H and TOPC
Performance
indicator
Reports to UNESCO IHP and WMO CHy on the completeness of the GTN-GW record held in GGMS,
including the number of records in, and nations submitting data to, GGMS; web-based delivery of
products to the community
Annual cost US$ 1–10 million
Action Develop an operational groundwater product, based on satellite observations
Benefit Global, consistent and verified datasets available to users
Time frame 2019
Who Satellite agencies, CEOS, CGMS
Performance
indicator
Reports to UNESCO IHP and WMO CHy on the completeness of the GTN-GW record held in GGMS,
including the number of records in, and nations submitting data to, GGMS; web-based delivery of
products to the community.
Annual Cost US$ 1–10 million

GCOS 2016 Implementation Plan
- 257 -
Action T15: Satellite soil-moisture data records
Action T16: Multi-satellite, soil-moisture data services
Action T17: International soil-moisture network
Action T18: Regional high-resolution soil-moisture data record
Action Regularly update individual microwave sensor (SMOS, SMAP, ASCAT, AMSR-E …) soil-moisture data
records, including the subsidiary variables (freeze/thaw, surface inundation, vegetation optical depth,
root-zone soil moisture)
Benefit Time series of data to identify trends over time
Time frame Continuing
Who Space agencies (ESA, EUMETSAT, NASA, NOAA, JAXA …) and Earth observation service providers
Performance
indicator
Availability of free and open global soil-moisture data records for individual microwave missions
Annual cost US$ 10–30 million
Action Regularly update of merged multi-sensor, soil-moisture data records, including the subsidiary variables
(freeze/thaw, surface inundation, vegetation optical depth, root-zone soil moisture)
Benefit High-quality, soil moisture CDR for users
Time frame Continuing
Who Copernicus, NOAA, Earth observation data providers
Performance
indicator
Availability of free and open merged multi-sensor data records (merged passive, merged active and
merged active-passive data)
Annual cost US$ 1–10 million
Action Operate, provide user services and expand the International Soil Moisture Network (ISMN), which is
part of the GTN-H.
Benefit Coordinated in situ soil moisture data for users and calibration/validation
Time frame Continuing
Who Vienna Technical University, supported by national data providers, ESA, GEWEX, CEOS and GEO
Performance
indicator
Availability of harmonized and quality-controlled in situ soil-moisture data provided by network
operators to ISMN
Annual cost US$ 100 000–1 million (includes only central services of the ISMN data centre)
Action Develop high-resolution soil-moisture data records for climate change adaptation and mitigation by
exploiting microwave and thermal remote-sensing data
Benefit Availability of data suitable for adaptation
Time frame 2017–2020
Who NASA Soil Moisture Active-Passive Programme, ESA Climate Change Initiative, Copernicus Evolution
Activities in cooperation with identified universities and research organizations
Performance
indicator
Public releases of experimental multi-year (> 10 years) high-resolution, soil-moisture data records
Annual cost US$ 10–30 million

GCOS 2016 Implementation Plan
- 258 -
Action T19: Maintain and extend the in situ mass balance network
Action T20: Improve the funding situation for international glacier data centres
Action Improve the funding situation for international glacier data centres and services as well as for long-term
glacier-monitoring programmes. Integrated and international availability of funding for sustaining
programme, expecting also private sector contributions
Benefit Secure long-term monitoring and data availability
Time frame 2020
Who National and international funding agencies
Performance
indicator
Resources dedicated to glacier-database management at WGMS and NSIDC; number of reference
glaciers with more than 30 years of continued observations
Annual cost US$ 1–10 million
Action T22: Global glacier inventory
Action Maintain and extend the in situ mass balance network, especially within developing countries and High
Mountain Asia (Himalaya, Karakorum, Pamir) (e.g. using capacity-building and twinning programmes)
Benefit Maintain a critical climate record
Time frame Ongoing
Who Research community, national institutions and agencies
Performance
indicator
Number of observation series submitted to WGMS
Annual cost US$ 100 000–1 million
Action T21: Encourage and enforce research projects to make their ECV-relevant observations
available through the dedicated international data centres
Action Encourage and enforce research projects to make their ECV-relevant observations available through
the dedicated international data centres (e.g. through dedicated budget lines and the use of digital
object identifiers for datasets).
Benefit Open and long-term availability of data for users
Time frame Ongoing
Who National funding agencies
Performance
indicator
Number of datasets submitted to dedicated international data centres
Annual cost US$ 100 000–1 million
Action Finalize the completion of a global reference inventory for glaciers and increase its data quality
(e.g. outline, time stamp) and data richness (e.g. attribute fields, hypsometry)
Benefit Improved data quality on glaciers
Time frame 2020
Who NSIDC and WGMS with GLIMS research community and space agencies
Performance
indicator
Data coverage in GLIMS database
Annual cost US$ 100 000–1 million

GCOS 2016 Implementation Plan
- 259 -
Action T23: Multi-decadal glacier inventories
Action T24: Allocate additional resources to extend the geodetic dataset
Action T25: Extend the glacier-front variation dataset both in space and in time
Action T26: Glacier observing sites
Action Continue to produce and compile repeat inventories at multi-decadal timescale
Benefit Extend the time series of glacier information
Time frame Ongoing
Who NSIDC and WGMS with GLIMS research community and space agencies.
Performance
indicator
Data coverage in GLIMS database
Annual cost US$ 1–10 million
Action Allocate additional resources to extend the geodetic dataset at national, regional and global levels:
decadal elevation change can potentially be computed for thousands of glaciers from air- and
spaceborne sensors
Benefit Improved accuracy of glacier change
Time frame Ongoing
Who WGMS with research community and space agencies
Performance
indicator
Data coverage in WGMS database
Annual cost US$ 30–100 million
Action Extend the glacier-front variation dataset both in space and back in time, using remote-sensing, in situ
observations and reconstruction methods
Benefit Understanding long-term trends in glacier extent (mass trends need additional information)
Time frame Ongoing
Who WGMS with research community and space agencies
Performance
indicator
Data coverage in WGMS database
Annual Cost US$ 10 000–100 000
Action Maintain current glacier-observing sites and add additional sites and infrastructure in data-sparse
regions, including South America, Africa, the Himalayas, the Karakoram and Pamir mountain ranges,
and New Zealand; attribute quality levels to long-term mass-balance measurements; improve satellite-
based glacier inventories in key areas
Benefit Sustained global monitoring to understand global trends
Time frame Continuing, new sites by 2017
Who Parties’ national services and agencies coordinated by GTN-G partners, WGMS, GLIMS and NSIDC
Performance
indicator
Completeness of database held at NSIDC from WGMS and GLIMS
Annual cost US$ 10–30 million

GCOS 2016 Implementation Plan
- 260 -
Action T27: Observations of glacier velocities
Action T28: Snow-cover and snowfall observing sites
Action T29: Integrated analyses of snow
Action T30: Ice-sheet measurements
Action Encourage observations and reporting of glacier velocities
Benefit Improve understanding of glacier dynamics and mass loss
Time frame Starting 2017
Who GTN-G partners, WGMS, GLIMS and NSIDC
Performance
indicator
Completeness of database held at NSIDC from WGMS and GLIMS
Annual cost US$ 100 000–1 million
Action Strengthen and maintain existing snow-cover and snowfall observing sites, provide clear and
unambiguous instructions; ensure that sites exchange snow data internationally; establish global
monitoring of those data over the GTS; and recover historical data; ensure reporting includes reports of
zero cover.
Benefit Improved understanding of changes in global snow
Time frame Continuing; receipt of 90% of snow measurements at international data centres
Who NMHSs and research agencies, in cooperation with WMO-GCW and WCRP and with advice from TOPC,
AOPC and GTN-H
Performance
indicator
Data submission to national centres such as NSIDC and world data services
Annual cost US$ 1–10 million
Action Obtain integrated analyses of snow over both hemispheres
Benefit Improved understanding of changes in global snow
Time frame Continuous
Who Space and research agencies in cooperation with WMO-GCW and WCRP-CliC with advice from TOPC,
AOPC and IACS
Performance
indicator
Availability of snow-cover products for both hemispheres
Annual cost US$ 1–10 million
Action Ensure continuity of in situ ice-sheet measurements and field experiments for improved understanding
of processes and for the better assessment of mass-loss changes
Benefit Robust data on trends in ice-sheet changes
Time frame Ongoing
Who Parties, working with WCRP-CliC, IACS and SCAR
Performance
indicator
Integrated assessment of ice sheet change supported by verifying observations.
Annual cost US$ 10–30 million
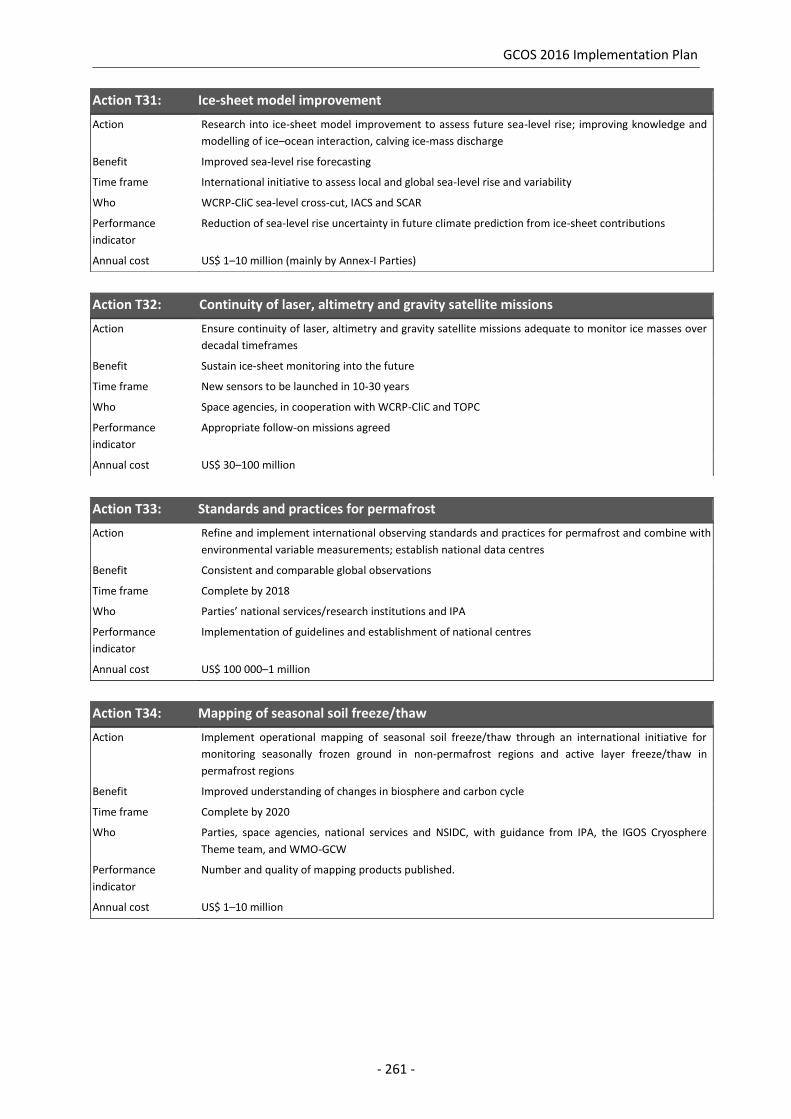
GCOS 2016 Implementation Plan
- 261 -
Action T31: Ice-sheet model improvement
Action T32: Continuity of laser, altimetry and gravity satellite missions
Action T33: Standards and practices for permafrost
Action T34: Mapping of seasonal soil freeze/thaw
Action Research into ice-sheet model improvement to assess future sea-level rise; improving knowledge and
modelling of ice–ocean interaction, calving ice-mass discharge
Benefit Improved sea-level rise forecasting
Time frame International initiative to assess local and global sea-level rise and variability
Who WCRP-CliC sea-level cross-cut, IACS and SCAR
Performance
indicator
Reduction of sea-level rise uncertainty in future climate prediction from ice-sheet contributions
Annual cost US$ 1–10 million (mainly by Annex-I Parties)
Action Ensure continuity of laser, altimetry and gravity satellite missions adequate to monitor ice masses over
decadal timeframes
Benefit Sustain ice-sheet monitoring into the future
Time frame New sensors to be launched in 10-30 years
Who Space agencies, in cooperation with WCRP-CliC and TOPC
Performance
indicator
Appropriate follow-on missions agreed
Annual cost US$ 30–100 million
Action Refine and implement international observing standards and practices for permafrost and combine with
environmental variable measurements; establish national data centres
Benefit Consistent and comparable global observations
Time frame Complete by 2018
Who Parties’ national services/research institutions and IPA
Performance
indicator
Implementation of guidelines and establishment of national centres
Annual cost US$ 100 000–1 million
Action Implement operational mapping of seasonal soil freeze/thaw through an international initiative for
monitoring seasonally frozen ground in non-permafrost regions and active layer freeze/thaw in
permafrost regions
Benefit Improved understanding of changes in biosphere and carbon cycle
Time frame Complete by 2020
Who Parties, space agencies, national services and NSIDC, with guidance from IPA, the IGOS Cryosphere
Theme team, and WMO-GCW
Performance
indicator
Number and quality of mapping products published.
Annual cost US$ 1–10 million

GCOS 2016 Implementation Plan
- 262 -
Action T35: Ensure the consistency of the various radiant energy fluxes
Action T36: Climate change indicators for adaptation
Action T37: Quality of ground-based reference sites for FAPAR and LAI
Action T38: Improve snow and ice albedo products
Action The the various radiant energy fluxes (e.g. surface albedo and FAPAR) derived from remote-sensing
observation, and their compatibility with the specific requirements of the models, especially in the
context of climate change studies;
fire and surface albedo, especially in the context of climate change studies
Benefit Improved data leading to improved model predictions and understanding of changes in biosphere
Time frame 2020
Who CEOS WG Cal/Val, TOPC observers, CEOS/CGMS WG Climate
Performance
indicator
Documented system to ensure consistency; reports demonstrating consistency
Annual cost U US$ 100 000–1 million
Action Establish climate change indicators for adaptation issues using land ECVs at high resolution
Benefit Inputs into adaptation planning, damage limitation and risk assessments
Time frame Initial products by 2018; ongoing development and improvement
Who GCOS, GCOS Science panels, WCRP, GFCS
Performance
indicator
Availability of indicators
Annual cost US$ 100 000–1 million
Action Improve the quality and number of ground-based reference sites for FAPAR and LAI; agree minimum
measurement standards and protocols; conduct systematic and comprehensive evaluation of
ground-based measurements for building a reference sites network
Benefit Ensure quality assurance of LAI and FAPAR products
Time frame Network operational by 2020
Who Parties’ national and regional research centres, in cooperation with space agencies and Copernicus
coordinated by CEOS WGCV, GCOS and TOPC
Performance
indicator
Data available
Annual cost US$ 1–10 million
Action Improve quality of snow (ice and sea ice) albedo products
Benefit Improve consistency of datasets
Time frame 2018
Who Space agencies and Copernicus coordinated through CEOS WGCV LPV, WMO Space Pprogramme, with
advice from GCOS and TOPC
Performance
indicator
Product available
Annual cost US$ 100 000–1 million
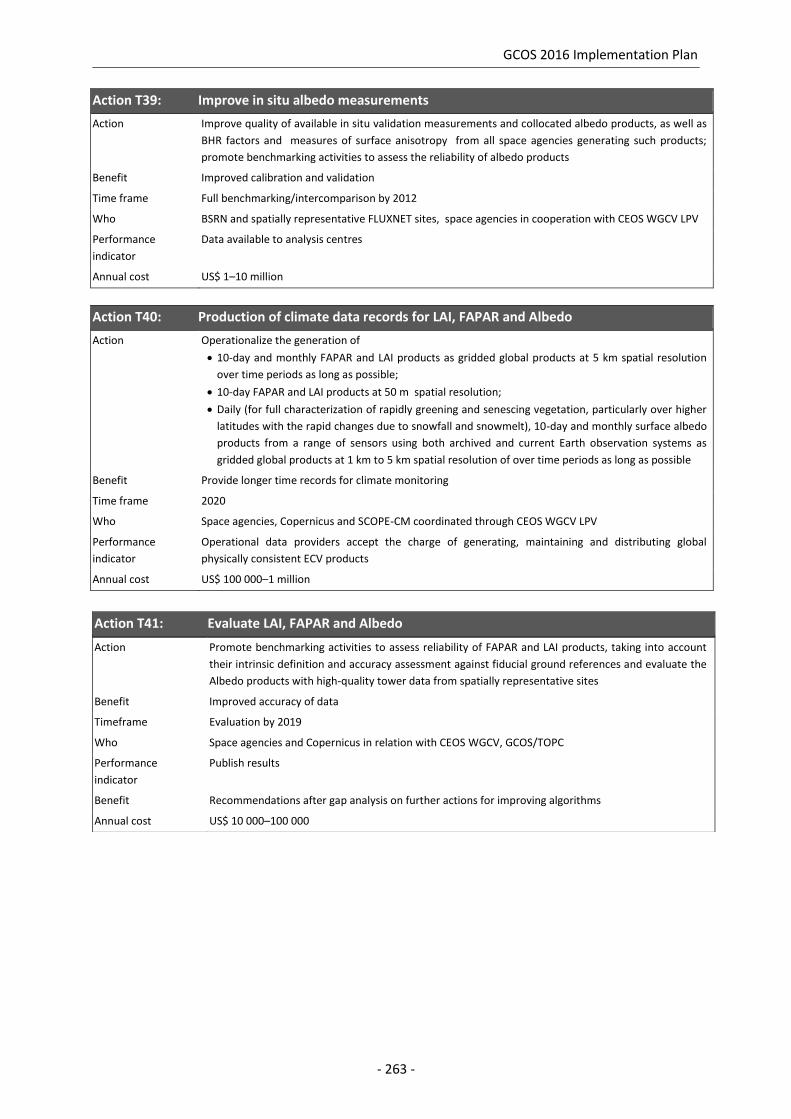
GCOS 2016 Implementation Plan
- 263 -
Action T39: Improve in situ albedo measurements
Action Improve quality of available in situ validation measurements and collocated albedo products, as well as
BHR factors and measures of surface anisotropy from all space agencies generating such products;
promote benchmarking activities to assess the reliability of albedo products
Benefit Improved calibration and validation
Time frame Full benchmarking/intercomparison by 2012
Who BSRN and spatially representative FLUXNET sites, space agencies in cooperation with CEOS WGCV LPV
Performance
indicator
Data available to analysis centres
Annual cost US$ 1–10 million
Action T40: Production of climate data records for LAI, FAPAR and Albedo
Action Operationalize the generation of
10-day and monthly FAPAR and LAI products as gridded global products at 5 km spatial resolution
over time periods as long as possible;
10-day FAPAR and LAI products at 50 m spatial resolution;
Daily (for full characterization of rapidly greening and senescing vegetation, particularly over higher
latitudes with the rapid changes due to snowfall and snowmelt), 10-day and monthly surface albedo
products from a range of sensors using both archived and current Earth observation systems as
gridded global products at 1 km to 5 km spatial resolution of over time periods as long as possible
Benefit Provide longer time records for climate monitoring
Time frame 2020
Who Space agencies, Copernicus and SCOPE-CM coordinated through CEOS WGCV LPV
Performance
indicator
Operational data providers accept the charge of generating, maintaining and distributing global
physically consistent ECV products
Annual cost US$ 100 000–1 million
Action T41: Evaluate LAI, FAPAR and Albedo
Action Promote benchmarking activities to assess reliability of FAPAR and LAI products, taking into account
their intrinsic definition and accuracy assessment against fiducial ground references and evaluate the
Albedo products with high-quality tower data from spatially representative sites
Benefit Improved accuracy of data
Timeframe Evaluation by 2019
Who Space agencies and Copernicus in relation with CEOS WGCV, GCOS/TOPC
Performance
indicator
Publish results
Benefit Recommendations after gap analysis on further actions for improving algorithms
Annual cost US$ 10 000–100 000

GCOS 2016 Implementation Plan
- 264 -
Action T42: Land-surface temperature: in situ protocols
Action T43: Production of land-surface temperature datasets
Action T44: Reprocessing land-surface temperature
Action T45: Land-surface temperature in situ network expansion
Action Promote standardized data protocols for in situ LST and support the CEOS-LPV group in development of
a consistent approach to data validation, taking its LST Validation Protocol as a baseline
Benefits LST datasets will be more accessible to users, encouraging user uptake of more than one LST dataset.
This will lead to better characterisation of uncertainties and inter-dataset variability.
Time frame Network concept and approach by 2017; implementation by 2018
Who Parties’ national services and research agencies, space data providers, GOFC-GOLD, NASA LCLUC, TOPC,
CEOS WGCV/LPV
Performance
indicator
Availability of protocols and evidence of their use.
Annual cost US$ 1 000–10 000
Action Continue the production of global LST datasets, ensuring consistency between products produced from
different sensors and by different groups
Benefits Make available long time series of LST datasets in consistent formats, enabling more widespread use of
LST for climate applications
Time frame Continual
Who Space agencies
Performance
indicator
Up-to-date production of global LST datasets
Annual cost US$ 10 000–100 000
Action Reprocess existing datasets of LST to generate a consistent long-term time series of global LST; in
particular, reprocess archives of low Earth orbit and geostationary LST observations in a consistent
manner and to community-agreed data formats
Benefits Make available long time series
Time frame Network concept and approach by 2017; implementation by 2018
Who Parties’ national services and research agencies, space data providers, GOFC-GOLD, NASA LCLUC, TOPC,
CEOS WGCV/LPV
Performance
indicator
Availability of long time series of LST datasets
Annual cost US$ 100 000–1 million
Action Expand the in situ network of permanent, high-quality IR radiometers for dedicated LST validation
Benefits LST datasets better validated and over more land-surface types; independent validation of stated
accuracies providing credibility to satellite LST products
Time frame Network concept and approach by 2017; implementation by 2018
Who Parties’ national services and research agencies, space data providers, GOFC-GOLD, NASA LCLUC, TOPC,
CEOS WGCV/LPV, ILSTE
Performance
indicator
Establishment of a comprehensive network of ground sites with high-quality in situ measurements
suitable for validating the different sensors; results from in situ radiometer intercomparison exercises
Annual cost US$ 1–10 million (10-20 sites at US$ 100 000 per site)

GCOS 2016 Implementation Plan
- 265 -
Action T46: Land-surface temperature radiometric calibration
Action T47: Land-cover experts
Action T48: Annual land-cover products
Action T49: Land-cover change
Action Radiometric calibration intercomparisons and uncertainties for LST sensors
Benefits LST datasets better calibrated and over all land-surface types for different satellite sensors;
independent calibration providing credibility and traceability of data and uncertainties
Time frame Network concept and approach by 2017; implementation by 2018
Who Coordinated by CEOS WGCV Infrared and Visible Optical Sensors subgroup/GSICS and supported by space
agencies
Performance
indicator
ECV generators taking into account radiometric calibration uncertainties, ideally with calibrations being
referenced to a common framework
Annual Cost US$ 1–10 million
Action Maintain and strengthen a global network of land-cover/land-use experts to: develop and update an
independent, very high spatial-resolution reference dataset for global land-cover map accuracy
assessment;and facilitate access to land-use and management information to support the development
of global-scale land-use products
Benefits For GLC map developers, GLC map users
Time frame Network concept and approach by 2017; implementation by 2018
Who GOFC-GOLD, CEOS WGCV/LPV, Parties’ national services and research agencies, space data providers,
NASA LCLUC, TOPC
Performance
indicator
Global LC map developers using the reference data developed by the operational network
Annual cost US$ 100 000–1 million
Action Generate annual land-cover products over key regions that allow change assessment across time
(including for the six IPCC AFOLU land categories) at 10 m–30 m spatial resolutions, according to
internationally agreed standards and accompanied by statistical descriptions of their accuracy
Benefits For mitigation and adaptation communities
Time frame 2017 and beyond
Who Space agencies, GOFC-GOLD, Copernicus Land Service, USGS, University of Maryland (UMD)-GoogleEarth
Performance
indicator
Product delivered and used by a large community; use of standard approaches for validation and
uncertainty metrics
Annual cost US$ 1–10 million
Action Generate global-scale land-cover products with an annual frequency and long-term records that allow
change assessment across time (including as much as possible for the six IPCC AFOLU land categories),
at resolutions between 250 m and 1 km, according to internationally agreed standards and
accompanied by statistical descriptions of their accuracy
Benefits To climate change modellers, others
Time frame 2017 and beyond
Who Space agencies, research institutes, GOFC-GOLD, Copernicus Land Service
Performance
indicator
Product delivered and used; use of standard approaches for validation and uncertainty metrics
Annual cost US$ 1–10 million
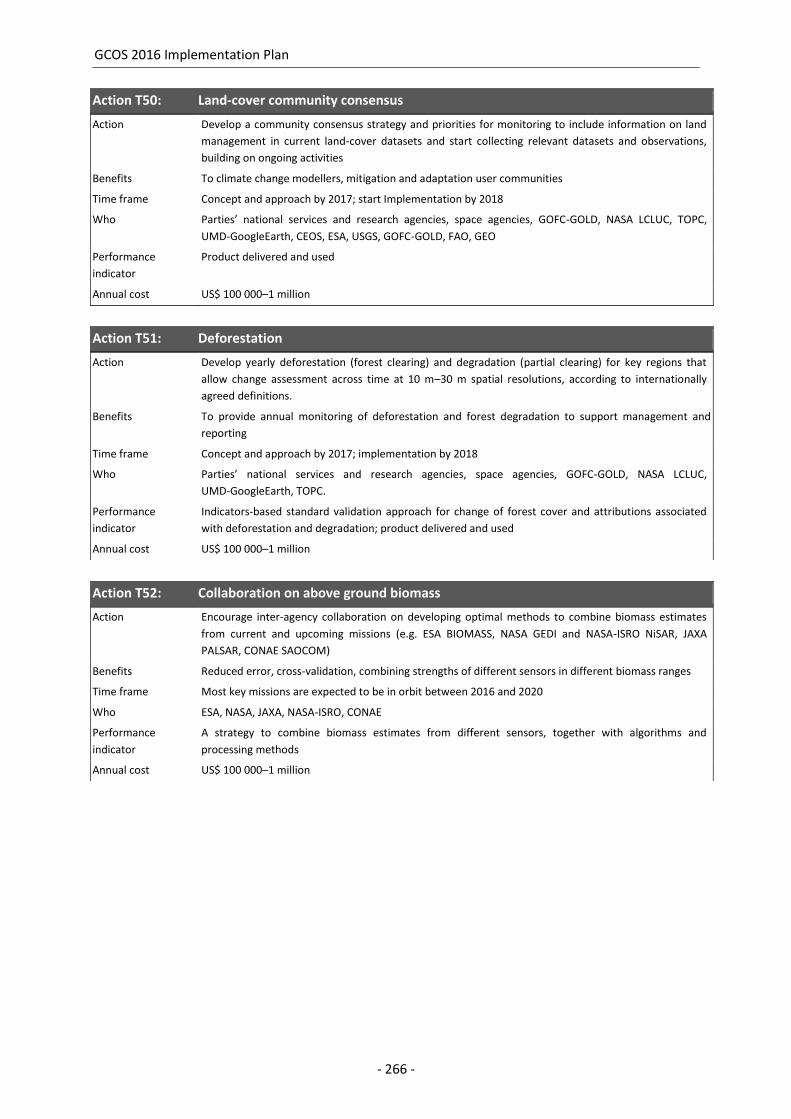
GCOS 2016 Implementation Plan
- 266 -
Action T50: Land-cover community consensus
Action T51: Deforestation
Action T52: Collaboration on above ground biomass
Action Develop a community consensus strategy and priorities for monitoring to include information on land
management in current land-cover datasets and start collecting relevant datasets and observations,
building on ongoing activities
Benefits To climate change modellers, mitigation and adaptation user communities
Time frame Concept and approach by 2017; start Implementation by 2018
Who Parties’ national services and research agencies, space agencies, GOFC-GOLD, NASA LCLUC, TOPC,
UMD-GoogleEarth, CEOS, ESA, USGS, GOFC-GOLD, FAO, GEO
Performance
indicator
Product delivered and used
Annual cost US$ 100 000–1 million
Action Develop yearly deforestation (forest clearing) and degradation (partial clearing) for key regions that
allow change assessment across time at 10 m–30 m spatial resolutions, according to internationally
agreed definitions.
Benefits To provide annual monitoring of deforestation and forest degradation to support management and
reporting
Time frame Concept and approach by 2017; implementation by 2018
Who Parties’ national services and research agencies, space agencies, GOFC-GOLD, NASA LCLUC,
UMD-GoogleEarth, TOPC.
Performance
indicator
Indicators-based standard validation approach for change of forest cover and attributions associated
with deforestation and degradation; product delivered and used
Annual cost US$ 100 000–1 million
Action Encourage inter-agency collaboration on developing optimal methods to combine biomass estimates
from current and upcoming missions (e.g. ESA BIOMASS, NASA GEDI and NASA-ISRO NiSAR, JAXA
PALSAR, CONAE SAOCOM)
Benefits Reduced error, cross-validation, combining strengths of different sensors in different biomass ranges
Time frame Most key missions are expected to be in orbit between 2016 and 2020
Who ESA, NASA, JAXA, NASA-ISRO, CONAE
Performance
indicator
A strategy to combine biomass estimates from different sensors, together with algorithms and
processing methods
Annual cost US$ 100 000–1 million

GCOS 2016 Implementation Plan
- 267 -
Action T53: Above-ground biomass validation strategies
Action T54: Above-ground biomass validation sites
Action T55: Above-ground biomass data access
Action T56: Above-ground biomass: forest inventories
Action Encourage inter-agency collaboration to develop validation strategies for upcoming missions aimed at
measuring biomass (e.g. ESA BIOMASS, NASA GEDI and NASA-ISRO NiSAR), to include combined use of
in situ and airborne lidar biomass measurements
Benefits Potential to produce more comprehensive validation of biomass estimates by cost-sharing. Greater
consistency between biomass estimates from different sensors because of assessment against common
reference data
Time frame From now until the operational phase of the various sensors (2016–2022).
Who ESA, NASA, JAXA, NASA-ISRO, CONAE
Performance
indicator
Formal agreement between agencies on a strategy for joint gathering and sharing of validation data,
together with funding of specific elements of the overall set of validation data
Annual cost US$ 10 000–100 000
Action Develop a set of validation sites covering the major forest types, especially in the tropics, at which high-
quality biomass estimations can be made, using standard protocols developed from ground
measurements or airborne lidar techniques
Benefits Essential to give confidence in satellite-derived biomass estimates at global scale
Time frame From now up to the operational phase of the various sensors (2018–2022)
Who Space agencies working with key in situ networks (e.g. RainFor, Afritron, the Smithsonian Center for
Tropical Forest Science), GEO-GFOI
Performance
indicator
Establishment of a comprehensive network of ground sites with high-quality, in situ biomass estimates
with uncertainty assessments suitable for validating the different sensors
Annual cost US$ 30–100 million (50 tropical sites covering all forest types: US$ 20 million); estimate for temperate
and boreal sites not yet formulated
Action Promote access to well-calibrated and validated regional- and national-scale biomass maps that are
increasingly being produced from airborne lidar.
Benefits Greatly extends the representativeness of data available for validating satellite-derived biomass data,
since a much greater range of land types and forest conditions will be covered
Time frame From now until the operational phase of the various sensors (2016–2022)
Who GEO-GFOI, other national and international bodies producing biomass maps
Performance
indicator
Availability of multiple regional- to country-scale maps of biomass derived from airborne lidar; use of
standard protocols for uncertainty assessment of lidar estimation of biomass
Annual cost US$ 10 000–100 000 (does not include monitoring costs)
Action Improve access to high-quality forest inventories, especially in the tropics, including those developed
for research purposes and REDD+
Benefits Extends the data available for validating satellite-derived biomass data
Time frame From now until the operational phase of the various sensors (2016–2022)
Who GEO-GFOI, other national and international bodies producing or funding forest inventories
Performance
indicator
Access to databases of georeferenced biomass measurements derived from ground measurements for
forest-inventory purposes
Annual cost US$ 10 000–100 000

GCOS 2016 Implementation Plan
- 268 -
Action T57: Soil carbon: carbon mapping
Action T58: Soil-carbon change
Action T59: Soil carbon – histosols
Action T60: Historic fire data
Action Cooperate with the soil-carbon mapping exercises to advocate accurate maps of soil carbon
Benefit Improved data accuracy
Time frame Ongoing
Who TOPC and GCOS
Performance
indicator
Improved maps
Annual cost US$1 000–10 000
Action Encourage flux sites to measure soil carbon at five-year intervals and record soil-management activities;
use this to supplement long-term experiments that are monitoring soil carbon.
Benefit Improved in situ observations will improve accuracy.
Time frame Ongoing
Who TOPC and GCOS
Performance
indicator
Number of flux sites making measurements
Annual cost US$10 000–100 000
Action Provide global maps of the extent of histosols (peatlands, wetlands and permafrost) and their depth
Benefit Improve understanding of carbon pools at risk from climate change
Time frame Ongoing
Who Research communities, ISRIC, HWSD and the Global Soil Map
Performance
indicator
Availability of maps
Annual cost US$ 10 000–100 000
Action Reanalyse the historical fire-disturbance satellite data (1982 to present)
Benefits Climate-modelling communities
Time frame By 2020
Who Space agencies, working with research groups coordinated by GOFC-GOLD-Fire By 2020
Performance
indicator
Establishment of a consistent dataset, including the globally available AVHRR data record
Annual cost US$ 1–10 million

GCOS 2016 Implementation Plan
- 269 -
Action T61: Operational global burned area and fire radiative power
Action T62: Fire maps
Action T63: Fire validation
Action Continue the production of operational, global burned area active fire (with associated FRP) products,
with metadata and uncertainty characterizations that meet threshold requirements and have necessary
product back-up to ensure operational delivery of products to users.
Benefits Climate-modelling communities, space agencies, civil protection services, fire managers, other users
Time frame Continuous
Who Space agencies, Copernicus Global Land Service, Copernicus Atmospheric Monitoring Service,
GOFC-GOLD
Performance
indicator
Availability of products that meet user needs
Annual cost US$ 1–10 million
Action Consistently map global burned area at < 100m resolution on a near-daily basis from combinations of
satellite products (Sentinel-2, Landsat, Sentinel-1, PROBA); work towards deriving consistent measures
of fire severity, fire type, fuel moisture and related plant-fuel parameters
Benefits Climate-modelling communities, space agencies, civil protection services, fire managers, other users
Time frame By 2020
Who Space agencies, research organizations, international organizations in collaboration with GOFC-GOLD-
Fire
Performance
indicator
Availability of data and products
Annual cost US$ 1–10 million
Action Continuation of validation activity around the detection of fire-disturbed areas from satellites to show
that threshold requirements are being met; work to reduce the errors of commission and omission;
provide better than existing uncertainty characterization of fire-disturbance products.
Benefits Climate-modelling communities.
Time frame Continuous
Who Space agencies and research organizations, supported by CEOS LPV
Performance
indicator
Publication of temporal accuracy
Annual cost US$ 1–10 million

GCOS 2016 Implementation Plan
- 270 -
Action T64: Fire disturbance model development
Action T65: Anthropogenic water use
Action T66: Pilot projects: anthropogenic water use
Action T67: Improve global estimates of anthropogenic greenhouse-gas emissions
Action Continuation of joint projects between research groups involved in the development of atmospheric
transport models, dynamic vegetation models and GHG emission models, tthe climate-modelling and
transport-modelling community and those involved in the continual algorithm development, validation
and uncertainty characterization of fire-disturbance products from satellite data (the Earth observation
and modelling community); contribute to better understanding of fire risk and fire-risk modelling
Benefits Climate-modelling communities, Copernicus Programme
Time frame Continuous
Who Space agencies (NASA, ESA, etc.), inter-agency bodies (GOFC-GOLD, CEOS, ECMWF, Meteosat, etc.),
Copernicus Global Land Service, Copernicus Atmospheric Monitoring Service, GOFC-GOLD
Performance
indicator
Projects that engage climate and atmospheric transport modellers and product-development
community
Annual cost US$ 1–10 million
Action Collect, archive and disseminate information related to anthropogenic water use
Benefit Accurate and up-to-date data on water availability and stress
Time frame Continuous
Who UN-Water, IWMI and FAO through AQUASTAT in collaboration with UN Statistics Division and other
data sources
Performance
indicator
Information contained in the AQUASTAT database.
Annual cost US$ 100 000–1 million
Action Develop and implement pilot data-collection exercises for water use
Benefit Demonstrate data-collection approaches for wide implementation
Time frame 2016–2019
Who GTN-H, UN-Water, IWMI and FAO through AQUASTAT in collaboration with the Convention on the
Protection and Use of Transboundary Watercourses and International Lakes
Performance
indicator
Completed data collection in pilot areas
Annual cost US$ 100 000–1 million
Action Continue to produce annual global estimates of emissions from fossil fuel, industry, agriculture and
waste; improve these estimates by following IPCC methods using Tier 2 for significant sectors; this will
require a global knowledge of fuel carbon contents and a consideration of the accuracy of the statistics
used
Benefit Improved tracking of global anthropogenic emissions
Time frame Ongoing, with annual updates
Who IEA, FAO, Global Carbon Project (GCP), Carbon Dioxide Information Analysis Centre (CDIAC), Emissions
Database for Global Atmospheric Research (EDGAR)
Performance
indicator
Availability of Improved estimates.
Annual cost US$ 10 000–100 000

GCOS 2016 Implementation Plan
- 271 -
Action T68: Use of satellites for Land use, land-use change and forestry emissions/removals
Action T70: Use of Inverse modelling techniques to support emission inventories
Action T71: Prepare for a carbon-monitoring system
Action Support the improvement of estimates of emissions and removals from Forestry and Land-use change
by using satellite data to monitor changes where ground-based data are insufficient.
Benefit Improved global and national monitoring of LULUCF
Time frame Ongoing.
Who National reporting supported by international agencies through programmes such as UNREDD and GFOI
Performance
indicator
Availability of satellite data
Annual cost US$ 100 000–1 million
Action T69: Research on the land sink
Action Research to better understand the land sink, its processes and magnitudes
Benefit Better understanding of the global carbon cycle
Time frame Ongoing
Who GCP, research groups
Performance
indicator
Published results
Annual cost US$ 100 000–1 million
Action Develop inverse modelling methods to support and add credibility to emission inventories; develop and
disseminate examples for several GHGs
Benefit Added credibility of national emission/removal estimates and demonstration of inventory
completeness
Time frame Ongoing
Who National Inventory agencies, researchers
Performance
indicator
Published results
Annual cost US$ 1–10 million
Action Preparatory work to develop a carbon monitoring system to be operational by 2035;
Development development of comprehensive monitoring systems of measurements of atmospheric
concentrations and of emission fluxes from anthropogenic area and point sources to include space-
based monitoring, in situ flask and flux tower measurements and the necessary transport and
assimilation models
Benefit Improved estimates of national emissions and removals
Time frame Initial demonstration results by 2023 – complete systems unlikely before 2030
Who Space agencies
Performance
indicator
Published results
Annual cost US$ 10–100 billion

GCOS 2016 Implementation Plan
- 272 -
Action T72: Prepare for a latent and sensible heat flux ECV
Action Review the feasibility of global monitoring of latent and sensible heat fluxes form the land surface;
prepare proposals for such an ECV.
Development of comprehensive monitoring systems of measurements of atmospheric concentrations
and emission fluxes from anthropogenic point sources, to include space-based monitoring, in situ flask
and flux tower measurements and the necessary transport and assimilation models
Benefit Improve understanding of heat fluxes over land
Time frame 2017
Who TOPC
Performance
indicator
Proposals for consideration by GCOS Steering Committee
Annual cost US$10 000–100 000

Annexes


GCOS 2016 Implementation Plan
- 275 -
ANNEX A: ECV product requirement tables
This Annex presents requirements for the ECV products for all ECVs in this Implementation Plan. As
these requirements are for products, they are independent of the observational method, whether
mainly satellite or in situ. GCOS recognizes that these requirements have not been always well
described, especially for in situ-based observations and observations needed for adaptation, and
there are actions in this Implementation Plan to refine the list before the end of 2017 and then to
maintain it as needs and observational capacities change.
These requirements follow on from, and update, previous product requirements provided for
satellite-based ECV products in the GCOS satellite supplements to the Implementation Plans for 2004
and 2010. 89 The requirements contained in these supplements have been of considerable
importance for satellite data providers. They have proved extremely effective in accelerating
implementation initiatives by these communities both through concerted efforts, globally, for
coordination (i.e. the CEOS-CGMS Working Group on Climate,90 as well as in the definition and
implementation of dedicated programmes at the level of individual space agencies (e.g. ESA’s CCI
programme91).
Whilst the value of these supplements is clear, the delay introduced by their preparation and the
corresponding response from space agencies, resulted in some inefficiencies: space agencies were
only able to provide a combined response to the Implementation Plan and Satellite Supplement
shortly before the GCOS review, the Status Report, was written, leaving little time for
implementation.
This Implementation Plan therefore includes the core component of the previous supplements (i.e.
the ECV product requirements themselves) and extends them to cover all ECVs. This will allow a
better review of whether or not the observing systems are achieving their goals and will align the
reviews with the overall GCOS review cycle and reporting to the UNFCCC. Merging the ECV product
requirements with the Implementation Plan itself has additional advantages such as a more direct
and traceable link between the Implementation Plan actions and the product requirements
(i.e. where an action is proposed to improve the accuracy of a product).
By no means is this intended to undermine the importance of data providers (e.g. WMO, GOOS and
the space agencies) in supporting the implementation of GCOS. On the contrary, it should be seen as
for a key step towards improved and consistent reporting to SBSTA.
This addition of requirements for in situ-based ECV products is more complicated, due to the greater
fragmentation of the communities with the relevant knowledge. In this Annex, an attempt is made to
provide a first coherent and exhaustive representation of ECV product requirements but further
89 GCOS, 2011: Systematic Observation Requirements for Satellite-based Products for Climate: Supplemental details to the
satellite-based component of the ”Implementation Plan for the Global Observing System for Climate in Support of the
UNFCCC (2010 Update)”. GCOS-154, WMO, Geneva, December 2011.
GCOS, 2006: Systematic Observation Requirements for Satellite-based Products for Climate: Supplemental details to the
satellite-based component of the “Implementation Plan for the Global Observing System for Climate in Support of the
UNFCCC”. GCOS-107, WMO, Geneva, September 2006. 90
http://ceos.org/ourwork/workinggroups/climate/ 91
http://cci.esa.int

GCOS 2016 Implementation Plan
- 276 -
consultations with the user communities are needed to ensure that these values better represent
their needs and not just observational system capabilities. Action G10 is included in the
Implementation Plan to further consolidate and refine these requirements over the course of the
next Implementation Plan cycle.
The ECV products requirements in this Annex should be considered target requirements, i.e.
requirements that data providers should aim to achieve over the next 10 years. Annex B provides an
explanation of some of the terms used in this annex.
NOTES:
(a) The required measurement uncertainties are presented as 95% confidence intervals
(approximately two standard deviations);92
(b) Stability is quoted per decade, unless otherwise indicated;
(c) Resolution is horizontal resolution where one value is quoted.
92 WMO, 2012: Guide to Meteorological Instruments and Methods of Observation. WMO-No. 8, 2008 edition updated in
2010 (Section 1.6.4.3), WMO, Geneva

GCOS 2016 Implementation Plan
- 277 -
Table 23. Atmospheric ECV product requirements.
93 Responsible for analysing ECV products according to actions G11, G12 and G13.
Key to abbreviations is given at the end of this annex. The GCOS Science panels will review and update this allocation as necessary.
Atmospheric ECV product requirementsECV Product Frequency Resolution Required
measurement
uncertainty
Stability (per
decade)
Standards/
references
Entity (see Part II, section 2.2)93
Satellite In situ
Surface wind
speed and direction
Surface wind speed
and direction
3 h 10 km/NA 0.5 m/s and mean
quadratic statistics to
10% of the locally
prevailing mean wind
speed, for
speed >20 m/s
0.05 m/s/decade For stability:
International Vector
Winds Science Team
Meeting (M.
Bourassa)
WGClimate WIGOS
Precipitation Estimates of liquid
and solid
precipitation
Monthly (resolving
diurnal cycles and
with statistics of
three-hour values)
25 km/NA 0.5 mm/h 0.02 mm/decade CMSAF requirements
related to the HOAPS
release 4.0 (CM-
12611)
WGClimate WIGOS
Temperature
(surface)
Hourly Site 0.1 K 0.02 K/decade P. Jones WIGOS
Daily Tx/Tn 0.1 K WIGOS
Pressure (surface) Hourly Site 0.1 hPa 0.02 hPa/decade P. Jones WIGOS
Water vapour
(surface)
Hourly Site RH 1%
DP 0.1 K
0.5%/decade
0.02 K/decade
Kate Willet WIGOS
Temperature
(upper-air)
Tropospheric
temperature profile
4 h 25 km/1 km 0.5 K 0.05 K WGClimate WIGOS
Stratospheric
temperature profile
4 h 100 km/2 km 0.5 K 0.05 K WGClimate WIGOS
Temperature of
deep atmospheric
layers
Monthly averages 100 km/5 km 0.2 K 0.02 K WGClimate WIGOS
Wind speed and
direction (upper-air)
Upper-air wind
retrievals
1 h 10 km/0.5 km 2m/s, 20° 0.5m/s, 5° WGClimate WIGOS

GCOS 2016 Implementation Plan
- 278 -
94 Responsible for analysing ECV products according to actions G11, G12 and G13.
Key to abbreviations is given at the end of this annex. The GCOS Science panels will review and update this allocation as necessary.
Atmospheric ECV product requirementsECV Product Frequency Resolution Required
measurement
uncertainty
Stability (per
decade)
Standards/
references
Entity (see Part II, section 2.2)94
Satellite In situ
Earth
radiation
budget
Top-of-atmosphere
ERB long-wave
Monthly (resolving diurnal
cycle)
100 km/NA Requirements on global
mean: 1 W/m2
0.2 W/m2/decade NOAA Tech. Rep.
NESDIS 134
WGClimate
Top-of-atmosphere
ERB short-wave
(reflected)
Monthly (resolving diurnal
cycle)
100 km/NA Requirements on global
mean: 1.0 W/m2
0.3W/m2/decade NOAA Tech. Rep.
NESDIS 134
WGClimate
Total solar
irradiance
Daily NA/NA 0.035% 0.01%/decade WGClimate
Solar spectral
irradiance
Daily Spectral resolution:
1 nm < 290 nm
2 nm (290–1 000
nm)
5 nm (1 000–
1 600 nm)
10 nm (1 600–
3 200 nm)
20 nm (3 200-
6 400 nm)
40 nm (6 400-
10 020)
20 000 nm (spacing
up to 160 000 nm)
0.3% (200–2400 nm) 1%(200–2 400 nm/
decade
WGClimate WIGOS

GCOS 2016 Implementation Plan
- 279 -
95 Responsible for analysing ECV products according to actions G11, G12 and G13.
Key to abbreviations is given at the end of this annex. The GCOS Science panels will review and update this allocation as necessary. 96
http://www.eumetsat.int/website/home/Satellites/FutureSatellites/MeteosatThirdGeneration/index.html?lang=EN
Atmospheric ECV product requirementsECV Product Frequency Resolution Required
measurement
uncertainty
Stability (per
decade)
Standards/
references
Entity (see Part II, section 2.2)95
Satellite In situ
Surface
radiation
budget
Surface ERB long-wave Monthly (resolving
diurnal cycle)
100 km/NA Requirements on
global mean: 1 W/m2
0.2W/m2/decade WGClimate WIGOS
Surface ERB short-wave Monthly(resolving
diurnal cycle)
100km/NA Requirements on
global mean: 1 W/m2
0.2 W/m2/decade WGClimate WIGOS
Water vapour Total column water
vapour
4 h 25 km/NA 2% 0.3% WClimate
Tropospheric and
lower-stratospheric
profiles of water vapour
4 h (troposphere),
daily (stratosphere)
25 km/2 km
100–200 km/2 km
5% 0.3% WGClimate
Upper tropospheric
humidity
Hourly 25 km/NA 5% 0.3% WGClimate
Cloud
properties
Cloud amount 3 h 50 km/NA 0.01–0.05 0.01/decade ESA CCI CMUG tables
(http://www.esa-
cmug-cci.org/)
WGClimate
Cloud-top pressure 3 h 50 km/NA 15–50h Pa 3–15 hPa WGClimate
Cloud-top temperature 3 h 50 km/NA 1–5 K 0.25 K/decade WGClimate
Cloud optical depth 3 h 50 km/NA 10% 2% WGClimate
Cloud water path
(liquid and ice)
3 h 50 km/NA 25% 5%
Cloud effective particle
radius (liquid + ice)
3 h 50 km/NA 1 µm; 1 µm/decade
Lightning Daily 10 km MTG EURD96
WGClimate WIGOS

GCOS 2016 Implementation Plan
- 280 -
97 Responsible for analysing ECV products according to actions G11, G12 and G13.
Key to abbreviations is given at the end of this annex. The GCOS Science panels will review and update this allocation as necessary. 98
These requirements for global products have been derived by AOPC to support understanding of fluxes of greenhouse gases. GAW is developing requirements of the ground-based segment that
would support this (Task Team on Observational Requirements and Satellite Measurements as regards Atmospheric Composition and Related Physical Parameters,
http://www.wmo.int/pages/prog/arep/gaw/TaskTeamObsReq.html). GCOS will coordinate with GAW to ensure compatibility of all observational requirements.
Atmospheric ECV product requirementsECV Product Frequency Resolution Required
measurement
uncertainty
Stability (per
decade)
Standards/
references
Entity (see Part II, section 2.2)97
Satellite In situ
Carbon
dioxide,
Methane and
other
greenhouse98
gases
Tropospheric CO2
column
4 h 5–10 km/NA 1 ppm 1.5 ppm/decade ESA CCI CMUG tables
(http://www.esa-
cmug-cci.org/)
WGClimate
Tropospheric CO2 4 h 5–10 km/5 km 1 ppm 1.5 ppm GAW
Tropospheric CH4
column
4 h 5–10 km/NA 10 ppb 7 ppb WGClimate
Tropospheric CH4 4 h 5–10 km/5 km 0.5 ppb 0.7 ppb GAW
Stratospheric CH4 Daily 100–200 km/2 km 5% 0.3% GAW
Ozone 98
Total column ozone 4 h 20–50 km/NA Max (2%; 5 DU) 1% WGClimate
Troposphere ozone 4 h 20–50 km/5 km 10-15% 2% WGClimate GAW
Ozone profile in upper
and lower stratosphere
4 h 100–200 km/1–2 km 10% 2% WGClimate
Ozone profile in upper
strato- and mesosphere
Daily 100–200 km/3 km 5–20% 2% WGClimate
Precursors
(supporting
the aerosol
and ozone
ECVs)98
NO2 tropospheric
column
4 h 5–10 km/NA Max (20%, 0.03 DU) 2% WGClimate
SO2,HCHO tropospheric
columns
4 h 5–10 km/NA Max (30%, 0.04 DU) 5% WGClimate
CO tropospheric
column
4 h 5–10 km/NA Max (20%, 20 DU) 2% WGClimate
CO tropospheric profile 4 h 10 km/5 km 20% 2% WGClimate

GCOS 2016 Implementation Plan
- 281 -
99 Responsible for analysing ECV products according to actions G11, G12 and G13.
Key to abbreviations is given at the end of this annex. The GCOS Science panels will review and update this allocation as necessary.
Atmospheric ECV product requirementsECV Product Frequency Resolution Required
measurement
uncertainty
Stability (per
decade)
Standards/
references
Entity (see Part II, section 2.2)99
Satellite In situ
Aerosol
properties
Aerosol optical depth 4 h 5–10 km/NA Max (0.03; 10%) 0.02/decade ESA CCI CMUG tables
(http://www.esa-
cmug-cci.org/)
WGClimate
Single-scattering albedo 4 h 5–10 km/NA 0.03 0.01 WGClimate
Aerosol-layer height 4 h 5–10 km/NA 1 km 0.5 km WGClimate
Aerosol-extinction
coefficient profile
Weekly 200–500 km/1 km
(near tropopause)
2 km (mid-
stratosphere)
10%, 20% WGClimate

GCOS 2016 Implementation Plan
- 282 -
Table 24. Ocean ECV product requirements
100 Responsible for analysing ECV products according to actions G11, G12 and G13
Key to abbreviations is given at the end of this annex. The GCOS Science panels will review and update this allocation as needed.
Ocean ECV product requirements ECV Products Frequency Resolution Required measurement
uncertainty
Stability (per
decade unless
otherwise
specified)
Standards/
References
Entity (see Part II, section
2.2)100
Satellite In situ
Sea-surface
temperature
Sea-surface temperature Hourly to weekly 1–100 km 0.1 K over 100-km scales < 0.03 K over
100-km scales
See EOV
Specification sheets
www.goosocean.or
g/eov
WGClimate JCOMM
Subsurface
temperature
Interior temperature Hourly to monthly 1–10 km 0.01 K Not specified JCOMM
Sea-surface
sSalinity
Sea-surface salinity Hourly to monthly 1–100 km 0.01 psu 0.001 psu WGClimate JCOMM
Subsurface
salinity
Interior salinity Hourly to
monthly
1–10 km 0.01 psu Not specified JCOMM
Surface
currents
Surface geostrophic current Hourly to weekly 30 km 5 cm/s Not specified WGClimate JCOMM
Subsurface
curents
Interior currents Hourly to weekly 1–10 km 0.02 m/s Not specified JCOMM
Sea level Global mean sea level Weekly to
monthly
10–100 km 2–4 mm (global mean); 1 cm
over a grid mesh
< 0.3 mm/yr
(global mean)
WGClimate JCOMM
Regional sea level Hourly to weekly 10 km 1 cm (over grid mesh of 50–
100 km)
< 1 mm/yr (for
grid mesh of
50–100 km)
WGClimate JCOMM
Sea state Wave height 3-hourly 25 km 10 cm 5 cm WGClimate JCOMM
Surface stress Surface stress Hourly-monthly 10–100 km 0.001–4 Nm2
Not specified JCOMM

GCOS 2016 Implementation Plan
- 283 -
101 Responsible for analysing ECV products according to actions G11, G12 and G13
Key to abbreviations is given at the end of this annex. The GCOS Science panels will review and update this allocation as needed.
Ocean ECV product requirements ECV Products Frequency Resolution Required measurement
uncertainty
Stability (per
decade unless
otherwise
specified)
Standards/
References
Entity (see Part II, section
2.2)101
Satellite In situ
Ocean-
surface heat
flux
Latent heat flux Hourly to monthly 1–25 km 10–15 Wm2 1–2 Wm
2 See EOV Specification
sheets
www.goosocean.org/
eov
JCOMM
Sensible heat flux Hourly to monthly 1–25 km 10–15 Wm2 1–2 Wm
2 JCOMM
Radiative heat flux Hourly to monthly 1–25 km 10–15 Wm2 1–2 Wm
2 JCOMM
Sea ice Sea-Ice concentration Weekly 1–15 km 5% ice area fraction 5% WGClimate
Sea-ice extent/edge Weekly 1–5 km 5 km Unspecified WGClimate
Sea-ice thickness Monthly 25 km 0.1 m Unspecified WGClimate
Sea-ice drift Weekly 5 km 1 km/day Unspecified WGClimate
Oxygen Interior ocean oxygen
concentration
Weekly to
decadal
3-20° degrees 0.5 µmol–2 µmol GOOS
Nutrients Interior ocean
concentrations of silicate,
phosphate, nitrate
Decadal Every 20° PO4: ±0.05 (μmol)
NO3: ±0.03 (μmol)
Si: ±0.1 (μmol)
GOOS
Inorganic
carbon
Interior ocean carbon
storage. At least 2 of: DIC, TA
or pH
Decadal Every 20° TA/DIC ± 2 μmol
pH ± 0.005
GOOS
pCO2 (to provide air–sea flux
of CO2)
Weekly to
decadal
Every 10°
(denser in the
coastal domain,
surface)
±2 μatm GOOS

GCOS 2016 Implementation Plan
- 284 -
102 Responsible for analysing ECV products according to actions G11, G12 and G13
Key to abbreviations is given at the end of this annex. The GCOS Science panels will review and update this allocation as needed.
Ocean ECV product requirements ECV Products Frequency Resolution Required measurement
uncertainty
Stability (per
decade unless
otherwise
specified)
Standards/
References
Entity (see Part II, section
2.2)102
Satellite In situ
Transient
tracers
Interior ocean CFC-12, CFC-
11, SF6, tritium, 3He,
14C,
39Ar
Annual to
decadal
Every 20° CFCs and SF6 ±1% Tritium
±0.5%, 0.005 TU
δ3He ± 0.15%
14C ±0.4 %
See EOV Specification
sheets
www.goosocean.org/
eov
GOOS
Nitrous oxide Interior ocean N2O Annual to
decadal
Every 20° Discrete samples: ~± 5%;
cont. sampling: <± 1%
GOOS
N2O air–sea flux
Ocean colour Water-leaving radiance Daily 4 km 5% (blue and green
wavelengths)
0.5% WGClimate
Chlorophyll-a concentration Weekly averages 4 km 30% 3% WGClimate
Plankton Phytoplankton
Requirements under assessment by GOOS Biology Panel
GOOS
Zooplankton GOOS
Marine
habitat
Properties
Coral reefs,
mangrove forests, seagrass
beds, Macroalgal
Communities
TBD GOOS

GCOS 2016 Implementation Plan
- 285 -
Table 25. Terrestrial ECV product requirements
103 Responsible for analysing ECV products according to actions G11, G12 and G13
Key to abbreviations is given at the end of this annex. The GCOS Science panels will review and update this allocation as needed.
Terrestrial ECV product requirements
ECV Products Frequency Resolution Required measurement
uncertainty
Stability (per
decade unless
otherwise
specified)
Standards/ References
Entity (see Part II, section
2.2)103
Satellite In Situ
River discharge
River discharge Daily Per river 10 % (relative)
ISO/TC 113: WMO
(2010) WMO (2008(a))
WMO (2009)
WHYCOS
Water Level Daily 100 m 10 cm 1 cm/yr WHYCOS
Flow velocity Few times per year
for station calibration Per river 10 % (relative) WHYCOS
Cross-section Few times per year
for station calibration Per river 10 % (relative) WHYCOS
Groundwater
Groundwater volume change Monthly 100 km 10 cm TBD ISO/TC 147
ISO 5667-18:2001 part
18
WHYCOS
Groundwater level Weekly Per well 1 cm WHYCOS
Groundwater recharge Weekly Per well 10 % (relative) WHYCOS
Groundwater discharge Weekly Per well 10 % (relative) WHYCOS
Wellhead level Weekly Per well 1 cm WHYCOS
Water quality Weekly Per well TBD TBD
Lakes
Lake water level Daily 100 m 3 cm for large lakes,
10 cm for the remainder 1 cm/decade
WMO (2006, 2008(a)
WGClimate HYDROLARE
Water extent Daily 20 m 10 % (relative)
5% (for 70 largest lakes) 5%/decade WGClimate HYDROLARE
Lake surface-water
temperature Weekly 300 m 1 K 0.1 K/decade WGClimate HYDROLARE
Lake-ice thickness Monthly 100m 1–2 cm WGClimate HYDROLARE
Lake-ice cover Daily 300 m 10 % 1 % /decade WGClimate HYDROLARE
Lake colour (Lake water-
leaving reflectance) Weekly 300 m 30 % 1 %/decade WGClimate

GCOS 2016 Implementation Plan
- 286 -
Terrestrial ECV product requirements ECV Products Frequency Resolution Required measurement
uncertainty
Stability (per
decade unless
otherwise
specified)
Standards/
References
Entity (see Part II, section 2.2)
Satellite In Situ
Soil moisture
Surface soil moisture Daily 1–25 km 0.04 m3/m
3 0.01 m
3/m
3/year WMO (2008(b)) WGClimate ISMN
Freeze/thaw Daily 1–25 km 90 % TBD WGClimate ISMN
Surface inundation Daily 1–25 km 90 % TBD ISMN
Root-zone soil moisture Daily 1–25 km 0.04 m3/m
3 0.01 m
3/m
3/year ISMN
Snow
Area covered by snow Daily 1 km (100 m in complex terrain)
5% (maximum error of omission and commission in snow area); location accuracy better than 1/3 IFOV with target IFOV 100 m in areas of complex terrain, 1 km elsewhere
4% (maximum error of omission and commission in snow area); location accuracy better than 1/3 IFOV with target IFOV 100 m in areas of complex terrain, 1 km elsewhere
WMO (2008(c)), IGOS (2007), IACS/UNESCO(2009)
WIGOS, GCW
Snow depth Daily 1 km (100 m in complex terrain)
10 mm 10 mm WIGOS, GCW
Snow-water equivalent Daily 1 km 10mm 10 mm WIGOS, GCW
Glaciers
Glacier area Annual (at end of ablation season)
Horizontal 15–30 m
5%
IGOS (2009), Paul et al. (2009), Zemp et al. (2013)
WGClimate GCW
Glacier elevation change Decadal Horizontal 30 m–100 m x vertical 1 m
2 m/decade 1 m/decade WGClimate GCW
Glacier mass change Seasonal to annual (the latter at end of ablation period)
Vertical: 0.01 m or 10 kg/m
2 (at
point location)
Better than 200 kg/m2/year
(glacier-wide) WGClimate GCW
Ice sheets and ice shelves
Surface elevation cChange 30 days Horizontal 100 m
0.1m/year 0.1m/year WGClimate GCW
Ice velocity 30 days Horizontal 100 m
0.1m/year 0.1m/year WGClimate GCW
Ice mass change 30 days Horizontal 50 km
10 km3/year
10 km3/year
WGClimate GCW
Grounding line location and thickness
Yearly Horizontal 100 m Vertical 10 m
1 m 10 m WGClimate GCW

GCOS 2016 Implementation Plan
- 287 -
Terrestrial ECV product requirements ECV Products Frequency Resolution Required measurement
uncertainty
Stability (per
decade unless
otherwise
specified)
Standards/
References
Entity (see Part II, section
2.2)
Satellite In Situ
Permafrost
Thermal state of permafrost
Daily to weekly
Sufficient sites to
characterize each
bio-climate zone
0.1 K GCW
Active layer thickness 2 cm GCW
Fraction of FAPAR Maps of FAPAR for modelling Daily 200/500 m Max (10%; 0.05) Max (3%; 0.02) WGClimate
Maps of FAPAR for adaptation 50m Max (10%; 0.05) Max (3%; 0.02) WGClimate
Leaf area index Maps of LAI for modelling Daily 250 m Max (15%) Max (10%; 0.25) WGClimate
Maps of LAI for adaptation 50 m WGClimate
Albedo
Maps of DHR albedo for
adaptation Daily 50 m Max (5%; 0.0025) Max (1%; 0.001) WGClimate BSRN
Maps of BHR albedo for
adaptation 50 m Max (5%; 0.0025) Max (1%; 0.001) WGClimate BSRN
Maps of DHR albedo for
modelling Daily 200/500 m Max (5%; 0.0025) Max (1%; 0.001) WGClimate
Maps of BHR albedo for
modelling 200/500 m Max (5%; 0.0025) Max (1%; 0.001) WGClimate
Land-surface
temperature
Maps of land-surface
temperature 3 hour 1 km 1 K <0.1 K/decade WGClimate
Above-ground
biomass Maps of AGB Annual
500 m-1 km
(based on
satellite
observations of
100–200 m)
< 20% error for biomass
values > 50 t/ha, and 10 t/ha
for biomass values ≤ 50 t/ha
10%
No agreed
standards but
see: GOFC-
GOLD (2015b)
GFOI (2013)
WGClimate

GCOS 2016 Implementation Plan
- 288 -
Terrestrial ECV product requirements ECV Products Frequency Resolution Required measurement
uncertainty
Stability (per
decade unless
otherwise specified)
Standards/
References
Entity (see Part II, section
2.2)
Satellite In Situ
Land cover
Maps of land cover Annual 250 m
15% (maximum error of
omission and commission in
mapping individual classes),
location accuracy better
than 1/3 IFOV with target
IFOV 250 m
15% (maximum error
of omission and
commission in
mapping individual
classes), location
accuracy better than
1/3 IFOV with target
IFOV 250 m
No agreed
standards but
see GLCN
(2014) and
GOFC-GOLD
(2015(a))
WGClimate GOFC-GOLD
Maps of high-resolution land
cover 5 year 10–30 m
5% (maximum error of
omission and commission in
mapping individual classes),
location accuracy better
than 1/3 IFOV with target
IFOV 10–30 m
5% (maximum error
of omission and
commission in
mapping individual
classes), location
accuracy better than
1/3 IFOV with target
IFOV 10–30 m
WGClimate GOFC-GOLD
Maps of key IPCC land use,
related changes and land-
management types
1–10 years
(including historical
data)
10–1 000 m
(depending on
time period)
20% (maximum error of
omission and commission in
mapping individual classes),
location accuracy better
than 1/3 IFOV with target
IFOV
20% (maximum error
of omission and
commission in
mapping individual
classes), location
accuracy better than
1/3 IFOV with target
IFOV
IPCC (2006) GOFC-GOLD
Soil carbon
% carbon in soil 5–10 years 20 km TBD
Mineral soil bulk density to
30 cm and 1 m 5–10 years 20 km TBD
Peatlands total depth of profile,
area and location 5–10 years 2 m vertical 20 m
horizontal 10% TBD

GCOS 2016 Implementation Plan
- 289 -
Terrestrial ECV product requirements ECV Products Frequency Resolution Required measurement
uncertainty
Stability (per
decade unless
otherwise
specified)
Standards/
References
Entity (see Part II, section
2.2)
Satellite In Situ
Fire
Burnt Areas 24 hours 30 m
15% (error of omission and
commission), compared to 30-
m observations
None
WGClimate
Active fire maps
6 hours at all
latitudes from
polar-orbiting and
1 hour from
geostationary
0.25-1 km
(polar);
1–3 km (geo)
5% error of commission
10% error of omission
Based on per-fire comparisons
for fires above target
threshold of 5 MW/km²
equivalent integrated FRP per
pixel (i.e. for a 0.5 km² pixel
the target threshold would be
2.5 MW, for a 9 km² pixel it
would be 45 MW).
WGClimate
Fire radiative power
6 hours at all
latitudes from
polar-orbiting and
1 hour from
geostationary
0.25-1 km
(polar)
1–3 km (geo)
10% integrated over pixel.
Based on target detection
threshold of 5 MW/km²
equivalent integrated FRP per
pixel (i.e. for a 0.5 km² pixel
the target threshold would be
2.5 MW, for a 9 km² pixel it
would be 45 MW).and with the
same detection accuracy as
the Active Fire Maps.
WGClimate

GCOS 2016 Implementation Plan
- 290 -
104 While GAW has responsibilities for the composition measurements, there is no single body considering the overall flux estimates though this has been done to some extent by the GCP.
Terrestrial ECV product requirements ECV Products Frequency Resolution Required measurement
uncertainty
Stability (per decade
unless otherwise
specified)
Standards/
References
Entity (see Part II, section
2.2)
Satellite In Situ
Anthropogenic
greenhouse-gas
fluxes
Emissions from fossil fuel use,
industry, agriculture and waste
sectors
Annual By country and
sector
Globally 5%
Nationally 10%
IPCC (2006)
IPCC (2013)
TBD104
Emissions/ removals by IPCC
land categories Annual
By
country/region
Globally 15%
Nationally 20%
Estimated fluxes by inversions of
observed atmospheric
composition - continental
Annual 1 000–10 000 km 10%
Maps for
modelling and
adaptation
WGClimate
Estimated fluxes by inversions of
observed atmospheric
composition - national
Annual 100–1 000 km 30% WGClimate
High-resolution CO2 column
concentrations to monitor point
sources
4 hourly 1 km 1ppm WGClimate
Latent and
sensible heat
fluxes
TOPC is considering the practicality of this being an ECV and, if so, what the requirements might be.

GCOS 2016 Implementation Plan
- 291 -
Stakeholders:
AQUASTAT FAO database and data collection system on water use
BSRN Baseline Surface Radiation Network
GAW WMO Global Atmosphere Watch
GCP Global Carbon Project
GCW WMO Global Cryosphere Watch
GOFC-GOLD Global Observation for Forest Cover and Land Dynamics
GOOS Global Ocean Observing System Sponsored by WMO, UNESCO-IOC, UNEP and ICSU
GTN-G Global Terrestrial Network - Glaciers
GTN-H Global Terrestrial Network - Hydrology
GTN-P Global terrestrial Network - Permafrost
HYDROLARE International Data Centre on Hydrology of Lakes and Reservoirs
JCOMM WMO-IOC Joint Technical Commission for Oceanography and Marine Meteorology
WGClimate Joint CEOS/CGMS working group on climate
WHYCOS WMO World Hydrological Cycle Observing System (a WMO programme)
WIGOS WMO Integrated Global Observing System
Box 10: Terrestrial standards: references.
CEN (2010) Hydrometry - Measurement of snow water equivalent using snow mass registration devices. CEN/TR
15996:2010, Brussels.
FAO (2000) Land Cover Classification System. Food and Agriculture Organization of the United Nations.
GFOI (2013) Integrating Remote-sensing and Ground-based Observations for Estimation of Emissions and Removals of
Greenhouse Gases in Forests: Methods and Guidance Pub: GEO, Geneva, Switzerland, 2014. ISBN 978-92-990047-4-6.
GLCN (2014) Global Land Cover Network (GLCN) Land Cover Classification System (LCCS), see http://www.glcn.org/.
GOFC-GOLD (2015(a)) See http://www.gofcgold.wur.nl/.
GOFC-GOLD (2015(b)) REDD+ Sourcebook November COP21 Edition, November 2015.
IACS/UNESCO (2009) International Classification of Seasonal Snow on the Ground.
IGOS (2007(a)) WMO/TD-No. 1405. 100 pp. CEN, 2010, Hydrometry - Measurement of snow water equivalent using snow
mass registration devices. CEN/TR 15996:2010, Brussels.
IGOS (2007(b)) Integrated Global Observing Strategy Cryosphere Theme Report - For the Monitoring of our Environment
from Space and from Earth. Geneva: World Meteorological Organization. WMO/TD-No. 1405. 100 pp.
IPCC (2006) 2006 IPCC Guidelines for National Greenhouse Gas Inventories, Prepared by the National Greenhouse Gas
Inventories Programme, Eggleston H.S., Buendia L., Miwa K., Ngara T. and Tanabe K. (eds). Published: IGES, Japan.
ISO 5667-18:2001 part 18 Guidance on sampling of groundwater at contaminated sites. Manual methods for the
measurement of a groundwater level in a well.
ISO/TC 113 ISO/Technical Committee 113: A1:AD21 61 published ISO standards related to the TC and its Subcommittees.
ISO/TC 147 ISO/TC 147/SC 6 N 120, Guidance on the sampling of groundwater.
ISO 5667-18:2001 part 18 Guidance on sampling of groundwater at contaminated sites.
Östrem G. and M. Brugmann, 1991, Glacier Mass Balance Measurements. A manual for field and office work. National
Hydrology Research Institute (Canada), Science Report No. 4, 224 pp.
Paul, F., Barry, et al. (2009): Guidelines for the compilation of glacier inventory data from digital sources.
WMO (2006) Technical Regulation Vol.lII, Hydrology, 2006 edition, Basic Documents №2, WMO- № 49.
WMO (2008a) Guide to Hydrological Practice, WMO- № 168, Sixth edition, 2008.
WMO (2008b) WMO Guide to Meteorological Instruments and Methods of Observation (Chapter 11).
WMO (2008c) Guide to meteorological instruments and methods of observation, WMO-No. 8, (Updated in 2010 and
2012).
WMO (2009) Guide to Hydrological Practices, Volume II, WMO- № 168.WMO (2010) Manual on Stream Gauging, Vol. I &
II, WMO- № 1044.
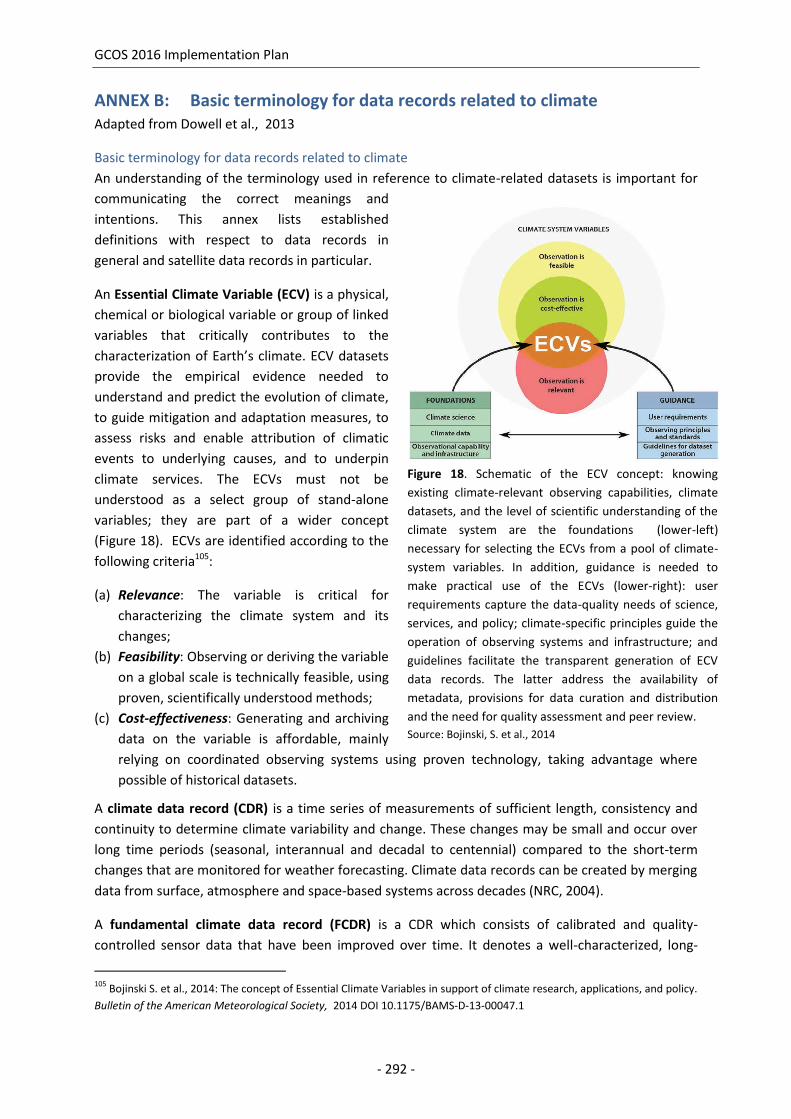
GCOS 2016 Implementation Plan
- 292 -
ANNEX B: Basic terminology for data records related to climate Adapted from Dowell et al., 2013
Basic terminology for data records related to climate
An understanding of the terminology used in reference to climate-related datasets is important for
communicating the correct meanings and
intentions. This annex lists established
definitions with respect to data records in
general and satellite data records in particular.
An Essential Climate Variable (ECV) is a physical,
chemical or biological variable or group of linked
variables that critically contributes to the
characterization of Earth’s climate. ECV datasets
provide the empirical evidence needed to
understand and predict the evolution of climate,
to guide mitigation and adaptation measures, to
assess risks and enable attribution of climatic
events to underlying causes, and to underpin
climate services. The ECVs must not be
understood as a select group of stand-alone
variables; they are part of a wider concept
(Figure 18). ECVs are identified according to the
following criteria105:
(a) Relevance: The variable is critical for
characterizing the climate system and its
changes;
(b) Feasibility: Observing or deriving the variable
on a global scale is technically feasible, using
proven, scientifically understood methods;
(c) Cost-effectiveness: Generating and archiving
data on the variable is affordable, mainly
relying on coordinated observing systems using proven technology, taking advantage where
possible of historical datasets.
A climate data record (CDR) is a time series of measurements of sufficient length, consistency and
continuity to determine climate variability and change. These changes may be small and occur over
long time periods (seasonal, interannual and decadal to centennial) compared to the short-term
changes that are monitored for weather forecasting. Climate data records can be created by merging
data from surface, atmosphere and space-based systems across decades (NRC, 2004).
A fundamental climate data record (FCDR) is a CDR which consists of calibrated and quality-
controlled sensor data that have been improved over time. It denotes a well-characterized, long-
105 Bojinski S. et al., 2014: The concept of Essential Climate Variables in support of climate research, applications, and policy.
Bulletin of the American Meteorological Society, 2014 DOI 10.1175/BAMS-D-13-00047.1
Figure 18. Schematic of the ECV concept: knowing
existing climate-relevant observing capabilities, climate
datasets, and the level of scientific understanding of the
climate system are the foundations (lower-left)
necessary for selecting the ECVs from a pool of climate-
system variables. In addition, guidance is needed to
make practical use of the ECVs (lower-right): user
requirements capture the data-quality needs of science,
services, and policy; climate-specific principles guide the
operation of observing systems and infrastructure; and
guidelines facilitate the transparent generation of ECV
data records. The latter address the availability of
metadata, provisions for data curation and distribution
and the need for quality assessment and peer review.
Source: Bojinski, S. et al., 2014

GCOS 2016 Implementation Plan
- 293 -
term data record, sometimes involving a series of instruments with potentially changing
measurement approaches, but with overlaps and calibrations sufficient to allow the generation of
products that are accurate and stable in both space and time to support climate applications (NRC,
2004). Examples of FCDRs are calibrated radiances, backscatter of active instruments and radio
occultation bending angles. FCDRs also include the ancillary data used to calibrate them. The term
FCDR has been adopted by GCOS and can be considered as an international consensus definition.
The term ECV product denotes parameters that need to be measured for each ECV. For instance, the
ECV cloud property includes at least five different geophysical variables where each of them
constitutes an ECV product. There may be several CDRs for each ECV product.
Basic terminology for definitions of metrological quantities106
Accuracy is defined as the “closeness of the agreement between a measured quantity value and a
true quantity value of the measurand”. The concept “measurement accuracy” is not a quantity and
is not given a numerical quantity value.
Bias is defined as an estimate of the systematic measurement error.
Uncertainty (of measurement) non-negative parameter, associated with the result of a
measurement that characterizes the dispersion of the values that could reasonably be attributed to
the measurand.
Metrological traceability is the property of a measurement result whereby the result can be related
to a reference through a documented unbroken chain of calibrations, each contributing to the
measurement uncertainty.
Stability may be thought of as the extent to which the uncertainty of measurement remains constant
with time. In this publication, values in Annex A under “stability” refer to the maximum acceptable
change in systematic error, usually per decade.
106 BIPM 2008 GUM 1995 with minor corrections. Evaluation of measurement data — Guide to the expression of
uncertainty in measurement Évaluation des données de mesure —Guide pour l’expression de l’incertitude de mesure JCGM
100:2008
WMO, 2012: Guide to Meteorological Instruments and Methods of Observation. WMO-No. 8, 2008 edition, updated in 2010


Appendices


GCOS 2016 Implementation Plan
- 297 -
APPENDIX 1: Contributors
This publication was written by a team led by Alan Belward.
Writing Team
Lead
Alan Belward, European Commission, Joint Research Centre, Italy
Members
Mark Bourassa, COAPS, USA
Mark Dowell, European Commission, Joint Research Centre, Italy
Stephen Briggs, European Space Agency (ESA)/ECSAT, United Kingdom
Han Dolman, University of Amsterdam, Netherlands
Kenneth Holmlund, EUMETSAT, Germany
Robert Husband, EUMETSAT, Germany
Shaun Quegan, University of Sheffield, United Kingdom
Roger Saunders, Met Office, United Kingdom
Adrian Simmons, ECMWF, United Kingdom
Bernadette Sloyan, CSIRO, Australia
Detlef Stammer, University of Hamburg, Germany
Konrad Steffen, WSL, Switzerland
Toste Tanhua, GEOMAR, Germany
Michel Verstraete, GCSRI, University of the Witwatersrand, South Africa
GCOS Secretariat
Carolin Richter
Simon Eggleston
Katherine Hill
Caterina Tassone
Magaly Robbez

GCOS 2016 Implementation Plan
- 298 -
Contributors
Liss Andreassen, Anthony Arendt, Stephen Briggs, Graham Cogley, Alex Gardner, Ben Marzeion Advisory Board of the Global Terrestrial Network-Glaciers
Richard Amstrong, University of Colorado CIRES/NSIDC, USA
Niels H. Batjes, ISRIC - World Soil Information (WDC Soils), Netherlands
Andreas Becker, GPCC Deutscher Wetterdienst, Germany
David Inglis Berry, National Oceanography Centre, United Kingdom
Etienne Berthier, LEGOS, CNRS, University of Toulouse, France
Maarten Blaauw, Queen's Universtity, Belfast, Northern Ireland, United Kingdom
Jessica Blunden, CWC-NCEI/NOAA, USA
Hartmut Boesch, National Centre for Earth Observation, University of Leicester, United Kingdom
Pascal Bonnefond, Observatoire de Paris – SYRTE, France
Sandrine Bony, LMD/IPSL, CNRS, Paris, France
Stephan Bojinski, WMO
Emmanuel Boss, University of Maine, United States
Tony Boston, Australian Bureau of Meteorology, Australia
Mary Jo Brodzik, University of Colorado, Cooperative Institute for Research in Environment Sciences, USA
Ross Brown, Environment and Climate Change Canada, Canada
Manola Brunet, Centre of Climate Change, Spain
James Butler, NOAA, USA
Fernando Camacho, CEOS/WGCV LPV, Spain
Frederic Chevallier, Laboratoire des Sciences du Climat et de l'Environnement (LSCE), France
Sam Cleland, Bureau of Meteorology, Australia
Helen Cleugh, CSIRO, Australia
Graham Cogley, Trent University, Canada
Richard Danielson, Nansen Environmental and Remote Sensing Centre, Norway
Gerrit de Leeuw, Finnish Meteorologcial Institute, Finland
Michel Deshayes, GEO (Group on Earth Observations)
Maxx Dilley, WMO/CLPA
Samy Djavidnia, Member of the GEO Blue Planet Steering Committee, European Union-European Maritime Safety Agency
Ted Edwin Engman, NASA (retired), USA
Hiroyuki Enomoto, National Institute of Polar Research (NIPR), Japan
John Eyre, Met Office, United Kingdom
Mofoluso Ayodele Fagbeja, African Regional Centre for Space Science and Technology Education in English (ARCSSTE-E), National Space Research and Development Agency (NASRDA), Nigeria

GCOS 2016 Implementation Plan
- 299 -
Charles Fierz, WSL Institute for Snow and Avalanche Research SLF and International Association of Cryospheric Sciences, Switzerland
Valentin Foltescu, United Nations Environment Programme, Kenya
Toshifumi Fujimoto, Japan Meteorological Agency, Japan
Syfred Funde, South African Weather Service, South Africa
Nadine Gobron, European Commission, Joint Research Centre, Italy
Wolfgang Grabs, Federal Institute of Hydrology (BfG), Germany
Christopher Hain, US National Oceanic and Atmospheric Administration (NOAA) National Environmental Satellite, Data, and Information Service (NESDIS), United States
Pandora Hope, Australian Bureau of Meteorology, Australia
Dale F. Hurst, CIRES/NOAA, USA
Erik Ivins, Jet Propulsion Lab, California Institute of Technology, Pasadena, USA
Johnny Johannessen, Nansen Environmental and Remote Sensing Centre, Norway
Philip Jones, University of East Anglia, United Kingdom
Damir Kabayev, Kazhydromet, Kazakhstan
Olga Kalashnikova, JPL, USA
Johannes Karstensen, GEOMAR Helmholtz Centre for Ocean Research, Germany
Katsuro Katsumata, Japan Agency for Marine-Earth Science and Technology, Japan
Boris Kelly-Gerreyn, Bureau of Meteorology, Australia
Elizabeth C. Kent, National Oceanography Centre, United Kingdom
Jeffrey Key, USA
Siri Jodha Singh Khalsa, University of Colorado, USA
Albert Klein-Tank, KNMI, Netherlands
Mary Ann Kutny, Jeff Privette, Mitch Goldberg, NOAA Satellite and Information Service (NESDIS), USA
Veronica Lance, National Oceanic and Atmospheric Administration (NOAA) and Global Science and Technology, Inc., USA
Felix Landerer, Jet Propulsion Laboratroy, California Insitute of Technology/NASA, USA
Tuomas Laurila, Finnish Meteorological Institute, Finland
John Francis Le Marshall, Bureau of Meteorology, Melbourne, Australia
Tsz Cheung Lee, Hong Kong Observatory, Hong Kong, China
Zhanqing Li, University of Maryland, USA
Christina Lief, NOAA, USA
Xiaopei Lin, Ocean University, China
Ana Lara Lopez and Tim Moltmann, Integrated Marine Observing System, Australia; Mark Hemer, Anthony Richardson and Bronte Tilbrook, CSIRO, Australia
Ulrich Looser, Global Runoff Data Centre (GRDC), Federal Institute of Hydrology (BfG), Germany
Jean-François Mahfouf, Météo-France, France
Terhikki Manninen, Finnish Meteorological Institute, Finland

GCOS 2016 Implementation Plan
- 300 -
Rodney Martínez Güingla, CIIFEN, Ecuador
Christoph Marty, WSL Institute for Snow and Avlanche Research, Switzerland
Shuhei Masuda, JAMSTEC, Japan
Simon McGree, Bureau of Meteorology, Australia
Galen McKinley, University of Wisconsin, Madison, USA
Michael McPhaden, Tropical Moored Buoy Implementation Panel, NOAA/PMEL, USA
Hamlet Melkonyan, Hydromet Service, Deputy Director, Armenia
Matthew Menne, NCEI/NOAA, USA
Christopher Merchant, University of Reading, United Kingdom
Andrea Merlone, Istituto Nazionale di Ricerca Metrologica and National Research Council (also representative of EURAMET and BIPM), Italy
Elaine Miles, Australian Bureau of Meteorology, Australia
Brice Mora, Wageningen University, GOFC-GOLD Land Cover Project Office, Netherlands
Frank Muller-Karger, University of South Florida, College of Marine Science, USA
Kachi, Nakamura, Yabe and Sobue, Japan Aerospace Exploration Agency, Japan
Glenn Nolan, Marine Institute Headquarters, Ireland
André Obregon, GEO (Group on Earth Observations) Secretariat
Osamu Ochiai, GEO (Group on Earth Observations) Secretariat
Nozomu Ohkawara, Japan Meteorological Agency, Japan
Daniel Ochieng Olago, University of Nairobi, Kenya
Natascha Oppelt, Kiel University, Dept. of Geography, Kiel, Germany
Eleanor O'Rourke, Diarmuid O. Conchubhair, Thomas Furey, Gema Casal, Caroline Cusack, Adam Leadbetter, Marine Institute, Ireland
Roland Pail, IAPG, Technical University of Munich, Germany
Thomas Painter, California Institute of Polar Research, Jet Propulsion Laboratory, USA
David Parker, Met Office, United Kingdom
Matthew Palmer, Met Office, United Kingdom
Frank Paul, Department of Geography, University of Zurich, Switzerland
Thomas Peterson, President of WMO-CCl
Rolf Philipona, MeteoSwiss, Switzerland
Peter Pilewskie, University of Colorado, Laboratory for Atospheric and Space Physivs, USA
Simon Pinnock, European Space Agency (ECSAT), United Kingdom
Neil Plummer, Bureau of Meteorology, Australia
Paul Poli, Météo-France, France
Joanna Post, UNFCCC
Will Pozzi, Group on Earth Observations (GEO) Global Drought Information System (GDIS) Point of Contact (PoC), USA

GCOS 2016 Implementation Plan
- 301 -
Jeff Privette, CWC-NCEI/NOAA, USAs
Jouni Pulliainen, Finnish Meteorological Institute, Finland
Shaun Quegan, University of Sheffield, United Kingdom
Nick Rayner, Met Office Hadley Centre, United Kingdom
J.T. Reager, Jet Propulsion Laboratroy, California Insitute of Technology/NASA, USA and Steve Wanzong (CIMSS-UW-Madison), Régis Borde (Eumetsat), Co-chairs of the International Winds Working Group, Germany and USA
Stefan Reimann, Empa, Switzerland
John Joseph Remedios, National Centre for Earth Observation and University of Leicester, United Kingdom
Lars Peter Riishojgaard, WMO
Karl Rittger, University of Colorado CIRES/NSIDC, USA
Pedro Rodriguez Veiga, National Centre for Earth Observation and University of Leicester, United Kingdom
Miguel O. Román, Terrestrial Information Systems Laboratory, USA
Paolo Rutti, WMO/WWR, Switzerland
Sassan Saatchi, California Institute of Polar Research, JPL, USA
Ted A. Scambos, National Snow and Ice Data Center, University of Colorado at Boulder, USA
Wolfgang Schoener, University of Graz, Austria
Klaus-Jürgen Schreiber, Deutscher Wetterdienst, Germany
Eric Schulz, Bureau of Meteorology, Australia
Jörg Schulz, EUMETSAT, Germany
Neville Smith, GODAE Ocean Services, Australia
Sabrina Speich, Ecole Normale Supérieure (Paris), Laboratoire de Météorologie Dynamique, France
Julienne Stroeve, National Snow and Ice Data Center, USA
Martin Steinbacher, Empa, Switzerland
Russell Stringer, Bureau of Meteorology, Australia
Greg Stuart, Bureau of Meteorology, Australia
Adrienne Sutton, NOAA Pacific Marine Environmental Laboratory, USAs
Kevin Tansey, University of Leicester, United Kingdom
Oksana Tarasova, WMO/AER/RES, Switzerland
Susan Tegtmeier, Geomar Helmholtz Centre for Ocean Research, Germany
Deon Terblanche, WMO/RES
Peter Thorne, University of Maynooth, Ireland
Frank Toussaint, World Data Centre for Climate at the German Climate Computing Centre (WDCC/DKRZ), Regular Member of ICSU-WDS, Germany
Blair Trewin, Australian Bureau of Meteorology, Australia
Matthew Tully, Bureau of Meteorology, Australia

GCOS 2016 Implementation Plan
- 302 -
Levon Vardanyan, Hydromet Service Director, Armenia
Valery Vuglinsky, State Hydrological Institute of Roshydromet, Russian Federation
Wolfgang Wagner, Vienna University of Technology, Austria
Jiankai Wang, China Meteorological Administration, China
Frank Webb, Jet Propulsion Laboratroy, California Insitute of Technology/NASA, USA
Robert Weller, Woods Hole Oceanographic Institution, USA
Bruce Wielicki, NASA Langley Research Center, USA
John Wilkin, Rutgers University, Institute of Marine and Coastal Sciences, USA
Martin Wooster, National Centre for Earth Observation, United Kingdom
Steven Worley, National Center for Atmospheric Research, USA
Margaret J. Yelland, National Oceanography Centre, United Kingdom
Weidong Yu, First Institute of Oceanography, SOA, China
Raymond Zaharia, Le Club des Argonautes, France
Michael Zemp, World Glacier Monitoring Service, Dept. Geography, University of Zurich, Switzerland
Andre Zerger, Bureau of Meteorology, Australia
Huqiang Zhang, Bureau of Meteorology, Australia
Peng Zhang, National Satellite Meteorological Centre, China
Climate Change Initiative Climate Modelling User Group, ESA, Europe

GCOS 2016 Implementation Plan
- 303 -
APPENDIX 2: Glossary of Acronyms
ACE-FTS Atmospheric Chemistry Experiment Fourier Transform Spectrometer
ACRE Atmospheric Circulation Reconstructions over the Earth
ADCP acoustic Doppler current profiler
ADM-Aeolus Atmospheric Dynamic Mission (ESA)
AERO-SAT International Satellite Aerosols Science Network
AERONET Aerosol Robotic NETwork
AFOLU Agriculture, Forestry and Other Land Use
AGAGE Advanced Global Atmospheric Gases Experiment
AGB Above Ground Biomass
AHI Advanced Himawari Imager
AIRS Atmospheric InfraRed Sounder (NASA)
ALOS Advanced Land Observing Satellite
AMDAR Aircraft Meteorological Data Relay
AMSR Advanced Microwave Scanning Radiometer
AMSR2 Advanced Microwave Scanning Radiometer 2
AMSU Advanced Microwave Sounding Unit
AMV Atmospheric Motion Vector
AOD aerosol optical depth
AOPC Atmospheric Observation Panel for Climate (GCOS)
AQUASTAT global water information system (FAO)
ARCSSTE-E African Regional Centre for Space Science and Technology Education in English
AR5WG1 Working Group I contribution to the IPCC Fifth Assessment Report
ARCTIC-ROOS Arctic Regional Ocean Observing System
ARF Aerosol Radiative Forcing
ASAR Advanced Synthetic Aperture Radar
ASCAT Advanced SCATcatterometer (EUMETSAT)
ASTER Advanced Spaceborne Thermal Emission and Reflection Radiometer (NASA)
ATMS Advanced Technology Microwave Sounder (NASA)
ATSR Along Track Scanning Radiometer (ESA)
AVHRR Advanced Very High Resolution Radiometer (NOAA)
AWI Alfred Wegener Institute
BAS British Antarctic Survey
BHR Bi-Hemispherical Reflectance
BIOMASS selected future ESA Earth Explorer Mission
BIPM Bureau International des Poids et Mesures www.bipm.org
BOUSSOLE Buoy for the Acquisition of Long-term Optical Time Series
BP British Petroleum plc
BRDF Broadband Reflectance Distribution Function
BRF Bidirectional Reflectance Factor
BSRN Baseline Surface Radiation Network
BUFR binary universal form for the representation of meteorological data

GCOS 2016 Implementation Plan
- 304 -
C3S Copernicus Climate Change Service
CARIBIC Civil Aircraft for the Regular Investigation of the atmosphere Based on an
Instrument Container
CBD Convention on Biological Diversity
CCD Charge Coupled Device
CCI Climate Change Initiative (ESA)
CD Compact Disk
CDIAC Carbon Dioxide Information Analysis Center
CDOM Coloured Dissolved Organic Matter
CDR Climate Data Record
CEOS Committee on Earth Observation Satellites
CERES Clouds and the Earth's Radiant Energy System (NASA)
CFC chlorofluorocarbon
CGMS Coordination Group for Meteorological Satellites
CH4 methane
CIIFEN Centro Internacional para la Investigación del Fenómeno el Nino (Ecuador)
CIMSS Cooperative Institute for Meterological Satellites Studies
CIRES Cooperative Institute for Research in Environmental Sciences
CITES Convention on International Trade in Endangered Species of Wild Fauna and
Flora
CLARREO Climate Absolute Radiance and Refractivity Observatory (proposed NASA
mission)
CLIC Climate and Cryosphere
CLIVAR climate variability and predictability
CMA China Meteorological Administration
CMSAF Satellite Application Facility on Climate Monitoring
CMUG Climate Modelling User Group
CNES Centre National d'Etudes Spatiales
CNRS The National Center for Scientific Research
CO carbon monoxide
CO2 carbon dioxide
COAPS Center for Ocean-Atmospheric Prediction Studies
CONAE Comisión Nacional de Actividades Espaciales
CONTRAIL Comprehensive Observation Network for TRace gases by AIrLiner
COP Conference of the Parties (UNFCCC)
CORDEX COordinated Regional Downscaling Experiment
COSMIC Constellation Observing System for Meteorology, Ionosphere, and Climate
CPR Continuous Plankton Recorder
CrIS Cross-track Infrared Sounder
CSIRO Commonwealth Scientific and Industrial Research Organisation
CSIS The Climate Services Information System
CTD conductivity temperature depth
DARF Direct Aerosol Radiative Forcing

GCOS 2016 Implementation Plan
- 305 -
DBCP Data Buoy Cooperation Panel
DCFS Direct covariance flux systems
DEM digital elevation model
DHR directional hemispherical reflectance
DIC dissolved organic carbon
DKD Deutscher Klimadienst
DMC CBS Lead Centre - DMC, Chile
DMN CBS Lead Centre - Direction de la Météorologie Nationale, Morocco for
Northern Region I and Madagascar
DMPA Data Management Programme Area
DMSP The Defense Meteorological Satellite Program
DOI Digital Object Identifier
DOOS Deep Ocean Observing Strategy
DP Dew Point
DU Dobson Unit
DSM Digital Surface Model
DTM Digital Terrain Model
DWD Deutscher Wetterdienst
EBV Essential Biodiversity Variable
ECMWF European Centre for Medium-Range Weather Forecasts
ECSAT The European Centre for Space Applications and Telecommunications
ECV Essential Climate Variable
EDGAR Emissions Database for Global Atmospheric Research
EMEP European Monitoring and Evaluation Programme www.emep.int
EMSO the European Multidisciplinary Seafloor and Water Column Observatory
ENSO El Niño Southern Oscillation
ENVISAT Environmental Satellite (ESA)
EO Earth Observation
EOV Essential Ocean Variable
ERB Earth Radiation Budget
ERF Effective Radiative Forcing
ERS European Remote-Sensing Satellite
ESA European Space Agency
ESRL NOAA Earth System Research Laboratory
ETM+ Landsat Enhanced Thematic Mapper (Plus)
ETOOFS JCOMM Expert Team on Operational Ocean Forecasting
ETWCH Expert Team on Waves and Coastal Hazard Forecasting Systems
EU European Union
EUMETNET grouping of 31 European National Meteorological Services
EUMETSAT European Organisation for the Exploitation of Meteorological Satellites
EURAMET the European Association of National Metrology Institutes
EWH Equivalent Water Height
FAO Food and Agricultural Organization of the United Nations
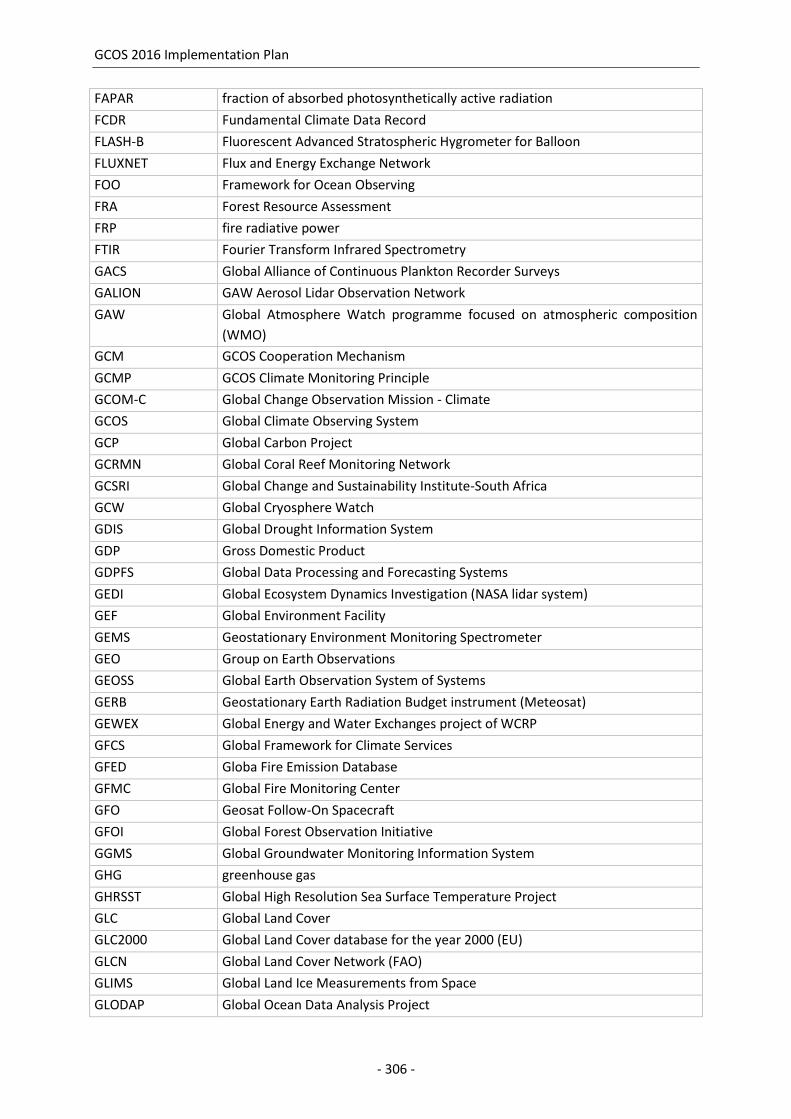
GCOS 2016 Implementation Plan
- 306 -
FAPAR fraction of absorbed photosynthetically active radiation
FCDR Fundamental Climate Data Record
FLASH-B Fluorescent Advanced Stratospheric Hygrometer for Balloon
FLUXNET Flux and Energy Exchange Network
FOO Framework for Ocean Observing
FRA Forest Resource Assessment
FRP fire radiative power
FTIR Fourier Transform Infrared Spectrometry
GACS Global Alliance of Continuous Plankton Recorder Surveys
GALION GAW Aerosol Lidar Observation Network
GAW Global Atmosphere Watch programme focused on atmospheric composition
(WMO)
GCM GCOS Cooperation Mechanism
GCMP GCOS Climate Monitoring Principle
GCOM-C Global Change Observation Mission - Climate
GCOS Global Climate Observing System
GCP Global Carbon Project
GCRMN Global Coral Reef Monitoring Network
GCSRI Global Change and Sustainability Institute-South Africa
GCW Global Cryosphere Watch
GDIS Global Drought Information System
GDP Gross Domestic Product
GDPFS Global Data Processing and Forecasting Systems
GEDI Global Ecosystem Dynamics Investigation (NASA lidar system)
GEF Global Environment Facility
GEMS Geostationary Environment Monitoring Spectrometer
GEO Group on Earth Observations
GEOSS Global Earth Observation System of Systems
GERB Geostationary Earth Radiation Budget instrument (Meteosat)
GEWEX Global Energy and Water Exchanges project of WCRP
GFCS Global Framework for Climate Services
GFED Globa Fire Emission Database
GFMC Global Fire Monitoring Center
GFO Geosat Follow-On Spacecraft
GFOI Global Forest Observation Initiative
GGMS Global Groundwater Monitoring Information System
GHG greenhouse gas
GHRSST Global High Resolution Sea Surface Temperature Project
GLC Global Land Cover
GLC2000 Global Land Cover database for the year 2000 (EU)
GLCN Global Land Cover Network (FAO)
GLIMS Global Land Ice Measurements from Space
GLODAP Global Ocean Data Analysis Project
GCOS 2016 Implementation Plan
- 307 -
GMSL Global Mean Sea Level
GLOSS Global Sea Level Observing System
GNSS Global Navigation Satellite System
GO-SHIP Global Ocean Ship-based Hydrographic Investigations Program
GOA-ON Global Ocean Acidification Observing Network
GODAE Global Ocean Data Assimilation Experiment
GOFC-GOLD Global Observation of Forest and Land Cover Dynamics
GOOS Global Ocean Observing System
GOSAT Greenhouse Gases Observing Satellite (Japan)
GOSIC Global Observing Systems Information Center
GOSUD Global Ocean Surface Underway Data
GPCC Global Precipitation Climatology Centre
GPCP Global Precipitation Climatology Project
GPM Global Precipitation Measurement (NASA)
GPS Global Positioning System
GRACE Gravity Recovery and Climate Experiment (NASA)
GRDC Global Runoff Data Centre (Federal Institute of Hydrology, Germany)
GRUAN GCOS Reference Upper-Air Network
GSICS Global Space-based Inter-Calibration System
GSN GCOS Surface Network
GTN-G Global Terrestrial Network for Glaciers
GTN-GW Global Terrestrial Network for Groundwater: the GGNM acts as GTN-GW
GTN-H Global Terrestrial Network - Hydrology
GTN-L Global Terrestrial Network - Lakes
GTN-P Global Terrestrial Network for Permafrost
GTN-R Global Terrestrial Network for River Discharge
GTN-SM Global Terrestrial Network for Soil Moisture: the ISMN act as GTN-SM
GTOS Global Terrestrial Observing System
GTS Global Telecommunication System (WMO)
GUAN GCOS Upper-Air Network
GVAP EUMETNET EIG GNSS water vapour programme
HAB Harmful algal bloom
HCHO formaldehyde
HF-radars High Frequency Radar
HMEI Hydro-meteorological Equipment Industry
HOAPS Hamburg Ocean Atmosphere Parameters and Fluxes from Satellite
HQ-GCDMS High Quality-Global Data Climate Management System
HWSD Harmonized World Soil Database
HYDROLARE hydrology database on lakes and reservoirs
HYDROWEB hydrology database (LEGOS)
IABP International Arctic Buoy Programme
IACS International Association of Cryospheric Sciences
IAEA International Atomic Energy Agency

GCOS 2016 Implementation Plan
- 308 -
IAGOS In-service Aircraft for a Global Observing System
IASI Infrared Atmospheric Sounding Interferometer (EUMETSAT)
IASI-NG IASI New Generation
ICOADS International Comprehensive Ocean-Atmosphere Data Set (NOAA)
ICOS Integrated Carbon Observation System (EU)
ICSU International Council for Science
IEA International Energy Agency
IEDRO International Environmental Data Rescue Organization
IFOV instantaneous field of view
IG3IS WMO’s Integrated Global Greenhouse Gas Information System
IGACO Integrated Global Atmospheric Chemistry Observations
IGBP International Geosphere-Biosphere Programme
IGMETS International Group for Marine Ecological Time Series
IGOS Integrated Global Observing Strategy
IGRAC International Groundwater Resources Assessment Centre
IHP International Hydrological Programme (UNESCO)
IIOE International Indian Ocean Expedition
ILSTE International Land Surface Temperature and Emissivity Working Group
ILTER International Long-Term Ecological Research
IMS Interactive Multisensor Snow and Ice Mapping System (NOAA)
INARCH International Network for Alpine Research Catchment Hydrology
INAM Instituto Nacional de Meteorologia of Mozambique – CBS Lead Centre
IOC Intergovernmental Oceanographic Commission (UNESCO)
IOCCG International Ocean-Colour Coordinating Group
IOCCP International Ocean Carbon Coordination Project
IODE International Oceanographic Data and Information Exchange (IOC)
IOVWST International Ocean Vector Winds Science Team
IPA International Permafrost Association
IPAB International Programme for Antarctic Buoys
IPCC Intergovernmental Panel on Climate Change
IR infrared
IRDR Integrated Research on Disaster Risk
IRIMO CBS Lead Centre-Iran
IRIS Interface Region Imaging Spectrograph (NASA)
ISCCP International Satellite Cloud Climatology Project
ISCCP-FD Results from the ISCCP
ISMN International Soil Moisture Network
ISO International Organization for Standardization
ISO/TC ISO Technical Committees
ISRIC World Soil Information
ISS International Space Station
ISSC International Social Science Council
ISTI International Surface Temperature Initiative

GCOS 2016 Implementation Plan
- 309 -
IVOS CEOS WGCV Infrared and Visible Optical Sensors subgroup
IWMI International Water Management Institute
JAMSTEC Japan Agency for Marine-Earth Science and Technology
JAXA Japan Aerospace Exploration Agency
JCOMM Joint Technical Commission for Oceanography and Marine Meteorology
JCOMM OCG JCOMM Observations Coordination Group
JCOMMOPS JCOMM in situ Observing Platform Support Centre
JMA Japan Meteorological Agency
JPL Jet Propulsion Laboratory (NASA)
JPSS Joint Polar Satellite System (NOAA)
JRC The Joint Research Centre of the European Commission
LAI leaf area index
LC Land Cover
LCCS Land Cover Classification System
LCLUC Land-Cover and Land-Use Change
LCML Land Cover Meta Language
LEGOS Laboratory of studies on Spatial Geophysics and Oceanography (Laboratoire
d’Etudes en Géophysique et Océanographie Spatiale), Touloused, France
LEO low earth orbit
LGAC Landsat Global Archive Consolidation
LMD/IPSL Laboratoire de Meteorologie Dynamique/Institut Pierre Simon Laplace
LPDAAC Land Processes Distributed Active Archive Center
LPV Land Product Validation
LS Lower Stratisphere
LSA SAF Land Surface Analysis Satellite Applications Facility
LSRT Land surface radiometric temperature
LST land-surface temperature
LTER Long Term Ecological Research Network
LULUCF Land Use, Land-Use Change and Forestry
MAIA Multi-Angle Imager for Aerosols
MARS Meteorological Archival and Retrieval System (ECMWF)
MAXDOAS Multi-Axis Differential Optical Absorption Spectroscopy
MEA Multilateral Environmental Agreements
MEMENTO MarinE MethanE and NiTrous Oxide database
MERIS Medium Resolution Imaging Spectrometer (on Envisat)
MESA Monitoring for Environment and Security in Africa Porgramme
METAR meteorological terminal aviation routine weather report
MGD Method and Guidance Document
3MI multiviewing, multichannel, multipolarization imager dedicated to aerosol
measurement
MISR Multi-angle Imaging SpectroRadiometer (NASA)
MLS Microwave Limb Sounder
MOBY Marine Optical Buoy

GCOS 2016 Implementation Plan
- 310 -
MODDRFS MODIS Dust Radiative Forcing in Snow algorithm
MODE-S Secondary Survellaince Radar Process
MODIS Moderate Resolution Imaging Spectroradiometer (NASA)
MODLAND Modis Land
MOZAIC Measurements of OZone, water vapour, carbon monoxide and nitrogen oxides
by in-service AIrbus airCraft
MSU Microwave Sounding Unit (NOAA)
MTG EURD Meteosat Third Generation End-User Requirements Document
MW Microwave
N2 Nitrogen
N2O Nitrous Oxide
NA Not Applicable
NASA National Aeronautics and Space Administration
NASA-ISRO NASA-ISRO Synthetic Aperture Radar
NASRDA National Space Research and Development Agency (Nigeria)
NCDC National Climatic Data Center
NCEI National Centers for Environmental Information (NOAA)
NDACC Network for the Detection of Atmospheric Composition Change
NDC Nationally Determined Contributions
NEON National Ecological Observatory Network
NESDIS National Environmental Satellite, Data, and Information Service
NEXRAD Next Generation Weather Radar
NF3 Nitrogen Trifluoride
NGCC National Geomatics Center of China www.ngcc.cn
NH3 Northern Hemisphere
NH3 Ammonia
NILU World Data Centre for Aerosols
NIR Near infrared
NISAR NASA-ISRO SAR Mission
NMHS National Meteorological and Hydrological Service
NMVOC Non-methane volatile organic compound
NO Nitrogen monoxide
NO2 Nitrogen Dioxide
NO3 Nitrate
NOAA National Oceanographic and Atmospheric Administration
NPP/JPSS National Polar-orbiting Partnership/Joint Polar Satellite System
NRCS Natural Resources Conservation Service
NSIDC National Snow and Ice Data Center
NWP Numerical Weather Prediction
O2 Oxygen
O3 Ozone
OC-CCI Ocean Colour CCI
OCO Orbiting Carbon Observatory (NASA)

GCOS 2016 Implementation Plan
- 311 -
OCR Ocean Colour Radiance
OGC Open Geospatial Consortium
OH Hydroxide
OLCI Ocean and Land Colour Imager on Sentinel-3
OLR Outgoing Longwave Radiation
OMPS Ozone Mapping Profiler Suite (NASA)
OOPC Ocean Observations Panel for Climate
OSCAR Observing Systems Capability Analysis and Review tool (WMO)
OSHF Ocean Surface Heat Flux
OSS Ocean Surface Stress
OSSST Ocean Surface Salinity Science Team
OSTST Ocean Surface Topography Science Team
OVSST Ocean Vector Stress Science Team
PACE Platform for Attitude Control Experiments
PALSAR Phased Array type L-band SAR (Japan)
PANDORA Spectrometer System
PAR Photosynthetically active radiation
PFR Precision Filter Radiometer
PFT Phytoplankton Functional Type
PM Particulate Matter
PMR Pressure Modulator Radiometer (NOAA)
PO4 Phosphate
POC Particulate Organic Carbon
POGO Partnership for Observations of the Global Ocean
PROBA PRoject for OnBoard Autonomy (ESA)
PROVIA Programme of Research on Vulnerability, Impacts and Adaptation
PSMSL Permanent Service for Mean Sea Level
QA4EO Quality Assurance framework for Earth Observation
QA/QC Quality Assurance/Quality Control
QC Quality Control
QPE Quantitative precipitation estimation
RBCN Regional Basic Climatological Network
RBON Regional basic Observing Network
RBSN Regional Basic Synoptic Network
RDA Research Data Alliance
RECLAIM RECovery of Logbooks And International Marine data
REDD-plus Reducing emissions from deforestation and forest degradation and the role of
conservation, sustainable management of forests and enhancement of forest
carbon stocks in developing countries (UNFCCC)
RGI Randolph Glacier Inventory
RH Relative Humidity
RIHMI-WDC All-Russian Research Institute for Hydrometeorological Information-World Data
Center

GCOS 2016 Implementation Plan
- 312 -
RO Radio occultation
RRR Rolling Review of Requirements (WMO)
SAEON The South African Environmental Observation Network
SAF Satellite Application Facility (EUMETSAT)
SAGE III Stratospheric Aerosol and Gas Experiment (NASA)
SAOCOM Satélite Argentino de Observación COn Microondas, Spanish for Argentine
Microwaves Observation Satellite
SAOZ Systeme d'Analyse par Observation Zenithale
SAR Synthetic Aperture Radar
SAVS Surface Albedo Validation Sites
SBSTA Subsidiary Body for Scientific and Technological Advice
SCAMS Scanning Microwave Spectrometer (NASA)
SCIAMACHY SCanning Imaging Absorption spectroMeter for Atmospheric CHartographY
SCOPE-CM Sustained, Coordinated Processing of Environmental Satellite data for Climate
Monitoring
SCOR Scientific Committee on Oceanic Research
SDG Sustainable Development Goal
SE Snow Extent
SF6 Sulfur hexafluoride
SGLI Second Generation Global Imager
SHADOZ Southern Hemisphere ADditional OZonesondes
SI International System of Units
SLF WSL Institute for Snow and Avalanche Research
SLP Surface Level Pressure
SLSTR The Sea and Land Surface Temperature Radiometer
SMAP Soil Moisture Active Passive (NASA)
SMOS Soil Moisture and Ocean Salinity (ESA)
SMR The Sub-Millimetre Radiometer
SNOTEL SNOwpack TELemetry network
SO2 Sulfur dioxide
SOCAT Surface Ocean CO2 Atlas
SOCOM Surface Ocean CO2 Mapping intercomparison project
SOGE System for observation of halogeneted GHG in Europe
SOOP Ship Of Opportunity Programme l
SOOS Southern Ocean Observing System
SORCE SOlar Radiation and Climate Experiment
SOT Ship Oberservation Team (JCOMM)
SPARTAN Surface PARTiculate mAtter Network
SPOT Satellite Pour l'Observation de la Terre (CNES)
SRB Surface Radiation Budget
SRTM Shuttle Radar Topography Mission
SSH Sea Surface Height
SSM/I Special Sensor Microwave Image (DMSP satellites)
GCOS 2016 Implementation Plan
- 313 -
SSM/S Special Sensor Microwave Imager Sounder (DMSP satellites)
SSM/T Special Sensor Microwave/Temperature profiler (NASA)
SSS Sea-surface salinity
SST Sea Surface Temperature
SUOMI-NPP Suomi National Polar-orbiting Partnership
SVP Surface Velocity Program
SVPB Drifters with SLP sensors
SWE Snow Water Equivalent
SWIR Short-wave infrared Imagery
SWOT Surface Water and Ocean Topography mission (NASA/CNES)
SYNOP Surface Synoptic Observation
SYRTE Systèmes de Référence Temps Espace
TA Total Alkalinity
TAC Traditional Alphanumerical Codes
TAMDAR Tropospheric Airborne Meteorological Data Reporting
TAO Tropical Atmosphere Ocean project
TBD To be determined
TCCON Total Carbon Column Observing Network
TEMPO Tropospheric Emissions: Monitoring of Pollution
TEMS Terrestrial Ecosystem Monitoring Sites
TERN Terrestrial Ecosystem Research Network
TM/ETM+ Landsat Thematic Mapper
TOA Top Of the Atmosphere
TOPC Terrestrial Observation Panel for Climate (GCOS)
TOPEX/Poseidon Topography Experiment/Poseidon (CNES-NASA)
TPOS Tropical Pacific Observing System
TPW Total Precipitable Water
TRITON Triangle Trans-Ocean Buoy Network (Japan/United States)
TRMM Tropical Rainfall Measuring Mission
TROPOMI TROPOspheric Monitoring Instrument (ESA/EU)
TRUTHS Traceable Radiometry Underpinning Terrestrial- and Helio-Studies (
TSIS Total Solar Irradiance and Spectral Solar Irradiance
TSM Total Suspendent Sediments
TTD Transit Time Distribution
UA Upper-air
UCAR University Corporation for Atmospheric Research
UK United Kingdom
ULS Upward-Looking Sonar (on submarines)
UMD University of Maryland
UN United Nations
UNCCD UN Convention to Combat Desertification
UNDP United Nations Development Programme
UNEP United Nations Environmental Programme

GCOS 2016 Implementation Plan
- 314 -
UNESCO United Nations Educational, Scientific and Cultural Organization
UNFCCC United Nations Framework Convention on Climate Change
UNISDR United Nations Office for Disaster Risk Reduction
UN-REDD United Nations Programme on Reducing Emissions from Deforestation and
Forest Degradation
USA United Sated of America
USGS United States Geological Survey
UT Upper Troposphere
UT/LS Upper Troposphere Lower Startosphere
UV Ultraviolet
UW University o Wisconsin
VHF Very High Frequency
VIIRS Visible Infrared Imaging Radiometer Suite (NASA/NOAA)
VIS visible
VOS Voluntary Observing Ship
VOSClim Voluntary Observing Ship Climate
WCRP World Climate Research Programme
WDAC WCRP Data Advisory Council
WDC World Data Centre
WDCC/DKRZ World Data Centre for Climate at the German Climate Computing Centre
WDCGG WDC for Greenhouse Gases (Japan)
WDS World Data System
WG Working Group
WGCV Working Group on Calibration and Validation (CEOS)
WGMS World Glacier Monitoring Service http://wgms.ch/
WHO World Health Organization www.who.int
WHOS WMO Hydrological Observing System
WHYCOS World Hydrological Cycle Observing System
WIGOS WMO Integrated Global Observing System
WMO World Meteorological Organization http://www.wmo.int
WMO CAS Commission for Atmospheric Science (WMO)
WMO CBS Commission for Basic Systems (WMO)
WMO Chy Commission for Hydrology
WMO CIMO Commission for Instruments and Methods of Observations (WMO)
WMO/RA WMO Regional Association
WMO/WWR WMO/World Weather Research
WOUDC World Ozone and Ultraviolet Radiation Data Centre (Canada)
WRCP World Climate Research Programme
WRCP/CLIVAR Climate and Ocean: Variability, Predictability and Change
WRCP/CORDEX COordinated Regional Downscaling EXperiment
WRDC World Radiation Data Centre (Russian Federation)
WRMC World Radiation Monitoring Center (BSRN)
WSL Swiss Federal Institute for Forest, Snow and Landscape Research

GCOS 2016 Implementation Plan
- 315 -
WWW/GOS World Weather Watch/Global Observing System
XBT expendable bathythermograph
XCTD expendable CTD

GCOS 2016 Implementation Plan
12
GLOBAL CLIMATE OBSERVING SYSTEM
GCOS Secretariat | c/o World Meteorological Organization
7 bis, avenue de la Paix | P.O. Box 2300 |CH-1211 Geneva 2 | Switzerland
Tel. : +41 (0) 22 730 8275/8067 | Fax : +41 (0) 22 730 8052 | E-mail: [email protected]
http://gcos.wmo.int