
The Global Market Place: How far can Nigeria go with the ... · The Global Market Place: How far...
25
The Global Market Place: How far can Nigeria go with the present Non-oil Product Mix? Rosemary N. Okoh
Transcript of The Global Market Place: How far can Nigeria go with the ... · The Global Market Place: How far...

The Global Market Place: How far can Nigeria go with the
present Non-oil Product Mix?
Rosemary N. Okoh
THE GLOBAL MARKET PLACE: HOW FAR CAN NIGERIA GO WITH
THE PRESENT NON-OIL PRODUCT MIX?
Rosemary N. Okoh (Ph.D)
National Centre for Economic Management and Administration No. 1& 3, Oba Akinyele Avenue
P.M.B. 85, U. I. Post Office Ibadan, Nigeria.
[email protected] Fax: 23428100079
Paper presented at the Conference On African Development And Poverty Reduction: The Micro-Macro Link

2
Abstract:
This paper is an empirical analysis of the demand for Nigeria’s non-oil export merchandize with a view to providing an answer to the question of how far the present product mix would go in the global market. The study employed the Johansen’s test of co-integration and analysis of structural characteristics of the integrated stochastic variables in the error correction vector. The results of the study show that the present product mix of non-oil merchandize export, have low and negative long run income elasticity of demand, but high long run price elasticity of demand, such that prices rise and fall in response to the highly volatile global commodity market prices. This study has important implication for international trade policies in Nigeria and other Africa economies. Nigeria cannot maximize gains from global integration until the basic prerequisites for industrialization and modernization of the productive base have been properly established. Entering the global market prematurely is a deterrent to growth in export. Nigeria must do the first things first - invest on innovation and reduce the efforts towards global integration, since this will continue to be inimical to the Nigerian economy as long as the present mix of non-oil exports products remains.
Introduction:
Nigeria’s quest for market access in the global market arena for her non-oil merchandise has led to the signing of bilateral, regional and trade preferential agreements with different countries. Apart from signing bilateral agreement with Benin republic, Bulgaria, equatorial Guinea, Jamaica, Niger, Romania, turkey, Uganda and Zimbabwe, investment promotion and protection treaties have also been signed with France, Switzerland, the United Kingdom, the Netherlands, North Korea, China and Turkey. Nigeria is one of the founding members of the World Trade organizations (WTO), the body that is currently charged with the responsibility to remove all barriers to trade between the nations of the world such that the whole world becomes “one big global market”. Despite these and the liberalization that resulted from the structural adjustment programme (SAP) of the mid 1980s, the value of Nigeria’s non-oil exports have dwindled from an average of 7% of total export in 1970-1985 to 4% in 1986-1998. It is bewildering to find that the non-oil exports declined in the period of greatest openness (Okoh, 2004). The need for expansion of non-oil exports in Nigeria is predicated on the fact that, crude oil which is Nigeria’s main source of foreign exchange is an exhaustible asset and cannot be relied on for sustainable development. This raises a number of questions:

3
• How responsive is the demand for Nigeria’s non-oil export to price and income variability in the global market?
• Does Nigeria’s non-oil product mix meet the world’s tastes and preferences? • Does the Nigerian economy need further openness?
These questions are pertinent at this time when it has become evident that the effective rate of protection of most Nigerian agricultural products are declining and becoming negative, particularly the export crops such, as cocoa and palm products (Ogunkola and Oyejide, 2001).
The export of primary products particularly agricultural products accounts for a large proportion of Nigeria’s non-oil export earnings. The range of traded non-oil merchandise is not only narrow but is made up of goods that are highly competitive in the world market. Hence Nigeria’s share of the non-oil merchandise in the world market particularly manufactures is relatively small (Uniamikogbo, 1996). According to Thirlwall, (1978) the demand for developing countries’ traditional export is inelastic relative to the demand for industrial goods. The domination of the export trade of Nigeria and other developing countries by primary products and the associated retardation of growth of traditional exports has been attributed to three distinct factors at work in the developed countries. First, the global shift of the pattern of demand to goods with relatively low import content of primary commodities; second, technological change which has led to the development of synthetic substitutes of raw materials; and third, the pursuance of protectionist policies by the developed countries retarding the growth of imports of primary commodities and industrial goods. Uniamikogbo (1996) further argues that since, the price elasticity of demand of most exports of developing countries is low, with slow expansion of demand; it would be irrational to continue the allocation of resources to these export activities. He argues that a further increase in production of these exports would result in reduction of prices and worsening terms of trade. Uniamikogbo’s argument is not against trade but a call to examine the non-oil product mix with a view to specializing in the production and export of those goods that would ensure favourable terms of trade with developed countries. Among the non-oil export merchandise, however, the elasticity of demand may defer. For instance, agricultural export commodities have been said to tend to be characterized by a low price elasticity of demand while mineral export commodities are said to have high price elasticity of demand. Agricultural exports are therefore likely to generate less income than mineral exports during an export boom (Ogun, 1995). The implication of this is that policies such as exchange rate devaluation may reduce the price of Nigerian exports but may not raise the export volume of agricultural export merchandise which is Nigeria’s major export product group in the non-oil sub sector.

4
The literature is replete with articles on the growth of exports and the development of the Nigerian economy. A number of available articles have found that exports have been instrumental to Nigeria’s growth performance suggesting that export led growth hypothesis holds in Nigeria (Fajana, 1979, Langley, 1968, Olomola, 1998, Ekpo and Egwaikhide, 1994, Oladipo, 1998, Ogunkola and Oyejide, 2001, Ogunkola 2003). The authors also recognize that greater integration into the world market has not made an impressionable impact on the Nigerian economy. In line with this argument, Uniamikogbo, (1996), proposes an end to the production and export of non-oil export merchandise which have low price and income elasticity of demand.
There are however only a few empirical studies on the impact of global integration on non-oil export in Nigeria, (Okoh, 2004). Okoh adopted Brahmbhatt and Dadush, (1996) index of speed of integration, that is the ratio of trade (exports plus imports) to GDP employing cointegration analysis concluded that openness was not significant in explaining growth in non-oil export. This is contrary to the current belief that openness or freer trade leads to expansion in export trade (Thirwall, 1999). There is thus a need to examine more closely the determinants of demand for Nigeria’s non-oil exports in the global market especially as it has been observed that free trade may work to the disadvantage of the developing countries, largely because of the nature of the products these countries seem destined to produce and trade under such system (Thirwall, 1999: p33.). The essence of this present paper therefore, is to verify empirically the long run nature of price and income elasticities of demand for Nigeria’s non-oil export product mix. The paper is divided into six sections including this introductory section, which is followed by theoretical framework, the structure of Nigeria’s non-oil exports, method of analysis, results and discussions and finally policy implications and conclusion.
Theoretical Framework
A number of models have been developed to explain the inequality in growth of the economies of rich industrialized nations and the poor developing nations. The centre-periphery models become useful at this point in time when it has become necessary to determine why policies, which are found to be potent in raising exports in the rich industrialized economies, work contrary to the growth expectations of African economies.
Myrdal (1963) employs the process of circular and cumulative causation in an attempt to explain widening international differences in the level of development from similar initial conditions. Through the means of labour migration, capital movements and trade,

5
international inequalities are perpetuated in exactly the same way as regional inequalities within the nations. According to Myrdal through trade developing nations have been forced into the production of primary products with inelastic demand with respect to both price and income. Accordingly, developing nations are at a grave disadvantage compared with the developed countries with respect to the balance of payments and the availability of foreign exchange. Myrdal argues that the developed industrialized countries have gained cumulative competitive trading advantage especially in manufacturing commodities. Myrdal is not alone in this line of discourse. Others are Prebisch, (1950), Seers (1962), and Kaldor (1970). For our purpose the Prebsich model will be examined perhaps for its simplicity and relevance to the explanation of demand for Nigerian non-oil export. The Prebisch model is a two-country and two-commodity model in which the industrialized country (centre) produces and exports manufactures goods with an income elasticity (em) of demand greater than unity, while the developing (periphery) nation produces and exports primary commodities which, have income elasticity (ep) of demand less than unity. The model assumes that the two trading countries’ starting rates of income growth are equal. The growth (g) rate of exports (x) and imports (m) in the centre(c) and periphery (p) will be: (a) For the centre: xc = gp * em … (1) Mc = gc * ep … (2) Where: XC = Export of the Centre; MC = Import of the Centre; GP = Growth rate of export of the Periphery; GC = Growth rate of export of the Centre; EM = Income Elasticity of demand for the Centre; EP = Income Elasticity of demand for the Periphery; (b) For the periphery: xp = gc * ep … (3) mp = gp * em … (4) The variables are as defined above. With imports growing faster in most developing nations such as Nigeria, growth will not be sustainable unless the periphery can finance an ever growing balance of payments deficit on the current account by capital flows. If not, to maintain the balance of payment equilibrium there must be some adjustment to raise the rate of growth of exports to reduce the rate of imports.

6
From the model the necessary growth rate of the periphery to maintain the balance can be obtained. From the assumptions, Mp = Xp … (5); or gp * em = Xp …. (6) ; and therefore gp = Xp/em …….. (7) The growth rate will be constrained at a rate lower than the centre. In these circumstances the gap (absolute and relative) between the periphery and centre will widen (Thirwall, 1999). Since the growth of periphery exports,
Xp = gc * ep … (8) Gp can be written as Gp = gc * ep/em …. (9)
Dividing through with gc we obtain the result that the relative growth rates of the periphery and centre will equal the ratio of the income elasticity of demand for the two countries commodities: Gp/gc = ep/em … (10) This condition will hold as long as current account equilibrium on the balance of payments is a requirement and relative price adjustment in international trade is either ruled out as adjustment mechanism to rectify balance of payments disequilibruim or does not work (Thirwall, 1999). Prebisch however noted that the consequences of this model could be avoided by recourse to protectionism, which would be a policy to reduce em. The em is equivalent to the propensity to import manufactured goods for the periphery. This model as simple as it is seems to be the most appropriate for explanation of the Nigerian non-oil scenario at this point in her history.
The Structure of Non-Oil Merchandize Export in Nigeria
Agricultural exports dominate non-oil export product mix. Non-oil exports merchandise consist traditionally of agricultural products both processed and unprocessed. Its share in total is as high as 70% of total non-oil exports value. Other components of the non-oil export product mix include manufactured products and solid minerals. Agricultural products include- Cocoa, Groundnut, Palm Produce, Rubber (Natural), Cotton and Yarn, Fish and Shrimps, while the Manufactured products and solid minerals on the other hand include: processed agricultural products, textiles, Tin Metal, beer, cocoa butter, plastic products processed timber, tyres, natural spring water, soap, detergent and fabricated iron rods. The non-oil commodities market experienced an export boom between 1960 and 1970. Their fortune turned downwards in the early 1980s when the international primary commodity markets collapsed with the associated deterioration in the terms of trade. Resulting mainly from the policies adopted during the
7
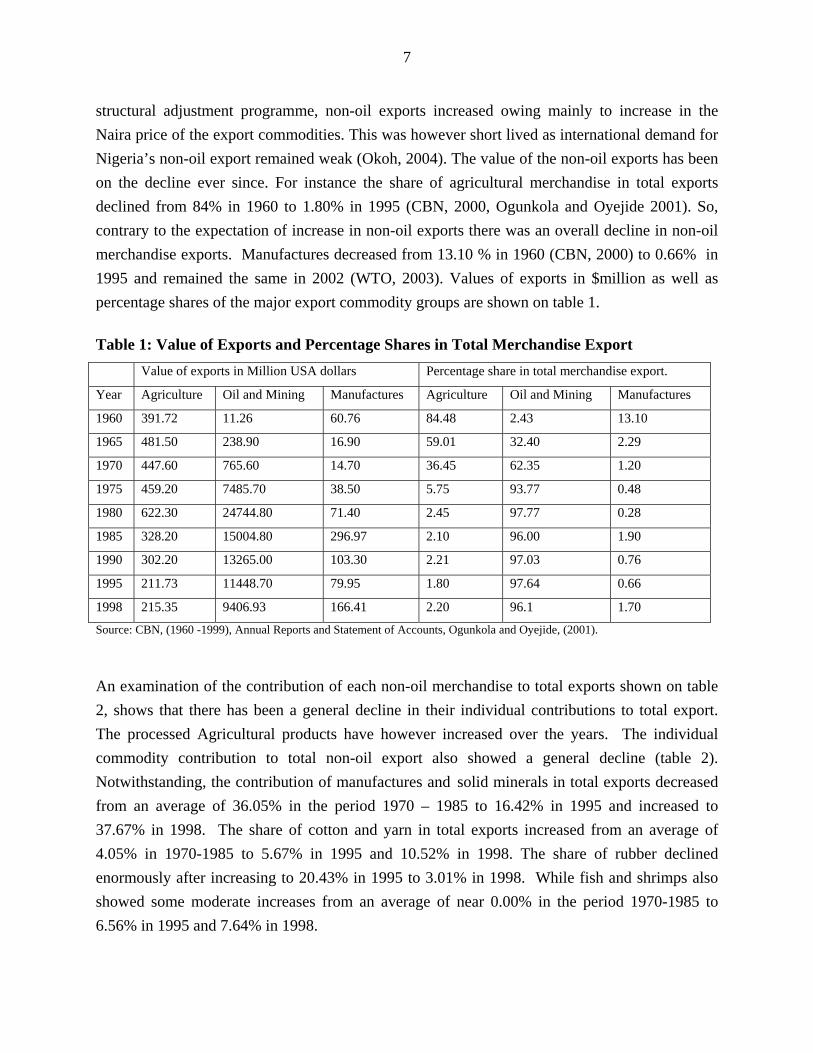
structural adjustment programme, non-oil exports increased owing mainly to increase in the Naira price of the export commodities. This was however short lived as international demand for Nigeria’s non-oil export remained weak (Okoh, 2004). The value of the non-oil exports has been on the decline ever since. For instance the share of agricultural merchandise in total exports declined from 84% in 1960 to 1.80% in 1995 (CBN, 2000, Ogunkola and Oyejide 2001). So, contrary to the expectation of increase in non-oil exports there was an overall decline in non-oil merchandise exports. Manufactures decreased from 13.10 % in 1960 (CBN, 2000) to 0.66% in 1995 and remained the same in 2002 (WTO, 2003). Values of exports in $million as well as percentage shares of the major export commodity groups are shown on table 1. Table 1: Value of Exports and Percentage Shares in Total Merchandise Export Value of exports in Million USA dollars Percentage share in total merchandise export.
Year Agriculture Oil and Mining Manufactures Agriculture Oil and Mining Manufactures
1960 391.72 11.26 60.76 84.48 2.43 13.10
1965 481.50 238.90 16.90 59.01 32.40 2.29
1970 447.60 765.60 14.70 36.45 62.35 1.20
1975 459.20 7485.70 38.50 5.75 93.77 0.48
1980 622.30 24744.80 71.40 2.45 97.77 0.28
1985 328.20 15004.80 296.97 2.10 96.00 1.90
1990 302.20 13265.00 103.30 2.21 97.03 0.76
1995 211.73 11448.70 79.95 1.80 97.64 0.66
1998 215.35 9406.93 166.41 2.20 96.1 1.70
Source: CBN, (1960 -1999), Annual Reports and Statement of Accounts, Ogunkola and Oyejide, (2001).
An examination of the contribution of each non-oil merchandise to total exports shown on table 2, shows that there has been a general decline in their individual contributions to total export. The processed Agricultural products have however increased over the years. The individual commodity contribution to total non-oil export also showed a general decline (table 2). Notwithstanding, the contribution of manufactures and solid minerals in total exports decreased from an average of 36.05% in the period 1970 – 1985 to 16.42% in 1995 and increased to 37.67% in 1998. The share of cotton and yarn in total exports increased from an average of 4.05% in 1970-1985 to 5.67% in 1995 and 10.52% in 1998. The share of rubber declined enormously after increasing to 20.43% in 1995 to 3.01% in 1998. While fish and shrimps also showed some moderate increases from an average of near 0.00% in the period 1970-1985 to 6.56% in 1995 and 7.64% in 1998.

8
It is important to mention here that in the period of greater openness, mid 1980s up to the end of the 1990s decade the value of non-oil imports (NOM) increased enormously while before this period non-oil import and exports (NOX) were more or less at par as figure 1 shows. The major components of Nigerian exports include manufactured-durable-consumer goods, plants, machineries and raw materials such as chemical inputs and pre-fabricated equipments. Figure 2 however shows that the growth rate of the two variables seemed to co-move during the period.
FIGURE 1: Non-oil Import and export values
NOM
NOX
Importand
Export
Years
0
200000
400000
600000
800000
1970 1975 1980 1985 1990 1995
FIGURE 2: Growth of non-oil imports and export
GNOM
GNOX
Impo
rt an
dE
xpor
t
Years
-100
0
100
200
300
400
1970 1975 1980 1985 1990 1995

9
Table 2: Contributions of Non-oil Merchandize Export to Total export (1970-1998).
(Percentages) 1970-1985
Average 1986-1998 Average
1994 1995 1996 1997 1998
Cocoa 4.00 1.80 0.90 0.70 0.60 0.60 0.60 Groundnut 0.40 0.00 0.00 0.00 0.00 0.00 0.00 Palm Produce 0.50 0.10 0.10 0.00 0.00 1.00 0.10 Rubber (Natural) 0.40 0.40 0.30 0.50 0.40 0.10 0.00 Tin Metal 0.40 0.00 0.00 0.00 0.00 0.00 0.00 Cotton and Yarn 0.50 0.10 0.10 0.10 0.10 0.30 0.50 Fish and Shrimps 0.50 0.10 0.20 0.20 0.10 0.10 0.30 Manufactures: processed agric. Products
1.94 1.54
0.75 0.44
0.06 0.02
0.74 0.17
0.40 0.24
0.70 0.36
1.30 1.58
Textiles 0.00 0.12 0.01 0.17 0.10 0.16 0.04 Other manufactures 0.40 0.19 0.03 0.40 0.06 0.16 0.08 Total non-oil export as % of Total exports
7.00
4.00
2.60
2.40
1.80
2.30
4.50
Source: Central Bank of Nigeria (2000).
Method of Analysis
Conceptual Framework
The conventional way of specifying the export demand function is in the form of a multiplicative or constant elasticity function of relative prices measured in a common currency and foreign income, as follows (Thirlwall, 1999).
NOXt = (RP)ɳ WtΣ……….(11)
Where: NOXt = value of exports in time t; RP = Pdt/Pft Pft = the foreign price in time t; Pdt= is the domestic price in time t; Wt = foreign income (Gross Domestic Product of the world) in time t ɳ = Price elasticity of demand for exports (<0)

10
Σ = Income elasticity of world demand for non-oil export (>0) The outward oriented hypothesis sees export as being foreign demand dependent and not supply constrained. The model is thus expected to estimate the determinants of world demand for Nigerian exports. Many less developed countries (LDCs) import demand functions have had to include a foreign exchange component, because it is scarce in the LDCs it has become an important determinant of their ability to import goods and services from the developed economies (Komolafe, 1995, Jerom, and Adenikinju, 1995, Uwatt, 1997). Since the bulk of Nigeria’s exports end up in Europe and other industrialized economies the exchange rate component is not included in this study. Openness of the Nigerian economy however is a plausible determinant of the world demand for Nigerian exports. Equation (11) may thus be expanded to include the index of openness as follows:
LNOXt = f(LWt, LRPt , LOPENXt,) …….(12) Where: LOPENX= (NOXt + MOXt/GDPt) = is the index of openness. The degree of openness is said to be synonymous with the idea of neutrality in the trade policy. The degree of openness is measured as a ratio of the sum of non-oil export and imports to GDP. The index has also been used as a proxy for outward orientation in trade relations (Greenaway and Sapsford, 1987, Ncube (1994)). NOXt = Value of non-oil export in the current year M OXt = Value of non-oil import in the current year GDPt = Value of the Gross Domestic Product in the current year The larger the index of openness, the higher the degree of openness. The index of openness will be computed for Nigeria in the period 1970 to 1999.
Data and Properties
The study employed time series data of domestic commodity price index, foreign commodity price index, value of non-oil exports (NOX), non-oil imports (NOM), World income or gross domestic products (W), and the index of openness (NOX + NOM / GDP) (OPENX). The relative prices (RP) equal domestic price index divided by foreign price index. The price indices are computed by the Central Bank of Nigeria (CBN) in two stages. First they compute the simple index for its component and next they compute the aggregate index. The aggregate index is a weighted average of the simple price relatives. The missing values in the various time series employed in the study were replaced by the simple average of the two preceding values.

11
The series were found to be of low order autoregressive process. They were also trended. The plot of all the variables in the model (not shown) shows that they do not converge.
Results and Discussions
Tests for Unit Roots
The augmented Dickey Fuller (ADF) test of unit roots was conducted for all the time series (including a deterministic trend), which were used in the study. The ADF results showed that all the variables were non-stationary at their levels. The test results revealed that the series were all integrated series of order I (1). The results of the ADF tests are shown on table 3.
Table 3; Augmented Dickey-Fuller Test Results
S/No. Variables ADF
statistics
at levels
Critical
value @
5%
ADF
statistic
1st
Difference
Critical
value
Order of
integration
1 NOX -2.1080 -3.5796 -3.6099 -2.9798* I(1)
2 W -2.2623 -3.5796 -8.0688 -3.5943 I(1)
3 RP -2.4840 -3.5796 -4.6137 -3.5943 I(1)
4 OPENX -2.4514 -3.5796 -4.5233 -3.5867 I(1) Note: *= without trend
Johansen’s Maximum Likelihood Test Of Cointegration
The cointegration test commenced with a test for the number of cointegrating relations or rank (r) of π using Johansen’s maximal Eigenvalue of the stochastic matrix and the LR test
based on the trace of the stochastic matrix. π is the long-run multiplier matrix of order myxi. my
is the vector of I(1) endogenous variables in the model, while xi is the number of exogenous variables including the intercept term. In this case the π matrix is the product of two matrices α
and β, that is π = αβ. Let Yi denote an n x 1 vector of I (1) variables, the rank of π, which is r,
determines how many linear combinations of Yi are stationary. If r = n, the variables in the

12
levels are stationary; if r = 0 such that π = 0, none of the linear combinations are stationary. We
can factor π; that is π = αβ. Both α and β are n x r matrices, and β contains the co-integration
vectors (the error-correcting mechanism in the system), and α the adjustment parameters. The Johansen’s methodology provides a number of tests and restrictions on α β vectors (Asche et. al.,
1999), which help to decipher the long run characteristics of the integrated variables in the model. The study employed the Johansen’s test of co-integration and analysis of structural characteristics of the integrated stochastic variables in the error correction vector to delineate the long run characteristics of the world’s demand for Nigeria’s non-oil exports.
Since the time series are integrated, the next most logical procedure is to test for cointegration among the series. The test statistics and choice criteria for selecting the order of the VAR model resulted in the choice of VAR= 2 by log likelihood criterion. The Johansen procedure generates LR test results based on the Maximal Eigenvalue of the stochastic matrix and the Trace of the stochastic matrix. The two log likelihood ratio tests rejected the null hypothesis that there is no cointegration among the integrated series. Specifically, the LR test based on both the maximal Eigenvalue of the stochastic matrix and the trace of the stochastic matrix rejected the null hypothesis that r = 0 and selected the hypothesis that r< = 1. For this study r<=1 was therefore employed. The result suggests that the variables have an equilibrium condition which keeps them in proportion to each other in the long run. The LR results are shown on table 4. Table 4: LR Tests Based On Maximal Eigenvalue Of The Stochastic Matrix And The Trace Of The Stochastic Matrix LR Test Based On Maximum Eigenvalue Of The Stochastic Matrix
HO: LR STATISTIC CRITICAL VALUE S AT
95%
r = 0 27.26 31.79
r< = 1 20.61 25.42
r< = 2 14.74 19.22
r< = 3 4.54 12.29
LR Test Based On Trace Of The Stochastic Matrix

13
HO: LR STATISTIC CRITICAL VALUES AT 95%
r = 0 67.15 63.00
r< = 1 39.89 42.34
r< = 2 19.28 25.77
r< = 3 4.54 12.39
LIST OF EIGENVALUES IN DESCENDING ORDER
0.6223 0.5210 0.4092 0.1496 0.000
Source: Computed from data
Estimated Co-integrated Vectors In Johansen Estimation (Normalized And Unnormalized)
Having identified co-integration among the series, we proceed to analyze the long run structural characteristics of the co-integrated variables. This was done by imposing one normalizing restriction on the integrated series. For this study we normalized on LNOX. The unrestricted and restricted estimates of the Johansen’s maximal likelihood (ML) estimates subject to exactly identifying restrictions are shown on table 5. TABLE 5: ESTIMATED COINTEGRATED VECTORS IN JOHANSEN ESTIMATION
Variable Unrestricted
(Unnormalizesd) Estimates
Exactly Identified
(Normalized ) Estimates
LNOX 0.1638 1.000
LRP 0.0513 0.313(3.35)
LW 0.3980 2.429(6.01)
LOPENX 0.8438 5.1501(13.16)
Trend 0.0646 0.3945(0.93) Note: 1. Cointegration with unrestricted intercepts and restricted trends in the VAR.
2. Standard Errors are in brackets.
The unnormalized estimates provide no economic explanation or the long run behaviour of variables in the model. The imposition of one normalization restriction on the cointegration vector exactly identifies the system giving an insight into the long run structural behaviour of the

14
system. The results of the normalized estimates in the Johansen procedure show that the parameters of LRP and LW are not statistically significant.
According to Johansen and Juselius (1994), restrictions motivated by economic theory can be used to detect structural relationship in cointegration vectors. Hence we proceeded to impose over identifying restrictions of n-2 zero restrictions and one normalizing restriction on the cointegrating equation. The variables of particular interest in this analysis are LRP and LW. The system converged to equilibrium after two iterations. The resulting estimates are long run elasticities.
The results of the over identifying restrictions on the cointegrating vector shows that the long run price elasticity of demand for Nigerian non-oil exports (estimate of LRP) is 1.8623. The coefficient is positive and greater than one contrary to a priori expectations. It is also highly significant at the 1% level. This result suggests that the global demand for Nigeria’s non-oil export merchandise is price elastic. The implication of this is that an upward variation in the relative price of non-oil exports would likely lead to a more than proportionate decrease in the demand for Nigerian non-oil exports. A decrease in price on the other hand would possibly cause a more than proportionate increase in demand. This finding does not corroborate the arguments and assumptions of previous write-ups on this issue as discussed earlier in this paper.
The estimate of the long run world income (LW) elasticity of demand for Nigeria’s non-oil export merchandise was -0.0698. It is negative and less than one contrary to a priori expectations. The implication is that as world income increases demand for Nigeria’s non-oil export merchandise declines. The results suggest that Nigeria’s non-oil exports products mix are “inferior goods”, such that as world income rises the world demand for the goods shift to some other preferred goods. If we take the absolute value of the long run world income (LW) elasticity of demand for Nigeria’s non-oil export merchandise, that is, 0.0698, is very close to zero. The implication is that increase in world income would not have any appreciable impact on the volume and the value of Nigeria’s non-oil merchandise export and if this is combined with a price increase then the non-oil export would fall considerably. This estimate of long run elasticity corroborates the arguments of the centre-periphery models, particularly those of Myrdal and Prebisch. The results are reported on table 6.

15
TABLE 6: THE ML ESTIMATES SUBJECT TO OVER IDENTIFYING RESTRICTIONS
Variables Over Identified
Estimates
LNOX 1.000
LRP 1.862(0.182)*
LW -0.0698(0.033)*
LOPENX -0.000
Trend -0.000
LR test of Restrictions CHSQ (2) =6.475 (0.039)**
LL subject to exactly identifying restrictions = -17.237
LL subject to over identifying restrictions = -20.475 NOTES: 1. Cointegration with unrestricted intercepts and restricted trends in the VAR. 2. *Standard Errors are in brackets. 3. ** Probability in bracket.
Test For Weak Exogeneity
Since it has been determined in this study that there is only one stochastic trend in the system it is necessary to investigate the extent to which the trend might be caused by any of the integrated series in the model. The factor loading matrix, α, contains information about the dynamic adjustment of the long-run relationships. The test involves a test of the hypothesis that the matrix α, that is, the speed of adjustment coefficients are equal to zero. The results are shown on table 7. It is clear from the results that the null hypothesis of weak exogeneity is rejected for LNOX, LW and LOPENX. This suggests that given the Nigerian data, none of the series but LRP, can be said to have enough influence to drive the global demand for Nigeria’s non-oil exports in the long run. The domestic price relative to the foreign price, which is not statistically significant at the 5% level, could be said to drive the global demand for Nigeria’s non-oil exports in the long run. It would therefore be in order to condition on the relative price without loss of information.
The implication of this result is that domestic prices relative to foreign prices must become more competitive in the international market to encourage demand for non-oil exports.

16
This means that efforts must be made to lower cost of production by focusing on those elements that push the domestic prices up above the foreign prices, such as, interest rates, foreign exchange rate, cost of imported inputs, cost of energy and provision of appropriate infrastructure and creation of policy environment conducive for investment.
Table 7: Results Of Tests On Weak Exogeneity
Variable HO: LR Statistic chi. Sq
(1)
Probability
LNOX α1 = 0 8.9730 0.00
LW α2 = 0 4.8594 0.03
LRP α3 = 0 2.9005 0.09
LOPENX α4 = 0 4.4824 0.03
Note: Maximum level of significance for rejection oh null hypothesis is 5%.
Test of Linearity/Exclusion
The test of linear restrictions examines whether the estimates of β coefficients, which contain the co- integration vector, that is, the error correcting mechanism in the system, are statistically significant. It is a test of the estimates of the cointegrated vectors in the Johansen estimation. The results are shown on table 8. The results show that LW and LOPENX are statistically significant. This suggests that world income which is a primary determinant (stimulus for) of demand for Nigeria’s non-oil export merchandize is significant in explaining the behaviour of demand for non-oil exports. As shown earlier its effect is negative and contrary to the a priori expectation. The index of openness is significant in explaining the behaviour of demand for Nigeria’s non-oil exports in the long run. The implication of this finding is that effort at expanding non-oil exports need to be re-evaluated and refocused in such a way as to maximize the gains of participating in the global market place. A non-oil product mix with a wider acceptation must be presented to the global market place. Nigeria has to “look inward” as a primary step towards “going outward”. The capacity to produce non- oil exports need to be developed further. There is a need to produce goods that correspond with global tastes and preferences. The relative price was however not significant.

17
Table 8: Test for Linearity/Exclusion.
Variables HO LR Statistic chi-sq
(1)
Probability
LNOX β 1 = 0 0.1684 0.682
LW β 2 = 0 5.9144 0.015
LRP β 3 = 0 0.0059 0.939
LOPENX β 4 = 0 6.2687 0.012
Note: βi are estimates of the restricted cointegrated vector
Diagnostic Tests
A number of diagnostic tests were conducted to investigate the characteristics of the residuals. The Langrangian Multiplier test, both LM and F versions of the test on residual serial correlation suggest that an absence of residual serial correlation. The results of the Ramsey’s RESET test using the square of the fitted values to test for the appropriateness of the functional form of the model show that the model is appropriately specified. The null hypothesis was rejected for both the LM and F version. The Jarque-Bera statistic of 0.688 with probability of 0.709 supports the normality of the model. The test for the presence of heteroscedasticity based on the regression of the squared residuals on fitted values reject the presence of heteroscedasticity in the model. The diagnostic test results are shown on table 9.

18
Table 9: Diagnostic Tests
Statistic LM version - Chi sq. F version
Serial Correlation test 0.098(0.76) 0.074 (0.79)
Ramsey’s RESET test 2.584 (0.11) 2.135 (0.16)
Normality test 0.688 (0.709) Not applicable
Heteroscedasticity 1.474 (0.23) 1.444 (0.24)
Stability Tests on the Recursive Residuals
Stability tests were also conducted and the results are shown in figures 3 and 4. One of the assumptions of the OLS is that the coefficient of the independent variables remains constant throughout the sample period. The cumulative sum (CUSUM) and the cumulative sum of squares (CUSUMSQ) of the recursive residuals show that the model was stable as the plots of the CUSUM and CUSUMSQ fluctuated within the two standard error bands. This further strengthens the results of the Ramsey’s RESET test that the model is appropriately specified.

19
Figure 3: The CUSUM test on Recursive Residuals
Plot of Cumulative Sum of RecursiveResiduals
The straight lines represent critical bounds at 5% significance level
-5
-10
-15
0
5
10
15
1972 1977 1982 1987 1992 1997 1999
Figure 4: The CUSUMSQ test on Recursive Residuals
Plot of Cumulative Sum of Squares ofRecursive Residuals
The straight lines represent critical bounds at 5% significance level
-0.5
0.0
0.5
1.0
1.5
1972 1977 1982 1987 1992 1997 1999

20
Policy Implications and Conclutions
Thirlwall (1999) identified the incentives for all export - oriented economies as: exemptions from duties and tariffs on inputs that go into exports, investment grants, tax holidays, favourable retention rights over foreign exchange if exporters are in certain sectors, and favourable treatment of foreign investment. These underlined the economic policy environment that resulted in the so-called “East Asian Miracle”. An examination of the macroeconomic policies (Okoh, 2004) of the Nigerian economy will reveal that these policies have been pursued at one time period or another between 1960 and 2004. The Nigerian economy is yet to experience her miracle. Will the miracle ever occur with the current product mix? The East Asian countries, Japan, South Korea, Taiwan, Singapore, Hong Kong, Malaysia, Indonesia, Thailand and China (not yet a member of) WTO employed different levels of laissez faire and protectionism but focused on “efficient resource allocation and “high rates of physical and human capital formation”. All of these were carried out under “good governance”.
Nigeria could learn from these success stories. There is a need to re-evaluate the current non-oil product mix with a view to going into production of raw materials and physical capital inputs and other manufactures, the demand for which are more income and price elastic. Our results reveal that the current product mix will not attract a reasonable share of the global market. Greater openness will not enhance exports because the goods are basically primary commodities, which have high price elasticity and low and negative income elasticity as the study shows. This leads to constrained non-oil expors growth, corroborating the assertions of the centre-periphery theory (Myrdal, 1963). The results of this study show that the focus of macro economic policy for stimulating the growth of non-oil export in contemporary times needs of necessity to focus on marketing policy tools. Marketing must be viewed from a holistic perspective to encompass product research, product development, public awareness of products and strategies for strengthening the link between producers and consumers, between and among producers of export goods and producers of inputs and researchers.
The achievement of enhanced non-oil merchandise export will involve investment in Research and Development. Research and development occupy a pride of place in solving the problem of sluggish development of the non-oil export sub sector. It is a slow process that may not attract much of private sector participation and hence requires that it be treated as top priority at this point in time by the government. Also the absence or the near absence of effective linkage between existing research institutes, universities and the final users of their research outputs is an important link that must be addressed if the diffusion of research and development outputs to the
21
final users must exist and the benefits of the research and development outputs fully appropriated.
The results of our study have implication for international trade polices in Nigeria and Africa in general. Many economists call for greater openness to achieve increase in non-oil merchandize growth (Obadan (2003), Ogunkola, 2003, Ogunkola and Oyejide (2001) to mention a few). The findings of this study reveal that it is necessary for Nigeria and other African countries to develop their production bases and their capacity to export non-oil merchandise before adopting policies that are meant to perform effectively under conditions of well-established production and export structures. Nigeria and other African countries cannot fully reap the benefits of global integration until the basic prerequisites for industrialization and modernization of their productive bases have been properly established. The problem of the Nigerian non-oil sub-sector is that of absence of innovation in product development.
The foregoing discussion clearly shows that the present product mix of non-oil merchandise export have low demand elasticity of income but high price elasticity of demand, such that prices rise and fall in response to the highly volatile global commodity market prices. In other words a sharp increase in price may lead to sharp decline in demand. On the other hand, when income increases demand will not increase appreciably. The goods seem to exhibit characteristics of abnormal goods. The present product mix cannot “go far” in the global market place. It will not lead to the desired diversification of the Nigerian economy.
Nigeria needs to be committed to development of efficient technology. It will involve some level of sacrifice on the part of Nigerians and their political leaders. We would have to sacrifice current consumption for expected increase in future consumption levels. There seem to be a dearth of innovation. This must be sought vigorously.

22
REFERENCES Asche, F., Bremnes, H. and Wessels, C.R. 1999, Product Aggregation, Market Integration, and Relationship between prices: An Application to World Salmon Markets. American Journal of Agricultural Economics 81(August 1999) 568 – 581. Brahmbhatt, M., and Dadush, U., (1996). Disparities in Global Integration, Finance and Development, September. Central Bank of Nigeria, (2000), The Structure of the Nigerian Economy and Implications of Development. Ream Communications Ltd. Lagos. Pp 198 – 199. Ekpo, A. H. and F. O. Egwaikhide, (1994), Export and Economic Growth: A Reconsideration of the Evidence. Journal of Economic Management. 2: 1: 57 –73. Fajana, O. (1979), Trade and Growth: the Nigerian Experience. World Development. 7 (1): 73-78. Food and Agriculture Organization (FAO) (2004); FAOSTAT http://www.fao.org.
Greenaway, D and Sapsford, D., (1987), Fiscal Dependence on Trade Taxes: A further Econometric Investigation. Public Finance 42 : 309 - 319.
Hoekmann,B.M. (1995), Trade Laws and Institutions. Good Practices and the World Trade Organization. World Bank Discussion Papers No. 282.
Iyoha, M.A 1995, Traditional and Contemporary Theories of External Trade. In: External Trade and Economic Development in Nigeria. Selected Papers for the 1995 Nigerian Economic Society (NES) Annual Conference Proceedings. Pp1 – 23. Jebuni, C. D., and Wangwe, S. M. (2000); Development Policy Option for Africa in the Context of the World Trade Organization (WTO) Agreements. Collaborative Research Project, WTO Framework Papers, http:/www.aercafrica.org Jerome, L. N., and Adenikinju, A. F., (1995), Trade Policies and the Promotion Of Manufactured Exports in Nigeria. Nigerian Economic Society, Conference, Ibadan, Nigeria. Pp. 1-18. Kaldor, N. (1970), The Case of Regional Policies. Scottish Journal of Political Economy, November. Komolafe, O., (1995), Modeling Import Demand Under Quantitative Trade Restrictions: An Application to Nigerian Data. Journal of Economic Management. 2(1): 55-78. Langley, K. M. (1968), The External Reserve Factor In Nigerian Economic Development. The Journal Of Economic And Social Studies 10:151.

23
Myrdal, G. (1963), Economic Theory and Underdeveloped Regions. Duckworth, London. Ncube, M. (1994), The Dynamic of Trade and Economic Relations in Southern Africa. Current Status and Options for the Future. In: Economic Policy Experience in Africa: What have we learnt? (eds.) Atsain, A. Wangwe , S. and Drabek, AG African Economic Research Consortium, Nairobi, Kenya. Obadan, M. I., (2003), Globalization and Economic Management in Africa. A paper presented at the 44th Annual Conference of the Nigerian Economic Society, in Ibadan, Nigeria. Pp. 1 - 32. Ogun, O. (1995); Export Boom Regimes and External Debt Accumulation: Lessons from Nigeria’s Development Experience. Journal of Economic Management 2(1): 37 – 54. Ogunkola, E.O and T.A.Oyejide, (2001), Market Access for Nigeria’s Exports in the European Union: An assessment of impact of the Lome Convention and Uruguay Round. The Nigerian Journal of Economic and Social Studies. 43(1): 15-46. Ogunkola, E. O., (2003), Agriculture and the WTO: Economic Interests and options for Nigeria in: Ingco, M. D., Nash, J. D., and Njinkeu D., (2003), Eds. Liberalizing Agricultural Trade: Issues and Options for Sub-Saharan Africa in the World Trade Organization (WTO). Pp. 137-182. Okoh, R. N., (2004a) Global Integration and the Growth of Nigeria’s Non-oil Exports. A paper presented at the Centre for the Study of African Economies, African Conference 2004, on Growth, Poverty Reduction and Human Development in Africa, 21st to 22nd March 2004, Oxford, UK. Pp. 1 - 30. Okoh, R. N. (2004b); Overview of the Nigerian Economy and Its Management. A paper presented during the DPRS Director’s Conference held at NCEMA, Ibadan, 21st – 25th June, 2004. Okoh, R. N. and Egbon, P. C., (1999); A New World Trade Organisation (WTO); Implication for Agribusiness in Africa in the Next Century. In: Egbon, P. C. and C. O. Orubu. (Eds) Critical Issues in Nigeria’s Development.. Pp. 1-12. Oladipo, O. S., (1998): Trade Liberalization and Economic Growth. Ife Social Science Review, 15 (1): 80. Olomola, P. A. (1998); Openness and Long-run Economic Growth in Nigeria (1960 - 98). Journal of Economic Management. 5: (1): 39 - 62. Pesaran M. H. and B. Pesaran, 1997. Working with Microfit 4.0: Interactive Econometric Analysis. Oxford University Press. Oxford. Pp. 227 - 297, 437 - 445. Prebisch, R. (1950), The Economic Development of Latin America and its Principal Problems. ECLA, UN Department of Economic Affairs, New York, USA.

24
Seers, D., (1962), A Model of Comparative Rates of Growth of the World Economy, Economic Journal, March. Thirlwall, (1999), Growth and Development. 6th Edition Macmillan Press, London, UK. Pp 419 - 459. World Trade Organisation (WTO) 2003, International statistics http:// www.wto.org/english/res_e/statis_e/its2003_e/its03_longterm_e.htm, Geneva Switzerland. Table iv09. Yusuf S., (2000): Globalization and the Challenge for Developing Countries. A paper presented at the AERC Bi-annual Workshop Plenary. May 2000 at Nairobi, Kenya, Pp. 1-44. Uwatt, B. U., (1997), Import Demand in Nigeria: A Re-examination of the Evidence. The Nigerian Economic and Financial Review. 2(December):65-86.