The Global Economy, Rising Risk and Marine Insurance Markets Risk and Reward in a Troubled World San...
85
The Global Economy, Rising Risk and Marine Insurance Markets Risk and Reward in a Troubled World San Francisco Board of Marine Underwriters San Francisco, CA May 3, 2012 Download at www.iii.org/presentations Robert P. Hartwig, Ph.D., CPCU, President & Economist Insurance Information Institute 110 William Street New York, NY 10038 Tel: 212.346.5520 Cell: 917.453.1885 [email protected]
-
Upload
gertrude-vanessa-douglas -
Category
Documents
-
view
214 -
download
0
Transcript of The Global Economy, Rising Risk and Marine Insurance Markets Risk and Reward in a Troubled World San...

The Global Economy, Rising Risk and Marine Insurance Markets
Risk and Reward in a Troubled WorldSan Francisco Board of Marine Underwriters
San Francisco, CAMay 3, 2012
Download at www.iii.org/presentationsRobert P. Hartwig, Ph.D., CPCU, President & Economist
Insurance Information Institute 110 William Street New York, NY 10038Tel: 212.346.5520 Cell: 917.453.1885 [email protected] www.iii.org
2
Presentation Outline
Global Economic Overview & Outlook International Overview Emerging vs. Developing Markets Global Trade Volume Forecasts: Imports/Exports
US Economy Overview & Outlook GDP Outlook Drivers of P/C Insurance Exposures Marine Drivers Presidential Politics and P/C Profitability
The Unfortunate Nexus of Opportunity, Risk and Uncertainty The Fusion of Economic and (Geo)Political Risk Top 10 Risks for the Global Economy
Global Catastrophe Loss Trends and Threats Was 2011 an Aberration or a Foreshadowing of the Future
US P/C Insurance Industry Financial Overview & Outlook

Global Economic Outlook: Regional and Major Economy
Perspectives
3
Strength of Economies Varies Greatly as Does Pace of Recovery from the
Economic Challenges Important Consequences for Insurer and
Reinsurer Growth Opportunities3

4
Real GDP Growth Forecasts: Major Economies: 2011 – 2013F
Sources: Blue Chip Economic Indicators (4/2012 issue); Insurance Information Institute.
1.7%
0.7% 1.
5%
3.1%
2.3%
0.6%
0.6%
8.4%
1.8%
2.6%
1.7%
0.9% 1.
7%
8.5%
1.7%
9.2%
-0.7%-0.5%-2%
0%
2%
4%
6%
8%
10%
US UK Euro Area Germany China Japan
2011 2012F 2013F
Growth Prospects Vary Widely by Region: Brightening in the US, Mild Recession in the Eurozone, A “Soft Landing” in China, Strength in
India, Reconstruction Stimulus in Japan and Modest Growth in America’s Largest Trading Partners—Canada and Mexico.
The Eurozone and UK are in
recession. Both should
end in Q3:2012
China growth has slowed, but remains strong in an expected “soft landing”
scenario
US recovery
continues
Rebuilding acts as a
stimulus to Japanese economy

5
Real GDP Growth Forecasts: Emerging Market Regions: 2010 – 2013F
*Excludes Libya in 2011. **Indonesia, Malaysia, Thailand, Philippines and VietnamSources: IMF World Economic Outlook (April 2012 ); Insurance Information Institute.
5.3%
10.6
%
4.9%
4.5%
4.3%
7.0%
5.3%
3.9%
7.2%
3.5%
5.3%
5.1%
3.5%
6.9%
1.9%
4.0%
5.4%
5.4%
4.1%
7.3%
3.7%
2.9% 3.
9%
6.2%
5.3%
4.3% 4.5%
4.2%
0%
2%
4%
6%
8%
10%
12%
WorldOutput
India MiddleEast &NorthAfrica*
Central &EasternEurope
Russia ASEAN-5** Sub-Saharan
Africa
2010 2011 2012F 2013F
Growth Prospects Vary Widely by Region: All Regions Slowed in 2011 As Economic Recovery Encountered Many Challenges. IMF Outlook for
2012 Is Mixed With Broader, More Robust Growth in 2013 Predicted. Actual Growth in 2012 Could Surprise to the Upside.

(4.0)
(2.0)
0.0
2.0
4.0
6.0
8.0
10.0
70
71
72
73
74
75
76
77
78
79
80
81
82
83
84
85
86
87
88
89
90
91
92
93
94
95
96
97
98
99
00
01
02
03
04
05
06
07
08
09
10
11
12
F1
3F
Advanced economies Emerging and developing economies World
Source: International Monetary Fund, World Economic Outlook Update, Apr. 2012; Ins. Info. Institute.
Emerging economies (led by China) are expected to grow by 5.7% in 2012 and
6.0% in 2013.
GDP Growth: Advanced & Emerging Economies vs. World, 1970-2013F
Advanced economies are expected to grow at a sluggish pace of 1.4% in
2012 and 2.0% in 2013.
World output is forecast to grow by 3.5% in 2012 and 4.1% in 2013. The world economy shrank by 0.6% in
2009 amid the global financial crisis
GDP Growth (%)
7
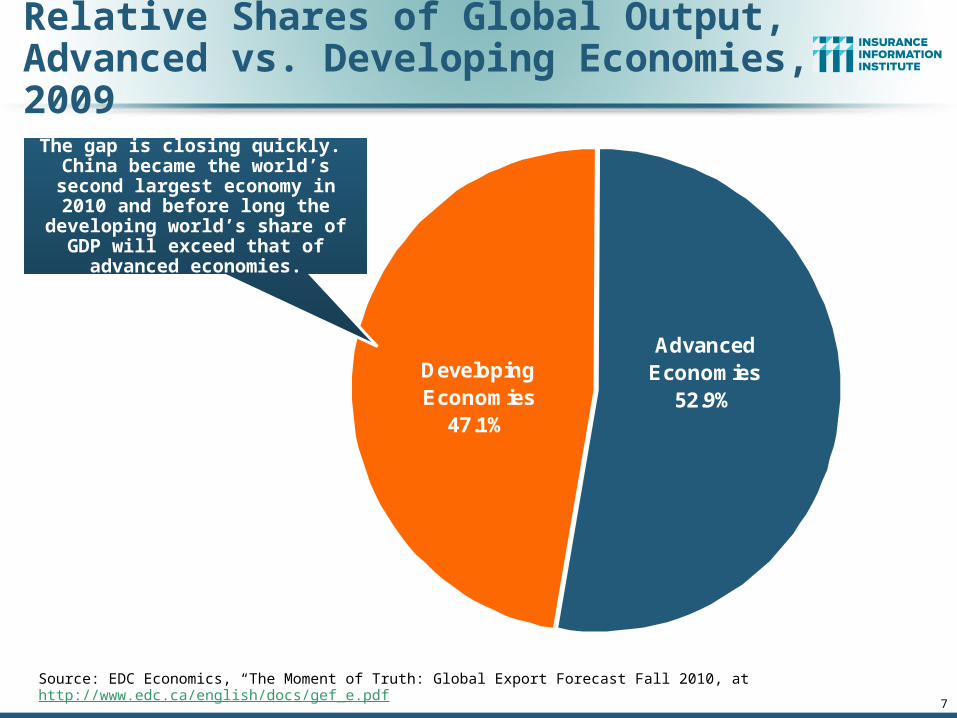
Relative Shares of Global Output,Advanced vs. Developing Economies, 2009
Developing Economies
47.1%
Advanced Economies
52.9%
Source: EDC Economics, “The Moment of Truth: Global Export Forecast Fall 2010, at http://www.edc.ca/english/docs/gef_e.pdf
The gap is closing quickly. China became the world’s second largest economy in 2010 and before long
the developing world’s share of GDP will exceed that of advanced
economies.

8
Current Real GDP Growth vs. Pre-Crisis Average (2000-2007 vs. 2011F-2012F*)
*Percentage point difference between compound annual rates of change 2000-2007 vs. forecasts for 2011-2012.
Source: IMF, World Economic Outlook, September 2011; Insurance Information Institute.
Latin and South American markets are
in general growing more strongly than prior to the crisis
The US, Europe and Eurasia have seen
significant slowdowns
Parts of the Middle East and South Asia
have done well

9
Current Real GDP Growth vs. Pre-Crisis Average (2000-2007 vs. 2011F-2012F*)
*Percentage point difference between compound annual rates of change 2000-2007 vs. forecasts for 2011-2012.
Source: IMF, World Economic Outlook, September 2011; Insurance Information Institute.
Growth in much of Europe today is about 2 pts.
Lower than pre-crisis

10
World Trade Volume:2010—2013F
Growth in World Trade Volume (Imports + Exports) Has Slowed But Continues to Grow
Percentage Change (%)
12.9%
5.8%
4.0%
5.6%
0%
2%
4%
6%
8%
10%
12%
14%
2010 2011 2012F 2013F
After decelerating in 2011 and 2012, global trade
growth is expected accelerate in 2013
Sources: IMF World Economic Outlook (April 2012 ); Insurance Information Institute.
11
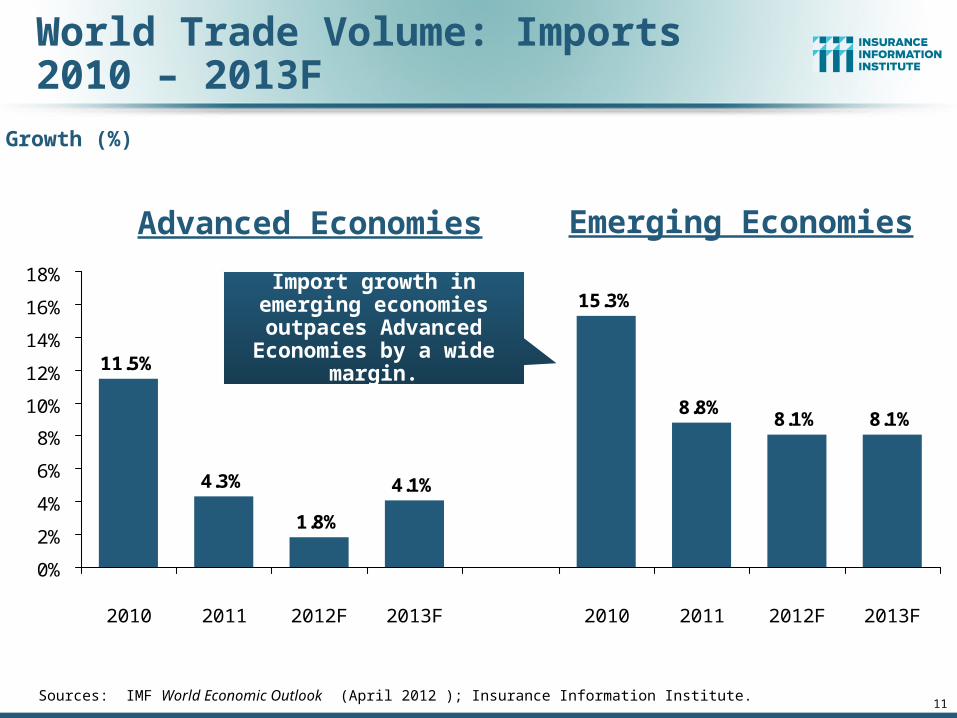
World Trade Volume: Imports2010 – 2013F
8.8%8.1% 8.1%
11.5%
4.3%
1.8%
4.1%
15.3%
0%
2%
4%
6%
8%
10%
12%
14%
16%
18%
2010 2011 2012F 2013F 2010 2011 2012F 2013F
Growth (%)
Import growth in emerging economies outpaces
Advanced Economies by a wide margin.
Advanced Economies Emerging Economies
Sources: IMF World Economic Outlook (April 2012 ); Insurance Information Institute.
12
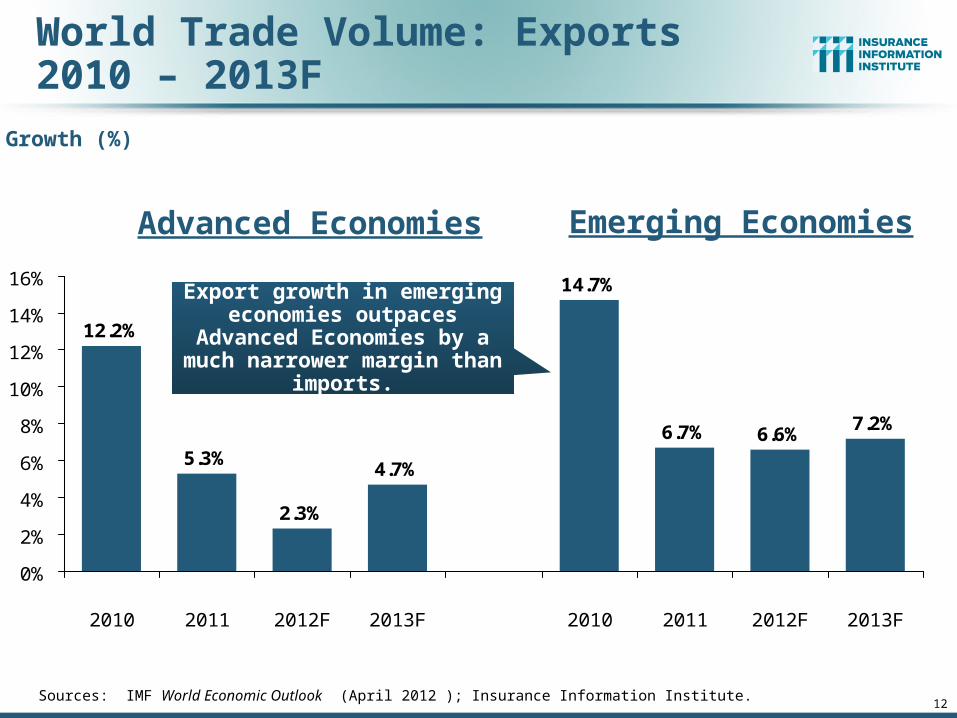
World Trade Volume: Exports2010 – 2013F
6.7% 6.6%7.2%
12.2%
5.3%
2.3%
4.7%
14.7%
0%
2%
4%
6%
8%
10%
12%
14%
16%
2010 2011 2012F 2013F 2010 2011 2012F 2013F
Growth (%)
Export growth in emerging economies outpaces Advanced Economies by a much narrower
margin than imports.
Advanced Economies Emerging Economies
Sources: IMF World Economic Outlook (April 2012 ); Insurance Information Institute.
The Strength of the Economy Will Influence P/C Insurer
Growth Opportunities
13
All Lines of Commercial Insurance Will Benefit, Including Marine
13

14
US Real GDP Growth*
* Estimates/Forecasts from Blue Chip Economic Indicators.Source: US Department of Commerce, Blue Economic Indicators 4/12; Insurance Information Institute.
2.7
%0
.9%
3.2
%2
.3%
2.9
%-0
.7%
0.6
%-4
.0%
-6.8
% -4.9
%-0
.7%
1.6
%5
.0%
3.9
%3
.8%
2.5
%2
.3%
0.4
%1
.3%
1.8
% 3.0
%2
.2%
2.3
%2
.4%
2.6
%2
.4%
2.6
%2
.9%
3.0
%4.1
%1
.1%
1.8
%2
.5% 3.6
%3
.1%
-8%
-6%
-4%
-2%
0%
2%
4%
6%
2
00
0
2
00
1
2
00
2
2
00
3
2
00
4
2
00
5
2
00
6
07
:1Q
07
:2Q
07
:3Q
07
:4Q
08
:1Q
08
:2Q
08
:3Q
08
:4Q
09
:1Q
09
:2Q
09
:3Q
09
:4Q
10
:1Q
10
:2Q
10
:3Q
10
:4Q
11
:1Q
11
:2Q
11
:3Q
11
:4Q
12
:1Q
12
:2Q
12
:3Q
12
:4Q
13
:1Q
13
:2Q
13
:3Q
13
:4Q
Demand for Insurance Continues To Be Impacted by Sluggish Economic Conditions, but the Benefits of Even Slow Growth Will Compound and
Gradually Benefit the Economy Broadly
Real GDP Growth (%)
Recession began in Dec. 2007. Economic toll of credit crunch, housing
slump, labor market contraction has been
severe but modest recovery is underway
The Q4:2008 decline was the steepest since the Q1:1982 drop of 6.8%
2012 is expected to see a modest but choppy
acceleration in growth continuing into 2013

74
.4
73
.6
73
.6
72
.2
73
.6 76
67
.8
68
.9
68
.2
67
.7 71
.6 74
.5
74
.2 77
.5
67
.5 69
.8
74
.3
71
.5
63
.7
55
.7 59
.4 60
.9 64
.1
69
.9
75
.0
75
.3
74
.3
40
45
50
55
60
65
70
75
80
Jan
-10
Fe
b-1
0
Ma
r-1
0
Ap
r-1
0
Ma
y-1
0
Jun
-10
Jul-
10
Au
g-1
0
Se
p-1
0
Oct
-10
No
v-1
0
De
c-1
0
Jan
-11
Fe
b-1
1
Ma
r-1
1
Ap
r-1
1
Ma
y-1
1
Jun
-11
Jul-
11
Au
g-1
1
Se
p-1
1
Oct
-11
No
v-1
1
De
c-1
1
Jan
-12
Fe
b-1
2
Ma
r-1
2
Consumer Sentiment Survey (1966 = 100)
January 2010 through March 2012
Consumer confidence has been low for years amid high unemployment, falling home prices and other factors adversely impact
consumers, but improved substantially in late 2011 and early 2012
Source: University of Michigan; Insurance Information Institute
Optimism among consumers is recovering, in part due to an
improving jobs outlook, after plunging amid the debt debate debacle and S&P downgrade
15

16
16.9
16.5
16.1
13.2
10.4
11.6 12
.7
14.5 14
.9
14.7 15
.1
15.4
15.5
15.4
16.9
16.617
.117.5
17.8
17.4
9
10
11
12
13
14
15
16
17
18
19
99 00 01 02 03 04 05 06 07 08 09 10 11 12F 13F 14F 15F 16F 17F 18-22F
(Millions of Units)
Auto/Light Truck Sales, 1999-2022F
Source: U.S. Department of Commerce; Blue Chip Economic Indicators (10/11 and 4/12); Insurance Information Institute.
Car/Light Truck Sales Will Continue to Recover from the 2009 Low Point, Bolstering the Auto Insurer Growth and the Manufacturing Sector.
New auto/light truck sales fell to the lowest level since the late 1960s. Forecast for 2012-13 is
still far below 1999-2007 average of 17 million units, but a recovery is underway.
Job growth and improved credit market conditions will boost auto sales in
2012 and beyond

17
Value of Construction Put in Place, Feb. 2012 vs. Feb. 2011*
-1.4%
-21.9%
-0.7%
5.8%
10.2%
4.6%6.4%
-25%
-20%
-15%
-10%
-5%
0%
5%
10%
15%
TotalConstruction
Total PrivateConstruction
Residential--Private
Non-Residential--
Private
Total PublicConstruction
Residential-Public
Non-Residential--
Public
Overall Construction Activity is Up, But Growth Is Entirely in the Private Sector as State/Local Government Budget Woes Continue
Growth (%)
Private sector construction activity is up in both the residential and nonresidential segments
*seasonally adjustedSource: U.S. Census Bureau, http://www.census.gov/construction/c30/c30index.html ; Insurance Information Institute.
Private: +10.2% Public: -1.4%
Public sector construction activity remains depressed

58
.3
57
.1
60
.4
59
.6
57
.8
55
.3
55
.1
55
.2
55
.3 56
.9 58
.2
58
.5 60
.8
61
.4
59
.7
59
.7
54
.2 55
.8
51
.4 52
.5
52
.5
51
.8
52
.2 53
.1 54
.1
52
.4 53
.4 54
.8
40
45
50
55
60
65
Jan
-10
Fe
b-1
0
Ma
r-1
0
Ap
r-1
0
Ma
y-1
0
Jun
-10
Jul-
10
Au
g-1
0
Se
p-1
0
Oct
-10
No
v-1
0
De
c-1
0
Jan
-11
Fe
b-1
1
Ma
r-1
1
Ap
r-1
1
Ma
y-1
1
Jun
-11
Jul-
11
Au
g-1
1
Se
p-1
1
Oct
-11
No
v-1
1
De
c-1
1
Jan
-12
Fe
b-1
2
Ma
r-1
2
Ap
r-1
2
ISM Manufacturing Index(Values > 50 Indicate Expansion)
January 2010 through April 2012
The manufacturing sector has been expanding and adding jobs. The question is whether this will continue.
Source: Institute for Supply Management at http://www.ism.ws/ismreport/mfgrob.cfm; Insurance Information Institute.
Optimism among manufacturers was
increasing in late 2011 and into early 2012
19

20
$200,000
$300,000
$400,000
$500,000
Dollar Value* of Manufacturers’ Shipments Monthly, Jan. 1992—Mar. 2012
*seasonally adjustedSource: U.S. Census Bureau, Full Report on Manufacturers’ Shipments, Inventories, and Orders, http://www.census.gov/manufacturing/m3/
Monthly shipments are nearly back to peak (in July 2008, 8 months into the recession). Trough in May 2009. Growth from trough to March 2012 was 31%. This
growth leads to gains in many commercial exposures: WC, Commercial Auto, Marine, Property and Various Liability Coverages
The value of Manufacturing Shipments in Mar. 2012 was up 31% to $466B from its May 2009 trough.
Dec. figure is only 3.9% below its previous record high in July 2008.
$ Millions
20

21
Manufacturing Growth for Selected Sectors, 2012 vs. 2011*
12.7%
8.5%6.2%
15.6%
6.6%
10.8%7.1%
9.8%11.4%
31.4%
13.5%
7.2%
0%
5%
10%
15%
20%
25%
30%
35%
All
Ma
nu
fact
uri
ng
Du
rab
le M
fg.
Pri
ma
ryM
eta
ls
Ma
chin
ery
Ele
ctri
cal
Eq
uip
.
Tra
nsp
ort
atio
nE
qu
ip.
No
n-D
ura
ble
Mfg
.
Fo
od
Pro
du
cts
Pe
tro
leu
m &
Co
al
Ch
em
ica
l
Pla
stic
s &
Ru
bb
er
Te
xtile
Pro
du
cts
Manufacturing Is Expanding Across a Wide Range of Sectors that Will Contribute to Growth in Insurable Exposures Including: WC, Commercial
Property, Commercial Auto and Many Liability Coverages
Growth (%)
Manufacturing of durable goods has been
especially strong
*Seasonally adjusted; Date are YTD comparing data through Feb. 2012 to the same period in 2011.Source: U.S. Census Bureau, Full Report on Manufacturers’ Shipments, Inventories, and Orders, http://www.census.gov/manufacturing/m3/
Durables: +11.4% Non-Durables: +8.5%
66%
68%
70%
72%
74%
76%
78%
80%
82%
Mar
01
Jun 0
1
Sep 0
1
Dec 0
1
Mar
02
Jun 0
2
Sep 0
2
Dec 0
2
Mar
03
Jun 0
3
Sep 0
3
Dec 0
3
Mar
04
Jun 0
4
Sep 0
4
Dec 0
4
Mar
05
Jun 0
5
Sep 0
5
Dec 0
5
Mar
06
Jun 0
6
Sep 0
6
Dec 0
6
Mar
07
Jun 0
7
Sep 0
7
Dec 0
7
Mar
08
Jun 0
8
Sep 0
8
Dec 0
8
Mar
09
Jun 0
9
Sep 0
9
Dec 0
9
Mar
10
Jun 1
0
Sep 1
0
Dec 1
0
Mar
11
Jun 1
1
Sep 1
1
Dec 1
1
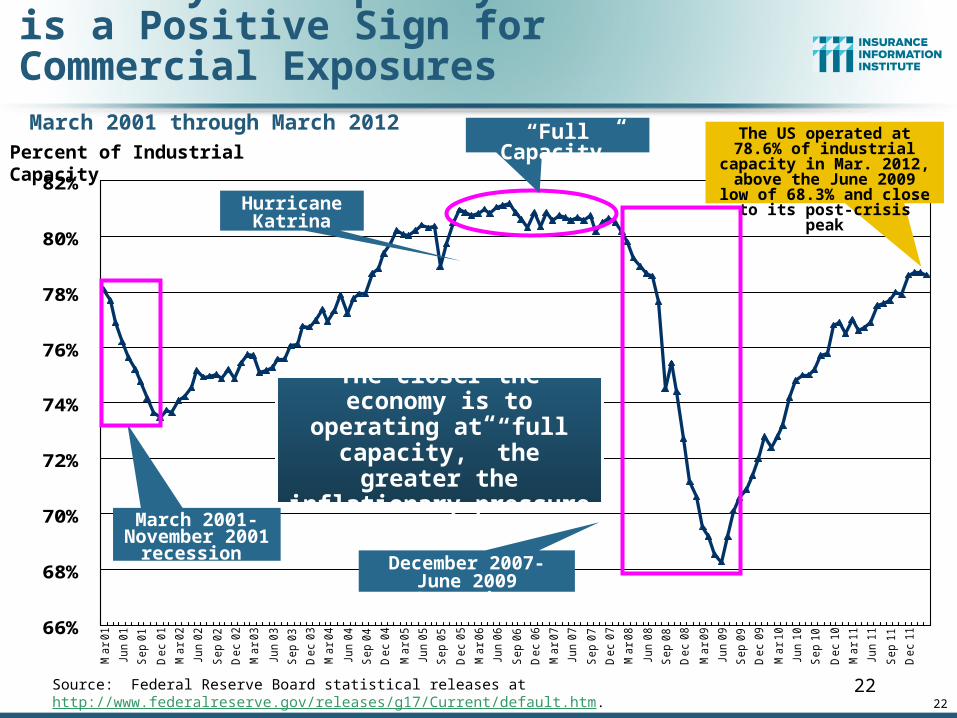
Recovery in Capacity Utilization is a Positive Sign for Commercial Exposures
Source: Federal Reserve Board statistical releases at http://www.federalreserve.gov/releases/g17/Current/default.htm. 22
Percent of Industrial Capacity
Hurricane Katrina
March 2001-November 2001
recession
“Full Capacity”
The closer the economy is to operating at “full
capacity,” the greater the inflationary pressure
The US operated at 78.6% of industrial capacity in Mar. 2012, above the June 2009
low of 68.3% and close to its post-crisis peak
December 2007-June 2009 Recession
March 2001 through March 2012
22

23
Global Industrial Production (2000-Feb. 2012)
Source: IMF, World Economic Outlook, April 2012; Insurance Information Institute.
12
Global industrial production has
been volatile but is growing
25
43,6
9448
,125
69,3
0062
,436
64,0
04 71,2
77 81,2
3582
,446
63,8
5363
,235
64,8
53 71,5
4970
,643
62,3
0452
,374
51,9
5953
,549
54,0
2744
,367
37,8
8435
,472
40,0
9938
,540
35,0
3734
,317
39,2
0119
,695 28
,322
43,5
4660
,837
56,2
8247
,806
0
10,000
20,000
30,000
40,000
50,000
60,000
70,000
80,000
90,000
80 81 82 83 84 85 86 87 88 89 90 91 92 93 94 95 96 97 98 99 00 01 02 03 04 05 06 07 08 09 10 11
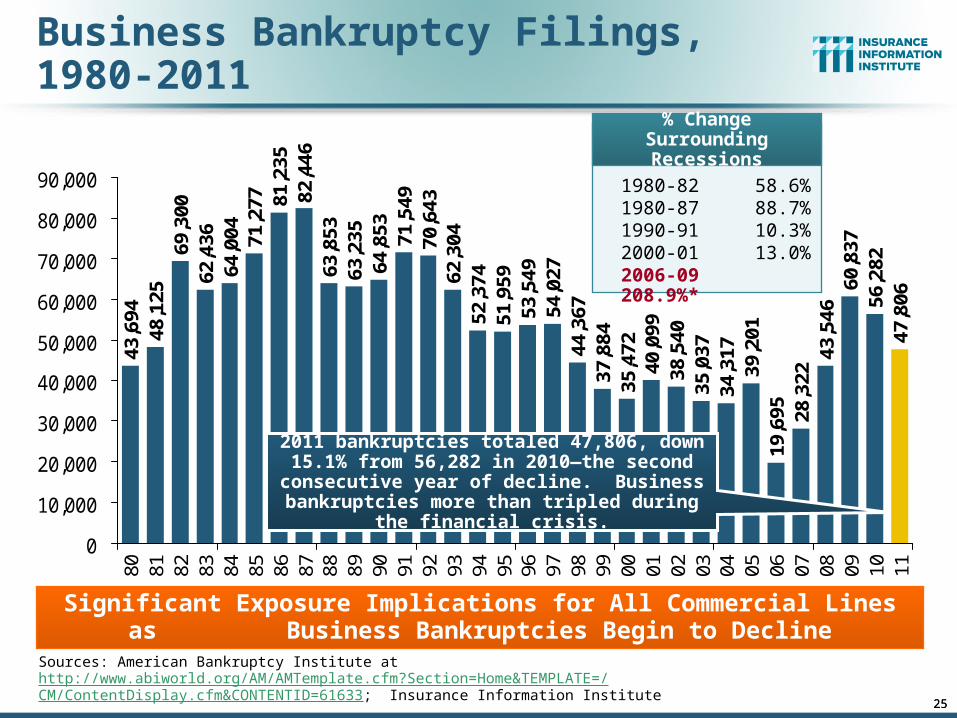
Business Bankruptcy Filings,1980-2011
Sources: American Bankruptcy Institute at http://www.abiworld.org/AM/AMTemplate.cfm?Section=Home&TEMPLATE=/CM/ContentDisplay.cfm&CONTENTID=61633; Insurance Information Institute
Significant Exposure Implications for All Commercial Lines as Business Bankruptcies Begin to Decline
2011 bankruptcies totaled 47,806, down 15.1% from 56,282 in 2010—the second consecutive year of decline. Business bankruptcies more
than tripled during the financial crisis.
% Change Surrounding Recessions
1980-82 58.6%1980-87 88.7%1990-91 10.3%2000-01 13.0%2006-09 208.9%*
25

26
Private Sector Business Starts, 1993:Q2 – 2011:Q3*
175
186
174
180
186
192
188
187 18
918
6 190 19
419
119
9 204
202
195
196
196
206
206
201
192
198
206
206
203
211
205
212
200 20
520
420
419
720
320
920
119
219
219
320
1 204
202
210 21
220
921
6 220 22
322
022
021
022
121
220
421
820
920
720
719
919
1 193
172 17
616
918
417
5 179
188
200
183 18
7 191
203
150
160
170
180
190
200
210
220
230
93 94 95 96 97 98 99 00 01 02 03 04 05 06 07 08 09 10 11
Business Starts Were Down Nearly 20% in the Recession, Holding Back Most Types of Commercial Insurance Exposure, But
Are Recovering Slowly* Data through September 30, 2011 are the latest available as of May 2, 2012; Seasonally adjusted. **Annualized based on data through 9/30.Source: Bureau of Labor Statistics, http://www.bls.gov/news.release/cewbd.t08.htm.
(Thousands)
Business starts were up 3.5% to 561,000 in the first 9 months of 2011 vs. first 9
months 2010. 722,000 new business starts were recorded in 2010, up 3.6% from
697,000 in 2009, which was the slowest year for new business starts since 1993
Business Starts2006: 872,0002007: 843,0002008: 790,0002009: 697,000 2010: 722,000 2011: 748,000**
26

27
12 Industries for the Next 10 Years: Insurance Solutions Needed
Export-Oriented Industries
Health Sciences
Health Care
Energy (Traditional)
Alternative Energy
Petrochemical
Agriculture
Natural Resources
Technology (incl. Biotechnology)
Light Manufacturing
Insourced Manufacturing
Many industries are
poised for growth, though
insurers’ ability to
capitalize on these
industries varies widely
Shipping (Rail, Marine, Trucking)

Global Oil Consumption and Price, 2008 – 2035F
Millions of Barrels per Day Nominal Price/BBL
*Source: US Energy Information Administration; Insurance Information Institute
85
.5
83
.7 86
.0 87
.4 88
.9 90
.3
90
.4
91
.1 92
.5
92
.9
93
.5
94
.3
95
.1 96
.1
97
.1
98
.2 99
.3
10
0.5
10
1.8
10
3.2
10
4.5
10
6.1
10
7.6
10
9.1
11
0.8
92
.0
91
.5
89
.6
$108
.10
$112
.36
$114
.21
$115
.96
$117
.54
$118
.99
$120
.25
$121
.34
$122
.30
$123
.09
$123
.71
$124
.20
$124
.53
$124
.68
$124
.94
$110
.30
$105
.71
$103
.15
$100
.50
$97.
62
$94.
58
$91.
38
$83.
21
$61.
66
$100
.51
$85.
73
$88.
03
$78.
03
80
85
90
95
100
105
110
20
08
20
09
20
10
20
11
20
12
20
13
20
14
20
15
20
16
20
17
20
18
20
19
20
20
20
21
20
22
20
23
20
24
20
25
20
26
20
27
20
28
20
29
20
30
20
31
20
32
20
33
20
34
20
35
0
20
40
60
80
100
120
140
Total Consumption Nominal Price (Light, Low Sulfur Crude)
Oil Will Become Relatively More Expensive Over Time, With Price Increases Outstripping Income Growth in Many Parts of the World
The nominal price of oil is expected to rise by 2.8% per year
on average through 2035
Global oil consumption is expected to rise by 1.1% per
year on average through 2035
29
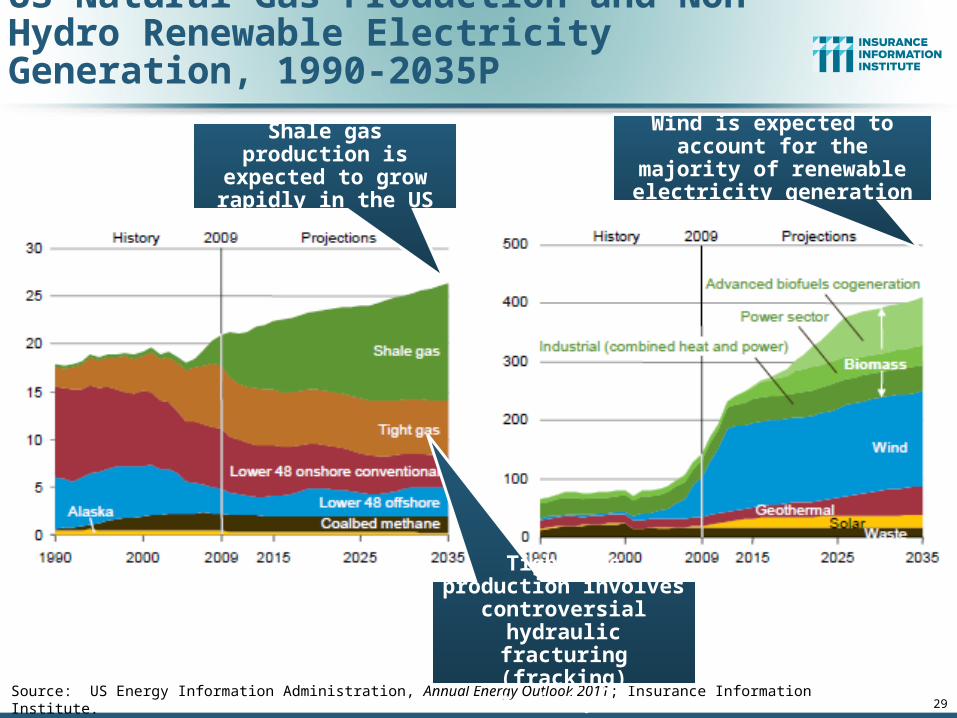
US Natural Gas Production and Non-Hydro Renewable Electricity Generation, 1990-2035P
Source: US Energy Information Administration, Annual Energy Outlook 2011; Insurance Information Institute.
Shale gas production is expected to grow rapidly in the US
Wind is expected to account for the majority of renewable
electricity generation
Tight gas production involves controversial
hydraulic fracturing (fracking) techniques

347.7
472.4508.3
551.5595.7
637.3678.3
462.1
0
100
200
300
400
500
600
700
800
1990 2005 2006 2010P 2015P 2020P 2025P 2030P
World Primary Energy Consumption, 1990-2030P
Source: Energy Information Administration, 2009 International Energy Outlook, Insurance Information Institute.
Between 2006 and 2030, energy consumption in projected to increase
annually by 1.5% worldwide but only 0.5% in the US
Quadrillion BTUs
Global energy consumption is
expected to increase by 33.4% between 2010 and 2030 but by only 12% in
the US

31
Presidential Politics & the P/C Insurance Industry
How Is Profitability Affected by the President’s Political Party?
31
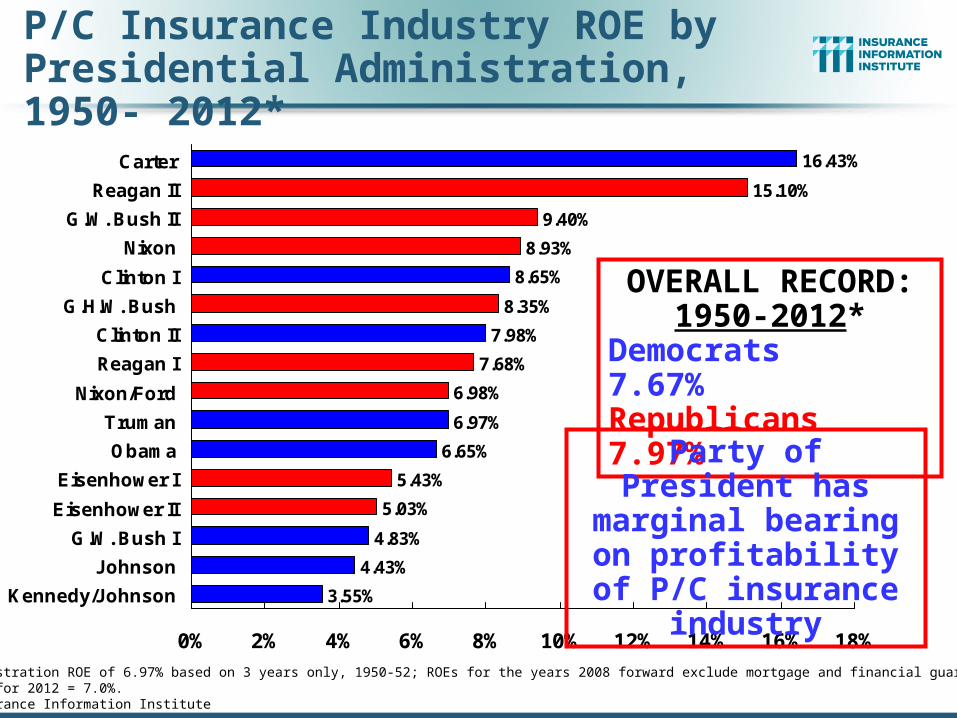
15.10%
9.40%
8.93%
8.65%
8.35%
7.98%
7.68%
6.98%
6.97%
6.65%
5.43%
5.03%
4.83%
4.43%
3.55%
16.43%
0% 2% 4% 6% 8% 10% 12% 14% 16% 18%
Carter
Reagan II
G.W. Bush II
Nixon
Clinton I
G.H.W. Bush
Clinton II
Reagan I
Nixon/Ford
Truman
Obama
Eisenhower I
Eisenhower II
G.W. Bush I
Johnson
Kennedy/Johnson
*Truman administration ROE of 6.97% based on 3 years only, 1950-52; ROEs for the years 2008 forward exclude mortgage and financial guaranty segments.Estimated ROE for 2012 = 7.0%. Source: Insurance Information Institute
OVERALL RECORD: 1950-2012*
Democrats 7.67%Republicans 7.97%
Party of President has marginal bearing on profitability of P/C insurance industry
P/C Insurance Industry ROE by Presidential Administration, 1950- 2012*

-5%
0%
5%
10%
15%
20%
25%
50
52
54
56
58
60
62
64
66
68
70
72
74
76
78
80
82
84
86
88
90
92
94
96
98
00
02
04
06
08
10
12
E
BLUE = Democratic President RED = Republican President
Tru
man Nixon/Ford
Ken
ned
y/
Joh
nso
n
Eis
enh
ow
er
Car
ter
Reagan/Bush I Clinton Bush II
P/C insurance Industry ROE by Presidential Party Affiliation, 1950- 2012*
*ROEs for the years 2008 forward exclude mortgage and financial guaranty segments; Estimated 2012 ROE = 7.0%Source: Insurance Information Institute
Ob
ama

34
Election 2012: Political Issues Impacting Insurers
Presidential Race Is Tight Potential for Senate to Flip Republican Affordable Care Act/Health Care Reform (ObamaCare)
Romney, Republicans generally vow to repeal the Act Complete repeal is unlikely as several popular ACA provisions are already implemented Supreme Court will rule on the constitutionality of the Act in June; Outcome uncertain
Dodd-Frank Act/Financial Services Reform & Implementation Republicans refer to DFA as a “confidence killer” and want it scaled back Outright repeal is highly unlike irrespective of election outcome Systemic criteria have been developed; Designations in late 2012 Financial Stability Oversight Council: Current/future composition impacted by election Changes to DFA and/or implementation will have little impact on P/C insurers
Key Committee Shifts Possible Senate Banking Chair: Tim Johnson (D-SD) Richard Shelby (R-AL) House Finl. Svcs. Chair: Spencer Bachus (R-AL) Jeb Hensarling (R-TX) (term limits)
– If House flipped Chair would go to Maxine Waters (D-CA)
Federal Insurance Office If Romney wins, he will appoint a new Treasury Secretary FIO leadership, agenda and funding could be impacted Secretary Geithner likely to step down after election even if Obama is re-elected
Agent Licensing, NFIP

35
The Unfortunate Nexus: Opportunity, Risk & Instability
Most of the Global Economy’s Future Gains Will be Fraught with Much
Greater Risk and Uncertainty than in the Past

36
Global Real (Inflation Adjusted) NonlifePremium Growth: 1980-2010
Source: Swiss Re, sigma, No. 2/2010.
Nonlife premium growth in emerging markets has
exceeded that of industrialized countries in
27 of the past 31 years, including the entirety of the
global financial crisis..
Real nonlife premium growth is very erratic in part to inflation volatility in emerging markets as
well as a lack of consistent cyclicality
Average: 1980-2010
Industrialized Countries: 3.8%
Emerging Markets: 9.2%
Overall Total: 4.2%

37
Nonlife Real Premium Growth in 2010
Source: Swiss Re, sigma, No. 2/2011.
Latin and South American markets performed
relatively well during and after the global financial crisis in terms of growth
There was also growth in the Middle East, East and South Asia as well as Australia and New
Zealand

38
Nonlife Real Premium Growth Ratesby Region: 2000-2009 and 2010
Source: Swiss Re, sigma, No. 2/2011.
Every emerging
market region except Central
and Eastern Europe
experienced growth during the financial
crisis and into 2010
The Middle East and many emerging market economies continued to grow during the global financial crisis and
continued to benefit from foreign direct investment
39
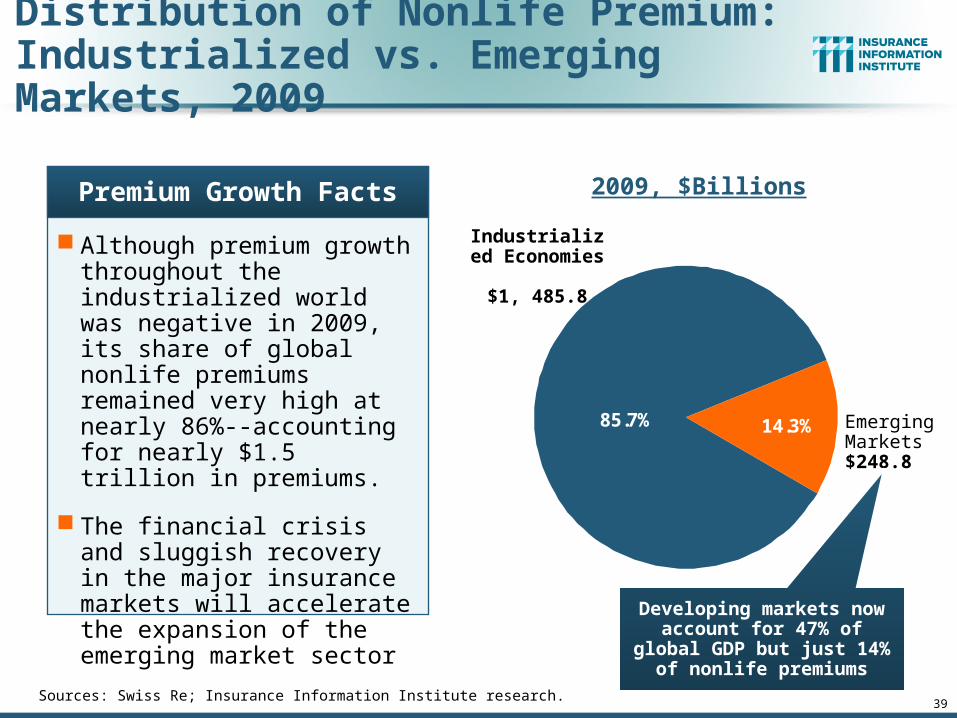
Distribution of Nonlife Premium: Industrialized vs. Emerging Markets, 2009
Sources: Swiss Re; Insurance Information Institute research.
Although premium growth throughout the industrialized world was negative in 2009, its share of global nonlife premiums remained very high at nearly 86%--accounting for nearly $1.5 trillion in premiums.
The financial crisis and sluggish recovery in the major insurance markets will accelerate the expansion of the emerging market sector
Premium Growth Facts
14.3%85.7%
Industrialized Economies
$1, 485.8
Emerging Markets$248.8
2009, $Billions
Developing markets now account for 47% of global
GDP but just 14% of nonlife premiums

40
Political Risk in 2011/12: Greatest Business Opportunities Are Often in Risky Nations
Source: Maplecroft
The fastest growing markets are generally
also among the politically riskiest,
including East and South Asia
Heightened risk has economic and insurance implications
Much of the middle East and North Africa have
experienced and continue to experience
political turmoil

41
The “Arab Spring” Has Increased Uncertainty in an Already Volatile Part of the World
Source: Wikipedia as of Nov. 7, 2011; Insurance Information Institute research.
Some energy-rich nations have been among the most
unstable in 2011/12
Longer-run, significant
investment and insurance
opportunities exist throughout
the region
Government overthrown Sustained civil disorder and governmental changes Protests and governmental changes Major protests Minor protests Protests outside the Arab world
Arab Springالربيع العربي

Country RiskThe risk that country-specific factors could adversely affect an insurer’s
ability to pay its financial obligations
Economic Risk
Macroeconomy
Prospects
Government Finance
Political Risk
Business Environment
Government Stability
Social Stability
Legal System
Financial System Risk
Non-Insurance
Insurance
Banking System
Reporting Standards & Regulation
Sovereign Debt
Government & Legislation
Supervisory Authority
Insurer Accountability
CRT-1Lowest Risk
CRT-5Highest Risk
CRT-3Moderate Risk
Source: A.M. Best.

Country Risk Relates to Insurance Market Development
0.0%
2.0%
4.0%
6.0%
8.0%
10.0%
12.0%
14.0%
Country Risk Score (from lower to higher risk)
Pen
etra
tio
n (
%)
Low Risk High Risk
Source: A.M. Best.
Low risk countries have high insurance
penetration rates and afford fewer
growth opportunities
Higher risk countries have low insurance
penetration rates and often offer more
growth opportunities

45
Summary of 10 Greatest Potential Threats to Global Economy as of May 2012
1. Armed Conflict in the Middle East, Disrupting Oil Markets $200/bbl oil is possible; Severe supply disruptions Resultserious damage to the global economy, killing fragile recovery
2. Rising Oil Prices Even in the absence of armed conflict, oil prices slowing growth Sustained $10/bbl increase -0.2% on global GDP in Year 1; -0.5% Year 2
3. Sovereign Debt Concerns in Europe (was #1 threat in 2011) Contagion spreads beyond GreeceSpain, Italy, Portugal, etc. EU political/economic solution fails resulting in disorderly default Sharp drift to the left in Europe & lose of resolve to address Eurozone problems
4. “Hard Landing” of Chinese Economy A sharp decline in China’s GDP would damage global economies
5. Mega-Catastrophe Trends Continue at Record Pace Catastrophes trimmed 0.5% off global GDP in 2011 Massive disruptions to fragile global supply chains
6. Sudden Weakening of US Economy7. Intensification of Geopolitical Instability (esp. Middle & Far East)8. Disintegration of Eurozone (Political Failure)9. Commodity Price Inflation (apart from oil)10. Large-Scale Cyber Attack/Terrorism Attack (including cyberterror)

Global Catastrophe Loss Developments and Trends
46
2011 Rewrote Catastrophe Loss and Insurance History
But Will Losses Turn the Market?
46

Geophysical events(earthquake, tsunami, volcanic activity)
Meteorological events (storm)
Hydrological events(flood, mass movement)
Selection of significant loss events (see table)
Natural catastrophes
Earthquake, tsunami Japan, 11 March
EarthquakeNew Zealand, 22 Feb.
Cyclone Yasi Australia, 2–7 Feb.
Landslides, flash floodsBrazil, 12/16 Jan.
Floods, flash floods Australia, Dec. 2010–Jan. 2011
Severe storms, tornadoesUSA, 22–28 April
Severe storms, tornadoesUSA, 20–27 May
WildfiresUSA, April/Sept.
EarthquakeNew Zealand, 13 June
FloodsUSA, April–May
Climatological events(extreme temperature, drought, wildfire)
Number of Events: 820Number of Events: 820
DroughtUSA, Oct. 2010– ongoing
Hurricane IreneUSA, Caribbean22 Aug.–2 Sept.
WildfiresCanada, 14–22 May
DroughtSomaliaOct. 2010–Sept. 2011
FloodsPakistanAug.–Sept.
FloodsThailandAug.–Nov.
Earthquake Turkey23 Oct.
Flash floods, floodsItaly, France, Spain4–9 Nov.
Floods, landslidesGuatemala, El Salvador11–19 Oct.
Tropical Storm WashiPhilippines, 16–18 Dec.
Winter Storm JoachimFrance, Switzerland, Germany, 15–17 Dec.
48Source: MR NatCatSERVICE
Natural Loss Events, 2011
World Map

Natural Catastrophes Worldwide 2011Insured losses US$ 105bn - Percentage distribution per continent
Continent Insured losses US$ m
America (North and South
America)40,000
Europe 2,000
Africa Minor damages
Asia 45,000
Australia/Oceania 18,000
37%
2%
44%
17%
<1%
49Source: MR NatCatSERVICE
In 2011, 61% of insured natural catastrophe losses
were in the Asia/Pacific region, nearly 3.5 times the
average of 13% over the prior 30 years (1981-2010)
In 2011, just 37% of insured natural
catastrophe losses were in the
Americas, barely half the average of 66%
over the prior 30 years (1981-2010)
49

Natural Catastrophes Worldwide 1980 – 2011 Insured losses US$ 870bn - Percentage distribution per continent
Continent Insured losses US$ m
America (North and South
America)566,000
Europe 146,000
Africa 2,000
Asia 115,000
Australia/Oceania 41,000
66%
16%
<1%
13%
5%
50Source: MR NatCatSERVICE
In 2011, 61% of natural catastrophe losses were
in the Asia/Pacific region, nearly 3.5 times the
average of 13% over the prior 30 years (1981-2010)
50

52
Top 16 Most Costly World Insurance Losses, 1970-2011**
(Insured Losses, 2011 Dollars, $ Billions)
*Average of range estimates of $35B - $40B as of 1/4/12; Privately insured losses only.**Figures do not include federally insured flood losses.Sources: Swiss Re sigma 1/2011; Munich Re; Insurance Information Institute research.
$11.9$13.0 $13.0$13.1
$19.1$21.3
$24.0$25.0
$37.5
$47.6
$7.7 $8.1 $8.3 $8.5 $9.3 $9.7
$0$5
$10$15$20$25$30$35$40$45$50
Hugo (1989)
WinterStormDaria(1991)
ChileQuake(2010)
Ivan (2004)
TyphoonMirielle(1991)
Charley(2004)
Wilma(2005)
ThailandFloods(2011)
NewZealandQuake(2011)
Ike (2008)
Northridge(1994)
SpringTornadoes/
Storms(2011)
WTC TerrorAttack(2001)
Andrew(1992)
JapanQuake,
Tsunami(2011)*
Katrina(2005)
Large catastrophes in Asia/Pacific and South
America Have dominated mega-losses since 2010
5 of the top 14 most expensive
catastrophes in world history have occurred within the past 2 years

Worldwide Natural Disasters,1980 – 2011
Number of Events
Source: MR NatCatSERVICE 53
Meteorological events(Storm)
Hydrological events(Flood, mass movement)
Climatological events(Extreme temperature, drought, forest fire)
Geophysical events(Earthquake, tsunami, volcanic eruption)
200
400
600
800
1 000
1 200
1980 1982 1984 1986 1988 1990 1992 1994 1996 1998 2000 2002 2004 2006 2008 2010
There were 820 events in 2011
55
U.S. Insured Catastrophe Loss Update
2011 Was One of the Most Expensive Years on Record
55

56
Top 14 Most Costly Disastersin U.S. History
(Insured Losses, 2011 Dollars, $ Billions)
*Losses will actually be broken down into several “events” as determined by PCS. Includes losses for the period April 1 – June 30.Sources: PCS; Insurance Information Institute inflation adjustments.
$9.0$11.9 $13.1
$19.1$21.3
$24.0 $25.0
$47.6
$8.5$7.7$6.5$5.5$4.4$4.3
$0$5
$10$15$20$25$30$35$40$45$50
Irene(2011)
Jeanne(2004)
Frances(2004)
Rita (2005)
Hugo (1989)
Ivan (2004)
Charley(2004)
Wilma(2005)
Ike (2008)
Northridge(1994)
SpringTornadoes& Storms*
(2011)
9/11Attack(2001)
Andrew(1992)
Katrina(2005)
Taken as a single event, the Spring 2011 tornado and storm season are
is the 4th costliest event in US insurance history
Hurricane Irene became the 11th most expense
hurricane in US history

Nu
mb
er
Geophysical (earthquake, tsunami, volcanic activity)
Climatological (temperature extremes, drought, wildfire)
Meteorological (storm)
Hydrological (flood, mass movement)
Natural Disasters in the United States, 1980 – 2011Number of Events (Annual Totals 1980 – 2011)
Source: MR NatCatSERVICE 57
37
8
51
2
50
100
150
200
250
300
1980 1982 1984 1986 1988 1990 1992 1994 1996 1998 2000 2002 2004 2006 2008 2010
There were 117 natural disaster events in 2011

59
$1
2.3
$1
0.7
$3
.7 $1
4.0
$1
1.3
$6
.0
$3
3.9
$7
.4 $1
5.9 $
32
.9
$7
1.7
$1
0.3
$7
.3
$2
8.5
$1
1.2
$1
4.1
$3
2.3
$1
00
.0
$1
3.7
$4
.7
$7
.8
$3
6.9
$8
.6
$2
5.8
$0
$20
$40
$60
$80
$100
$120
89 90 91 92 93 94 95 96 97 98 99 00 01 02 03 04 05 06 07 08 09 10 11*20??
US Insured Catastrophe Losses
*PCS figure as of April 6, 2012.Note: 2001 figure includes $20.3B for 9/11 losses reported through 12/31/01 ($25.9B 2011 dollars). Includes only business and personal property claims, business interruption and auto claims. Non-prop/BI losses = $12.2B ($15.6B in 2011 dollars.) Sources: Property Claims Service/ISO; Insurance Information Institute.
US CAT Losses in 2011 Were the 5th Highest in US History on An Inflation Adjusted Basis
$100 Billion CAT Year is Coming Eventually
Record Tornado Losses Caused
2011 CAT Losses to Surge
($ Billions, 2011 Dollars)
59

62
Combined Ratio Points Associated with Catastrophe Losses: 1960 – 2011*
*Insurance Information Institute estimates for 2010 and 2011 based on A.M. Best data.Notes: Private carrier losses only. Excludes loss adjustment expenses and reinsurance reinstatement premiums. Figures are adjusted for losses ultimately paid by foreign insurers and reinsurers.Source: ISO; Insurance Information Institute.
0.4
1.2
0.4 0.
8 1.3
0.3 0.4 0.
71.
51.
00.
40.
4 0.7
1.8
1.1
0.6
1.4 2.
01.
3 2.0
0.5
0.5 0.7
3.0
1.2
2.1
8.8
2.3
5.9
3.3
2.8
1.0
3.6
2.9
1.6
5.4
1.6
3.3
3.3
8.1
2.7
1.6
5.0
2.6
4.4
8.0
3.6
0.9
0.1
1.1
1.1
0.8
0
1
2
3
4
5
6
7
8
9
10
1960
1962
1964
1966
1968
1970
1972
1974
1976
1978
1980
1982
1984
1986
1988
1990
1992
1994
1996
1998
2000
2002
2004
2006
2008
2010
The Catastrophe Loss Component of Private Insurer Losses Has Increased Sharply in Recent Decades
Avg. CAT Loss Component of the Combined Ratio
by Decade
1960s: 1.04 1970s: 0.85 1980s: 1.31 1990s: 3.39 2000s: 3.52 2010s: 6.20*
Combined Ratio Points
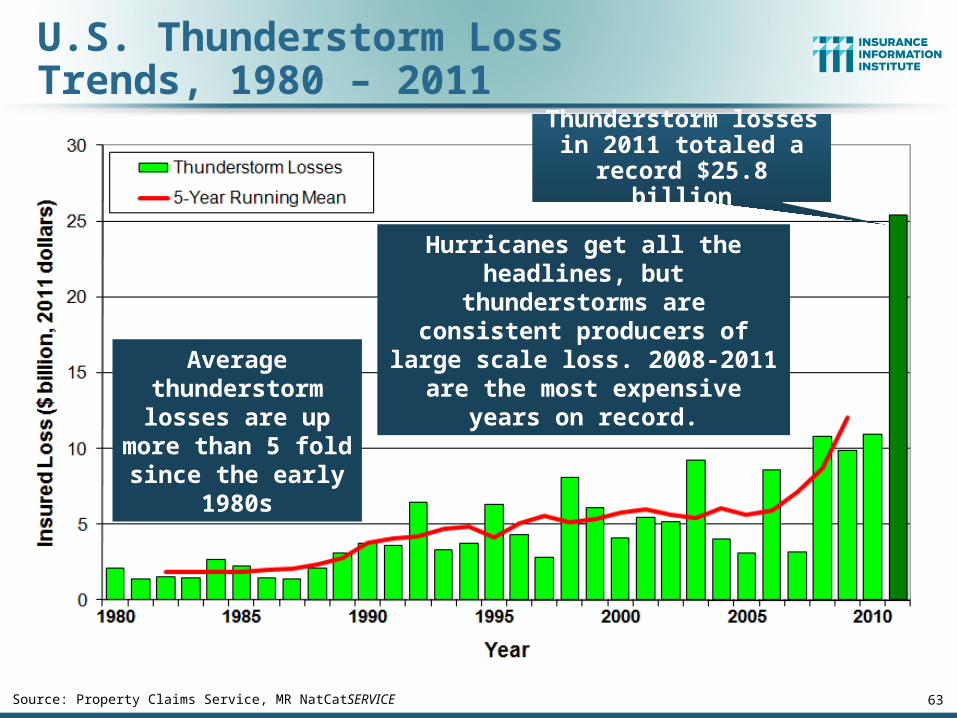
U.S. Thunderstorm Loss Trends, 1980 – 2011
63Source: Property Claims Service, MR NatCatSERVICE
Average thunderstorm
losses are up more than 5 fold since the early 1980s
Hurricanes get all the headlines, but thunderstorms are consistent
producers of large scale loss. 2008-2011 are the most expensive
years on record.
Thunderstorm losses in 2011 totaled a record
$25.8 billion

64
P/C Insurance Industry Financial Overview
Profit Recovery Was Set Back in 2011 by High Catastrophe
Loss & Other Factors
64

P/C Net Income After Taxes1991–2011 ($ Millions)
$1
4,1
78
$5
,84
0
$1
9,3
16
$1
0,8
70
$2
0,5
98
$2
4,4
04 $
36
,81
9
$3
0,7
73
$2
1,8
65
$3
,04
6
$3
0,0
29
$6
2,4
96
$3
,04
3
$3
5,2
04
$1
9,1
50$2
8,6
72
-$6,970
$6
5,7
77
$4
4,1
55
$2
0,5
59
$3
8,5
01
-$10,000
$0
$10,000
$20,000
$30,000
$40,000
$50,000
$60,000
$70,000
$80,000
91 92 93 94 95 96 97 98 99 00 01 02 03 04 05 06 07 08 09 10 11*
2005 ROE*= 9.6% 2006 ROE = 12.7% 2007 ROE = 10.9% 2008 ROE = 0.1% 2009 ROE = 5.0% 2010 ROE = 6.6% 2011:Q3 ROAS1 = 3.5%
P-C Industry 2011 profits were down 46% to $19.2B vs. 2010, due
primarily to high catastrophe losses and as non-cat
underwriting results deteriorated
* ROE figures are GAAP; 1Return on avg. surplus. Excluding Mortgage & Financial Guaranty insurers yields a 4.6% ROAS for 2011, 7.6% for 2010 and 7.4% for 2009.Sources: A.M. Best, ISO, Insurance Information Institute

A 100 Combined Ratio Isn’t What ItOnce Was: Investment Impact on ROEs
Combined Ratio / ROE
* 2008 -2011 figures are return on average surplus and exclude mortgage and financial guaranty insurers. 2011 combined ratio including M&FG insurers is 108.2, ROAS = 3.5%. Source: Insurance Information Institute from A.M. Best and ISO data.
97.5
100.6 100.1 100.8
92.7
101.099.3
100.9
106.4
95.7
4.6%
7.6%7.4%4.4%
9.6%
15.9%
14.3%
12.7% 10.9%
8.8%
80
85
90
95
100
105
110
1978 1979 2003 2005 2006 2007 2008 2009 2010 20110%
3%
6%
9%
12%
15%
18%
Combined Ratio ROE*
Combined Ratios Must Be Lower in Today’s DepressedInvestment Environment to Generate Risk Appropriate ROEs
A combined ratio of about 100 generated ~5.5% ROE in 2009/10,
10% in 2005 and 16% in 1979

-5%
0%
5%
10%
15%
20%
25%
75
76
77
78
79
80
81
82
83
84
85
86
87
88
89
90
91
92
93
94
95
96
97
98
99
00
01
02
03
04
05
06
07
08
09
10
11
*
Profitability Peaks & Troughs in the P/C Insurance Industry, 1975 – 2011*
*Profitability = P/C insurer ROEs are I.I.I. estimates. 2011 figure is an estimate based on ROAS data. Note: Data for 2008-2011 exclude mortgage and financial guaranty insurers. For 2011:Q3 ROAS = 3.5% including M&FG.Source: Insurance Information Institute; NAIC, ISO, A.M. Best.
1977:19.0% 1987:17.3%
1997:11.6%2006:12.7%
1984: 1.8% 1992: 4.5% 2001: -1.2%
10 Years
10 Years9 Years
2011:4.6%*
History suggests next ROE peak will be in 2016-2017
ROE
1975: 2.4%

The BIG Question:When Will the Market Turn?
68
Are Catastrophes and Other Factors Pressuring Insurance Markets?
68

69
Criteria Necessary for a “Market Turn”:All Four Criteria Must Be Met
Criteria Status Comments
Sustained Period of
Large Underwriting
LossesEarly Stage,
Inevitable
•Apart from 2011 CAT losses, overall p/c underwriting losses remain modest•Combined ratios (ex-CATs) still in low 100s (vs. 110+ at onset of last hard market)•Prior-year reserve releases continue to reduce u/w losses, boost ROEs, though more modestly
Material Decline in Surplus/ Capacity
Entered 2011 At Record High; Only
Small Decline
•Surplus hit a record $565B as of 3/31/11•Fell just 1.6% through 12/31/11 from 12/31/10•Will likely see new record in 2012•Little excess capacity remains in reinsurance markets•Modest growth in demand for insurance is insufficient to absorb much excess capacity
Tight Reinsurance
MarketSomewhat in
Place
•Much of the global “excess capacity” was eroded by cats•Higher prices in Asia/Pacific•Modestly higher pricing for US risks
Renewed Underwriting
& Pricing Discipline
Some Firming esp. in
Property, WC
•Commercial lines pricing trends have turned from negative to flat and now positive, esp. Property & WC; •Competition remains intense as many seek to maintain market share
Sources: Barclays Capital; Insurance Information Institute.

1. UNDERWRITING
70
Have Underwriting Losses Been Large Enough for Long Enough to Turn the Market?
70

71
P/C Insurance Industry Combined Ratio, 2001–2011*
* Excludes Mortgage & Financial Guaranty insurers 2008--2011. Including M&FG, 2008=105.1, 2009=100.7, 2010=102.4, 2011=106.4 Sources: A.M. Best, ISO.
95.7
99.3100.8
108.2
101.0
92.6
100.898.4
100.1
107.5
115.8
90
100
110
120
2001 2002 2003 2004 2005 2006 2007 2008 2009 2010 2011*
Best Combined
Ratio Since 1949 (87.6)
As Recently as 2001, Insurers Paid Out
Nearly $1.16 for Every $1 in Earned
Premiums
Relatively Low CAT Losses, Reserve Releases
Cyclical Deterioration
Heavy Use of Reinsurance Lowered Net
Losses
Relatively Low CAT Losses, Reserve Releases
Avg. CAT Losses,
More Reserve Releases
Higher CAT
Losses, Shrinking Reserve
Releases, Toll of Soft
Market

Underwriting Gain (Loss)1975–2011E*
* Includes mortgage and financial guaranty insurers in all yearsSources: A.M. Best, ISO; Insurance Information Institute.
Large Underwriting Losses Are NOT Sustainable in Current Investment Environment
-$55
-$45
-$35
-$25
-$15
-$5
$5
$15
$25
$35
75 76 77 78 79 80 81 82 83 84 85 86 87 88 89 90 91 92 93 94 95 96 97 98 99 00 01 02 03 04 05 06 07 08 09 1011*
Cumulative underwriting deficit from 1975 through
2011 is $479B
($ Billions) Underwriting losses in
2011 totaled $36.5B, the
largest since 2001

109.4110.2
118.8
109.5
112.5
110.2
107.6
104.1
109.7 110.2
102.5
105.4
91.2
94.8
101.299.5
101.0
107.5
102.0102.0
111.1112.3
122.3
90
95
100
105
110
115
120
125
90
91
92
93
94
95
96
97
98
99
00
01
02
03
04
05
06
07
08
09
10
11
P
12
F
Co
mm
erc
ial L
ine
s C
om
bin
ed
Ra
tio
*2007-2012 figures exclude mortgage and financial guaranty segments.Source: A.M. Best; Insurance Information Institute
Commercial Lines Combined Ratio, 1990-2012F*
Commercial lines underwriting
performance in 2011 was the worst since 2002
74

75
2
(2)
(8)
(3)
(7)(10) (10)
(4)
(0)
11
24
15
119
(5)
(9)
(14)
(10) (11)(7)
(5)(2)
-$20
-$15
-$10
-$5
$0
$5
$10
$15
$20
$25
$309
2
93
94
95
96
97
98
99
00
01
02
03
04
05
06
07
08
09
10
11
E
12
F
13
F
Pri
or
Yr.
Re
se
rve
Re
lea
se
($
B)
-6
-4
-2
0
2
4
6
8 Imp
ac
t on
Co
mb
ine
d R
atio
(Po
ints
)
Prior Yr. ReserveDevelopment ($B)
Impact onCombined Ratio(Points)
P/C Reserve Development, 1992–2013F
Reserve Releases Remained Strong in 2010 But Tapered Off in 2011. Releases Are Expected to
Further Diminish in 2012 and 2103Note: 2005 reserve development excludes a $6 billion loss portfolio transfer between American Re and Munich Re. Including this transaction, total prior year adverse development in 2005 was $7 billion. The data from 2000 and subsequent years excludes development from financial guaranty and mortgage insurance. Sources: Barclays Capital; A.M. Best.
Prior year reserve releases totaled $8.8
billion in the first half of 2010, up from
$7.1 billion in the first half of 2009

2. SURPLUS/CAPITAL/CAPACITY
76
Have Large Global Losses Reduced Capacity in the Industry, Setting
the Stage for a Market Turn?
76

77
Policyholder Surplus, 2006:Q4–2011:Q4
Sources: ISO, A.M .Best.
($ Billions)
$487.1$496.6
$512.8$521.8
$478.5
$455.6
$437.1
$463.0
$490.8
$511.5
$540.7$530.5
$544.8
$559.2 $559.1
$538.6
$550.3
$564.7
$505.0$515.6$517.9
$420
$440
$460
$480
$500
$520
$540
$560
$580
06:Q4 07:Q1 07:Q2 07:Q3 07:Q4 08:Q1 08:Q2 08:Q3 08:Q4 09:Q1 09:Q2 09:Q3 09:Q4 10:Q1 10:Q2 10:Q3 10:Q4 11:Q1 11:Q2 11:Q3 11:Q4
2007:Q3Previous Surplus Peak
Quarterly Surplus Changes Since 2011:Q1 Peak
11:Q2: -$5.6B (-1.0%)11:Q3: -$26.1B (-4.6%)11:Q4: -$14.3B (-2.5%)
Surplus as of 12/31/11 was down 2.5% below its all
time record high of $564.7B set as of 3/31/11. A new record high in 2012 is
possible.
*Includes $22.5B of paid-in capital from a holding company parent for one insurer’s investment in a non-insurance business in early 2010.
The Industry now has $1 of surplus for every $0.80 of NPW, close to the strongest claims-
paying status in its history.
78
3. REINSURANCE MARKET CONDITIONS
Record Global Catastrophes Activity is
Pressuring Pricing
78

79
Reinsurer Share of Recent Significant Market Losses
Source: Insurance Information Institute from reinsurance share percentages provided in RAA, ABIR and CEA press release, Jan. 13, 2011.
Billions of 2011 Dollars
$0$5
$10$15$20$25$30$35$40
JapanEarthquake/
Tsunami (Mar2011)
New Zealand Earthquake (Feb
2011)
Thailand Floods(Aug - Nov 2011)
Chile Earthquake(Feb. 2010)
AustraliaCyclone/ Floods(Jan-Feb 2011)
Reinsurer SharePrimary Insurer Share
40% Reinsurance share of total insured loss
Reinsurers Paid a High Proportion of Insured Losses Arising from Major Catastrophic Events Around the World in Recent Years
$0.4$4.0
$22.5$9.5
$15.0
$3.5
$37.5
$13.0
$6.0
$10.0
$7.9
$8.3
$2.2$2.8
$5.0
73%60%
95%44%
79

Source: Guy Carpenter, GC Capital Ideas.com, February 28, 2012.
Historical Capital Levels of Guy Carpenter Reinsurance Composite, 1998—3Q11
80
Most excess reinsurance capacity was
removed from the market in 2011, but
there does not appear to be a
shortage, leading to modest increases in
2012 reinsurance renewals except in areas hit hard by
CATs.
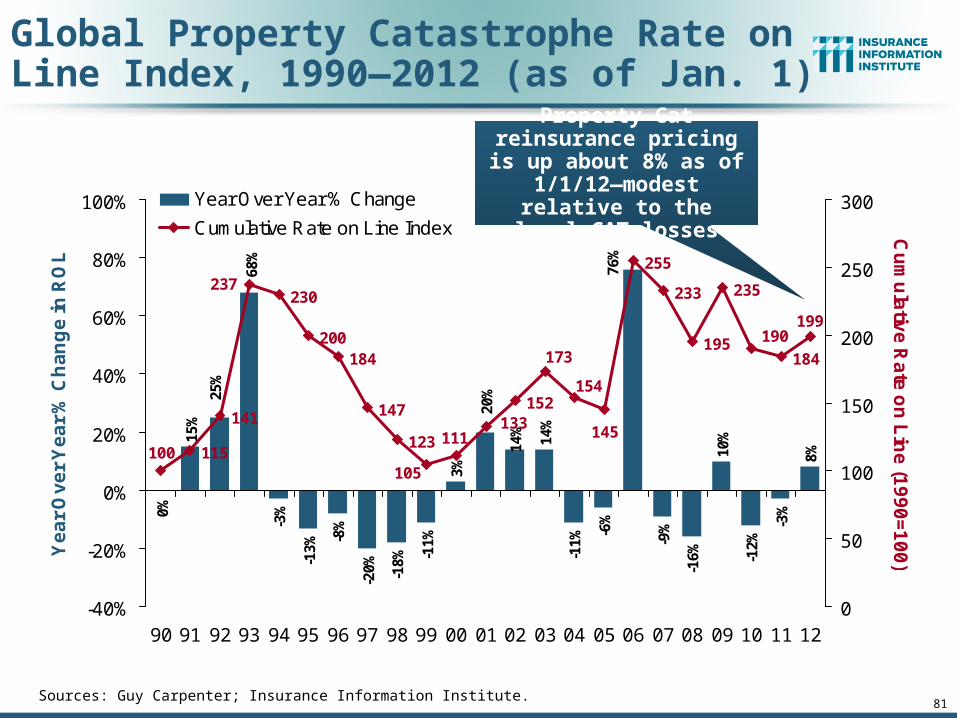
81
Global Property Catastrophe Rate on Line Index, 1990—2012 (as of Jan. 1)
15%
-3%
-13%
-8%
-20% -18% -1
1%
3%
14%
-11%
-6%
-9%
-16%
10%
-12%
-3%
8%
14%
76%
68%
25%
20%
0%
115
141
230
200184
147
123
152
255
233
195
235
184
199
133111
105
237
100
154
173
145
190
-40%
-20%
0%
20%
40%
60%
80%
100%
90 91 92 93 94 95 96 97 98 99 00 01 02 03 04 05 06 07 08 09 10 11 12
Ye
ar
Ov
er
Ye
ar
% C
ha
ng
e in
RO
L
0
50
100
150
200
250
300
Cu
mu
lativ
e R
ate
on
Lin
e (1
99
0=
10
0)
Year Over Year % Change
Cumulative Rate on Line Index
Sources: Guy Carpenter; Insurance Information Institute.
Property-Cat reinsurance pricing is up about 8% as of 1/1/12—modest relative
to the level CAT losses

4. RENEWED PRICING DISCIPLINE
82
Is There Evidence of a Broad and Sustained Shift in Pricing?
82

83
-5%
0%
5%
10%
15%
20%
25%
71 72 73 74 75 76 77 78 79 80 81 82 83 84 85 86 87 88 89 90 91 92 93 94 95 96 97 98 99 00 01 02 03 04 05 06 07 08 09 10 11*
Premium Growth Is Up Modestly: More in 2012?
(Percent)1975-78 1984-87 2000-03
Shaded areas denote “hard market” periodsSources: A.M. Best (historical and forecast), ISO, Insurance Information Institute.
Net Written Premiums Fell 0.7% in 2007 (First Decline
Since 1943) by 2.0% in 2008, and 4.2% in 2009, the First 3-Year Decline Since 1930-33.
NWP was up 0.9% in 2010
2011 growth
was +3.3%

85
Average Commercial Rate Change,All Lines, (1Q:2004–4Q:2011)
-3.2
%-5
.9%
-7.0
%-9
.4%
-9.7
% -8.2
%-4
.6% -2
.7%
-3.0
%-5
.3%
-9.6
%-1
1.3
%-1
1.8
%-1
3.3
%-1
2.0
%-1
3.5
%-1
2.9
% -11
.0%
-6.4
% -5.1
%-4
.9%
-5.8
%-5
.6%
-5.3
%-6
.4% -5.2
%-5
.4%
-2.9
%
2.8
%
-0.1
% 0.9
%
-0.1
%
-16%
-14%
-12%
-10%
-8%
-6%
-4%
-2%
0%
2%
4%
1Q
04
2Q
04
3Q
04
4Q
04
1Q
05
2Q
05
3Q
05
4Q
05
1Q
06
2Q
06
3Q
06
4Q
06
1Q
07
2Q
07
3Q
07
4Q
07
1Q
08
2Q
08
3Q
08
4Q
08
1Q
09
2Q
09
3Q
09
4Q
09
1Q
10
2Q
10
3Q
10
4Q
10
1Q
11
2Q
11
3Q
11
4Q
11
Source: Council of Insurance Agents & Brokers (1Q04-4Q11); Insurance Information Institute
KRW Effect
Pricing as of Q3:2011 was positive for the first time
since 2003. Slightly stronger gains in Q4.
(Percent)
Q2 2011 marked the 30th consecutive quarter of price
declines

86
Change in Commercial Rate Renewals, by Account Size: 1999:Q4 to 2011:Q4
Source: Council of Insurance Agents and Brokers; Barclay’s Capital; Insurance Information Institute.
Percentage Change (%)
KRW Effect: No Lasting Impact
Pricing turned positive (+0.9%) in Q3:2011, the first increase in
nearly 8 years; Q4:2011 renewals were up 2.8%
Pricing Turned Negative in Early
2004 and Remained that
way for 7 ½ years
Peak = 2001:Q4 +28.5%
Trough = 2007:Q3 -13.6%
87
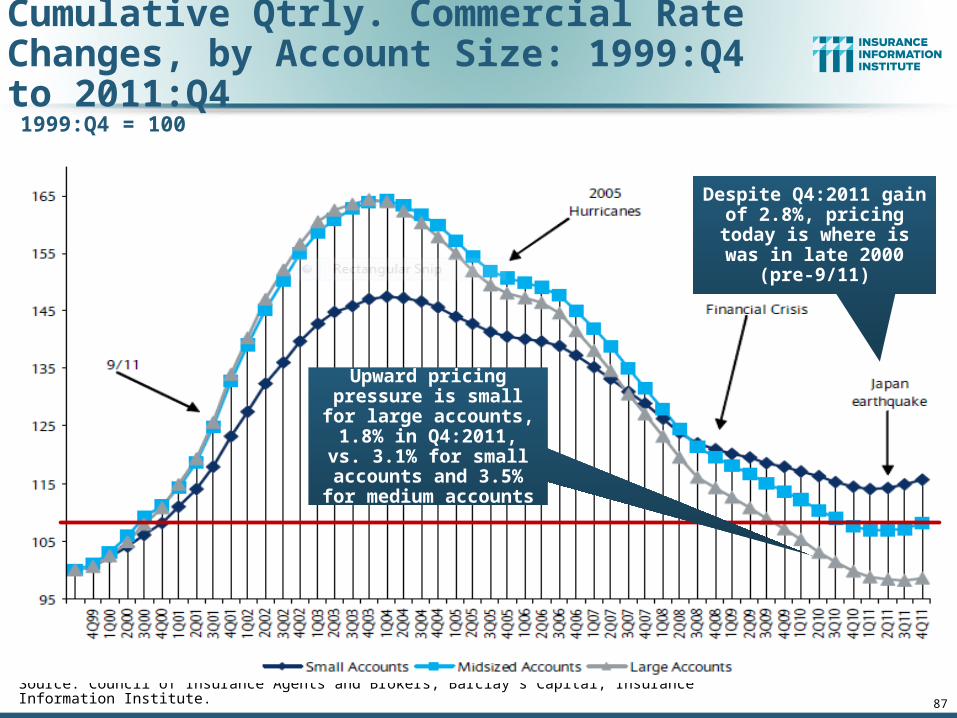
Cumulative Qtrly. Commercial Rate Changes, by Account Size: 1999:Q4 to 2011:Q4
1999:Q4 = 100
Source: Council of Insurance Agents and Brokers; Barclay’s Capital; Insurance Information Institute.
Despite Q4:2011 gain of 2.8%, pricing today is
where is was in late 2000 (pre-9/11)
Upward pricing pressure is small for large accounts, 1.8% in
Q4:2011, vs. 3.1% for small accounts and
3.5% for medium accounts
88
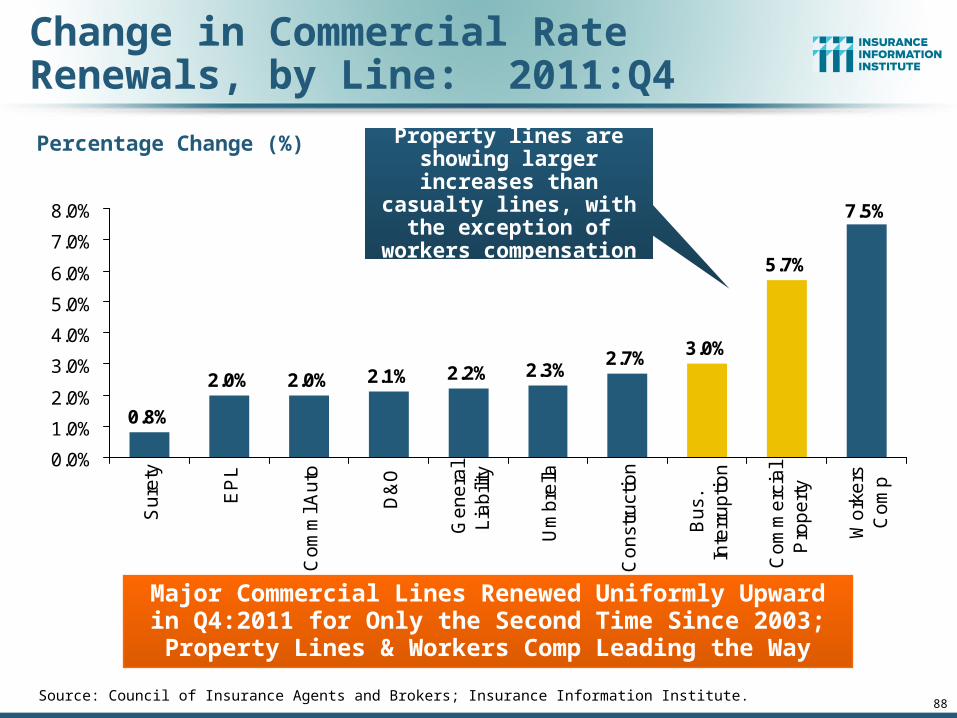
Change in Commercial Rate Renewals, by Line: 2011:Q4
Source: Council of Insurance Agents and Brokers; Insurance Information Institute.
Major Commercial Lines Renewed Uniformly Upward in Q4:2011 for Only the Second Time Since 2003; Property Lines
& Workers Comp Leading the Way
Percentage Change (%)
2.7% 3.0%
5.7%
7.5%
0.8%
2.0% 2.0% 2.1% 2.2% 2.3%
0.0%
1.0%
2.0%
3.0%
4.0%
5.0%
6.0%
7.0%
8.0%
Su
rety
EP
L
Co
mm
l Au
to
D&
O
Ge
ne
ral
Lia
bili
ty
Um
bre
lla
Co
nst
ruct
ion
Bu
s.In
terr
up
tion
Co
mm
erc
ial
Pro
pe
rty
Wo
rke
rsC
om
p
Property lines are showing larger increases than
casualty lines, with the exception of workers
compensation

INVESTMENTS: THE NEW REALITY
89
How Much of a Threat Are Persistently Low Interest Rates for (Re)Insurers?
89

Property/Casualty Insurance Industry Investment Income: 2000–2013F1
$38.9$37.1 $36.7
$38.7
$54.6
$51.2
$47.1 $47.6$49.0
$45.5$46.4
$39.6
$49.5
$52.3
$30
$40
$50
$60
00 01 02 03 04 05 06 07 08 09 10 11 12F 13F
Investment Income in 2011 Was Surprisingly Strong, Though Investment Income Is Likely to Weaken in 2012 Due to Persistently Low Interest Rates
1 Investment gains consist primarily of interest and stock dividends.*2012F-201F based on Conning projections.Sources: ISO; Conning Research & Consulting; Insurance Information Institute.
($ Billions)
Investment earnings in 2011 were 10.3% below
their 2007 pre-crisis peak
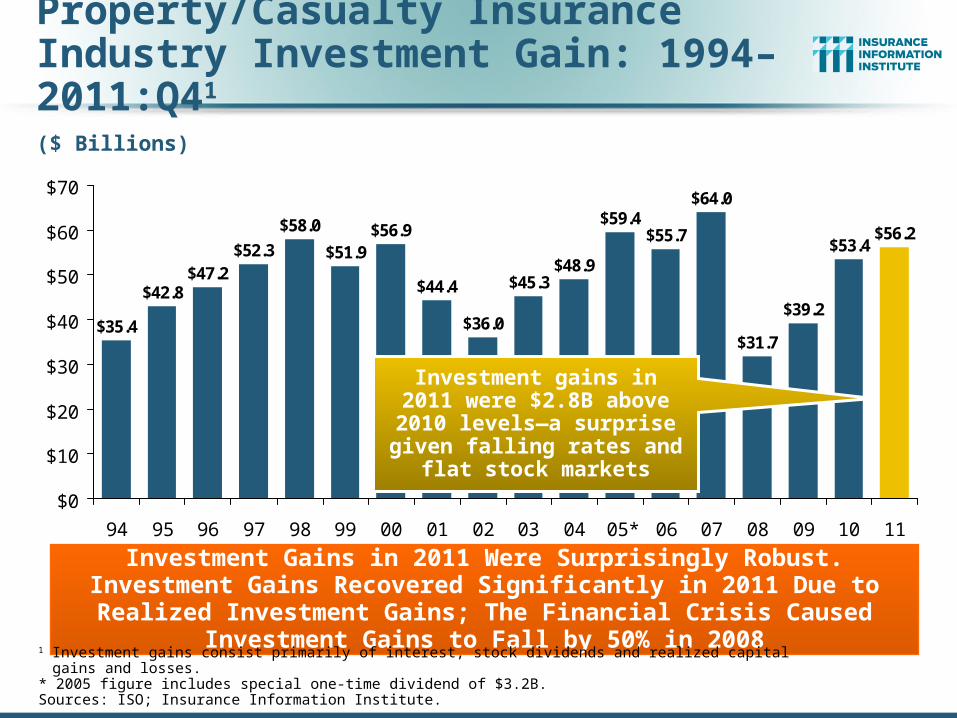
Property/Casualty Insurance Industry Investment Gain: 1994–2011:Q41
$35.4
$42.8$47.2
$52.3
$44.4
$36.0
$45.3$48.9
$59.4$55.7
$64.0
$31.7
$39.2
$53.4$56.2$58.0
$51.9$56.9
$0
$10
$20
$30
$40
$50
$60
$70
94 95 96 97 98 99 00 01 02 03 04 05* 06 07 08 09 10 11
Investment Gains in 2011 Were Surprisingly Robust. Investment Gains Recovered Significantly in 2011 Due to Realized Investment Gains; The
Financial Crisis Caused Investment Gains to Fall by 50% in 2008
1 Investment gains consist primarily of interest, stock dividends and realized capital gains and losses.* 2005 figure includes special one-time dividend of $3.2B.Sources: ISO; Insurance Information Institute.
($ Billions)
Investment gains in 2011 were $2.8B above 2010 levels—a surprise given falling rates
and flat stock markets
93
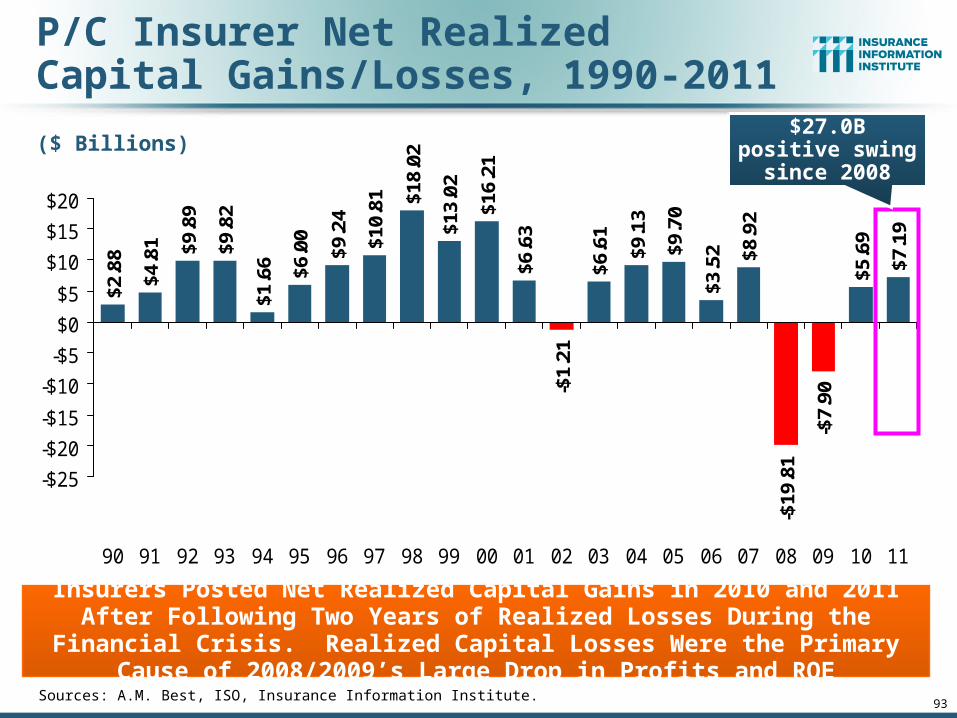
P/C Insurer Net Realized Capital Gains/Losses, 1990-2011
Sources: A.M. Best, ISO, Insurance Information Institute.
$2.8
8
$4.8
1 $9.8
9
$9.8
2
$10.
81 $18.
02
$13.
02
$16.
21
$6.6
3
-$1.
21
$6.6
1
$9.1
3
$9.7
0
$3.5
2 $8.9
2
-$7.
90
$5.6
9
$7.1
9
-$19
.81
$9.2
4
$6.0
0
$1.6
6
-$25
-$20
-$15
-$10
-$5
$0
$5
$10
$15
$20
90 91 92 93 94 95 96 97 98 99 00 01 02 03 04 05 06 07 08 09 10 11
Insurers Posted Net Realized Capital Gains in 2010 and 2011 After Following Two Years of Realized Losses During the Financial Crisis. Realized Capital
Losses Were the Primary Cause of 2008/2009’s Large Drop in Profits and ROE
($ Billions) $27.0B positive swing since 2008

94
U.S. 10-Year Treasury Note Yields:A Long Downward Trend, 1990–2012*
*Monthly, through March 2012. Note: Recessions indicated by gray shaded columns.Sources: Federal Reserve Bank at http://www.federalreserve.gov/releases/h15/data/Monthly/H15_TCMNOM_Y10.txt National Bureau of Economic Research (recession dates); Insurance Information Institutes.
1%
2%
3%
4%
5%
6%
7%
8%
9%
'90 '91 '92 '93 '94 '95 '96 '97 '98 '99 '00 '01 '02 '03 '04 '05 '06 '07 '08 '09 '10 '11 '12
Yields on 10-Year U.S. Treasury Notes have been essentially
below 5% for nearly a decade.
Since roughly 80% of P/C bond/cash investments are in 10-year or shorter durations, most P/C insurer portfolios will have low-yielding bonds for years to come.
Yields on 10-Year U.S. Treasury Notes have
been essentially below 4% since January 2008.
94

3-Month Interest Rates forMajor Global Economies, 2008-2013F
0.7
%
0.3
% 0.7
%
2.0
% 2.5
%
1.4
%1.8
%
0.6
%
2.1
%
1.3
%
1.0
%
0.2
%
0.9
%
0.2
% 0.7
%
2.9
%
0.9
%
0.2
%
1.1
%
0.2
%
0.8
%
4.9
%
1.1
%
0.1
%
0.9
%
0.2
%
0.9
%
5.1
%
0.9
%
0.1
%
1.2
%
0.3
%
1.1
%
5.1
%
1.2
%
0.2
%
0.0%
1.0%
2.0%
3.0%
4.0%
5.0%
6.0%
Euro Area Japan UK China Netherlands US
20082009201020112012F2013F
Source: Blue Chip Economic Indicators, Apr. 2012 edition.
Interest rates remain generally low in much of the
world, depressing insurer investment earnings. Central banks in many
countries, including the US, are intentionally holding
rates low.

97
-1.8
%
-1.8
%
-2.0
%
-3.6
%
-3.3
%
-3.3
%
-3.7
%
-4.3
%
-5.2
%
-5.7
%
-7.3%
-1.9
%
-2.1
%
-3.1
%
-8%-7%-6%-5%-4%-3%-2%-1%0%
Perso
nal L
ines
Pvt Pass
Aut
o
Pers P
rop
Comm
ercia
l
Comm
l Auto
Credit
Comm
Pro
p
Comm
Cas
Fidelity
/Sure
ty
Warra
nty
Surplu
s Line
s
Med
Mal
WC
Reinsu
rance
**
Lower Investment Earnings Place a Greater Burden on Underwriting and Pricing Discipline
*Based on 2008 Invested Assets and Earned Premiums**US domestic reinsurance onlySource: A.M. Best; Insurance Information Institute.
Reduction in Combined Ratio Necessary to Offset 1% Decline in Investment Yield to Maintain Constant ROE, by Line*
97

www.iii.org
Thank you for your timeand your attention!
Twitter: twitter.com/bob_hartwigDownload at www.iii.org/presentations
Insurance Information Institute Online:
98