The global economy effects on commodity dependent countries like zambia
19
The Global Economy Effects on Commodity Dependent Countries like Zambia 17 th November 2016 Kampamba Shula US Job Market China PMI Global Commodity Trends The Dollar Effect The Trump Effect Global Copper Outlook Zambia Copper Outlook
-
Upload
kampamba-shula -
Category
Economy & Finance
-
view
274 -
download
0
Transcript of The global economy effects on commodity dependent countries like zambia
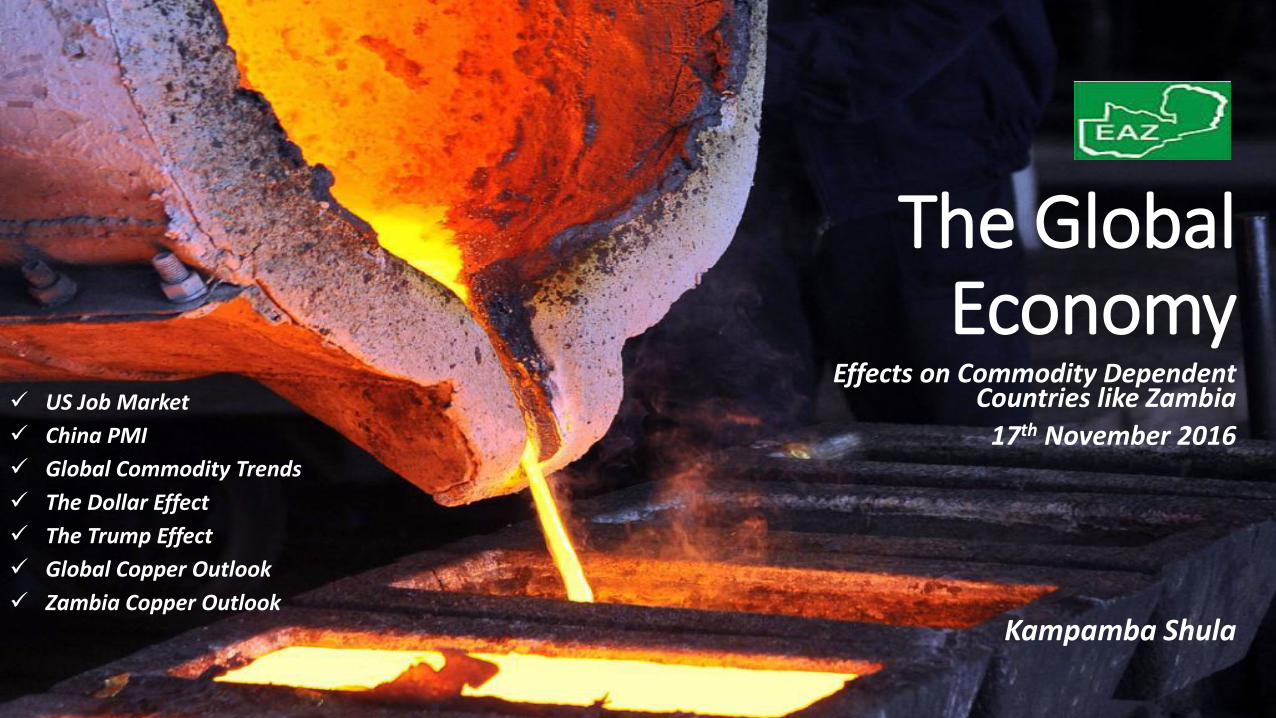
The Global Economy
Effects on Commodity Dependent Countries like Zambia
17th November 2016
Kampamba Shula
US Job Market
China PMI
Global Commodity Trends
The Dollar Effect
The Trump Effect
Global Copper Outlook
Zambia Copper Outlook
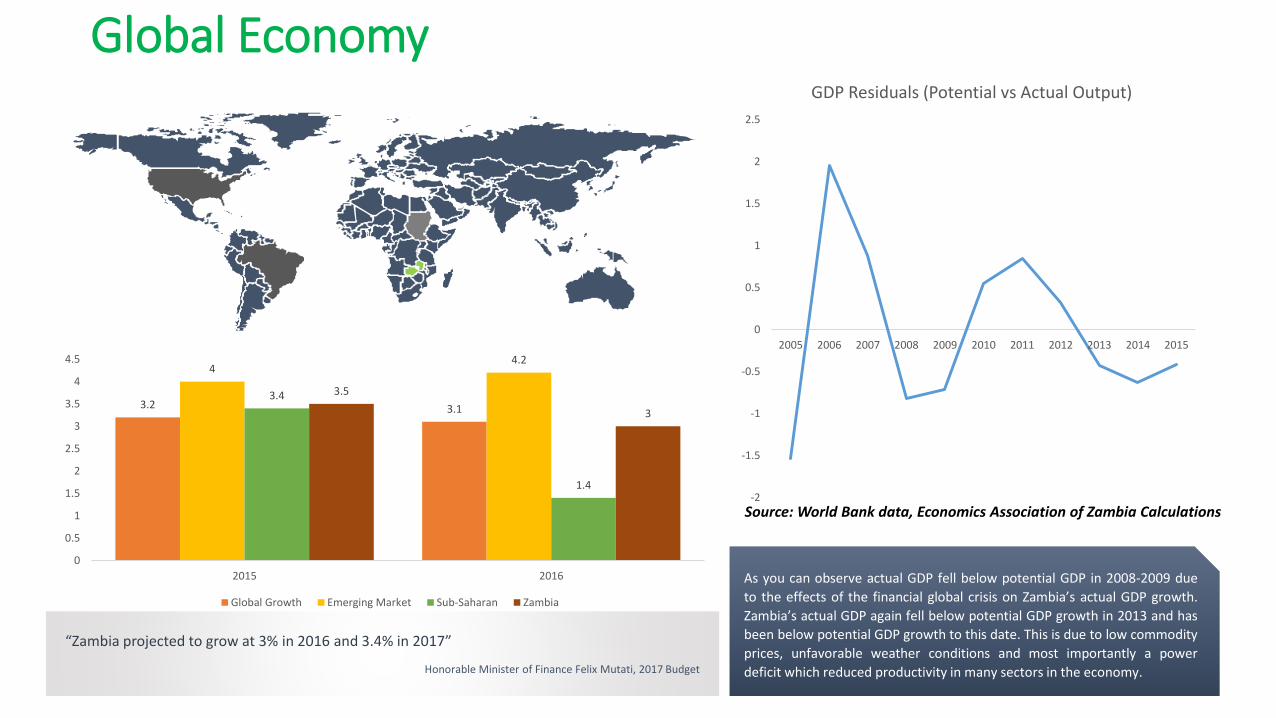
3.2 3.1
44.2
3.4
1.4
3.5
3
0
0.5
1
1.5
2
2.5
3
3.5
4
4.5
2015 2016
Global Growth Emerging Market Sub-Saharan Zambia
“Zambia projected to grow at 3% in 2016 and 3.4% in 2017”
Honorable Minister of Finance Felix Mutati, 2017 Budget
As you can observe actual GDP fell below potential GDP in 2008-2009 due
to the effects of the financial global crisis on Zambia’s actual GDP growth.
Zambia’s actual GDP again fell below potential GDP growth in 2013 and has
been below potential GDP growth to this date. This is due to low commodity
prices, unfavorable weather conditions and most importantly a power
deficit which reduced productivity in many sectors in the economy.
-2
-1.5
-1
-0.5
0
0.5
1
1.5
2
2.5
2005 2006 2007 2008 2009 2010 2011 2012 2013 2014 2015
GDP Residuals (Potential vs Actual Output)
Global Economy
Source: World Bank data, Economics Association of Zambia Calculations
US Job Market
0
50
100
150
200
250
300
Jan-16 Feb-16 Mar-16 Apr-16 May-16 Jun-16 Jul-16 Aug-16 Sep-16 Oct-16
Tho
usa
nd
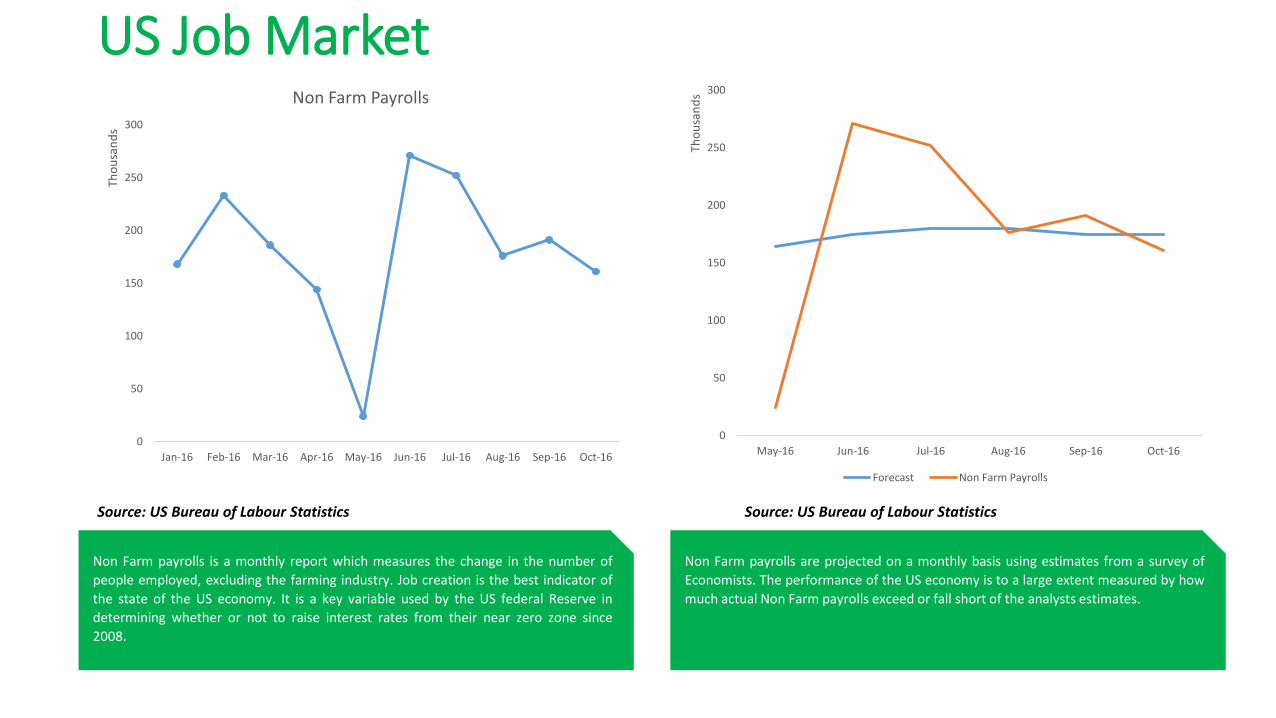
sNon Farm Payrolls
Non Farm payrolls is a monthly report which measures the change in the number of
people employed, excluding the farming industry. Job creation is the best indicator of
the state of the US economy. It is a key variable used by the US federal Reserve in
determining whether or not to raise interest rates from their near zero zone since
2008.
0
50
100
150
200
250
300
May-16 Jun-16 Jul-16 Aug-16 Sep-16 Oct-16
Tho
usa
nd
s
Forecast Non Farm Payrolls
Non Farm payrolls are projected on a monthly basis using estimates from a survey of
Economists. The performance of the US economy is to a large extent measured by how
much actual Non Farm payrolls exceed or fall short of the analysts estimates.
Source: US Bureau of Labour Statistics Source: US Bureau of Labour Statistics
US Job Market
-2
-1
0
1
2
3
4
2014 Q1 2014 Q2 2014 Q3 2014 Q4 2015 Q1 2015 Q2 2015 Q3 2015 Q4 2016 Q1 2016 Q2 2016 Q3
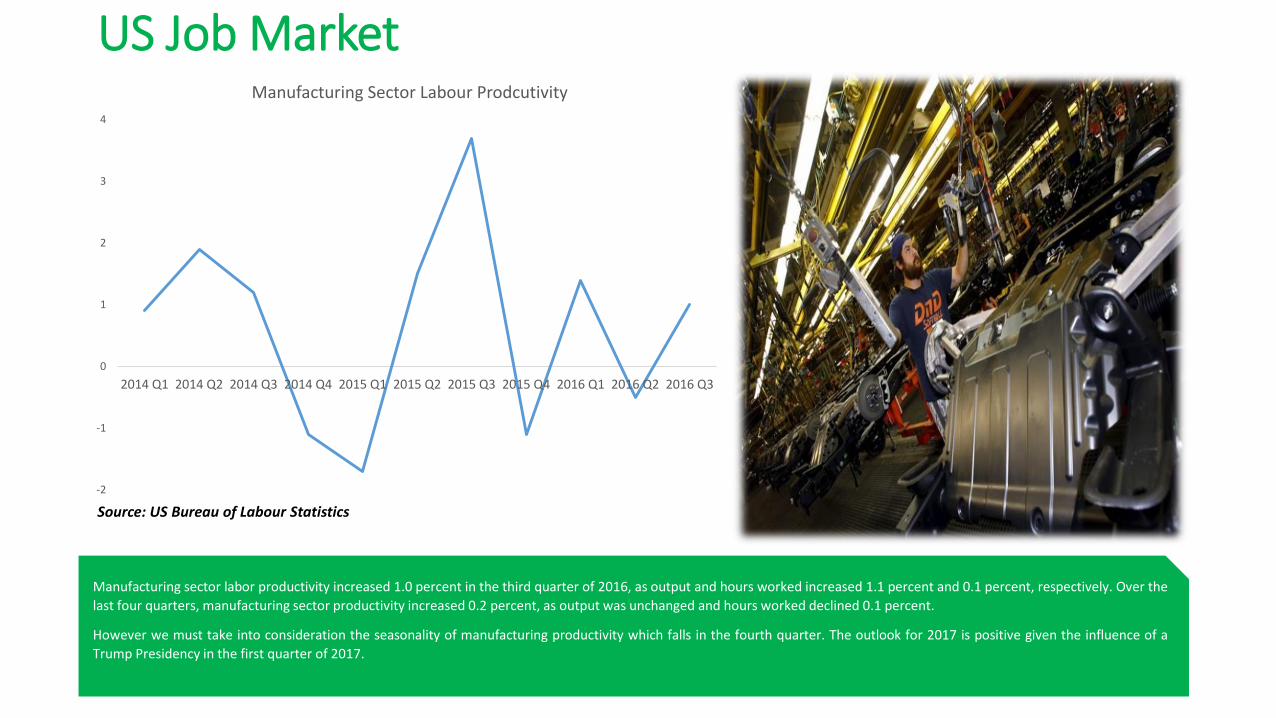
Manufacturing Sector Labour Prodcutivity
Manufacturing sector labor productivity increased 1.0 percent in the third quarter of 2016, as output and hours worked increased 1.1 percent and 0.1 percent, respectively. Over the
last four quarters, manufacturing sector productivity increased 0.2 percent, as output was unchanged and hours worked declined 0.1 percent.
However we must take into consideration the seasonality of manufacturing productivity which falls in the fourth quarter. The outlook for 2017 is positive given the influence of a
Trump Presidency in the first quarter of 2017.
Source: US Bureau of Labour Statistics
46
47
48
49
50
51
52
Jan-16 Feb-16 Mar-16 Apr-16 May-16 Jun-16 Jul-16 Aug-16 Sep-16 Oct-16
Actual China PMI Projected China PMI
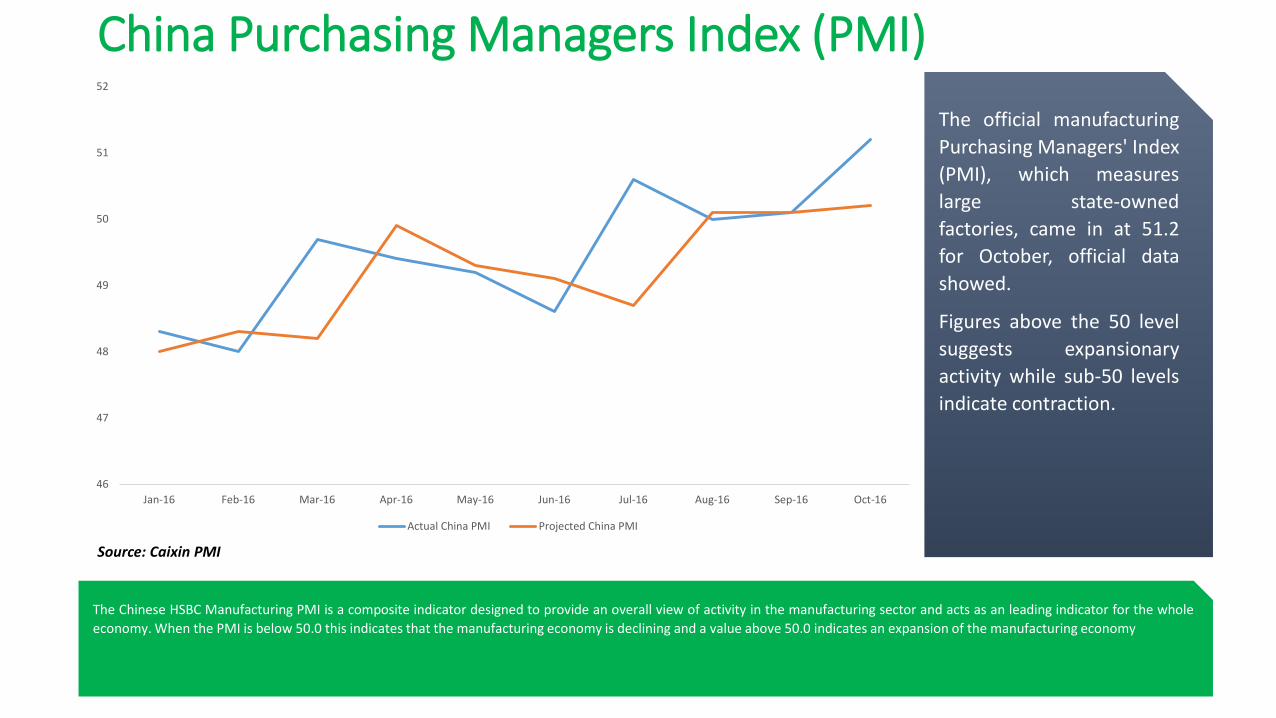
China Purchasing Managers Index (PMI)
The Chinese HSBC Manufacturing PMI is a composite indicator designed to provide an overall view of activity in the manufacturing sector and acts as an leading indicator for the whole
economy. When the PMI is below 50.0 this indicates that the manufacturing economy is declining and a value above 50.0 indicates an expansion of the manufacturing economy
The official manufacturing
Purchasing Managers' Index
(PMI), which measures
large state-owned
factories, came in at 51.2
for October, official data
showed.
Figures above the 50 level
suggests expansionary
activity while sub-50 levels
indicate contraction.
Source: Caixin PMI

China Purchasing Managers Index (PMI)
40%
53%
7%
Manufacturing Services Other
Manufacturing's contribution to overall growth has been slipping over the years as Beijing transitions its
economy from industry to consumption, accounting for around 40 percent of gross domestic product.
Services, on the other hand, now makes up more than half of the economy and the sector, which includes
real estate, restaurants, and e-commerce, has been on a steady upwards climb.
Economists say the pattern over the past few months suggested
sustained economic growth, but a growing dependence on
government spending and an overheated property market may pose
increased risks later this year with debt levels continuing to rise.
Source: World Bank

Global Commodity Trends
0
1000
2000
3000
4000
5000
6000
7000
Jan
-15
Feb
-15
Mar
-15
Ap
r-1
5
May
-15
Jun
-15
Jul-
15
Au
g-1
5
Sep
-15
Oct
-15
No
v-1
5
Dec
-15
Jan
-16
Feb
-16
Mar
-16
Ap
r-1
6
May
-16
Jun
-16
Jul-
16
Au
g-1
6
Sep
-16
Oct
-16
Copper US$ per tonne
But perhaps the most important single factor affecting commodity prices right now is
China. For much of the last two decades, growth in demand from China sustained
commodity producers as a slew of infrastructure and manufacturing projects drove
demand. This trend began to weaken.
The downswing in commodity prices was sharp in 2015, particularly following the
financial volatility that started mid-August, after China’s shock devaluation of the
renminbi – with investors fretting about the country’s slowing economy.
China PMI (Year)
Source: Caixin PMI Source: Bank of Zambia
Global Commodity Trends
13
47
87
53
2000 2014
China Other
0
10
20
30
40
50
60
70
Jan
-15
Feb
-15
Mar
-15
Ap
r-1
5
May
-15
Jun
-15
Jul-
15
Au
g-1
5
Sep
-15
Oct
-15
No
v-1
5
Dec
-15
Jan
-16
Feb
-16
Mar
-16
Ap
r-1
6
May
-16
Jun
-16
Jul-
16
Au
g-1
6
Sep
-16
Oct
-16
Crude Oil US$ per barrel
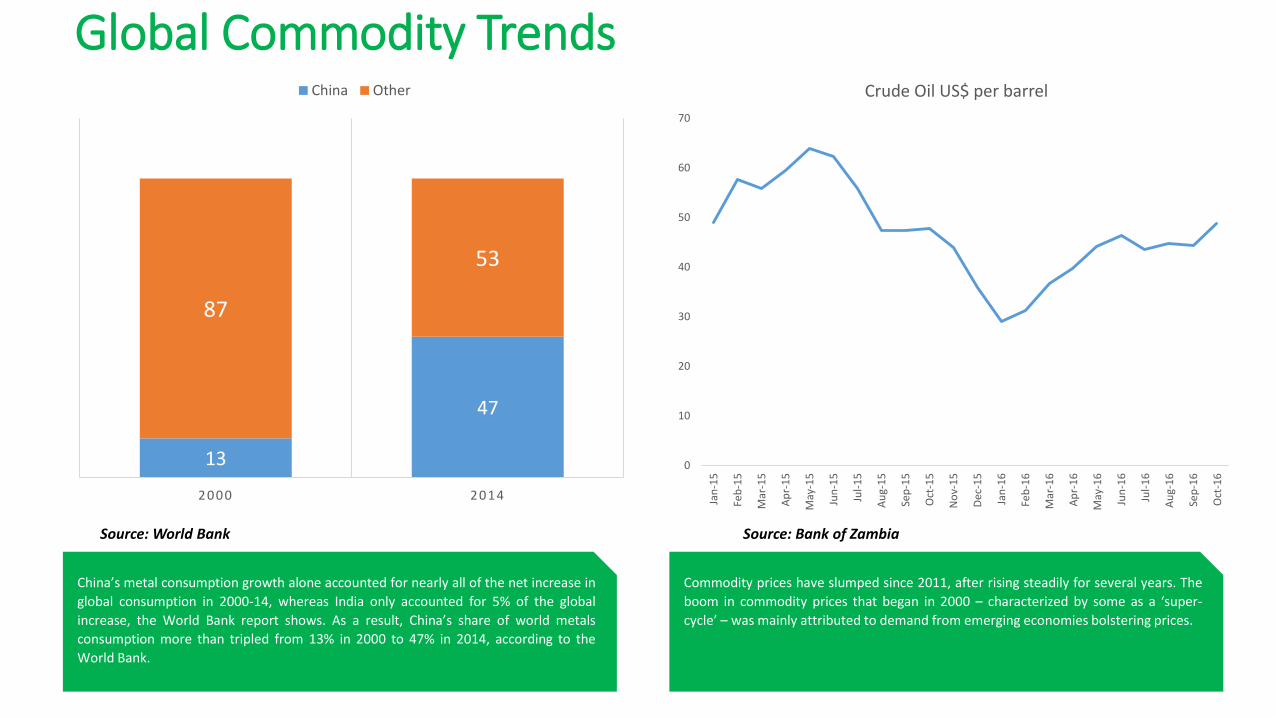
China’s metal consumption growth alone accounted for nearly all of the net increase in
global consumption in 2000-14, whereas India only accounted for 5% of the global
increase, the World Bank report shows. As a result, China’s share of world metals
consumption more than tripled from 13% in 2000 to 47% in 2014, according to the
World Bank.
Commodity prices have slumped since 2011, after rising steadily for several years. The
boom in commodity prices that began in 2000 – characterized by some as a ‘super-
cycle’ – was mainly attributed to demand from emerging economies bolstering prices.
Source: World Bank Source: Bank of Zambia

Global Commodity Trends
6.3
4.6
2011 2014
Commodity Exporting Country Growth
2.7
0.1
1.4
2.1
2013 2014
Brazil Mexico
IMF data shows real GDP growth in this group of countries decreased to 4.6% in 2014
from 6.3% in 2011, but the picture was mixed, as the commodity prices shifts have
created winners and losers in this volatile asset class.
Brazil, a commodity-exporting country, saw its GDP growth fall to 0.1% in 2014 from
2.7% in 2013. Meanwhile, Mexico, a manufacturing exporter boosted by low oil prices
saw its economic growth strengthen. Mexico’s real GDP rose to 2.1% in 2014 from
1.4% in 2013, and is projected to increase to 2.8% in 2016 from a projected 2.3% in
2015
Source: IMFSource: IMF
Most commodities are denominated in
dollars. But, the dollar's value has risen
over the past two years, making it
more expensive to sell and buy
commodities with respect to local
currencies. As a result, emerging
markets, which typically maintain
competitive exchange rates with
respect to the greenback, have been
hit by the dollar appreciation. The
result is a decline in overall commodity
sales.
The Dollar Effect

The Trump Effect: Make Copper Great Again
A big part of President-elect Donald Trump's appeal was his promise to restore, among other things, U.S. manufacturing and mining jobs that have disappeared over several decades. A big
infrastructure investment plan, however, does appear to be in the works, worth perhaps $1 trillion. Copper prices have surged on the back of it, up 13 percent since Tuesday and extending
a rally that began 3 weeks ago

The Trump Effect: Make Copper Great Again
China now accounts for more than half of global refined copper demand versus 7.5 percent for the U.S. That chart pretty much sums up the economic resentments that played some part in
Trump's victory. The salient point for copper investors, though, is that a 10 percent increase in U.S. copper demand is equivalent to less than a 1.5 percent increase in Chinese copper
consumption. And we haven't seen U.S. demand grow at anything close to that pace in almost 20 years.
Source: Wall Street Journal
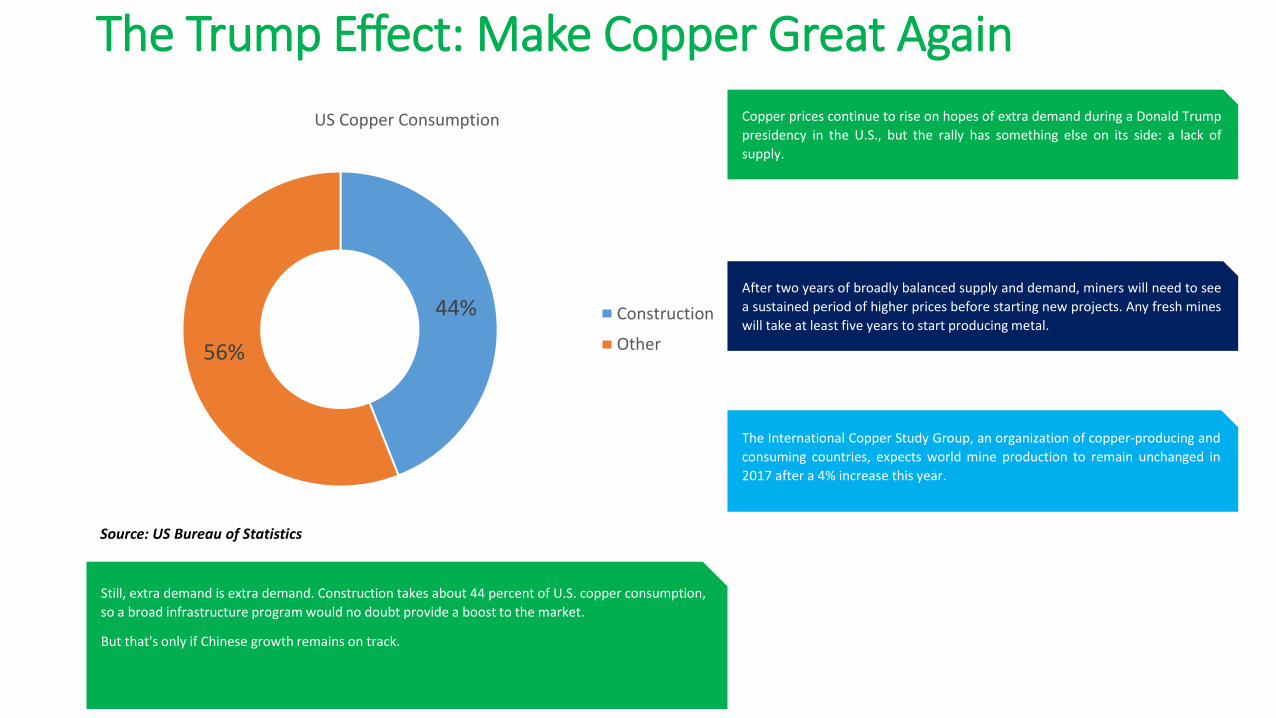
The Trump Effect: Make Copper Great Again
Still, extra demand is extra demand. Construction takes about 44 percent of U.S. copper consumption,
so a broad infrastructure program would no doubt provide a boost to the market.
But that's only if Chinese growth remains on track.
44%
56%
US Copper Consumption
Construction
Other
Copper prices continue to rise on hopes of extra demand during a Donald Trump
presidency in the U.S., but the rally has something else on its side: a lack of
supply.
After two years of broadly balanced supply and demand, miners will need to see
a sustained period of higher prices before starting new projects. Any fresh mines
will take at least five years to start producing metal.
The International Copper Study Group, an organization of copper-producing and
consuming countries, expects world mine production to remain unchanged in
2017 after a 4% increase this year.
Source: US Bureau of Statistics
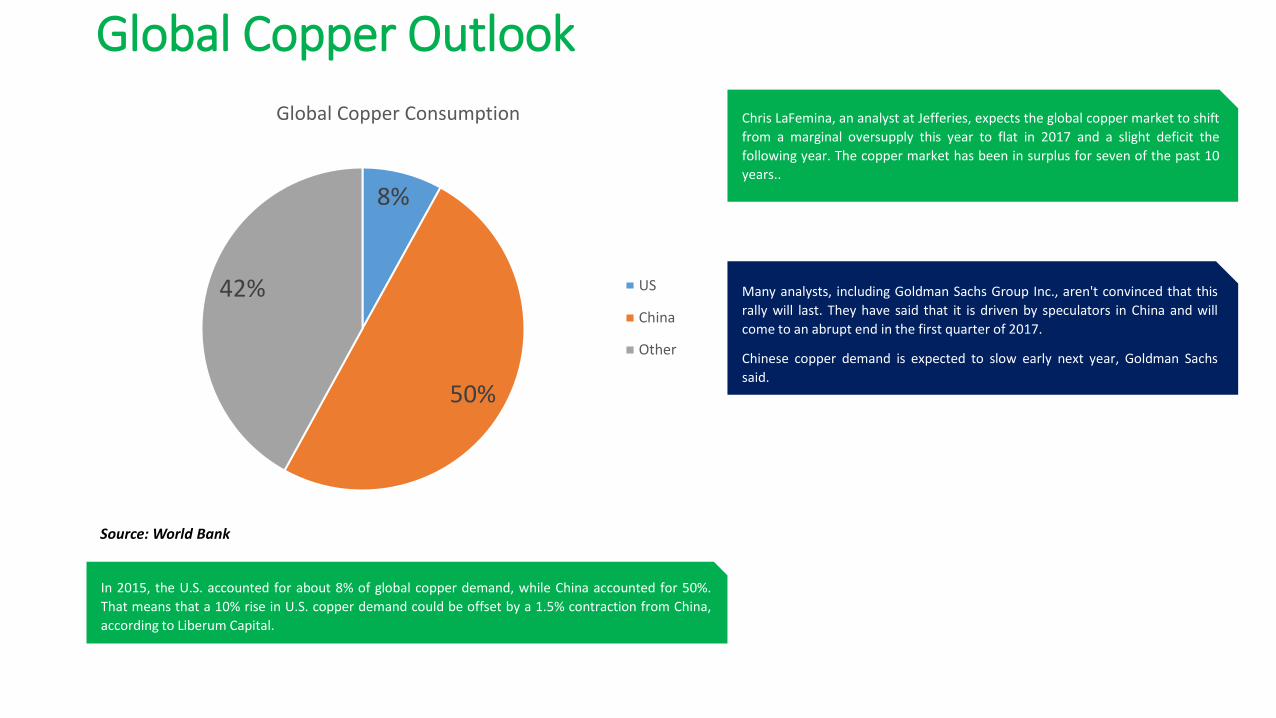
Global Copper Outlook
In 2015, the U.S. accounted for about 8% of global copper demand, while China accounted for 50%.
That means that a 10% rise in U.S. copper demand could be offset by a 1.5% contraction from China,
according to Liberum Capital.
Chris LaFemina, an analyst at Jefferies, expects the global copper market to shift
from a marginal oversupply this year to flat in 2017 and a slight deficit the
following year. The copper market has been in surplus for seven of the past 10
years..
Many analysts, including Goldman Sachs Group Inc., aren't convinced that this
rally will last. They have said that it is driven by speculators in China and will
come to an abrupt end in the first quarter of 2017.
Chinese copper demand is expected to slow early next year, Goldman Sachs
said.
8%
50%
42%
Global Copper Consumption
US
China
Other
Source: World Bank
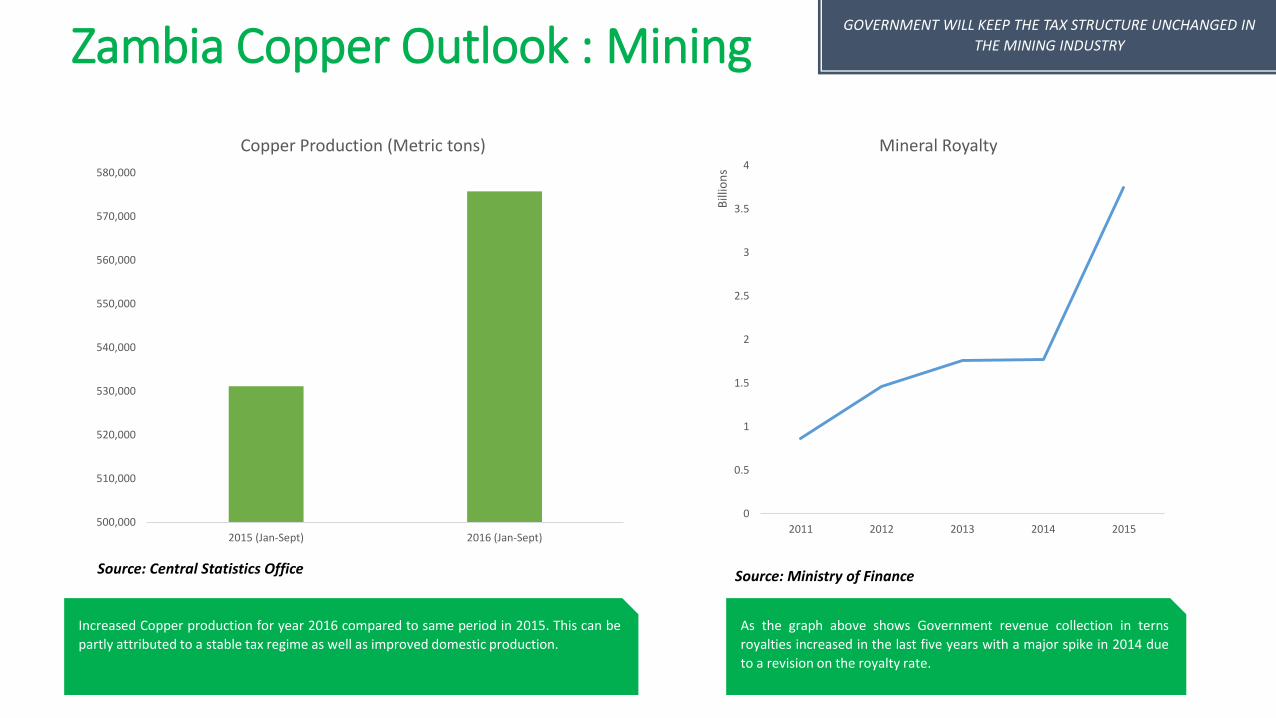
Zambia Copper Outlook : Mining
500,000
510,000
520,000
530,000
540,000
550,000
560,000
570,000
580,000
2015 (Jan-Sept) 2016 (Jan-Sept)
Copper Production (Metric tons)
0
0.5
1
1.5
2
2.5
3
3.5
4
2011 2012 2013 2014 2015
Bill
ion
s
Mineral Royalty
As the graph above shows Government revenue collection in terns
royalties increased in the last five years with a major spike in 2014 due
to a revision on the royalty rate.
Increased Copper production for year 2016 compared to same period in 2015. This can be
partly attributed to a stable tax regime as well as improved domestic production.
GOVERNMENT WILL KEEP THE TAX STRUCTURE UNCHANGED IN
THE MINING INDUSTRY
Source: Central Statistics Office Source: Ministry of Finance

Zambia Copper Outlook: Energy
65,881
183,659
48,020
375,549
71,454
5,526
77,925
23,052
395,944
2,729,904
4,414,352
OTHERS
AGRICULTURE
QUARRIES
MANUFACTURING
ENERGY AND WATER
CONSTUCTION
TRADE
TRANSPORT
FINANCE AND PROPERTY
SERVICES
MINING
- 500,000 1,000,000 1,500,000 2,000,000 2,500,000 3,000,000 3,500,000 4,000,000 4,500,000 5,000,000
SECTOR CONSUMPTION (MWh), JAN-SPET 2016
SECTOR CONSUMPTION
The bulk of electricity consumption still goes to the Mining sector followed by services, Finances and property and then manufacturing. Government has indicated in the 2017 budget that
it will begin negotiations to have power purchase agreements with the mines moved to cost reflective tariffs.
GOVERNMENT WILL MOVE TO COST REFLECTIVE TARIFFS BY END OF 2017 TO
ATTRACT PRIVATE SECTOR INVESTMENT WHILE MAINTAINING THE LIFE LINE TARIFF
TO PROTECT POORER HOUSEHOLDS.
Source: Zesco

Zambia Copper Outlook: Trade Balance
0
0.5
1
1.5
2
2.5
3
3.5
4
4.5
2015 (Jan-Sep) 2016 (Jan-Sep)
Export Earnings (US$ Billions)
Copper ExportEarnings
Non-TraditionalExport Earnings
-$2,000
-$1,500
-$1,000
-$500
$0
$500
$1,000
$1,500
$2,000
$2,500
Mill
ion
s
Trade balance
0
2
4
6
8
10
12
Bill
ion
s
Exports (US$) Imports (US$)
As the trade balance graph shows over the past 2 years Zambia has recorded trade deficits and more importantly Zambia’s gap between imports and exports began to narrow as far
back as 2011.This shows our terms of trade have deteriorated greatly owing to less copper exports. The outlook will remain bleak till sometime in 2018.
Source: Central Statistics Office Source: Central Statistics Office Source: Central Statistics Office

Zambia Copper Outlook: Exchange rate
Zambia’s exchange rate will also play a major part of the copper outlook in 2017 as Copper is priced in dollars. A stronger dollar relative to the Kwacha will dampen copper exports on the
international market.
0.0000
2.0000
4.0000
6.0000
8.0000
10.0000
12.0000
14.0000
16.0000
18.0000
20.0000
K/US$ K/Euro K/BPS K/ZAR
Source: Bank of Zambia
Contacts
For the Full Report on “The Global Economy-Effects on Commodity
Dependent Countries like Zambia” Contact:
Kampamba Shula – Programs Officer
26 Parairenyatwa Road,
Rhodes Park, Lusaka
Telephone: +260 211 842 088;
P.O. Box 38006
Twitter: @EAZambia
Facebook: Economics Association of Zambia