The global 21-cm signal in the context of the high-z...
15
MNRAS 464, 1365–1379 (2017) doi:10.1093/mnras/stw2412 Advance Access publication 2016 September 22 The global 21-cm signal in the context of the high-z galaxy luminosity function Jordan Mirocha, 1‹ Steven R. Furlanetto 1 and Guochao Sun 2 1 Department of Physics and Astronomy, University of California, Los Angeles, CA 90024, USA 2 Cahill Center for Astronomy and Astrophysics, California Institute of Technology, Pasadena, CA 91125, USA Accepted 2016 September 21. Received 2016 September 19; in original form 2016 July 1 ABSTRACT We build a new model for the global 21-cm signal that is calibrated to measurements of the high-z galaxy luminosity function (LF) and further tuned to match the Thomson scattering optical depth of the cosmic microwave background, τ e . Assuming that the z 8 galaxy popu- lation can be smoothly extrapolated to higher redshifts, the recent decline in best-fitting values of τ e and the inefficient heating induced by X-ray binaries (the presumptive sources of the high-z X-ray background) imply that the entirety of cosmic reionization and reheating occurs at z 12. In contrast to past global 21-cm models, whose z ∼ 20 (ν ∼ 70 MHz) absorption fea- tures and strong ∼25 mK emission features were driven largely by the assumption of efficient early star formation and X-ray heating, our new models peak in absorption at ν ∼ 110 MHz at depths ∼−160 mK and have negligible emission components. Current uncertainties in the faint-end of the LF, binary populations in star-forming galaxies, and UV and X-ray escape fractions introduce ∼20 MHz (∼50 mK) deviations in the trough’s frequency (amplitude), while emission signals remain weak (10 mK) and are confined to ν 140 MHz. These pre- dictions, which are intentionally conservative, suggest that the detection of a 21-cm absorption minimum at frequencies below ∼90 MHz and/or emission signals stronger than ∼10mK at ν 140 MHz would provide strong evidence for ‘new’ sources at high redshifts, such as Population III stars and their remnants. Key words: galaxies: high-redshift – intergalactic medium – galaxies: luminosity function, mass function – dark ages, reionization, first stars – diffuse radiation. 1 INTRODUCTION Galaxy evolution in the early Universe is most often studied from two distinct vantage points: through direct observations of high-z galaxies and measurements of the thermal and ionization history of the intergalactic medium (IGM). These two approaches are ex- ceptionally complementary, at least in principle, as the IGM is a repository of photons that never reach our telescopes. At the highest redshifts, due to limitations of even the most powerful space-based optical and near-infrared instrumentation, future constraints on the properties of the IGM will serve as an essential substitute for direct observations of galaxies themselves. As a result, the establishment of a framework for inferring galaxy properties from IGM signals is paramount. The canonical probe of high-z galaxies is the rest-frame ultravi- olet (UV) galaxy luminosity function (LF), i.e. the number density of galaxies per unit luminosity and redshift. Dedicated programmes using the Hubble Space Telescope (HST) have driven progress in this area at the highest redshifts so far probed, with healthy samples E-mail: [email protected] now extending to redshifts as high as z ∼ 8 (Bouwens et al. 2015; Finkelstein et al. 2015), and a number of candidates at 9 z 12 (e.g. Ellis et al. 2013; Oesch et al. 2014). The James Webb Space Telescope (JWST) will be very important for filling out the sample of galaxies at yet higher redshifts, but current models predict its reach will not extend beyond z ∼ 15 (e.g. Mason, Trenti & Treu 2015) without the aid of strong lensing, which has boosted HST’s capabilities in the Frontier Fields (Atek et al. 2015; Livermore, Finkelstein & Lotz 2016). Complementary IGM-based constraints on high-z galaxies are far more crude at this stage. The Thomson Scattering optical depth, τ e , for example, constrains the total column density of electrons be- tween the observer and the cosmic microwave background (CMB), while Gunn–Peterson troughs in quasar spectra mark the end of reionization at z ∼ 6 (e.g. Fan et al. 2002). Together, these con- straints provide a lower limit on the duration of the epoch of reion- ization (EoR), which one can parametrize as a reionization redshift, z rei , assuming an instantaneous transition from neutral to ionized. The Planck team recently reported a Thomson scattering optical depth to the CMB of τ e = 0.055 ± 0.009 (Planck Collaboration XLVI 2016), indicating z rei ∼ 8 ± 1, and thus a minimal duration of z rei ∼ 2. C 2016 The Authors Published by Oxford University Press on behalf of the Royal Astronomical Society
Transcript of The global 21-cm signal in the context of the high-z...

MNRAS 464, 1365–1379 (2017) doi:10.1093/mnras/stw2412Advance Access publication 2016 September 22
The global 21-cm signal in the context of the high-z galaxyluminosity function
Jordan Mirocha,1‹ Steven R. Furlanetto1 and Guochao Sun2
1Department of Physics and Astronomy, University of California, Los Angeles, CA 90024, USA2Cahill Center for Astronomy and Astrophysics, California Institute of Technology, Pasadena, CA 91125, USA
Accepted 2016 September 21. Received 2016 September 19; in original form 2016 July 1
ABSTRACTWe build a new model for the global 21-cm signal that is calibrated to measurements of thehigh-z galaxy luminosity function (LF) and further tuned to match the Thomson scatteringoptical depth of the cosmic microwave background, τ e. Assuming that the z � 8 galaxy popu-lation can be smoothly extrapolated to higher redshifts, the recent decline in best-fitting valuesof τ e and the inefficient heating induced by X-ray binaries (the presumptive sources of thehigh-z X-ray background) imply that the entirety of cosmic reionization and reheating occurs atz � 12. In contrast to past global 21-cm models, whose z ∼ 20 (ν ∼ 70 MHz) absorption fea-tures and strong ∼25 mK emission features were driven largely by the assumption of efficientearly star formation and X-ray heating, our new models peak in absorption at ν ∼ 110 MHzat depths ∼−160 mK and have negligible emission components. Current uncertainties in thefaint-end of the LF, binary populations in star-forming galaxies, and UV and X-ray escapefractions introduce ∼20 MHz (∼50 mK) deviations in the trough’s frequency (amplitude),while emission signals remain weak (�10 mK) and are confined to ν � 140 MHz. These pre-dictions, which are intentionally conservative, suggest that the detection of a 21-cm absorptionminimum at frequencies below ∼90 MHz and/or emission signals stronger than ∼10mK atν � 140 MHz would provide strong evidence for ‘new’ sources at high redshifts, such asPopulation III stars and their remnants.
Key words: galaxies: high-redshift – intergalactic medium – galaxies: luminosity function,mass function – dark ages, reionization, first stars – diffuse radiation.
1 IN T RO D U C T I O N
Galaxy evolution in the early Universe is most often studied fromtwo distinct vantage points: through direct observations of high-zgalaxies and measurements of the thermal and ionization historyof the intergalactic medium (IGM). These two approaches are ex-ceptionally complementary, at least in principle, as the IGM is arepository of photons that never reach our telescopes. At the highestredshifts, due to limitations of even the most powerful space-basedoptical and near-infrared instrumentation, future constraints on theproperties of the IGM will serve as an essential substitute for directobservations of galaxies themselves. As a result, the establishmentof a framework for inferring galaxy properties from IGM signals isparamount.
The canonical probe of high-z galaxies is the rest-frame ultravi-olet (UV) galaxy luminosity function (LF), i.e. the number densityof galaxies per unit luminosity and redshift. Dedicated programmesusing the Hubble Space Telescope (HST) have driven progress inthis area at the highest redshifts so far probed, with healthy samples
� E-mail: [email protected]
now extending to redshifts as high as z ∼ 8 (Bouwens et al. 2015;Finkelstein et al. 2015), and a number of candidates at 9 � z � 12(e.g. Ellis et al. 2013; Oesch et al. 2014). The James Webb SpaceTelescope (JWST) will be very important for filling out the sampleof galaxies at yet higher redshifts, but current models predict itsreach will not extend beyond z ∼ 15 (e.g. Mason, Trenti & Treu2015) without the aid of strong lensing, which has boosted HST’scapabilities in the Frontier Fields (Atek et al. 2015; Livermore,Finkelstein & Lotz 2016).
Complementary IGM-based constraints on high-z galaxies arefar more crude at this stage. The Thomson Scattering optical depth,τ e, for example, constrains the total column density of electrons be-tween the observer and the cosmic microwave background (CMB),while Gunn–Peterson troughs in quasar spectra mark the end ofreionization at z ∼ 6 (e.g. Fan et al. 2002). Together, these con-straints provide a lower limit on the duration of the epoch of reion-ization (EoR), which one can parametrize as a reionization redshift,zrei, assuming an instantaneous transition from neutral to ionized.The Planck team recently reported a Thomson scattering opticaldepth to the CMB of τ e = 0.055 ± 0.009 (Planck CollaborationXLVI 2016), indicating zrei ∼ 8 ± 1, and thus a minimal durationof �zrei ∼ 2.
C© 2016 The AuthorsPublished by Oxford University Press on behalf of the Royal Astronomical Society

1366 J. Mirocha, S. R. Furlanetto and G. Sun
Efforts to jointly interpret the aforementioned measurements havelargely been geared towards reconciliation. Does the number of pho-tons generated by the galaxies we do see match the number requiredto maintain a state of full ionization in the IGM? Furthermore, isthe population of galaxies in place prior to full reionization sub-stantial enough to match the most up-to-date measurements of τ e?The answer to both of these questions is ‘yes’, provided one makesreasonable assumptions about (i) the abundance of galaxies we donot see (i.e. extrapolations to the LF), and (ii) the escape fractionof Lyman continuum (LyC) photons from galaxies, fesc,LyC. Recentwork suggests that extrapolating the Schechter form of the LF tolow luminosities may well be reasonable (Livermore et al. 2016),at least at z ∼ 6, while the fesc,LyC ∼ 0.2 values that have causeddiscomfort in recent years may be now reasonable if the UV emis-sion of star clusters is boosted by binary star evolution (Eldridge &Stanway 2009; Ma et al. 2016; Stanway, Eldridge & Becker 2016).
Despite such reduced tensions between theory and observation,the story of galaxy evolution in the early Universe is far fromcomplete. In the coming years, observations of redshifted 21-cmemission from neutral hydrogen are expected to contribute sub-stantially to our existing understanding of reionization and high-zgalaxies while opening up a brand new window into the excita-tion (or ‘spin’) temperature history of the high-z IGM (e.g. Madau,Meiksin & Rees 1997; Furlanetto, Oh & Briggs 2006). As a result,21-cm measurements promise to weigh in on long-standing ques-tions regarding the ionizing photon production efficiency of high-zgalaxies, the nature of X-ray sources (Pritchard & Furlanetto 2007;Fialkov, Barkana & Visbal 2014b; Pacucci et al. 2014; Ewall-Wiceet al. 2016, e.g.), and perhaps even the properties of the interstellarmedium of high-z galaxies, which can serve as both a source ofradiation (e.g. bremsstrahlung; Mineo, Gilfanov & Sunyaev 2012a)and sink for LyC, X-ray, and perhaps even Lyman–Werner (LW)photons (Kitayama et al. 2004; Schauer et al. 2015), whose escapefraction we consider in Section 3.5 for the first time in a 21-cmcontext.
Studies aimed at better understanding the complementarity of21-cm measurements and other EoR probes, though few so far,demonstrate that even crude 21-cm constraints can greatly aid ourunderstanding of reionization and high-z galaxies (Pritchard, Loeb& Wyithe 2010; Beardsley et al. 2015). Preliminary results from thePrecision Array for Probing the Epoch of Reionization (PAPER)have since bolstered these arguments, finding the first observationalevidence of X-ray heating of the high-z IGM through upper limitson the 21-cm power spectrum (Parsons et al. 2014; Ali et al. 2015;Pober et al. 2015; Greig, Mesinger & Pober 2016), and thus con-strained the X-ray properties of z ∼ 8 galaxies for the first time. Thecomplementarity can be viewed from the opposite perspective aswell, since constraints on high-z galaxies can in principle be usedto better separate signal from foreground (Petrovic & Oh 2011).
The sky-averaged (global) 21-cm signal (Shaver et al. 1999),now being targeted by several ground-based experiments (e.g. Ex-periment to Detect the Global EoR Signal, Broadband Instrumentfor Global HydrOgen ReioNisation Signal, Sonda Cosmologica delas Islas para la Deteccion de Hidrogeno Neutro, Shaped Antennameasurement of the background RAdio Spectrum, Large-AperatureExperiment to Detect the Dark Ages (LEDA); Bowman & Rogers2010; Voytek et al. 2014; Patra et al. 2015; Sokolowski et al. 2015;Bernardi et al. 2016), with more concepts in design (e.g. Dark AgesRadio Explorer (DARE); Burns et al. 2012), is a particularly clear-cut ally of galaxy surveys as it is sensitive to the volume-averaged(i.e. LF integrated) emissivity of galaxies. The mean ionizationand spin temperature histories encoded by the global 21-cm signalof course influence the 21-cm power spectrum as well. The joint
constraining power of the power spectrum and global signal was re-cently considered by Liu & Parsons (2016), though to the best of ourknowledge the 21-cm signal (sky average or power spectrum) andgalaxy LF have yet to be considered in a common framework. Thishas prevented 21-cm models from calibrating to recent advancesdriven by HST, and as a result has led to predictions spanning awide range of possibilities (e.g. Furlanetto 2006; Pritchard & Loeb2010; Mesinger, Ferrara & Spiegel 2013; Fialkov et al. 2014b;Mirocha, Harker & Burns 2015; Tanaka, O’Leary & Perna 2016).
Our goal here is to address these issues in two steps.
(i) Leverage the success of simple models for the galaxy LF(e.g. Trenti et al. 2010; Tacchella, Trenti & Carollo 2013; Sun &Furlanetto 2016) to create a new ‘vanilla model’ for the global21-cm signal calibrated both to the LF (Bouwens et al. 2015) andτ e (Planck Collaboration XLVI 2016).
(ii) Explore simple extensions to the standard picture of the LF inan attempt to determine the global 21-cm signal’s sensitivity to theproperties of the faint galaxy population, and thus more concretelydetermine how its detection will complement future galaxy surveysand 21-cm power spectrum experiments.
In the near term, these models can be used to test signal extrac-tion algorithms and better inform instrument design. In the longerterm, our models will provide a reference point from which to inter-pret a global 21-cm measurement in the broader context of galaxyformation.
This paper is organized as follows. In Section 2, we outlineour theoretical model for the galaxy population and global 21-cmsignal. In Section 3, we present our main results, including ourLF-calibrated model for the global 21-cm signal, its sensitivity tothe star formation efficiency of faint galaxies, the stellar and blackhole populations of high-z galaxies, and the escape fraction of UVand X-ray photons. We provide some discussion of our results inSection 4 and summarize our main conclusions in Section 5. Weuse cosmological parameters from Planck Collaboration XIII (2016)throughout.
2 MO D E L L I N G F R A M E WO R K
Our model has essentially two parts: (i) a model for the galaxypopulation, whose properties are derived from the dark matter (DM)halo mass function (HMF) and assumptions about the relationshipbetween halo mass and halo luminosity, and (ii) a model for theglobal 21-cm signal, which takes the volume-averaged emissivity ofthe galaxy population as input, and from it determines the ionizationand thermal history of the IGM. Though its individual componentsare similar to models appearing in the literature in recent years,in this section we briefly outline the procedure to emphasize theconnection between the galaxy LF and global 21-cm signal, whichto our knowledge have yet to be considered in a common framework.
2.1 Constructing the UV luminosity function
Our model is motivated by recent studies of the high-z galaxy LFbased on abundance matching (Mason et al. 2015; Mashian, Oesch& Loeb 2016; Sun & Furlanetto 2016). The mismatch between theshape of the DM HMF and the galaxy LF can be accounted for by (i)a mass-dependent occupation fraction or duty cycle, fDC, of galaxiesin haloes (e.g. Trenti et al. 2010) and/or (ii) differential evolution ofgalaxy luminosity, Lh, with halo mass, Mh, and/or redshift, z (e.g.Mason et al. 2015; Mashian et al. 2016; Sun & Furlanetto 2016).
Unfortunately, these two approaches cannot be distinguishedby measurements of luminosity functions alone. Because there is
MNRAS 464, 1365–1379 (2017)
The global 21-cm signal in context 1367
theoretical support for consistent active star formation in haloes athigh-z (except perhaps in very low mass haloes; e.g., O’Shea et al.2015; Xu et al. 2016), we will operate within the Lh = Lh(Mh, z)framework [scenario (i)] rather than invoking fDC < 1.
In this case, the intrinsic LF can be expressed as
dφ(Lh) = dn(Mh, z)
dMh
(dLh
dMh
)−1
dLh, (1)
where n(Mh, z) is the number density of haloes of mass Mh at redshiftz and φ is the galaxy LF. Equation (1) is equivalent to the observedLF only under the assumption that all photons in the observed band(rest-frame 1600 Å here) escape galaxies. In general, this is not thecase, as some rest-frame 1600 Å photons will be absorbed by dustbefore they can escape the galaxy. However, we will ignore dust inwhat follows as our calculations are restricted to z � 6, at whichtime dust extinction has only a minor impact on the conversionbetween the observed and intrinsic LF (e.g. Bouwens et al. 2012;Capak et al. 2015).
Recent work suggests that Lh must evolve with redshift if it isto fit all high-z data (e.g. Mason et al. 2015; Mashian et al. 2016;Sun & Furlanetto 2016). One approach is to parametrize Lh directlyas a function of both halo mass and redshift and solve for thedependences required to fit high-z LFs (Mashian et al. 2016). Wewill adopt a slightly different approach, which we describe below.
First, because the observed LF of high-z galaxies probes rest-frame UV luminosity, which is dominated by massive young stars,we take the intrinsic luminosity of galaxies to be
Lh,ν = M∗(Mh, z)Lν, (2)
where M∗ is the star formation rate (SFR) and Lν is a conversionfactor which sets the luminosity (in band ν) per unit star formation.
In general, Lν , could depend on Mh and z, though for the remain-der of this study we will assume it is a constant. For our fiducialmodels we adopt the BPASS version 1.0 models without binaries(Eldridge & Stanway 2009), from which the photon production at1600Å, L1600, and in the LW and LyC bands, LLyC and LLW, can becomputed self-consistently from a choice of the stellar metallicity,Z, and in general the stellar initial mass function (IMF), nebularemission, and so on. We compare results obtained using modelswith binaries, as well as those obtained using STARBURST99 (Lei-therer et al. 1999) in Appendix A.
We model the SFR as (e.g. Sun & Furlanetto 2016)
M∗(Mh, z) = f∗(Mh, z)Mb(z,Mh), (3)
where Mb(z,Mh) is the baryonic mass accretion rate (MAR) onto a DM halo of mass Mh at redshift z, and f∗ is the efficiency ofstar formation. The baryonic MAR is well approximated by (e.g.McBride, Fakhouri & Ma 2009; Dekel et al. 2013)
Mb(z,Mh) = fbMh,0MγM
h (1 + z)γz (4)
with γ M ∼ 1 and γ z ∼ 5/2, where Mh,0 is a normalization constantand fb is the primordial baryon fraction.
However, rather than adopting a parametric form for the MARcalibrated by simulations, we derive it directly from the HMF. Thebasic idea is to abundance match haloes across redshifts, and inso doing determine their trajectories through mass space. This ap-proach ensures self-consistency, as, for example, a population ofhaloes evolved forward in time through an MAR model will notnecessarily match an independently generated model for the HMFat all times. See Furlanetto et al. (in preparation) for more details.
For our fiducial model, we assume the star formation efficiency(SFE) is a double power law (DPL) in Mh, i.e.
f∗(Mh) = f∗,0(MhMp
)γlo +(
MhMp
)γhi, (5)
where f∗,0 is the SFE at its peak mass, Mp, and γ lo and γ hi describethe power-law index at low and high masses, respectively. We willconsider two additional modifications to this form in Section 3, andthe possibility of a redshift dependence in Section 4.
Equations (1)–(5) define our model for the galaxy LF, which is ahybrid between physical and empirical models, as the foundation ofour model is the HMF but we treat the SFE using a phenomenologi-cal model whose parameters must be calibrated by observations. Asa result, we will need to extrapolate the SFE to lower mass haloesand higher redshifts than are represented in our calibration data setin order to model the global 21-cm signal. Part of our goal in Sec-tion 3 is to determine how these extrapolations to the SFE – whichare equivalent to extrapolations in the galaxy LF – affect the global21-cm signal.
2.2 Generating the global 21-cm signal
We adopt the commonly used two-zone model for the IGM (e.g.Furlanetto 2006; Pritchard & Loeb 2010) in which the volume-filling factor of ionized regions (QH II) and the electron fraction(xe) and kinetic temperature (TK) of the ‘bulk IGM’ outside fullyionized regions are treated separately. In order to solve for thesethree quantities, one requires (i) a model for the volume-averagedemissivity of galaxies, εν(z), (ii) an algorithm to compute the meanbackground intensity, Jν , i.e. the volume-averaged emissivity atten-uated by neutral IGM gas and diluted by cosmic expansion, and (iii)a non-equilibrium chemical reaction network which solves for theevolution of QH II, xe, and TK in response to the photoionization andheating rates set by Jν .
With a model for the luminosities of individual galaxies, thevolume-averaged emissivity can be computed via integration of thegalaxy LF weighted by the escape fraction and luminosity in therelevant band,
εν(z) =∫ ∞
Lmin
fesc,νLh,ν
dφ(Lh,ν)
dLh,ν
dLh,ν . (6)
We allow the escape fraction in the 10.2–13.6 eV band (whichwe refer to loosely as the LW band), fesc,LW, to differ from theLyC escape fraction, fesc,LyC, though both are treated as constant,frequency-independent quantities. For X-rays, it is more sensibleto parametrize the escape fraction with a neutral hydrogen columndensity, which hardens the intrinsic X-ray spectrum differentiallyas a function of frequency, i.e.
fesc,ν = exp[−NH I(σH I,ν + yσHe I,ν)
]. (7)
Here, y is the primordial helium abundance by number, and σH I,ν
and σHe I,ν are the bound-free cross-sections for neutral hydrogenand neutral helium, respectively. Note that this expression assumesthat NHe I = yNH I, i.e. the neutral helium fraction is equal to theneutral hydrogen fraction, and ignores the opacity of singly ionizedhelium.
With models for the volume-averaged emissivity in hand, the ion-ization and heating rates in each phase of the IGM can be computed,and the ionization states and kinetic temperatures evolved forwardin time. For the fully ionized phase of the IGM, the ionization rategoverns the rate at which the volume of ionized bubbles grows,while the temperature is held fixed at TK = 2 × 10⁴ K.
MNRAS 464, 1365–1379 (2017)

1368 J. Mirocha, S. R. Furlanetto and G. Sun
Solving for the ionization state and temperature of the bulk IGMis more challenging. We solve the cosmological radiative transferequation to determine the meta-galactic radiation background in-tensity, Jν , which can be done efficiently assuming a neutral high-zIGM1 (Mirocha 2014).
We model Lν for X-ray sources as a multicolour disc (MCD)spectrum (Mitsuda et al. 1984) appropriate for high-mass X-ray bi-naries (HMXBs), which are now known to be important for reioniza-tion (Fragos et al. 2013; Power et al. 2013) and 21-cm models (e.g.Fialkov et al. 2014b; Mirocha 2014). We assume black holes (BHs)with masses M• = 10 M� and normalize the MCD spectrum to theobserved X-ray luminosity–star formation rate (LX–SFR) relation,which we will discuss in more detail in Section 3.4.
The differential brightness temperature can then be computed as(e.g. Furlanetto 2006)
δTb � 27(1 − xi)
(�b,0h
2
0.023
) (0.15
�m,0h2
1 + z
10
)1/2 (1 − Tγ
TS
),
(8)
where xi = QH II + (1 − QH II)xe and
T −1S ≈ T −1
γ + xcT−1
K + xαT −1α
1 + xc + xα
(9)
is the excitation or ‘spin’ temperature of neutral hydrogen, whichcharacterizes the number of hydrogen atoms in the hyperfine tripletstate relative to the singlet state, and Tα � TK. We compute the col-lisional coupling coefficient, xc, using the tabulated values in Zygel-man (2005) and take the radiative coupling coefficient (Wouthuysen1952; Field 1958) to be xα = 1.81 × 10¹¹JαSα/(1 + z), where Sα isa factor of order unity that accounts for line profile effects (Chen &Miralda-Escude 2004; Chuzhoy, Alvarez & Shapiro 2006; Furlan-etto & Pritchard 2006; Hirata 2006), and Jα is the intensity of theLy α background in units of s−1 cm−2 Hz−1 sr−1.
All calculations were carried out with the ARES code.2 WithinARES, we use the hmf-calc code (Murray, Power & Robotham2013), which itself depends on the Code for Anisotropies in theMicrowave Background (CAMB; Lewis, Challinor & Lasenby 2000),to compute the HMF, which we take to be the Sheth, Mo & Tormen(2001) form. Regarding the Wouthuysen–Field coupling, we use theanalytic formulae from Furlanetto & Pritchard (2006) to determineSα and adopt the recycling fractions (of Ly n → Ly α photons) fromPritchard & Furlanetto (2006). We use the lookup tables of Furlan-etto & Johnson Stoever (2010) to determine the fraction of photo-electron energy deposited as heat and further ionization, bound-freeabsorption cross-sections of Verner & Ferland (1996), while recom-bination and cooling rate coefficients were taken from Fukugita &Kawasaki (1994). We generate initial conditions using the COSMOREC
code (Chluba & Thomas 2011), and adopt Planck cosmological pa-rameters (Planck Collaboration XIII 2016). Fiducial parameters arelisted in Table 1.
3 R ESULTS
In this section, we present first the calibrated SFE model and itsuncertainties (Section 3.1) along with the resultant LF and global 21-cm signal predictions (Section 3.2). Then, we proceed to investigatehow sensitive the global 21-cm signal is to the minimum mass
1 Accounting for the late-time softening of the meta-galactic X-ray back-ground as reionization progresses has a negligible impact on our results.2 https://bitbucket.org/mirochaj/ares
Table 1. Fiducial model parameters. Note that the last four rows containthe best-fitting values for the parameters of equation (5), which are obtainedthrough our calibration procedure (see Section 3.1).
Name Value Description
fesc,LW 1.0 Escape fraction of 10.2–13.6 eV photonsfesc,LyC 0.1 Escape fraction of LyC photonsNH I 0 Absorbing column of X-ray sourcesTmin (K) 104 Virial temperature thresholdZ 0.02 Stellar metallicityf∗ dpl Functional form of SFE
f∗,0 0.05 SFE normalizationMp(M�) 2.8 × 10¹¹ Halo mass at which f∗ peaksγ lo 0.49 Low-mass slope of f∗(Mh)γ hi −0.61 High-mass slope of f∗(Mh)
of star-forming galaxies (Section 3.3), their stellar and black holepopulations (Section 3.4), and the escape fraction of LW, LyC, andX-ray photons (Section 3.5). Because we are focused principallyon ‘vanilla’ models, i.e. realizations of the signal brought aboutby galaxies as we (think we) understand them, we do not in thissection consider contributions from PopIII stars, ‘miniquasars’, orother non-standard or unobserved sources of the high-z LW, LyC,and X-ray radiation backgrounds. We will discuss such sourcesagain in Section 4.
3.1 Model calibration
We fit for the four parameters of equation (5) using the affine-invariant Markov Chain Monte Carlo (MCMC) code EMCEE
(Foreman-Mackey et al. 2013). We adopt the Bouwens et al. (2015)measurements of the LF at z ∼ 6, 7, and 8 as our calibration dataset (their table 5). Our likelihood function is then
l(x|θ) = �Nz
i �NMj pij , (10)
where the index i runs over redshift bins and j runs over magnitudebins. pij is the probability of the data, x, given the model, describedby parameters θ , i.e.
pij = 1√2πσ 2
ij
exp
{− [φ(zi, Mj ) − φ(zi, Mj |θ )]2
2σ 2ij
}, (11)
Here, σ ij is the uncertainty in the number density of galaxies atredshift zi in magnitude bin Mj, which we force to be Gaussian whennecessary simply by averaging the occasional asymmetric error barquoted in Bouwens et al. (2015). We adopt broad uninformativepriors on each model parameter of interest.
In Fig. 1, we show our reconstructed SFE curve (solid black line)and its 68 per cent and 95 per cent confidence intervals (dark andlight grey regions, respectively), both of which agree well with otherrecent work (Mason et al. 2015; Sun & Furlanetto 2016). Note thecharacteristic peak at Mh ∼ 3 × 10¹¹M� and the peak efficiencyof ∼0.05, in contrast to the common assumption of a constant ‘ef-fective’ efficiency in all haloes above the atomic cooling threshold.The overall normalization of the SFE is uncertain by a factor ofseveral (not pictured in Fig. 1), as it depends on the assumed stellarpopulation, HMF, and in general, the dust correction. However, thisuncertainty in the normalization does not translate to a comparableuncertainty in the volume-averaged ionization or thermal history,since the ionization and heating rates depend on the luminositydensity. We will revisit this point in Section 3.4 and Appendix A.
MNRAS 464, 1365–1379 (2017)

The global 21-cm signal in context 1369
Figure 1. Calibrated SFE curve computed using the Bouwens et al. (2015)data at z ∼ 6. The solid black line is the maximum likelihood SFE curve,with dark and light grey regions denoting regions containing 68 per centand 95 per cent of the likelihood, respectively. Note that the boundariesof shaded regions do not necessarily correspond to realizations of the SFEcurve, as they are determined through computation of the 68 per cent and95 per cent ranges for each Mh independently. Shown for reference are thehalo masses corresponding to virial temperatures of 103, 104, and 105 K atredshifts z = 6, 10, and 20 (upper left). The dashed and dotted curves aresimple extensions to the pure DPL SFE curve explored in subsequent figures.MUV = −17 corresponds to a halo mass of ∼109 M� for our fiducial model.
The uncertainties in f∗ grow at both the low- and high-mass ends.Though the SFE of high-mass galaxies almost certainly encodesinteresting physics, such sources are probably too rare to makean impact on the global 21-cm signal. As a result, we will focusprincipally on possible behaviours in the low-mass end of the SFE,equivalent to the faint-end of the galaxy LF, and leave questionsregarding the bright-end to be addressed properly by WFIRST inthe years to come.
We will consider two simple phenomenological extensions tothe pure DPL SFE model in the remainder of the paper, whichwe refer to as the floor and steep models, as identified bydashed and dotted lines in Fig. 1, respectively. The floormodel isimplemented by adding a constant 0.5 per cent SFE in haloes below109 M�, while the steep model is a multiplicative modificationto the dpl model of the form
f∗(Mh) =[
1 + (2μ/3) − 1
) (Mh
Mc
)−μ]−3/μ
, (12)
with μ = 1 and Mc = 1010M�. The floormodel resembles somephysical models (e.g. Mason et al. 2015), while the steep modelis similar (though much more extreme) than occupation fractionpredictions from recent numerical simulations (e.g. O’Shea et al.2015, who found μ ∼ 1.5 and Mc ∼ 6 × 10⁷M�). However, ourmain motivation for adopting these particular extensions to the SFEis that their corresponding τ e values differ by an amount comparableto the 1σ confidence interval for τ e recently published by the Planckteam, assuming fesc = 0.1 and Tmin = 104 K, as we will see in thenext section.
3.2 The luminosity function – global 21-cm connection
In Fig. 2, we present the main result of this paper: models forthe galaxy LF and corresponding predictions for the global 21-cmsignal. We match the z ∼ 6 LF as measured by Bouwens et al.(2015) by construction. Our best-fitting model is again represented
by the solid black line, with 68 per cent confidence region denotedby the shaded grey region, and phenomenological SFE floor andsteep extensions shown as dashed and dotted curves. The insetshows the Thomson optical depth of the CMB for each SFE model,relative to the Planck measurement of τ e = 0.055 ± 0.009 (PlanckCollaboration XLVI 2016), assuming fesc,LyC = 0.1.
The SFE behaviour affects the predicted global 21-cm signalas well, as shown in the right-hand panel of Fig. 2. Imposing afloor in the SFE in low-mass galaxies causes earlier features inthe global 21-cm signal, while a steep decline in the SFE causeslater features. All three curves are deep (∼−160 ± 10 mK), andoccur at frequencies 95 � ν � 125 MHz. The dpl and floormodels have a very weak �5 mK emission feature, which wouldbe extremely difficult to detect observationally. Indeed, the steepmodel lacks an emission feature entirely.
Realizations of the global 21-cm signal similar to those of Fig. 2 –though not quite as extreme – have appeared in the literature before,most often a byproduct of restricting star formation to massivehaloes, assuming a dramatic suppression of X-ray emissions perunit star formation in high-z galaxies (e.g. Pritchard & Loeb 2010;Mesinger et al. 2013; Mirocha et al. 2015), or assuming that thespectra of X-ray sources are very hard (Fialkov et al. 2014b).3
In contrast, the minimum mass of star-forming galaxies playsonly a minor role in our framework (as in Sun & Furlanetto 2016,see also Section 3.3). Our preference for models with strong high-frequency absorption features and weak (or non-existent) emissionfeatures is instead driven primarily by:
(i) the relatively inefficient f∗ ∼ 5 per cent peak star formationefficiency and f∗ � 1 per cent in low-mass (but very abundant)haloes, in contrast to the fiducial ∼10 per cent;
(ii) the steady reduction in τ e over the last few years (PlanckCollaboration XIII 2016; Planck Collaboration XLVI 2016), whichsupports compressed reionization histories;
(iii) suggestive evidence that the high-z X-ray background isdominated by X-ray binaries (Brorby et al. 2016; Lehmer et al.2016), which have hard spectra and thus lead to relatively inefficientheating of the IGM.
We are inclined to give our late-absorption (or ‘cold reionization’)models more weight than was perhaps warranted in years past giventheir explicit calibration to the known high-z galaxy population.Madau & Fragos (2016) recently came to a similar conclusion usingup-to-date constraints on the star formation history and a synthesismodel for binary systems.
Given the recent interest in the spin temperature of the high-z IGM, we show our predictions for the mean spin temperatureat z = 8.4 in the right-most inset of Fig. 2. The hatched regionindicates unphysical values, while the grey region is disfavouredby the PAPER limits on the power spectrum (the most pessimisticlimits quoted in Greig et al. 2016).
From an observational standpoint, the magnitude of changes inthe global 21-cm signal brought about by changes in the SFE modelare encouragingly large, as several forecasting studies have pre-dicted that the absorption minimum of the global 21-cm signalcan be recovered with an accuracy of �1 MHz in frequency and
3 Each of the aforementioned models, including ours, qualitatively agreewhen star formation is assumed to occur only in atomic cooling haloes witha constant efficiency, independent of the modelling approach adopted. See,e.g. figs 2, 9, 1, and 2 of Pritchard & Loeb (2010), Mesinger et al. (2013),Mirocha et al. (2015), and Fialkov et al. (2014b), respectively.
MNRAS 464, 1365–1379 (2017)

1370 J. Mirocha, S. R. Furlanetto and G. Sun
Figure 2. Left: LFs at z ∼ 6 using the SFE curves shown in Fig. 1. Observational data from Bouwens et al. (2015) and Finkelstein et al. (2015) are shown inred and blue, respectively, though only the red points were used in the fit. The grey region is the 68 per cent confidence interval, and dashed and dotted curvesare the same extensions to the fiducial dpl SFE model as shown in Fig. 1. Inset shows the CMB optical depth, relative to the recent Planck measurement ofτ e = μ ± σ , with (μ, σ ) = (0.055, 0.009). Right: models of the global 21-cm signal corresponding to the LF models of the left-hand panel. The inset shows themean IGM spin temperature of each model at z = 8.4 relative to the unphysical adiabatic cooling limit (hatched region) and lower limits from PAPER (shadedregion).
�10–20 mK in amplitude, at least for ideal instruments (e.g.Pritchard & Loeb 2010; Harker et al. 2012; Liu et al. 2013; Bernardiet al. 2016; Harker et al. 2016). As a result, even a crude mea-surement of the global 21-cm signal could provide a much-neededconstraint on the faint galaxy population in the early Universe.The goal of the remaining sections is to explore the degree towhich uncertainties in other model parameters can complicate thisprocedure.
Before moving on, note that had we adopted the Finkelstein et al.(2015) LFs instead of the Bouwens et al. (2015) LFs our fiducial SFEwould be systematically lower than that shown in Fig. 1 by about∼15 per cent. As a result, reionization and reheating would occurlater, and lead to a global 21-cm signal with even later featuresthan those of Fig. 2. The impact of the calibration data set canthus have important consequences, a point which we will revisit inSection 4.4.
3.3 Influence of the minimum mass of star-forming haloes
Results shown in the previous section assumed that the minimummass of star-forming galaxies is set by the atomic cooling threshold(return to Fig. 1 for a guide between Mmin (z) and Tmin). Of course,star formation may proceed in lower mass haloes via H2 cooling,at least until a strong LW background develops (Haiman, Rees &Loeb 1997), or perhaps could be restricted to more massive haloesif thermal feedback is effective (Gnedin 2000). Though the modeof star formation is not expected to be the same above and belowthe atomic threshold, we continue none the less in order to establisha reference case, devoting more thorough investigations includingfeedback to future work.
In Fig. 3, we show how the global 21-cm signal depends onthe low-mass SFE and Tmin. The effects are most dramatic for thefloor SFE model (top panel), consistent with the Sun & Furlan-etto (2016) result in the context of τ e (their fig. 9). If Tmin = 104 K,the signal shifts to lower frequencies by ∼10 MHz and becomesdeeper by ∼10 mK in amplitude relative to our fiducial dplmodel. Decreasing Tmin to 103 K, corresponding to halo massesof ∼106−107 M� shifts the signal by ∼20 MHz towards lower
frequencies, while adopting Tmin = 102.5 K pushes the signal tolower frequencies by another ∼10 MHz. These shifts are not with-out consequence, however, as the CMB optical depth for the Tmin
≤ 103 K models are inconsistent with the Planck measurement atthe 95 per cent confidence level (see inset). A reduction in the es-cape fraction or in the efficiency of stellar LyC photon production(relative to 1600 Å production) would be required to resolve thisdiscrepancy.
For our fiducial model (middle panel of Fig. 3), Tmin has a rel-atively minimal effect. At most, the absorption minimum shifts∼10 MHz relative to the fiducial case, with a negligible differencebetween the 102.5 and 103 K cases. The dpl SFE is apparently steepenough that the contribution of very low mass galaxies is negligible,effectively removing the importance of Tmin.
Lastly, invoking a steep decline in the SFE (bottom panel ofFig. 3) shifts the global 21-cm signal absorption minimum to higherfrequencies, as star formation is restricted to the most massive – andmost rare – haloes. The same effect could be achieved by raising thevirial temperature threshold to Tmin � 105 K, which could occur dueto thermal feedback (Gnedin 2000). However, note that in this caseτ e is approaching the 2σ lower limit of Planck. Boosting τ e wouldrequire fesc,LyC � 0.1 or an enhancement in the LyC productionefficiency (relative to 1600 Å production). As a result, we willadopt Tmin = 104 K in the sections that follow and investigate theimpact of the stellar population model (Section 3.4) and the escapefraction (Section 3.5) quantitatively under this assumption.
3.4 Stellar population effects
Fig. 3 suggests that Tmin may still hold some power over the global21-cm signal, though only if the SFE flattens (LF steepens) at lowmasses. Even in this case, Tmin primarily affects the timing of thespectral features in the global 21-cm signal, with a much less dra-matic influence on their amplitude. This may be encouraging –perhaps then deviations from the amplitude of the trough in ourreference model could provide clean evidence of other effects in-dependent of its frequency. We focus in this section on how such
MNRAS 464, 1365–1379 (2017)

The global 21-cm signal in context 1371
Figure 3. Effects of the minimum virial temperature, for the floor SFEmodel (top), DPL model (middle), and steep model (bottom). Differentlinewidths represent different Tmin choices, from the atomic cooling thresh-old (thickest lines) to molecular cooling haloes (thinnest lines). Solid greycurve is our fiducial model and remains unchanged in each panel. Thomsonscattering optical depth for all models is annotated in the lower right cornerof each panel – the light grey shaded regions are inconsistent with the recentPlanck measurements at the 95 per cent confidence level.
deviations may reflect evolution in the stellar and black hole pop-ulations of high-z galaxies, as parametrized through the metallicityof stellar populations, and the relationship between the metallicityand the LX–SFR relation.
Interestingly, and perhaps conveniently, the choice of stellarmetallicity also impacts the inferred efficiency of star formation.This is not because we have invoked any physical connection in ourmodel, but because our SFE is calibrated to the galaxy LF, whichrequires an assumption about the 1600 Å luminosity (per unit starformation). The result is that stellar metallicity has a smaller effecton the ionization history than one might naively expect.
For example, imagine we enhanced the 1600 Å luminosity ofgalaxies (per unit SFR), L1600, by decreasing the stellar metallicity.Our model for the LF would shift systematically to the left, i.e. allgalaxies would become brighter. To compensate, which we mustdo to preserve the best fit to the observed LF, we would introducea corresponding decrease in the SFE, which shifts the LF back
towards the right (i.e. galaxies become fainter). Mathematically, werequire
f∗(Z1)L1600(Z1) = f∗(Z2)L1600(Z2). (13)
While models with Z1 and Z2 have different star formation his-tories, the redshift evolution of the 1600 Å luminosity density ispreserved.4 However, the luminosity density in other bands neednot be preserved. If, for example, the LyC luminosity of galaxies(per unit SFR), LLyC, is more sensitive to Z than L1600, then theionization history will respond to Z even if the LF remains fixed.Indeed, this is the case – the shape of the stellar spectrum changeswith Z – meaning in general the ionizing background and LW back-ground change with Z even while holding the LF fixed. For example,the number of ionizing photons emitted per unit 1600 Å luminositychanges by a factor of ∼1.7 between the lowest and highest metal-licities we consider (see Appendix A). If this were not the case,then LF-calibrated models for the global 21-cm signal would becompletely insensitive to Z.
In the left-hand panel of Fig. 4, we show how metallicity andthe SFE affect the CMB optical depth. It is immediately clear thateach (Z, SFE) combination we consider leads to τ e values consistentwith Planck. The spread in τ e between our most extremefloor andsteep SFE models (at fixed metallicity) corresponds roughly tothe 1σ Planck uncertainty of ∼0.01, which makes for a convenientrule of thumb. Similarly, for a given SFE model τ e changes by∼0.01 between the lowest and highest metallicities we consider.
In the right-hand panel of Fig. 4, we show how metallicity and theSFE model affect the mean spin temperature and neutral fractionof the IGM at z = 8.4, i.e. the same parameter space constrainedrecently by the 21-cm power spectrum limits from PAPER (Parsonset al. 2014; Ali et al. 2015; Pober et al. 2015). Our steep SFEmodels (downward triangles) are near the PAPER limits (compareto fig. 1 of Greig et al. 2016), though the rest are still well withinthe allowed region of parameter space. The majority of our modelspredict TS ≤ Tγ at z = 8.4, unless the SFE is pure DPL (as in ourreference model) and the stellar metallicity takes on its minimalvalue, or there exists a floor in the SFE and Z � 0.008.
Changes in the spin temperature with metallicity can be quitelarge, up to a factor of ∼7 in the most extreme floor SFE model.This is partly a result of our assumption that the LX–SFR relationdepends on metallicity as LX ∝ Z−0.6 (Brorby et al. 2016), whichwe discuss in more detail below. The impact of Z on QH II is muchmore modest, at ∼10–20 per cent.
The efficiency of X-ray heating is often scaled by the parameterfX, which modifies the locally calibrated LX–SFR relation (e.g.Grimm, Gilfanov & Sunyaev 2003; Gilfanov, Grimm & Sunyaev2004; Mineo, Gilfanov & Sunyaev 2012b). The heating rate densityis then assumed to be a fixed fraction of the X-ray luminosity density,i.e.
εheat(z) = fX
(fheat
0.2
) (2.6 × 1039
erg s−1 (M� yr)−1
)
×(
ρ∗(z)
M� yr−1 cMpc−3
)erg s−1 cMpc−3, (14)
where ρ∗ is the SFR density and fheat is the fraction of photo-electronenergy deposited as heat (as opposed to ionization or excitation;Shull & van Steenberg 1985; Furlanetto & Johnson Stoever 2010).
4 Assuming the functional form of the SFE and Tmin are independent ofL1600.
MNRAS 464, 1365–1379 (2017)

1372 J. Mirocha, S. R. Furlanetto and G. Sun
Figure 4. Effects of the stellar metallicity and SFE model on the CMB optical depth and mean properties of the IGM at z = 8.4. Left: CMB optical depthas a function of stellar metallicity, relative to 68 per cent (dark grey) and 95 per cent (light grey) Planck confidence regions. Different symbols represent thedifferent SFE models, from the floor SFE model (upper set of triangles), to steep models (lower set of triangles). Right: mean IGM spin temperatureversus neutral fraction at z = 8.4. Again, different colours correspond to different assumed stellar metallicities while the markers denote the different SFEmodels. The dotted line indicates the temperature of the CMB at z = 8.4 and the narrow cross-hatched region at the bottom indicates unphysical temperatures.The steep SFE models (downward triangles) with solar metallicity are disfavoured by the recent PAPER measurements (Greig et al. 2016).
Our goal here is not to explore all possibilities for the LX–SFRrelation, which one can achieve by varying the normalization fX
of equation (14) to arbitrary large or small values, but to explorechanges consistent with our current understanding of star-forminggalaxies. As a result, we use the metallicity-dependent LX–SFRrelation found by Brorby et al. (2016) as a guide.
The expectation for some time has been LX ∝ SFR × Zβ , withβ < 0, as low-metallicity environments ought to produce moremassive stars and binaries (e.g. Belczynski et al. 2008; Linden et al.2010; Mapelli et al. 2010). Observations of the Chandra Deep FieldSouth (Basu-Zych et al. 2013; Lehmer et al. 2016) find evidenceof a boost in LX–SFR with increasing redshift, which, interestingly,is close to the evolution allowed by the unresolved fraction of thecosmic X-ray background (Dijkstra et al. 2012). The Brorby et al.(2016) result implies that such evolution may simply reflect themetallicity evolution of galaxies, though measurements of the gas-phase metallicities in high-z galaxies (e.g. Sanders et al. 2016) willbe needed to put this hypothesis to the test.
Rather than scaling εheat ∝ fXρ∗ as in equation (14), we solvethe cosmological radiative transfer equation (RTE) in detail, whichenables a more careful treatment of X-ray source spectral energydistributions (SEDs) (Mirocha 2014). We use the MCD model bothbecause it is representative of HMXBs, which are thought to be themost important sources in high-z galaxies (e.g. Fragos et al. 2013;Lehmer et al. 2016), and also because their hard spectra provide apessimistic limit in which heating is as inefficient as it could be5
(per 0.5–8 keV X-ray luminosity).In the left-hand panel of Fig. 5 we first explore the effects of
treating fX and Z as completely independent (i.e. neglecting theempirically motivated variation of fX with Z discussed above). In-terestingly, the ordering of the curves runs counter to our typicalintuition: decreasing Z leads to less efficient heating and thus deeper
5 Note that inverse Compton emission from supernova remnants (SNRs) hasan intrinsically harder spectrum than HMXBs (Oh 2001), so our model couldbe even more pessimistic about the heating efficiency. However, over the0.2 � hν/keV � 2 keV interval in which most heating occurs, unabsorbedHMXB spectra and SNRs spectra are comparably flat.
absorption troughs. This is because low-Z stellar populations pro-duce 1600 Å photons more efficiently than metal-enriched popula-tions, which requires star formation to be less efficient if we are tomatch the LF (see equation 13). This leads to a systematic down-ward shift in the SFR density, and thus the X-ray luminosity densityand heating at all redshifts. This effect is also apparent in τ e (seeinset).
Introducing a Z-dependent fX reverses this trend in the globalsignal,6 since decreases in Z and thus the SFE are compensated forby fX. If fX ∝ Z−0.6, as recently suggested by Brorby et al. (2016),there is a spread of ∼50 mK between the predicted absorptionfeatures. The dashed cyan curve shows the result one obtains byintroducing a factor (Zmin /Zmax )−0.6 � 9 shift in LX–SFR withoutadjusting the normalization of the SFE (as in equation 13). Thismay not seem like much: without the LF constraint, we would over-estimate the heating and obtain an absorption trough only ∼10 mKshallower than it should be. However, there is a much larger point tobe made here: under our assumptions, metallicity can only accountfor a factor of ∼9 change in the LX–SFR relation. As a result, de-tection of an absorption trough shallower than ∼−110 mK placesstrong constraints on either the metallicity dependence of the LX–SFR relation or presence of additional sources of X-ray radiation inthe early Universe.7 We will explore one caveat to this result in thenext section.
The actual metallicity of high-z galaxies is not yet clear, thoughit does not seem unreasonable to assume sub-solar metallicity atz > 6 given the limited time available for chemical enrichment.
6 Note that while τ e is sensitive to Z, it is insensitive to the Z-dependence ofthe LX–SFR relation since HMXBs are a negligible source of ionization inthe bulk IGM.7 In general, the characteristic mass of BHs in X-ray binary systems maygrow with decreasing Z, in which case the typical HMXB SED wouldbecome softer and result in more efficient heating. However, Mirocha (2014)showed that an even factor of 100 change in M• results in only a � 30 mKchange in the depth of the absorption minimum (their fig. 5), so treatingM• = M•(Z) is a secondary effect, at least when only stellar mass objectsare important.
MNRAS 464, 1365–1379 (2017)
The global 21-cm signal in context 1373
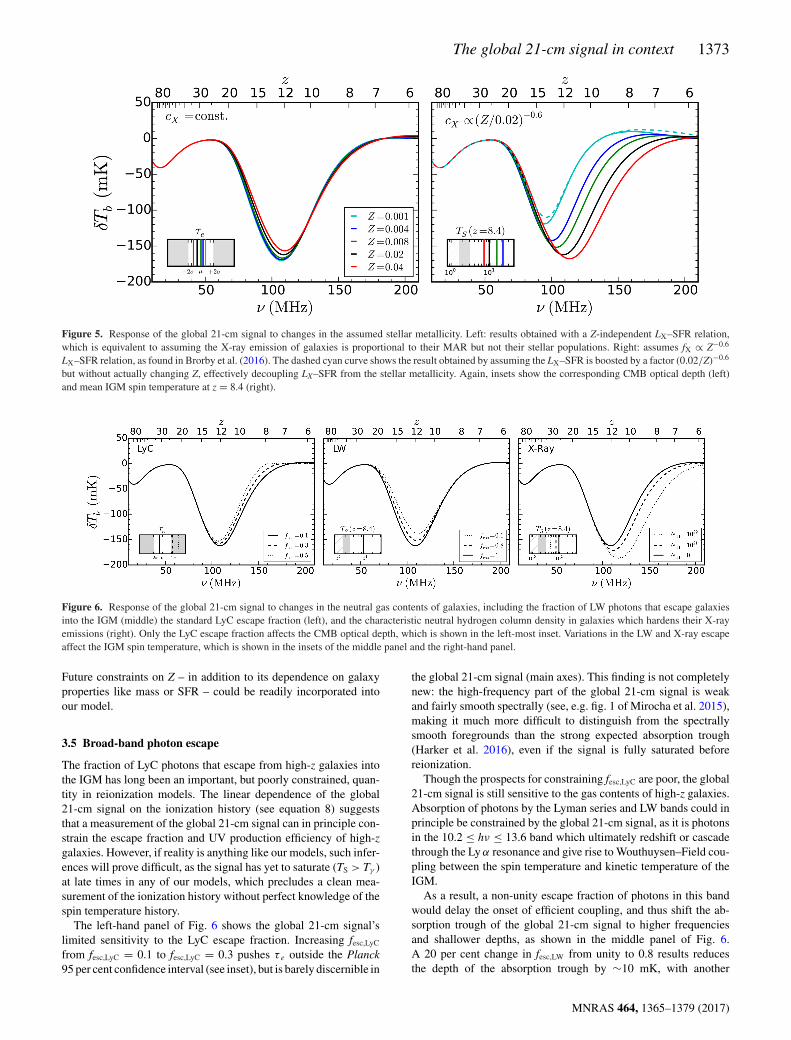
Figure 5. Response of the global 21-cm signal to changes in the assumed stellar metallicity. Left: results obtained with a Z-independent LX–SFR relation,which is equivalent to assuming the X-ray emission of galaxies is proportional to their MAR but not their stellar populations. Right: assumes fX ∝ Z−0.6
LX–SFR relation, as found in Brorby et al. (2016). The dashed cyan curve shows the result obtained by assuming the LX–SFR is boosted by a factor (0.02/Z)−0.6
but without actually changing Z, effectively decoupling LX–SFR from the stellar metallicity. Again, insets show the corresponding CMB optical depth (left)and mean IGM spin temperature at z = 8.4 (right).
Figure 6. Response of the global 21-cm signal to changes in the neutral gas contents of galaxies, including the fraction of LW photons that escape galaxiesinto the IGM (middle) the standard LyC escape fraction (left), and the characteristic neutral hydrogen column density in galaxies which hardens their X-rayemissions (right). Only the LyC escape fraction affects the CMB optical depth, which is shown in the left-most inset. Variations in the LW and X-ray escapeaffect the IGM spin temperature, which is shown in the insets of the middle panel and the right-hand panel.
Future constraints on Z – in addition to its dependence on galaxyproperties like mass or SFR – could be readily incorporated intoour model.
3.5 Broad-band photon escape
The fraction of LyC photons that escape from high-z galaxies intothe IGM has long been an important, but poorly constrained, quan-tity in reionization models. The linear dependence of the global21-cm signal on the ionization history (see equation 8) suggeststhat a measurement of the global 21-cm signal can in principle con-strain the escape fraction and UV production efficiency of high-zgalaxies. However, if reality is anything like our models, such infer-ences will prove difficult, as the signal has yet to saturate (TS > Tγ )at late times in any of our models, which precludes a clean mea-surement of the ionization history without perfect knowledge of thespin temperature history.
The left-hand panel of Fig. 6 shows the global 21-cm signal’slimited sensitivity to the LyC escape fraction. Increasing fesc,LyC
from fesc,LyC = 0.1 to fesc,LyC = 0.3 pushes τ e outside the Planck95 per cent confidence interval (see inset), but is barely discernible in
the global 21-cm signal (main axes). This finding is not completelynew: the high-frequency part of the global 21-cm signal is weakand fairly smooth spectrally (see, e.g. fig. 1 of Mirocha et al. 2015),making it much more difficult to distinguish from the spectrallysmooth foregrounds than the strong expected absorption trough(Harker et al. 2016), even if the signal is fully saturated beforereionization.
Though the prospects for constraining fesc,LyC are poor, the global21-cm signal is still sensitive to the gas contents of high-z galaxies.Absorption of photons by the Lyman series and LW bands could inprinciple be constrained by the global 21-cm signal, as it is photonsin the 10.2 ≤ hν ≤ 13.6 band which ultimately redshift or cascadethrough the Ly α resonance and give rise to Wouthuysen–Field cou-pling between the spin temperature and kinetic temperature of theIGM.
As a result, a non-unity escape fraction of photons in this bandwould delay the onset of efficient coupling, and thus shift the ab-sorption trough of the global 21-cm signal to higher frequenciesand shallower depths, as shown in the middle panel of Fig. 6.A 20 per cent change in fesc,LW from unity to 0.8 results reducesthe depth of the absorption trough by ∼10 mK, with another
MNRAS 464, 1365–1379 (2017)

1374 J. Mirocha, S. R. Furlanetto and G. Sun
20 per cent decrease in fesc,LW leading to another ∼15 mK shift in theabsorption signal strength. These changes would be difficult to dis-cern via other means as they affect neither the z = 8.4 spin tem-perature (at a substantial level) or the ionization history (in contrastto comparable changes in fesc,LyC which push τ e outside the Planckconfidence region).8
To our knowledge, fesc,LW has been set to unity in every study ofthe 21-cm background to date. There is some theoretical support forfesc,LW < 1, at least in idealized haloes (e.g. Kitayama et al. 2004;Schauer et al. 2015), and observations that suggest a non-negligibleH2 opacity in star-forming galaxies (Reddy et al. 2016). ShallowδTb � −110 mK absorption features could be achieved throughvariations in fesc,LW, though would require fesc,LW � 0.4, which isprobably extreme (Schauer et al. 2015). To ‘fill in’ the trough with-out invoking fesc,LW � 1, we would need to introduce additionalX-ray source populations or boost LX–SFR with metallicity morestrongly than suggested by Brorby et al. (2016). Distinguishingfesc,LW < 1 from efficient heating scenarios will require limits onthe strength of the global 21-cm emission signal since, while bothscenarios can cause weak absorption troughs, only efficient heatingcan drive a strong 21-cm emission feature.
Lastly, X-ray sources are also subject to an escape fraction,parametrized by a neutral hydrogen absorbing column, NH I (seeequation 7). Large absorbing columns harden the spectra of X-ray sources, which acts to lower the efficiency of X-ray heatingand therefore produce stronger absorption troughs. We see in theright-most panel of Fig. 6 that a large NH I = 1022/cm2 absorbingcolumn results in a ∼− 190 mK trough and mean spin temperatureof TS ∼ 5 K at z = 8.4 (see inset), near the limit of what is al-lowed by PAPER. In the limit of completely negligible heating, anabsorption trough occurs at depths of �−200 mK due to the onsetof reionization (see, e.g. fig. 6 in Mirocha, Harker & Burns 2013).
4 D ISCUSSION
Our new model for the global 21-cm signal represents a conservativeapproach in which galaxies at arbitrarily high redshifts are assumedto share the same properties as those currently observed at z ∼ 6–8,with some guidance from lower redshifts when necessary. WithoutPopIII stars, miniquasars, or other plausible-but-unconstrained ob-jects, we predict a global 21-cm signal which peaks in absorptionat (ν, δTb) ∼ (110 MHz, −160 mK) and has virtually no emissionsignature at late times. Uncertainties in critical model parametersof course remain, but within the limits of current stellar popula-tion models, observational constraints on the reionization history,and assumption that the modelling formalism for the global 21-cmsignal and galaxy LF themselves are appropriate, our main resultis robust. This has important ramifications for observational effortsto detect and characterize the global 21-cm signal and theoreticalefforts to interpret its meaning in the broader context of galaxyformation.
Our goal in this section is to highlight the features and limitationsof our model most pertinent to upcoming observations and futuremodel development.
8 Note that in general the LW background can have a more complex impacton the signal (see, e.g. Fialkov et al. 2014a) given that it influences starformation in minihaloes before reionization (Haiman et al. 1997). However,here we focus only on atomic cooling haloes in which LW feedback isunimportant.
4.1 Relevance to global 21-cm experiments
4.1.1 Detection
A persistent feature of our models is a deep absorption minimum atν ∼ 110 MHz. If this prediction is accurate, it has important conse-quences for global 21-cm experiments in several regards. First, theFM radio band occupies 88–110 MHz and will overwhelm even thestrongest of signals. The FM band has typically not been a concernfor experiments targeting the absorption minimum of the signal,since earlier predictions found a minimum closer to ∼70 MHz andan emission maximum at frequencies of ∼115 MHz, convenientlystraddling one of the most important foreground contaminants.
Even if the FM band can be avoided, e.g. by observing from theremote sites on the Earth’s surface or the radio-quiet lunar farside(Burns et al. 2012), separation of the signal from the foregroundcould be more difficult if it lies near the edge of one’s band of ob-servation. If, for example, only half of the broad absorption featurefalls within band its spectral complexity is reduced, and the signalcould thus be more easily mimicked by the galactic foreground,especially given the complex effects of realistic beams (Bernardi,McQuinn & Greenhill 2015). As a result, a broad-band is optimal,as advocated by Mirocha et al. (2015, albeit for reasons of interpre-tation rather than detectability), though simultaneously fitting datataken in disjoint frequency intervals may be an economical methodfor obtaining broad-band constraints.
While extracting the full global 21-cm signal is the ultimategoal for experiments, model rejection techniques can be readilyapplied today. To date, the only constraints on the emission featurecome from Bowman & Rogers (2010), who, operating under theassumption of a saturated signal, were able to rule out the sharpestreionization scenarios that would manifest as a ∼20 mK ‘step’relative to the smooth galactic foreground. Our findings suggestthat an analogous exercise invoking a deep trough rather than asharp emission step could be fruitful.
Indeed, Bernardi et al. (2016) recently performed such a test with∼20 min of 50 ≤ ν/MHz ≤ 100 LEDA data, limiting the depthof the absorption minimum to δTb, min � −1 K, which lies withina factor of ∼3 of the strongest absorption signal that is physicallyallowed. In the near future, such an approach may be used to ruleout some of our models. Luckily, the strongest signals consideredin this study are also the most ordinary, having solar metallicity,a dpl SFE, and unattenuated LW and X-ray emissions, meaningevidence for non-standard prescriptions might emerge sooner ratherthan later.
4.1.2 Interpretation
Throughout, we have emphasized that our model is as conservativeas possible in that we only include known sources. By identifyingthe realizations of the global 21-cm signal consistent with the statusquo, set today primarily by galaxy LF measurements and τ e, weeffectively define a null test for a global 21-cm signal detection.That is, if all of the following statements are in the future observedto be true, then no dramatic changes to the model are required:
(i) the absorption trough occurs at frequencies ν � 90 MHz;(ii) the absorption trough is stronger than ν ∼ −110 mK;(iii) the emission maximum is weaker than ∼10 mK.
If any of the above statements are false, our model is either wrongor incomplete.
Realizations of the global 21-cm signal inconsistent with#1 above could occur if the SFE flattens at low masses (LF
MNRAS 464, 1365–1379 (2017)

The global 21-cm signal in context 1375
steepens at faint end; see Fig. 3) or if PopIII star formation inminihaloes (which we have neglected) is efficient. Both scenarioswould trigger Wouthuysen–Field coupling at earlier times than ourother models predict, but simultaneously enhance the ionizing back-ground. As a result, a reduction in fesc would likely be required tomaintain consistency with the Planck constraint on τ e.
Very shallow troughs (contrary to item #2 above) can be achievedby very small LW escape fractions or additional heat sources (e.g.PopIII remnants or direct collapse BHs; Tanaka et al. 2016). Theargument for additional heat sources, rather than fesc,LW < 1, wouldbecome stronger if the signal had a shallow trough and a strongemission signal, violating items 2 and 3 above.
Finally, all three criteria are likely broken if Population III starformation is efficient and their remnants accrete persistently. How-ever, the details are complex, as PopIII star formation is subjectto potentially several feedback mechanisms, such as H2 destruction(or catalysis) induced by large-scale radiation backgrounds (Haimanet al. 1997; Ricotti 2016, e.g.), and the relative supersonic motionbetween baryons and DM after recombination (Tseliakhovich &Hirata 2010). Given that our goal is to establish a conservativereference case, we leave a more thorough investigation of PopIIIscenarios to future work.
4.2 Prospects for joint LF – global 21-cm inference
The criteria outlined in Section 4.1.2 suggest that even a relativelycrude initial detection should be able to distinguish a global 21-cmsignal that is broadly consistent with our model from one that is not.However, the differences between models in our study are also largeenough that – should similar realizations be observed – precisionmeasurements could be used to constrain interesting parameterslike the stellar metallicity, LX–SFR relation, and SFE in low-massgalaxies, which is equivalent to the faint-end slope of the galaxy LFin our formalism.
Given that the location of the global 21-cm absorption minimumvaries by ∼30 MHz between the extreme floor and steep SFEmodels we consider, the prospects for using the global 21-cm signalto probe faint galaxies are encouraging. Comparable shifts in theminimum can, however, arise from other effects, which is of someconcern [for example lowering the halo mass threshold for starformation (see Section 3.3) or invoking a redshift-dependent SFE(see Section 4.4)]. This means commensurate progress in LF and21-cm measurements will likely be required to distinguish changesin the SFE at low mass from Tmin < 104 K scenarios. In contrast,the metallicity and LX–SFR relation (Section 3.4) and LW and X-ray escape fractions (Section 3.5) primarily affect the amplitudeof the trough and emission signal, and thus may be constrainedindependently of the details of the SFE and Tmin.
4.3 Relevance to power spectrum experiments
Though we have not attempted to model the 21-cm power spectrumexplicitly, our results still have implications for power spectrumexperiments.
Our fiducial model predicts a mean IGM spin temperature ofTS ∼ 10 K at z = 8.4 and neutral fraction of 1 − QH II ∼ 0.85. Forcomparison, limits for these quantities were recently published byPober et al. (2015) and Greig et al. (2016) in response to improvingupper limits on the power spectrum from PAPER (Parsons et al.2014; Ali et al. 2015). Greig et al. (2016) find that TS � 3 K assuminga neutral fraction >10 per cent, TS � 5 K if one tightens the assumedneutral fraction range to 30–65 per cent, and to TS � 6 K if one
includes priors on the IGM ionization state at z = 5.9 (McGreer,Mesinger & D’Odorico 2015) and τ e (Planck Collaboration XIII2016). If the IGM is cold during reionization, the assumption ofsaturation – typically used to boost the computational efficiency ofpower spectrum calculations – will be poor, and may require suchconstraints to be revisited in more detail.
In this study, we have not attempted to incorporate the PAPERconstraints directly in our fitting since we do not generate a newmodel for the ionization and spin temperature histories on eachMCMC step. Instead, we only use MCMC to fit the galaxy LF,from which point we take the best-fitting SFE parameters and runglobal 21-cm signal models separately. However, it seems clear thatsimultaneously considering multiple measurements at once could bevery powerful. For example, Liu & Parsons (2016) recently showedthat knowledge of the power spectrum can aid detection of theglobal signal. On the other hand, an independent measurement ofthe global 21-cm signal would identify the source of the fluctuationsunderlying the power spectrum.
Though forecasted constraints on the model parameters obtainedby power spectrum measurements were found to only improve mod-estly upon inclusion of the global signal, Liu & Parsons (2016) pointout that this is likely due to the weakness and spectral smoothnessin the global 21-cm emission feature, which was the only pieceof the signal employed in their study. The 21-cm absorption sig-nal is likely to be much more powerful in such a role given thelarge shifts (tens of MHz in frequency and tens of mK in ampli-tude) that result from reasonable changes in model parameters ofinterest.
4.4 Improving the model calibration
Current uncertainties in LF measurements have a noticeable impacton our results, as evidenced by the spread in τ e, TS(z = 8.4), andglobal 21-cm signal induced by our different SFE models (floor,dpl, steep), which are meant to roughly span the range of pos-sibilities in the (currently unconstrained) faint-end of the LF. Thereare two ways of looking at this: (i) the allowed range of modelsmeans global 21-cm signal measurements can help constrain thegalaxy LF and (ii) improved LF measurements will help to furtherrefine our range of ‘vanilla’ global signal models. We will explorethe latter view more thoroughly below, as we have already addressedpoint (i) in Section 4.2.
Extending LF constraints to fainter magnitudes would clearlyinfluence our model’s calibration, as is likely to occur in the near-term via JWST. Systematic errors are also a concern for our cali-brated models, as for example, the z ∼ 6–7 Bouwens et al. (2015)and Finkelstein et al. (2015) LFs are discrepant by a factor of∼2 at MUV � −18, which is larger than the quoted statistical un-certainties in the measurements. Hopefully, future measurementswill alleviate such tensions. For now, we note that adopting theFinkelstein et al. (2015) LF, rather than that of Bouwens et al.(2015), would only strengthen our conclusions, since the Finkelsteinet al. (2015) LFs imply even less efficient star formation in high-zgalaxies, meaning it is even more difficult to make shallow absorp-tion troughs and/or strong emission features in the global 21-cmsignal.
Additionally, we have not attempted to use any z < 6 galaxy LFdata. Doing so may provide evidence for redshift evolution in f∗,but such inferences are complicated by the increasing importanceof dust at z � 6 (Bouwens et al. 2012; Capak et al. 2015). For now,we present a few plausible extensions to the SFE in Fig. 7 in whichits normalization and peak mass evolve with redshift.
MNRAS 464, 1365–1379 (2017)

1376 J. Mirocha, S. R. Furlanetto and G. Sun
Figure 7. Effects of redshift evolution in the SFE on the high-z galaxy LF and global 21-cm signal. Left: redshift evolution in f∗(Mp) is apparent in the LF(top) and global 21-cm signal (bottom). Right: results obtained assuming the peak mass, Mp, rather than the peak normalization, f∗(Mp), is varied as (1 + z)±1.In the upper panels, z ∼ 6 and z ∼ 8 data points are from Bouwens et al. (2015), while the z ∼ 11 point is the object discovered by Oesch et al. (2016).
First, we simply scale the normalization of the SFE as a powerlaw in redshift (left-hand panels of Fig. 7),
f∗(Mp) = f∗,0
(1 + z
7
)γ∗(15)
and allow the power-law index to vary between −1 ≤ γ∗ ≤ 1. Thiscauses a ∼0.2–0.5 dex change in φ(MUV) at z ∼ 8 (magenta band;top left panel), growing to ∼0.5–1 dex at z ∼ 11 (cyan band). Theabsorption minimum of the global signal varies by ∼± 10 MHz inposition, and in amplitude by ∼10 mK.
Next, we fix the amplitude of the SFE curve but allow the locationof the peak mass to vary with redshift as
Mp = M0
(1 + z
7
)γM
(16)
with −1 ≤ γ M ≤ 1, and M0 = 3 × 10¹¹M� as in our fiducial model.The results are shown in the right-hand panels of Fig. 7, and exhibit asmaller spread in the LF (top right) and global signal (bottom right)than did evolution in f∗(Mp). The LF changes very little between−1 ≤ γ M ≤ 1, while the minimum of the global 21-cm signal variesby ±5 MHz, in contrast to the changes of order ±10 MHz causedby the f∗(Mp) evolution (lower left panel). This model strugglesto produce MUV ∼ −22 galaxies with an abundance similar to thatimplied by the z ∼ 11.1 galaxy recently discovered by (Oesch et al.2016), but given that this point represents just one object we cautionthe reader against over interpretation of these findings.
In addition to using longer redshift baseline in LF measurements,future studies could leverage stellar mass functions (e.g. Song et al.2016) or constraints on the UV luminosity density at z ∼ 4–5 fromthe Ly α forest (e.g. Becker & Bolton 2013).
Fig. 4 shows that reducing uncertainties in τ e could also havean important impact on our calibration, at least in principle, as the1σ error on τ e roughly corresponds to the differences in our modelbrought about by the uncertain behaviour of the SFE at low mass.However, without commensurate progress in our understanding ofUV photon escape from galaxies, any updates to τ e can be ascribedsolely to fesc,LyC, rather than to the SFE, to which the global 21-cmsignal is more sensitive. This may actually be a blessing in disguise:it implies that the global 21-cm signal can be used to infer galaxyproperties at high-z without understanding fesc,LyC at all. This is instark contrast to efforts to reconcile τ e and the galaxy LF, in whichcase fesc,LyC plays a central role.
The global 21-cm signal and/or power spectrum themselves canin principle provide an independent measurement of τ e (Pritchardet al. 2010; Fialkov & Loeb 2016; Liu et al. 2016), though if realityis anything like our fiducial model, this will prove to be extremelydifficult as the extraction of τ e relies on a strong emission signal(at least for the global 21-cm signal), which we predict to be weakor non-existent. This serves to emphasize the intimate link betweenthe ionization and thermal histories in the 21-cm background, andhow constraints on one are only as good as constraints on the other.
Finally, improved constraints on the X-ray emissions of high-zgalaxies could be readily incorporated into our models, e.g. mea-surements of the LX–SFR relation, including its redshift evolution,metallicity dependence, and potentially additional scalings (e.g.with the stellar mass or SFR itself). Further examination of thetypes of X-ray sources inhabiting high-z galaxies would either helpsubstantiate our decision to only include X-ray emissions fromHMXBs, or force us to abandon it. The unresolved fraction of thecosmic X-ray background might provide some additional help in
MNRAS 464, 1365–1379 (2017)

The global 21-cm signal in context 1377
constraining high-z X-ray emissions, but based on the results ofFialkov et al. (2016), the unresolved X-ray background will onlyprovide a useful constraint if fX is very large.
4.5 Extending the model
Because our models are more restrictive than, e.g. the four parametermodel of Mirocha et al. (2015) or the tanh model of Harker et al.(2016), their use in signal extraction as is may not be warranted.For example, in the event that our model is dissimilar from the truesignal, its rigidity would prevent a good fit and instead cause largebiases to result in the posterior distributions of model parameters(unbeknownst to us). It would be preferable to either (i) first detectand characterize the signal using a flexible and efficient model, andfollow-up by comparing to more detailed (but expensive) modelslike ours, or (ii) augment our model with new source populations,to be described below.
Additions to the model might include new sources of Ly α, LyC,and X-ray photons such as PopIII stars, miniquasars, or even moreexotic candidates such as annihilating or decaying DM. By includ-ing, e.g., a variable PopIII star formation efficiency, it would bepossible to quantify the need for PopIII stars by the data. This hasthe appearance of a high-level model selection exercise to followinitial null tests, such as those proposed in Harker (2015), in whichour fiducial LF-calibrated model would provide a common basisfrom which to test the necessity of new extensions.
Aside from augmenting the model with entirely new compo-nents, further insights regarding the relationship between its under-lying components could also be interesting. For example, we havenot made any attempt to link fesc,LW, fesc,LyC, and NH I in a physi-cal model, nor have we invoked Mh-dependent escape fractions orstellar populations. Further study of such effects seem warrantedgiven the potential impact on the global 21-cm signal and galaxyLF. Guidance from numerical simulations would be most welcomein these areas, as detailed modelling is beyond the scope of thiswork.
5 C O N C L U S I O N S
We have shown that linking models of the global 21-cm signalto recent measurements of the high-z galaxy LF leads to a strongpreference for models with late heating and reionization (z � 12).At the formalism level, we assume that the f∗-based model is thetrue model for the galaxy LF, that the stellar population synthesismodels we employ are accurate, and that the IGM is reasonablywell-modelled as a two-phase medium. As for the components ofthe model, we assume that HMXBs are the sole sources of the z �6 X-ray background, and follow a LX–SFR relation similar to thatof local star-forming galaxies. If these assumptions hold, then ourmodel suggests following:
(i) The global 21-cm signal peaks in absorption at ν ∼ 110 MHzand a depth of ∼−160 mK. The emission feature is negligible inmost models, reaching an amplitude �10 mK at ν ∼ 150 MHzin the most optimistic scenario (Figs 2 and 5). Ruling out suchmodels may be easier than the sharp step-function emission modelstypically targeted at ν � 100 MHz, and would provide clear evidenceof non-standard physics and/or source populations.
(ii) The absorption trough in the global 21-cm signal is verysensitive to the SFE in low-mass galaxies (Fig. 2), with a ∼30 MHzspread in its position arising from differences between currentlyviable models. Constraining the SFE will be very difficult with
the LF alone given the depths one must probe (MUV ∼ −12) todifferentiate models.
(iii) The minimum mass of haloes capable of supporting starformation, parametrized through Tmin, has only a minor impact onour results (Fig. 3) given the steep decline of the SFE with halomass implied by the LF (Fig. 1).
(iv) The Z-dependence of the LX–SFR relation is very impor-tant, affecting the depth of the absorption feature at the ∼50 mKlevel (Fig. 5), which corresponds to mean IGM spin temperaturesbetween ∼10 and 40 K at z = 8.4 (Fig. 4), close to the recent PA-PER constraints. Stellar metallicity plays a relatively minor role insetting the ionization history (Fig. 4).
(v) The global 21-cm signal is not very sensitive to the LyCemission properties of galaxies. However, the escape of LW andX-ray photons may have a dramatic impact on the signal (Fig. 6).
AC K N OW L E D G E M E N T S
JM would like to thank Louis Abramson for many stimulating con-versations and comments on an earlier draft, and the anonymousreferee for comments that helped improve this paper. This workwas supported by the National Science Foundation through awardAST-1440343 and by NASA through award NNX15AK80G. Wealso acknowledge a NASA contract supporting the ‘WFIRST Ex-tragalactic Potential Observations (EXPO) Science InvestigationTeam’ (15-WFIRST15-0004), administered by GSFC. SRF waspartially supported by a Simons Fellowship in Theoretical Physicsand thanks the Observatories of the Carnegie Institute of Washing-ton for hospitality while much of this work was completed.
R E F E R E N C E S
Ali Z. S. et al., 2015, ApJ, 809, 61Atek H. et al., 2015, ApJ, 800, 18Barkana R., Loeb A., 2005, ApJ, 626, 1Basu-Zych A. R. et al., 2013, ApJ, 762, 45Beardsley A. P., Morales M. F., Lidz A., Malloy M., Sutter P. M., 2015, ApJ,
800, 128Becker G. D., Bolton J. S., 2013, MNRAS, 436, 1023Belczynski K., Kalogera V., Rasio F. A., Taam R. E., Zezas A., Bulik T.,
Maccarone T. J., Ivanova N., 2008, ApJS, 174, 223Bernardi G., McQuinn M., Greenhill L. J., 2015, ApJ, 799, 90Bernardi G. et al., 2016, MNRAS, 461, 2847Bouwens R. J. et al., 2012, ApJ, 754, 83Bouwens R. J. et al., 2015, ApJ, 803, 34Bowman J. D., Rogers A. E. E., 2010, Nature, 468, 796Brorby M., Kaaret P., Prestwich A., Mirabel I. F., 2016, MNRAS, 457, 4081Burns J. O. et al., 2012, Adv. Space Res., 49, 433Capak P. L. et al., 2015, Nature, 522, 455Chen X., Miralda-Escude J., 2004, ApJ, 602, 1Chluba J., Thomas R. M., 2011, MNRAS, 412, 748Chuzhoy L., Alvarez M. A., Shapiro P. R., 2006, ApJ, 648, L1Dekel A., Zolotov A., Tweed D., Cacciato M., Ceverino D., Primack J. R.,
2013, MNRAS, 435, 999Dijkstra M., Gilfanov M., Loeb A, Sunyaev R., 2012, MNRAS, 421, 213Eldridge J. J., Stanway E. R., 2009, MNRAS, 400, 1019Ellis R. S. et al., 2013, ApJ, 763, L7Ewall-Wice A., Hewitt J., Mesinger A., Dillon J. S., Liu A., Pober J., 2016,
MNRAS, 458, 2710Fan X., Narayanan V. K., Strauss M. A., White R. L., Becker R. H., Pentericci
L., Rix H.-W., 2002, AJ, 123, 1247Fialkov A., Loeb A., 2016, ApJ, 821, 59Fialkov A., Barkana R., Pinhas A., Visbal E., 2014a, MNRAS, 437, L36Fialkov A., Barkana R., Visbal E., 2014b, Nature, 506, 197
MNRAS 464, 1365–1379 (2017)
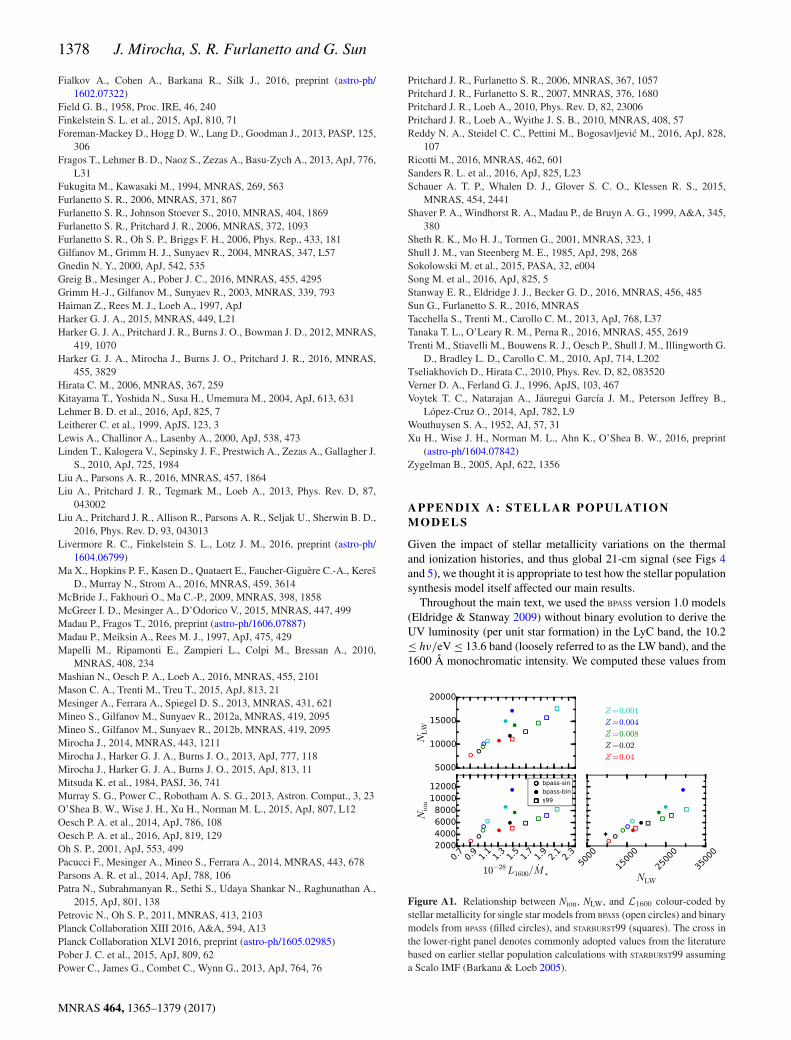
1378 J. Mirocha, S. R. Furlanetto and G. Sun
Fialkov A., Cohen A., Barkana R., Silk J., 2016, preprint (astro-ph/1602.07322)
Field G. B., 1958, Proc. IRE, 46, 240Finkelstein S. L. et al., 2015, ApJ, 810, 71Foreman-Mackey D., Hogg D. W., Lang D., Goodman J., 2013, PASP, 125,
306Fragos T., Lehmer B. D., Naoz S., Zezas A., Basu-Zych A., 2013, ApJ, 776,
L31Fukugita M., Kawasaki M., 1994, MNRAS, 269, 563Furlanetto S. R., 2006, MNRAS, 371, 867Furlanetto S. R., Johnson Stoever S., 2010, MNRAS, 404, 1869Furlanetto S. R., Pritchard J. R., 2006, MNRAS, 372, 1093Furlanetto S. R., Oh S. P., Briggs F. H., 2006, Phys. Rep., 433, 181Gilfanov M., Grimm H. J., Sunyaev R., 2004, MNRAS, 347, L57Gnedin N. Y., 2000, ApJ, 542, 535Greig B., Mesinger A., Pober J. C., 2016, MNRAS, 455, 4295Grimm H.-J., Gilfanov M., Sunyaev R., 2003, MNRAS, 339, 793Haiman Z., Rees M. J., Loeb A., 1997, ApJHarker G. J. A., 2015, MNRAS, 449, L21Harker G. J. A., Pritchard J. R., Burns J. O., Bowman J. D., 2012, MNRAS,
419, 1070Harker G. J. A., Mirocha J., Burns J. O., Pritchard J. R., 2016, MNRAS,
455, 3829Hirata C. M., 2006, MNRAS, 367, 259Kitayama T., Yoshida N., Susa H., Umemura M., 2004, ApJ, 613, 631Lehmer B. D. et al., 2016, ApJ, 825, 7Leitherer C. et al., 1999, ApJS, 123, 3Lewis A., Challinor A., Lasenby A., 2000, ApJ, 538, 473Linden T., Kalogera V., Sepinsky J. F., Prestwich A., Zezas A., Gallagher J.
S., 2010, ApJ, 725, 1984Liu A., Parsons A. R., 2016, MNRAS, 457, 1864Liu A., Pritchard J. R., Tegmark M., Loeb A., 2013, Phys. Rev. D, 87,
043002Liu A., Pritchard J. R., Allison R., Parsons A. R., Seljak U., Sherwin B. D.,
2016, Phys. Rev. D, 93, 043013Livermore R. C., Finkelstein S. L., Lotz J. M., 2016, preprint (astro-ph/
1604.06799)Ma X., Hopkins P. F., Kasen D., Quataert E., Faucher-Giguere C.-A., Keres
D., Murray N., Strom A., 2016, MNRAS, 459, 3614McBride J., Fakhouri O., Ma C.-P., 2009, MNRAS, 398, 1858McGreer I. D., Mesinger A., D’Odorico V., 2015, MNRAS, 447, 499Madau P., Fragos T., 2016, preprint (astro-ph/1606.07887)Madau P., Meiksin A., Rees M. J., 1997, ApJ, 475, 429Mapelli M., Ripamonti E., Zampieri L., Colpi M., Bressan A., 2010,
MNRAS, 408, 234Mashian N., Oesch P. A., Loeb A., 2016, MNRAS, 455, 2101Mason C. A., Trenti M., Treu T., 2015, ApJ, 813, 21Mesinger A., Ferrara A., Spiegel D. S., 2013, MNRAS, 431, 621Mineo S., Gilfanov M., Sunyaev R., 2012a, MNRAS, 419, 2095Mineo S., Gilfanov M., Sunyaev R., 2012b, MNRAS, 419, 2095Mirocha J., 2014, MNRAS, 443, 1211Mirocha J., Harker G. J. A., Burns J. O., 2013, ApJ, 777, 118Mirocha J., Harker G. J. A., Burns J. O., 2015, ApJ, 813, 11Mitsuda K. et al., 1984, PASJ, 36, 741Murray S. G., Power C., Robotham A. S. G., 2013, Astron. Comput., 3, 23O’Shea B. W., Wise J. H., Xu H., Norman M. L., 2015, ApJ, 807, L12Oesch P. A. et al., 2014, ApJ, 786, 108Oesch P. A. et al., 2016, ApJ, 819, 129Oh S. P., 2001, ApJ, 553, 499Pacucci F., Mesinger A., Mineo S., Ferrara A., 2014, MNRAS, 443, 678Parsons A. R. et al., 2014, ApJ, 788, 106Patra N., Subrahmanyan R., Sethi S., Udaya Shankar N., Raghunathan A.,
2015, ApJ, 801, 138Petrovic N., Oh S. P., 2011, MNRAS, 413, 2103Planck Collaboration XIII 2016, A&A, 594, A13Planck Collaboration XLVI 2016, preprint (astro-ph/1605.02985)Pober J. C. et al., 2015, ApJ, 809, 62Power C., James G., Combet C., Wynn G., 2013, ApJ, 764, 76
Pritchard J. R., Furlanetto S. R., 2006, MNRAS, 367, 1057Pritchard J. R., Furlanetto S. R., 2007, MNRAS, 376, 1680Pritchard J. R., Loeb A., 2010, Phys. Rev. D, 82, 23006Pritchard J. R., Loeb A., Wyithe J. S. B., 2010, MNRAS, 408, 57Reddy N. A., Steidel C. C., Pettini M., Bogosavljevic M., 2016, ApJ, 828,
107Ricotti M., 2016, MNRAS, 462, 601Sanders R. L. et al., 2016, ApJ, 825, L23Schauer A. T. P., Whalen D. J., Glover S. C. O., Klessen R. S., 2015,
MNRAS, 454, 2441Shaver P. A., Windhorst R. A., Madau P., de Bruyn A. G., 1999, A&A, 345,
380Sheth R. K., Mo H. J., Tormen G., 2001, MNRAS, 323, 1Shull J. M., van Steenberg M. E., 1985, ApJ, 298, 268Sokolowski M. et al., 2015, PASA, 32, e004Song M. et al., 2016, ApJ, 825, 5Stanway E. R., Eldridge J. J., Becker G. D., 2016, MNRAS, 456, 485Sun G., Furlanetto S. R., 2016, MNRASTacchella S., Trenti M., Carollo C. M., 2013, ApJ, 768, L37Tanaka T. L., O’Leary R. M., Perna R., 2016, MNRAS, 455, 2619Trenti M., Stiavelli M., Bouwens R. J., Oesch P., Shull J. M., Illingworth G.
D., Bradley L. D., Carollo C. M., 2010, ApJ, 714, L202Tseliakhovich D., Hirata C., 2010, Phys. Rev. D, 82, 083520Verner D. A., Ferland G. J., 1996, ApJS, 103, 467Voytek T. C., Natarajan A., Jauregui Garcıa J. M., Peterson Jeffrey B.,
Lopez-Cruz O., 2014, ApJ, 782, L9Wouthuysen S. A., 1952, AJ, 57, 31Xu H., Wise J. H., Norman M. L., Ahn K., O’Shea B. W., 2016, preprint
(astro-ph/1604.07842)Zygelman B., 2005, ApJ, 622, 1356
A P P E N D I X A : ST E L L A R PO P U L AT I O NM O D E L S
Given the impact of stellar metallicity variations on the thermaland ionization histories, and thus global 21-cm signal (see Figs 4and 5), we thought it is appropriate to test how the stellar populationsynthesis model itself affected our main results.
Throughout the main text, we used the BPASS version 1.0 models(Eldridge & Stanway 2009) without binary evolution to derive theUV luminosity (per unit star formation) in the LyC band, the 10.2≤ hν/eV ≤ 13.6 band (loosely referred to as the LW band), and the1600 Å monochromatic intensity. We computed these values from
Figure A1. Relationship between Nion, NLW, and L1600 colour-coded bystellar metallicity for single star models from BPASS (open circles) and binarymodels from BPASS (filled circles), and STARBURST99 (squares). The cross inthe lower-right panel denotes commonly adopted values from the literaturebased on earlier stellar population calculations with STARBURST99 assuminga Scalo IMF (Barkana & Loeb 2005).
MNRAS 464, 1365–1379 (2017)

The global 21-cm signal in context 1379
Figure A2. Effects of the adopted stellar population synthesis model. Left: variation in the peak SFE, which results from each stellar population modelsdiffering values for L1600/M∗. Middle: CMB optical depth as a function of metallicity and stellar population model. Right: variation in the position of theglobal 21-cm absorption trough as a function of metallicity and stellar population model.
assuming continuous star formation in the steady-state limit whent � 100 Myr and neglect nebular emission.
Fig. A1 shows the relationship between the LyC yield (Nion; in-tegrated from 1 to 2 Ryd), 10.2 ≤ hν/eV ≤ 13.6 yield (NLW), and1600 Å intensity for our fiducial models, as well as the BPASS version1.0 models with binaries and the original STARBURST99 models (Lei-therer et al. 1999). Yields in each band are strongly correlated witheach other, which is to be expected given their close associationin photon wavelength. The STARBURST99 models (squares) predictsomewhat larger values of L1600 than does BPASS, but the spread ofall models is a factor of ∼2–3.
Fig. A2 shows how these variations in the stellar population af-fect the normalization of the SFE, the CMB optical depth, and thelocation of the absorption minimum of the global 21-cm signal.Equation (13) guarantees a correlation between the normalizationof f∗ and Z, which spans the same factor of ∼2–3 as seen in L1600 inFig. A2 by definition. There is not a corresponding factor of ∼2–3change in τ e, however. This is because f∗ and L1600 are anticorre-lated, as described previously. Due to the correlation between Nion
and L1600, Nion and f∗ are anticorrelated as well, and so for a givenstellar population model, the dependence of τ e on Z is fairly weak.The spread between the models is comparable to the size of the 1σ
Planck error bar.The choice of stellar population model also affects the global
21-cm signal. In the right-hand panel of Fig. A2, we show how theposition of the absorption minimum changes as a function of theSFE model and stellar metallicity. All models occupy a relativelynarrow range in frequency, 103 � νmin /MHz � 110, though theyspan ∼50 mK in amplitude. For each stellar population model,the spread due to metallicity is much smaller, at ∼3–4 MHz infrequency and ∼10–15 mK in amplitude, as in the left-hand panelof Fig. 5.
This paper has been typeset from a TEX/LATEX file prepared by the author.
MNRAS 464, 1365–1379 (2017)


![7. The signal check of ignition system - Mr Carscan. Signal Analysis_Ignition.pdf · 2017. 3. 24. · a. Shield crank signal line to 3 [cm] front of ECU : b. Shield wiring of ignition](https://static.fdocuments.in/doc/165x107/6145540a34130627ed50e82b/7-the-signal-check-of-ignition-system-mr-signal-analysisignitionpdf-2017.jpg)