
The GHG emissions pathways and targets in Brazil: 1970 - … · The GHG emissions pathways and...
13
The GHG emissions pathways and targets in Brazil: 1970 - 2013 Marina Piatto [email protected] Lima COP20/CMP10 Agriculture and livestock
Transcript of The GHG emissions pathways and targets in Brazil: 1970 - … · The GHG emissions pathways and...
The GHG emissions pathways and targets in Brazil: 1970 - 2013
Marina Piatto [email protected]
Lima COP20/CMP10
Agriculture and livestock
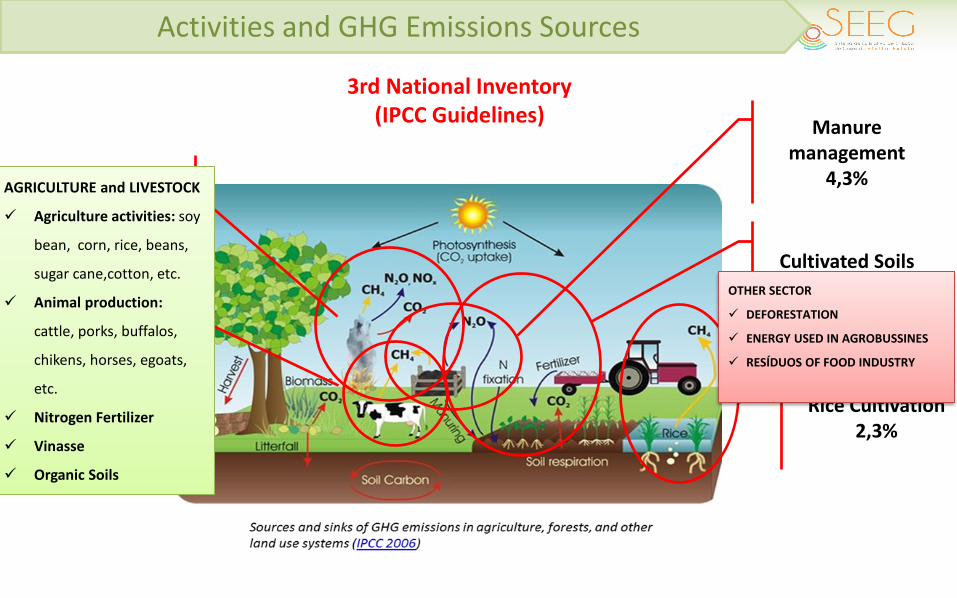
Activities and GHG Emissions Sources
3rd National Inventory (IPCC Guidelines)
Rice Cultivation 2,3%
Crop Residues Burned
1,2%
Manure management
4,3%
Cultivated Soils 35%
Enteric Fermantation
56%
AGRICULTURE and LIVESTOCK
Agriculture activities: soy
bean, corn, rice, beans,
sugar cane,cotton, etc.
Animal production:
cattle, porks, buffalos,
chikens, horses, egoats,
etc.
Nitrogen Fertilizer
Vinasse
Organic Soils
OTHER SECTOR
DEFORESTATION
ENERGY USED IN AGROBUSSINES
RESÍDUOS OF FOOD INDUSTRY
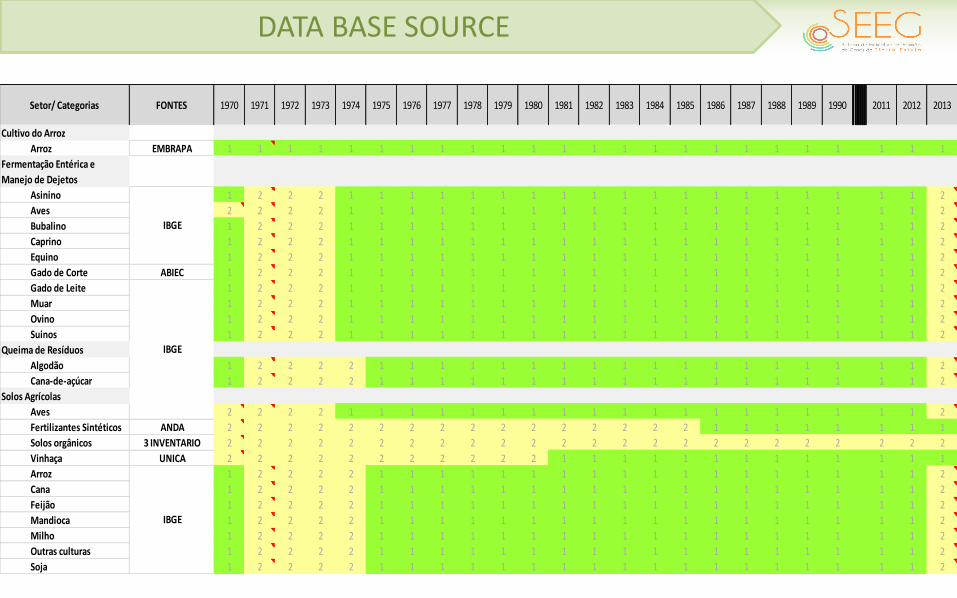
DATA BASE SOURCE
Setor/ Categorias FONTES 1970 1971 1972 1973 1974 1975 1976 1977 1978 1979 1980 1981 1982 1983 1984 1985 1986 1987 1988 1989 1990 2011 2012 2013
Cultivo do Arroz
Arroz EMBRAPA 1 1 1 1 1 1 1 1 1 1 1 1 1 1 1 1 1 1 1 1 1 1 1 1
Fermentação Entérica e
Manejo de Dejetos
Asinino 1 2 2 2 1 1 1 1 1 1 1 1 1 1 1 1 1 1 1 1 1 1 1 2
Aves 2 2 2 2 1 1 1 1 1 1 1 1 1 1 1 1 1 1 1 1 1 1 1 2
Bubalino 1 2 2 2 1 1 1 1 1 1 1 1 1 1 1 1 1 1 1 1 1 1 1 2
Caprino 1 2 2 2 1 1 1 1 1 1 1 1 1 1 1 1 1 1 1 1 1 1 1 2
Equino 1 2 2 2 1 1 1 1 1 1 1 1 1 1 1 1 1 1 1 1 1 1 1 2
Gado de Corte ABIEC 1 2 2 2 1 1 1 1 1 1 1 1 1 1 1 1 1 1 1 1 1 1 1 2
Gado de Leite 1 2 2 2 1 1 1 1 1 1 1 1 1 1 1 1 1 1 1 1 1 1 1 2
Muar 1 2 2 2 1 1 1 1 1 1 1 1 1 1 1 1 1 1 1 1 1 1 1 2
Ovino 1 2 2 2 1 1 1 1 1 1 1 1 1 1 1 1 1 1 1 1 1 1 1 2
Suinos 1 2 2 2 1 1 1 1 1 1 1 1 1 1 1 1 1 1 1 1 1 1 1 2
Queima de Resíduos
Algodão 1 2 2 2 2 1 1 1 1 1 1 1 1 1 1 1 1 1 1 1 1 1 1 2
Cana-de-açúcar 1 2 2 2 2 1 1 1 1 1 1 1 1 1 1 1 1 1 1 1 1 1 1 2
Solos Agrícolas
Aves 2 2 2 2 1 1 1 1 1 1 1 1 1 1 1 1 1 1 1 1 1 1 1 2
Fertilizantes Sintéticos ANDA 2 2 2 2 2 2 2 2 2 2 2 2 2 2 2 2 1 1 1 1 1 1 1 1
Solos orgânicos 3 INVENTARIO 2 2 2 2 2 2 2 2 2 2 2 2 2 2 2 2 2 2 2 2 2 2 2 2
Vinhaça UNICA 2 2 2 2 2 2 2 2 2 2 2 1 1 1 1 1 1 1 1 1 1 1 1 1
Arroz 1 2 2 2 2 1 1 1 1 1 1 1 1 1 1 1 1 1 1 1 1 1 1 2
Cana 1 2 2 2 2 1 1 1 1 1 1 1 1 1 1 1 1 1 1 1 1 1 1 2
Feijão 1 2 2 2 2 1 1 1 1 1 1 1 1 1 1 1 1 1 1 1 1 1 1 2
Mandioca 1 2 2 2 2 1 1 1 1 1 1 1 1 1 1 1 1 1 1 1 1 1 1 2
Milho 1 2 2 2 2 1 1 1 1 1 1 1 1 1 1 1 1 1 1 1 1 1 1 2
Outras culturas 1 2 2 2 2 1 1 1 1 1 1 1 1 1 1 1 1 1 1 1 1 1 1 2
Soja 1 2 2 2 2 1 1 1 1 1 1 1 1 1 1 1 1 1 1 1 1 1 1 2
IBGE
IBGE
IBGE
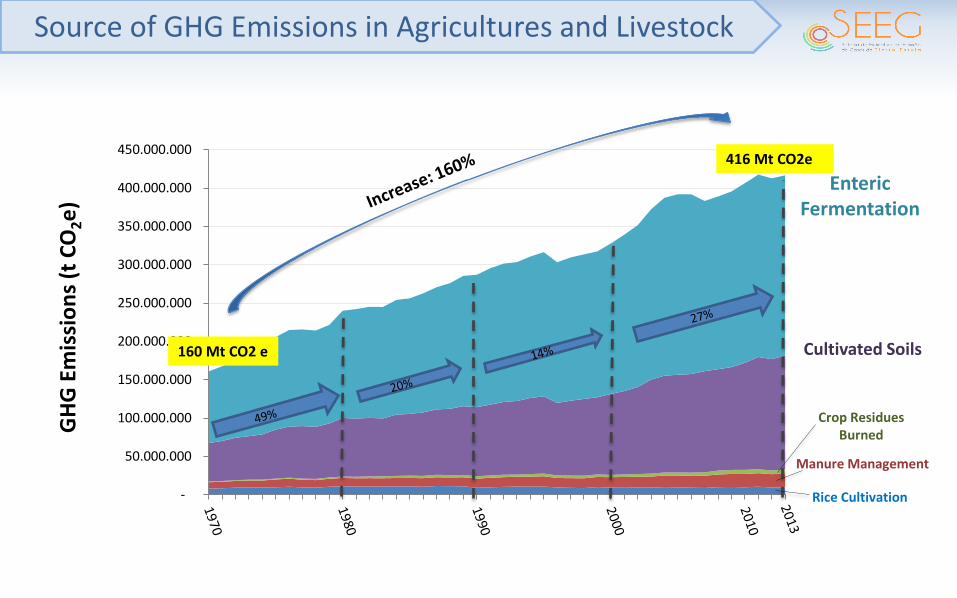
Source of GHG Emissions in Agricultures and Livestock
-
50.000.000
100.000.000
150.000.000
200.000.000
250.000.000
300.000.000
350.000.000
400.000.000
450.000.000
GH
G E
mis
sio
ns
(t C
O2e
)
416 Mt CO2e
160 Mt CO2 e
Enteric Fermentation
Cultivated Soils
Crop Residues Burned
Rice Cultivation
Manure Management

GHG Emission Distribuction GHG Emission Distribution
Enteric Fermentation (235)
Managed Soils (148)
Manure Management (18)
Rice cultivation (9)
Crop Residues Burned
(5)
Beef cattle (265)
Milk cattle (49)
Porks (11)
Sugar Cane (7)
Rice (10)
Fertilizers (30)
Organic Soils (4)
Crop residues (12)
Other animals (15)
Chikens (9)
2%
56%
35%
4%
1%
63%
12%
2,6%
2,3%
3,7%
7,6%
1,2%
3%
1,2%
2,3%
Agricultures and Livestock
26,6% Brazilian
GHG Emissions 2013
(416 Mt CO2 e)

GHG Emissions by State - 2013
11.7%
Beef Cattle 78%
Fertilizers 9%
Soy Residues
4% Others
9%
MT
Beef Cattle 48%
Milk Cattle 26%
Fertilizers 12%
Others 14%
MG
Beef Cattle 43%
Rice 16%
Fertilizers 13%
Others
RS
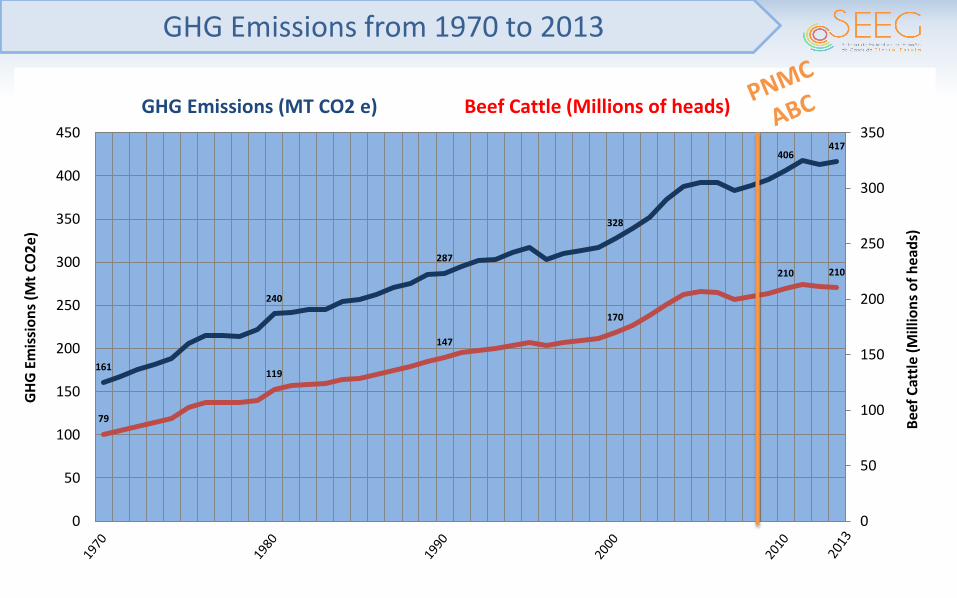
GHG Emissions from 1970 to 2013
161
240
287
328
406 417
79
119
147
170
210 210
0
50
100
150
200
250
300
350
0
50
100
150
200
250
300
350
400
450
Bee
f C
attl
e (M
illio
ns
of
hea
ds)
GH
G E
mis
sio
ns
(Mt
CO
2e
)
GHG Emissions (MT CO2 e) Beef Cattle (Millions of heads)
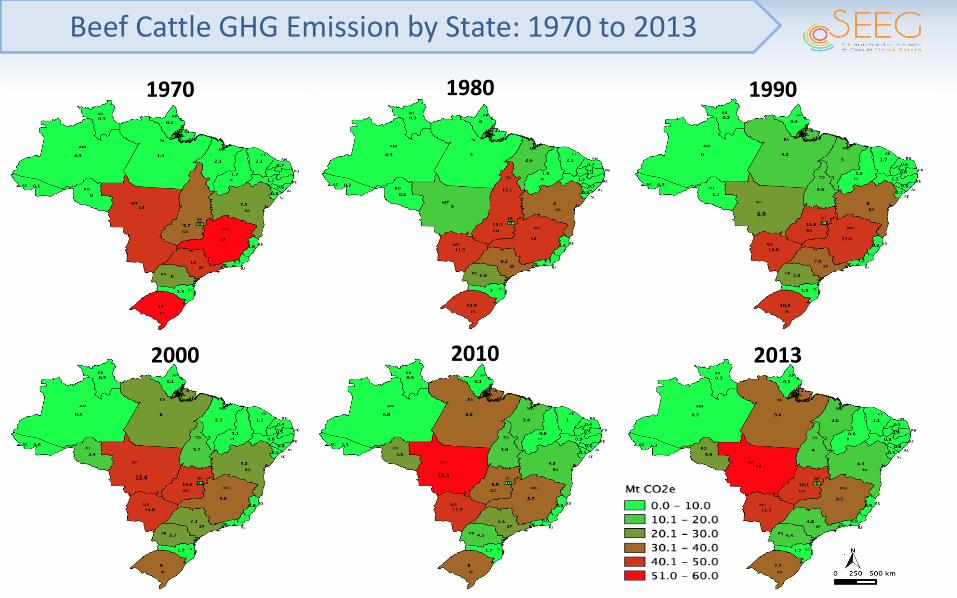
Beef Cattle GHG Emission by State: 1970 to 2013
6.9
12.4 15.1
2000
1970 1990 1980
2010 2013
0
10
20
30
40
50
60
70
80
0,0
0,5
1,0
1,5
2,0
2,5
3,0
3,5
4,0
Emis
sio
n o
f N
2O
(M
t C
O2
e) –
Co
rn P
rod
uct
ion
(M
t)
Use
of
Nit
roge
n F
ert
ilize
r (
Mt)
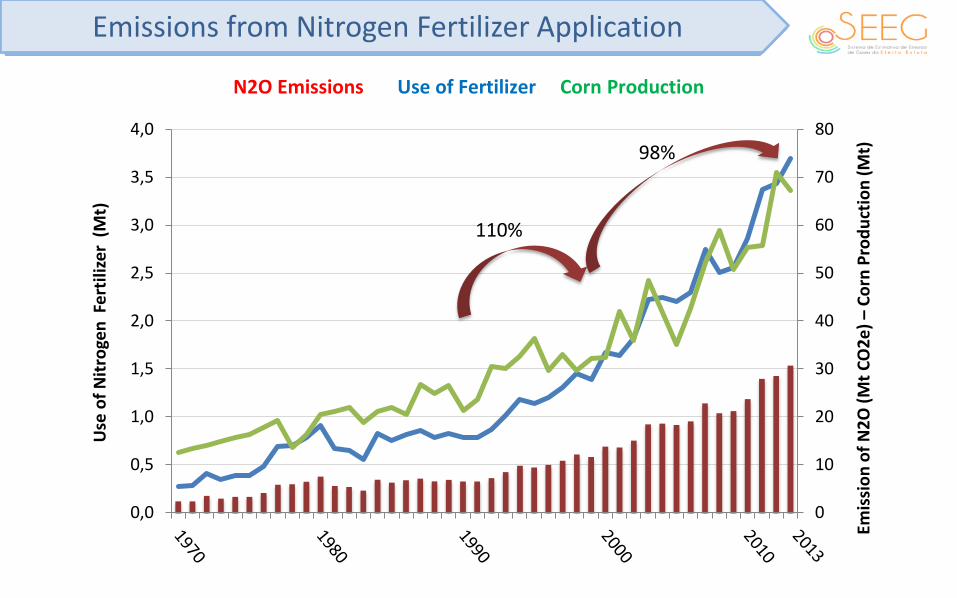
N2O Emissions Use of Fertilizer Corn Production
110%
98%
Emissions from Nitrogen Fertilizer Application
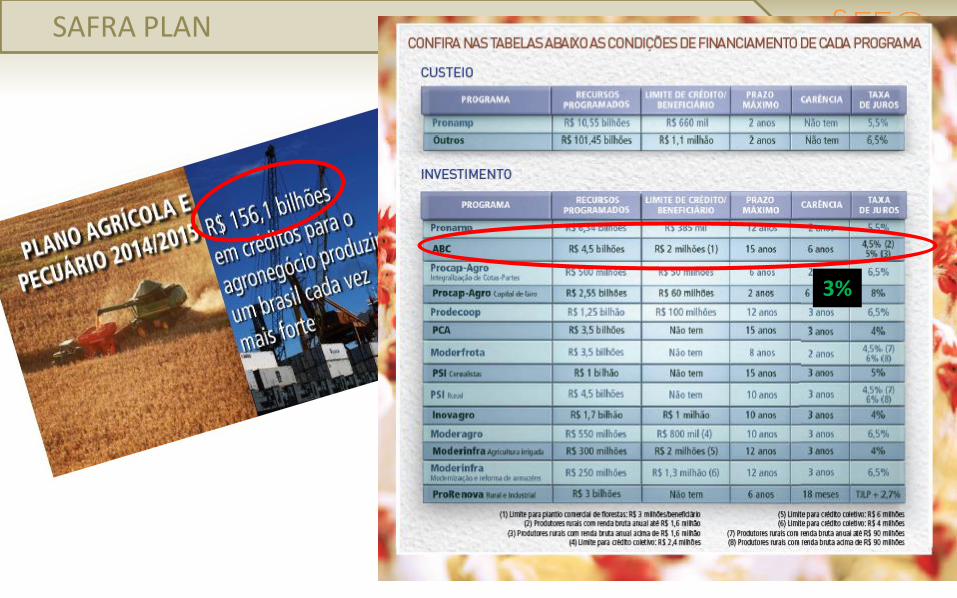
SAFRA PLAN
3%
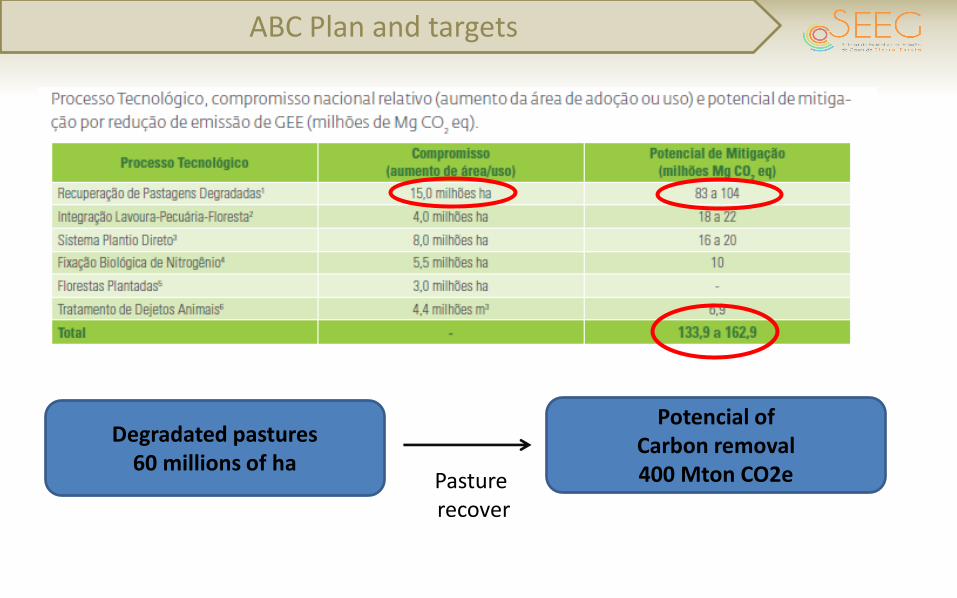
ABC Plan and targets
Degradated pastures 60 millions of ha
Potencial of Carbon removal 400 Mton CO2e Pasture
recover
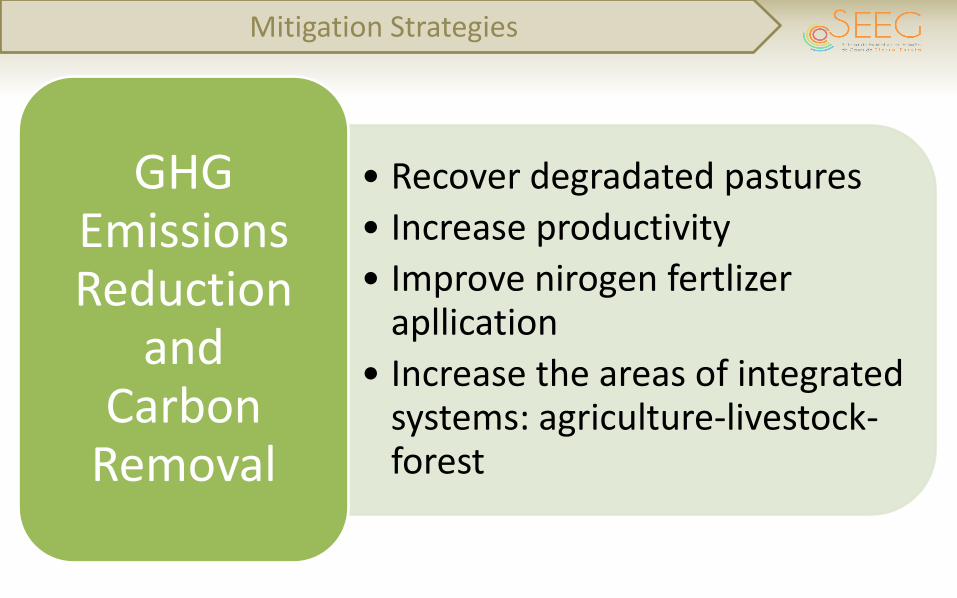
Mitigation Strategies
• Recover degradated pastures
• Increase productivity
• Improve nirogen fertlizer apllication
• Increase the areas of integrated systems: agriculture-livestock-forest
GHG Emissions Reduction
and Carbon
Removal