The GEISA spectroscopic database: Current and future ...
17
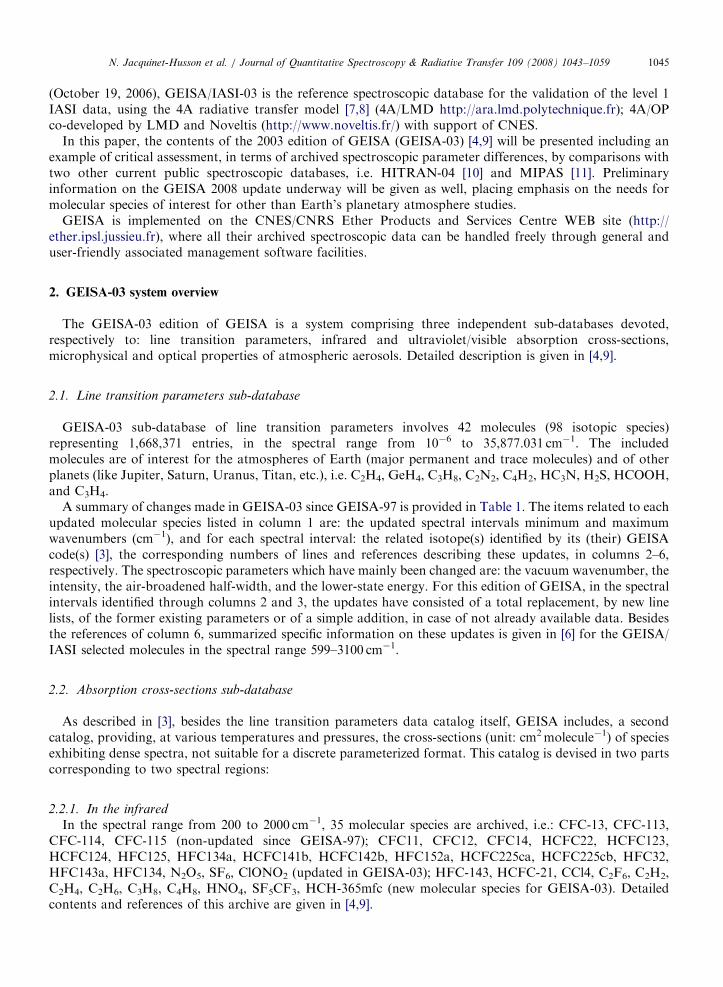
Journal of Quantitative Spectroscopy & Radiative Transfer 109 (2008) 1043–1059 The GEISA spectroscopic database: Current and future archive for Earth and planetary atmosphere studies N. Jacquinet-Husson a, , N.A. Scott a , A. Che´din a , L. Cre´peau a , R. Armante a , V. Capelle a , J. Orphal b , A. Coustenis c , C. Boonne d , N. Poulet-Crovisier d , A. Barbe e , M. Birk f , L.R. Brown g , C. Camy-Peyret h , C. Claveau h , K. Chance i , N. Christidis j , C. Clerbaux k,l , P.F. Coheur l , V. Dana h , L. Daumont e , M.R. De Backer-Barilly e , G. Di Lonardo m , J.M. Flaud b , A. Goldman n , A. Hamdouni e , M. Hess f , M.D. Hurley o , D. Jacquemart p , I. Kleiner b , P. Ko¨pke q , J.Y. Mandin h , S. Massie r , S. Mikhailenko s , V. Nemtchinov t , A. Nikitin s , D. Newnham u , A. Perrin b , V.I. Perevalov s , S. Pinnock j , L. Re´galia-Jarlot e , C.P. Rinsland v , A. Rublev w , F. Schreier f , L. Schult x , K.M. Smith u , S.A. Tashkun s , J.L. Teffo h , R.A. Toth g , Vl.G. Tyuterev e , J. Vander Auwera l , P. Varanasi t , G. Wagner f a Laboratoire de Me´te´orologie Dynamique/Institut Pierre Simon Laplace, Ecole Polytechnique, Route De´partementale 36, 91128 Palaiseau, France b Laboratoire Inter-Universitaire des Syste`mes Atmosphe´riques, Faculte´des Sciences et Technologie, 61 avenue du Ge´ne´ral de Gaulle, 94010 Cre´teil, France c Laboratoire d’Etudes Spatiales et d’Instrumentation en Astrophysique, Observatoire de Paris-Meudon, 5 place Jules Janssen, 92195 Meudon, France d Institut Pierre Simon Laplace, Universite´Pierre et Marie Curie, 4 Place Jussieu, 75252 Paris, France e Groupe de Spectrome´trie Mole´culaire et Atmosphe´rique, Universite´de Reims-Champagne-Ardenne, 51062 Reims, France f Remote Sensing Technology Institute, German Aerospace Center (DLR), Oberpfaffenhofen, D-82234 Wessling, Germany g Jet Propulsion Laboratory, California Institute of Technology, Pasadena, CA 91109, USA h Laboratoire de Physique Mole´culaire pour l’Atmosphe`re et l’Astrophysique, Universite´Pierre et Marie Curie, 3, rue Galile´e 94200 Ivry sur Seine, France i Harvard-Smithsonian Center for Astrophysics, 60 Garden Street, Cambridge, MA 02138, USA j Department of Meteorology, University of Reading, 2 Earley Gate, Whiteknights, Reading RG6 2AU, UK k Service d’Ae´ronomie/ Institut Pierre Simon Laplace, Universite´Pierre et Marie Curie, 4 Place Jussieu, 75252 Paris, France l Service de Chimie Quantique et Photophysique, Universite´Libre de Bruxelles ,C.P. 160/09, B-1050 Brussels, Belgium m Universita´ di Bologna, Dipartimento di Chimica Fisica ed Inorganica, Viale del Risorgimento 4, 40136 Bologna, Italy n Department of Physics, University of Denver, Denver, CO 80208, USA o Ford Research Laboratory, 2101 Village Road, Dearborn, MI 48124, USA p Laboratoire de Dynamique, Interactions et Re´activite´, Universite´Pierre et Marie Curie, 4 Place Jussieu, 75252 Paris, France q Meteorologisches Institut der Universita ¨t Mu ¨ nchen, Mu ¨ nchen D-80333, Germany r National Center for Atmospheric Research, Boulder CO 80307, USA s Laboratory of Theoretical Spectroscopy, Institute of Atmospheric Optics, Russian Academy of Sciences, 634055 Tomsk, Russian Federation t State University of New York at Stony Brook, Stony Brook, NY 11794, USA ARTICLE IN PRESS www.elsevier.com/locate/jqsrt 0022-4073/$ - see front matter r 2008 Elsevier Ltd. All rights reserved. doi:10.1016/j.jqsrt.2007.12.015 Corresponding author. Tel.: +33 1 69 33 51 62; fax: +33 1 69 33 52 18. E-mail address: [email protected] (N. Jacquinet-Husson).
Transcript of The GEISA spectroscopic database: Current and future ...
ARTICLE IN PRESS
Journal of Quantitative Spectroscopy &
0022-4073/$ - se
doi:10.1016/j.jq
�CorrespondE-mail addr
Radiative Transfer 109 (2008) 1043–1059
www.elsevier.com/locate/jqsrt
The GEISA spectroscopic database: Current and future archivefor Earth and planetary atmosphere studies
N. Jacquinet-Hussona,�, N.A. Scotta, A. Chedina, L. Crepeaua, R. Armantea,V. Capellea, J. Orphalb, A. Coustenisc, C. Boonned, N. Poulet-Crovisierd, A. Barbee,M. Birkf, L.R. Browng, C. Camy-Peyreth, C. Claveauh, K. Chancei, N. Christidisj,C. Clerbauxk,l, P.F. Coheurl, V. Danah, L. Daumonte, M.R. De Backer-Barillye,
G. Di Lonardom, J.M. Flaudb, A. Goldmann, A. Hamdounie, M. Hessf,M.D. Hurleyo, D. Jacquemartp, I. Kleinerb, P. Kopkeq, J.Y. Mandinh, S. Massier,
S. Mikhailenkos, V. Nemtchinovt, A. Nikitins, D. Newnhamu, A. Perrinb,V.I. Perevalovs, S. Pinnockj, L. Regalia-Jarlote, C.P. Rinslandv, A. Rublevw,F. Schreierf, L. Schultx, K.M. Smithu, S.A. Tashkuns, J.L. Teffoh, R.A. Tothg,
Vl.G. Tyutereve, J. Vander Auweral, P. Varanasit, G. Wagnerf
aLaboratoire de Meteorologie Dynamique/Institut Pierre Simon Laplace, Ecole Polytechnique, Route Departementale 36,
91128 Palaiseau, FrancebLaboratoire Inter-Universitaire des Systemes Atmospheriques, Faculte des Sciences et Technologie, 61 avenue du General de Gaulle,
94010 Creteil, FrancecLaboratoire d’Etudes Spatiales et d’Instrumentation en Astrophysique, Observatoire de Paris-Meudon, 5 place Jules Janssen,
92195 Meudon, FrancedInstitut Pierre Simon Laplace, Universite Pierre et Marie Curie, 4 Place Jussieu, 75252 Paris, France
eGroupe de Spectrometrie Moleculaire et Atmospherique, Universite de Reims-Champagne-Ardenne, 51062 Reims, FrancefRemote Sensing Technology Institute, German Aerospace Center (DLR), Oberpfaffenhofen, D-82234 Wessling, Germany
gJet Propulsion Laboratory, California Institute of Technology, Pasadena, CA 91109, USAhLaboratoire de Physique Moleculaire pour l’Atmosphere et l’Astrophysique, Universite Pierre et Marie Curie, 3,
rue Galilee 94200 Ivry sur Seine, FranceiHarvard-Smithsonian Center for Astrophysics, 60 Garden Street, Cambridge, MA 02138, USA
jDepartment of Meteorology, University of Reading, 2 Earley Gate, Whiteknights, Reading RG6 2AU, UKkService d’Aeronomie/ Institut Pierre Simon Laplace, Universite Pierre et Marie Curie, 4 Place Jussieu, 75252 Paris, France
lService de Chimie Quantique et Photophysique, Universite Libre de Bruxelles ,C.P. 160/09, B-1050 Brussels, BelgiummUniversita di Bologna, Dipartimento di Chimica Fisica ed Inorganica, Viale del Risorgimento 4, 40136 Bologna, Italy
nDepartment of Physics, University of Denver, Denver, CO 80208, USAoFord Research Laboratory, 2101 Village Road, Dearborn, MI 48124, USA
pLaboratoire de Dynamique, Interactions et Reactivite, Universite Pierre et Marie Curie, 4 Place Jussieu, 75252 Paris, FranceqMeteorologisches Institut der Universitat Munchen, Munchen D-80333, Germany
rNational Center for Atmospheric Research, Boulder CO 80307, USAsLaboratory of Theoretical Spectroscopy, Institute of Atmospheric Optics, Russian Academy of Sciences, 634055 Tomsk, Russian Federation
tState University of New York at Stony Brook, Stony Brook, NY 11794, USA
e front matter r 2008 Elsevier Ltd. All rights reserved.
srt.2007.12.015
ing author. Tel.: +331 69 33 51 62; fax: +33 1 69 33 52 18.
ess: [email protected] (N. Jacquinet-Husson).

ARTICLE IN PRESSN. Jacquinet-Husson et al. / Journal of Quantitative Spectroscopy & Radiative Transfer 109 (2008) 1043–10591044
uRutherford Appleton Laboratory, Chilton, Didcot, Oxon OX11 OQX, UKvNASA Langley Research Center, Science Directorate, Mail Stop 401A, Hampton, VA 23681-2199, USA
wInstitute of Molecular Physics at Russian Research Center Kurchatov Institute, Moscow 123183, Russian FederationxMax-Planck-Institut fur Meteorologie, D-20146 Hamburg, Germany
Received 29 October 2007; received in revised form 6 December 2007; accepted 9 December 2007
Abstract
The development of Gestion et Etude des Informations Spectroscopiques Atmospheriques (GEISA: Management and
Study of Spectroscopic Information) was started over three decades at Laboratoire de Meteorologie Dynamique (LMD) in
France. GEISA is a computer accessible spectroscopic database, designed to facilitate accurate forward radiative transfer
calculations using a line-by-line and layer-by-layer approach. More than 350 users have been registered for on-line use of
the GEISA facilities. The current 2003 edition of GEISA (GEISA-03) is a system comprising three independent sub-
databases devoted respectively to: line transition parameters, infrared and ultraviolet/visible absorption cross-sections,
microphysical and optical properties of atmospheric aerosols.
Currently, GEISA is involved in activities related to the assessment of the capabilities of IASI (Infrared Atmospheric
Sounding Interferometer on board of the METOP European satellite) through the GEISA/IASI database derived from
GEISA.
The GEISA-03 content is presented, placing emphasis on molecular species of interest for Earth and planetary
atmosphere studies, with details on the updated 2008 archive underway. A critical assessment on the needs, in terms of
molecular parameters archive, related with recent satellite astrophysical missions is made. Detailed information on free on-
line GEISA and GEISA/IASI access is given at http://ara.lmd.polytechnique.fr and http://ether.ipsl.jussieu.fr.
r 2008 Elsevier Ltd. All rights reserved.
Keywords: GEISA; Spectroscopic database; Line parameters; Cross-sections; Atmospheric absorption; Atmospheric aerosols; Earth’s and
planetary atmospheres
1. Introduction
Adequate tools are required to perform reliable radiative transfer modelling calculations to meet the needsof communities involved in understanding the atmospheres of the Earth and other planets. Among these tools,compilations of spectroscopic parameters are used for a vast array of applications and especially for planetaryatmospheric remote sensing. Consequently, there is an acute need for comprehensive, trustworthy andoperational interactive spectroscopic databases to benefit the research in direct and inverse radiative transfer.In this context, since over three decades, the ARA group at LMD has developed GEISA, a computeraccessible spectroscopic database system [1–4], designed to facilitate accurate and fast forward, calculations ofatmospheric radiative transfer using a line-by-line and (atmospheric) layer-by-layer approach. This effort hasproven to be beneficial to the atmospheric scientific community participating in direct and inverse radiativetransfer studies.
The role of molecular spectroscopy in modern atmospheric research has entered a new phase with theadvent of highly sophisticated spectroscopic instruments and computers. For example, the performance ofEarth atmospheric sounders like AIRS (http://airs.jpl.nasa.gov/) in the USA, and IASI (http://earth-sciences.cnes.fr/IASI/) in Europe, which have a better vertical resolution and accuracy, compared tothe previous existing satellite infrared vertical sounders, is directly related to the quality of the spectroscopicparameters of the optically active gases, since these are essential input in the forward models used to simulaterecorded radiance spectra. Consequently, a strong demand exists for highly comprehensive, well-validated,efficiently operational, and desirably interactive computer-based spectroscopic databases to benefit theresearch in direct and inverse radiative transfer. In this purpose, GEISA is currently involved [5] in activitiesrelated to the assessment of the capabilities IASI through the GEISA/IASI database, extensively described inJacquinet-Husson et al. [6]. Since the Metop (http://www.eumetsat.int) European polar satellite launch
ARTICLE IN PRESSN. Jacquinet-Husson et al. / Journal of Quantitative Spectroscopy & Radiative Transfer 109 (2008) 1043–1059 1045
(October 19, 2006), GEISA/IASI-03 is the reference spectroscopic database for the validation of the level 1IASI data, using the 4A radiative transfer model [7,8] (4A/LMD http://ara.lmd.polytechnique.fr); 4A/OPco-developed by LMD and Noveltis (http://www.noveltis.fr/) with support of CNES.
In this paper, the contents of the 2003 edition of GEISA (GEISA-03) [4,9] will be presented including anexample of critical assessment, in terms of archived spectroscopic parameter differences, by comparisons withtwo other current public spectroscopic databases, i.e. HITRAN-04 [10] and MIPAS [11]. Preliminaryinformation on the GEISA 2008 update underway will be given as well, placing emphasis on the needs formolecular species of interest for other than Earth’s planetary atmosphere studies.
GEISA is implemented on the CNES/CNRS Ether Products and Services Centre WEB site (http://ether.ipsl.jussieu.fr), where all their archived spectroscopic data can be handled freely through general anduser-friendly associated management software facilities.
2. GEISA-03 system overview
The GEISA-03 edition of GEISA is a system comprising three independent sub-databases devoted,respectively to: line transition parameters, infrared and ultraviolet/visible absorption cross-sections,microphysical and optical properties of atmospheric aerosols. Detailed description is given in [4,9].
2.1. Line transition parameters sub-database
GEISA-03 sub-database of line transition parameters involves 42 molecules (98 isotopic species)representing 1,668,371 entries, in the spectral range from 10�6 to 35,877.031 cm�1. The includedmolecules are of interest for the atmospheres of Earth (major permanent and trace molecules) and of otherplanets (like Jupiter, Saturn, Uranus, Titan, etc.), i.e. C2H4, GeH4, C3H8, C2N2, C4H2, HC3N, H2S, HCOOH,and C3H4.
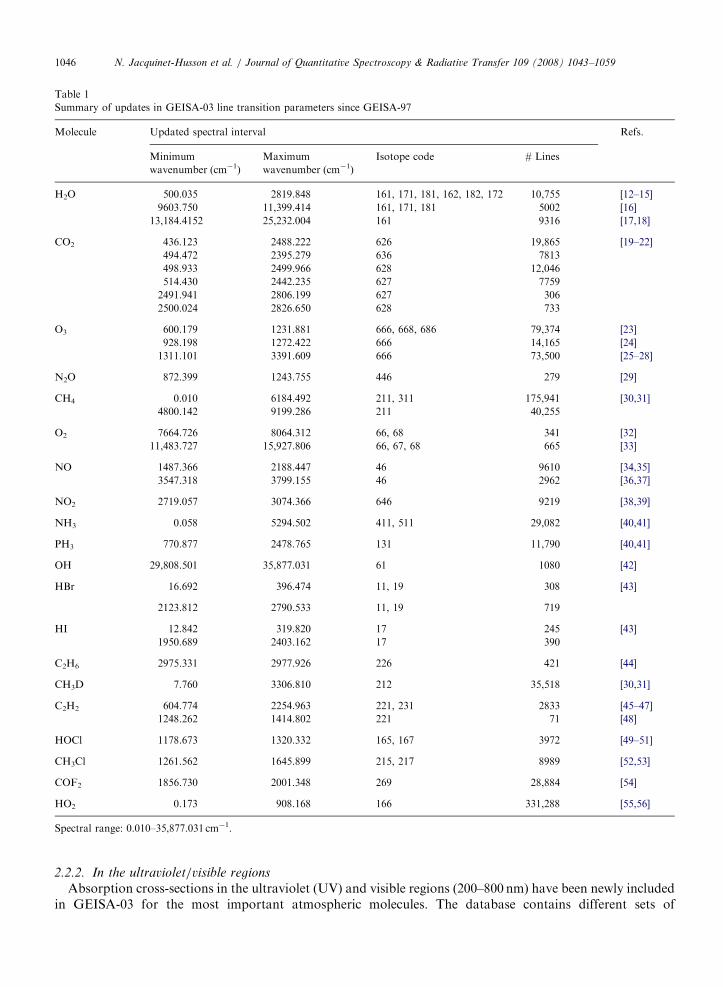
A summary of changes made in GEISA-03 since GEISA-97 is provided in Table 1. The items related to eachupdated molecular species listed in column 1 are: the updated spectral intervals minimum and maximumwavenumbers (cm�1), and for each spectral interval: the related isotope(s) identified by its (their) GEISAcode(s) [3], the corresponding numbers of lines and references describing these updates, in columns 2–6,respectively. The spectroscopic parameters which have mainly been changed are: the vacuum wavenumber, theintensity, the air-broadened half-width, and the lower-state energy. For this edition of GEISA, in the spectralintervals identified through columns 2 and 3, the updates have consisted of a total replacement, by new linelists, of the former existing parameters or of a simple addition, in case of not already available data. Besidesthe references of column 6, summarized specific information on these updates is given in [6] for the GEISA/IASI selected molecules in the spectral range 599–3100 cm�1.
2.2. Absorption cross-sections sub-database
As described in [3], besides the line transition parameters data catalog itself, GEISA includes, a secondcatalog, providing, at various temperatures and pressures, the cross-sections (unit: cm2molecule�1) of speciesexhibiting dense spectra, not suitable for a discrete parameterized format. This catalog is devised in two partscorresponding to two spectral regions:
2.2.1. In the infrared
In the spectral range from 200 to 2000 cm�1, 35 molecular species are archived, i.e.: CFC-13, CFC-113,CFC-114, CFC-115 (non-updated since GEISA-97); CFC11, CFC12, CFC14, HCFC22, HCFC123,HCFC124, HFC125, HFC134a, HCFC141b, HCFC142b, HFC152a, HCFC225ca, HCFC225cb, HFC32,HFC143a, HFC134, N2O5, SF6, ClONO2 (updated in GEISA-03); HFC-143, HCFC-21, CCl4, C2F6, C2H2,C2H4, C2H6, C3H8, C4H8, HNO4, SF5CF3, HCH-365mfc (new molecular species for GEISA-03). Detailedcontents and references of this archive are given in [4,9].
ARTICLE IN PRESS
Table 1
Summary of updates in GEISA-03 line transition parameters since GEISA-97
Molecule Updated spectral interval Refs.
Minimum
wavenumber (cm�1)
Maximum
wavenumber (cm�1)
Isotope code # Lines
H2O 500.035 2819.848 161, 171, 181, 162, 182, 172 10,755 [12–15]
9603.750 11,399.414 161, 171, 181 5002 [16]
13,184.4152 25,232.004 161 9316 [17,18]
CO2 436.123 2488.222 626 19,865 [19–22]
494.472 2395.279 636 7813
498.933 2499.966 628 12,046
514.430 2442.235 627 7759
2491.941 2806.199 627 306
2500.024 2826.650 628 733
O3 600.179 1231.881 666, 668, 686 79,374 [23]
928.198 1272.422 666 14,165 [24]
1311.101 3391.609 666 73,500 [25–28]
N2O 872.399 1243.755 446 279 [29]
CH4 0.010 6184.492 211, 311 175,941 [30,31]
4800.142 9199.286 211 40,255
O2 7664.726 8064.312 66, 68 341 [32]
11,483.727 15,927.806 66, 67, 68 665 [33]
NO 1487.366 2188.447 46 9610 [34,35]
3547.318 3799.155 46 2962 [36,37]
NO2 2719.057 3074.366 646 9219 [38,39]
NH3 0.058 5294.502 411, 511 29,082 [40,41]
PH3 770.877 2478.765 131 11,790 [40,41]
OH 29,808.501 35,877.031 61 1080 [42]
HBr 16.692 396.474 11, 19 308 [43]
2123.812 2790.533 11, 19 719
HI 12.842 319.820 17 245 [43]
1950.689 2403.162 17 390
C2H6 2975.331 2977.926 226 421 [44]
CH3D 7.760 3306.810 212 35,518 [30,31]
C2H2 604.774 2254.963 221, 231 2833 [45–47]
1248.262 1414.802 221 71 [48]
HOCl 1178.673 1320.332 165, 167 3972 [49–51]
CH3Cl 1261.562 1645.899 215, 217 8989 [52,53]
COF2 1856.730 2001.348 269 28,884 [54]
HO2 0.173 908.168 166 331,288 [55,56]
Spectral range: 0.010–35,877.031 cm�1.
N. Jacquinet-Husson et al. / Journal of Quantitative Spectroscopy & Radiative Transfer 109 (2008) 1043–10591046
2.2.2. In the ultraviolet/visible regions
Absorption cross-sections in the ultraviolet (UV) and visible regions (200–800 nm) have been newly includedin GEISA-03 for the most important atmospheric molecules. The database contains different sets of
ARTICLE IN PRESSN. Jacquinet-Husson et al. / Journal of Quantitative Spectroscopy & Radiative Transfer 109 (2008) 1043–1059 1047
cross-sections that correspond to various kinds of applications, i.e. either, at high signal/noise ratio butreduced spectral resolution, recorded with grating spectrometers and diode-array detectors, or, at very highspectral resolution but somewhat smaller signal/noise, recorded with FTS. Note that most of the datapresented here was obtained in the last decade since 1998. The involved molecular species are:
2.2.2.1. O3. Three different data sets are archived: (1) absorption cross-sections measured with the GOME(http://earth.esa.int/ers/gome) instrument [57] in the 231–794 nm spectral range at five temperatures between202 and 293K, with a spectral resolution of 0.2 nm below and 0.4 nm above 400 nm; (2) absorptioncross-sections measured with an FTS in the 230–830 nm range [58], again at five temperatures between203 and 293K, with a spectral resolution that is significantly higher than the O3 absorption features [59] andwith very accurate spectral calibration; (3) absorption cross-sections measured with GOME [60] in the230–1070 nm spectral range, at five temperatures between 203 and 293K, with a spectral resolution that isslightly lower than for the first data set. The O3 absorption cross-sections recorded with the FTS areparticularly useful when high spectral resolution and/or calibration is required, while the O3 cross-sectionsrecorded with GOME and SCIAMACHY (http://envisat.esa.int/instruments/sciamachy) are less resolved butshow significantly smaller noise, which is important when retrieving very weak absorbers from atmosphericspectra in this region.
2.2.2.2. NO2. Several data sets are available that show only small differences concerning the absolutevalues, however spectral resolution and total pressure are very important experimental parameters [59]; inaddition the presence of the dimer N2O4 or of impurities like HONO can affect the data. The NO2
archived cross-sections have been recorded: (1) with the GOME [61] and SCIAMACHY [60] instruments(the latter one including NO2 cross-sections at a temperature as low as 203K); (2) with an FTS from twodifferent studies, the first one at two different total pressures (100 and 1000 hPa) and five temperaturesbetween 223 and 293K covering the 230–830 nm range [62] the second one at a smaller number oftemperatures but over a wider spectral range (238–1000 nm) and including a systematic study of pressureeffects [63–66].
2.2.2.3. OClO and SO2. Two kinds of cross-section data have been archived: one kind recorded at lowerspectral resolution (but at very high signal/noise ratio) with SCIAMACHY [60] and in addition another kindrecorded with an FTS. For OClO, there are cross-sections available at five different temperatures in the213–293K range for the FTS data [67], while for SO2 the FTS data were recorded at different pressures butonly at room temperature [68]. The SO2 data recorded with SCIAMACHY [60] cover five temperaturesbetween 203 and 293K.
2.2.2.4. BrO and OBrO. Only cross-sections recorded by an FTS were selected. For BrO these data cover the300–385 nm spectral range at five temperatures between 203 and 298K [69], while for OBrO (385–616 nmspectral range) cross-sections are available only at room temperature [70].
2.2.2.5. O2 and O4. Absorption cross-sections are available from different studies related with data for theSchumann-Runge and Herzberg bands of O2 in the UV [71–74] and for visible regions [75,76], frommeasurements with an FTS at temperatures between 223 and 294K.
2.2.2.6. H2CO. The absorption cross-sections at 293K covering the 240–400 nm spectral range have beenrecorded with SCIAMACHY [60].
2.2.2.7. CS2. The absorption cross-sections, recorded with an FTS at 294K covering the 290–350 nmspectral range are from [76].
It has to be noted that in general, the cross-sections recorded by an FTS have a wavelength calibration ofbetter than 0.01 nm [59], which is an important advantage for atmospheric applications, in particular whenretrieving several absorbers simultaneously.
ARTICLE IN PRESSN. Jacquinet-Husson et al. / Journal of Quantitative Spectroscopy & Radiative Transfer 109 (2008) 1043–10591048
2.3. Microphysical and optical properties of atmospheric aerosols sub-database
Besides the molecular species that define the gaseous infrared opacity in the Earth’s atmosphere, aerosolparticles, also contribute to this opacity. Consequently, a new sub-database, related with aerosols particleproperties has been added to the GEISA system in 2003. It gathers the microphysical and optical propertiesfrom four published aerosol data catalogs, i.e. [77–80], the overall content of which deals with the archive ofcomplex refractive indices and possibly computed optical-related properties, for selected basic aerosolcomponents. Software for data management and user-selected aerosol mixtures elaboration are available from[78–81]. Details and references are given in Ref. [5].
3. Assessment of GEISA-03 contents
Some comparisons, in terms of spectroscopic parameters contents, of GEISA-03 with two other currentpublic spectroscopic databases, i.e. HITRAN-04 [10] and MIPAS [11] in its PF3.2 version are presented in thefollowing. It has to be noted that the initial emphasis of the three compilations have been different (see relatedpublications).
3.1. Comparison of GEISA-03 and HITRAN-04 contents
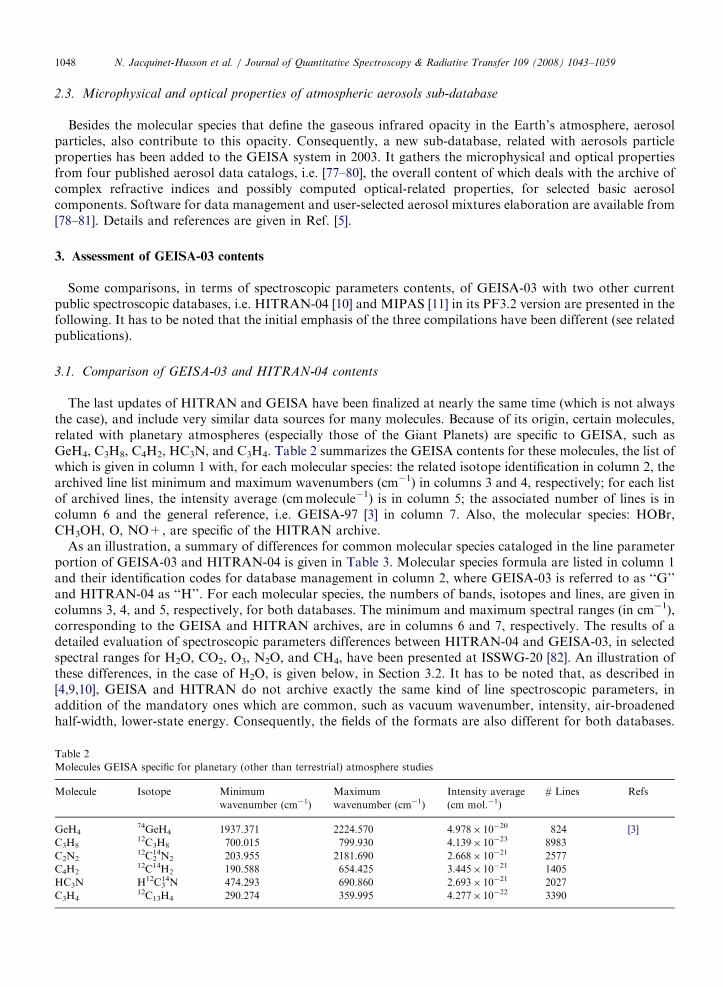
The last updates of HITRAN and GEISA have been finalized at nearly the same time (which is not alwaysthe case), and include very similar data sources for many molecules. Because of its origin, certain molecules,related with planetary atmospheres (especially those of the Giant Planets) are specific to GEISA, such asGeH4, C3H8, C4H2, HC3N, and C3H4. Table 2 summarizes the GEISA contents for these molecules, the list ofwhich is given in column 1 with, for each molecular species: the related isotope identification in column 2, thearchived line list minimum and maximum wavenumbers (cm�1) in columns 3 and 4, respectively; for each listof archived lines, the intensity average (cmmolecule�1) is in column 5; the associated number of lines is incolumn 6 and the general reference, i.e. GEISA-97 [3] in column 7. Also, the molecular species: HOBr,CH3OH, O, NO+, are specific of the HITRAN archive.
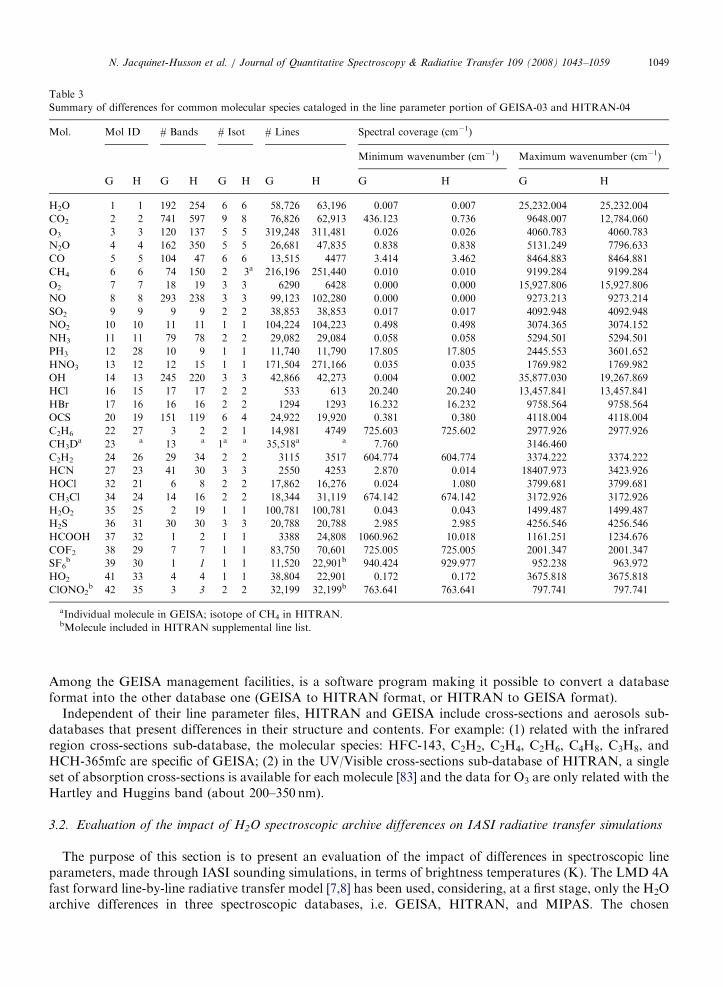
As an illustration, a summary of differences for common molecular species cataloged in the line parameterportion of GEISA-03 and HITRAN-04 is given in Table 3. Molecular species formula are listed in column 1and their identification codes for database management in column 2, where GEISA-03 is referred to as ‘‘G’’and HITRAN-04 as ‘‘H’’. For each molecular species, the numbers of bands, isotopes and lines, are given incolumns 3, 4, and 5, respectively, for both databases. The minimum and maximum spectral ranges (in cm�1),corresponding to the GEISA and HITRAN archives, are in columns 6 and 7, respectively. The results of adetailed evaluation of spectroscopic parameters differences between HITRAN-04 and GEISA-03, in selectedspectral ranges for H2O, CO2, O3, N2O, and CH4, have been presented at ISSWG-20 [82]. An illustration ofthese differences, in the case of H2O, is given below, in Section 3.2. It has to be noted that, as described in[4,9,10], GEISA and HITRAN do not archive exactly the same kind of line spectroscopic parameters, inaddition of the mandatory ones which are common, such as vacuum wavenumber, intensity, air-broadenedhalf-width, lower-state energy. Consequently, the fields of the formats are also different for both databases.
Table 2
Molecules GEISA specific for planetary (other than terrestrial) atmosphere studies
Molecule Isotope Minimum
wavenumber (cm�1)
Maximum
wavenumber (cm�1)
Intensity average
(cm mol.�1)
# Lines Refs
GeH474GeH4 1937.371 2224.570 4.978� 10�20 824 [3]
C3H812C3H8 700.015 799.930 4.139� 10�23 8983
C2N212C2
14N2 203.955 2181.690 2.668� 10�21 2577
C4H212C14H2 190.588 654.425 3.445� 10�21 1405
HC3N H12C314N 474.293 690.860 2.693� 10�21 2027
C3H412C13H4 290.274 359.995 4.277� 10�22 3390
ARTICLE IN PRESS
Table 3
Summary of differences for common molecular species cataloged in the line parameter portion of GEISA-03 and HITRAN-04
Mol. Mol ID # Bands # Isot # Lines Spectral coverage (cm�1)
Minimum wavenumber (cm�1) Maximum wavenumber (cm�1)
G H G H G H G H G H G H
H2O 1 1 192 254 6 6 58,726 63,196 0.007 0.007 25,232.004 25,232.004
CO2 2 2 741 597 9 8 76,826 62,913 436.123 0.736 9648.007 12,784.060
O3 3 3 120 137 5 5 319,248 311,481 0.026 0.026 4060.783 4060.783
N2O 4 4 162 350 5 5 26,681 47,835 0.838 0.838 5131.249 7796.633
CO 5 5 104 47 6 6 13,515 4477 3.414 3.462 8464.883 8464.881
CH4 6 6 74 150 2 3a 216,196 251,440 0.010 0.010 9199.284 9199.284
O2 7 7 18 19 3 3 6290 6428 0.000 0.000 15,927.806 15,927.806
NO 8 8 293 238 3 3 99,123 102,280 0.000 0.000 9273.213 9273.214
SO2 9 9 9 9 2 2 38,853 38,853 0.017 0.017 4092.948 4092.948
NO2 10 10 11 11 1 1 104,224 104,223 0.498 0.498 3074.365 3074.152
NH3 11 11 79 78 2 2 29,082 29,084 0.058 0.058 5294.501 5294.501
PH3 12 28 10 9 1 1 11,740 11,790 17.805 17.805 2445.553 3601.652
HNO3 13 12 12 15 1 1 171,504 271,166 0.035 0.035 1769.982 1769.982
OH 14 13 245 220 3 3 42,866 42,273 0.004 0.002 35,877.030 19,267.869
HCl 16 15 17 17 2 2 533 613 20.240 20.240 13,457.841 13,457.841
HBr 17 16 16 16 2 2 1294 1293 16.232 16.232 9758.564 9758.564
OCS 20 19 151 119 6 4 24,922 19,920 0.381 0.380 4118.004 4118.004
C2H6 22 27 3 2 2 1 14,981 4749 725.603 725.602 2977.926 2977.926
CH3Da 23 a 13 a 1a a 35,518a a 7.760 3146.460
C2H2 24 26 29 34 2 2 3115 3517 604.774 604.774 3374.222 3374.222
HCN 27 23 41 30 3 3 2550 4253 2.870 0.014 18407.973 3423.926
HOCl 32 21 6 8 2 2 17,862 16,276 0.024 1.080 3799.681 3799.681
CH3Cl 34 24 14 16 2 2 18,344 31,119 674.142 674.142 3172.926 3172.926
H2O2 35 25 2 19 1 1 100,781 100,781 0.043 0.043 1499.487 1499.487
H2S 36 31 30 30 3 3 20,788 20,788 2.985 2.985 4256.546 4256.546
HCOOH 37 32 1 2 1 1 3388 24,808 1060.962 10.018 1161.251 1234.676
COF2 38 29 7 7 1 1 83,750 70,601 725.005 725.005 2001.347 2001.347
SF6b 39 30 1 1 1 1 11,520 22,901b 940.424 929.977 952.238 963.972
HO2 41 33 4 4 1 1 38,804 22,901 0.172 0.172 3675.818 3675.818
ClONO2b 42 35 3 3 2 2 32,199 32,199b 763.641 763.641 797.741 797.741
aIndividual molecule in GEISA; isotope of CH4 in HITRAN.bMolecule included in HITRAN supplemental line list.
N. Jacquinet-Husson et al. / Journal of Quantitative Spectroscopy & Radiative Transfer 109 (2008) 1043–1059 1049
Among the GEISA management facilities, is a software program making it possible to convert a databaseformat into the other database one (GEISA to HITRAN format, or HITRAN to GEISA format).
Independent of their line parameter files, HITRAN and GEISA include cross-sections and aerosols sub-databases that present differences in their structure and contents. For example: (1) related with the infraredregion cross-sections sub-database, the molecular species: HFC-143, C2H2, C2H4, C2H6, C4H8, C3H8, andHCH-365mfc are specific of GEISA; (2) in the UV/Visible cross-sections sub-database of HITRAN, a singleset of absorption cross-sections is available for each molecule [83] and the data for O3 are only related with theHartley and Huggins band (about 200–350 nm).
3.2. Evaluation of the impact of H2O spectroscopic archive differences on IASI radiative transfer simulations
The purpose of this section is to present an evaluation of the impact of differences in spectroscopic lineparameters, made through IASI sounding simulations, in terms of brightness temperatures (K). The LMD 4Afast forward line-by-line radiative transfer model [7,8] has been used, considering, at a first stage, only the H2Oarchive differences in three spectroscopic databases, i.e. GEISA, HITRAN, and MIPAS. The chosen
ARTICLE IN PRESSN. Jacquinet-Husson et al. / Journal of Quantitative Spectroscopy & Radiative Transfer 109 (2008) 1043–10591050
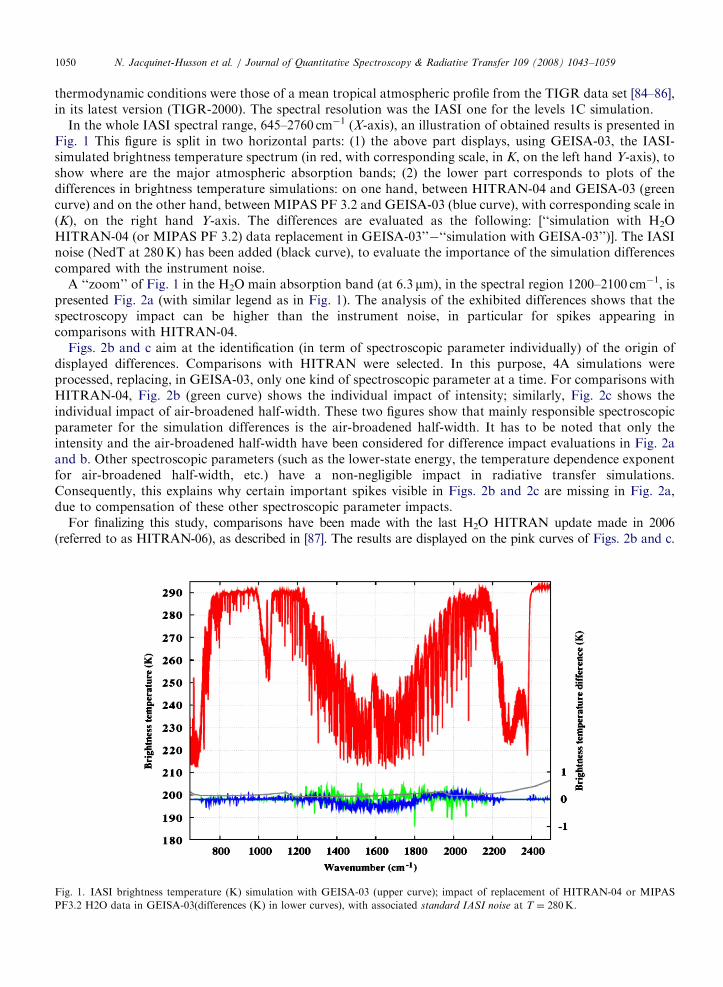
thermodynamic conditions were those of a mean tropical atmospheric profile from the TIGR data set [84–86],in its latest version (TIGR-2000). The spectral resolution was the IASI one for the levels 1C simulation.
In the whole IASI spectral range, 645–2760 cm�1 (X-axis), an illustration of obtained results is presented inFig. 1 This figure is split in two horizontal parts: (1) the above part displays, using GEISA-03, the IASI-simulated brightness temperature spectrum (in red, with corresponding scale, in K, on the left hand Y-axis), toshow where are the major atmospheric absorption bands; (2) the lower part corresponds to plots of thedifferences in brightness temperature simulations: on one hand, between HITRAN-04 and GEISA-03 (greencurve) and on the other hand, between MIPAS PF 3.2 and GEISA-03 (blue curve), with corresponding scale in(K), on the right hand Y-axis. The differences are evaluated as the following: [‘‘simulation with H2OHITRAN-04 (or MIPAS PF 3.2) data replacement in GEISA-03’’�‘‘simulation with GEISA-03’’)]. The IASInoise (NedT at 280K) has been added (black curve), to evaluate the importance of the simulation differencescompared with the instrument noise.
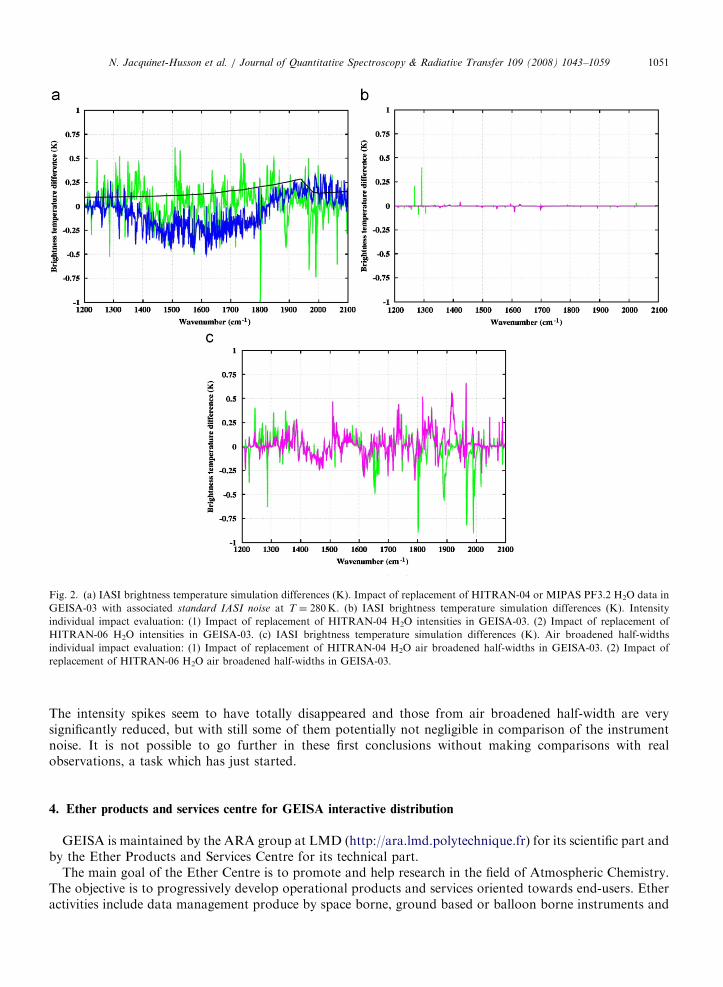
A ‘‘zoom’’ of Fig. 1 in the H2O main absorption band (at 6.3 mm), in the spectral region 1200–2100 cm�1, ispresented Fig. 2a (with similar legend as in Fig. 1). The analysis of the exhibited differences shows that thespectroscopy impact can be higher than the instrument noise, in particular for spikes appearing incomparisons with HITRAN-04.
Figs. 2b and c aim at the identification (in term of spectroscopic parameter individually) of the origin ofdisplayed differences. Comparisons with HITRAN were selected. In this purpose, 4A simulations wereprocessed, replacing, in GEISA-03, only one kind of spectroscopic parameter at a time. For comparisons withHITRAN-04, Fig. 2b (green curve) shows the individual impact of intensity; similarly, Fig. 2c shows theindividual impact of air-broadened half-width. These two figures show that mainly responsible spectroscopicparameter for the simulation differences is the air-broadened half-width. It has to be noted that only theintensity and the air-broadened half-width have been considered for difference impact evaluations in Fig. 2aand b. Other spectroscopic parameters (such as the lower-state energy, the temperature dependence exponentfor air-broadened half-width, etc.) have a non-negligible impact in radiative transfer simulations.Consequently, this explains why certain important spikes visible in Figs. 2b and 2c are missing in Fig. 2a,due to compensation of these other spectroscopic parameter impacts.
For finalizing this study, comparisons have been made with the last H2O HITRAN update made in 2006(referred to as HITRAN-06), as described in [87]. The results are displayed on the pink curves of Figs. 2b and c.
Fig. 1. IASI brightness temperature (K) simulation with GEISA-03 (upper curve); impact of replacement of HITRAN-04 or MIPAS
PF3.2 H2O data in GEISA-03(differences (K) in lower curves), with associated standard IASI noise at T ¼ 280K.
ARTICLE IN PRESS
Fig. 2. (a) IASI brightness temperature simulation differences (K). Impact of replacement of HITRAN-04 or MIPAS PF3.2 H2O data in
GEISA-03 with associated standard IASI noise at T ¼ 280K. (b) IASI brightness temperature simulation differences (K). Intensity
individual impact evaluation: (1) Impact of replacement of HITRAN-04 H2O intensities in GEISA-03. (2) Impact of replacement of
HITRAN-06 H2O intensities in GEISA-03. (c) IASI brightness temperature simulation differences (K). Air broadened half-widths
individual impact evaluation: (1) Impact of replacement of HITRAN-04 H2O air broadened half-widths in GEISA-03. (2) Impact of
replacement of HITRAN-06 H2O air broadened half-widths in GEISA-03.
N. Jacquinet-Husson et al. / Journal of Quantitative Spectroscopy & Radiative Transfer 109 (2008) 1043–1059 1051
The intensity spikes seem to have totally disappeared and those from air broadened half-width are verysignificantly reduced, but with still some of them potentially not negligible in comparison of the instrumentnoise. It is not possible to go further in these first conclusions without making comparisons with realobservations, a task which has just started.
4. Ether products and services centre for GEISA interactive distribution
GEISA is maintained by the ARA group at LMD (http://ara.lmd.polytechnique.fr) for its scientific part andby the Ether Products and Services Centre for its technical part.
The main goal of the Ether Centre is to promote and help research in the field of Atmospheric Chemistry.The objective is to progressively develop operational products and services oriented towards end-users. Etheractivities include data management produce by space borne, ground based or balloon borne instruments and
ARTICLE IN PRESSN. Jacquinet-Husson et al. / Journal of Quantitative Spectroscopy & Radiative Transfer 109 (2008) 1043–10591052
also the development of satellite scientific products and the development of tools to help data use and dataanalysis.
Through a website (http://ether.ipsl.jussieu.fr) Ether provides information on French scientific activities. Itforms part of the Ether Products and Services Centre, which uses this site as a forum for publishing:measurement data from French laboratories, as well as from many international centres; forecasts such aspotential vorticity; modelling results; downloadable procedures; browse images, on-line processing software(which can be activated through the Ether interface).
In this context, GEISA and GEISA/IASI databases have been implemented on the Ether Products andServices Centre since January 2007. Ether provides users with free and easy access (with tools and WEBinterfaces) to products from these two databases. The facilities associated with GEISA and GEISA/IASIdistribution are the same for both databases, i.e.:
�
Ta
Up
Mo
H2
CO
O3
CH
CO
N2
HN
O2
CF
‘‘1’
the
Interactive access to individual lines with tools to have a look and to download any information on thedatabase, i.e. contents (total or in user’s selected spectral range), histogram (on various parameters values),transition analysis, etc.
� FTP access to individual molecular species to download data easily. � On-line access to IR and UV/Vis cross-sections and aerosols. � Information about the data.Users have to click on the GEISA logo on the first page of the Ether WEB site (http://ether.ipsl.jussieu.fr) toaccess freely to GEISA and GEISA/IASI data and information.
5. GEISA spectroscopy enhancement needed: towards GEISA-08
The regularly updated and evolving spectroscopic databases, such as GEISA, still have their limitations andfaults, which have to be corrected or improved upon, in order to meet the requirements of a diverse group ofusers.
5.1. Earth’s atmosphere studies evaluation and requirements
A detailed (but not exhaustive) list of major improvements needed has been given in paragraph 6 of Ref. [3]and is still relevant today, such as the following important remaining spectroscopy-related problems:
�
The water vapor spectroscopic parameters: still need to be validated. � The water vapor continuum: more tuning to be done when more validation data (especially with high watervapor content) become available.
� The bands of freons 850 and 920 cm�1: temperature dependence to be refined.ble 4
date requirement index for selected molecules and spectroscopic parameters in major public spectroscopic databases
lecules Line position Line intensities Line broadening Line mixing Continuum Cross-sections
O 1 1 1 1
2 Y Y 1 1
3 1? 1
4 2 2 1 1
Y Y Y
O ? ? 2 2
O3 1 1 3
and N2 collision-induced spectrum Y
Cs, HCFCs, N2O5 Y
’ parameters that need to be improved; ‘‘2’’ and ‘‘3’’ second and third priority for improvement; ‘‘Y’’ no problem clearly identified; ‘‘?’’
databases have to be checked. A blank corresponds to non-applicable information.
ARTICLE IN PRESSN. Jacquinet-Husson et al. / Journal of Quantitative Spectroscopy & Radiative Transfer 109 (2008) 1043–1059 1053
�
O3 in the 9.6 mm region: the spectroscopic parameters still need to be validated. � Some CO2-Q branches: further improvement/tuning of the line mixing.More details are given in Table 4, in terms of individual spectroscopic parameter quality improvementrequired, in the major spectroscopic data public databases, for individual molecules, i.e. H2O, CO2, O3, CH4,CO, N2O, and HNO3 with some additional information on continuum and IR cross-sections evaluation givenas well. The molecule names are in column 1; the 4 other columns, 2–5, correspond respectively to thefollowing spectroscopic parameters, i.e. line position, line intensity, line broadening, and line mixing; the tworemaining columns, 6 and 7, are for continuum and IR cross-sections, respectively. For each molecule listed incolumn 1, coded index of quality have been given (from conclusions of IASI/ISSWG working group [6]) forthe spectroscopic parameters of columns 2–7, if applicable, as the following: ‘‘1’’ parameters that need to beimproved; ‘‘2’’ and ‘‘3’’ second and third priority for improvement; ‘‘Y’’ no problem clearly identified; and ‘‘?’’the databases have to be checked. A blank corresponds to non-applicable information.
5.2. Space studies of outer planets and Titan requirements
The GEISA database has been extensively used in the modelling of Titan’s atmosphere and in thecomparison with observations performed by Voyager (http://voyager.jpl.nasa.gov/), ground-based telescopesand more recently by the instruments on board the Cassini-Huygens mission (http://www.esa.int/SPECIALS/Cassini-Huygens/index.html).
In the past, large uncertainties and lacks existed on the spectroscopic data for several of the compounds foundon Titan. Consequently, complementary data (to those already archived in GEISA) have been used, i.e. forbenzene (C6H6), data provided by Dang-Nhu [88]; for the n8 band and the hot bands n8+n9�n9 of C4H2, generatedline lists from Arie and Johns [89] and band intensities from Koops et al. [90]; Graner [91] had provided thepropyne (CH3CCH for C3H4) n9 band data; C2H4 spectroscopic data were from Blass et al [92] and Rotger [93]. Inaddition, the ethane (C2H6) band between 1400 and 1500 cm�1 (observed on Jupiter and Titan), all the propane(C3H8) bands other than the one at 748 cm�1, the C4H2 band at 628 cm�1, the C2N2 band at 735 cm�1, the allene(C3H4) band near 350 cm�1, etc. were partially analyzed. This was also the case for heavier molecules predicted onTitan, such as C6H2, C4N2, and HC5N, for which very little spectroscopic data existed.
In the past year, spectroscopic parameters on several of the aforementioned molecules have becomeavailable and thus enhanced the analysis of Titan observations. Thus, the monochromatic radiance of thesatellite is now calculated based on spectroscopic parameters as described in Coustenis et al. [94], mainly fromGEISA-03 [4,9] and from recent additions to be implemented in the 2008 update of the database (see the nextparagraph). Data on some of the molecules of interest to the planetary community can be also found ininternational databases such as the NIST atomic and molecular physics databases (http://www.nist.gov/srd/atomic.htm), the JPL spectral line catalog [95] (http://spec.jpl.nasa.doc), and the CDMS database [96,97](http://www.ph1.uni-koeln.de/vorhersagen/).
Some of the data that remain to be obtained and implemented in GEISA can be listed as follows:
(a)
Hydrocarbons� CH4: in the near-infrared region (from 0.8 to 5 mm) both from theory and laboratory measurements.� C6H2: the band at 642 cm�1 which is studied by the LISA group.� C2H6: a complete analysis of the 1400–1500 cm�1 band to be made, following the new spectroscopicparameters by Vander Auwera et al. [98].� C3H8: needs in all bands beyond 800 cm�1.� C3H4 (propyne and allene): the data of the CDMS archive to be considered.� C6H6: a re-analysis of the Dang-Nhu [88] data is required.
(b)
Nitriles� C2N2: presently no data on the combination band at 735 cm�1 (which interferes with C2H2 and C3H8).� CH3CN: acetonitrile has been observed in the millimeter range, but also has bands in the mid andfar IR.� Other heavier nitriles such as propionitrile, etc.

ARTICLE IN PRESSN. Jacquinet-Husson et al. / Journal of Quantitative Spectroscopy & Radiative Transfer 109 (2008) 1043–10591054
(c)
Tab
Mol
Mol
H2O
CO2
N2O
CH4
PH3
HN
H2C
C2H
CH3
C2H
C2H
HCN
C2N
C4H
C3H
HC3
For Titan’s atmosphere� A global analysis to identify the hot bands and retrieve the intensities of the present molecular species is
urgently needed.� Furthermore, numerous isotopes now identified in Titan’s spectrum (e.g. [99–101] cannot be properly
analyzed in the absence of adequate spectroscopic data. Updates in the available spectroscopicdatabases are essential to the study of the outer planets and their satellites with atmospheres.
le 5
ecu
ecu
O3
O
6
D
2
4
2
2
4
N
5.3. Line transition parameters sub-database updates for the 2008 edition of GEISA (GEISA-08)
A systematic evaluation of the spectroscopy works underway for possible update in GEISA-08 has beenmade. A preliminary list, of the currently molecular species to be considered for the line transition sub-database, has been established and is summarized in Table 5a. In the first column are given the 16 selectedmolecular species, i.e. H2O, CO2, N2O, CH4, PH3, HNO3, H2CO, C2H6, CH3D, C2H2, C2H4, HCN, C2N2,C4H2, C3H4, and HC3N (related with HCN, the whole GEISA-03 contents will be replaced). It has to be noted
a
lar species currently selected for GEISA-08 edition update (preliminary non-exhaustive list)
le Spectral range or Bande ID Origin
500–8000 cm�1 JPL
2200–7000 cm�1 JPL
4000–9000 cm�1
1900–6800 cm�1 JPL
750–1350 cm�1 ICB, JPL, LISA, LPMAA
2850–3150 cm�1
4800–9200 cm�1
770–3601 cm�1 JPL, LISA
Submillimeter JPL, LISA, SAO
n5–n9 (421 cm�1)
2n9–n9 (438 cm�1) Wright State, South Alabama, Ohio State Universities
11.2mm (n5 and 2n98.3 mm (n8+n9) and (n6+n7)
1.573mm Anhui Institute of Optics
5–10mm (n2, n3, n4, n6) LISA, LADIR
12 mm region LISA, ULB
3250–3700 cm�1 ICB, JPL, LTS
2.5 and 3.8 mm LADIR
1.5 mm region LPMAA
0.83mm region ULB
850–1500 cm�1 ICB, ULB, Univ. LOUVAIN
0.006–17,943 cm�1 University College London
A. Maki
203–266 cm�1 LISA/GPCOS, LESIA
199–244 cm�1; 605–651 cm�1 LISA/GPCOS, LESIA
290–360 cm�1 LESIA
593–673 cm�1
16 mm (n5) LISA/GPCOS
20 mm (n6)
ARTICLE IN PRESS
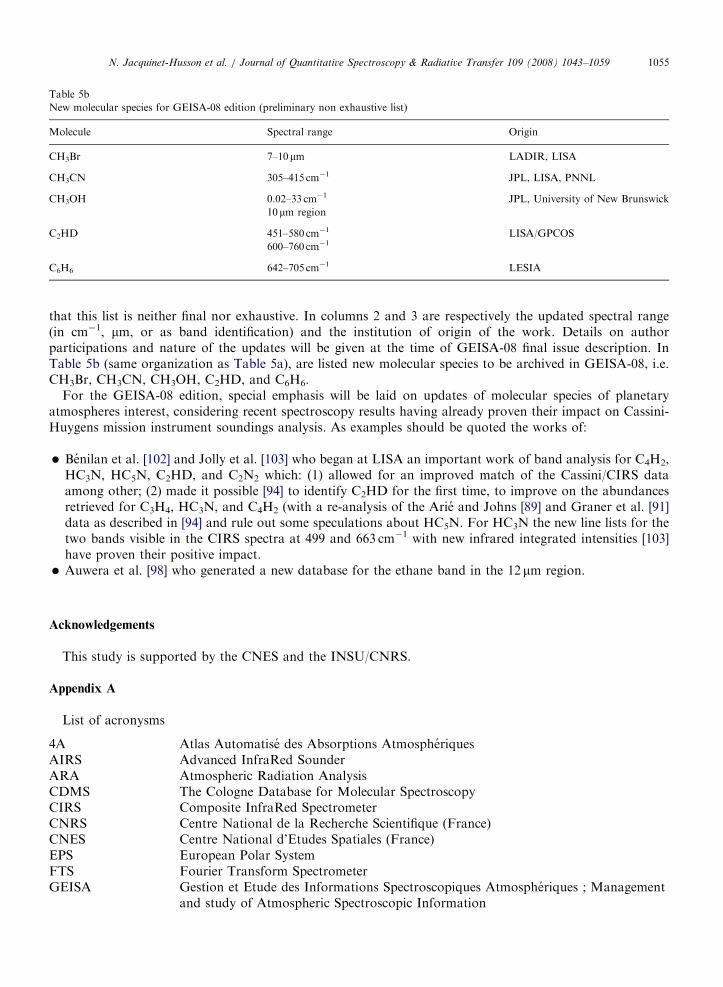
Table 5b
New molecular species for GEISA-08 edition (preliminary non exhaustive list)
Molecule Spectral range Origin
CH3Br 7–10mm LADIR, LISA
CH3CN 305–415 cm�1 JPL, LISA, PNNL
CH3OH 0.02–33 cm�1 JPL, University of New Brunswick
10 mm region
C2HD 451–580 cm�1 LISA/GPCOS
600–760 cm�1
C6H6 642–705 cm�1 LESIA
N. Jacquinet-Husson et al. / Journal of Quantitative Spectroscopy & Radiative Transfer 109 (2008) 1043–1059 1055
that this list is neither final nor exhaustive. In columns 2 and 3 are respectively the updated spectral range(in cm�1, mm, or as band identification) and the institution of origin of the work. Details on authorparticipations and nature of the updates will be given at the time of GEISA-08 final issue description. InTable 5b (same organization as Table 5a), are listed new molecular species to be archived in GEISA-08, i.e.CH3Br, CH3CN, CH3OH, C2HD, and C6H6.
For the GEISA-08 edition, special emphasis will be laid on updates of molecular species of planetaryatmospheres interest, considering recent spectroscopy results having already proven their impact on Cassini-Huygens mission instrument soundings analysis. As examples should be quoted the works of:
�
Benilan et al. [102] and Jolly et al. [103] who began at LISA an important work of band analysis for C4H2,HC3N, HC5N, C2HD, and C2N2 which: (1) allowed for an improved match of the Cassini/CIRS dataamong other; (2) made it possible [94] to identify C2HD for the first time, to improve on the abundancesretrieved for C3H4, HC3N, and C4H2 (with a re-analysis of the Arie and Johns [89] and Graner et al. [91]data as described in [94] and rule out some speculations about HC5N. For HC3N the new line lists for thetwo bands visible in the CIRS spectra at 499 and 663 cm�1 with new infrared integrated intensities [103]have proven their positive impact. � Auwera et al. [98] who generated a new database for the ethane band in the 12 mm region.Acknowledgements
This study is supported by the CNES and the INSU/CNRS.
Appendix A
List of acronysms
4A
Atlas Automatise des Absorptions Atmospheriques AIRS Advanced InfraRed Sounder ARA Atmospheric Radiation Analysis CDMS The Cologne Database for Molecular Spectroscopy CIRS Composite InfraRed Spectrometer CNRS Centre National de la Recherche Scientifique (France) CNES Centre National d’Etudes Spatiales (France) EPS European Polar System FTS Fourier Transform Spectrometer GEISA Gestion et Etude des Informations Spectroscopiques Atmospheriques ; Managementand study of Atmospheric Spectroscopic Information
ARTICLE IN PRESSN. Jacquinet-Husson et al. / Journal of Quantitative Spectroscopy & Radiative Transfer 109 (2008) 1043–10591056
GOME
Global Ozone Monitoring Experiment HITRAN HIgh-resolution TRANsmission molecular absorption data base IASI Infrared Atmospheric Sounder Interferometer ICB Institut Carnot de Bourgogne INSU Institut National des Sciences de l’Univers (France) IR Infrared ISSWG IASI Sounding Science Working Group LISA/GPCOS Laboratoire Inter-Universitaire des Systemes Atmospheriques/ Groupe de Physico-Chimie Organique Spatiale
JPL Jet Propulsion Laboratory LADIR Laboratoire de Dynamique, Interaction et reactivite LESIA Laboratoire d’Etudes Spatiales et d’Instrumentation en Astrophysique LISA Laboratoire Inter-Universitaire des Systemes Atmospheriques LMD Laboratoire de Meteorologie Dynamique LPMAA Laboratoire de Physique Moleculaire pour l’Atmosphereet l’Astrophysique
LTS Laboratory of Theoretical Spectroscopy MIPAS Michelson Interferometer for Passive Atmospheric Sounding METOP Meteorological Operational Satellite NASA National Aeronautics and Space Administration (USA) NEdT Noise Equivalent Temperature difference NIST National Institute of Standards and Technology SCIAMACHY SCanning Imaging Absorption spectroMeter for AtmosphericChartograpHY
TIGR Thermodynamic Initial Guess Retrieval ULB Universite Libre de Bruxelles UV Ultra Violet VIS VisibleReferences
[1] Chedin A, Husson N, Scott NA. Une banque de donnees pour l’etude des phenomenes de transfert radiatif dans les atmospheres
planetaires: la banque GEISA. Bull Inform Centre Donnees Stellaires (France) 1982;22:121–121.
[2] Husson N, Bonnet B, Scott NA, Chedin A. Management and study of spectroscopic information: the GEISA program. JQSRT
1992;48:509–18.
[3] Jacquinet-Husson N, Arie E, Ballard J, Barbe A, Brown LR, Bonnet B, et al. The 1997 spectroscopic GEISA databank. JQSRT
1999;62:205–54.
[4] Rosenkranz Ph, Buhler S, Feist D, Hewison T, Jacquinet-Husson N, Pardo JR, et al. Thermal microwave radiation—applications
for remote sensing, Chap. 2: Emission and spectroscopy of the clear atmosphere. IEE Electromagn Waves Ser (London, UK)
2006;52:76.
[5] Jacquinet-Husson N, Scott NA, Chedin A, Chursin AA. The GEISA spectroscopic database system revisited for IASI direct
radiative transfer modelling. Atmos Ocean Opt 2003;16(3):256–82.
[6] Jacquinet-Husson N, Scott NA, Chedin A, Garceran K, Armante R, Chursin AA, et al. The 2003 edition of the GEISA/IASI
spectroscopic database. JQSRT 2005;95:429–67.
[7] Scott NA. A direct method of computation of transmission function of an inhomogeneous gaseous medium: description of the
method and influence of various factors. JQSRT 1974;14:691–707.
[8] Scott NA, Chedin A. A fast line-by-line method for atmospheric absorption computations: the automatized atmospheric absorption
atlas. J Appl Meteor 1981;20:556–64.
[9] Jacquinet-Husson N, Scott NA, Garceran K, Armante R, Chedin A. The 2003 edition of GEISA: a spectroscopic database system
for the second generation vertical sounders radiance simulation. In: Proceedings of the 13th international TOVS study conference
(ITSC-13), Sainte-Adele, Canada, 28 October–4 November 2003.
[10] Rothman LS, Jacquemart D, Barbe A, Chris Benner D, Birk M, Brown LR, et al. The HITRAN 2004 molecular spectroscopic
database. JQSRT 2005;96:139–204.
[11] Flaud J-M, Piccolo C, Carli B, Perrin A, Coudert LH, Teffo JL, et al. Molecular line parameters for the MIPAS (Michelson
interferometer for passive atmospheric sounding) experiment. Atmos Ocean Opt 2003;16(3):172–88.
ARTICLE IN PRESSN. Jacquinet-Husson et al. / Journal of Quantitative Spectroscopy & Radiative Transfer 109 (2008) 1043–1059 1057
[12] Toth RA. Water vapor measurements between 590 and 2582 cm�1: line positions and strengths. J Mol Spectrosc 1998;190:379–96.
[13] Toth RA. HDO and D2O low pressure, long path spectra in the 600-3100 cm�1 region I. HDO line positions and strengths. J Mol
Spectrosc 1999;195:73–97;
Toth RA. Analysis of line positions and strengths of H216O ground and hot bands connecting to interacting upper states: (020), (100),
and (001). J Mol Spectrosc 1999;194:28–42.
[14] Toth RA. Air- and N2-broadening parameters of water vapor: 604 to 2271 cm�1. J Mol Spectrosc 2000;201:218–43.
[15] Toth RA. Air- and N2-broadening parameters of HDO and D2O: 709 to 1936 cm�1. J Mol Spectrosc 1999;198:358–70.
[16] Brown LR, Toth RA, Dulick M. Empirical line parameters of H216O near 0.94mm: positions, intensities and air-broadening
coefficients. J Mol Spectrosc 2002;212:57–82.
[17] Coheur P-F, Fally S, Carleer M, Clerbaux C, Colin R, Jenouvrier A, et al. New water vapor line parameters in the
26000–13000 cm�1 region. JQSRT 2002;74:493–510.
[18] Fally S, Coheur P-F, Carleer M, Clerbaux C, Colin R, Jenouvrier A, et al. Water vapor line broadening and shifting by air in the
26000–13000 cm�1 region. JQSRT 2003;82:119–32.
[19] Tashkun SA, Perevalov VI, Teffo J-L, Rothman LS, Tyuterev VlG. Global fitting of 12C16O2 vibrational–rotational line positions
using the effective Hamiltonian approach. JQSRT 1998;60:785–801.
[20] Tashkun SA, Perevalov VI, Teffo J-L. Global fittings of the vibrational–rotational line positions of the 16O12C17O and 16O12C18O
isotopic species of carbon dioxide. J Mol Spectrosc 2001;210:137–45.
[21] Teffo J-L, Daumont L, Claveau C, Valentin A, Tashkun SA, Perevalov Vl. Infrared spectra of the 16O12C17O and 16O12C18O species
of carbon dioxide: the region 500–1500 cm�1. J Mol Spectrosc 2002;213:145–52.
[22] Teffo J-L, Daumont L, Claveau C, Valentin A, Tashkun SA, Perevalov Vl. Infrared spectra of the 16O12C17O and 16O12C18O species
of carbon dioxide: II the region 1500–3000 cm�1. J Mol Spectrosc 2003;219:271–81.
[23] Wagner G, Birk M, Schreier F, Flaud J-M. Spectroscopic database for ozone in the fundamental spectral region. J Geophys Res
2002;107(D22):4626–43.
[24] Flaud J-M, Wagner G, Birk M, Camy-Peyret C, Claveau C, De Backer-Barilly MR, et al. Ozone absorption around 10mm.
J Geophys Res 2003;108(D9):4269–71.
[25] Barbe A, Chichery A, Tyuterev VlG, Tashkun S, Mikhailenko S. The 2n2 and 3n2–n2 bands of ozone. Spectrochim Acta A
1998;54:1935–45.
[26] S&MPO database /http://ozone.univ-reims.frS and /http://ozone.iao.ruS.
[27] De Backer-Barilly MR, Barbe A, Tyuterev VlG. Infrared spectrum of 16O18O16O in the 5micron range: positions, intensities, and
atmospheric applications. Atmos Oceanic Opt 2003;16:183–206.
[28] Mikhailenko S, Barbe A, Tyuterev VlG. Extended analysis of line positions and intensities of ozone bands in the 2900–3200 cm�1
region. J Mol Spectrosc 2002;215:229–41.
[29] Daumont L, Claveau C, De Backer-Barilly MR, Hamdouni A, Regalia-Jarlot L, Teffo J-L, et al. Line intensities of 14N216O: the 10
micrometers region revisited. JQSRT 2002;72:37–55.
[30] Brown LR, Benner DC, Champion JP, Devi VM, Fejard L, Gamache RR, et al. Methane line parameters in HITRAN. JQSRT
2003;82:219–38.
[31] Brown LR. Empirical line parameters of methane from 1.1 to 2.1 mm. JQSRT 2005;96:251–70.
[32] Goldman A, Stephen TM, Rothman LS, Giver LP, Mandin JY, Gamache RR, et al. The 1mm CO2 bands and the O2 (0–1) X3
Sg�–a1Dg and (1–0) X3Sg
�–b1Sg+ bands in the Earth atmosphere. JQSRT 2003;82:197–205.
[33] Brown LR, Plymate C. Experimental line parameters of the oxygen A band at 760 nm. J Mol Spectrosc 2000;199:166–79.
[34] Gillis JR, Goldman A. Nitric oxide IR line parameters for the upper atmosphere. Appl Opt 1982;21:1616–27.
[35] Goldman A. Private communication, 2003.
[36] Mandin J-Y, Dana V, Regalia L, Barbe A, Thomas X. L-splittings and line intensities in the first overtone of nitric oxide. J Mol
Spectrosc 1997;185:347–55.
[37] Mandin J-Y, Dana V, Regalia L, Barbe A, Von der Heyden P. Lambda-splittings and line intensities in the 3’1 hot band of14N16O: the spectrum of nitric oxide in the first overtone region. J Mol Spectrosc 1998;187:200–5.
[38] Mandin J-Y, Dana V, Perrin A, Flaud J-M, Camy-Peyret C, Regalia L, et al. The {n1+2n2, n1+n3} bands of14N16O2: line positions
and intensities; line intensities in the n1+n2+n3�n2 hot band. J Mol Spectrosc 1997;181:379–88.
[39] Dana V, Mandin J-Y, Allout M-Y, Perrin A, Regalia L, Barbe A, et al. Broadening parameters of NO2 lines in the 3.4 mm spectral
region. JQSRT 1997;57:445–58.
[40] Kleiner I, Tarrago G, Cottaz C, Sagui L, Brown LR, Poynter RL, et al. NH3 and PH3 line parameters: 2000 HITRAN update and
new results. JQSRT 2003;82:293–312.
[41] Butler RAH, Sagui L, Kleiner I, Brown LR. The mid-infrared spectrum of phosphine (PH3) between 2.8 and 3.7mm: line positions,
intensities, assignments. J Mol Spectrosc 2006;238:178–92.
[42] Gillis JR, Goldman A, Stark G, Rinsland CP. Line parameters for the A2S+_X2P bands of OH. JQSRT 2001;68:225–30.
[43] Goldman A, Coffey MT, Hannigan JW, Mankin WG, Chance KV, Rinsland CP. HBr and HI line parameters update for
atmospheric spectroscopy databases. JQSRT 2003;82:313–7.
[44] Rinsland CP, Jones NB, Connor BJ, Logan JA, Pougatchev NS, Goldman A, et al. Northern and southern hemisphere ground-
based infrared spectroscopic measurements of tropospheric carbon monoxide and ethane. J Geophys Res 1998;103(28):197–217.
[45] Mandin J-Y, Dana V, Claveau C. Line intensities in the n5 band of acetylene 12C2H2. JQSRT 2000;67:429–46.
[46] Jacquemart D, Claveau C, Mandin J-Y, Dana V. Line intensities of hot bands in the 13.6 mm spectral region of acetylene 12C2H2.
JQSRT 2001;69:81–101.
ARTICLE IN PRESSN. Jacquinet-Husson et al. / Journal of Quantitative Spectroscopy & Radiative Transfer 109 (2008) 1043–10591058
[47] Jacquemart D, Mandin J-Y, Dana V, Regalia-Jarlot L, Thomas X, Von Der Heyden P. Multispectrum fitting measurements of line
parameters for 5 mm cold bands of acetylene. JQSRT 2002;75:397–422.
[48] Vander Auwera J. Absolute intensities measurements in the n4+n5 band of 12C2H2: analysis of Herman-Wallis effects and forbidden
transitions. J Mol Spectrosc 2000;201:143–50.
[49] Flaud J-M, Birk M, Wagner G, Orphal J, Klee S, Lafferty WJ. The far-infrared spectrum of HOCl: line positions and intensities.
J Mol Spectrosc 1998;191:362–7.
[50] Flaud J-M. Private communication, 2002.
[51] Vander Auwera J, Kleffmann J, Flaud J-M, Pawelke G, Burger H, Hurtmans D, et al. Absolute n2 line intensities of HOCl by
simultaneous measurements in the infrared with a tunable diode laser and far-infrared region using a Fourier transform
spectrometer. J Mol Spectrosc 2000;204:36–47.
[52] Chackerian Jr C, Brown LR, Lacome N, Tarrago G. Methyl chloride n5 region line shape parameters and rotational constants for
the n2, n5 and 2n3 vibrational bands. J Mol Spectrosc 1998;191:148–57.
[53] Brown LR. Private communication, 2002.
[54] Brown LR. Private communication, 2001.
[55] Chance KV, Park K, Evenson KM, Zink LR, Stroh F, Fink EH, et al. Improved molecular constants for the ground state of HO2.
J Mol Spectrosc 1997;183:418–418.
[56] Chance KV. Private communication, 2003.
[57] Burrows JP, Richter A, Dehn A, Deters B, Himmelmann S, Voigt S, et al. Atmospheric remote-sensing reference data from GOME-
2. Temperature-dependent absorption cross sections of O3 in the 231–794nm range. JQSRT 1999;61:509–17.
[58] Voigt S, Orphal J, Bogumil K, Burrows JP. The temperature dependence (203–293K) of the absorption cross sections of O3 in the
230–850nm region measured by Fourier-transform spectroscopy. J Photochem Photobiol 2001;143(A):1–9.
[59] Orphal J. A critical review of the absorption cross-sections of O3 and NO2 in the ultraviolet and visible. J Photochem Photobiol
2003;157(A):185–209.
[60] Bogumil K, Orphal J, Homann T, Voigt S, Spietz P, Fleischmann OC, et al. Measurements of molecular absorption spectra with the
SCIAMACHY pre-flight model: instrument characterization and reference data for atmospheric remote-sensing in the 230–2380nm
region. J Photochem Photobiol 2003;157(A):167–84.
[61] Burrows JP, Dehn A, Deters B, Himmelmann S, Richter A, Voigt S, et al. Atmospheric remote-sensing reference data from GOME:
Part 1. Temperature-dependent absorption cross-sections of NO2 in the 231–794nm range. JQSRT 1998;60:1025–31.
[62] Voigt S, Orphal J, Burrows JP. The temperature and pressure dependence of the absorption cross-sections of NO2 in the 250–800nm
region measured by Fourier-transform spectroscopy. J Photochem Photobiol 2002;149(A):1–7.
[63] Vandaele A-C, Hermans C, Simon PC, Van Roozendael M, Guilmot J-M, Carleer M, et al. Fourier transform measurement of NO2
absorption cross-section in the visible range at room temperature. J Atmos Chem 1996;25:289–305.
[64] Vandaele A-C, Hermans C, Simon PC, Carleer M, Colin R, Fally S, et al. Measurements of the NO2 absorption cross-section from
42,000 cm�1 to 10 000 cm�1 (238–1000nm) at 220K and 294K. JQSRT 1998;59:171–84.
[65] Vandaele A-C, Hermans C, Fally S, Carleer M, Colin R, Merienne M-F, et al. High-resolution Fourier transform measurement of
the NO2 visible and near-infrared absorption cross sections: temperature and pressure effects. J Geophys Res 2002;107(D):43–8.
[66] Vandaele A-C, Hermans C, Fally S, Carleer M, Merienne M-F, Jenouvrier A, et al. Absorption cross-sections of NO2: simulation of
temperature and pressure effects. JQSRT 2003;76:373–91.
[67] Kromminga H, Orphal J, Spietz P, Voigt S, Burrows JP. New measurements of OClO absorption cross-sections in the 325–435nm
region and their temperature dependence between 213 and 293K. J Photochem Photobiol 2003;157(A):149–60.
[68] Vandaele A-C, Simon PC, Guilmot JM, Carleer M, Colin R. SO2 absorption cross-section measurement in the UV using a Fourier
transform spectrometer. J Geophys Res 1994;99(D12):25599–606.
[69] Fleischmann OC, Burrows JP, Hartmann M, Orphal J. New ultraviolet absorption cross-sections of BrO at atmospheric
temperatures measured by time-windowing Fourier transform spectroscopy. J Photochem Photobiol 2004;168(A):117–32.
[70] Fleischmann OC, Meyer-Arnek J, Burrows JP, Orphal J. The visible absorption spectrum of OBrO investigated by Fourier
transform spectroscopy. J Phys Chem 2005;109(A):5093–103.
[71] Jenouvrier A, Merienne M-F, Coquart B, Carleer M, Fally S, Vandaele AC, et al. Fourier transform spectroscopy of the O2
Herzberg bands: I. Rotational analysis. J Mol Spectrosc 1999;198:136–62.
[72] Fally S, Vandaele AC, Carleer M, Hermans C, Jenouvrier A, Merienne M-F, et al. Fourier transform spectroscopy of the O2
Herzberg bands. III. Absorption cross sections of the collision-induced bands and of the Herzberg continuum. J Mol Spectrosc
2000;204:10–20.
[73] Merienne M-F, Jenouvrier A, Coquart B, Carleer M, Fally S, Colin R, et al. Fourier transform spectroscopy of the O2 Herzberg
bands: II. Band oscillator strengths and transition moments. J Mol Spectrosc 2000;202:171–93.
[74] Merienne M-F, Jenouvrier A, Coquart B, Carleer M, Fally S, Colin R, et al. Improved data set for the Herzberg band systems of16O2. J Mol Spectrosc 2001;207:120–120.
[75] Newnham DA, Ballard J. Visible absorption cross sections and integrated absorption intensities of molecular oxygen (O2 and O4).
J Geophys Res 1998;103D:28801–16.
[76] Vandaele A-C, De Maziere M, Hermans C, Carleer M, Clerbaux C, Coheur P, et al. UV, visible and near-IR spectroscopy of
atmospheric species. Recent Res Dev Chem Phys 2003;4:325–44.
[77] Massie ST. Indices of refraction for the HITRAN compilation. JQSRT 1994;52:501–13.
[78] Rublev AA. Algorithm and computation of aerosol phase functions. Internal Note IAE-5715/16 of Russian Research Center,
Kurchatov Institute, Moscow, Russia, 1994.

ARTICLE IN PRESSN. Jacquinet-Husson et al. / Journal of Quantitative Spectroscopy & Radiative Transfer 109 (2008) 1043–1059 1059
[79] Hess M, Kopke P, Schult I. Optical Properties of aerosols and clouds: the software package OPAC. BAMS 1998;79(5):831–44.
[80] Kopke P, Hess M, Schult I, Shettle EP. Global aerosol dataset. Max-Planck-Institut fur Meteorologie 1997. Report No.243,
Hamburg, Germany, 1997.
[81] Zolatarev VM, Morozov VM, Smirnova EV. Optical constants of natural and technology media, Leningrad, Russia, 1984. 216pp
(in Russian).
[82] Jacquinet-Husson N, Garceran K, Scott NA, Armante R, Chedin A. Spectroscopic data assessment for the GEISA/IASI-03 archive.
20th Meeting of the IASI Sounding Science Working Group, Met Office, Exeter, UK, 26–28 October 2004, /http://ara.lmd.
polytechnique.fr/htdocs-public/oral_pub/oralpub.htmlS.
[83] Orphal J, Chance KV. Ultraviolet and visible absorption cross-sections for HITRAN. JQSRT 2003;82:491–504.
[84] Chedin A, Scott NA, Wahiche C, Moulinier P. The improved initialization inversion method: a high resolution physical method for
temperature retrievals from satellites of the TIROS-N series. J Clim Appl Meteor 1985;24:128–43.
[85] Achard V. Trois problemes cles de l’analyse 3D de la structure thermodynamique de l’atmosphere par satellite. These de doctorat,
Universite Paris 7, 1991. 168pp. [Available from Laboratoire de Meteorologie Dynamique, Ecole Polytechnique, 91128 Palaiseau,
France.]
[86] Chevallier F, Cheruy F, Scott NA, Chedin A. A neural network approach for a fast and accurate computation of longwave radiative
budget. J Appl Meteor 1998;37(11):1385–97.
[87] Gordon IE, Rothman LS, Gamache RR, Jacquemart D, Boone C, Bernath PF, et al. Current updates of the water-vapor line list in
HITRAN: a new ‘‘Diet’’ for air-broadened half-widths. JQSRT 2007;108:389–402.
[88] Dang-Nhu M, Blanquet G, Walrand J, Raulin F. Spectral intensities in the n4 band of benzene at 15mm. J Mol Spectrosc
1989;134(1):237–9.
[89] Arie E, Johns JWC. The bending energy levels of C4H2. J Mol Spectrosc 1992;155:195–204.
[90] Koops Th, Smit WMA, Visser T. Measurement and interpretation of the absolute infrared intensities of acetylene: fundamentals and
combination bands. J Mol Struct 1984;112:285–99.
[91] Graner G, Farrenq F, Blanquet G, Walrand J, Pekkala K. J Mol Spectrosc 1993;161:80–102.
[92] Blass WE, Hillman JJ, Fayt A, Daunt SJ, Senesac LR, Ewing AC, et al. 10mm ethylene: spectroscopy, intensities and a planetary
modeler’s atlas. JQSRT 2001;71:47–60.
[93] Rotger M. Private communication, 2007.
[94] Coustenis A, Achterberg R, Conrath B, Jennings D, Marten A, Gautier D, et al. The composition of Titan’s stratosphere from
Cassini/CIRS mid-infrared spectra. Icarus 2007;189:35–62.
[95] Pickett HM, Poynter RL, Cohen EA, Delitsky ML, Pearson JC, Muller HSP. Submillimeter, millimeter, and microwave spectral line
catalog. JQSRT 1998;60:883–90.
[96] Muller HSP, Thorwirth S, Roth DA, Winnewisser G. The Cologne database for molecular spectroscopy, CDMS. Astronom
Astrophys 2001;370:L49–52.
[97] Muller HSP, Schloder F, Stutzki J, Winnewisser G. The Cologne database for molecular spectroscopy, CDMS: a useful tool for
astronomers and spectroscopists. J Mol Struct 2005;742:215–27.
[98] Vander Auwera J, Moazzen-Ahmadi N, Flaud J-M. Toward an accurate database for the 12 mm region of the ethane spectrum.
Astrophys J 2007;662(1):750–7.
[99] Bezard B, Nixon CA, Kleiner I, Jennings DE. Detection of 13CH3D on Titan. Icarus 2007;191:397–400.
[100] Coustenis A, Jennings D, Jolly A, Benilan Y, Nixon C, Gautier D, et al. Detection of C2HD and the D/H ratio on Titan. Icarus
2008, submitted for publication.
[101] Nixon CA, Achterberg RK, Vinatier S, Bezard B, Coustenis A, Teanby NA, et al. The 12C/13C ratio in Titan hydrocarbons from
Cassini/CIRS infrared spectra. Icarus 2008, in press.
[102] Benilan Y, Jolly A, Raulin F, Guillemin J-C. IR band intensities of DC3N and HC315N: implication for observations of Titan’s
atmosphere. Planet Space Sci 2006;54(6):635–40.
[103] Jolly A, Benilan Y, Fayt A. New infrared integrated intensities for HC3N and extensive line list for the n5 and n6 bending modes.
J Mol Spectrosc 2007;242(1):46–54.