
THE GAP - Fluor Corporation
144
2017 ANNUAL R EPORT BRIDGING THE GAP between short-term adversity and long- term discipline 10 page GOV. MARIO M. CUOMO BRIDGE
Transcript of THE GAP - Fluor Corporation

2 0 1 7 A N N U A L R E P O R T
BRIDGINGTHE GAP
between short-term adversity and long-
term discipline
10page
G O V . M A R I O M . C U O M O B R I D G E
AN
NU
AL
RE
PO
RT
20
17
819586.indd 1 3/1/18 8:56 AM

F L U O R C O R P O R A T I O N ( N Y S E : F L R ) is one of the largest professional services firms, providing engineering, procurement, construction, fabrication and modularization, commissioning and maintenance, as well as project management services, on a global basis. Fluor, through its operating subsidiaries, is an integrated solutions provider for clients in a diverse set of industries worldwide, including oil and gas, chemicals and petrochemicals, mining and metals, transportation, power, life sciences and manufacturing. Fluor is also a service provider to the U.S. federal government and other governments abroad, and performs operations and maintenance activities globally for major industrial clients.
F O R W A R D - L O O K I N G S T A T E M E N T S This annual report contains statements that may constitute forward-looking statements involving risks and uncertainties, including statements about market outlook, new awards, backlog levels, competition, and the implementation of strategic initiatives, including investments and acquisitions. These forward-looking statements reflect the Company’s current analysis of existing information as of the date of this annual report, and are subject to various risks and uncertainties. As a result, caution must be exercised in relying on forward-looking statements. Due to known and unknown risks, the Company’s actual results may differ materially from our expectations or projections. Additional information concerning factors that may influence Fluor’s results can be found in the Form 10-K that follows this annual report, under the heading “Item 1A. Risk Factors.”
CONTENTS
Bridging The Gap
819586.indd 2 2/28/18 1:57 PM

02 S H A R E H O L D E R L E T T E R
10 T I M E L I N E
12 E N E R G Y, C H E M I C A L S & M I N I N G
14 I N D U S T R I A L , I N F R A S T R U C T U R E & P O W E R
16 G O V E R N M E N T
18 D I V E R S I F I E D S E R V I C E S
20 N E W AWA R D S & B A C K L O G D ATA
21 S E L E C T E D F I N A N C I A L D ATA
22 C O R P O R AT E M A N A G E M E N T T E A M
23 B O A R D O F D I R E C T O R S
25 F O R M 1 0 - K
A N N U A L R E P O R T 2017
1
819586.indd 3 2/28/18 1:57 PM

D AV I D T. S E AT O N C H A I R M A N & C H I E F E X E C U T I V E O F F I C E R
While financial markets sometimes drive companies to make decisions focused on the short term, we remain committed to deploying our strategies, initiatives and actions with a vision for the long term.
819586.indd 4 2/28/18 1:57 PM

A N N U A L R E P O R T 2017
2017 was a year in which we continued our transformation into building a company that can deliver sustainable long-term growth for our stakeholders. We are bridging the gap between the recent capital constraints of our clients and our expectation of a multi-year recovery in the markets we serve.
T hus, in 2017 we continued on our journey to fully deploy our strategy to deliver the capital-efficient projects our clients
demand. This was evidenced by new awards across the entire asset life cycle, from front-end engineering and design (FEED) to full engineering, procurement, fabrication and construction, and to Stork’s operations and maintenance services.
We have taken significant steps to prepare our company for the future, making progress on predictive analytics that will enable more accurate project reporting and forecasting, and on developing our proprietary Zero Base ExecutionSM (ZBESM) approach for simplified design that delivers fit-for-purpose facilities which meet our clients’ needs.
Focusing on long-term sustainability has always been a key part of our foundation. Our clients
create the projects that make society work. The energy that powers us, the raw materials that build our industries and cities, the bridges and highways that connect us, the missions that keep our people and nations safe – these are the vitally important arenas in which our clients operate. Through the power of our integrated solutions, Fluor helps these clients bring their plans to fruition.
TO OUR VALUED SHAREHOLDERS
3
Focusing on long-term sustainability has always been a key part of our foundation. Our clients create the projects that make society work.
2 0 15 2 0 16 2 0 1 7
19.0
18.1
R E V E N U E
( D o l l a r s i n B i l l i o n s )
19.5
N O R T H W E S T R E D W A T E R S T U R G E O N R E F I N E R Y
A L B E R TA , C A N A D A
819586.indd 5 2/28/18 1:57 PM

A N N U A L R E P O R T 2017
4
2017F I N A N C I A L R E S U LT S
Total new awards for 2017 were $12.6 billion, and ending backlog was $31 billion. New awards for the year reflect the fact that many of our clients continue to evaluate their capital expenditure needs and remain focused on moving select advantaged projects forward.
Net earnings attributable to Fluor in 2017 were $191 million, or $1.36 per diluted share. This includes the impact of recently enacted U.S. tax reform legislation of $37 million, or $0.27 per diluted share. Fluor’s revenue for the full year was $19.5 billion, up from $19 billion in 2016. We are encouraged by what we see from a revenue standpoint.
Fluor’s balance sheet remains strong, with $2.1 billion in cash and marketable securities at year-end. During the year, we returned $118 million in dividends to shareholders. We remain committed to being good stewards of our balance sheet and capital structure.
2 0 1 7 A C C O M P L I S H M E N T S
Since we began our strategic journey to become the integrated solutions provider of choice for our clients, we have seen a fundamental shift in our markets, especially in energy and commodities. More than ever before, clients are demanding cost and schedule certainty, and that facilities be designed and built for capital efficiency, allowing them to thrive in any commodity price environment.
Our client-focused approach was a strong contributor to our selection by LyondellBasell to perform the engineering and procurement for its propylene oxide (PO) and tertiary butyl alcohol (TBA) facility near Houston, Texas. PO is a key component of many everyday products, including bedding, furniture, carpeting, coatings, building materials and adhesives. The TBA will be converted to fuel additives that help gasoline burn cleaner and reduce automobile emissions. This project is the world’s largest of its kind and represents the single largest capital investment in Lyondell- Basell’s history.
Other achievements in the Energy, Chemicals and Mining segment included the completion of The Dow Chemical Company’s new ethylene production facility in Freeport, Texas, which produces the raw materials for many of Dow’s industry-leading performance plastics products. Fluor was involved with this client throughout the entire project, from FEED through engineering, procurement and construction (EPC).
The global mining industry is emerging from a period of low commodity prices, and over the past year we have begun to see clients move forward with significant investments. In 2017, we secured several FEED awards with the potential to convert them to full EPC engagements. We completed the Ma’aden phosphate megaproject in Saudi Arabia and signed a memorandum of understanding to support the client’s future projects. Additionally, a Fluor joint venture was awarded the EPC for a copper concentrator at BHP’s Spence open-cut copper mine in Chile. These mines produce essential components of products used for household, industrial and agricultural applications around the world.
C O N S O L I D A T E D
N E W A W A R D S & B A C K L O G
(Dollars in B il l ions)
2 0 1 720162015
44
.7
45.
0
31.0
12.6
21.8
21.0
A w a r d s
B a c k l o g
819586.indd 6 2/28/18 1:57 PM

In 2017, restoring power to Puerto Rico was an example of the unique value that Fluor can bring.
5
U . S . A R M Y C O R P S O F E N G I N E E R SP U E R T O R I C O R E S T O R A T I O N P R O J E C T
P U E R T O R I C O
819586.indd 7 2/28/18 1:57 PM

6
We remain committed to deploying our strategies, initiatives and actions with a vision for the long term.
U . S . D E P A R T M E N T O F E N E R G YI D A H O C L E A N U P P R O J E C TI D A H O F A L L S , I D A H O , U S A
819586.indd 8 2/28/18 1:58 PM

7
A N N U A L R E P O R T 2017
In our Industrial, Infrastructure and Power segment, we completed the first span of the Governor Mario M. Cuomo Bridge in New York, opening four new lanes to ease the city’s traffic congestion. Scheduled to fully open to traffic in 2018, it will be the largest bridge project in New York State history, and will significantly enhance travel efficiency for commuter and commercial traffic. Residents and visitors in the Boston area will benefit from the Green Line Light Rail Extension, which was awarded to a Fluor joint venture in 2017 and is scheduled to open in 2021. And in the Netherlands, a Fluor joint venture was selected for a project to expand the A10 South motorway and the Amsterdam Zuid rail station, improving quality of life in the area. In Texas, Fluor benefited from much-needed investment in the regional road infrastructure, with two awards to improve highways in the Dallas area.
In Life Sciences and Advanced Manufacturing, we are progressing well on our project to design and build Novo Nordisk’s manufacturing facility in North Carolina, which will produce critical ingredients for its new oral treatment for diabetes patients. The project is Novo Nordisk’s largest ever, and is the biggest single life sciences manufacturing investment in the history of the state. We see significant opportunities in this market, given the number of new drugs that were approved by the U.S. Food and Drug Administration in 2017.
In Power, we are helping clients fulfill their mission to deliver reliable electricity to communities. We were selected by Ontario Power Generation (OPG) in Canada to provide procurement and construction for
the refurbishment of OPG’s Darlington Nuclear Generating Station. NuScale Power made significant progress in 2017 toward approval for its small modular reactor (SMR) technology design. In March, the company’s design certification was accepted for review by the U.S. Nuclear Regulatory Commission (NRC), and they recently approved NuScale’s design approach, eliminating the need for back-up electrical power. NuScale expects final approval of its design in 2020, paving the way for the deployment of the first reactors by the mid-2020s, delivering a safe, clean, flexible and more affordable nuclear power solution.
Our Government Group continues to support our clients’ missions, from contingency operations and base operations support to nuclear site clean-up and remediation. In 2017, restoring power to Puerto Rico was an example of the unique value that Fluor can bring. After Hurricane Maria devastated the island, Fluor was brought in by the U.S. Army Corps of Engineers to bring power back. We have made significant progress to date and are proud to help restore a sense of normalcy to Puerto Rico’s residents. There is potential for additional work, as the U.S. Congress moves toward providing additional disaster relief support to help rebuild the island’s infrastructure.
Our Diversified Services segment continues to be a key part of our total integrated solutions offering by providing facility start-up and management, plant and facility maintenance, operations support and asset management services. In 2017, we fully integrated our operations and maintenance with Stork. Despite pressure on maintenance spend,
Stork won a number of awards – including a contract from Ecopetrol to support its operations in Colombia, building on a 30-year relationship with the client. Our AMECO equipment business and TRS Staffing Solutions achieved growth by supporting clients and projects around the world.
I N V E S T I N G I N T H E F U T U R E
While financial markets sometimes drive companies to make decisions focused on the short term, we remain committed to deploying our strategies, initiatives and actions with a vision for the long term.
For example, we continue to invest in the innovation that differentiates us from our competitors and enables us to deliver the capital-efficient solutions that our clients demand. In 2017, we held our third Innovation Unwrapped event, where employees from across the company competed to spend a week working on real client challenges – in part with the client – and come up with robust solutions. We are implementing solutions from our previous events, including Safety PinSM, a smart technology application designed to improve safety planning and reduce incidents on job sites.
We also introduced our ZBE approach, a unique set of work processes that combines our technical and executional capabilities in ways our competitors cannot. ZBE allows us to simplify design for our clients and provide them with facilities that run effectively and efficiently on a leaner build.
As we look to the future, the foundation of our company is as solid as it has ever been in our 105-year history.
G O L D C O R P P E Ñ A S Q U I T O P Y R I T E L E A C H P R O J E C T
Z A C AT E C A S , M E X I C O
819586.indd 9 2/28/18 1:58 PM

10%A M E R I C A S
12%G O V E R N M E N T
8%D I V E R S I F I E D S E R V I C E S
25%I N D U S T R I A L , I N F R A S T R U C T U R E & P O W E R
55%E N E R G Y, C H E M I C A L S & M I N I N G
5%A S I A PA C I F I C & A U S T R A L I A
43%E U R O P E , A F R I C A & M I D D L E E A S T
42%U N I T E D S TAT E S
B A C K L O G B Y S E G M E N TC O N S O L I D A T E D B A C K L O G B Y R E G I O N
8
T E X A S D E P A R T M E N T O F T R A N S P O R T A T I O N H O R S E S H O E P R O J E C T
D A L L A S , T E X A S , U S A
819586.indd 10 2/28/18 1:58 PM

9
A N N U A L R E P O R T 2017
We simplified our business line organization, with the leaders now reporting directly to me. We made executive changes, including bringing in new leadership to our Power business line, and we created a Project Support Services organization with the goal of providing our projects around the world with consistency and excellence in everything from project controls to health, safety and environment.
Project Support Services oversees our drive toward data-centric execution as we embrace what the World Economic Forum has declared the Fourth Industrial Revolution. In 2017, we made significant progress on this journey when we launched a new data-centric execution platform. This platform will use historical standardized data to more accurately analyze and predict project outcomes, helping us to drive execution excellence and the cost and schedule certainty that our clients demand. We believe that by leading the charge, this will be a game-changer for Fluor and our customers.
Our projects are the building blocks of progress, from providing energy to support the needs of the world’s growing population to developing the infrastructure that enables global commerce and the manufacturing facilities that produce life-saving pharmaceuticals. We are dedicated to giving back to the communities in which our employees live and work, and to working in a sustainable manner. Our focus is on the
long term, whether developing energy-saving solutions for our offices and projects or investing in the future of communities around the world. For example, in 2017 Fluor and its employees helped more than 200,000 young people receive 2.6 million hours of life-skills and leadership training by partnering with youth-serving organizations and initiatives.
T H E O U T L O O K F O R 2 0 1 8
As we look to the future, the foundation of our company is as solid as it has ever been in our 105-year history. We have weathered the recent market challenges and are ready to take advantage of the new opportunities that we expect to see in 2018 and beyond.
Our four Core Values of safety, integrity, teamwork and excellence remain at the center of everything we do, every day. Safety continues to be a major area of emphasis – while our performance in 2017 improved compared with 2016, we know we can do more through an uncompromising focus on safety and promoting a caring, preventive culture.
We will continue to invest in providing the best and most advanced education and training for our workforce as the competition for talent increases, especially in the United States. This investment will enable Fluor to maintain its strong reputation as an employer of choice – a place that abounds with career opportunities, and attracts and retains the best and brightest talent in our industry.
In closing, I want to thank our Board of Directors – a diverse group of highly accomplished people who provide us with the guidance and direction to enable us to be successful. In 2017, we welcomed retired U.S. Navy Admiral Sam Locklear to our Board. I would also like to acknowledge the passing in December 2017 of Dean O’Hare, the former chairman and chief executive officer of the Chubb Corporation. Dean served on our board for 18 years, and I very much appreciated the significant contribution he made to Fluor through his advice and counsel. He will be sorely missed.
Finally, I want to thank our over 56,000-strong, talented global workforce for the passion and commitment they bring to work every day. In an uncommon year of natural disasters that severely impacted many of the communities where our employees live and work, you showed exceptional strength, decency and humanity. In addition to extensive volunteer activities, the Employee Giving Campaign raised more than $5.6 million to support the health and wellbeing of communities around the world. Your actions are a reminder of what truly matters in life, and why we are all so proud to be part of a company that supports its clients, betters the communities where we work, improves lives and is truly transforming the world.
D AV I D T. S E AT O N C H A I R M A N & C H I E F E X E C U T I V E O F F I C E RM A R C H 5 , 2 0 1 8
819586.indd 11 2/28/18 1:58 PM
A N N U A L R E P O R T 2017
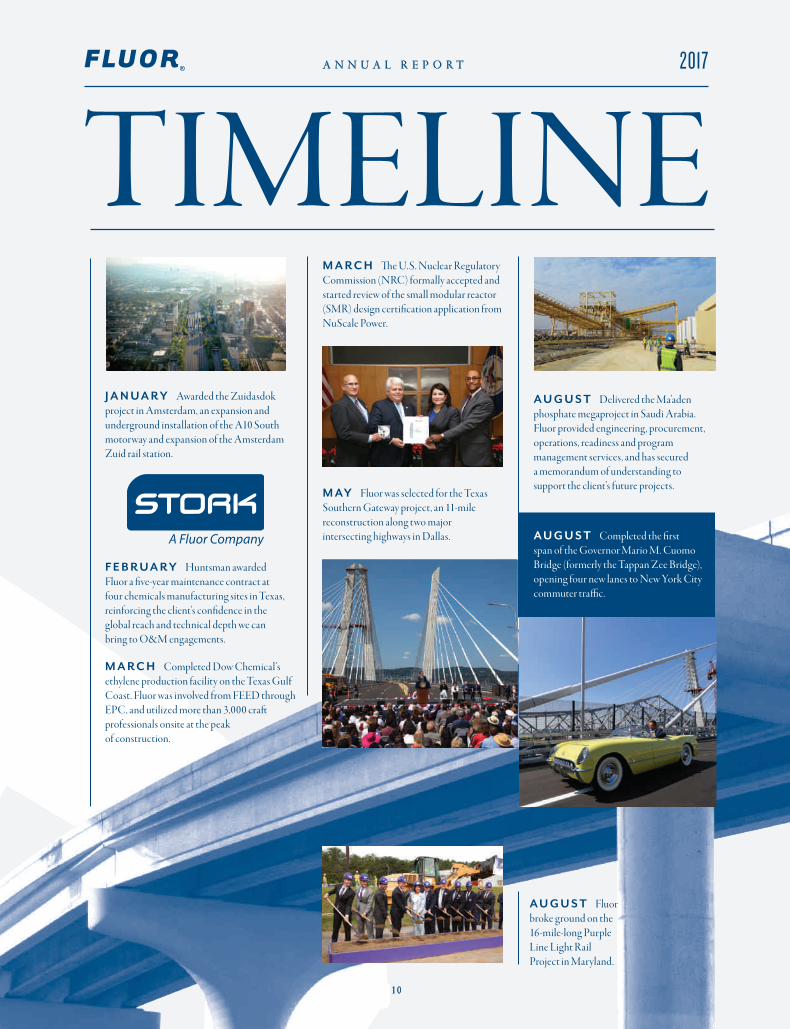
TIMELINE
M A R C H Completed Dow Chemical’s ethylene production facility on the Texas Gulf Coast. Fluor was involved from FEED through EPC, and utilized more than 3,000 craft professionals onsite at the peak of construction.
F E B R U A R Y Huntsman awarded Fluor a five-year maintenance contract at four chemicals manufacturing sites in Texas, reinforcing the client’s confidence in the global reach and technical depth we can bring to O&M engagements.
J A N U A R Y Awarded the Zuidasdok project in Amsterdam, an expansion and underground installation of the A10 South motorway and expansion of the Amsterdam Zuid rail station.
M A R C H The U.S. Nuclear Regulatory Commission (NRC) formally accepted and started review of the small modular reactor (SMR) design certification application from NuScale Power.
M AY Fluor was selected for the Texas Southern Gateway project, an 11-mile reconstruction along two major intersecting highways in Dallas.
A U G U S T Delivered the Ma’aden phosphate megaproject in Saudi Arabia. Fluor provided engineering, procurement, operations, readiness and program management services, and has secured a memorandum of understanding to support the client’s future projects.
A U G U S T Fluor broke ground on the 16-mile-long Purple Line Light Rail Project in Maryland.
1 0
A U G U S T Completed the first span of the Governor Mario M. Cuomo Bridge (formerly the Tappan Zee Bridge), opening four new lanes to New York City commuter traffic.
819586.indd 12 2/28/18 1:58 PM

2017
D E C E M B E R Completed three major engineering, procurement, fabrication and construction (EPFC)projects in Canada: a new refinery in Edmonton, and two projects for a large new oil sands facility in Fort McMurray.
D E C E M B E R Awarded Shell Penguins Offshore Platform project for the North Sea, fully leveraging our global offshore capabilities with Asia design and modular fabrication capabilities.
S E P T E M B E R Awarded contract by LyondellBasell to build the largest propylene oxide plant in the world – also the largest investment in the client’s history. Utilizing Zero Base ExecutionSM, we greatly simplified the project to reduce costs by hundreds of millions of dollars over the original plan.
O C T O B E R The U.S. Army Corps of Engineers awarded task orders to support power restoration in Puerto Rico, and FEMA issued task orders to support hurricane disaster recovery efforts along the Gulf Coast.
S E P T E M B E R Fluor was awarded the EPC for a 95,000-ton-per-day copper concentrator mining project for the BHP Spence Project in Chile.
S E P T E M B E R Awarded the Guam Base Operations Support (BOS) contract, one of the largest BOS opportunities in the Department of Defense portfolio.
1 1
N O V E M B E R Selected to provide procurement and construction for refurbishment work at Ontario Power Generation’s Darlington Nuclear Generating Station in Canada. Credit: Ontario Power Generation
N O V E M B E R Awarded the Green Line Rail Extension in Boston, encompassing seven new stations, a vehicle storage and maintenance facility, and two branch lines.
T E X A S D E P A R T M E N T O F T R A N S P O R T A T I O NH O R S E S H O E P R O J E C T
D A L L A S , T E X A S , U S A
819586.indd 13 2/28/18 1:58 PM

WE ARE SHOWING CLIENTS WAYS TO UNLEASH CAPITAL
E N E R G Y , C H E M I C A L S & M I N I N G
P E M E X T R A N S F O R M A C I O N I N D U S T R I A LT U L A R E F I N E R Y U P G R A D E P R O J E C T
H I D A L G O , M E X I C O
819586.indd 14 2/28/18 1:58 PM

A N N U A L R E P O R T 2017
1 3
E C M | Y E A R I N R E V I E W
C ommodity prices moderately improved in 2017, continuing what is predicted to be a steady but measured multi-year recovery.
In this environment, projects gaining final investment decision (FID) must meet certain critical criteria, as clients remain committed to project investment discipline: Cost and schedule certainty must be assured, and facilities must be designed and built for capital efficiency, allowing them to thrive in any commodity price environment. While these hard demands limit the number of projects approved, they also unlock more of the kinds of projects where Fluor’s Energy, Chemicals and Mining business excels.
Fluor continued to lead in 2017 because we persistently focus on bringing our clients innovative new solutions to assure project outcomes, such as our proprietary Zero Base ExecutionSM process and data-driven performance. We continue to deliver the value of modularization through our fabrication yards, which enables more cost-effective manufacturing execution for projects anywhere in the world. We continue to invest in our leadership, developing people with fresh ideas for solving complex market challenges, and we continue to build a stronger, better-equipped self-perform workforce.
Fluor’s integrated solutions are boosting client confidence, and we are seeing more project
opportunities globally, namely petrochemical, LNG and gas in North America, downstream in Asia Pacific and the Middle East, upstream in East Africa and mining in South America. Mining in particular is emerging from an extended period of underinvestment, and significant projects are being funded in areas where Fluor is already well established. We have secured significant mining FEED awards for 2018, and we are well positioned to convert these to full multi-year EPC engagements.
Our outlook is optimistic. As clients faced tougher choices during the down-cycle, we listened to their challenges and rose to address them by developing innovative approaches to formulate and execute their projects to make
them viable. As FIDs are beginning to rise, Fluor is in full pursuit, targeting advantaged projects where we can provide clients with a solution set to succeed. We are showing clients ways to unleash capital in an economically challenging environment and still expect profitability throughout the project’s lifecycle.
During the downturn, clients showed great discipline in reducing internal costs and resetting their businesses. As commodities recover they are primed for improving returns, which in turn will enable more projects. Fluor, too, was hard at work during the downturn, and we have put our company in an advantaged position to win this work.
I N N O V A T I N G S O L U T I O N S T O U N L O C K P R O J E C T S
A w a r d s
B a c k l o g
2 0 1 72 0162 015
N E W A W A R D S & B A C K L O G
( D o l l a r s i n B i l l i o n s )
29.4
21.8
17.0
5.4
12.0
8.4
2 015 2 016 2 0 1 7
455
40
1
86
7
S E G M E N T P R O F I T
( D o l l a r s i n M i l l i o n s )
J I M B R I T T A I N
G R O U P P R E S I D E N T, E N E R G Y & C H E M I C A L S
Fluor’s integrated solutions are boosting client confidence, and we are seeing more project opportunities globally.
819586.indd 15 2/28/18 1:58 PM

I N D U S T R I A L , I N F R A S T R U C T U R E & P O W E R
WE EXPECT TO CAPTURE A LARGE SHARE OF OPPORTUNITIES
N O V O N O R D I S K D A P I U S P R O J E C T
C L AY T O N , N O R T H C A R O L I N A , U S A
819586.indd 16 2/28/18 1:58 PM

A N N U A L R E P O R T 2017
15
New capital projects in Industrial, Infrastructure and Power are facing two unbending requirements: Large investments
must first assure certainty of outcome and capital efficiency of the finished project, regardless of market conditions. Only the most capable and innovative EPC companies can deliver on both imperatives.
Fluor, plying the power of integrated solutions, stands at the forefront. North America is emerging from an extended period of underinvestment, and we are beginning to see significant new activity and awards to replace long-neglected infrastructure.
In 2017, we created a new regional platform in Texas to leverage our self-perform construction capabilities in the bid-build market. We also started on the Purple Line Light Rail Project in Maryland and the Green Line Rail Extension in Boston.
Internationally, we are focusing on areas of high activity where Fluor is well established, namely Europe and the United Kingdom. In markets where projects are enabled by public-private partnership financing structures, Fluor continues to leverage its financial strength, P3 experience and executional capabilities to seize the advantage in winning the work.
We continue to see a number of opportunities in our Life Sciences and Advanced
Manufacturing market. For example, in 2015 the U.S. Food and Drug Administration finalized a record number of drug approvals, which is driving new facility investments now.
We continue to progress well on our portfolio of projects, including our Novo Nordisk project, which will be the largest biotech facility ever built. We also see much opportunity on the horizon. In 2017, about 40 new drugs were approved, setting the stage for new multi-year capital spend. Given our experience, reputation and vast resources, we expect to capture a large share of these opportunities.
In Power, demand has flattened in North America and Europe, yet there are still ample
opportunities as the trend continues away from coal and toward gas and renewables. Fluor has experience across the full energy mix, which we will use to pursue the best opportunities in regions where we have a strong presence. Our pursuits in Power will be highly disciplined, targeting projects, clients and regions where we can leverage our complete integrated solutions offering.
In 2017, our NuScale business continued to blaze the trail toward the future of nuclear power. The Nuclear Regulatory Commission accepted for review our design certification application, a major milestone in our quest to lead the way in bringing small modular reactor (SMR) technology to power markets.
A C H I E V I N G G R O W T H T H R O U G H D I S C I P L I N E
R I C K K O U M O U R I S
G R O U P P R E S I D E N T, M I N I N G & M E TA L S , I N F R A S T R U C T U R E ,
P O W E R , L I F E S C I E N C E S & A D V A N C E D M A N U F A C T U R I N G
A w a r d s
B a c k l o g
2 0 1 72 0162 015
N E W A W A R D S & B A C K L O G
( D o l l a r s i n B i l l i o n s )
9.7
15.1
7.7
2.6
7.1
6.2
2 015 2 016 2 0 1 7
(171
)
136
(45)
S E G M E N T P R O F I T
( D o l l a r s i n M i l l i o n s )
I I P | Y E A R I N R E V I E W
North America is emerging from an extended period of underinvestment, and we are beginning to see significant new activity and awards to replace long-neglected infrastructure.
819586.indd 17 2/28/18 1:58 PM

G O V E R N M E N T
THIS SHIFTING LANDSCAPE PRESENTS ADVANTAGES FOR FLUOR
U . S . A R M Y C O R P S O F E N G I N E E R SP U E R T O R I C O P O W E R R E S T O R A T I O N P R O J E C T
P U E R T O R I C O
819586.indd 18 2/28/18 1:58 PM

A N N U A L R E P O R T 2017
1 7
F or the Government group, 2017 was a year of action and opportunity. As the incoming administration established its priorities and
budgets, we saw increased emphasis on national security and public infrastructure, and a less restrictive regulatory and contracting environment. While our group’s skill sets have been honed for years to fit the needs of government clients in any political environment, this shifting landscape presents advantages for Fluor.
Business was strong in 2017 across our segments. In contingency operations, Fluor secured nine new contracts and expanded existing contracts in Africa, Europe and the Middle East. Based on our unmatched ability to provide rapid, scalable resources for disaster relief, Fluor also was called on to provide immediate services in the aftermath of hurricanes in Texas, Florida and Puerto Rico, and the wildfires in California.
Power restoration in Puerto Rico is a particularly cogent example of the unique value Fluor can bring. After Hurricane Maria, Fluor mobilized to help the U.S. Army Corps of Engineers begin the difficult process of restoring power. Our solution integrates Fluor personnel and equipment with local contractors and materials, and we have helped restore power to nearly a quarter of a million customers.
In our services segment, we won a major multi-year base operations support contract in Guam, and we added a number of classified customers who are increasingly seeing Fluor as the contractor of choice for this sensitive work. In environmental and nuclear remediation, we won a 10-year contract for the deactivation and remediation of a gaseous diffusion plant in Kentucky.
We see stability ahead in the government agencies we support, and in special cases like disaster relief, we remain ready to respond.
We also have made strategic hires to bolster our position in the high-level liquid waste and laboratory management markets.
Wielding the strength of One Fluor, we are one of the only companies in our space with the financial foundation and massive scalable capabilities that government agencies absolutely rely on to accomplish their missions. Mounting global challenges will continue to demand integrated solutions, giving us reason to expect strong growth ahead.
B E I N G I N D I S P E N S A B L E T O O U R C L I E N T S ’ M I S S I O N S
T O M D ’ A G O S T I N O
G R O U P P R E S I D E N T, G O V E R N M E N T
A w a r d s
B a c k l o g
2 0 1 72 0162 015
N E W A W A R D S & B A C K L O G
( D o l l a r s i n B i l l i o n s )
3.6
5.2
3.8
2.6
1.4
4.6
2 015 2 016 2 0 1 7
128
85
83
S E G M E N T P R O F I T
( D o l l a r s i n M i l l i o n s )
G O V | Y E A R I N R E V I E W
We see stability ahead in the government agencies we support, and in special cases like disaster relief, we remain ready to respond.
819586.indd 19 2/28/18 1:58 PM

D I V E R S I F I E D S E R V I C E S
NO OTHER COMPANY CAN OFFER THIS FULL SOLUTION LIKE FLUOR
S T O R K F A B R I C A T I O N & W E L D I N G W O R K S H O P A C T I V I T I E S
T R I N I D A D & T O B A G O
819586.indd 20 2/28/18 1:58 PM

A N N U A L R E P O R T 2017
19
I n 2017, Diversified Services continued to be a key strategic component in Fluor’s integrated solutions offering and a powerful differentiator for
the company. Operators increasingly are seeking the advantages that can be realized by partnering with a company that has the capability to provide O&M solutions once the asset comes online. No other company can offer this full engineering, procurement, fabrication, construction and maintenance (EPFCM) solution like Fluor.
While operating budgets typically are more resilient than capital budgets during market downcycles, 2017 saw significant pressures on maintenance spend. Clients are delaying required maintenance, revisiting their processes and looking for better ways to operate their facilities. As One Fluor, we are applying our vast skilled workforce, technical expertise and advanced data solutions to help them achieve their goals.
During 2017 the integration of Stork into the Fluor organization was successfully completed. To optimize the business, the Stork management team composed and commenced an action plan based on four change steps that will define our future – Excellence, Lean, Growth and Innovation. Our first action was to streamline the business entities within the Stork offering and reduce costs to improve our competitive position.
Our ultimate goal is to evolve from selling hours to a model that sells solutions that draw from Fluor’s full resources, allowing us to align with our clients’ greatest needs and ambitions. To make this transition, we are investing in better tools and processes to elevate our performance in ways others can’t. Examples include the appointment of a data architect to drive better operational analytics for clients, investments in robotics and 3D printing, and naming a global director of operational excellence who will oversee performance of all major contracts around the world. This approach is already showing its first successes, with clients implementing best practices to improve maintenance efficiency and effectiveness. We also are providing O&M consultation at the FEED stage of Fluor
projects, helping clients build for operational efficiency throughout the facility’s lifecycle.
In 2017, our TRS Staffing Solutions business achieved growth by supporting clients around the world. We provided qualified workforce for Fluor’s Tengizchevroil (TCO) megaproject in Kazakhstan, and for projects in the Netherlands, Kuwait, Malaysia and Australia, and disaster relief in hurricane-ravaged areas.
AMECO achieved strong growth in 2017 as well, integrating with contracts across all Fluor business lines. AMECO significantly expanded its scaffolding business, renewed two long-term contracts in Jamaica, booked two new maintenance contracts with Stork, won a large mining project in Mexico, and supported recovery efforts in Puerto Rico with more than 200 equipment units.
T A K I N G I N T E G R A T E D S O L U T I O N S T O T H E N E X T L E V E L
T A C O D E H A A N
G R O U P P R E S I D E N T, D I V E R S I F I E D S E R V I C E S
A w a r d s
B a c k l o g
2 0 1 72 0 162 0 15
N E W A W A R D S & B A C K L O G
( D o l l a r s i n B i l l i o n s )
2.1
2.9
2.5
2.0
1.4
1.8
2 015 2 016 2 0 1 7
134
12212
7
S E G M E N T P R O F I T
( D o l l a r s i n M i l l i o n s )
D S | Y E A R I N R E V I E W
Operators increasingly are seeking the advantages that can be realized by partnering with a company that has the capability to provide O&M solutions once the asset comes online.
819586.indd 21 2/28/18 1:58 PM
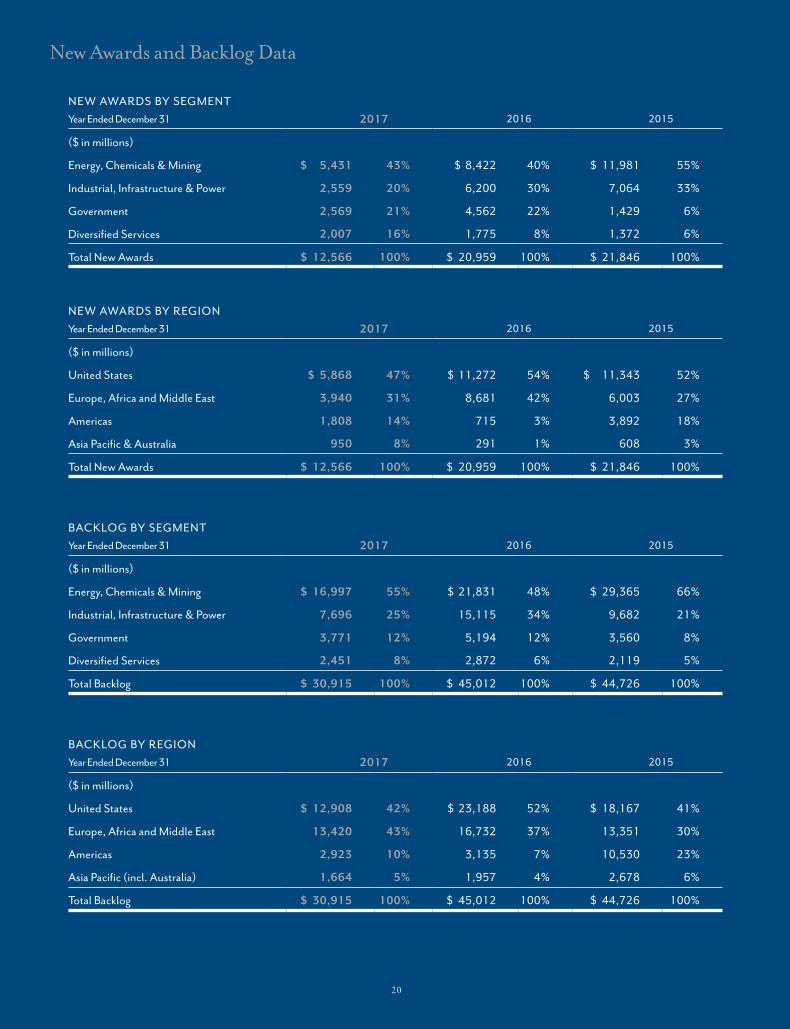
New Awards and Backlog Data
Year Ended December 31 2017 2016 2015
($ in millions)
United States $ 12,908 42% $ 23,188 52% $ 18,167 41%
Europe, Africa and Middle East 13,420 43% 16,732 37% 13,351 30%
Americas 2,923 10% 3,135 7% 10,530 23%
Asia Pacific (incl. Australia) 1,664 5% 1,957 4% 2,678 6%
Total Backlog $ 30,915 100% $ 45,012 100% $ 44,726 100%
BACKLOG BY REGION
Year Ended December 31 2017 2016 2015
($ in millions)
Energy, Chemicals & Mining $ 16,997 55% $ 21,831 48% $ 29,365 66%
Industrial, Infrastructure & Power 7,696 25% 15,115 34% 9,682 21%
Government 3,771 12% 5,194 12% 3,560 8%
Diversified Services 2,451 8% 2,872 6% 2,119 5%
Total Backlog $ 30,915 100% $ 45,012 100% $ 44,726 100%
BACKLOG BY SEGMENT
Year Ended December 31 2017 2016 2015
($ in millions)
United States $ 5,868 47% $ 11,272 54% $ 11,343 52%
Europe, Africa and Middle East 3,940 31% 8,681 42% 6,003 27%
Americas 1,808 14% 715 3% 3,892 18%
Asia Pacific & Australia 950 8% 291 1% 608 3%
Total New Awards $ 12,566 100% $ 20,959 100% $ 21,846 100%
NEW AWARDS BY REGION
Year Ended December 31 2017 2016 2015
($ in millions)
Energy, Chemicals & Mining $ 5,431 43% $ 8,422 40% $ 11,981 55%
Industrial, Infrastructure & Power 2,559 20% 6,200 30% 7,064 33%
Government 2,569 21% 4,562 22% 1,429 6%
Diversified Services 2,007 16% 1,775 8% 1,372 6%
Total New Awards $ 12,566 100% $ 20,959 100% $ 21,846 100%
NEW AWARDS BY SEGMENT
2 0
819586.indd 22 2/28/18 1:58 PM

Selected Financial Data
Net earnings attributable to Fluor Corporation in 2017 included pre-tax charges totaling $260 million (or $1.18 per diluted share) resulting from forecast revisions for estimated cost growth at three fixed-price, gas-fired power plant projects in the southeastern United States, pre-tax charges totaling $44 million (or $0.20 per diluted share) resulting from forecast revisions for estimated cost increases on a downstream project and the adverse impact of recently enacted U.S. tax reform of $37 million (or $0.27 per diluted share). Net earnings attributable to Fluor Corporation in 2016 included a pre-tax charge of $265 million (or $1.20 per diluted share) related to forecast revisions for estimated cost increases on a petrochemicals project in the United States. See page 33 of our Form 10-K for all explanatory footnotes relating to this selected financial data.
2 1
Year Ended December 31 2017 2016 2015 2014 2013
TOTAL REVENUE $ 19,521.0 $ 19,036.5 $ 18,114.0 $ 21,531.6 $ 27,351.6
Earnings from continuing operations before taxes 386.4 546.6 726.6 1,204.9 1,177.6
Amounts attributable to Fluor Corporation: Earnings from continuing operations $ 191.4 $ 281.4 $ 418.2 $ 715.5 $ 667.7
Loss from discontinued operations, net of taxes (5.7) (204.6)
NET EARNINGS $ 191.4 $ 281.4 $ 412.5 $ 510.9 $ 667.7
Basic earnings (loss) per share attributable to Fluor Corporation: Earnings from continuing operations $ 1.37 $ 2.02 $ 2.89 $ 4.54 $ 4.11
Loss from discontinued operations, net of taxes (0.04) (1.30)
NET EARNINGS $ 1.37 $ 2.02 $ 2.85 $ 3.24 $ 4.11
Diluted earnings (loss) per share attributable to Fluor Corporation: Earnings from continuing operations $ 1.36 $ 2.00 $ 2.85 $ 4.48 $ 4.06
Loss from discontinued operations, net of taxes (0.04) (1.28)
NET EARNINGS $ 1.36 $ 2.00 $ 2.81 $ 3.20 $ 4.06
Cash dividends per common share declared $ 0.84 $ 0.84 $ 0.84 $ 0.84 $ 0.64
Return on average shareholders’ equity 5.9% 9.1% 13.6% 20.1% 18.6%
Current Assets $ 5,601.3 $ 5,610.3 $ 5,105.4 $ 5,417.8 $ 5,757.9
Current Liabilities 3,574.2 3,816.0 2,935.4 3,330.9 3,407.2
Working capital 2,027.1 1,794.3 2,170.0 2,086.9 2,350.7Property, plant and equipment, net 1,093.7 1,017.2 892.3 980.3 967.0Total assets 9,327.7 9,216.4 7,625.4 8,187.5 8,320.7Capitalization 1.750% Senior Notes 597.7 523.6
3.375% Senior Notes 496.9 496.0 495.2 494.3 493.5 3.5% Senior Notes 493.3 492.4 491.4 490.4
1.5% Convertible Senior Notes 18.3 18.4
Revolving Credit Facility 52.7
Other debt obligations 31.1 35.5 10.4 11.4
Shareholders’ equity 3,342.3 3,125.2 2,997.3 3,110.9 3,757.0
Total capitalization 4,961.3 4,725.4 3,983.9 4,124.3 4,280.3
Common shares outstanding at year end 139.9 139.3 139.0 148.6 161.3
New awards $ 12,565.6 $ 20,959.2 $ 21,846.2 $ 28,831.1 $ 25,085.6
Backlog at year end 30,915.4 45,011.9 44,726.1 42,481.5 34,907.1Capital expenditures 283.1 235.9 240.2 324.7 288.5Cash provided by operating activities 602.0 705.9 849.1 642.6 788.9Cash utilized by investing activities (484.3) (741.4) (66.5) (199.1) (234.6)Cash utilized by financing activities (215.5) (10.4) (728.2) (666.4) (369.6)Employees at year end Salaried employees 31,951 28,681 27,195 27,643 29,425
Craft/hourly employees 24,755 32,870 11,563 9,865 8,704
Total employees 56,706 61,551 38,758 37,508 38,129
CONSOLIDATED OPER ATING RESULTS
CONSOLIDATED FINANCIAL POSITION
OTHER DATA
819586.indd 23 2/28/18 1:58 PM

C O R P O R A T E M A N A G E M E N T T E A M
Ray F. BarnardExecutive Vice President, Systems and Supply Chain (2002)
Jim BrittainGroup President, Energy & Chemicals (1987)
Jose-Luis Bustamante Executive Vice President, Business Development and Strategy (1990)
Tom D’ Agostino Group President, Government (2013)
Taco De HaanGroup President, Diversified Services (1995)
Garry W. FlowersExecutive Vice President (1978)
Carlos M. HernandezExecutive Vice President, Chief Legal Officer and Secretary (2007) Rick KoumourisGroup President, Mining & Metals, Infrastructure, Power, Life Sciences & Advanced Manufacturing (1987)
Mark A. LandrySenior Vice President, Chief Human Resources Officer (1989)
Matthew McSorleyExecutive Vice President, Project Support Services (1991)
Jack PenleySenior Vice President, Construction & Fabrication (1984)
David T. SeatonChairman and Chief Executive Officer (1985)
Bruce A. StanskiExecutive Vice President, Chief Financial Officer (2009)
Years in parentheses indicate the year each officer joined Fluor.
2 2
819586.indd 24 3/1/18 10:02 AM

2 3
B O A R D O F D I R E C T O R S
(See reverse side for listings)
819586.indd 25 3/1/18 10:02 AM

2 4
Years in parentheses indicate the year each director was elected to the Board. (1) Executive Committee – David T. Seaton, Chairman;
(2) Audit Committee – Peter K. Barker, Chairman; (3) Governance Committee – Alan M. Bennett, Chairman;
(4) Organization and Compensation Committee – Peter J. Fluor, Chairman
B O A R D O F D I R E C T O R S
Lynn C. SwannAthletic Director, The University of Southern California (2013) (2) (3)
Deborah D. McWhinneyFormer Chief Executive Officer and Chief Operating Officer of Global Enterprise Payments at Citigroup Inc.; Director of Fresenius Medical Care AG & Co., IHS Markit Ltd. and Lloyd’s Banking Group (2014) (3) (4)
Admiral Samuel J. Locklear President, SJL Global Insights LLC; U.S. Navy (retired) (2017) (2) (3)
James T. HackettExecutive Chairman and Chief Operating Officer – Midstream, Alta Mesa Resources, Inc.; Director of Alta Mesa Resources, Inc., Enterprise Products Holdings, LLC and National Oilwell Varco (2016) (3) (4)
Admiral Joseph W. PrueherU.S. Navy (retired); former United States Ambassador to the People’s Republic of China (2003) (1) (3) (4)
Rosemary T. Berkery Vice Chair, UBS Wealth Management Americas;Chair, UBS Bank USA (2010)
Alan M. BennettFormer President and Chief Executive Officer of H & RBlock, Inc.; Director of Halliburton Company and The TJX Companies, Inc. (2011) (1) (2) (3)
Nader H. SultanSenior Partner, F & N Consulting Company; former Chief Executive Officer and Deputy Chairman of Kuwait Petroleum Corporation; Non-Executive Chairman of Ikarus Petroleum Industries Company (2009) (2) (3)
Matthew K. RoseExecutive Chairman, Burlington Northern Santa Fe, LLC; Director of AT&T, Inc.(2014) (2) (4)
Peter J. FluorFluor’s Lead Independent Director; Chairman and Chief Executive Officer of Texas Crude Energy, LLC; Director of Anadarko Petroleum Corporation (1984) (1) (3) (4)
David T. SeatonChairman and Chief Executive Officer of the Company; Director of The Mosaic Company (2011) (1)
Armando J. OliveraFormer President and Chief Executive Officer of Florida Power & Light Company; Director of Consolidated Edison, Inc. and Lennar Corporation (2012) (3) (4)
Peter K. Barker Former California Chairman, JP Morgan Chase & Co.; Director of Avery Dennison Corporation & Franklin Resources, Inc. (2007) (1) (2) (4)
819586.indd 26 2/28/18 1:58 PM

UNITED STATESSECURITIES AND EXCHANGE COMMISSION
Washington, D.C. 20549
Form 10-K� ANNUAL REPORT PURSUANT TO SECTION 13 OR 15(d) OF THE SECURITIES EXCHANGE ACT OF 1934
For the fiscal year ended December 31, 2017
or
� TRANSITION REPORT PURSUANT TO SECTION 13 OR 15(d) OF THE SECURITIES EXCHANGE ACT OF 1934
For the transition period from to
Commission file number: 1-16129
FLUOR CORPORATION(Exact name of registrant as specified in its charter)
Delaware 33-0927079(State or other jurisdiction of (I.R.S. Employerincorporation or organization) Identification No.)
6700 Las Colinas BoulevardIrving, Texas 75039
(Address of principal executive offices) (Zip Code)
469-398-7000(Registrant’s telephone number, including area code)
Securities registered pursuant to Section 12(b) of the Act:Title of Each Class Name of Each Exchange on Which Registered
Common Stock, $.01 par value per share New York Stock Exchange
Securities registered pursuant to Section 12(g) of the Act:None
Indicate by check mark if the registrant is a well-known seasoned issuer, as defined in Rule 405 of the SecuritiesAct. Yes � No �
Indicate by check mark if the registrant is not required to file reports pursuant to Section 13 or Section 15(d) of the ExchangeAct. Yes � No �
Indicate by check mark whether the registrant (1) has filed all reports required to be filed by Section 13 or 15(d) of theExchange Act during the preceding 12 months (or for such shorter period that the registrant was required to file such reports), and(2) has been subject to such filing requirements for the past 90 days. Yes � No �
Indicate by check mark whether the registrant has submitted electronically and posted on its corporate Web site, if any, everyInteractive Data File required to be submitted and posted pursuant to Rule 405 of Regulation S-T during the preceding 12 months(or for such shorter period that the registrant was required to submit and post such files). Yes � No �
Indicate by check mark if disclosure of delinquent filers pursuant to Item 405 of Regulation S-K is not contained herein, andwill not be contained, to the best of registrant’s knowledge, in definitive proxy or information statements incorporated by referencein Part III of this Form 10-K or any amendment to this Form 10-K. �
Indicate by check mark whether the registrant is a large accelerated filer, an accelerated filer, a non-accelerated filer, a smallerreporting company or an emerging growth company. See the definitions of ‘‘large accelerated filer,’’ ‘‘accelerated filer,’’ ‘‘smallerreporting company’’ and ‘‘emerging growth company’’ in Rule 12b-2 of the Exchange Act.
Large accelerated filer � Accelerated filer � Non-accelerated filer � Smaller reporting company �Emerging growth company �
If an emerging growth company, indicate by check mark if the registrant has elected not to use the extended transition periodfor complying with any new or revised financial accounting standards provided pursuant to Section 13(a) of the Exchange Act. �
Indicate by check mark whether the registrant is a shell company (as defined in Rule 12b-2 of the ExchangeAct). Yes � No �
As of June 30, 2017, the aggregate market value of the registrant’s common stock held by non-affiliates of the registrant wasapproximately $6.4 billion based on the closing sale price as reported on the New York Stock Exchange.
Indicate the number of shares outstanding of each of the registrant’s classes of common stock, as of the latest practicable date.Class Outstanding at February 16, 2018
Common Stock, $.01 par value per share 139,907,306 shares
DOCUMENTS INCORPORATED BY REFERENCEDocument Parts Into Which Incorporated
Portions of the Proxy Statement for the Annual Meeting Part IIIof Stockholders to be held on May 3, 2018 (ProxyStatement)
FLUOR CORPORATION
INDEX TO ANNUAL REPORT ON FORM 10-K
For the Fiscal Year Ended December 31, 2017
Page
PART I
Item 1. Business . . . . . . . . . . . . . . . . . . . . . . . . . . . . . . . . . . . . . . . . . . . . . . . . . . . . . . . . 1Item 1A. Risk Factors . . . . . . . . . . . . . . . . . . . . . . . . . . . . . . . . . . . . . . . . . . . . . . . . . . . . . 14Item 1B. Unresolved Staff Comments . . . . . . . . . . . . . . . . . . . . . . . . . . . . . . . . . . . . . . . . . . 30Item 2. Properties . . . . . . . . . . . . . . . . . . . . . . . . . . . . . . . . . . . . . . . . . . . . . . . . . . . . . . . 30Item 3. Legal Proceedings . . . . . . . . . . . . . . . . . . . . . . . . . . . . . . . . . . . . . . . . . . . . . . . . . 31Item 4. Mine Safety Disclosures . . . . . . . . . . . . . . . . . . . . . . . . . . . . . . . . . . . . . . . . . . . . . 31
PART II
Item 5. Market for Registrant’s Common Equity, Related Stockholder Matters and IssuerPurchases of Equity Securities . . . . . . . . . . . . . . . . . . . . . . . . . . . . . . . . . . . . . . . 32
Item 6. Selected Financial Data . . . . . . . . . . . . . . . . . . . . . . . . . . . . . . . . . . . . . . . . . . . . . 33Item 7. Management’s Discussion and Analysis of Financial Condition and Results of
Operations . . . . . . . . . . . . . . . . . . . . . . . . . . . . . . . . . . . . . . . . . . . . . . . . . . . . . 34Item 7A. Quantitative and Qualitative Disclosures About Market Risk . . . . . . . . . . . . . . . . . . 51Item 8. Financial Statements and Supplementary Data . . . . . . . . . . . . . . . . . . . . . . . . . . . . 52Item 9. Changes in and Disagreements with Accountants on Accounting and Financial
Disclosure . . . . . . . . . . . . . . . . . . . . . . . . . . . . . . . . . . . . . . . . . . . . . . . . . . . . . 52Item 9A. Controls and Procedures . . . . . . . . . . . . . . . . . . . . . . . . . . . . . . . . . . . . . . . . . . . . 52Item 9B. Other Information . . . . . . . . . . . . . . . . . . . . . . . . . . . . . . . . . . . . . . . . . . . . . . . . . 55
PART III
Item 10. Directors, Executive Officers and Corporate Governance . . . . . . . . . . . . . . . . . . . . . 55Item 11. Executive Compensation . . . . . . . . . . . . . . . . . . . . . . . . . . . . . . . . . . . . . . . . . . . . 55Item 12. Security Ownership of Certain Beneficial Owners and Management and Related
Stockholder Matters . . . . . . . . . . . . . . . . . . . . . . . . . . . . . . . . . . . . . . . . . . . . . . 56Item 13. Certain Relationships and Related Transactions, and Director Independence . . . . . . . 56Item 14. Principal Accountant Fees and Services . . . . . . . . . . . . . . . . . . . . . . . . . . . . . . . . . . 56
PART IV
Item 15. Exhibits and Financial Statement Schedules . . . . . . . . . . . . . . . . . . . . . . . . . . . . . . 57Item 16. Form 10-K Summary . . . . . . . . . . . . . . . . . . . . . . . . . . . . . . . . . . . . . . . . . . . . . . . 60Signatures . . . . . . . . . . . . . . . . . . . . . . . . . . . . . . . . . . . . . . . . . . . . . . . . . . . . . . . . . . . . . . . . 61
i
Forward-Looking Information
From time to time, Fluor� Corporation makes certain comments and disclosures in reports andstatements, including this annual report on Form 10-K, or statements are made by its officers or directors,that, while based on reasonable assumptions, may be forward-looking in nature. Under the PrivateSecurities Litigation Reform Act of 1995, a ‘‘safe harbor’’ may be provided to us for certain of theseforward-looking statements. We wish to caution readers that forward-looking statements, includingdisclosures which use words such as the company ‘‘believes,’’ ‘‘anticipates,’’ ‘‘expects,’’ ‘‘estimates’’ andsimilar statements are subject to various risks and uncertainties which could cause actual results ofoperations to differ materially from expectations.
Any forward-looking statements that we may make are based on our current expectations and beliefsconcerning future developments and their potential effects on us. There can be no assurance that futuredevelopments affecting us will be those anticipated by us. Any forward-looking statements are subject tothe risks, uncertainties and other factors that could cause actual results of operations, financial condition,cost reductions, acquisitions, dispositions, financing transactions, operations, expansion, consolidation andother events to differ materially from those expressed or implied in such forward-looking statements.
Due to known and unknown risks, our actual results may differ materially from our expectations orprojections. While most risks affect only future cost or revenue anticipated by us, some risks may relate toaccruals that have already been reflected in earnings. Our failure to receive payments of accrued revenueor to incur liabilities in excess of amounts previously recognized could result in a charge against futureearnings. As a result, the reader is cautioned to recognize and consider the inherently uncertain nature offorward-looking statements and not to place undue reliance on them.
These factors include those referenced or described in this Annual Report on Form 10-K (including in‘‘Item 1A. — Risk Factors’’). We cannot control such risk factors and other uncertainties, and in manycases, we cannot predict the risks and uncertainties that could cause our actual results to differ materiallyfrom those indicated by the forward-looking statements. You should consider these risks and uncertaintieswhen you are evaluating us and deciding whether to invest in our securities. Except as otherwise requiredby law, we undertake no obligation to publicly update or revise our forward-looking statements, whether asa result of new information, future events or otherwise.
Defined Terms
Except as the context otherwise requires, the terms ‘‘Fluor’’ or the ‘‘Registrant’’ as used herein arereferences to Fluor Corporation and its predecessors and references to the ‘‘company,’’ ‘‘we,’’ ‘‘us,’’ or‘‘our’’ as used herein shall include Fluor Corporation, its consolidated subsidiaries and joint ventures.
PART I
Item 1. Business
Fluor Corporation was incorporated in Delaware on September 11, 2000 prior to a reverse spin-offtransaction. However, through our predecessors, we have been in business for over a century. Ourprincipal executive offices are located at 6700 Las Colinas Boulevard, Irving, Texas 75039, and ourtelephone number is (469) 398-7000.
Our common stock currently trades on the New York Stock Exchange under the ticker symbol ‘‘FLR’’.
Fluor Corporation is a holding company that owns the stock of a number of subsidiaries, as well asinterests in joint ventures. Acting through these entities, we are one of the largest professional servicesfirms providing engineering, procurement, construction, fabrication and modularization, commissioningand maintenance, as well as project management services, on a global basis. We are an integrated solutionsprovider for our clients in a diverse set of industries worldwide including oil and gas, chemicals andpetrochemicals, mining and metals, transportation, power, life sciences and advanced manufacturing. Weare also a service provider to the U.S. federal government and governments abroad; and, we perform
1

operations, maintenance and asset integrity activities globally for major industrial clients. We have beennamed to Fortune Magazine’s ‘‘World’s Most Admired Companies�’’ for the 18th consecutive year, and weare ranked by Engineering News Record as number two in its 2017 list of Top 400 Contractors. We werealso named to Forbes’ JUST100� list of America’s best corporate citizens, where top companies are rankedby how they perform on issues that most concern Americans, for the second year in a row. Additionally,Fluor has been recognized by Ethisphere magazine as a World’s Most Ethical Company� for the past11 years.
Our business is divided into four principal segments. The four segments are: Energy, Chemicals &Mining; Industrial, Infrastructure & Power; Diversified Services; and Government. Fluor ConstructorsInternational, Inc., which is organized and operates separately from the rest of our business, providesunionized management and construction services in the United States and Canada, both independentlyand as a subcontractor on projects in each of our segments. Financial information on our segments, asdefined under accounting principles generally accepted in the United States, is set forth on page F-47 ofthis annual report on Form 10-K under the caption ‘‘Operating Information by Segment,’’ which isincorporated herein by reference.
Competitive Strengths
As an integrated world class solutions provider of engineering, procurement, construction, fabrication,maintenance and project management services, we believe that our business model allows us theopportunity to bring to our clients on a global basis capital efficient business offerings that combineexcellence in execution, safety, cost containment and experience. In that regard, we believe that ourbusiness strategies, which are based on certain of our core competencies, provide us with some significantcompetitive advantages:
Excellence in Execution Given our proven track record of project completion and client satisfaction,we believe that our ability to design, engineer, procure, fabricate, construct, commission, operate, maintainand manage complex projects often in geographically challenging locations gives us a distinct competitiveadvantage. We strive to complete our projects meeting or exceeding all client specifications. In anincreasingly competitive environment, we are also continually emphasizing cost and schedule controls sothat we meet our clients’ performance requirements as well as their schedule and budgetary needs.
Financial Strength We believe that we are among the most financially sound companies in ourindustry. We strive to maintain a solid financial condition, placing an emphasis on having a strong balancesheet and an investment grade credit rating. Our financial strength provides us a valuable competitiveadvantage in terms of access to surety bonding capacity and letters of credit which are critical to ourbusiness. Our strong balance sheet also allows us to fund our strategic initiatives, pay dividends, repurchasestock, pursue opportunities for growth and better manage unanticipated cash flow variations.
Safety One of our core values and a fundamental business strategy is our constant pursuit of safety.The maintenance of a safe and secure workplace is a key business driver for us and our clients. In the areasin which we provide our services, we strive to deliver excellent safety performance. In our experience,whether in an office or at a job-site, a safe environment decreases risks, assures a proper environment forall workers, enhances their morale and improves their productivity, reduces project cost and generallyimproves client relations. We believe that our commitment to safety is one of our most distinguishingfeatures.
Global Execution Platform As one of the largest U.S.-based, publicly-traded engineering,procurement, construction, fabrication and maintenance companies, we have a global footprint withemployees situated throughout the world. Our global presence allows us to build local relationships thatpermit us to capitalize on opportunities near these locations. It also allows us to mobilize quickly to projectsites around the world and to draw on our local knowledge and talent pools. In many of the countrieswhere we work, clients are requiring more local content in their projects by mandating use of in-countrytalent and procurement of in-country goods and services. To meet these challenges, we continue to expand
2

our footprint in growth regions by establishing local offices, forming strategic alliances with local partners,leveraging our supply chain expertise and emphasizing local training programs. We also continue to expandthe scope of services in our distributed execution centers where we can continue to provide superiorservices on a cost-efficient basis.
Market Diversity The company serves multiple markets across a broad spectrum of industries aroundthe globe and offers a wide variety of engineering, procurement, construction, fabrication andmodularization, commissioning and maintenance services. We feel that our market diversity is a keystrength of our company that helps to mitigate the impact of the cyclicality in the markets we serve. Just asimportant, our concentrated attention on market diversification allows us to achieve more consistentgrowth and deliver solid returns. We believe that our continued strategy of maintaining a good mixturewithin our entire business portfolio permits us to both focus on our more stable business markets and tocapitalize on developing our cyclical markets when the timing is appropriate. This strategy also allows us tobetter weather any downturns in a specific market by emphasizing markets that are strong.
Client Relationships Our culture is based on putting the customer at the center of everything we do.We actively pursue relationships with new clients while at the same time building on our long-termrelationships with existing clients. We continue to believe that long-term relationships with existing,sometimes decades-old, clients serves us well by allowing us to better understand and be more responsiveto their requirements. Regardless of whether our clients are new or have been with us for many years, ourability to successfully foster relationships is a key driver to the success of our business.
Risk Management We believe that our ability to assess, understand, gauge, mitigate and manageproject risk, especially in difficult locations or circumstances or in a complicated contracting environment,provides us with a proven ability to deliver the project certainty our clients demand. We have anexperienced management team, and utilize a systematic and disciplined approach towards managing risks.We believe that our comprehensive risk management approach allows us to better control costs andschedule, which in turn leads to clients who are satisfied with the delivered product.
Integrated Solutions Through our integrated solutions offering, we can deliver to clients our broadrange of engineering, procurement, construction, fabrication, equipment services, maintenance andmanagement services and offerings in an integrated package. This approach spans the entire lifecycle of aproject — from initial scoping and front end engineering to construction, fabrication, equipment andsupply chain to post-completion operations and maintenance — thereby allowing us to bring our fullbreadth of resources to better solve client challenges and create opportunities. Our integrated solutionsapproach allows us to exercise better overall control of a project, in collaboration with our clients, which inturn results in more predictable and profitable results while enhancing the value, safety and efficiencies wecan bring to a project. We believe we are one of the few industry players who have the capability to deliverintegrated solutions to our clients, which we believe is a clear differentiator for us.
General Operations
Our services fall into six broad categories: engineering and design; procurement; construction;fabrication and modularization; maintenance, modification and asset integrity services; and projectmanagement. We offer these services both independently as well as through our integrated solutionsofferings. Our services can range from basic consulting activities, often at the early stages of a project, tocomplete design-build and maintenance contracts.
• In engineering and design, we develop solutions to address our clients’ most complex problems on acost-effective basis. Our engineering services range from traditional engineering disciplines such aspiping, mechanical, electrical, control systems, civil, structural and architectural to advancedengineering specialties including process engineering, chemical engineering, simulation, enterpriseintegration, integrated automation processes and interactive 3-D modeling. Through our designsolutions, we provide clients with a varied group of service offerings which can include front-endengineering, conceptual design, estimating, feasibility studies, permitting, process simulation,
3

technology and licensing evaluation, scope definition and siting. Our engineering and designsolutions are intended to align each project’s function, scope, cost and schedule in concert withclient objectives in order to best optimize project success.
• Our procurement organization offers traditional procurement services as well as supply chainsolutions aimed at improving product quality and performance while also reducing project cost andschedule. Our clients benefit from our global sourcing and supply expertise, global purchasingpower, technical knowledge, processes, systems and experienced global resources. Our procurementactivities include strategic sourcing, material management, contracts management, buying,expediting, supplier quality inspection and logistics.
• In construction, we mobilize, execute, commission and demobilize projects on a self-perform orsubcontracted basis. Generally, we are responsible for the completion of a project, often in difficultlocations and under challenging circumstances. We are frequently designated as a programmanager, where a client has facilities in multiple locations, complex phases in a single projectlocation, or a large-scale investment in a facility. Depending upon the project, we often serve as theprimary contractor or we may act as a subcontractor to another party.
• We also provide a variety of fabrication and modularization services, including integratedengineering and modular fabrication and assembly, modular construction and asset support servicesto customers around the globe from our joint venture yards in China, Mexico, Canada and Russia.By operating self-perform fabrication yards in key regions of the world, our off-site fabricationsolutions help our clients achieve cost and schedule savings by reducing on-site craft needs andshifting work to inherently safer and more controlled work environments.
• We offer maintenance, modification and asset integrity services in order to improve theperformance and extend the life of our clients’ complex facilities. Our acquisition of StorkHolding B.V. helped us significantly increase our diversified services offerings and enhance ourintegrated solutions capabilities. Diversified services include the delivery of total maintenanceservices, facility management, plant readiness, commissioning, start-up and maintenancetechnology, small capital projects, turnaround and outage services, all on a global basis. Amongother things, we can provide key management, staffing and management skills as well as equipment,tools and fleet services to clients on-site at their facilities. Our diversified services activities alsoinclude routine and outage/turnaround maintenance services, general maintenance and assetmanagement, emissions reduction technologies and services, and restorative, repair, predictive andprevention services.
• Project management, the primary responsibility of managing all aspects of the effort to deliverprojects on schedule and within budget, is required on every project. We are often hired as theoverall program manager on large complex projects where various contractors and subcontractorsare involved and multiple activities need to be integrated to ensure the success of the overallproject. Project management services include logistics, development of project execution plans,detailed schedules, cost forecasts, progress tracking and reporting, and the integration of theengineering, procurement and construction efforts. Project management is accountable to the clientto deliver the safety, functionality and financial performance requirements of the project.
We operate in four principal business segments, as described below.
Energy, Chemicals & Mining
Energy, Chemicals & Mining is where we focus on opportunities in the upstream, midstream,downstream, chemical, petrochemical, offshore and onshore oil and gas production, liquefied natural gas,pipeline, metals and mining markets. We have long served a broad spectrum of commodity-basedindustries as an integrated solutions provider offering a full range of design, engineering, procurement,construction, fabrication and project management services. While we perform projects that range greatly insize and scope, we believe that one of our distinguishing features is that we are one of the few companies
4

that have the global strength and experience to perform extremely large projects in difficult locations. Asthe locations of large scale energy, chemicals and mining projects have become more challenginggeographically, geopolitically or otherwise, we believe that clients will continue to look to us based uponour size, strength, global reach, experience and track-record to manage their complex projects.
With each specific project, our role can vary. We may be involved in providing front-end engineering,program management and final design services, construction management services, self-performconstruction, or oversight of other contractors, and we may also assume responsibility for the procurementof materials, equipment and subcontractors. We have the capacity to design, fabricate and construct newfacilities, upgrade, modernize and expand existing facilities, and rebuild facilities following fires andexplosions. We also provide consulting services ranging from feasibility studies to process assessment toproject finance structuring and studies.
In the upstream sector, our clients need to develop additional and new sources of supply. Our typicalprojects in the upstream sector revolve around the production, processing and transporting of oil and gasresources, including the development of infrastructure associated with major new fields and pipelines, aswell as LNG projects. We are also involved in offshore production facilities and in conventional andunconventional gas projects in various geographic locations.
In the downstream sector, we continue to pursue significant global opportunities relating to refinedproducts. Our clients are modernizing and modifying existing refineries to increase capacity and satisfyenvironmental requirements. We continue to play a strong role in each of these markets. We also remainfocused on markets, such as clean fuels, where an increasing number of countries are implementingstronger environmental standards.
We have been very active for several years in the chemicals and petrochemicals market, with majorprojects involving the expansion of ethylene based derivatives. The most active markets have been in theUnited States, Middle East and Asia, where there is significant demand for chemical products.
In mining and metals, we provide a full range of services to the bauxite, copper, gold, iron ore,diamond, nickel, alumina, aluminum, phosphates and other commodity-based industries. These servicesinclude feasibility studies through detailed engineering, design, procurement, construction, andcommissioning and start-up support. We see many of these opportunities being developed in extremealtitudes, topographies and climates, such as the Andes Mountains, Western Australia and Africa. We areone of the few companies with the size and experience to execute large scale mining and metals projects inthese difficult locations. In the first quarter of 2018, mining and metals will be moved from the Energy &Chemicals business segment to the Industrial, Infrastructure & Power business segment to align with howthese business segments will be managed.
Industrial, Infrastructure & Power
The Industrial, Infrastructure & Power segment provides design, engineering, procurement,construction and project management services to the transportation, life sciences, advancedmanufacturing, water and power sectors. These projects often require application of our clients’state-of-the-art processes and technical knowledge. We focus on providing our clients with capitalefficiencies through solutions that seek to reduce costs and compress delivery schedules. By doing so, weare able to complete our clients’ projects on a timely and more cost efficient basis.
In infrastructure, we are an industry leader in developing projects for both domestic and internationalgovernments, such as roads, highways, bridges and rail, with particular interest in large, complex projects.We provide a broad range of services including consulting, design, planning, financial structuring,engineering and construction. We also provide long-term operation and maintenance services for transitand highway projects. Our projects may involve the use of public/private partnerships, which allow us todevelop and finance deals in concert with public entities for projects such as toll roads and rail lines thatwould not have otherwise been undertaken, had only public funding been available. The need for new
5

infrastructure in emerging countries and the replacement and expansion of aging infrastructure indeveloped countries continues to drive project opportunities on a global basis.
For the advanced manufacturing market, we provide design, engineering, procurement, constructionand construction management services to a wide variety of industries on a global basis. We specialize indesigning fit-for-purpose projects which incorporate lean manufacturing concepts while also satisfyingclient sustainability goals. Our experience spans a wide variety of market segments ranging from traditionalmanufacturing to advanced technology projects.
In life sciences, we provide design, engineering, procurement, construction and constructionmanagement services to the pharmaceutical and biotechnology industries. We also specialize in providingvalidation and commissioning services where we not only bring new facilities into production, but we alsokeep existing facilities operating. The ability to complete projects on a large scale basis, especially in abusiness where time to market is critical, allows us to better serve our clients and is a key competitiveadvantage.
In the power market, we provide a full range of services to the gas fueled, environmental compliance,renewables, nuclear and solid fueled markets. Our offering includes engineering, procurement,construction, program management, start-up and commissioning and technical services. We provide theseservices to a broad array of utilities, independent power producers, original equipment manufacturers andother third parties.
We continue to invest in NuScale Power, LLC (‘‘NuScale’’), a small modular nuclear reactor (‘‘SMR’’)technology company. NuScale is a leader in the development of light water, passively safe SMRs, which webelieve will provide us with significant future project opportunities. In December 2016, NuScale submittedits design certification application to the U.S. Nuclear Regulatory Commission, a major step towards theeventual construction of the first SMR nuclear power facility. We expect our application to be approved onor before January 2021.
Government
Our Government segment is a provider of engineering, construction, logistics, base and facilitiesoperations and maintenance, contingency response and environmental and nuclear services to the U.S.government and governments abroad. Because the U.S. and other governments are the largest purchasersof outsourced services in the world, government work represents an attractive opportunity for thecompany.
For the energy sector, we provide site management, environmental remediation, decommissioning,engineering and construction services and have been very successful in addressing the myriadenvironmental and regulatory challenges associated with legacy and operational nuclear sites. We are anindustry leader in nuclear remediation at governmental facilities. We also provide safe, dependable andvalue-added nuclear operation services for the United States Department of Energy (‘‘DOE’’) andinternational governments where we have brought our commercial operations and program managementexpertise to government clients to help stabilize substantial quantities of high-level, hazardous nuclearmaterials. We also manage the processing of low-level and high-level radioactive waste as well asdevelopment plans for on-site or off-site safe disposal of nuclear waste.
The Government segment also provides engineering and construction services, logistics andlife-support, as well as contingency operations support, to the defense sector. We support military logisticaland infrastructure needs around the world. Specifically, we provide life-support, engineering, procurement,construction and logistical augmentation services to the U.S. military and coalition forces in variousinternational locations, with a primary focus on the United States military-related activities in and aroundthe Middle East and more specifically in Afghanistan and Africa. Because of our strong network of globalresources, we believe we are well-situated to efficiently and effectively mobilize the resources necessary fordefense operations, even in the most remote and difficult locations to both traditional and U.S.government classified customers around the world.
6

In combination with our subsidiary, Fluor Federal Solutions, we are a leading provider of outsourcedservices to the U.S. government. We provide operations and maintenance services at military bases andeducation and training services to the Department of Labor, particularly through Job Corps programs. Inaddition, we provide construction services to new and existing facilities for the U.S. military, theintelligence community and in support of foreign military sales programs.
The company is also providing support to the Department of Homeland Security. We are particularlyinvolved in supporting the U.S. government’s rapid response capabilities to address security issues anddisaster relief, the latter primarily through our long-standing relationship with the Federal EmergencyManagement Agency and recently in support of the Army Corps of Engineers.
Diversified Services
The Diversified Services segment provides a wide array of maintenance, modification, asset integrity,equipment and staffing services to support projects across Fluor’s business lines and our clients all over theworld.
Through Stork, we provide facility start-up and management, plant and facility maintenance,operations support and asset management services to the oil and gas, chemicals, life sciences, mining andmetals, consumer products and manufacturing industries. We focus on asset management solutions, as wellas providing services in diverse areas such as electrical and instrumentation, fabric maintenance,mechanical and piping. We also provide inspection and integrity services to our clients to better ensure thereliable operations of their projects. This business, driven by annual operating expenditures, often benefitsfrom large projects that originate in another of our segments which can lead to long-term maintenance oroperations opportunities. Conversely, our long-term maintenance contracts can lead to larger capitalprojects for our other business segments when those needs arise. Our goal is to help clients improve theperformance of their assets while also extending asset life.
Our power services business line offers a variety of services to owners including fossil, renewable andnuclear plant maintenance, facility management, operations support, asset performance improvement,capital modifications and improvements, operations readiness and start-up commissioning on a globalbasis. We have annual maintenance and modification contracts covering full generation fleets within theutility generation market.
Diversified Services also includes Site Services� and fleet management services through AMECO�.AMECO provides integrated construction equipment, tool, and fleet service solutions to the company andthird party clients on a global basis for construction projects and plant sites. AMECO supports largeconstruction projects and plants at locations throughout North and South America, Africa, the MiddleEast, Australia and Southeast Asia.
Staffing services, also part of Diversified Services, are provided through TRS�. TRS is a globalenterprise of staffing specialists that provides the company and third party clients with technical,professional and craft resources either on a contract or permanent placement basis.
Other Matters
Backlog
Backlog represents the total amount of revenues we expect to record in the future based uponcontracts that have been awarded to us. Backlog is stated in terms of gross revenues and may includesignificant estimated amounts of third party, subcontracted and pass-through costs.
7

Backlog in the engineering and construction industry is a measure of the total dollar value of work tobe performed on contracts awarded and in progress. The following table sets forth the consolidatedbacklog of the company’s segments at December 31, 2017 and 2016:
December 31, December 31,2017 2016
(in millions)
Energy, Chemicals & Mining . . . . . . . . . . . . . . . . . . . . . . . . . . . . . . . . . . . $16,997 $21,831Industrial, Infrastructure & Power . . . . . . . . . . . . . . . . . . . . . . . . . . . . . . . 7,696 15,115Government(1) . . . . . . . . . . . . . . . . . . . . . . . . . . . . . . . . . . . . . . . . . . . . . . 3,771 5,194Diversified Services(2) . . . . . . . . . . . . . . . . . . . . . . . . . . . . . . . . . . . . . . . . 2,451 2,872
Total(3) . . . . . . . . . . . . . . . . . . . . . . . . . . . . . . . . . . . . . . . . . . . . . . . . . $30,915 $45,012
(1) U.S. government agencies operate under annual fiscal appropriations by Congress and fund variousfederal contracts only on an incremental basis. With respect to backlog in our Government segment, ifa contract covers multiple years, we include the full contract award, whether funded or unfunded,excluding option periods. As of December 31, 2017 and 2016, total backlog includes $741 million and$2.7 billion, respectively, of unfunded government contracts. For our contingency operations, weinclude only those amounts for which specific task orders have been awarded.
(2) The equipment and temporary staffing businesses in the Diversified Services segment do not reportbacklog or new awards. With respect to our ongoing operations and maintenance and asset integritycontracts in this segment, backlog includes the amount of revenue we expect to recognize for theremainder of the current year renewal period plus up to three additional years if renewal is consideredto be probable.
(3) For projects related to proportionately consolidated joint ventures, we include only our percentageownership of each joint venture’s backlog.
The following table sets forth our consolidated backlog at December 31, 2017 and 2016 by region:
December 31, December 31,2017 2016
(in millions)
United States . . . . . . . . . . . . . . . . . . . . . . . . . . . . . . . . . . . . . . . . . . . . . . $12,908 $23,188Asia Pacific (including Australia) . . . . . . . . . . . . . . . . . . . . . . . . . . . . . . . . 1,664 1,957Europe, Africa and Middle East . . . . . . . . . . . . . . . . . . . . . . . . . . . . . . . . . 13,420 16,732The Americas (excluding the United States) . . . . . . . . . . . . . . . . . . . . . . . . 2,923 3,135
Total . . . . . . . . . . . . . . . . . . . . . . . . . . . . . . . . . . . . . . . . . . . . . . . . . . . $30,915 $45,012
Although backlog reflects business that is considered to be firm, cancellations, deferrals or scopeadjustments may occur. Backlog is adjusted to reflect any known project cancellations, revisions to projectscope and cost, foreign currency exchange fluctuations and project deferrals, as appropriate. Backlogdenominated in foreign currencies is measured using average exchange rates. Due to additional factorsoutside of our control, such as changes in project schedules, we cannot predict the portion of ourDecember 31, 2017 backlog estimated to be performed annually subsequent to 2018. Accordingly, backlogis not necessarily indicative of future earnings or revenues and no assurances can be provided that we willultimately realize on our backlog.
8

The following table sets forth our changes in consolidated backlog in each year to reach endingbacklog at December 31, 2017 and 2016:
2017 2016
(in millions)
Backlog at beginning of year . . . . . . . . . . . . . . . . . . . . . . . . . . . . . . . . . . . . . . . $ 45,012 $ 44,726New awards . . . . . . . . . . . . . . . . . . . . . . . . . . . . . . . . . . . . . . . . . . . . . . . . . 12,566 20,959Adjustments and cancellations, net(1) . . . . . . . . . . . . . . . . . . . . . . . . . . . . . . . (7,597) (2,061)Work performed . . . . . . . . . . . . . . . . . . . . . . . . . . . . . . . . . . . . . . . . . . . . . . (19,066) (18,612)
Backlog at end of year . . . . . . . . . . . . . . . . . . . . . . . . . . . . . . . . . . . . . . . . . . . $ 30,915 $ 45,012
(1) Adjustments and cancellations, net during 2017 resulted primarily from the removal of the twoWestinghouse nuclear power plant projects from backlog, an adjustment to limit the contractual termof the Magnox RSRL Project to a five year term ending in August 2019 and exchange ratefluctuations. Adjustments and cancellations, net during 2016 resulted primarily from an adjustmentfor a liquefied natural gas project in Canada that was suspended, as well as project scope reductionsand exchange rate fluctuations.
In 2018, we expect to perform approximately 51 percent of our total backlog reported as ofDecember 31, 2017. In comparison, during the last three years we expected to annually perform an averageof 41 percent of our total year-end backlog in the subsequent fiscal year.
For additional information with respect to our backlog, please see ‘‘Item 7. — Management’sDiscussion and Analysis of Financial Condition and Results of Operations,’’ below.
Types of Contracts
While the basic terms and conditions of the contracts that we perform may vary considerably,generally we perform our work under two types of contracts: (a) reimbursable contracts and (b) fixed-price, lump-sum or guaranteed maximum contracts. In some markets, we are seeing ‘‘hybrid’’ contractscontaining both fixed-price and reimbursable elements. As of December 31, 2017, the following tablebreaks down the percentage and amount of revenue associated with these types of contracts for ourexisting backlog:
December 31, 2017
(in millions) (percentage)
Reimbursable . . . . . . . . . . . . . . . . . . . . . . . . . . . . . . . . . . . . . . . . . . . . . . . $19,464 63%Fixed-Price, Lump-Sum and Guaranteed Maximum . . . . . . . . . . . . . . . . . . . . $11,451 37%
In accordance with industry practice, most of our contracts, including those with the U.S. governmentare subject to termination at the discretion of our client. In such situations, our contracts typically providefor the payment of fees earned through the date of termination and the reimbursement of costs incurredincluding demobilization costs.
Under reimbursable contracts, the client reimburses us based upon negotiated rates and pays us apre-determined or fixed fee, or a fee based upon a percentage of the cost incurred in completing theproject. Our profit may be in the form of a fee, a simple mark-up applied to labor cost incurred inperforming the contract, or a combination of the two. The fee element may also vary. The fee may be anincentive fee based upon achieving certain performance factors, milestones or targets; it may be a fixedamount in the contract; or it may be based upon a percentage of the cost incurred.
Our Government segment, primarily acting as a prime contractor or a major subcontractor for anumber of government programs, generally performs its services under reimbursable contracts subject toapplicable statutes and regulations. In many cases, these contracts include incentive fee arrangements. Theprograms in question often take many years to complete and may be implemented by the award of many
9
different contracts. Some of our government contracts are known as indefinite delivery indefinite quantity(‘‘IDIQ’’) agreements. Under these arrangements, we work closely with the government to define thescope and amount of work required based upon an estimate of the maximum amount that the governmentdesires to spend. While the scope is often not initially fully defined or does not require any specific amountof work, once the project scope is determined, additional work may be awarded to us without the need forfurther competitive bidding.
Fixed-price contracts include both lump-sum contracts and negotiated fixed-price contracts. Underlump-sum contracts, we typically bid against our competitors on a contract based upon specificationsprovided by the client. This type of contracting presents certain inherent risks including the possibility ofambiguities in the specifications received, or economic and other changes that may occur during thecontract period. Under negotiated fixed-price contracts, we are selected as contractor first, and then wenegotiate price with the client. Negotiated fixed-price contracts frequently occur in single-responsibilityarrangements where we perform some of the work before negotiating the total price for the project.Another type of fixed-price contract is a unit price contract under which we are paid a set amount for every‘‘unit’’ of work performed. If we perform well under these types of contracts, we can benefit from costsavings; however, if the project does not proceed as originally planned, we generally cannot recover costoverruns except in certain limited situations.
Guaranteed maximum price contracts are reimbursable contracts except that the total fee plus thetotal cost cannot exceed an agreed upon guaranteed maximum price. We can be responsible for some or allof the total cost of the project if the cost exceeds the guaranteed maximum price. Where the total cost isless than the negotiated guaranteed maximum price, we may receive the benefit of the cost savings basedupon a negotiated agreement with the client.
Some of our contracts, regardless of type, may operate under joint ventures or other teamingarrangements. Typically, we enter into these arrangements with reputable companies with whom we haveworked previously. These arrangements are generally made to strengthen our market position or technicalskills, or where the size, scale or location of the project directs the use of such arrangements.
Competition
We are one of the world’s largest providers of engineering, procurement, construction, fabrication,operations and maintenance services. The markets served by our business are highly competitive and, forthe most part, require substantial resources and highly skilled and experienced technical personnel. A largenumber of companies are competing in the markets served by our business, including U.S.-basedcompanies such as AECOM, Bechtel Group, Inc., EMCOR Group, Inc., Jacobs Engineering Group, Inc.,KBR, Inc., Kiewit Corporation, Granite Construction, Inc., and Quanta Services, Inc., and international-based companies such as ACS Actividades de Construccion y Servicios, Balfour Beatty plc, Chicago Bridgeand Iron Company N.V., Chiyoda Corporation, Hyundai Engineering & Construction Company, Ltd.,JGC Corporation, McDermott International, Inc., Petrofac Limited, SNC-Lavalin Group, Inc., SamsungEngineering, Stantec Inc., TechnipFMC plc, Wood Group plc, and WorleyParsons Limited.
In the engineering, procurement, fabrication and construction arena, which is served by our Energy,Chemicals & Mining segment and our Industrial, Infrastructure & Power segment, competition is based onan ability to provide the design, engineering, planning, management and project execution skills requiredto complete complex projects in a safe, timely and cost-efficient manner. Our engineering, procurement,fabrication and construction business derives its competitive strength from our diversity, excellence inexecution, reputation for quality, technology, cost-effectiveness, worldwide procurement capability, projectmanagement expertise, geographic coverage, ability to meet client requirements by performingconstruction on either a union or an open shop basis, ability to execute projects of varying sizes, strongsafety record and lengthy experience with a wide range of services and technologies.
The various markets served by the Diversified Services segment, while having some similarities to theconstruction and procurement arena, tend also to have discrete issues impacting individual business lines.Each of the markets we serve has a large number of companies competing in its markets. In the operations
10

and maintenance markets, barriers to entry are both financially and logistically low, with the result that theindustry is highly fragmented with no single company being dominant. Competition in those markets isgenerally driven by reputation, price and the capacity to perform. The equipment sector, which operates innumerous markets, is highly fragmented and very competitive, with a large number of competitors mostlyoperating in specific geographic areas. The competition in the equipment sector for larger capital projectservices is more narrow and limited to only those capable of providing comprehensive equipment, tool andmanagement services. Temporary staffing is a highly fragmented market with over 1,000 companiescompeting globally. The key competitive factors in this business line are price, service, quality, clientrelationships, breadth of service and the ability to identify and retain qualified personnel and geographiccoverage.
Key competitive factors in our Government segment are primarily centered on performance and theability to provide the design, engineering, planning, management and project execution skills required tocomplete complex projects in a safe, timely, cost-efficient and compliant manner.
Significant Clients
For 2017, revenue earned from agencies of the U.S. government and Exxon Mobil Corporationaccounted for 15 percent and 13 percent, respectively, of our total revenue. We perform work for theseclients under multiple contracts and sometimes through joint venture arrangements. No other clientaccounted for more than 10 percent of our revenues in 2017.
Raw Materials
The principal products we use in our business include structural steel, metal plate, concrete, cable andvarious electrical and mechanical components. These products and components are subject to raw material(aluminum, copper, nickel, iron ore, etc.) availability and commodity pricing fluctuations, which wemonitor on a regular basis. We have access to numerous global supply sources, and we do not foresee anyunavailability of these items that would have a material adverse effect on our business in the near term.However, the availability of these products, components and raw materials may vary significantly from yearto year due to various factors including client demand, producer capacity, market conditions and specificmaterial shortages.
Research and Development
Aside from our investment in NuScale, we generally do not engage in significant research anddevelopment efforts for new products and services and, during the past three fiscal years, we have notincurred costs for company-sponsored or client-sponsored research and development activities whichwould be material, special or unusual in any of our business segments. See ‘‘Item 7. — Management’sDiscussion and Analysis of Financial Condition and Results of Operations — Power’’ for further discussionof the operations of NuScale.
Patents
We hold patents and licenses for certain items that we use in our operations, including those held byNuScale and Stork. However, none is so essential that its loss would materially affect our business.
Environmental, Safety and Health Matters
In our business, we engage in design, engineering, construction, construction management, fabricationand operations and maintenance at sites throughout the world. Work at some of these sites involvesactivities related to nuclear facilities, hazardous waste, hydrocarbon production, distribution and transport,the military and infrastructure. Some of our work can be performed adjacent to environmentally sensitivelocations such as wetlands, lakes and rivers. We also contract with the U.S. federal government toremediate hazardous materials, including chemical agents and weapons, as well as to decontaminate anddecommission nuclear sites. These activities can require us to manage, handle, remove, treat, transport and
11

dispose of toxic, radioactive or hazardous substances. Significant fines, penalties and other sanctions mayarise under environmental health and safety laws and regulations, and many of these laws call for joint andseveral and/or strict liability, which can render a party liable without regard to negligence or fault of suchperson.
We believe, based upon present information available to us, that we are generally compliant with allsuch environmental health and safety laws and regulations. We further believe that our accruals withrespect to future environmental costs are adequate and that any future costs will not have a material effecton our consolidated financial position, results of operations, liquidity, capital expenditures or competitiveposition. Some factors, however, could result in additional expenditures or the provision of additionalaccruals in expectation of such expenditures. These include the imposition of more stringent requirementsunder environmental laws or regulations, new developments or changes regarding site cleanup costs or theallocation of such costs among potentially responsible parties, or a determination that we are potentiallyresponsible for the release of hazardous substances at sites other than those currently identified.
Number of Employees
The following table sets forth the number of employees of Fluor and its subsidiaries as ofDecember 31, 2017:
Number ofEmployees
Salaried Employees . . . . . . . . . . . . . . . . . . . . . . . . . . . . . . . . . . . . . . . . . . . . . . . . . . . . . 31,951Craft and Hourly Employees . . . . . . . . . . . . . . . . . . . . . . . . . . . . . . . . . . . . . . . . . . . . . . . 24,755
Total . . . . . . . . . . . . . . . . . . . . . . . . . . . . . . . . . . . . . . . . . . . . . . . . . . . . . . . . . . . . . . 56,706
The number of craft and hourly employees varies in relation to the number, size and phase ofexecution of projects we have in process at any particular time.
Executive Officers of the Registrant
The following information is being furnished with respect to the company’s executive officers as ofDecember 31, 2017:
Name Age Position with the Company(1)
Ray F. Barnard . . . . . . . . . . . 58 Executive Vice President, Systems and Supply ChainJames F. Brittain . . . . . . . . . 59 Group President, Energy & ChemicalsJose-Luis Bustamante . . . . . . 54 Executive Vice President, Business Development and StrategyRobin K. Chopra . . . . . . . . . 53 Senior Vice President and ControllerThomas P. D’Agostino . . . . . . 59 Group President, GovernmentTaco de Haan . . . . . . . . . . . . 50 Group President, Diversified ServicesGarry W. Flowers . . . . . . . . . 66 Executive Vice PresidentCarlos M. Hernandez . . . . . . 63 Executive Vice President, Chief Legal Officer and SecretaryRick Koumouris . . . . . . . . . . 57 Group President, Mining & Metals, Infrastructure, Power,
Life Sciences & Advanced ManufacturingMark A. Landry . . . . . . . . . . 53 Senior Vice President, Human ResourcesDavid T. Seaton . . . . . . . . . . 56 Chairman and Chief Executive OfficerBruce A. Stanski . . . . . . . . . . 57 Executive Vice President and Chief Financial Officer
(1) All references are to positions held with Fluor Corporation. All of the officers listed in the precedingtable serve in their respective capacities at the pleasure of the Board of Directors.
12

Ray F. Barnard
Mr. Barnard has been Executive Vice President, Systems and Supply Chain since February 2014. Priorto that, he was Chief Information Officer from February 2005 to February 2014. Mr. Barnard joined thecompany in 2002.
James F. Brittain
Mr. Brittain has been Group President, Energy & Chemicals since March 2017. Prior to that, he wasSenior Vice President, Business Line President — Energy & Chemicals Americas from February 2014 toMarch 2017 and Vice President, Project Director — Energy & Chemicals from February 2009 to February2014. Mr. Brittain joined the company in 1987.
Jose-Luis Bustamante
Mr. Bustamante has been Executive Vice President, Business Development and Strategy sinceFebruary 2015. Prior to that, he was Senior Vice President of Business Development, Marketing andStrategic Planning — Energy & Chemicals from February 2012 to February 2015. Mr. Bustamante joinedthe company in 1990.
Robin K. Chopra
Mr. Chopra has been Senior Vice President and Controller, as well as the Principal AccountingOfficer of Fluor since March 2016. Prior to that, he was Controller of our former Energy & Chemicals,Industrial & Infrastructure and Power segments from September 2014 to March 2016 and Vice President,Internal Audit from March 2008 to September 2014. Mr. Chopra joined the company in 1991.
Thomas P. D’Agostino
Mr. D’Agostino has been Group President, Government since August 2017. Prior to that, he wasSenior Vice President, Sales, Government from June 2015 to August 2017 and Senior Vice President ofStrategic Planning and Development for Government from November 2013 to June 2015. Prior to joiningthe company in November 2013, he served in various roles, including Under Secretary for NuclearSecurity, Administrator of the National Nuclear Security Administration (NNSA) and DeputyAdministrator for Defense Programs from 2007 until his retirement in February 2013.
Taco de Haan
Mr. de Haan has been Group President, Diversified Services since March 2017 and Chief ExecutiveOfficer of Stork since October 2016. Prior to that, he was Senior Vice President, Business LinePresident — Energy & Chemicals EAME from February 2011 to October 2016. Mr. de Haan joined thecompany in 1995.
Garry W. Flowers
Mr. Flowers has been Executive Vice President, with responsibility for corporate security and specialprojects, since February 2017. Prior to that, he was Executive Vice President, Project Support Servicesfrom February 2014 to February 2017 and Group President, Global Services from January 2012 toFebruary 2014. Mr. Flowers joined the company in 1978.
Carlos M. Hernandez
Mr. Hernandez has been Executive Vice President, Chief Legal Officer and Secretary since October2007, when he joined the company. Prior to joining the company, he was General Counsel and Secretary ofArcelorMittal USA, Inc. from April 2005 to September 2007.
13

Rick Koumouris
Mr. Koumouris has been Group President of Mining & Metals, Infrastructure, Power and LifeSciences & Advanced Manufacturing since March 2017. Prior to that, he was Senior Vice President,Business Line President — Mining & Metals from March 2007 to March 2017. Mr. Koumouris joined thecompany in 1987.
Mark A. Landry
Mr. Landry has been Senior Vice President, Human Resources since July 2016. Prior to that, he hadvarious roles in our Human Resources group overseeing various commercial operations from May 2014 toJuly 2016 and was an HR Director for Energy & Chemicals and the HR Regional Director for EAME,Asia Pacific and Australia from December 2010 to May 2014. Mr. Landry joined the company in 1989.
David T. Seaton
Mr. Seaton has been Chief Executive Officer since February 2011 and Chairman since February 2012.Prior to that, he was Chief Operating Officer from November 2009 to February 2011. Mr. Seaton joinedthe company in 1985.
Bruce A. Stanski
Mr. Stanski has been Executive Vice President and Chief Financial Officer since August 2017. Prior tothat, he was Group President, Government from August 2009 to August 2017. Prior to joining the companyin March 2009, he was President, Government and Infrastructure of KBR, Inc. from August 2007 to March2009.
Available Information
Our website address is www.fluor.com. You may obtain free electronic copies of our annual reports onForm 10-K, quarterly reports on Form 10-Q, current reports on Form 8-K, and all amendments to thosereports on the ‘‘Investor Relations’’ portion of our website, under the heading ‘‘SEC Filings’’ filed under‘‘Financial Information.’’ These reports are available on our website as soon as reasonably practicable afterwe electronically file them with the Securities and Exchange Commission. These reports, and anyamendments to them, are also available at the Internet website of the Securities and ExchangeCommission, http://www.sec.gov. The public may also read and copy any materials we file with theSecurities and Exchange Commission at the SEC’s Public Reference Room located at 100 F Street,N.E., Washington, D.C., 20549. In order to obtain information about the operation of the Public ReferenceRoom, you may call 1-800-732-0330. We also maintain various documents related to our corporategovernance including our Corporate Governance Guidelines, our Board Committee Charters and ourCode of Business Conduct and Ethics for Members of the Board of Directors on the ‘‘Sustainability’’portion of our website under the heading ‘‘Corporate Governance Documents’’ filed under ‘‘Governance.’’
Item 1A. Risk Factors
We are vulnerable to the cyclical nature of the markets we serve.
The demand for our services is dependent upon the existence of projects with engineering,procurement, construction, fabrication, maintenance and management needs. Over the past few years,poor economic conditions, low commodity prices, political uncertainties and currency devaluations haveadversely affected our clients’ interest in approving new projects, reduced our clients’ budgets for capitalexpenditures and otherwise caused a slowdown in the services our clients require. Despite improvingconditions, our clients remain selective in how they allocate and expend their capital, which has resulted ina reduction of the number of projects we may bid on and win, especially the larger scale projects in whichwe specialize. In our Energy, Chemicals & Mining segment, capital expenditures by our clients may beinfluenced by factors such as prevailing prices and expectations about future prices for underlying
14

commodities, technological advances, the costs of exploration, production and delivery of product,domestic and international political, military, regulatory and economic conditions and other similar factors.In the power portion of our Industrial, Infrastructure & Power segment, new order activity has continuedto see relatively low demand for our services in power due to stagnant demand for domestic power,coupled with improved energy efficiency and political and environmental concerns. In our mining andmetal business line, while new order activity has picked up, the number and the size of the awards are lessthan we have historically seen due in part to volatility in the commodities and capital markets, which havecaused clients in this segment to be conservative in how they allocate their investment capital for futureimprovements. Industries such as these and many of the others we serve have historically been and willcontinue to be vulnerable to general downturns, which in turn could materially and adversely affect thedemand for our services.
Our revenue and earnings are largely dependent on the award of new contracts, which we do not directly control.
A substantial portion of our revenue and earnings is generated from large-scale project awards. Thetiming of project awards is unpredictable and outside of our control. Awards, including expansions ofexisting projects, often involve complex and lengthy negotiations and competitive bidding processes. Theseprocesses can be impacted by a wide variety of factors including a client’s decision to not proceed with thedevelopment of a project, governmental approvals, financing contingencies, commodity prices,environmental conditions and overall market and economic conditions. We may not win contracts that wehave bid upon due to price, a client’s perception of our ability to perform and/or perceived technologyadvantages held by others. Many of our competitors may be more inclined to take greater or unusual risksor terms and conditions in a contract that we might not deem acceptable especially when the markets forthe services we typically offer are relatively soft. Because a significant portion of our revenue is generatedfrom large projects, our results of operations can fluctuate quarterly and annually depending on whetherand when large project awards occur and the commencement and progress of work under large contractsalready awarded. As a result, we are subject to the risk of losing new awards to competitors or the risk thatrevenue may not be derived from awarded projects as quickly as anticipated. Current economic andpolitical conditions also make it extremely difficult for our clients, our vendors and us to accuratelyforecast and plan future business activities.
We may experience reduced profits or losses under contracts if costs increase above estimates.
Generally our business is performed under contracts that include cost and schedule estimates inrelation to our services. Inaccuracies in these estimates may lead to cost overruns that may not be paid byour clients thereby resulting in reduced profits or losses. Unforeseen increases in or failures to properlyestimate the cost of raw materials, components, equipment, labor or the ability to timely obtain them mayresult in such cost overruns or project delays. If a contract is significant or there are one or more eventsthat impact a contract or multiple contracts, cost overruns could have a material impact on our reputationor our financial results, negatively impacting our financial condition, results of operations or cash flow.Approximately 37 percent of the dollar-value of our backlog is currently fixed-price contracts, where webear a significant portion of the risk for cost overruns, and we expect this percentage of fixed-pricecontracts to increase in subsequent years. Reimbursable contract types, such as those that includenegotiated hourly billing rates, may restrict the kinds or amounts of costs that are reimbursable, thereforeexposing us to risk that we may incur certain costs in executing these contracts that are above our estimatesand not recoverable from our clients. If we fail to accurately estimate the resources and time necessary forthese types of contracts, or fail to complete these contracts within the timeframes and costs we have agreedupon, there could be a material impact on our financial results as well as our reputation.
15

Our project execution activities may result in reduced profits or losses that could have a material impact on ourfinancial condition, results of operations or cash flow.
Because our projects are often technically complex, with multiple phases occurring over several years,we incur risks in our project execution activities. These risks could result in cost overruns, project delays orother problems and can include the following:
• Unanticipated technical problems, including design or engineering issues;
• Inaccurate representations of site conditions and unanticipated changes in the project executionplan;
• Project modifications creating unanticipated costs or delays and failure to properly manage projectmodifications;
• Inability to achieve guaranteed performance or quality standards with regard to engineering,construction or project management obligations;
• Insufficient or inadequate project execution tools and systems needed to record, track, forecast andcontrol cost and schedule;
• Failure to accurately estimate the cost of projects;
• Failure to properly make judgments in accordance with applicable professional standards, includingengineering standards;
• Failure to properly assess and update appropriate risk mitigation strategies and measures;
• Incorrect assumptions related to productivity, scheduling estimates or future economic conditionsincluding with respect to the impacts of inflation on lump-sum or fixed-price contracts;
• Difficulties related to the performance of our clients, partners, subcontractors, suppliers or otherthird parties;
• Delays or productivity issues caused by weather; and
• Changes in local laws or difficulties or delays in obtaining permits, rights of way or approvals.
These and other risks may result in our failure to achieve contractual cost or schedule commitments,safety performance, overall client satisfaction or other performance criteria. As a result, we may receivelower fees or lose our ability to earn incentive fees. In other cases, our fee will not change but we will haveto continue to perform work without additional fee until the performance criteria is achieved. In bothinstances, this could result in lower than expected gross margins. In addition, if we fail to meet guaranteedperformance or quality standards, we may be held responsible under the guarantee or warranty provisionsof our contract for cost impact to the client, generally in the form of contractually agreed-upon liquidateddamages or an obligation to re-perform substandard work. We may also be required to pay liquidateddamages if we fail to complete a project on schedule. To the extent these events occur, the total cost to theproject (including any liquidated damages we become liable to pay) could be material and could, in somecircumstances, equal or exceed the full value of the contract. In such events, our financial condition, resultsof operations or cash flow could be negatively impacted.
Intense competition in the global engineering, procurement and construction industry could reduce our marketshare and profits.
We serve markets that are highly competitive and in which a large number of multinational companiescompete. These markets can require substantial resources and investment in technology and skilledpersonnel. We also see a continuing influx of non-traditional competitors offering below-market pricingwhile accepting greater risk. Competition can place downward pressure on our contract prices and profitmargins, and may force us to accept contractual terms and conditions that are not normal or customary,thereby increasing the risk that we may have losses on such contracts. Intense competition is expected to
16

continue in these markets, presenting us with significant challenges in our ability to maintain strong growthrates and acceptable profit margins. If we are unable to meet these competitive challenges, we could losemarket share to our competitors and experience an overall reduction in our profits.
Our use of teaming arrangements and joint ventures, which are important to our business, exposes us to risk anduncertainty because the success of those ventures depends on the satisfactory performance by our venture partnersover whom we may have little or no control. The failure of our venture partners to perform their venture obligationscould impose additional financial and performance obligations on us that could result in reduced profits or, in somecases, significant losses for us with respect to the venture.
In the ordinary course of business, and as has become increasingly common in our industry, weexecute specific projects and otherwise conduct certain operations through joint ventures, consortiums,partnerships and other collaborative arrangements (collectively, ‘‘ventures’’), including ICA Fluor andCOOEC Fluor Heavy Industries (‘‘CFHI’’). We have various ownership interests in these ventures, withsuch ownership typically being proportionate to our decision-making and distribution rights. The venturesgenerally contract directly with the third party client; however, services may be performed directly by theventure, or may be performed by us, our partners, or a combination thereof.
Our success in many of our markets is dependent, in part, on the presence or capability of a localpartner. If we are unable to compete alone, or with a quality partner, our ability to win work andsuccessfully complete our contracts may be impacted. Differences in opinions or views between venturepartners can result in delayed decision-making or failure to agree on material issues which could adverselyaffect the business and operations of our ventures. In many of the countries in which we engage in jointventures, it may be difficult to enforce our contractual rights under the applicable joint venture agreement.
At times, we also participate in ventures where we are not a controlling party or where we team withunaffiliated parties on a particular project bid. In such instances, we may have limited control over venturedecisions and actions, including internal controls and financial reporting which may have an impact on ourbusiness. If internal control problems arise within the joint venture, or if our joint venture partners havefinancial or operational issues, there could be a material impact on our business, financial condition orresults of operations.
The success of these and other ventures also depends, in large part, on the satisfactory performance byour venture partners of their venture obligations, including their obligation to commit working capital,equity or credit support as required by the venture and to support their indemnification and othercontractual obligations. If our venture partners fail to satisfactorily perform their venture obligations, theventure may be unable to adequately perform or deliver its contracted services. Under thesecircumstances, we may be required to make additional investments and provide additional services toensure the adequate performance and delivery by the venture of the contracted services and to meet anyperformance guarantees. From time to time in order to establish or preserve a relationship, or to betterensure venture success, we may accept risks or responsibilities for the venture which are not necessarilyproportionate with the reward we expect to receive or which may differ from risks or responsibilities wewould normally accept in our own operations. We may also be subject to joint and several liability for ourventure partners under the applicable contracts for venture projects. These additional obligations couldresult in reduced profits or, in some cases, increased liabilities or significant losses for us with respect tothe venture, and in turn, our business and operations. In addition, a failure by a venture partner to complywith applicable laws, rules or regulations could negatively impact our business and could result in fines,penalties, suspension or in the case of government contracts even debarment.
From time to time, we are involved in litigation proceedings, potential liability claims and contract disputes whichmay reduce our profits.
We may be subject to a variety of legal proceedings, liability claims or contract disputes in virtuallyevery part of the world. We engage in engineering and construction activities for large facilities wheredesign, construction or systems failures can result in substantial injury or damage. In addition, the nature
17

of our business results in clients, subcontractors and suppliers occasionally presenting claims against us forrecovery of costs they incurred in excess of what they expected to incur, or for which they believe they arenot contractually liable. We have been and may in the future be named as a defendant in legal proceedingswhere parties may make a claim for damages or other remedies with respect to our projects or othermatters. During times of economic uncertainty, especially with regard to our commodity-based clients,claim frequencies and amounts tend to increase.
In proceedings when it is determined that we have liability, we may not be covered by insurance or, ifcovered, the dollar amount of these liabilities may exceed our policy limits. In addition, even whereinsurance is maintained for such exposure, the policies have deductibles resulting in our assuming exposurefor a layer of coverage with respect to any such claims. Our professional liability coverage is on a‘‘claims-made’’ basis covering only claims actually made during the policy period currently in effect. Anyliability not covered by our insurance, in excess of our insurance limits or, if covered by insurance butsubject to a high deductible, could result in a significant loss for us, and reduce our cash available foroperations.
In other legal proceedings, liability claims or contract disputes, we may be covered by indemnificationagreements which may at times be difficult to enforce. Even if enforceable, it may be difficult to recoverunder these agreements if the indemnitor does not have the ability to financially support the indemnity.Litigation and regulatory proceedings are subject to inherent uncertainties, and unfavorable rulings couldoccur. If we were to receive an unfavorable ruling in a matter, our business and results of operations couldbe materially harmed. For further information on matters in dispute, please see ‘‘14. Contingencies andCommitments’’ in the Notes to Consolidated Financial Statements.
Our failure to recover adequately on claims against project owners, subcontractors or suppliers for payment orperformance could have a material effect on our financial results.
We occasionally bring claims against project owners for additional costs exceeding the contract priceor for amounts not included in the original contract price. Similarly, we present change orders and claimsto our subcontractors and suppliers. If we fail to properly provide notice or document the nature of changeorders or claims, or are otherwise unsuccessful in negotiating a reasonable settlement, we could incurreduced profits, cost overruns and in some cases a loss on the project. These types of claims can oftenoccur due to matters such as owner-caused delays or changes from the initial project scope, which result inadditional cost, both direct and indirect. From time to time, these claims can be the subject of lengthy andcostly proceedings, and it is often difficult to accurately predict when these claims will be fully resolved.When these types of events occur and while unresolved claims are pending, we may invest significantworking capital in projects to cover cost overruns pending the resolution of the relevant claims. A failure topromptly recover on these types of claims could have a material adverse impact on our liquidity andfinancial results.
Cyber-security breaches of our systems and information technology could adversely impact our ability to operate.
We utilize, develop, install and maintain a number of information technology systems both for us andfor others. Various privacy and security laws require us to protect sensitive and confidential informationfrom disclosure. In addition, we are bound by our client and other contracts, as well as our own businesspractices, to protect confidential and proprietary information (whether it be ours or a third party’sinformation entrusted to us) from disclosure. Our computer systems face the threat of unauthorizedaccess, computer hackers, viruses, malicious code, cyber attacks, phishing and other security incursions andsystem disruptions, including attempts to improperly access our confidential and proprietary informationas well as the confidential and proprietary information of our clients and other business partners. While weendeavor to maintain industry-accepted security measures and technology to secure our computer systemsand while we endeavor to ensure our cloud vendors that store our data maintain similar measures, thesesystems and the information stored on these systems may still be subject to threats. A party whocircumvents our security measures could misappropriate confidential or proprietary information, or could
18

cause damage or interruptions to our systems. Any of these events could damage our reputation or have amaterial adverse effect on our business, financial condition, results of operations or cash flows.
We have international operations that are subject to foreign economic and political uncertainties and risks.Unexpected and adverse changes in the foreign countries in which we operate could result in project disruptions,increased cost and potential losses.
Our business is subject to international economic and political conditions that change (sometimesfrequently) for reasons which are beyond our control. As of December 31, 2017, approximately 58 percentof our backlog consisted of revenue to be derived from projects and services to be completed outside theUnited States. We expect that a significant portion of our revenue and profits will continue to come frominternational projects for the foreseeable future.
Operating in the international marketplace exposes us to a number of risks including:
• abrupt changes in government policies, laws, treaties (including those impacting trade), regulationsor leadership;
• embargoes or other trade restrictions, including sanctions;
• restrictions on currency movement;
• tax increases;
• currency exchange rate fluctuations;
• changes in labor conditions and difficulties in staffing and managing international operations;
• U.S. government policy changes in relation to the foreign countries in which we or our clientsoperate;
• other social, political and economic instability;
• international hostilities; and
• unrest, civil strife, acts of war, terrorism and insurrection.
Also, the lack of a well-developed legal system in some of the countries where we operate may make itdifficult to enforce our contractual rights or to defend ourself against claims made by others. We operate inlocations where there is a significant amount of political risk. In addition, military action or continuedunrest could impact the supply or pricing of oil, disrupt our operations in the region and elsewhere, andincrease our security costs. Our level of exposure to these risks will vary on each project, depending on thelocation of the project and the particular stage of each such project. For example, our risk exposure withrespect to a project in an early development phase, such as engineering, will generally be less than our riskexposure on a project that is in the construction phase. To the extent that our international business isaffected by unexpected and adverse foreign economic and political conditions and risks, we may experienceproject disruptions and losses. Project disruptions and losses could significantly reduce our overall revenueand profits.
Our backlog is subject to unexpected adjustments and cancellations and, therefore, may not be a reliable indicator ofour future revenue or earnings.
As of December 31, 2017, our backlog was approximately $30.9 billion. Our backlog generally consistsof projects for which we have an executed contract or commitment with a client and reflects our expectedrevenue from the contract or commitment, which is often subject to revision over time. We cannotguarantee that the revenue projected in our backlog will be realized or profitable or will not be subject todelay or suspension. Project cancellations, scope adjustments or deferrals, or foreign currency fluctuationsmay occur with respect to contracts reflected in our backlog and could reduce the dollar amount of ourbacklog and the revenue and profits that we actually earn; or, may cause the rate at which we perform onour backlog to decrease. Most of our contracts have termination for convenience provisions in them
19

allowing clients to cancel projects already awarded to us. Our contracts typically provide for the paymentof fees earned through the date of termination and the reimbursement of costs incurred includingdemobilization costs. In addition, projects may remain in our backlog for an extended period of time.During periods of economic slowdown, or decreases and/or instability in commodity prices, the risk ofbacklog projects being suspended, delayed or cancelled generally increases. Finally, poor project orcontract performance could also impact our backlog and profits. Such developments could have a materialadverse effect on our business and our profits.
If we experience delays and/or defaults in client payments, we could suffer liquidity problems or we could be unableto recover all expenditures.
Because of the nature of our contracts, we sometimes commit resources to projects prior to receivingpayments from clients in amounts sufficient to cover expenditures as they are incurred. Some of our clientsmay find it increasingly difficult to pay invoices for our services timely, especially as commodity prices arevolatile or relatively low, increasing the risk that our accounts receivable could become uncollectible andultimately be written off. In certain cases, our clients for our large projects are project-specific entities thatdo not have significant assets other than their interests in the project. From time to time, it may be difficultfor us to collect payments owed to us by these clients. In addition, clients may request extension of thepayment terms otherwise agreed to under our contracts. Delays in client payments may require us to makea working capital investment, which could impact our cash flows and liquidity. If a client fails to payinvoices on a timely basis or defaults in making its payments on a project in which we have devotedsignificant resources, there could be a material adverse effect on our results of operations or liquidity.
We are dependent upon suppliers and subcontractors to complete many of our contracts.
Some of the work performed under our contracts is actually performed by third-party subcontractors.We also rely on third-party suppliers to provide much of the equipment and materials used for projects. Ifwe are unable to hire qualified subcontractors or find qualified suppliers, our ability to successfullycomplete a project could be impaired. If the amount we are required to pay for subcontractors orequipment and supplies exceeds what we have estimated, especially in a fixed-price type contract, we maysuffer losses on these contracts. If a supplier or subcontractor fails to provide supplies, technology,equipment or services as required under a contract to us, our joint venture partner, our client or any otherparty involved in the project for any reason, or provides supplies, technology, equipment or services thatare not an acceptable quality, we may be required to source those supplies, technology, equipment orservices on a delayed basis or at a higher price than anticipated, which could impact contract profitability.In addition, faulty workmanship, equipment or materials could impact the overall project, resulting inclaims against us for failure to meet required project specifications. These risks may be intensified duringan economic downturn if these suppliers or subcontractors experience financial difficulties or find itdifficult to obtain sufficient financing to fund their operations or access to bonding, and are not able toprovide the services or supplies necessary for our business. In addition, in instances where we rely on asingle contracted supplier or subcontractor or a small number of suppliers or subcontractors, if asubcontractor or supplier were to fail, there can be no assurance that the marketplace can providereplacement technology, equipment, materials or services in a timely basis or at the costs we hadanticipated. A failure by a third-party subcontractor or supplier to comply with applicable laws, rules orregulations could negatively impact our business and could result in fines, penalties, suspension, or in thecase of government contracts, even debarment.
Our businesses could be materially and adversely affected by events outside of our control.
Extraordinary or force majeure events beyond our control, such as natural or man-made disasters,could negatively impact our ability to operate or increase our costs to operate. As an example, from time totime we face unexpected severe weather conditions which may result in delays in our operations;evacuation of personnel and curtailment of services; increased labor and material costs or shortages;inability to deliver materials, equipment and personnel to jobsites in accordance with contract schedules;
20

and loss of productivity. We may remain obligated to perform our services after any such natural orman-made disasters, unless a contract provision provides us with relief from our obligations. The extracosts incurred as a result of these events may not be reimbursed by our clients. If we are not able to reactquickly to such events, or if a high concentration of our projects are in a specific geographic region thatsuffers from a natural or man-made disaster, our operations may be significantly affected, which couldhave a negative impact on our operations. In addition, if we cannot complete our contracts on time, wemay be subject to potential liability claims by our clients which may reduce our profits and result in losses.
Our U.S. government contracts and contracting rights may be terminated or otherwise adversely impacted at anytime, and our inability to win or renew government contracts during regulated procurement processes could harmour operations and reduce our projects and revenues.
We enter into significant government contracts, from time to time, such as those contracts that wehave in place with the U.S. Department of Energy and Department of Defense. U.S. government contractsare subject to various uncertainties, restrictions and regulations, including oversight audits by governmentrepresentatives and profit and cost controls, which could result in withholding or delay of payments to us.U.S. government contracts are also subject to uncertainties associated with Congressional funding,including the potential impacts of budget deficits and federal sequestration. A significant portion of ourbusiness is derived as a result of U.S. government regulatory, military and infrastructure priorities.Changes in these priorities, which can occur due to policy changes or changes in the economy, couldadversely impact our revenues. The U.S. government is under no obligation to maintain program fundingat any specific level, and funds for a program may even be eliminated. Our U.S. government clients mayterminate or decide not to renew our contracts with little or no prior notice.
In addition, U.S. government contracts are subject to specific regulations such as the FederalAcquisition Regulation (‘‘FAR’’), the Truth in Negotiations Act, the Cost Accounting Standards (‘‘CAS’’),the Service Contract Act and Department of Defense security regulations. Failure to comply with any ofthese regulations and other government requirements may result in contract price adjustments, financialpenalties or contract termination. Our U.S. government contracts are also subject to audits, cost reviewsand investigations by U.S. government contracting oversight agencies such as the U.S. Defense ContractAudit Agency (the ‘‘DCAA’’). The DCAA reviews the adequacy of and our compliance with our internalcontrol systems and policies (including our labor, billing, accounting, purchasing, estimating, compensationand management information systems). The DCAA also has the ability to review how we have accountedfor costs under the FAR and CAS. The DCAA presents its report findings to the Defense ContractManagement Agency (‘‘DCMA’’). Should the DCMA determine that we have not complied with the termsof our contract and applicable statutes and regulations, or if they believe that we have engaged ininappropriate accounting or other activities, payments to us may be disallowed or we could be required torefund previously collected payments. Additionally, we may be subject to criminal and civil penalties,suspension or debarment from future government contracts, and qui tam litigation brought by privateindividuals on behalf of the U.S. government under the False Claims Act, which could include claims fortreble damages. Furthermore, in this environment, if we have significant disagreements with ourgovernment clients concerning costs incurred, negative publicity could arise which could adversely affectour industry reputation and our ability to compete for new contracts in the government arena or otherwise.
Most U.S. government contracts are awarded through a rigorous competitive process. The U.S.government has increasingly relied upon multiple-year contracts with pre-established terms and conditionsthat generally require those contractors that have been previously awarded the contract to engage in anadditional competitive bidding process for each task order issued under the contract. Such processesrequire successful contractors to anticipate requirements and develop rapid-response bid and proposalteams as well as dedicated supplier relationships and delivery systems to react to these needs. We facerigorous competition and significant pricing pressures in order to win these task orders. If we are notsuccessful in reducing costs or able to timely respond to government requests, we may not win additionalawards. Moreover, even if we are qualified to work on a government contract, we may not be awarded thecontract because of existing government policies designed to protect small businesses and under-
21

represented minority contractors. Our inability to win or renew government contracts during theprocurement processes could harm our operations and reduce our profits and revenues.
Many of our U.S. government contracts require security clearances. Depending upon the level ofclearance required, security clearances can be difficult and time-consuming to obtain. If we or ouremployees are unable to obtain or retain necessary security clearances, we may not be able to win newbusiness, and our existing government clients could terminate their contracts with us or decide not torenew them, thus adversely affecting our revenues.
Under the Budget Control Act of 2011, an automatic sequestration process, or across-the-boardbudget cuts (a large portion of which was defense-related), was triggered when the Joint Select Committeeon Deficit Reduction, a committee of twelve members of Congress, failed to agree on a deficit reductionplan for the U.S. federal budget. The sequestration began on March 1, 2013. Although the BipartisanBudget Act of 2013 provides some sequester relief until the end of 2017, absent additional legislative orother remedial action, the sequestration requires reduced U.S. federal government spending from 2018through 2025. A significant reduction in federal government spending or a change in budgetary prioritiescould reduce demand for our services, cancel or delay federal projects, and result in the closure of federalfacilities and significant personnel reductions, which could have a material adverse effect on our results ofoperations and financial condition.
If one or more of our U.S. government contracts are terminated for any reason including forconvenience, if we are suspended or debarred from U.S. government contract work, or if payment of ourcost is disallowed, we could suffer a significant reduction in expected revenue and profits.
Employee, agent or partner misconduct or our overall failure to comply with laws or regulations could weaken ourability to win contracts, which could result in reduced revenues and profits.
Misconduct, fraud, non-compliance with applicable laws and regulations, or other improper activitiesby one of our employees, agents or partners could have a significant negative impact on our business andreputation. Such misconduct could include the failure to comply with anti-corruption, export control andenvironmental regulations; federal procurement regulations, regulations regarding the pricing of labor andother costs in government contracts and regulations regarding the protection of sensitive governmentinformation; regulations on lobbying or similar activities; regulations pertaining to the internal control overfinancial reporting; and, various other applicable laws or regulations. The precautions we take to preventand detect fraud, misconduct or failures to comply with applicable laws and regulations may not beeffective, and we could face unknown risks or losses. Failure to comply with applicable laws or regulationsor acts of fraud or misconduct could subject us to fines and penalties, loss of security clearance andsuspension or debarment from contracting with government agencies, which could weaken our ability towin contracts and have a material adverse impact on our revenues and profits.
Changes in our effective tax rate and tax positions may vary.
We are subject to income taxes in the United States and numerous foreign jurisdictions. A change intax laws, treaties or regulations, or their interpretation, in any country in which we operate could result in alower or higher tax rate on our earnings, which could have a material impact on our earnings and cashflows from operations. For example, recently enacted tax reform legislation in the U.S. could significantlyimpact our provision for income taxes. In addition, significant judgment is required in determining ourworldwide provision for income taxes and our determinations could be found to be incorrect. In theordinary course of our business, there are many transactions and calculations where the ultimate taxdetermination is uncertain. We are regularly under audit by tax authorities, and our tax estimates and taxpositions could be materially affected by many factors including the final outcome of tax audits and relatedlitigation, the introduction of new tax accounting standards, legislation, regulations and relatedinterpretations, our global mix of earnings, the realizability of deferred tax assets and changes in uncertaintax positions. Future increases in our tax rate or adverse changes in tax laws could have a material adverseeffect on our profitability and liquidity.
22

Systems and information technology interruption, as well as new systems implementation, could adversely impactour ability to operate and our operating results.
As a global company, we are heavily reliant on computer, information and communicationstechnology and related systems, some of which are hosted by third party providers, in order to operate.From time to time, we experience system interruptions and delays that may be planned for upgrades orthat may be unplanned. Unplanned interruptions include natural disasters, power loss, telecommunicationsfailures, acts of war or terrorism, acts of God, computer viruses, physical or electronic break-ins and similarevents or disruptions. Any of these or other events could cause system interruption, delays, loss of criticalor sensitive data (including personal or financial data) or loss of funds; could delay or prevent operations(including the processing of transactions and reporting of financial results); and could adversely affect ourreputation or our operating results. While we have and require the maintenance of reasonable safeguardsdesigned to protect against unavailability or loss of data, these safeguards may not be sufficient. We may berequired to expend significant resources to protect against or alleviate damage caused by systemsinterruptions and delays, which could have a material adverse effect on our business and cash flows.
We continue to evaluate the need to upgrade and/or replace our systems and network infrastructure toprotect our computing environment, to stay current on vendor supported products, to improve theefficiency of our systems and for other business reasons. The implementation of new systems andinformation technology could adversely impact our operations by imposing substantial capitalexpenditures, demands on management time and risks of delays or difficulties in transitioning to newsystems. And, our systems implementations may not result in productivity improvements at the levelsanticipated. Systems implementation disruption and any other information technology disruption, if notanticipated and appropriately mitigated, could have a material adverse effect on our business.
We could be adversely affected by violations of the U.S. Foreign Corrupt Practices Act and similar worldwideanti-bribery laws.
The U.S. Foreign Corrupt Practices Act, the U.K. Bribery Act of 2010 and similar anti-bribery laws inother jurisdictions generally prohibit companies and their intermediaries from making improper paymentsto officials or others for the purpose of obtaining or retaining business. While our policies mandatecompliance with these anti-bribery laws, we operate in many parts of the world that have experiencedcorruption to some degree and, in certain circumstances, strict compliance with anti-bribery laws mayconflict with local customs and practices. We train our personnel concerning anti-bribery laws and issues,and we also inform our partners, subcontractors, suppliers, agents and others who work for us or on ourbehalf that they must comply with anti-bribery law requirements. We also have procedures and controls inplace to monitor compliance. We cannot assure that our internal controls and procedures always willprotect us from the possible reckless or criminal acts committed by our employees or agents. If we arefound to be liable for anti-bribery law violations (either due to our own acts or our inadvertence, or due tothe acts or inadvertence of others including our partners, agents, subcontractors or suppliers), we couldsuffer from criminal or civil penalties or other sanctions, including contract cancellations or debarment,and loss of reputation, any of which could have a material adverse effect on our business. Litigation orinvestigations relating to alleged or suspected violations of anti-bribery laws, even if ultimately suchlitigation or investigations demonstrate that we did not violate anti-bribery laws, could be costly and coulddivert management’s attention away from other aspects of our business.
Damage to our reputation could in turn cause damage to our business.
Maintaining our reputation is critical to attracting and maintaining our clients and other businessrelationships. If we fail to address issues that may give rise to reputational risk, we could significantly harmour business. These issues may include, but are not limited to, any of the risk factors discussed in thisItem 1A, including compliance with laws, project execution risk, cyber security and safety. If our reputationis harmed, we could suffer a number of adverse consequences, such as:
• reduced demand for our services;
23

• lack of investor confidence;
• less favorable credit rating;
• the inability to attract and retain qualified employees;
• a loss of or reduction in scope of current project contracts and fewer contract awards;
• less favorable contract terms;
• increased litigation and costs; and
• heightened regulatory scrutiny.
These and other consequences resulting from damage to our reputation could have a material adverseeffect on our business, financial condition, results of operations and cash flows.
New or changing legal requirements, including those relating to climate change, could adversely affect our operatingresults.
Our business and results of operations could be affected by the passage of climate change, defense,environmental, infrastructure, trade and other laws, policies and regulations. For example, growingconcerns about climate change may result in the imposition of additional environmental regulations.Legislation, international protocols or treaties, regulation or other restrictions on emissions could affectour clients, including those who (a) are involved in the exploration, production or refining of fossil fuelssuch as our energy and chemicals clients, (b) emit greenhouse gases through the combustion of fossil fuels,including some of our power business clients or (c) emit greenhouse gases through the mining,manufacture, utilization or production of materials or goods. Such legislation or restrictions could increasethe costs of projects for us and our clients or, in some cases, prevent a project from going forward, therebypotentially reducing the need for our services which could in turn have a material adverse effect on ouroperations and financial condition. However, legislation and regulation regarding climate change couldalso increase the pace of development of carbon capture and storage projects, alternative transportation,alternative energy facilities, such as wind farms or nuclear reactors or incentivize increased implementationof clean fuel projects which could positively impact the demand for our services. As another example, theimplementation of trade barriers, countervailing duties, or border taxes, or the addition, relaxation orrepeal of laws, policies and regulations regarding the industries and sectors in which we work could resultin a decline in demand for our services, or may make the manner in which we perform our services,especially from outside the United States, less cost efficient. Furthermore, changes to existing tradeagreements may impact our business operations. We cannot predict when or whether any of these variouslegislative and regulatory proposals may become law or what their effect will be on us and our customers.
We could be adversely impacted if we fail to comply with domestic and international import and export laws.
Our global operations require importing and exporting goods and technology across internationalborders on a regular basis. Our policies mandate strict compliance with U.S. and foreign internationaltrade laws. To the extent we export technical services, data and products outside of the United States, weare subject to U.S. and international laws and regulations governing international trade and exportsincluding but not limited to the International Traffic in Arms Regulations, the Export AdministrationRegulations and trade sanctions against embargoed countries, which are administered by the Office ofForeign Assets Control with the Department of Treasury. From time to time, we identify certaininadvertent or potential export or related violations. These violations may include, for example, transferswithout required governmental authorization. A failure to comply with these laws and regulations couldresult in civil or criminal sanctions, including the imposition of fines, the denial of export privileges, andsuspension or debarment from participation in U.S. government contracts.
24

Past and future environmental, safety and health regulations could impose significant additional cost on us thatreduce our profits.
We are subject to numerous environmental laws and health and safety regulations. Our projects caninvolve the handling of hazardous and other highly regulated materials, including nuclear and otherradioactive materials, which, if improperly handled or disposed of, could subject us to civil and criminalliabilities. It is impossible to reliably predict the full nature and effect of judicial, legislative or regulatorydevelopments relating to health and safety regulations and environmental protection regulationsapplicable to our operations. The applicable regulations, as well as the length of time available to complywith those regulations, continue to develop and change. The cost of complying with rulings andregulations, satisfying any environmental remediation requirements for which we are found responsible, orsatisfying claims or judgments alleging personal injury, property damage or natural resource damages as aresult of exposure to or contamination by hazardous materials, including as a result of commodities such aslead or asbestos-related products, could be substantial, may not be covered by insurance, could reduce ourprofits, and therefore, could materially impact our future operations.
Our company, along with our investment in NuScale, is subject to a number of regulations such as theU.S. Nuclear Regulatory Commission and non-U.S. regulatory bodies, such as the International AtomicEnergy Commission and the European Union, which can have a substantial effect on our nuclearoperations and investments. Delays in receiving necessary approvals, permits or licenses, the failure tomaintain sufficient compliance programs, and other problems encountered during construction (includingchanges to such regulatory requirements) could significantly increase our costs or have an adverse effect onour results of operations, our return on investments, our financial position and our cash flow.
A substantial portion of our business is generated either directly or indirectly as a result of federal,state, local and foreign laws and regulations related to environmental matters. A reduction in the numberor scope of these laws or regulations, or changes in government policies regarding the funding,implementation or enforcement of such laws and regulations, could significantly reduce the size of one ofour markets and limit our opportunities for growth or reduce our revenue below current levels.
If we do not have adequate indemnification for our nuclear services, it could adversely affect our business andfinancial condition.
We provide services to the U.S. Department of Energy and the nuclear energy industry in theon-going maintenance and modification of nuclear facilities as well as decontamination anddecommissioning activities of nuclear plants. The Price-Anderson Act generally indemnifies partiesperforming services to nuclear power plants and Department of Energy contractors; however, not allactivities we engage in on behalf of our clients are covered. Thus, if the Price-Anderson Actindemnification protections do not apply to our services, or if the exposure occurs outside of the UnitedStates in a region that does not have protections comparable to the Price-Anderson Act, our business andfinancial condition could be adversely affected by our client’s refusal to contract with us, by our inability toobtain commercially reasonable insurance or third party indemnification, or by the potentially significantmonetary damages we could incur.
Through a joint venture, we also provide services to the United Kingdom’s Nuclear DecommissioningAgency (‘‘NDA’’) relating to the clean up and decommissioning of certain public sector sites in the UnitedKingdom. Indemnification provisions under the Nuclear Installations Act of 1965 available to nuclear sitelicensees, the Atomic Energy Authority and the Crown, and contractual indemnification from the NDA donot apply to every liability that we might incur while performing services for the NDA. If the NuclearInstallations Act of 1965 and contractual indemnification provisions do not apply to our services or if ourexposure occurs outside of the United Kingdom, our business and financial condition could be adverselyaffected.
25

Foreign currency risks could have an adverse impact on company revenue, earnings and/or backlog.
Certain of our contracts subject us to foreign currency risk, particularly when project contract revenueis denominated in a currency different than the contract costs. In addition, our operational cash flows andcash balances, though predominately held in U.S. dollars, may consist of different currencies at variouspoints in time in order to execute our project contracts globally and meet transactional requirements. Wemay attempt to minimize our exposure to foreign currency risk by obtaining contract provisions thatprotect us from foreign currency fluctuations and/or by implementing hedging strategies utilizingderivatives as hedging instruments. However, these actions may not always eliminate all foreign currencyrisk, and as a result, our profitability on certain projects could be affected.
Our monetary assets and liabilities denominated in nonfunctional currencies are subject to currencyfluctuations when measured period to period for financial reporting purposes. In addition, the U.S. dollarvalue of our backlog may from time to time increase or decrease significantly due to foreign currencyvolatility. We may also be exposed to limitations on our ability to reinvest earnings from operations in onecountry to fund our operations in other countries.
The company’s reported revenue and earnings of foreign subsidiaries could be affected by foreigncurrency volatility. Revenue, cost and earnings of foreign subsidiaries with functional currencies other thanthe U.S. dollar are translated into U.S. dollars for reporting purposes. If the U.S. dollar appreciates againsta foreign subsidiary’s non-U.S. dollar functional currency, the company would report less revenue, cost andearnings in U.S. dollars than it would have had the U.S. dollar depreciated against the same foreigncurrency or if there had been no change in the exchange rate.
Our business may be negatively impacted if we are unable to adequately protect intellectual property rights.
Our success is dependent, in part, on our ability to differentiate our services through our technologiesand know-how. This success includes the ability of companies in which we invest, such as NuScale toprotect their intellectual property rights. We rely principally on a combination of patents, copyrights, tradesecrets, confidentiality agreements and other contractual arrangements to protect our interests. However,these methods only provide a limited amount of protection and may not adequately protect our interests.Our employees, contractors and joint venture partners are subject to confidentiality obligations, but thisprotection may be inadequate to deter or prevent misappropriation of our confidential information and/orinfringement of our intellectual property rights. This can be especially true in certain foreign countries thatdo not protect intellectual property rights to the same extent as the laws of the United States, or when ourjoint venture partner is a competitor who will gain access to our procedures and know-how while workingwith us in the performance of services.
Our clients require broad ownership rights in the work product and other materials we deliver. If weare not able to retain ownership of our pre-existing intellectual property and improvements thereto, it mayaffect our ability to provide similar services to other clients in the future, which ultimately, could have amaterial adverse effect on our operations.
We cannot provide assurances that others will not independently develop technology substantiallysimilar to our trade secret technology or that we can successfully preserve our intellectual property rightsin the future. Our intellectual property rights could be invalidated, circumvented, challenged or infringedupon. Litigation to determine the scope of intellectual property rights, even if ultimately successful, couldbe costly and could divert management’s attention away from other aspects of our business.
In addition, our clients or other third parties may also provide us with their technology andintellectual property. There is a risk that we may not sufficiently protect our or their information fromimproper use or dissemination and, as a result, could be subject to claims and litigation and resultingliabilities, loss of contracts or other consequences that could have an adverse impact on our business,financial condition and results of operation.
We also hold licenses from third parties which may be utilized in our business operations. If we are nolonger able to license such technology on commercially reasonable terms or otherwise, our business and
26
financial performance could be adversely affected. When we license our intellectual property to thirdparties, the scope of such license grant is limited to a particular plant or project. If such third party exceedsthe scope of the license grant, and if we are unable to detect unauthorized use of our intellectual propertyor otherwise take appropriate steps to enforce our rights, our revenue and margins will be adverselyimpacted, and the value of our intellectual property portfolio may decline thereby adversely affecting ourcompetitive advantage and ability to win future work.
Adverse credit and financial market conditions could impair our, our clients’ and our partners’ borrowing capacity,which could negatively affect our business operations, profits and growth objectives.
Our ongoing ability to generate cash is important for the funding of our continuing operations,investing in joint ventures, the servicing of our indebtedness, paying dividends to stockholders and makingacquisitions. To the extent that existing cash balances and cash flow from operations, together withborrowing capacity under our existing credit facilities, are insufficient to make investments or acquisitionsor provide needed working capital, we may require additional financing from other sources. Our ability toobtain such additional financing in the future will depend in part upon prevailing capital marketconditions, as well as conditions in our business and our operating results; and those factors may affect ourefforts to arrange additional financing on terms that are acceptable to us. Furthermore, if global economic,political or other market conditions adversely affect the financial institutions which provide credit to us, itis possible that our ability to draw upon our credit facilities may be impacted. If adequate funds are notavailable, or are not available on acceptable terms, we may not be able to make future investments, takeadvantage of acquisitions or other opportunities, or respond to competitive challenges.
In addition, adverse credit and financial market conditions could also adversely affect our clients’ andour partners’ borrowing capacity, which support the continuation and expansion of projects worldwide, andcould result in contract cancellations or suspensions, project award and execution delays, payment delaysor defaults by our clients. These disruptions could materially impact our backlog and profits. If we extend asignificant portion of credit to our clients or projects in a specific geographic region or industry, we mayexperience higher levels of collection risk or non-payment if those clients are impacted by factors specificto their geographic industry or region. Finally, our business has traditionally lagged recoveries in thegeneral economy, and therefore may not recover as quickly as the economy as a whole.
Our employees work on projects that are inherently dangerous and in locations where there are high security risks,and a failure to maintain a safe work site could result in significant losses.
We often work on large-scale and complex projects, frequently in geographically remote or high risklocations that are subject to political, social or economic risks, or war or civil unrest. In those locationswhere we have employees or operations, we may expend significant efforts and incur substantial securitycosts to maintain the safety of our personnel. In addition, our project sites can place our employees andothers near large equipment, dangerous processes or substances or highly regulated materials, and inchallenging environments. Safety is a primary focus of our business and is critical to our reputation andperformance. Often, we are responsible for safety on the project sites where we work. Many of our clientsrequire that we meet certain safety criteria to be eligible to bid on contracts, and some of our contract feesor profits are subject to satisfying safety criteria. Unsafe work conditions also have the potential ofincreasing employee turnover, increasing project costs and raising our operating costs. If we fail toimplement appropriate safety procedures and/or if our procedures fail, our employees or others may sufferinjuries or even loss of life, the completion of a project could be delayed and we could experienceinvestigations or litigation. Although we maintain functional groups whose primary purpose is toimplement effective health, safety and environmental procedures throughout our company, the failure tocomply with such procedures, client contracts or applicable regulations could subject us to losses andliability. And, despite these activities, in these locations and at these sites, we cannot guarantee the safetyof our personnel, nor damage to or loss of work, equipment or supplies.
27

Our continued success requires us to hire and retain qualified personnel.
The success of our business is dependent upon being able to attract and retain personnel, includingengineers, project management and craft employees around the globe, who have the necessary andrequired experience and expertise, and who will perform these services at a reasonable and competitiverate. Competition for these and other experienced personnel is intense. It may be difficult to attract andretain qualified individuals with the expertise and in the timeframe demanded by our clients. In certaingeographic areas, for example, we may not be able to satisfy the demand for our services because of ourinability to successfully hire and retain qualified personnel. Also, it may be difficult to replace personnelwho hold government granted eligibility that may be required to obtain certain government projects and/orwho have significant government contract experience.
As some of our executives and other key personnel approach retirement age, we need to provide forsmooth transitions, which may require that we devote time and resources to identify and integrate newpersonnel into these leadership roles and other key positions. If we are unable to attract and retain asufficient number of skilled personnel or effectively implement appropriate succession plans, our ability topursue projects may be adversely affected, the costs of executing our existing and future projects mayincrease and our financial performance may decline.
In addition, the cost of providing our services, including the extent to which we utilize our workforce,affects our profitability. For example, the uncertainty of contract award timing can present difficulties inmatching our workforce size with our contracts. If an expected contract award is delayed or not received,we could incur costs resulting from excess staff, reductions in staff, or redundancy of facilities that couldhave a material adverse impact on our business, financial conditions and results of operations.
We may be unable to win new contract awards if we cannot provide clients with letters of credit, bonds or othersecurity or credit enhancements.
In certain of our business lines it is industry practice for customers to require surety bonds, letters ofcredit, bank guarantees or other forms of credit enhancement. Surety bonds, letters of credit or guaranteesindemnify our clients if we fail to perform our obligations under our contracts. Historically, we have hadstrong surety bonding capacity due to our industry leading credit rating, but, bonding is provided at thesurety’s sole discretion. In addition, because of the overall limitations in worldwide bonding capacity, wemay find it difficult to find sufficient surety bonding capacity to meet our total surety bonding needs. Withregard to letters of credit, while we have had adequate capacity under our existing credit facilities, anycapacity that may be required in excess of our credit limits would be at our lenders’ sole discretion andtherefore is not certain. Failure to provide credit enhancements on terms required by a client may result inan inability to compete for or win a project.
Any acquisitions, dispositions or other investments may present risks or uncertainties.
We have made and expect to continue to pursue selective acquisitions or dispositions of businesses, orinvestments in strategic business opportunities. We cannot provide assurances that we will be able to locatesuitable acquisitions or investments, or that we will be able to consummate any such transactions on termsand conditions acceptable to us, or that such transactions will be successful. Acquisitions may bring us intobusinesses we have not previously conducted or jurisdictions where we have had little to no prioroperations experience and thus expose us to additional business risks that are different from those we havetraditionally experienced. We also may encounter difficulties identifying all significant risks during our duediligence activities or integrating acquisitions and successfully managing the growth we expect toexperience from these acquisitions. We may not be able to successfully cause a buyer of a divested businessto assume the liabilities of that business or, even if such liabilities are assumed, we may have difficultiesenforcing our rights, contractual or otherwise, against the buyer. We may invest in companies or businessesthat fail, causing a loss of all or part of our investment. In addition, if we determine that another-than-temporary decline in the fair value exists for a company in which we have invested, we may haveto write down that investment to its fair value and recognize the related write-down as an investment loss.
28
For cases in which we are required under the equity method or the proportionate consolidation method ofaccounting to recognize a proportionate share of another company’s income or loss, such income or lossmay impact our earnings.
Although we expect to realize certain benefits as a result of our acquisitions and investments, there is a possibilitythat we may be unable to successfully integrate our businesses or capitalize upon our investments in order to realizethe anticipated benefits of these acquisitions and investments or do so within the intended timeframe.
Whenever we make an acquisition or investment, we have and will continue to devote significantmanagement attention and resources to integrating or aligning the business practices and operations ofcompanies we acquire or invest in. Difficulties we may encounter in the integration/alignment processinclude:
• A delay in the integration or alignment of management teams, strategies, operations, products andservices;
• Diversion of the attention of management as a result of the acquisition or investment;
• The consequences of a change in tax treatment, including the costs of integration/consolidation andcompliance, and the possibility that the anticipated benefits of the acquisition/investment will not berealized;
• Differences in corporate culture and management philosophies;
• The ability to retain key personnel;
• The challenges of integrating or aligning complex systems, technology, networks and other assetsinto or to be compatible with ours in a way that minimizes any adverse effects on the business; and
• Potential unknown liabilities and unforeseen increased expenses or delays associated with theacquisition or investment, including the costs to integrate or consolidate beyond current estimates.
Any of these factors could affect each company’s ability to maintain business relationships or ourability to achieve the anticipated benefits of the acquisition or investment, or could reduce our earnings orotherwise adversely affect our business and financial results.
Our actual results could differ from the assumptions and estimates used to prepare our financial statements.
In preparing our financial statements, we are required under U.S. generally accepted accountingprinciples to make estimates and assumptions as of the date of the financial statements. These estimatesand assumptions affect the reported values of assets, liabilities, revenue and expenses, and the disclosure ofcontingent assets and liabilities. Areas requiring significant estimates by our management include:
• recognition of contract revenue, costs, profits or losses in applying the principles ofpercentage-of-completion accounting;
• recognition of revenues related to project incentives or awards we expect to receive;
• recognition of recoveries under contract change orders or claims;
• estimated amounts for expected project losses, warranty costs, contract close-out or other costs;
• collectability of billed and unbilled accounts receivable and the need and amount of any allowancefor doubtful accounts;
• asset valuations;
• income tax provisions and related valuation allowances;
• determination of expense and potential liabilities under pension and other post-retirement benefitprograms; and
29

• accruals for other estimated liabilities, including litigation and insurance revenues/reserves.
Our actual business and financial results could differ from our estimates of such results, which couldhave a material negative impact on our financial condition and reported results of operations.
It can be very difficult or expensive to obtain the insurance we need for our business operations.
As part of business operations we maintain insurance both as a corporate risk management strategyand to satisfy the requirements of many of our contracts. Although in the past we have been generally ableto cover our insurance needs, there can be no assurances that we can secure all necessary or appropriateinsurance in the future, or that such insurance can be economically secured. For example, catastrophicevents can result in decreased coverage limits, more limited coverage, increased premium costs ordeductibles. We also monitor the financial health of the insurance companies from which we procureinsurance, and this is one of the factors we take into account when purchasing insurance. Our insurance ispurchased from a number of the world’s leading providers, often in layered insurance or quota sharearrangements. If any of our third party insurers fail, abruptly cancel our coverage or otherwise cannotsatisfy their insurance requirements to us, then our overall risk exposure and operational expenses couldbe increased and our business operations could be interrupted.
In the event we make acquisitions using our stock as consideration, stockholders’ ownership percentage would bediluted.
We intend to grow our business not only organically but also potentially through acquisitions. Onemethod of paying for acquisitions or to otherwise fund our corporate initiatives is through the issuance ofadditional equity securities. If we do issue additional equity securities, the issuance would have the effect ofdiluting our earnings per share and stockholders’ percentage ownership.
Delaware law and our charter documents may impede or discourage a takeover or change of control.
Fluor is a Delaware corporation. Various anti-takeover provisions under Delaware law imposeimpediments on the ability of others to acquire control of us, even if a change of control would bebeneficial to our stockholders. In addition, certain provisions of our charters and bylaws may impede ordiscourage a takeover. For example:
• stockholders may not act by written consent;
• there are various restrictions on the ability of a stockholder to call a special meeting or to nominatea director for election; and
• our Board of Directors can authorize the issuance of preferred shares.
These types of provisions in our charters and bylaws could also make it more difficult for a third partyto acquire control of us, even if the acquisition would be beneficial to our stockholders. Accordingly,stockholders may be limited in the ability to obtain a premium for their shares.
Item 1B. Unresolved Staff Comments
None.
Item 2. Properties
Major Facilities
Operations of Fluor and its subsidiaries are conducted at both owned and leased properties indomestic and foreign locations totaling approximately 7.2 million rentable square feet. Our executiveoffices are located at 6700 Las Colinas Boulevard, Irving, Texas. As our business and the mix of structuresare constantly changing, the extent of utilization of the facilities by particular segments cannot beaccurately stated. In addition, certain owned or leased properties of Fluor and its subsidiaries are leased or
30

subleased to third party tenants. While we have operations worldwide, the following table describes thelocation and general character of our more significant existing facilities:
Location Interest
United States:Greenville, South Carolina . . . . . . . . . . . . . . . . . . . . . . . . . . . . . . . . . . . . . . . OwnedHouston (Sugar Land), Texas . . . . . . . . . . . . . . . . . . . . . . . . . . . . . . . . . . . . . LeasedIrving, Texas (Corporate Headquarters) . . . . . . . . . . . . . . . . . . . . . . . . . . . . . OwnedSouthern California (Aliso Viejo and Long Beach) . . . . . . . . . . . . . . . . . . . . . Leased
Canada:Calgary, Alberta . . . . . . . . . . . . . . . . . . . . . . . . . . . . . . . . . . . . . . . . . . . . . . OwnedVancouver, British Columbia . . . . . . . . . . . . . . . . . . . . . . . . . . . . . . . . . . . . . Leased
Latin America:Buenos Aires, Argentina . . . . . . . . . . . . . . . . . . . . . . . . . . . . . . . . . . . . . . . . LeasedMexico City, Mexico . . . . . . . . . . . . . . . . . . . . . . . . . . . . . . . . . . . . . . . . . . . LeasedSantiago, Chile . . . . . . . . . . . . . . . . . . . . . . . . . . . . . . . . . . . . . . . . . . . . . . . Owned and Leased
Europe, Africa and Middle East:Al Khobar, Saudi Arabia . . . . . . . . . . . . . . . . . . . . . . . . . . . . . . . . . . . . . . . . OwnedAmsterdam, the Netherlands . . . . . . . . . . . . . . . . . . . . . . . . . . . . . . . . . . . . . OwnedFarnborough, England . . . . . . . . . . . . . . . . . . . . . . . . . . . . . . . . . . . . . . . . . . Owned and LeasedGliwice, Poland . . . . . . . . . . . . . . . . . . . . . . . . . . . . . . . . . . . . . . . . . . . . . . . OwnedJohannesburg, South Africa . . . . . . . . . . . . . . . . . . . . . . . . . . . . . . . . . . . . . . Leased
Asia/Asia Pacific:Cebu, the Philippines . . . . . . . . . . . . . . . . . . . . . . . . . . . . . . . . . . . . . . . . . . LeasedManila, the Philippines . . . . . . . . . . . . . . . . . . . . . . . . . . . . . . . . . . . . . . . . . Owned and LeasedNew Delhi, India . . . . . . . . . . . . . . . . . . . . . . . . . . . . . . . . . . . . . . . . . . . . . . LeasedPerth, Australia . . . . . . . . . . . . . . . . . . . . . . . . . . . . . . . . . . . . . . . . . . . . . . . LeasedShanghai, China . . . . . . . . . . . . . . . . . . . . . . . . . . . . . . . . . . . . . . . . . . . . . . Leased
We also lease or own a number of sales, administrative and field construction offices, warehouses andequipment yards strategically located throughout the world. In addition, through various joint ventures, weown or lease fabrication yards in China, Mexico, Canada and Russia.
Item 3. Legal Proceedings
Fluor and its subsidiaries, as part of their normal business activities, are parties to a number of legalproceedings and other matters in various stages of development. Management periodically assesses ourliabilities and contingencies in connection with these matters based upon the latest information available.We disclose material pending legal proceedings pursuant to Securities and Exchange Commission rulesand other pending matters as we may determine to be appropriate.
For information on legal proceedings and matters in dispute, see ‘‘14. Contingencies andCommitments’’ in the Notes to Consolidated Financial Statements.
Item 4. Mine Safety Disclosures
Not applicable.
31

PART II
Item 5. Market for Registrant’s Common Equity, Related Stockholder Matters and Issuer Purchases of EquitySecurities
Our common stock is traded on the New York Stock Exchange under the symbol ‘‘FLR.’’ Thefollowing table sets forth for the quarters indicated the high and low sales prices of our common stock, asreported in the Consolidated Transactions Reporting System, and the cash dividends paid per share ofcommon stock.
Common Stock
Price Range DividendsHigh Low Per Share
Year Ended December 31, 2017Fourth Quarter . . . . . . . . . . . . . . . . . . . . . . . . . . . . . . . . . . . . . . . . . . $52.03 $42.00 $0.21Third Quarter . . . . . . . . . . . . . . . . . . . . . . . . . . . . . . . . . . . . . . . . . . . $46.78 $37.04 $0.21Second Quarter . . . . . . . . . . . . . . . . . . . . . . . . . . . . . . . . . . . . . . . . . . $53.03 $43.65 $0.21First Quarter . . . . . . . . . . . . . . . . . . . . . . . . . . . . . . . . . . . . . . . . . . . . $58.37 $49.85 $0.21
Year Ended December 31, 2016Fourth Quarter . . . . . . . . . . . . . . . . . . . . . . . . . . . . . . . . . . . . . . . . . . $57.78 $44.05 $0.21Third Quarter . . . . . . . . . . . . . . . . . . . . . . . . . . . . . . . . . . . . . . . . . . . $54.45 $47.91 $0.21Second Quarter . . . . . . . . . . . . . . . . . . . . . . . . . . . . . . . . . . . . . . . . . . $55.69 $45.80 $0.21First Quarter . . . . . . . . . . . . . . . . . . . . . . . . . . . . . . . . . . . . . . . . . . . . $55.48 $39.48 $0.21
Any future cash dividends will depend upon our results of operations, financial condition, cashrequirements, availability of surplus and such other factors as our Board of Directors may deem relevant.See ‘‘Item 1A. — Risk Factors.’’
At February 16, 2018, there were 139,907,306 shares outstanding and 4,687 stockholders of record ofthe company’s common stock. The company estimates there were an additional 167,720 stockholderswhose shares were held by banks, brokers or other financial institutions at February 6, 2018.
Issuer Purchases of Equity Securities
The following table provides information as of the three months ended December 31, 2017 aboutpurchases by the company of equity securities that are registered by the company pursuant to Section 12 ofthe Exchange Act.
MaximumTotal Number of Number of
Shares Purchased as Shares that MayTotal Number Average Price Part of Publicly Yet Be Purchased
of Shares Paid per Announced Plans Under Plans orPeriod Purchased Share or Programs Programs(1)
October 1–October 31, 2017 . . . . . . . . . — $ — — 11,610,219November 1–November 30, 2017 . . . . . — — — 11,610,219December 1–December 31, 2017 . . . . . . — — — 11,610,219
Total . . . . . . . . . . . . . . . . . . . . . . . . — $ — —
(1) The share repurchase program was originally announced on November 3, 2011 for 12,000,000 sharesand has been amended to increase the size of the program by an aggregate 34,000,000 shares, mostrecently in February 2016 with an increase of 10,000,000 shares. The company continues to repurchaseshares from time to time in open market transactions or privately negotiated transactions, includingthrough pre-arranged trading programs, at its discretion, subject to market conditions and otherfactors and at such time and in amounts that the company deems appropriate.
32

Item 6. Selected Financial Data
The following table presents selected financial data for the last five years. This selected financial datashould be read in conjunction with the consolidated financial statements and related notes included in‘‘Item 15. — Exhibits and Financial Statement Schedules.’’ Amounts are expressed in millions, except forper share and employee information:
Year Ended December 31,
2017 2016 2015 2014 2013
CONSOLIDATED OPERATING RESULTS
Total revenue $19,521.0 $19,036.5 $18,114.0 $21,531.6 $27,351.6Earnings from continuing operations before taxes 386.4 546.6 726.6 1,204.9 1,177.6
Amounts attributable to Fluor Corporation:Earnings from continuing operations(1) $ 191.4 281.4 $ 418.2 $ 715.5 $ 667.7Loss from discontinued operations, net of taxes — — (5.7) (204.6) —
Net earnings(1) $ 191.4 $ 281.4 $ 412.5 $ 510.9 $ 667.7
Basic earnings (loss) per share attributable to FluorCorporation:Earnings from continuing operations(1) $ 1.37 $ 2.02 $ 2.89 $ 4.54 $ 4.11Loss from discontinued operations, net of taxes — — (0.04) (1.30) —
Net earnings(1) $ 1.37 $ 2.02 $ 2.85 $ 3.24 $ 4.11
Diluted earnings (loss) per share attributable to FluorCorporation:Earnings from continuing operations(1) $ 1.36 $ 2.00 $ 2.85 $ 4.48 $ 4.06Loss from discontinued operations, net of taxes — — (0.04) (1.28) —
Net earnings(1) $ 1.36 $ 2.00 $ 2.81 $ 3.20 $ 4.06
Cash dividends per common share declared $ 0.84 $ 0.84 $ 0.84 $ 0.84 $ 0.64
Return on average shareholders’ equity(2) 5.9% 9.1% 13.6% 20.1% 18.6%
CONSOLIDATED FINANCIAL POSITIONCurrent assets $ 5,601.3 $ 5,610.3 $ 5,105.4 $ 5,417.8 $ 5,757.9Current liabilities 3,574.2 3,816.0 2,935.4 3,330.9 3,407.2
Working capital 2,027.1 1,794.3 2,170.0 2,086.9 2,350.7Property, plant and equipment, net 1,093.7 1,017.2 892.3 980.3 967.0Total assets 9,327.7 9,216.4 7,625.4 8,187.5 8,320.7Capitalization
1.750% Senior Notes 597.7 523.6 — — —3.375% Senior Notes 496.9 496.0 495.2 494.3 493.53.5% Senior Notes 493.3 492.4 491.4 490.4 —1.5% Convertible Senior Notes — — — 18.3 18.4Revolving Credit Facility — 52.7 — — —Other debt obligations 31.1 35.5 — 10.4 11.4Shareholders’ equity 3,342.3 3,125.2 2,997.3 3,110.9 3,757.0
Total capitalization 4,961.3 4,725.4 3,983.9 4,124.3 4,280.3
Common shares outstanding at year end 139.9 139.3 139.0 148.6 161.3
OTHER DATANew awards $12,565.6 $20,959.2 $21,846.2 $28,831.1 $25,085.6Backlog at year end(3) 30,915.4 45,011.9 44,726.1 42,481.5 34,907.1Capital expenditures 283.1 235.9 240.2 324.7 288.5Cash provided by operating activities 602.0 705.9 849.1 642.6 788.9Cash utilized by investing activities (484.3) (741.4) (66.5) (199.1) (234.6)Cash utilized by financing activities (215.5) (10.4) (728.2) (666.4) (369.6)Employees at year end
Salaried employees 31,951 28,681 27,195 27,643 29,425Craft/hourly employees 24,755 32,870 11,563 9,865 8,704
Total employees 56,706 61,551 38,758 37,508 38,129(1) Net earnings attributable to Fluor Corporation in 2017 included pre-tax charges totaling $260 million (or $1.18 per diluted
share) resulting from forecast revisions for estimated cost growth at three fixed-price, gas-fired power plant projects in thesoutheastern United States, pre-tax charges totaling $44 million (or $0.20 per diluted share) resulting from forecast revisions
33

for estimated cost increases on a downstream project and the adverse impact of recently enacted U.S. tax reform legislationof $37 million (or $0.27 per diluted share).
Net earnings attributable to Fluor Corporation in 2016 included a pre-tax charge of $265 million (or $1.20 per diluted share)related to forecast revisions for estimated cost increases on a petrochemicals project in the United States.
Net earnings attributable to Fluor Corporation in 2015 included a pre-tax pension settlement charge of $240 million (or$1.04 per diluted share), a pre-tax loss of $60 million (or $0.26 per diluted share) resulting from forecast revisions for a largegas-fired power plant in Brunswick County, Virginia, and a pre-tax gain of $68 million (or $0.30 per diluted share) related tothe sale of 50 percent of the company’s ownership interest in its principal operating subsidiary in Spain to facilitate theformation of an Energy, Chemicals & Mining joint venture. Net earnings attributable to Fluor Corporation in 2015 alsoincluded an after-tax loss from discontinued operations of $6 million (or $0.04 per diluted share) resulting from thesettlement of lead exposure cases related to the previously divested lead business of St. Joe Minerals Corporation and TheDoe Run Company in Herculaneum, Missouri and the payment of legal fees incurred in connection with a pendingindemnification action against the buyer of the lead business for these settlements and others. The tax effect associated withthis loss was $3 million.
Net earnings attributable to Fluor Corporation in 2014 included an after-tax loss from discontinued operations of$205 million (or $1.28 per diluted share) in connection with the reassessment of estimated loss contingencies related to thedivested lead business. The tax effect associated with this loss was $112 million.
Net earnings attributable to Fluor Corporation in 2013 included pre-tax income of $57 million (or $0.22 per diluted share)resulting from the favorable resolution of various issues with the U.S. government related to 2001 - 2013. Of this amount,$31 million was the result of resolving challenges as to the reimbursability of certain costs, $11 million was the result of afavorable court ruling that resolved certain disputed items and $15 million was related to the closeout and final disposition ofother matters.
See ‘‘Item 7. — Management’s Discussion and Analysis of Financial Condition and Results of Operations’’ on pages 34 to 51and Notes to Consolidated Financial Statements on pages F-8 to F-52 for additional information relating to significant itemsaffecting the results of operations for 2015 - 2017.
(2) Return on average shareholders’ equity is calculated based on net earnings from continuing operations attributable to FluorCorporation divided by the average shareholders’ equity of the five most recent quarters.
(3) Total backlog included $741 million, $2.7 billion, $912 million, $2.1 billion and $983 million of unfunded portion ofmulti-year government contracts new awards as of December 31, 2017, 2016, 2015, 2014 and 2013, respectively.
Item 7. Management’s Discussion and Analysis of Financial Condition and Results of Operations
Introduction
The following discussion and analysis is provided to increase the understanding of, and should be readin conjunction with, the Consolidated Financial Statements and accompanying Notes. For purposes ofreviewing this document, ‘‘segment profit’’ is calculated as revenue less cost of revenue and earningsattributable to noncontrolling interests excluding: corporate general and administrative expense; interestexpense; interest income; domestic and foreign income taxes; other non-operating income and expenseitems; and loss from discontinued operations. For a reconciliation of total segment profit to earnings fromcontinuing operations before taxes, see Note 17 in the Notes to Consolidated Financial Statements.
Results of Operations
Consolidated revenue was $19.5 billion, $19.0 billion and $18.1 billion during 2017, 2016 and 2015,respectively. During both 2017 and 2016, revenue growth in the Industrial, Infrastructure & Power,Government and Diversified Services segments was partially offset by revenue declines in the Energy,Chemicals & Mining segment.
Earnings from continuing operations before taxes for 2017 decreased 29 percent to $386 million from$547 million in 2016. Earnings in 2017 were adversely affected by pre-tax charges totaling $304 millionresulting from forecast revisions for estimated cost growth at three fixed-price, gas-fired power plantprojects in the southeastern United States and a downstream project. Earnings in 2016 were adverselyaffected by pre-tax charges totaling $265 million related to forecast revisions for estimated cost increaseson a petrochemicals project in the United States. Apart from the adverse effects of the forecast revisions inboth years, earnings in 2017 declined primarily in the Energy, Chemicals & Mining segment.
34
Earnings from continuing operations before taxes for 2016 decreased 25 percent to $547 million from$727 million in 2015. As discussed above, earnings in 2016 were adversely affected by pre-tax chargestotaling $265 million related to forecast revisions for estimated cost increases on a petrochemicals project,which were partially offset by higher contributions from power projects in the Industrial, Infrastructure &Power segment. Earnings from continuing operations before taxes for 2016 were also affected by highercorporate general and administrative expenses.
During 2015, the company settled the remaining obligations associated with the U.S. defined benefitpension plan (the ‘‘U.S. plan’’). Plan participants received vested benefits from the plan assets by electingeither a lump-sum distribution, roll-over contribution to other defined contribution or individualretirement plans, or an annuity contract with a third-party provider. As a result of the settlement, thecompany was relieved of any further obligation. During 2015, the company recorded a pension settlementcharge of $240 million which consisted primarily of unrecognized actuarial losses included in accumulatedother comprehensive loss.
As discussed in Note 2 of the Notes to Consolidated Financial Statements, the company recorded anafter-tax loss from discontinued operations of $6 million (net of taxes of $3 million) during 2015 resultingfrom the settlement of lead exposure cases and the payment of legal fees related to the divested leadbusiness of St. Joe Minerals Corporation and The Doe Run Company in Herculaneum, Missouri, whichthe company sold in 1994. The company filed suit against the buyer seeking indemnification for allliabilities arising from these lead exposure cases.
The effective tax rate on earnings from continuing operations was 31.6%, 40.1%, and 33.8% for 2017,2016, and 2015, respectively. The effective tax rate for 2017 was unfavorably impacted by a $37 million taxcharge resulting from the enactment on December 22, 2017 of comprehensive tax legislation commonlyreferred to as the Tax Cuts and Jobs Act (the ‘‘Act’’), as further discussed in Note 4 of the Notes toConsolidated Financial Statements. Apart from the impact of the Act, the effective tax rate for 2017benefited from the release of a deferred tax liability as a result of the restructuring of certain internationaloperations and a worthless stock deduction for an insolvent foreign subsidiary. These benefits werepartially offset by the establishment of valuation allowances on certain foreign net operating losscarryforwards.
The 2016 rate was unfavorably impacted by foreign losses without a tax benefit and by an adjustmentto deferred tax assets as a result of the issuance of U.S. Treasury regulations under Internal Revenue CodeSection 987 for foreign currency translation gains and losses. The unfavorable impact was partially offsetby a benefit from the resolution of an IRS audit for tax years 2012 - 2013 and the domestic productionactivities deduction. The 2015 rate was impacted unfavorably by foreign losses without a tax benefit,partially offset by benefits resulting from an IRS settlement for tax years 2004 - 2005 and the conclusion ofan IRS audit for tax years 2009 - 2011. All periods benefitted from earnings attributable to noncontrollinginterests for which income taxes are not typically the responsibility of the company.
Diluted earnings per share from continuing operations in 2017 decreased to $1.36 from $2.00 in 2016.Diluted earnings per share in 2017 were adversely affected by charges totaling $1.38 per diluted shareresulting from forecast revisions for estimated cost growth at the three power plant projects and thedownstream project mentioned above as well as the impact of recently enacted U.S. tax reform legislationof $0.27 per diluted share. Diluted earnings per share from continuing operations in 2016 were adverselyaffected by forecast revisions for estimated cost increases on the petrochemicals project mentioned aboveof $1.20 per diluted share. Diluted earnings per share from continuing operations in 2015 were $2.85,including a pension settlement charge of $1.04 per diluted share.
The company’s results reported by foreign subsidiaries with non-U.S. dollar functional currencies areaffected by foreign currency volatility. When the U.S. dollar appreciates against the non-U.S. dollarfunctional currencies of these subsidiaries, the company’s reported revenue, cost and earnings, aftertranslation into U.S. dollars, are lower than what they would have been had the U.S. dollar depreciatedagainst the same foreign currencies or if there had been no change in the exchange rates.
35

The company’s margins, in some cases, may be favorably or unfavorably impacted by a change in themix of work performed or a change in the amount of materials and customer-furnished materials, whichare accounted for as pass-through costs. Segment profit margins are generally higher during the earlierstages of the project life cycle as project execution activities are more heavily weighted to higher marginengineering activities rather than lower margin construction activities, particularly when there is asignificant amount of materials, including customer-furnished materials, recognized during construction.For example, during 2017, margins in the company’s Energy, Chemicals & Mining segment were adverselyaffected by a shift in the mix of work from higher margin engineering activities to lower marginconstruction activities.
The Energy, Chemicals & Mining segment remains well positioned for new project activity; however,delays in final investment decisions continue to affect the timing of new awards.
Consolidated new awards in 2017 were $12.6 billion compared to $21.0 billion in 2016 and$21.8 billion in 2015. All business segments contributed to the new award activity in 2017, including amining project in Chile, a power restoration project in Puerto Rico, a contract extension for theLOGCAP IV program, a propylene oxide project in Texas and infrastructure projects in the United Statesand the Netherlands. The Energy, Chemicals & Mining; Industrial, Infrastructure & Power; andGovernment segments were the significant drivers of new award activity during 2016, including an awardfor the Tengiz Oil Expansion Project in Kazakhstan which was awarded in the third quarter. The Energy,Chemicals & Mining and Industrial, Infrastructure & Power segments were the major contributors to thenew award activity during 2015. Approximately 53 percent of consolidated new awards for 2017 were forprojects located outside of the United States compared to 46 percent for 2016.
Consolidated backlog was $30.9 billion as of December 31, 2017, $45.0 billion as of December 31,2016, and $44.7 billion as of December 31, 2015. The decrease in backlog at the end of 2017 primarilyresulted from the removal of two nuclear power plant projects for Westinghouse Electric Company LLC(‘‘Westinghouse’’) and an adjustment to limit the contractual term of the Magnox nucleardecommissioning project in the United Kingdom (the ‘‘Magnox RSRL Project’’) to a five year term, as wellas new award activity being outpaced by work performed. The higher backlog at the end of 2016 was due tosignificant new awards and project adjustments in the Energy, Chemicals & Mining and Industrial,Infrastructure & Power segments, partially offset by an adjustment for a liquefied natural gas project thatwas suspended in the third quarter. As of December 31, 2017, approximately 58 percent of consolidatedbacklog related to projects located outside of the United States compared to 48 percent as ofDecember 31, 2016.
On March 1, 2016, the company acquired 100 percent of Stork Holding B.V. (‘‘Stork’’) for anaggregate purchase price of A695 million (or approximately $756 million), including the assumption of debtand other liabilities. Stork, based in the Netherlands, is a global provider of maintenance, modification andasset integrity services associated with large existing industrial facilities in the oil and gas, chemicals,petrochemicals, industrial and power markets. The company paid A276 million (or approximately$300 million) in cash consideration. The operations of Stork are reported in the Diversified Servicessegment below. See Note 18 to the Consolidated Financial Statements for a further discussion of theacquisition.
In February 2016, the company made an initial cash investment of $350 million in COOEC FluorHeavy Industries Co., Ltd. (‘‘CFHI’’), a joint venture in which the company has a 49% ownership interestand Offshore Oil Engineering Co., Ltd., a subsidiary of China National Offshore Oil Corporation, has 51%ownership interest. Through CFHI, the two companies own, operate and manage the Zhuhai FabricationYard in China’s Guangdong province. The company made additional investments of $62 million in 2016and $26 million in 2017 and has a future funding commitment of $52 million.
For a more detailed discussion of the operating performance of each business segment, corporategeneral and administrative expense and other items, see ‘‘— Segment Operations’’ and ‘‘— Corporate, Taxand Other Matters’’ below.
36
Discussion of Critical Accounting Policies and Estimates
The company’s discussion and analysis of its financial condition and results of operations is basedupon its Consolidated Financial Statements, which have been prepared in accordance with accountingprinciples generally accepted in the United States. The company’s significant accounting policies aredescribed in the Notes to Consolidated Financial Statements. The preparation of the ConsolidatedFinancial Statements requires management to make estimates and judgments that affect the reportedamounts of assets, liabilities, revenue and expenses, and related disclosure of contingent assets andliabilities. Estimates are based on information available through the date of the issuance of the financialstatements and, accordingly, actual results in future periods could differ from these estimates. Significantjudgments and estimates used in the preparation of the Consolidated Financial Statements apply to thefollowing critical accounting policies:
Engineering and Construction Contracts Contract revenue is recognized on thepercentage-of-completion method based on contract cost incurred to date compared to total estimatedcontract cost. Contracts are generally segmented between types of services, such as engineering andconstruction, and accordingly, gross margin related to each activity is recognized as those separate servicesare rendered. The percentage-of-completion method of revenue recognition requires the company toprepare estimates of cost to complete for contracts in progress. In making such estimates, judgments arerequired to evaluate contingencies such as potential variances in schedule and the cost of materials, laborcost and productivity, the impact of change orders, liability claims, contract disputes and achievement ofcontractual performance standards. Changes in total estimated contract cost and losses, if any, arerecognized in the period they are determined. Pre-contract costs are expensed as incurred unless they areexpected to be recovered from the client. The majority of the company’s engineering and constructioncontracts provide for reimbursement on a cost-plus, fixed-fee or percentage-fee basis. As of December 31,2017, 63 percent of the company’s backlog was reimbursable while 37 percent was for fixed-price orlump-sum contracts. In certain instances, the company provides guaranteed completion dates and/orachievement of other performance criteria. Failure to meet schedule or performance guarantees couldresult in unrealized incentive fees or liquidated damages. In addition, increases in contract cost can resultin non-recoverable cost which could exceed revenue realized from the projects. The company generallyprovides limited warranties for work performed under its engineering and construction contracts. Thewarranty periods typically extend for a limited duration following substantial completion of the company’swork on a project. Historically, warranty claims have not resulted in material costs incurred, and anyestimated costs for warranties are included in the individual project cost estimates for purposes ofaccounting for long-term contracts.
The company has made claims arising from the performance under its contracts. The companyrecognizes revenue, but not profit, for certain claims (including change orders in dispute and unapprovedchange orders in regard to both scope and price) when it is determined that recovery of incurred cost isprobable and the amounts can be reliably estimated. Under claims accounting (ASC 605-35-25), theserequirements are satisfied when (a) the contract or other evidence provides a legal basis for the claim,(b) additional costs were caused by circumstances that were unforeseen at the contract date and not theresult of deficiencies in the company’s performance, (c) claim-related costs are identifiable and consideredreasonable in view of the work performed, and (d) evidence supporting the claim is objective andverifiable. Cost, but not profit, associated with unapproved change orders is accounted for in revenue whenit is probable that the cost will be recovered through a change in the contract price. In circumstances whererecovery is considered probable, but the revenue cannot be reliably estimated, cost attributable to changeorders is deferred pending determination of the impact on contract price. If the requirements forrecognizing revenue for claims or unapproved change orders are met, revenue is recorded only to theextent that costs associated with the claims or unapproved change orders have been incurred. Back chargesto suppliers or subcontractors are recognized as a reduction of cost when it is determined that recovery ofsuch cost is probable and the amounts can be reliably estimated. Disputed back charges are recognizedwhen the same requirements described above for claims accounting have been satisfied. The companyperiodically evaluates its positions and amounts recognized with respect to all its claims and back charges.
37

As of December 31, 2017 and 2016, the company had recorded $124 million and $61 million, respectively,of claim revenue for costs incurred to date and such costs are included in contract work in progress.Additional costs, which will increase the claim revenue balance over time, are expected to be incurred infuture periods. The company had also recorded disputed back charges totaling $18 million and $41 millionas of December 31, 2017 and 2016, respectively. The company believes the ultimate recovery of amountsrelated to these claims and back charges is probable in accordance with ASC 605-35-25.
Backlog in the engineering and construction industry is a measure of the total dollar value of work tobe performed on contracts awarded and in progress. Although backlog reflects business that is consideredto be firm, cancellations, deferrals or scope adjustments may occur. Backlog is adjusted to reflect anyknown project cancellations, revisions to project scope and cost, foreign currency exchange fluctuationsand project deferrals, as appropriate.
Engineering and Construction Partnerships and Joint Ventures Certain contracts are executed jointlythrough partnership and joint venture arrangements with unrelated third parties. Generally, thesearrangements are characterized by a 50 percent or less ownership interest that requires only a small initialinvestment. The arrangements are often formed for the single business purpose of executing a specificproject and allow the company to share risks and secure specialty skills required for project execution.
In accordance with ASC 810, ‘‘Consolidation,’’ the company assesses its partnerships and jointventures at inception to determine if any meet the qualifications of a variable interest entity (‘‘VIE’’). Thecompany considers a partnership or joint venture a VIE if it has any of the following characteristics: (a) thetotal equity investment is not sufficient to permit the entity to finance its activities without additionalsubordinated financial support, (b) characteristics of a controlling financial interest are missing (either theability to make decisions through voting or other rights, the obligation to absorb the expected losses of theentity or the right to receive the expected residual returns of the entity), or (c) the voting rights of theequity holders are not proportional to their obligations to absorb the expected losses of the entity and/ortheir rights to receive the expected residual returns of the entity, and substantially all of the entity’sactivities either involve or are conducted on behalf of an investor that has disproportionately few votingrights. Upon the occurrence of certain events outlined in ASC 810, the company reassesses its initialdetermination of whether the partnership or joint venture is a VIE. The majority of the company’spartnerships and joint ventures qualify as VIEs because the total equity investment is typically nominal andnot sufficient to permit the entity to finance its activities without additional subordinated financial support.
The company also performs a qualitative assessment of each VIE to determine if the company is itsprimary beneficiary, as required by ASC 810. The company concludes that it is the primary beneficiary andconsolidates the VIE if the company has both (a) the power to direct the economically significant activitiesof the entity and (b) the obligation to absorb losses of, or the right to receive benefits from, the entity thatcould potentially be significant to the VIE. The company considers the contractual agreements that definethe ownership structure, distribution of profits and losses, risks, responsibilities, indebtedness, voting rightsand board representation of the respective parties in determining if the company is the primarybeneficiary. The company also considers all parties that have direct or implicit variable interests whendetermining whether it is the primary beneficiary. In most cases, the company does not qualify as theprimary beneficiary. When the company is determined to be the primary beneficiary, the VIE isconsolidated. As required by ASC 810, management’s assessment of whether the company is the primarybeneficiary of a VIE is continuously performed.
For construction partnerships and joint ventures, unless full consolidation is required, the companygenerally recognizes its proportionate share of revenue, cost and profit in its Consolidated Statement ofEarnings and uses the one-line equity method of accounting in the Consolidated Balance Sheet, which is acommon application of ASC 810-10-45-14 in the construction industry. The cost and equity methods ofaccounting are also used, depending on the company’s respective ownership interest and amount ofinfluence on the entity, as well as other factors. At times, the company also executes projects throughcollaborative arrangements for which the company recognizes its relative share of revenue and cost.
38

Deferred Taxes and Uncertain Tax Positions Deferred tax assets and liabilities are recognized for theexpected future tax consequences of events that have been recognized in the company’s financialstatements or tax returns. As discussed in Note 4 of the Notes to Consolidated Financial Statements,enactment of the Act on December 22, 2017 significantly changed how U.S. corporations are taxed. TheAct requires complex computations to be performed that were not previously required in U.S. tax law,significant judgments to be made in interpretation of the provisions of the Act, the use of significantestimates in calculations, and the preparation and analysis of information not previously consideredrelevant or regularly produced. The U.S. Treasury Department, the IRS, and other standard-setting bodiescould interpret or issue guidance on how provisions of the Act will be applied or otherwise administeredthat is different from the company’s interpretation. As the company completes its analysis of the Act,collects and prepares necessary data, and interprets any additional guidance, the company may makeadjustments to provisional amounts over the next twelve months that may materially impact the company’sprovision for income taxes in the period in which the adjustments are made.
As of December 31, 2017, the company had deferred tax assets of $618 million which were partiallyoffset by a valuation allowance of $100 million and further reduced by deferred tax liabilities of$202 million. The valuation allowance reduces certain deferred tax assets to amounts that are more likelythan not to be realized. The valuation allowance for 2017 primarily relates to the deferred tax assets oncertain net operating loss carryforwards in certain jurisdictions for U.S. and non-U.S. subsidiaries. Thecompany evaluates the realizability of its deferred tax assets by assessing its valuation allowance and byadjusting the amount of such allowance, if necessary. The factors used to assess the likelihood ofrealization are the company’s forecast of future taxable income and available tax planning strategies thatcould be implemented to realize the net deferred tax assets. Failure to achieve forecasted taxable incomein the applicable taxing jurisdictions could affect the ultimate realization of deferred tax assets and couldresult in an increase in the company’s effective tax rate on future earnings.
Income tax positions must meet a more-likely-than-not recognition threshold to be recognized.Income tax positions that previously failed to meet the more-likely-than-not threshold are recognized inthe first subsequent financial reporting period in which that threshold is met. Previously recognized taxpositions that no longer meet the more-likely-than-not threshold are derecognized in the first subsequentfinancial reporting period in which that threshold is no longer met. The company recognizes potentialinterest and penalties related to unrecognized tax benefits within its global operations in income taxexpense.
Retirement Benefits The company accounts for its defined benefit pension plans in accordance withASC 715-30, ‘‘Defined Benefit Plans — Pension.’’ As required by ASC 715-30, the unfunded or overfundedprojected benefit obligation is recognized in the company’s financial statements. Assumptions concerningdiscount rates, long-term rates of return on plan assets and rates of increase in compensation levels aredetermined based on the current economic environment in each host country at the end of each respectiveannual reporting period. The company evaluates the funded status of each of its retirement plans usingthese current assumptions and determines the appropriate funding level considering applicable regulatoryrequirements, tax deductibility, reporting considerations and other factors. Assuming no changes in currentassumptions, the company expects to contribute up to $25 million to its defined benefit pension plans in2018, which is expected to be in excess of the minimum funding required. If the discount rates werereduced by 25 basis points, plan liabilities would increase by approximately $57 million.
Segment Operations
The company provides professional services in the fields of engineering, procurement, construction,fabrication and modularization, commissioning and maintenance, as well as project management services,on a global basis and serves a diverse set of industries worldwide. During the first quarter of 2017, thecompany changed the name of the Maintenance, Modification & Asset Integrity segment to DiversifiedServices. The company now reports its operating results in the following four reportable segments: Energy,Chemicals & Mining; Industrial, Infrastructure & Power; Government; and Diversified Services. For moreinformation on the business segments see ‘‘Item 1. — Business’’ above.
39

Energy, Chemicals & Mining
Revenue and segment profit for the Energy, Chemicals & Mining segment are summarized as follows:
Year Ended December 31,
(in millions) 2017 2016 2015
Revenue $9,376.7 $9,754.2 $11,865.4
Segment profit 454.7 401.5 866.6
Revenue in 2017 decreased 4 percent compared to 2016, primarily due to reduced volume of projectexecution activity for chemicals projects completed in 2016 or nearing completion in 2017, partially offsetby an increase in construction activities for an, upstream project and several downstream and mining andmetals projects. Revenue in 2016 decreased by 18 percent compared to 2015, primarily due to a significantdecline in volume of the mining and metals business line, as well as a reduced volume of project executionactivities for certain large chemicals projects that were completed or nearing completion in the prior year.Revenue in 2016 was also adversely affected by forecast revisions for a large petrochemical project in theUnited States.
Segment profit in 2017 increased compared to 2016 due to the adverse impact of forecast revisions in2016. Normalizing for the adverse effects of the forecast revisions in 2016, segment profit declined in 2017due to lower volume of project execution activity for chemicals projects nearing completion, a continuedshift in mix from higher margin engineering to lower margin construction activities, and a forecast revisionfor estimated cost increases on a downstream project. Segment profit in 2016 significantly decreasedcompared to 2015. Segment profit in 2016 was adversely affected by forecast revisions for estimated costincreases on the petrochemicals project in the United States of $265 million. The decrease in segmentprofit in 2016 was also driven by reduced contributions from the mining and metals business line andcertain upstream projects that were completed or nearing completion in 2015.
Segment profit margin was 4.8 percent, 4.1 percent and 7.3 percent for the years ended December 31,2017, 2016 and 2015, respectively. The change in segment profit margin in 2017 was primarily attributableto the same factors that affected revenue and segment profit. Segment profit margin in 2016 was primarilyaffected by forecast revisions on the large petrochemicals project discussed above.
New awards in the Energy, Chemicals & Mining segment were $5.4 billion in 2017, $8.4 billion in 2016and $12.0 billion in 2015. New awards in 2017 included an offshore project in the North Sea, a miningproject in Chile, a propylene oxide project in Texas, a petrochemical project in Malaysia and two refineryprojects in Texas. New awards in 2016 included an upstream project for the Tengiz Oil Expansion Project inKazakhstan and a bauxite mine project in Guinea. New awards in 2015 included a refinery project inKuwait, a large natural gas transmission project in the United States, production and chemicals work inCanada, and additional refinery projects in Europe and the United States.
Backlog for the Energy, Chemicals & Mining segment was $17.0 billion as of December 31, 2017,$21.8 billion as of December 31, 2016 and $29.4 billion as of December 31, 2015. The reduction in backlogduring 2017 resulted primarily from new award activity being outpaced by work performed. The reductionin backlog during 2016 resulted primarily from an adjustment for a liquefied natural gas project in Canadathat was suspended in the third quarter of 2016, as well as new award activity being outpaced by workperformed. While commodity prices have improved, clients continue to delay final investment decisions.
Total assets in the segment were $1.8 billion as of December 31, 2017 and $2.3 billion as ofDecember 31, 2016.
40

Industrial, Infrastructure & Power
Revenue and segment profit for the Industrial, Infrastructure & Power segment are summarized asfollows:
Year Ended December 31,
(in millions) 2017 2016 2015
Revenue $4,367.5 $4,094.5 $2,264.0
Segment profit (loss) (170.8) 135.8 (44.9)
Revenue in 2017 increased 7 percent compared to 2016 primarily due to increased project executionactivity for several life sciences and advanced manufacturing projects, partially offset by reduced levels ofproject execution for two nuclear projects. Revenue in 2016 increased 81 percent compared to 2015,primarily due to increased project execution activities in the power business line for several projects,including two nuclear projects and several gas-fired power plants in the southeastern United States.
Segment profit in 2017 was adversely affected by pre-tax charges of $260 million resulting fromforecast revisions for estimated cost growth at three fixed-price, gas-fired power plant projects. Segmentprofit increased significantly in 2016 compared to 2015 primarily due to the higher volume of projectexecution activities for the power projects mentioned in the paragraph above, as well as the adverse impactin 2015 of a loss of $60 million resulting from forecast revisions on a large gas-fired power plant inBrunswick County, Virginia. The change in segment profit margins in 2017 and 2016 were primarilyattributable to the same factors impacting segment profit in those years.
The Industrial, Infrastructure & Power segment includes the operations of NuScale, which areprimarily research and development activities. NuScale expenses, net of qualified reimbursableexpenditures, included in the determination of segment profit, were $76 million, $92 million and$80 million for 2017, 2016 and 2015, respectively.
New awards in the Industrial, Infrastructure & Power segment were $2.6 billion during 2017,$6.2 billion during 2016 and $7.1 billion during 2015. New awards in 2017 included the Southern Gatewayproject in Texas, the A10 Zuidasdok infrastructure project in Amsterdam and the Green Line Light RailExtension project in Boston. New awards in 2016 were primarily in the infrastructure business line andincluded the Purple Line Light Rail Transit project in Maryland, the Loop 202 South Mountain Freewayproject in Arizona, the Port Access Road project in South Carolina, an award on a combined-cycle powerplant in Greensville County, Virginia and a pharmaceutical manufacturing facility in North Carolina. Newawards in 2015 included an award from Westinghouse to manage the construction workforce at two nuclearpower plant projects in South Carolina (‘‘V.C. Summer’’) and Georgia (‘‘Plant Vogtle’’), a gas-fired powerplant in Florida and a highway project in Texas.
Backlog in the Industrial, Infrastructure & Power segment was $7.7 billion as of December 31, 2017,$15.1 billion as of December 31, 2016 and $9.7 billion as of December 31, 2015. The decrease in backlogduring 2017 primarily resulted from the removal of the two Westinghouse nuclear power plant projectsduring 2017. The increase in backlog during 2016 primarily resulted from project adjustments in the powerbusiness line for the two Westinghouse nuclear power plant projects and new awards in the infrastructurebusiness line.
Total assets in the Industrial, Infrastructure & Power segment were $926 million as of December 31,2017 and $750 million as of December 31, 2016. The increase in total assets resulted from increasedworking capital in support of project execution activities.
Total assets in the Industrial, Infrastructure & Power segment as of December 31, 2017 includedaccounts receivable related to the two subcontracts with Westinghouse to manage the constructionworkforce at the Plant Vogtle and V.C. Summer nuclear power plant projects. On March 29, 2017 (‘‘thebankruptcy petition date’’), Westinghouse filed for Chapter 11 bankruptcy protection in the U.S.Bankruptcy Court, Southern District of New York. In the third quarter of 2017, the V.C. Summer project
41

was cancelled by the owner. In the fourth quarter of 2017, the remaining scope of work on the Plant Vogtleproject was transferred to a new contractor. In addition to amounts due for post-petition services, totalassets as of December 31, 2017 included amounts due of $66 million and $2 million for services provided tothe V.C. Summer and Plant Vogtle projects, respectively, prior to the date of the bankruptcy petition. SeeNote 17 to the Consolidated Financial Statements.
Government
Revenue and segment profit for the Government segment are summarized as follows:
Year Ended December 31,
(in millions) 2017 2016 2015
Revenue $3,232.7 $2,720.0 $2,557.4
Segment profit 127.9 85.1 83.1
Revenue in 2017 increased 19 percent compared to 2016 primarily due to increases in projectexecution activities for several large multi-year decommissioning and cleanup projects, as well as thecommencement of a power restoration project in Puerto Rico (‘‘Power Infrastructure RestorationProject’’). Revenue in 2016 increased 6 percent compared to 2015, primarily due to the commencement ofproject execution activities for the Idaho Cleanup Project Core Contract (‘‘Idaho Core Project’’) during2016 and an increase in project execution activities for construction services projects. These increases werelargely offset by lower revenue from the Magnox nuclear decommissioning project in the United Kingdom(the ‘‘Magnox RSRL Project’’) and the continued reduction in project execution activities associated withthe LOGCAP IV program in Afghanistan.
Segment profit for 2017 increased 50 percent compared to 2016, substantially driven by increasedcontributions from multi-year decommissioning and cleanup projects and the commencement of the PowerInfrastructure Restoration Project. Segment profit for 2016 increased 2 percent compared to 2015,primarily due to contributions from the commencement of project execution activities for the Idaho CoreProject, as well as the favorable effect of the segment’s cost optimization efforts. These increases wereoffset by reduced contributions from the Magnox RSRL Project and the LOGCAP IV program.
Segment profit margin was 4.0 percent, 3.1 percent, and 3.3 percent for the years ended December 31,2017, 2016 and 2015, respectively. The increase in segment profit margin in 2017 was driven by the samefactors that drove the increase in segment profit. Segment profit margin in 2016 decreased slightly whencompared to 2015 primarily due to lower margin contributions from decommissioning and cleanupprojects.
New awards were $2.6 billion, $4.6 billion and $1.4 billion during 2017, 2016 and 2015, respectively.New awards in 2017 included two awards related to the Power Infrastructure Restoration Project in PuertoRico and contract extensions for both the LOGCAP IV program and the management and operations ofthe Strategic Petroleum Reserve project. New awards in 2016 included large awards for multi-yeardecommissioning and cleanup projects in the segment’s environmental and nuclear business line.
Backlog was $3.8 billion as of December 31, 2017, $5.2 billion as of December 31, 2016 and$3.6 billion as of December 31, 2015. Total backlog included $741 million, $2.7 billion and $912 million ofunfunded government contracts as of December 31, 2017, 2016, and 2015, respectively. The decrease inbacklog in 2017 primarily resulted from a customer decision to limit the contractual term of the MagnoxRSRL Project to a five year term ending in August 2019.
Total assets in the Government segment were $732 million as of December 31, 2017 compared to$494 million as of December 31, 2016. The increase in total assets primarily resulted from increasedworking capital in support of project execution activities for the Power Infrastructure Restoration Projectin Puerto Rico.
42

Diversified Services
Revenue and segment profit for the Diversified Services segment are summarized as follows:
Year Ended December 31,
(in millions) 2017 2016 2015
Revenue $2,544.1 $2,467.8 $1,427.2
Segment profit 133.6 121.9 127.4
Revenue in 2017 increased 3 percent compared to 2016, primarily due to the inclusion of twelvemonths of revenue associated with the acquisition of the Stork business (which closed on March 1, 2016)compared to ten months during 2016, as well as revenue growth from the equipment business in NorthAmerica. The increase in revenue in 2017 was partially offset by a lower level of project execution activitiesin the power services business. Revenue in 2016 increased 73 percent compared to 2015, primarily due tothe inclusion of ten months of revenue associated with the Stork business. The increase in revenue fromStork was partially offset by lower revenues for the equipment business due to the demobilization ofprojects in Latin America and North America and a lower level of project execution activities in both thecontinuous site presence and power services business lines.
Segment profit in 2017 increased 10 percent compared to the prior year. Increased contributions fromthe equipment business in North America were partially offset by lower contributions from the Storkbusiness. Segment profit in 2016 declined 4.4 percent compared to the prior year resulting primarily fromthe lower level of project execution activities in the power services and continuous site presence businesslines, which exceeded segment profit contributions from Stork.
Segment profit margin was 5.3 percent, 4.9 percent and 8.9 percent for the years ended December 31,2017, 2016 and 2015, respectively. The increase in segment profit margin in 2017 was primarily due to thesame factors affecting segment profit. The decline in segment profit margin in 2016 was principally drivenby the inclusion of Stork in 2016.
New awards in the Diversified Services segment were $2.0 billion in 2017, $1.8 billion in 2016 and$1.4 billion in 2015. Backlog was $2.5 billion as of December 31, 2017, $2.9 billion as of December 31, 2016and $2.1 billion as of December 31, 2015. The reduction in backlog during 2017 resulted primarily fromnew award activity in the Stork and power services business being outpaced by work performed. Theequipment and temporary staffing businesses do not report backlog or new awards.
Total assets in the Diversified Services segment were $2.1 billion as of December 31, 2017 comparedto $2.0 billion as of December 31, 2016.
Corporate, Tax and Other Matters
Corporate For the three years ended December 31, 2017, 2016 and 2015, corporate general andadministrative expenses were $192 million, $191 million and $168 million, respectively. Corporate generaland administrative expenses remained relatively flat in 2017 compared to the prior year. During 2017, thecompany incurred foreign currency exchange losses, while recognizing foreign currency exchange gains in2016. The impact of the foreign currency losses was substantially offset by lower levels of organizationalrealignment expenses and compensation during 2017, as well as the inclusion of transaction and integrationcosts in 2016 associated with the Stork acquisition. The increase in 2016 was primarily attributable totransaction costs and integration activities associated with the Stork acquisition and higher organizationalrealignment expenses when compared to 2015, which were partially offset by foreign currency exchangegains.
Net interest expense was $40 million, $53 million and $28 million for the years ended December 31,2017, 2016 and 2015, respectively. The decrease in 2017 was primarily due to an increase in interest incomeresulting from time deposits entered into during the year as well as a decrease in interest expense resultingfrom the repayment of the Stork Notes and borrowings under a revolving line of credit. The increase in
43

2016 was primarily due to interest associated with debt assumed in the Stork acquisition and theA500 million of 1.750% Senior Notes issued in March 2016.
Tax The effective tax rate on earnings from continuing operations was 31.6 percent, 40.1 percent,and 33.8 percent for 2017, 2016, and 2015, respectively. Factors affecting the effective tax rates for2015 - 2017 are discussed above under ‘‘— Results of Operations.’’
Litigation and Matters in Dispute Resolution
See Note 14 to the Consolidated Financial Statements.
Liquidity and Financial Condition
Liquidity is provided by available cash and cash equivalents and marketable securities, cash generatedfrom operations, credit facilities and access to capital markets. The company has both committed anduncommitted lines of credit available to be used for revolving loans and letters of credit. The companybelieves that for at least the next 12 months, cash generated from operations, along with its unused creditcapacity and cash position, is sufficient to support operating requirements. However, the companyregularly reviews its sources and uses of liquidity and may pursue opportunities to increase its liquidityposition. The company’s financial strategy and consistent performance have earned it strong credit ratings,resulting in a competitive advantage and continued access to the capital markets. As of December 31, 2017,the company was in compliance with all the financial covenants related to its debt agreements.
Cash Flows
Cash and cash equivalents were $1.8 billion and $1.9 billion as of December 31, 2017 and 2016,respectively. Cash and cash equivalents combined with current and noncurrent marketable securities were$2.1 billion as of both December 31, 2017 and 2016. Cash and cash equivalents are held in numerousaccounts throughout the world to fund the company’s global project execution activities. Non-U.S. cashand cash equivalents amounted to $919 million and $1.0 billion as of December 31, 2017 and 2016,respectively. Non-U.S. cash and cash equivalents exclude deposits of U.S. legal entities that are eitherswept into overnight, offshore accounts or invested in offshore, short-term time deposits, to which there isunrestricted access.
In evaluating its liquidity needs, the company considers cash and cash equivalents held by itsconsolidated variable interest entities (joint ventures and partnerships). These amounts (which totaled$516 million and $440 million as of December 31, 2017 and 2016, respectively, as reflected on theConsolidated Balance Sheet) were not necessarily readily available for general purposes. In its evaluation,the company also considers the extent to which the current balance of its advance billings on contracts(which totaled $874 million and $764 million as of December 31, 2017 and 2016, respectively, as reflectedon the Consolidated Balance Sheet) is likely to be sustained or consumed over the near term for projectexecution activities and the cash flow requirements of its various foreign operations. In some cases, it maynot be financially efficient to move cash and cash equivalents between countries due to statutory dividendlimitations and/or adverse tax consequences. The company did not consider any cash to be permanentlyreinvested overseas as of December 31, 2017 and 2016 and, as a result, has appropriately reflected the taximpact on foreign earnings in deferred taxes.
Operating Activities
Cash flows from operating activities result primarily from earnings sources and are affected bychanges in operating assets and liabilities which consist primarily of working capital balances for projects.Working capital levels vary from year to year and are primarily affected by the company’s volume of work.These levels are also impacted by the mix, stage of completion and commercial terms of engineering andconstruction projects, as well as the company’s execution of its projects within budget. Working capitalrequirements also vary by project and relate to clients in various industries and locations throughout theworld. Most contracts require payments as the projects progress. The company evaluates the counterparty
44

credit risk of third parties as part of its project risk review process. The company maintains adequatereserves for potential credit losses and generally such losses have been minimal and within management’sestimates. Additionally, certain projects receive advance payments from clients. A normal trend for theseprojects is to have higher cash balances during the initial phases of execution which then level out towardthe end of the construction phase. As a result, the company’s cash position is reduced as customeradvances are utilized, unless they are replaced by advances on other projects. The company maintains cashreserves and borrowing facilities to provide additional working capital in the event that a project’s netoperating cash outflows exceed its available cash balances.
During 2017, working capital increased primarily due to an increase in prepaid income taxes and adecrease in accounts payable, partially offset by decreases in accounts receivable and contract work inprogress. Specific factors related to these drivers include:
• A decrease in accounts payable in the Energy, Chemicals & Mining segment, which resultedprimarily from normal invoicing and payment activities.
• A decrease in accounts receivable, primarily related to collections from an Energy, Chemicals &Mining joint venture project in the United States.
• A decrease in contract work in progress in the Energy, Chemicals & Mining segment, whichresulted primarily from normal project execution activities.
During 2016, working capital decreased primarily due to an increase in accounts payable and adecrease in joint venture net working capital partially offset by increases in accounts receivable andcontract work in progress. Specific factors related to these drivers include:
• An increase in accounts payable in the Energy, Chemicals & Mining and Industrial,Infrastructure & Power segments which resulted from normal invoicing activities.
• A decrease in the net working capital of a project joint venture in the Energy, Chemicals & Miningsegment.
• An increase in accounts receivable, primarily attributable to work performed for an Energy,Chemicals & Mining joint venture project in the United States.
• An increase in contract work in progress in the Industrial, Infrastructure & Power segment, whichresulted primarily from normal project execution activities for two nuclear projects.
During 2015, working capital decreased primarily due to a decrease in accounts receivable andcontract work in progress and an increase in advance billings partially offset by an increase in prepaidincome taxes. Specific factors related to these drivers include:
• A decrease in accounts receivable in the Energy, Chemicals & Mining segment, primarily related tocollections for a coal bed methane gas project in Australia.
• A decrease in contract work in progress in the Energy, Chemicals & Mining segment that resultedprimarily from normal project execution activities. A significant contributor to the decrease incontract work in progress in the Energy, Chemicals & Mining segment was a major minereplacement project in Canada.
• An increase in advance billings in the Energy, Chemicals & Mining segment which was the result ofnormal project execution activities for several projects including an upstream project in Russia.
Cash provided by operating activities was $602 million, $706 million and $849 million in 2017, 2016and 2015, respectively. The decreases in cash provided by operating activities in both of the last two yearsresulted primarily from declines in net working capital inflows and lower net earnings compared to prioryears. The decrease in cash provided by operating activities in 2017 was partially offset by a decrease indeferred taxes. (See Note 4 of the Notes to Consolidated Financial Statements.)
45

Income tax payments were $175 million, $165 million and $250 million in 2017, 2016 and 2015,respectively.
Cash from operating activities is used to provide contributions to the company’s defined contributionand defined benefit pension plans. Contributions into the defined contribution plans during 2017, 2016 and2015 were $165 million, $167 million and $146 million, respectively. The company contributedapproximately $15 million into its defined benefit pension plans during both 2017 and 2016 and $58 millioninto its defined benefit pension plans during 2015. Company contributions to defined benefit pension plansduring 2015 primarily related to additional funding to settle the U.S. plan. Assuming no changes in currentassumptions, the company expects to contribute up to $25 million in 2018 to its defined benefit pensionplans, which is expected to be in excess of the minimum funding required. As of December 31, 2017 and2016, the accumulated benefit obligation exceeded plan assets for certain defined benefit pension plans inthe Netherlands and Germany that the company assumed in the Stork acquisition during 2016. Plan assetsexceeded the accumulated benefit obligation for each of the other non-U.S plans (including the company’slegacy plan in the Netherlands) as of December 31, 2017 and 2016.
In May 2014, NuScale entered into a cooperative agreement establishing the terms and conditions of amulti-year funding award totaling $217 million under the DOE’s Small Modular Reactor LicensingTechnical Support Program. NuScale expenses included in the determination of net earnings were$76 million, $92 million and $80 million during 2017, 2016 and 2015, respectively. NuScale expenses for2017, 2016 and 2015 were reported net of qualified reimbursable expenses of $48 million, $57 million and$65 million, respectively. The company anticipates that it will have received cost reimbursements from theDOE totaling $217 million by the end of the first quarter of 2018. For further discussion of the cooperativeagreement, see Note 1 to the Consolidated Financial Statements.
During 2014, the company recorded a loss from discontinued operations in connection with thereassessment of estimated loss contingencies related to the previously divested lead business of St. JoeMinerals Corporation and The Doe Run Company in Herculaneum, Missouri. In October 2014, thecompany entered into a settlement agreement with counsel for a number of plaintiffs, and in January 2015,the company paid $306 million pursuant to the settlement agreement. See Note 2 to the ConsolidatedFinancial Statements for further discussion of the matter.
Investing Activities
Cash utilized by investing activities amounted to $484 million, $741 million and $67 million during2017, 2016 and 2015, respectively. The primary investing activities included purchases, sales and maturitiesof marketable securities; capital expenditures; disposals of property, plant and equipment; investments inpartnerships and joint ventures; and business acquisitions.
The company holds cash in bank deposits and marketable securities which are governed by thecompany’s investment policy. This policy focuses on, in order of priority, the preservation of capital,maintenance of liquidity and maximization of yield. These investments include money market funds whichinvest in U.S. Government-related securities, bank deposits placed with highly-rated financial institutions,repurchase agreements that are fully collateralized by U.S. Government-related securities, high-gradecommercial paper and high quality short-term and medium-term fixed income securities. During 2017,purchases of marketable securities exceeded proceeds from sales and maturities of such securities by$21 million. During 2016 and 2015, proceeds from sales and maturities of marketable securities exceededpurchases of such securities by $162 million and $25 million, respectively. The company held combinedcurrent and noncurrent marketable securities of $275 million and $255 million as of December 31, 2017and 2016, respectively.
Capital expenditures of $283 million, $236 million and $240 million during 2017, 2016 and 2015,respectively, primarily related to construction equipment associated with equipment operations in theDiversified Services segment, as well as expenditures for land, facilities and investments in informationtechnology. Proceeds from the disposal of property, plant and equipment of $96 million, $81 million and
46

$94 million during 2017, 2016 and 2015, respectively, primarily related to the disposal of constructionequipment associated with the equipment operations in the Diversified Services segment.
During 2015, the company sold two office buildings located in California for net proceeds of$82 million and subsequently entered into a twelve year lease with the purchaser. The resulting gain on thesale of the property was approximately $58 million, of which $7 million was recognized during the fourthquarter of 2015 and $4 million was recognized during both 2017 and 2016. These gains were included incorporate general and administrative expense in the Consolidated Statement of Earnings. The remainingdeferred gain of approximately $43 million is being amortized over the remaining life of the lease on astraight-line basis.
During 2016, the company acquired 100 percent of Stork for an aggregate purchase price ofA695 million (or approximately $756 million), including the assumption of debt and other liabilities. Stork,based in the Netherlands, is a global provider of maintenance, modification and asset integrity servicesassociated with large existing industrial facilities in the oil and gas, chemicals, petrochemicals, industrialand power markets. The company paid A276 million (or approximately $300 million) in cash consideration.The company borrowed A200 million (or approximately $217 million) under its $1.7 billion Revolving Loanand Letter of Credit Facility, and paid A76 million (or approximately $83 million) of cash on hand toinitially finance the Stork acquisition. The A200 million borrowed under the $1.7 billion Revolving Loanand Letter of Credit Facility was subsequently repaid from the net proceeds of the 2016 Notes as discussedin Note 8 to the Consolidated Financial Statements.
During 2015, the company sold 50% of its ownership of Fluor S.A., its principal Spanish operatingsubsidiary, to Sacyr Industrial, S.L.U. for a cash purchase price of approximately $46 million, subject tocertain purchase price adjustments. The company deconsolidated the subsidiary and recorded a pre-taxnon-operating gain of $68 million during 2015, which was determined based on the proceeds received onthe sale and the estimated fair value of the company’s retained 50% noncontrolling interests, less thecarrying value of the net assets associated with the former subsidiary.
Investments in unconsolidated partnerships and joint ventures were $273 million, $518 million and$91 million in 2017, 2016 and 2015, respectively. Investments in 2017 and 2016 included capitalcontributions to an Energy, Chemicals & Mining joint venture in the United States and investments inCFHI. The company has a future funding commitment to CFHI of $52 million.
Financing Activities
Cash utilized by financing activities during 2017, 2016 and 2015 of $216 million, $10 million and$728 million, respectively, included company stock repurchases, company dividend payments tostockholders, proceeds from the issuance of senior notes, repayments of debt, borrowings and repaymentsunder revolving lines of credit, and distributions paid to holders of noncontrolling interests.
The company has a common stock repurchase program, authorized by the Board of Directors, topurchase shares in open market or privately negotiated transactions at the company’s discretion. In 2016and 2015, the company repurchased 202,650 shares and 10,104,988 shares of common stock, respectively,under its current and previously authorized stock repurchase programs resulting in cash outflows of$10 million and $510 million, respectively. As of December 31, 2017, 11,610,219 shares could still bepurchased under the existing stock repurchase program.
Quarterly cash dividends are typically paid during the month following the quarter in which they aredeclared. Therefore, dividends declared in the fourth quarter of 2017 will be paid in the first quarter of2018. Quarterly cash dividends of $0.21 per share were declared in 2017, 2016 and 2015. Dividends of$118 million were paid during both 2017 and 2016. Dividends of $125 million were paid during 2015. Thepayment and level of future cash dividends is subject to the discretion of the company’s Board of Directors.
In March 2016, the company issued A500 million of 1.750% Senior Notes (the ‘‘2016 Notes’’) dueMarch 21, 2023 and received proceeds of A497 million (or approximately $551 million), net of underwritingdiscounts. Interest on the 2016 Notes is payable annually on March 21 of each year, beginning on
47
March 21, 2017. Prior to December 21, 2022, the company may redeem the 2016 Notes at a redemptionprice equal to 100 percent of the principal amount, plus a ‘‘make whole’’ premium described in theindenture. On or after December 21, 2022, the company may redeem the 2016 Notes at 100 percent of theprincipal amount plus accrued and unpaid interest, if any, to the date of redemption. Additionally, thecompany may redeem the 2016 Notes at any time upon the occurrence of certain changes in U.S. tax laws,as described in the indenture, at 100 percent of the principal amount plus accrued and unpaid interest, ifany, to the date of redemption.
In November 2014, the company issued $500 million of 3.5% Senior Notes (the ‘‘2014 Notes’’) dueDecember 15, 2024 and received proceeds of $491 million, net of underwriting discounts. Interest on the2014 Notes is payable semi-annually on June 15 and December 15 of each year, and began on June 15,2015. Prior to September 15, 2024, the company may redeem the 2014 Notes at a redemption price equalto 100 percent of the principal amount, plus a ‘‘make whole’’ premium described in the indenture. On orafter September 15, 2024, the company may redeem the 2014 Notes at 100 percent of the principal amountplus accrued and unpaid interest, if any, to the date of redemption.
In September 2011, the company issued $500 million of 3.375% Senior Notes (the ‘‘2011 Notes’’) dueSeptember 15, 2021 and received proceeds of $492 million, net of underwriting discounts. Interest on the2011 Notes is payable semi-annually on March 15 and September 15 of each year, and began on March 15,2012. The company may, at any time, redeem the 2011 Notes at a redemption price equal to 100 percent ofthe principal amount, plus a ‘‘make whole’’ premium described in the indenture.
For the 2016 Notes, the 2014 Notes and the 2011 Notes, if a change of control triggering event occurs,as defined by the terms of the respective indentures, the company will be required to offer to purchaseapplicable notes at a purchase price equal to 101 percent of their principal amount, plus accrued andunpaid interest, if any, to the date of redemption. The company is generally not limited under theindentures governing the 2016 Notes, the 2014 Notes and the 2011 Notes in its ability to incur additionalindebtedness provided the company is in compliance with certain restrictive covenants, includingrestrictions on liens and restrictions on sale and leaseback transactions. We may, from time to time,repurchase the 2016 Notes, the 2014 Notes or the 2011 Notes in the open market, in privately-negotiatedtransactions or otherwise in such volumes, at such prices and upon such other terms as we deemappropriate.
In conjunction with the acquisition of Stork on March 1, 2016, the company assumed Stork’soutstanding debt obligations, including its 11.0% Super Senior Notes due 2017 (the ‘‘Stork Notes’’),borrowings under a A110 million Super Senior Revolving Credit Facility, and other debt obligations. OnMarch 2, 2016, the company gave notice to all holders of the Stork Notes of the full redemption of theoutstanding A273 million (or approximately $296 million) principal amount of Stork Notes plus aredemption premium of A7 million (or approximately $8 million) effective March 17, 2016. Theredemption of the Stork Notes was initially funded with additional borrowings under the company’s$1.7 billion Revolving Loan and Letter of Credit Facility, which borrowings were subsequently repaid fromthe net proceeds of the 2016 Notes. Certain other outstanding debt obligations assumed in the Storkacquisition of A20 million (or approximately $22 million) were settled in March 2016. In April 2016, thecompany repaid and replaced the A110 million Super Senior Revolving Credit Facility with a A125 millionRevolving Credit Facility that was available to fund working capital in the ordinary course of business. Thisreplacement facility, which bore interest at EURIBOR plus .75%, expired in April 2017. Outstandingborrowings of $53 million under the A125 million Revolving Credit Facility were repaid in the first quarterof 2017.
In February 2004, the company issued $330 million of 1.5% Convertible Senior Notes (the ‘‘2004Notes’’) due February 15, 2024 and received proceeds of $323 million, net of underwriting discounts. InDecember 2004, the company irrevocably elected to pay the principal amount of the 2004 Notes in cash.During the first half of 2015, holders converted $8 million of the 2004 Notes in exchange for the principalbalance owed in cash plus 167,674 shares of the company’s common stock at a conversion rate of 37.0997shares per each $1,000 principal amount of the 2004 Notes. On May 7, 2015, the company redeemed the
48

remaining $10 million of outstanding 2004 Notes at a redemption price equal to 100 percent of theprincipal amount plus accrued and unpaid interest up to (but excluding) May 7, 2015.
Distributions paid to holders of noncontrolling interests represent cash outflows to partners ofconsolidated partnerships or joint ventures created primarily for the execution of single contracts orprojects. Distributions paid were $47 million, $58 million and $59 million in 2017, 2016 and 2015,respectively. Distributions in 2017 primarily related to two transportation joint venture projects in theUnited States. Distributions in 2016 primarily related to three transportation joint venture projects in theUnited States. Distributions in 2015 primarily related to two transportation joint venture projects in theUnited States and an iron ore joint venture project in Australia. Capital contributions by joint venturepartners were $6 million, $9 million and $5 million in 2017, 2016 and 2015, respectively.
Effect of Exchange Rate Changes on Cash
Unrealized translation gains and losses resulting from changes in functional currency exchange ratesare reflected in the cumulative translation component of accumulated other comprehensive loss. During2017, most major foreign currencies strengthened against the U.S. dollar resulting in unrealized translationgains of $110 million of which $51 million related to cash held by foreign subsidiaries. During 2016 and2015, most major foreign currencies weakened against the U.S. dollar resulting in unrealized translationlosses of $103 million and $166 million, respectively, of which $54 million and $98 million, respectively,related to cash held by foreign subsidiaries. The cash held in foreign currencies will primarily be used forproject-related expenditures in those currencies, and therefore the company’s exposure to exchange gainsand losses is generally mitigated.
Off-Balance Sheet Arrangements
As of December 31, 2017, the company had both committed and uncommitted lines of credit availableto be used for revolving loans and letters of credit. As of December 31, 2017, letters of credit andborrowings totaling $1.7 billion were outstanding under these committed and uncommitted lines of credit.The committed lines of credit include a $1.7 billion Revolving Loan and Letter of Credit Facility and a$1.8 billion Revolving Loan and Letter of Credit Facility. Both facilities mature in February 2022. Thecompany may utilize up to $1.75 billion in the aggregate of the combined $3.5 billion committed lines ofcredit for revolving loans, which may be used for acquisitions and/or general purposes. Each of the creditfacilities may be increased up to an additional $500 million subject to certain conditions, and containcustomary financial and restrictive covenants, including a maximum ratio of consolidated debt to tangiblenet worth of one-to-one and a cap on the aggregate amount of debt of the greater of $750 million orA750 million for the company’s subsidiaries. Borrowings under both facilities, which may be denominatedin USD, EUR, GBP or CAD, bear interest at rates based on the Eurodollar Rate or an alternative baserate, plus an applicable borrowing margin.
In connection with the Stork acquisition, the company assumed a A110 million Super Senior RevolvingCredit Facility that bore interest at EURIBOR plus 3.75%. In April 2016, the company repaid andreplaced the A110 million Super Senior Revolving Credit Facility with a A125 million Revolving CreditFacility which was used for revolving loans, bank guarantees, letters of credit and to fund working capital inthe ordinary course of business. This replacement facility, which bore interest at EURIBOR plus .75%,expired in April 2017. Outstanding borrowings of $53 million under the A125 million Revolving CreditFacility were repaid in the first quarter of 2017.
Letters of credit are provided in the ordinary course of business primarily to indemnify the company’sclients if the company fails to perform its obligations under its contracts. Surety bonds may be used as analternative to letters of credit.
49

Guarantees, Inflation and Variable Interest Entities
Guarantees
In the ordinary course of business, the company enters into various agreements providingperformance assurances and guarantees to clients on behalf of certain unconsolidated and consolidatedpartnerships, joint ventures and other jointly executed contracts. These agreements are entered intoprimarily to support the project execution commitments of these entities. The performance guaranteeshave various expiration dates ranging from mechanical completion of the project being constructed to aperiod extending beyond contract completion in certain circumstances. The maximum potential amount offuture payments that the company could be required to make under outstanding performance guarantees,which represents the remaining cost of work to be performed by or on behalf of third parties underengineering and construction contracts, was estimated to be $14 billion as of December 31, 2017. Amountsthat may be required to be paid in excess of estimated cost to complete contracts in progress are notestimable. For cost reimbursable contracts, amounts that may become payable pursuant to guaranteeprovisions are normally recoverable from the client for work performed under the contract. For lump-sumor fixed-price contracts, the performance guarantee amount is the cost to complete the contracted work,less amounts remaining to be billed to the client under the contract. Remaining billable amounts could begreater or less than the cost to complete. In those cases where costs exceed the remaining amounts payableunder the contract, the company may have recourse to third parties, such as owners, co-venturers,subcontractors or vendors for claims. The company assessed its performance guarantee obligation as ofDecember 31, 2017 and 2016 in accordance with ASC 460, ‘‘Guarantees,’’ and the carrying value of theliability was not material.
Financial guarantees, made in the ordinary course of business in certain limited circumstances, areentered into with financial institutions and other credit grantors and generally obligate the company tomake payment in the event of a default by the borrower. These arrangements generally require theborrower to pledge collateral to support the fulfillment of the borrower’s obligation.
Inflation
Although inflation and cost trends affect our results, the company mitigates these trends by seeking tofix the company’s cost at or soon after the time of award on lump-sum or fixed-price contracts or to recovercost increases in cost reimbursable contracts. The company has taken actions to reduce its dependence onexternal economic conditions; however, management is unable to predict with certainty the amount andmix of future business.
Variable Interest Entities (‘‘VIEs’’)
In the normal course of business, the company forms partnerships or joint ventures primarily for theexecution of single contracts or projects. The company evaluates each partnership and joint venture todetermine whether the entity is a VIE. If the entity is determined to be a VIE, the company assesseswhether it is the primary beneficiary and needs to consolidate the entity.
For further discussion of the company’s VIEs, see ‘‘Discussion of Critical Accounting Policies andEstimates’’ above and Note 16 to the Consolidated Financial Statements.
50

Contractual Obligations
Contractual obligations as of December 31, 2017 are summarized as follows:
Payments Due by Period
Contractual Obligations Total 1 year or less 2–3 years 4–5 years Over 5 years
(in millions)Debt:
1.750% Senior Notes $ 598 $ — $ — $ — $ 5983.375% Senior Notes 497 — — 497 —3.5% Senior Notes 493 — — — 493Other borrowings 31 27 4 — —Interest on debt obligations(1) 243 46 91 69 37
Operating leases(2) 327 86 127 58 56Capital leases 28 2 3 2 21Uncertain tax positions(3) 13 — — — 13Joint venture contributions 91 66 4 21 —Pension minimum funding(4) 78 20 32 26 —Other post-employment benefits 13 3 4 3 3Other compensation-related obligations(5) 449 63 116 156 114Total $2,861 313 381 832 1,335
(1) Interest is based on the borrowings that are presently outstanding and the timing of payments indicated inthe above table.
(2) Operating leases are primarily for engineering and project execution office facilities in Texas, California,the United Kingdom and various other U.S and international locations, equipment used in connection withlong-term construction contracts and other personal property.
(3) Uncertain tax positions taken or expected to be taken on an income tax return may result in additionalpayments to tax authorities. The total amount of the accrual for uncertain tax positions related to thecompany’s effective tax rate is included in the ‘‘Over 5 years’’ column as the company is not able toreasonably estimate the timing of potential future payments. If a tax authority agrees with the tax positiontaken or expected to be taken or the applicable statute of limitations expires, then additional paymentswould not be necessary.
(4) The company generally provides funding to its international pension plans to at least the minimum requiredby applicable regulations. In determining the minimum required funding, the company utilizes currentactuarial assumptions and exchange rates to forecast estimates of amounts that may be payable for up tofive years in the future. In management’s judgment, minimum funding estimates beyond a five-year timehorizon cannot be reliably estimated. Where minimum funding as determined for each individual planwould not achieve a funded status to the level of accumulated benefit obligations, additional discretionaryfunding may be provided from available cash resources.
(5) Principally deferred executive compensation.
Item 7A. Quantitative and Qualitative Disclosures about Market Risk
Cash and marketable securities are deposited with major banks throughout the world. Such depositsare placed with high quality institutions and the amounts invested in any single institution are limited tothe extent possible in order to minimize concentration of counterparty credit risk. Marketable securitiesconsist of time deposits, registered money market funds, U.S. agency securities, U.S. Treasury securities,commercial paper, international government securities and corporate debt securities. The company has notincurred any credit risk losses related to deposits in cash and marketable securities.
Certain of the company’s contracts are subject to foreign currency risk. The company limits exposureto foreign currency fluctuations in most of its engineering and construction contracts through provisionsthat require client payments in currencies corresponding to the currency in which cost is incurred. As aresult, the company generally does not need to hedge foreign currency cash flows for contract workperformed. However, in cases where revenue and expenses are not denominated in the same currency, thecompany may hedge its exposure, if material and if an efficient market exists, as discussed below.
51

The company utilizes derivative instruments to mitigate certain financial exposures, including currencyand commodity price risk associated with engineering and construction contracts, currency risk associatedwith monetary assets and liabilities denominated in nonfunctional currencies and risk associated withinterest rate volatility. As of December 31, 2017, the company had total gross notional amounts of$934 million of foreign currency contracts (primarily related to the British Pound, Euro, Kuwaiti Dinar,Indian Rupee, Philippine Peso and South Korean Won). The foreign currency contracts are of varyingduration, none of which extend beyond December 2021. As of December 31, 2017, the company had totalgross notional amounts of $81 million associated with contractual foreign currency payment provisions thatwere deemed embedded derivatives. There were no commodity contracts outstanding as of December 31,2017. The company’s historical gains and losses associated with derivative instruments have typically beenimmaterial, and have largely mitigated the exposures being hedged. The company does not enter intoderivative transactions for speculative purposes.
The company’s results reported by foreign subsidiaries with non-U.S. dollar functional currencies arealso affected by foreign currency volatility. When the U.S. dollar appreciates against the non-U.S. dollarfunctional currencies of these subsidiaries, the company’s reported revenue, cost and earnings, aftertranslation into U.S. dollars, are lower than what they would have been had the U.S. dollar depreciatedagainst the same foreign currencies or if there had been no change in the exchange rates.
The company’s long-term debt obligations typically carry a fixed-rate coupon, and therefore, itsexposure to interest rate risk is not material.
Item 8. Financial Statements and Supplementary Data
The information required by this Item is submitted as a separate section of this Form 10-K. See‘‘Item 15. — Exhibits and Financial Statement Schedules’’ below.
Item 9. Changes in and Disagreements with Accountants on Accounting and Financial Disclosure
None.
Item 9A. Controls and Procedures
Evaluation of Disclosure Controls and Procedures
Our management, with the participation of our chief executive officer and chief financial officer, areresponsible for establishing and maintaining ‘‘disclosure controls and procedures’’ (as defined inRule 13a-15(e) under the Exchange Act) for our company. Based on their evaluation as of the end of theperiod covered by this report, our chief executive officer and chief financial officer have concluded that ourdisclosure controls and procedures were effective to ensure that the information required to be disclosedby us in this Annual Report on Form 10-K was (i) recorded, processed, summarized and reported withinthe time periods specified in the SEC’s rules and (ii) accumulated and communicated to our management,including our principal executive and principal financial officers, to allow timely decisions regardingrequired disclosures.
Management’s Report on Internal Control Over Financial Reporting
Our management is responsible for establishing and maintaining effective internal control overfinancial reporting and for the assessment of the effectiveness of internal control over financial reporting.The company’s internal control over financial reporting is a process designed, as defined in Rule 13a-15(f)under the Exchange Act, to provide reasonable assurance regarding the reliability of financial reportingand the preparation of consolidated financial statements for external purposes in accordance withgenerally accepted accounting principles in the United States.
In connection with the preparation of the company’s annual consolidated financial statements,management of the company has undertaken an assessment of the effectiveness of the company’s internalcontrol over financial reporting based on criteria established in Internal Control — Integrated Framework
52

issued by the Committee of Sponsoring Organizations of the Treadway Commission (the 2013 COSOframework). Management’s assessment included an evaluation of the design of the company’s internalcontrol over financial reporting and testing of the operational effectiveness of the company’s internalcontrol over financial reporting. Based on this assessment, management has concluded that the company’sinternal control over financial reporting was effective as of December 31, 2017.
Because of its inherent limitations, internal control over financial reporting may not prevent or detectmisstatements. Projections of any evaluation of effectiveness to future periods are subject to the risk thatcontrols may become inadequate because of changes in conditions, or that the degree of compliance withthe policies or procedures may deteriorate.
Ernst & Young LLP, the independent registered public accounting firm that audited the company’sconsolidated financial statements included in this annual report on Form 10-K, has issued an attestationreport on the effectiveness of the company’s internal control over financial reporting which appears below.
53

Report of Independent Registered Public Accounting Firm
To the Shareholders and the Board of Directors of Fluor Corporation
Opinion on Internal Control over Financial Reporting
We have audited Fluor Corporation’s internal control over financial reporting as of December 31,2017, based on criteria established in Internal Control — Integrated Framework issued by the Committeeof Sponsoring Organizations of the Treadway Commission (2013 framework) (the COSO criteria). In ouropinion, Fluor Corporation maintained, in all material respects, effective internal control over financialreporting as of December 31, 2017, based on the COSO criteria.
We also have audited, in accordance with the standards of the Public Company Accounting OversightBoard (United States) (PCAOB), the consolidated balance sheets of Fluor Corporation as ofDecember 31, 2017 and 2016, and the related consolidated statements of earnings, comprehensive income,cash flows and changes in equity for each of the three years in the period ended December 31, 2017, andthe related notes (collectively referred to as the ‘‘financial statements’’) of Fluor Corporation and ourreport dated February 20, 2018 expressed an unqualified opinion thereon.
Basis for Opinion
Fluor Corporation’s management is responsible for maintaining effective internal control overfinancial reporting and for its assessment of the effectiveness of internal control over financial reportingincluded in the accompanying Management’s Report on Internal Control Over Financial Reporting. Ourresponsibility is to express an opinion on Fluor Corporation’s internal control over financial reportingbased on our audit. We are a public accounting firm registered with the PCAOB and are required to beindependent with respect to Fluor Corporation in accordance with the U.S. federal securities laws and theapplicable rules and regulations of the Securities and Exchange Commission and the PCAOB.
We conducted our audit in accordance with the standards of the PCAOB. Those standards requirethat we plan and perform the audit to obtain reasonable assurance about whether effective internal controlover financial reporting was maintained in all material respects.
Our audit included obtaining an understanding of internal control over financial reporting, assessingthe risk that a material weakness exists, testing and evaluating the design and operating effectiveness ofinternal control based on the assessed risk, and performing such other procedures as we considerednecessary in the circumstances. We believe that our audit provides a reasonable basis for our opinion.
Definition and Limitations of Internal Control Over Financial Reporting
A company’s internal control over financial reporting is a process designed to provide reasonableassurance regarding the reliability of financial reporting and the preparation of financial statements forexternal purposes in accordance with generally accepted accounting principles. A company’s internalcontrol over financial reporting includes those policies and procedures that (1) pertain to the maintenanceof records that, in reasonable detail, accurately and fairly reflect the transactions and dispositions of theassets of the company; (2) provide reasonable assurance that transactions are recorded as necessary topermit preparation of financial statements in accordance with generally accepted accounting principles,and that receipts and expenditures of the company are being made only in accordance with authorizationsof management and directors of the company; and (3) provide reasonable assurance regarding preventionor timely detection of unauthorized acquisition, use, or disposition of the company’s assets that could havea material effect on the financial statements.
Because of its inherent limitations, internal control over financial reporting may not prevent or detectmisstatements. Also, projections of any evaluation of effectiveness to future periods are subject to the riskthat controls may become inadequate because of changes in conditions, or that the degree of compliancewith the policies or procedures may deteriorate.
/s/Ernst & Young LLP
Dallas, TexasFebruary 20, 2018
54

Changes in Internal Control over Financial Reporting
There have been no changes in our internal control over financial reporting during the fourth quarterof the fiscal year ending December 31, 2017 that have materially affected, or are reasonably likely tomaterially affect, our internal control over financial reporting.
Item 9B. Other Information
None.
PART III
Item 10. Directors, Executive Officers and Corporate Governance
Directors, Executive Officers, Promoters and Control Persons
The information required by Paragraph (a), and Paragraphs (c) through (g) of Item 401 ofRegulation S-K (except for information required by Paragraphs (d) — (f) of that Item to the extent therequired information pertains to our executive officers) and Item 405 of Regulation S-K will be set forth inthe section entitled ‘‘Election of Directors — Biographical Information, including Experience,Qualifications, Attributes and Skills’’ and ‘‘Section 16(a) Beneficial Ownership Reporting Compliance’’ inour definitive proxy statement to be filed with the SEC pursuant to Regulation 14A within 120 days afterthe close of our fiscal year and is incorporated herein by reference. The information required byParagraph (b) of Item 401 of Regulation S-K, as well as the information required by Paragraphs (d) — (f)of that Item to the extent the required information pertains to our executive officers, is set forth in Part I,Item 1 of this Annual Report on Form 10-K under the heading ‘‘Executive Officers of the Registrant.’’
Code of Ethics
We have long maintained and enforced a Code of Business Conduct and Ethics that applies to our chiefexecutive officer, chief financial officer, and principal accounting officer and controller. A copy of ourCode of Business Conduct and Ethics, as amended, has been posted on the ‘‘Sustainability’’ — ‘‘Ethics andCompliance’’ portion of our website, www.fluor.com.
We have disclosed and intend to continue to disclose any changes or amendments to our code ofethics or waivers from our code of ethics applicable to our chief executive officer, chief financial officer,and principal accounting officer and controller by posting such changes or waivers to our website.
Corporate Governance
We have adopted Corporate Governance Guidelines, which are available on our website atwww.fluor.com under the ‘‘Sustainability’’ portion of our website under the heading ‘‘CorporateGovernance Documents’’ filed under ‘‘Governance.’’ Information regarding the Audit Committee ishereby incorporated by reference from the information that will be contained in the section entitled‘‘Corporate Governance — Board of Directors Meetings and Committees — Audit Committee’’ in ourProxy Statement.
Item 11. Executive Compensation
Information required by this item will be included in the following sections of our Proxy Statement forour 2018 annual meeting of stockholders: ‘‘Organization and Compensation Committee Report,’’‘‘Compensation Committee Interlocks and Insider Participation,’’ ‘‘Executive Compensation’’ and‘‘Director Compensation,’’ as well as the related pages containing compensation tables and information,which information is incorporated herein by reference.
55

Item 12. Security Ownership of Certain Beneficial Owners and Management and Related Stockholder Matters
Equity Compensation Plan Information
The following table provides information as of December 31, 2017 with respect to the shares ofcommon stock that may be issued under the company’s equity compensation plans:
(a) (b) (c)Number of securities to be Weighted average Number of securities available for
issued upon exercise of exercise price of future issuance under equityoutstanding options, outstanding options, compensation plans (excluding
Plan Category warrants and rights warrants and rights securities listed in column (a))
Equity compensation plansapproved by stockholders(1) . 5,069,956 $60.08 12,819,674
Equity compensation plans notapproved by stockholders . . — — —
Total . . . . . . . . . . . . . . . . . . . 5,069,956 $60.08 12,819,674
(1) Consists of the 2003 Executive Performance Incentive Plan (the ‘‘2003 Plan’’), under which 131,811shares are currently issuable upon exercise of outstanding options, warrants and rights, but underwhich no shares remain available for future issuance; the Amended and Restated 2008 ExecutivePerformance Incentive Plan, under which 4,938,145 shares are currently issuable upon exercise ofoutstanding options, warrants and rights, and under which no shares remain for future issuance; andthe 2017 Performance Incentive Plan, under which no securities are currently issuable upon exerciseof outstanding options, warrants or rights, but under which 12,819,674 shares remain available forissuance.
The additional information required by this item will be included in the ‘‘Stock Ownership and Stock-Based Holdings of Executive Officers and Directors’’ and ‘‘Stock Ownership of Certain BeneficialOwners’’ sections of our Proxy Statement for our 2018 annual meeting of stockholders, which informationis incorporated herein by reference.
Item 13. Certain Relationships and Related Transactions, and Director Independence
Information required by this item will be included in the ‘‘Certain Relationships and RelatedTransactions’’ and ‘‘Board Independence’’ sections of the ‘‘Corporate Governance’’ portion of our ProxyStatement for our 2018 annual meeting of stockholders, which information is incorporated herein byreference.
Item 14. Principal Accountant Fees and Services
Information required by this item will be included in the ‘‘Ratification of Appointment ofIndependent Registered Public Accounting Firm’’ section of our Proxy Statement, which information isincorporated herein by reference.
56

PART IV
Item 15. Exhibits and Financial Statement Schedules
(a) Documents filed as part of this annual report on Form 10-K:
1. Financial Statements:
Our consolidated financial statements at December 31, 2017 and 2016 and for each of the three yearsin the period ended December 31, 2017 and the notes thereto, together with the report of the independentregistered public accounting firm on those consolidated financial statements are hereby filed as part of thisannual report on Form 10-K, beginning on page F-1.
2. Financial Statement Schedules:
No financial statement schedules are presented since the required information is not present or notpresent in amounts sufficient to require submission of the schedule, or because the information required isincluded in the consolidated financial statements and notes thereto.
3. Exhibits:
EXHIBIT INDEX
Exhibit Description
3.1 Amended and Restated Certificate of Incorporation of the registrant (incorporated byreference to Exhibit 3.1 to the registrant’s Current Report on Form 8-K filed on May 8, 2012).
3.2 Amended and Restated Bylaws of the registrant (incorporated by reference to Exhibit 3.2 tothe registrant’s Current Report on Form 8-K filed on February 9, 2016).
4.1 Senior Debt Securities Indenture between Fluor Corporation and Wells Fargo Bank, NationalAssociation, as trustee, dated as of September 8, 2011 (incorporated by reference toExhibit 4.3 to the registrant’s Current Report on Form 8-K filed on September 8, 2011).
4.2 First Supplemental Indenture between Fluor Corporation and Wells Fargo Bank, NationalAssociation, as trustee, dated as of September 13, 2011 (incorporated by reference toExhibit 4.4 to the registrant’s Current Report on Form 8-K filed on September 13, 2011).
4.3 Second Supplemental Indenture between Fluor Corporation and Wells Fargo Bank, NationalAssociation, as trustee, dated as of June 22, 2012 (incorporated by reference to Exhibit 4.2 tothe registrant’s Form S-3ASR filed on June 22, 2012).
4.4 Third Supplemental Indenture between Fluor Corporation and Wells Fargo Bank, NationalAssociation, as trustee, dated as of November 25, 2014 (incorporated by reference toExhibit 4.1 to the registrant’s Current Report on Form 8-K filed on November 25, 2014).
4.5 Fourth Supplemental Indenture between Fluor Corporation and Wells Fargo Bank, NationalAssociation, as trustee, dated as of March 21, 2016 (incorporated by reference to Exhibit 4.3 tothe registrant’s Current Report on Form 8-K filed on March 21, 2016).
10.1 Fluor Corporation 2003 Executive Performance Incentive Plan, as amended and restated as ofMarch 30, 2005 (incorporated by reference to Exhibit 10.15 to the registrant’s QuarterlyReport on Form 10-Q filed on May 5, 2005).
10.2 Form of Compensation Award Agreements for grants under the Fluor Corporation 2003Executive Performance Incentive Plan (incorporated by reference to Exhibit 10.16 to theregistrant’s Quarterly Report on Form 10-Q filed on November 9, 2004).
57
Exhibit Description
10.3 Fluor Corporation Amended and Restated 2008 Executive Performance Incentive Plan(incorporated by reference to Exhibit 10.1 to the registrant’s Current Report on Form 8-Kfiled on May 3, 2013).
10.4 Form of Option Agreement (2015 grants) under the Fluor Corporation Amended andRestated 2008 Executive Performance Incentive Plan (incorporated by reference toExhibit 10.26 to the registrant’s Quarterly Report on Form 10-Q filed on April 30, 2015).
10.5 Form of Option Agreement (2017 grants) under the Fluor Corporation Amended andRestated 2008 Executive Performance Incentive Plan (incorporated by reference toExhibit 10.6 to the registrant’s Annual Report on Form 10-K filed on February 17, 2017).
10.6 Form of Value Driver Incentive Award Agreement (for the senior team) under the FluorCorporation Amended and Restated 2008 Executive Performance Incentive Plan(incorporated by reference to Exhibit 10.24 to the registrant’s Quarterly Report on Form 10-Qfiled on April 30, 2015).
10.7 Form of Value Driver Incentive Award Agreement (for the senior team, with a post-vestingholding period) under the Fluor Corporation Amended and Restated 2008 ExecutivePerformance Incentive Plan (incorporated by reference to Exhibit 10.7 to the registrant’sQuarterly Report on Form 10-Q filed on May 5, 2016).
10.8 Form of Value Driver Incentive Award Agreement (2017 grants) under the Fluor CorporationAmended and Restated 2008 Executive Performance Incentive Plan (incorporated byreference to Exhibit 10.9 to the registrant’s Annual Report on Form 10-K filed on February 17,2017).
10.9 Form of Value Driver Incentive Award Agreement (for non-senior executives) under the FluorCorporation Amended and Restated 2008 Executive Performance Incentive Plan(incorporated by reference to Exhibit 10.25 to the registrant’s Quarterly Report on Form 10-Qfiled on April 30, 2015).
10.10 Form of Value Driver Incentive Award Agreement (cash-based, for non-senior executives)under the Fluor Corporation Amended and Restated 2008 Executive Performance IncentivePlan (incorporated by reference to Exhibit 10.9 to the registrant’s Quarterly Report onForm 10-Q filed on May 5, 2016).
10.11 Form of Restricted Stock Unit Agreement under the Fluor Corporation Amended andRestated 2008 Executive Performance Incentive Plan (incorporated by reference toExhibit 10.27 to the registrant’s Quarterly Report on Form 10-Q filed on April 30, 2015).
10.12 Form of Restricted Stock Unit Agreement (for the senior team, with a post-vesting holdingperiod) under the Fluor Corporation Amended and Restated 2008 Executive PerformanceIncentive Plan (incorporated by reference to Exhibit 10.10 to the registrant’s Quarterly Reporton Form 10-Q filed on May 5, 2016).
10.13 Form of Restricted Stock Unit Agreement (2017 grants) under the Fluor CorporationAmended and Restated 2008 Executive Performance Incentive Plan (incorporated byreference to Exhibit 10.14 to the registrant’s Annual Report on Form 10-K filed onFebruary 17, 2017).
10.14 Fluor Corporation 2017 Performance Incentive Plan (incorporated by reference toExhibit 10.1 to the registrant’s Registration Statement on Form S-8 filed on May 4, 2017).
10.15 Fluor Executive Deferred Compensation Plan, as amended and restated effective April 21,2003 (incorporated by reference to Exhibit 10.5 to the registrant’s Annual Report onForm 10-K filed on February 29, 2008).
58

Exhibit Description
10.16 Fluor 409A Executive Deferred Compensation Program, as amended and restated effectiveJanuary 1, 2017 (incorporated by reference to Exhibit 10.16 to the registrant’s QuarterlyReport on Form 10-Q filed on November 2, 2017).
10.17 Executive Severance Plan (incorporated by reference to Exhibit 10.7 to the registrant’s AnnualReport on Form 10-K filed on February 22, 2012).
10.18 Retention Award, dated November 16, 2017, granted to Mr. Garry W. Flowers.*
10.19 Retirement and Release Agreement, effective February 8, 2018, between the registrant andBiggs C. Porter.*
10.20 Summary of Fluor Corporation Non-Management Director Compensation.*
10.21 Form of Restricted Stock Unit Agreement granted to directors under the Fluor Corporation2017 Performance Incentive Plan (incorporated by reference to Exhibit 10.19 to theregistrant’s Quarterly Report on Form 10-Q filed on August 3, 2017).
10.22 Fluor Corporation Deferred Directors’ Fees Program, as amended and restated effectiveJanuary 1, 2002 (incorporated by reference to Exhibit 10.9 to the registrant’s Annual Reporton Form 10-K filed on March 31, 2003).
10.23 Fluor Corporation 409A Director Deferred Compensation Program, as amended and restatedeffective as of November 2, 2016 (incorporated by reference to Exhibit 10.22 to the registrant’sAnnual Report on Form 10-K filed on February 17, 2017).
10.24 Directors’ Life Insurance Summary (incorporated by reference to Exhibit 10.12 to theregistrant’s Registration Statement on Form 10/A (Amendment No. 1) filed on November 22,2000).
10.25 Form of Indemnification Agreement entered into between the registrant and each of itsdirectors and executive officers (incorporated by reference to Exhibit 10.21 to the registrant’sAnnual Report on Form 10-K filed on February 25, 2009).
10.26 Form of Change in Control Agreement entered into between the registrant and each of itsexecutive officers (incorporated by reference to Exhibit 10.1 to the registrant’s Current Reporton Form 8-K filed on June 29, 2010).
10.27 $1,800,000,000 Amended and Restated Revolving Loan and Letter of Credit FacilityAgreement dated as of February 25, 2016, among Fluor Corporation, Fluor B.V., the Lendersthereunder, BNP Paribas, as Administrative Agent and an Issuing Lender, Bank of America,N.A., as Syndication Agent, and Citibank, N.A. and The Bank of Tokyo — MitsubishiUFJ, Ltd., as Co-Documentation Agents (incorporated by reference to Exhibit 10.1 to theregistrant’s Current Report on Form 8-K filed on March 2, 2016).
10.28 $1,700,000,000 Amended and Restated Revolving Loan and Letter of Credit FacilityAgreement dated as of February 25, 2016, among Fluor Corporation, Fluor B.V., the Lendersthereunder, BNP Paribas, as Administrative Agent and an Issuing Lender, Bank of America,N.A., as Syndication Agent, and Citibank, N.A. and The Bank of Tokyo — MitsubishiUFJ, Ltd., as Co-Documentation Agents (incorporated by reference to Exhibit 10.2 to theregistrant’s Current Report on Form 8-Q filed on March 2, 2016).
21.1 Subsidiaries of the registrant.*
23.1 Consent of Independent Registered Public Accounting Firm.*
31.1 Certification of Chief Executive Officer of Fluor Corporation.*
31.2 Certification of Chief Financial Officer of Fluor Corporation.*
59

Exhibit Description
32.1 Certification of Chief Executive Officer pursuant to Rule 13a-14(b) or Rule 15d-14(b) of theSecurities Exchange Act of 1934 and 18 U.S.C. Section 1350.*
32.2 Certification of Chief Financial Officer pursuant to Rule 13a-14(b) or Rule 15d-14(b) of theSecurities Exchange Act of 1934 and 18 U.S.C. Section 1350.*
101.INS XBRL Instance Document.*
101.SCH XBRL Taxonomy Extension Schema Document.*
101.CAL XBRL Taxonomy Extension Calculation Linkbase Document.*
101.LAB XBRL Taxonomy Extension Label Linkbase Document.*
101.PRE XBRL Taxonomy Extension Presentation Linkbase Document.*
101.DEF XBRL Taxonomy Extension Definition Linkbase Document.*
* New exhibit filed with this report.
Attached as Exhibit 101 to this report are the following documents formatted in XBRL (ExtensibleBusiness Reporting Language): (i) the Consolidated Statement of Earnings for the years endedDecember 31, 2017, 2016 and 2015, (ii) the Consolidated Balance Sheet at December 31, 2017 andDecember 31, 2016, (iii) the Consolidated Statement of Cash Flows for the years ended December 31,2017, 2016 and 2015 and (iv) the Consolidated Statement of Equity for the years ended December 31,2017, 2016 and 2015.
Item 16. Form 10-K Summary
Not applicable.
60

SIGNATURES
Pursuant to the requirements of Section 13 or 15(d) of the Securities Exchange Act of 1934, theregistrant has duly caused this annual report on Form 10-K to be signed on its behalf by the undersigned,thereunto duly authorized.
FLUOR CORPORATION
By: /s/ BRUCE A. STANSKI
Bruce A. Stanski,Executive Vice President
and Chief Financial Officer
February 20, 2018
Pursuant to the requirements of the Securities Exchange Act of 1934, this annual report on Form 10-Khas been signed below by the following persons on behalf of the registrant and in the capacities and on thedates indicated.
Signature Title Date
Principal Executive Officer and Director:
/s/ DAVID T. SEATON February 20, 2018Chairman and Chief ExecutiveOfficerDavid T. Seaton
Principal Financial Officer:
/s/ BRUCE A. STANSKI February 20, 2018Executive Vice President and ChiefFinancial OfficerBruce A. Stanski
Principal Accounting Officer:
/s/ ROBIN K. CHOPRA February 20, 2018Senior Vice President andControllerRobin K. Chopra
Other Directors:
/s/ PETER K. BARKER February 20, 2018Director
Peter K. Barker
/s/ ALAN M. BENNETT February 20, 2018Director
Alan M. Bennett
/s/ ROSEMARY T. BERKERY February 20, 2018Director
Rosemary T. Berkery
/s/ PETER J. FLUOR February 20, 2018Director
Peter J. Fluor
61

Signature Title Date
/s/ JAMES T. HACKETT February 20, 2018Director
James T. Hackett
/s/ SAMUEL J. LOCKLEAR February 20, 2018Director
Samuel J. Locklear
/s/ DEBORAH D. MCWHINNEY February 20, 2018Director
Deborah D. McWhinney
/s/ ARMANDO J. OLIVERA February 20, 2018Director
Armando J. Olivera
/s/ JOSEPH W. PRUEHER February 20, 2018Director
Joseph W. Prueher
/s/ MATTHEW K. ROSE February 20, 2018Director
Matthew K. Rose
/s/ NADER H. SULTAN February 20, 2018Director
Nader H. Sultan
/s/ LYNN C. SWANN February 20, 2018Director
Lynn C. Swann
62

FLUOR CORPORATION
INDEX TO CONSOLIDATED FINANCIAL STATEMENTS
TABLE OF CONTENTS PAGE
Report of Independent Registered Public Accounting Firm . . . . . . . . . . . . . . . . . . . . . . . . . . . F-2
Consolidated Statement of Earnings . . . . . . . . . . . . . . . . . . . . . . . . . . . . . . . . . . . . . . . . . . . . F-3
Consolidated Statement of Comprehensive Income . . . . . . . . . . . . . . . . . . . . . . . . . . . . . . . . . F-4
Consolidated Balance Sheet . . . . . . . . . . . . . . . . . . . . . . . . . . . . . . . . . . . . . . . . . . . . . . . . . . F-5
Consolidated Statement of Cash Flows . . . . . . . . . . . . . . . . . . . . . . . . . . . . . . . . . . . . . . . . . . F-6
Consolidated Statement of Changes in Equity . . . . . . . . . . . . . . . . . . . . . . . . . . . . . . . . . . . . . F-7
Notes to Consolidated Financial Statements . . . . . . . . . . . . . . . . . . . . . . . . . . . . . . . . . . . . . . F-8
F-1

Report of Independent Registered Public Accounting Firm
To the Shareholders and the Board of Directors of Fluor Corporation
Opinion on the Financial Statements
We have audited the accompanying consolidated balance sheets of Fluor Corporation (the Company)as of December 31, 2017 and 2016, and the related consolidated statements of earnings, comprehensiveincome, cash flows and changes in equity for each of the three years in the period ended December 31,2017, and the related notes (collectively referred to as the ‘‘financial statements’’). In our opinion, thefinancial statements present fairly, in all material respects, the consolidated financial position of theCompany as of December 31, 2017 and 2016, and the consolidated results of its operations and its cashflows for each of the three years in the period ended December 31, 2017, in conformity with U.S. generallyaccepted accounting principles.
We also have audited, in accordance with the standards of the Public Company Accounting OversightBoard (United States) (PCAOB), the Company’s internal control over financial reporting as ofDecember 31, 2017, based on criteria established in Internal Control-Integrated Framework issued by theCommittee of Sponsoring Organizations of the Treadway Commission (2013 framework) and our reportdated February 20, 2018 expressed an unqualified opinion thereon.
Basis for Opinion
These financial statements are the responsibility of the Company’s management. Our responsibility isto express an opinion on the Company’s financial statements based on our audits. We are a publicaccounting firm registered with the PCAOB and are required to be independent with respect to theCompany in accordance with the U.S. federal securities laws and the applicable rules and regulations ofthe Securities and Exchange Commission and the PCAOB.
We conducted our audits in accordance with the standards of the PCAOB. Those standards requirethat we plan and perform the audit to obtain reasonable assurance about whether the financial statementsare free of material misstatement, whether due to error or fraud. Our audits included performingprocedures to assess the risks of material misstatement of the financial statements, whether due to error orfraud, and performing procedures that respond to those risks. Such procedures include examining, on atest basis, evidence regarding the amounts and disclosures in the financial statements. Our audits alsoincluded evaluating the accounting principles used and significant estimates made by management, as wellas evaluating the overall presentation of the financial statements. We believe that our audits provide areasonable basis for our opinion.
/s/Ernst & Young LLP
We have served as the Company’s auditor since 1973.
Dallas, TexasFebruary 20, 2018
F-2

FLUOR CORPORATION
CONSOLIDATED STATEMENT OF EARNINGS
Year Ended December 31,
(in thousands, except per share amounts) 2017 2016 2015
TOTAL REVENUE $19,520,970 $19,036,525 $18,114,048
TOTAL COST OF REVENUE 18,902,480 18,246,209 17,019,352
OTHER (INCOME) AND EXPENSESGain related to a partial sale of a subsidiary — — (68,162)Pension settlement charge — — 239,896Corporate general and administrative expense 192,187 191,073 168,329Interest expense 67,638 69,689 44,770Interest income (27,776) (17,046) (16,689)
Total cost and expenses 19,134,529 18,489,925 17,387,496
EARNINGS FROM CONTINUING OPERATIONS BEFORETAXES 386,441 546,600 726,552
INCOME TAX EXPENSE 121,972 219,151 245,888
EARNINGS FROM CONTINUING OPERATIONS 264,469 327,449 480,664
LOSS FROM DISCONTINUED OPERATIONS, NET OF TAX — — (5,658)
NET EARNINGS 264,469 327,449 475,006
LESS: NET EARNINGS ATTRIBUTABLE TONONCONTROLLING INTERESTS 73,092 46,048 62,494
NET EARNINGS ATTRIBUTABLE TO FLUORCORPORATION $ 191,377 $ 281,401 $ 412,512
AMOUNTS ATTRIBUTABLE TO FLUOR CORPORATIONEarnings from continuing operations $ 191,377 $ 281,401 $ 418,170Loss from discontinued operations, net of tax — — (5,658)
Net earnings $ 191,377 $ 281,401 $ 412,512
BASIC EARNINGS (LOSS) PER SHARE ATTRIBUTABLE TOFLUOR CORPORATIONEarnings from continuing operations $ 1.37 $ 2.02 $ 2.89Loss from discontinued operations, net of tax — — (0.04)
Net earnings $ 1.37 $ 2.02 $ 2.85
DILUTED EARNINGS (LOSS) PER SHARE ATTRIBUTABLETO FLUOR CORPORATIONEarnings from continuing operations $ 1.36 $ 2.00 $ 2.85Loss from discontinued operations, net of tax — — (0.04)
Net earnings $ 1.36 $ 2.00 $ 2.81
SHARES USED TO CALCULATE EARNINGS PER SHAREBasic 139,761 139,171 144,805Diluted 140,893 140,912 146,722
DIVIDENDS DECLARED PER SHARE $ 0.84 $ 0.84 $ 0.84
See Notes to Consolidated Financial Statements.
F-3

FLUOR CORPORATION
CONSOLIDATED STATEMENT OF COMPREHENSIVE INCOME
Year Ended December 31,
(in thousands) 2017 2016 2015
NET EARNINGS $264,469 $327,449 $ 475,006
OTHER COMPREHENSIVE INCOME (LOSS), NET OF TAX:Foreign currency translation adjustment 74,424 (64,380) (104,595)Ownership share of equity method investees’ other comprehensive
income (loss) (701) 6,036 (7,513)Defined benefit pension and postretirement plan adjustments 15,609 (5,137) 162,615Unrealized gain (loss) on derivative contracts 4,743 (662) (126)Unrealized gain (loss) on available-for-sale securities (444) 207 (211)
TOTAL OTHER COMPREHENSIVE INCOME (LOSS), NET OFTAX 93,631 (63,936) 50,170
COMPREHENSIVE INCOME 358,100 263,513 525,176
LESS: COMPREHENSIVE INCOME ATTRIBUTABLE TONONCONTROLLING INTERESTS 72,296 46,006 61,227
COMPREHENSIVE INCOME ATTRIBUTABLE TO FLUORCORPORATION $285,804 $217,507 $ 463,949
See Notes to Consolidated Financial Statements.
F-4

FLUOR CORPORATION
CONSOLIDATED BALANCE SHEET
December 31, December 31,(in thousands, except share and per share amounts) 2017 2016
ASSETSCURRENT ASSETSCash and cash equivalents ($516,046 and $439,942 related to variable interest entities
(‘‘VIEs’’)) $1,804,075 $1,850,436Marketable securities, current ($91,295 and $48,155 related to VIEs) 161,134 111,037Accounts and notes receivable, net ($327,652 and $232,242 related to VIEs) 1,602,751 1,700,224Contract work in progress ($132,500 and $124,677 related to VIEs) 1,458,533 1,537,289Other current assets ($9,229 and $24,017 related to VIEs) 574,764 411,284
Total current assets 5,601,257 5,610,270
PROPERTY, PLANT AND EQUIPMENTLand 82,794 77,985Buildings and improvements 493,704 490,047Machinery and equipment 1,501,452 1,364,231Furniture and fixtures 155,423 157,104Construction in progress 62,237 50,047
2,295,610 2,139,414Less accumulated depreciation 1,201,929 1,122,191
Net property, plant and equipment ($44,004 and $53,728 related to VIEs) 1,093,681 1,017,223
OTHER ASSETSMarketable securities, noncurrent 113,622 143,553Goodwill 564,683 532,239Investments 878,863 740,385Deferred taxes 316,472 454,109Deferred compensation trusts 381,826 348,487Other ($27,631 and $24,248 related to VIEs) 377,288 370,151
Total other assets 2,632,754 2,588,924
TOTAL ASSETS $9,327,692 $9,216,417
LIABILITIES AND EQUITYCURRENT LIABILITIESTrade accounts payable ($258,592 and $221,601 related to VIEs) $1,512,740 $1,590,506Revolving credit facility and other borrowings 27,361 82,243Advance billings on contracts ($361,701 and $263,393 related to VIEs) 874,036 763,774Accrued salaries, wages and benefits ($32,678 and $35,573 related to VIEs) 706,520 734,649Other accrued liabilities ($44,211 and $32,015 related to VIEs) 453,513 644,857
Total current liabilities 3,574,170 3,816,029
LONG-TERM DEBT DUE AFTER ONE YEAR 1,591,598 1,517,949NONCURRENT LIABILITIES 669,525 639,608CONTINGENCIES AND COMMITMENTS
EQUITYShareholders’ equity
Capital stockPreferred — authorized 20,000,000 shares ($0.01 par value), none issued — —Common — authorized 375,000,000 shares ($0.01 par value); issued and outstanding —
139,918,324 and 139,258,483 shares in 2017 and 2016, respectively 1,399 1,393Additional paid-in capital 88,222 38,317Accumulated other comprehensive loss (402,242) (496,669)Retained earnings 3,654,931 3,582,150
Total shareholders’ equity 3,342,310 3,125,191Noncontrolling interests 150,089 117,640
Total equity 3,492,399 3,242,831
TOTAL LIABILITIES AND EQUITY $9,327,692 $9,216,417
See Notes to Consolidated Financial Statements.
F-5

FLUOR CORPORATION
CONSOLIDATED STATEMENT OF CASH FLOWS
Year Ended December 31,
(in thousands) 2017 2016 2015
CASH FLOWS FROM OPERATING ACTIVITIES
Net earnings $ 264,469 $ 327,449 $ 475,006Adjustments to reconcile net earnings to cash provided (utilized) by operating
activities:Loss from discontinued operations, net of taxes — — 5,658Pension settlement charge — — 239,896Depreciation of fixed assets 206,113 211,095 188,700Amortization of intangibles 19,156 14,818 1,038(Earnings) loss from equity method investments, net of distributions 2,849 12,180 (1,597)Gain related to a partial sale of a subsidiary — — (68,162)Gain on sale of property, plant and equipment (22,746) (21,604) (31,272)Amortization of stock-based awards 40,669 40,086 61,053Deferred compensation trust (49,539) (22,332) 44,298Deferred compensation obligation 52,615 29,323 (6,854)Statute expirations and tax settlements — (13,280) (7,827)Deferred taxes 100,286 (7,912) 4,675
Net retirement plan accrual (contributions) (8,846) (1,756) (37,805)Changes in operating assets and liabilities (11,899) 135,393 303,896Cash outflows from discontinued operations — — (316,195)Other items 8,844 2,459 (5,376)
Cash provided by operating activities 601,971 705,919 849,132
CASH FLOWS FROM INVESTING ACTIVITIES
Purchases of marketable securities (237,360) (359,986) (386,021)Proceeds from the sales and maturities of marketable securities 216,436 522,094 411,380Capital expenditures (283,107) (235,904) (240,220)Proceeds from disposal of property, plant and equipment 96,102 81,162 94,323Proceeds from sale of buildings — — 82,082Proceeds from a partial sale of a subsidiary — — 45,566Investments in partnerships and joint ventures (273,117) (518,220) (91,078)Acquisitions, net of cash acquired — (240,740) —Other items (3,232) 10,243 17,461
Cash utilized by investing activities (484,278) (741,351) (66,507)
CASH FLOWS FROM FINANCING ACTIVITIES
Repurchase of common stock — (9,718) (509,658)Dividends paid (117,995) (117,995) (125,204)Proceeds from issuance of 1.75% Senior Notes — 552,958 —Debt and credit facility issuance costs — (3,513) —Repayment of Stork Notes, convertible debt and other borrowings — (333,654) (28,425)Borrowings under revolving lines of credit — 882,142 —Repayment of borrowings under revolving lines of credit (53,455) (917,027) —Distributions paid to noncontrolling interests (47,215) (57,904) (58,986)Capital contributions by noncontrolling interests 6,397 9,072 5,254Taxes paid on vested restricted stock (6,186) (7,007) (8,400)Stock options exercised 9,380 3,658 1,780Other items (6,428) (11,362) (4,591)
Cash utilized by financing activities (215,502) (10,350) (728,230)
Effect of exchange rate changes on cash 51,448 (53,668) (97,634)
Decrease in cash and cash equivalents (46,361) (99,450) (43,239)Cash and cash equivalents at beginning of year 1,850,436 1,949,886 1,993,125
Cash and cash equivalents at end of year $1,804,075 $1,850,436 $1,949,886
See Notes to Consolidated Financial Statements.
F-6

FLUOR CORPORATION
CONSOLIDATED STATEMENT OF CHANGES IN EQUITY
AccumulatedAdditional Other TotalCommon Stock Paid-In Comprehensive Retained Shareholders’ Noncontrolling Total
(in thousands, except per share amounts) Shares Amount Capital Income (Loss) Earnings Equity Interests Equity
BALANCE AS OF DECEMBER 31, 2014 148,634 $1,486 $ — $(484,212) $3,593,597 $3,110,871 $112,959 $3,223,830
Net earnings — — — — 412,512 412,512 62,494 475,006Other comprehensive income (loss) — — — 51,437 — 51,437 (1,267) 50,170Dividends ($0.84 per share) — — — — (122,609) (122,609) — (122,609)Distributions to noncontrolling interests — — — — — — (58,986) (58,986)Capital contributions by noncontrolling
interests — — — — — — 5,254 5,254Other noncontrolling interest transactions — — 334 — — 334 (4,302) (3,968)Stock-based plan activity 321 5 54,656 — — 54,661 — 54,661Repurchase of common stock (10,105) (101) (54,789) — (454,768) (509,658) — (509,658)Debt conversions 168 — (201) — — (201) — (201)
BALANCE AS OF DECEMBER 31, 2015 139,018 $1,390 $ — $(432,775) $3,428,732 $2,997,347 $116,152 $3,113,499
Net earnings — — — — 281,401 281,401 46,048 327,449Other comprehensive loss — — — (63,894) — (63,894) (42) (63,936)Dividends ($0.84 per share) — — 270 — (118,265) (117,995) — (117,995)Distributions to noncontrolling interests — — — — — — (57,904) (57,904)Capital contributions by noncontrolling
interests — — — — — — 9,072 9,072Other noncontrolling interest transactions — — 852 — — 852 4,314 5,166Stock-based plan activity 443 5 37,193 — — 37,198 — 37,198Repurchase of common stock (203) (2) 2 — (9,718) (9,718) — (9,718)
BALANCE AS OF DECEMBER 31, 2016 139,258 $1,393 $ 38,317 $(496,669) $3,582,150 $3,125,191 $117,640 $3,242,831
Net earnings — — — — 191,377 191,377 73,092 264,469Other comprehensive income (loss) — — — 94,427 — 94,427 (796) 93,631Dividends ($0.84 per share) — — 374 — (118,596) (118,222) — (118,222)Distributions to noncontrolling interests — — — — — — (47,215) (47,215)Capital contributions by noncontrolling
interests — — — — — — 6,397 6,397Other noncontrolling interest transactions — — 1,610 — — 1,610 971 2,581Stock-based plan activity 660 6 47,921 — — 47,927 — 47,927
BALANCE AS OF DECEMBER 31, 2017 139,918 $1,399 $ 88,222 $(402,242) $3,654,931 $3,342,310 $150,089 $3,492,399
See Notes to Consolidated Financial Statements.
F-7

FLUOR CORPORATION
NOTES TO CONSOLIDATED FINANCIAL STATEMENTS
1. Major Accounting Policies
Principles of Consolidation
The financial statements include the accounts of Fluor Corporation and its subsidiaries (‘‘thecompany’’). The company frequently forms joint ventures or partnerships with unrelated third partiesprimarily for the execution of single contracts or projects. The company assesses its joint ventures andpartnerships at inception to determine if any meet the qualifications of a variable interest entity (‘‘VIE’’) inaccordance with Accounting Standards Codification (‘‘ASC’’) 810, ‘‘Consolidation.’’ If a joint venture orpartnership is a VIE and the company is the primary beneficiary, the joint venture or partnership is fullyconsolidated (see Note 16 below). For construction partnerships and joint ventures, unless fullconsolidation is required, the company generally recognizes its proportionate share of revenue, cost andprofit in its Consolidated Statement of Earnings and uses the one-line equity method of accounting in theConsolidated Balance Sheet, which is a common application of ASC 810-10-45-14 in the constructionindustry. The cost and equity methods of accounting are also used, depending on the company’s respectiveownership interest and amount of influence on the entity, as well as other factors. At times, the companyalso executes projects through collaborative arrangements for which the company recognizes its relativeshare of revenue and cost.
All significant intercompany transactions of consolidated subsidiaries are eliminated. Certain amountsdisclosed in 2016 and 2015 have been reclassified to conform to the 2017 presentation. Management hasevaluated all material events occurring subsequent to the date of the financial statements up to the filingdate of this annual report on Form 10-K.
The Consolidated Financial Statements as of and for the year ended December 31, 2016 include thefinancial statements of Stork Holding B.V. (‘‘Stork’’) since March 1, 2016, the date of acquisition. SeeNote 18 for a discussion of the acquisition.
Use of Estimates
The preparation of financial statements in accordance with accounting principles generally acceptedin the United States requires management to make estimates and assumptions that affect reportedamounts. These estimates are based on information available through the date of the issuance of thefinancial statements. Therefore, actual results could differ from those estimates.
Cash and Cash Equivalents
Cash and cash equivalents include securities with maturities of three months or less at the date ofpurchase. Securities with maturities beyond three months are classified as marketable securities withincurrent and noncurrent assets.
Marketable Securities
Marketable securities consist of time deposits placed with investment grade banks with originalmaturities greater than three months, which by their nature are typically held to maturity, and are classifiedas such because the company has the intent and ability to hold them to maturity. Held-to-maturitysecurities are carried at amortized cost. The company also has investments in debt securities which areclassified as available-for-sale because the investments may be sold prior to their maturity date.Available-for-sale securities are carried at fair value. The cost of securities sold is determined by using thespecific identification method. Marketable securities are assessed for other-than-temporary impairment.
F-8

FLUOR CORPORATION
NOTES TO CONSOLIDATED FINANCIAL STATEMENTS (Continued)
Engineering and Construction Contracts
The company recognizes engineering and construction contract revenue using thepercentage-of-completion method, based primarily on contract cost incurred to date compared to totalestimated contract cost. Cost of revenue includes an allocation of depreciation and amortization.Customer-furnished materials, labor and equipment and, in certain cases, subcontractor materials, laborand equipment, are included in revenue and cost of revenue when management believes that the companyis responsible for the ultimate acceptability of the project. Contracts are generally segmented betweentypes of services, such as engineering and construction, and accordingly, gross margin related to eachactivity is recognized as those separate services are rendered. Changes to total estimated contract cost orlosses, if any, are recognized in the period in which they are determined. Pre-contract costs are expensed asincurred unless they are expected to be recovered from the client. Revenue recognized in excess ofamounts billed is classified as a current asset under contract work in progress. Advances that are paymentson account of contract work in progress of $337 million and $382 million as of December 31, 2017 and2016, respectively, have been deducted from contract work in progress. Amounts billed to clients in excessof revenue recognized to date are classified as a current liability under advance billings on contracts. Thecompany anticipates that substantially all incurred cost associated with contract work in progress as ofDecember 31, 2017 will be billed and collected in 2018.
The company recognizes revenue, but not profit, for certain claims (including change orders in disputeand unapproved change orders in regard to both scope and price) when it is determined that recovery ofincurred cost is probable and the amounts can be reliably estimated. Under claims accounting(ASC 605-35-25), these requirements are satisfied when (a) the contract or other evidence provides a legalbasis for the claim, (b) additional costs were caused by circumstances that were unforeseen at the contractdate and not the result of deficiencies in the company’s performance, (c) claim-related costs areidentifiable and considered reasonable in view of the work performed, and (d) evidence supporting theclaim is objective and verifiable. Cost, but not profit, associated with unapproved change orders isaccounted for in revenue when it is probable that the cost will be recovered through a change in thecontract price. In circumstances where recovery is considered probable but the revenue cannot be reliablyestimated, cost attributable to change orders is deferred pending determination of the impact on contractprice. If the requirements for recognizing revenue for claims or unapproved change orders are met,revenue is recorded only to the extent that costs associated with the claims or unapproved change ordershave been incurred. Back charges to suppliers or subcontractors are recognized as a reduction of cost whenit is determined that recovery of such cost is probable and the amounts can be reliably estimated. Disputedback charges are recognized when the same requirements described above for claims accounting have beensatisfied. The company generally provides limited warranties for work performed under its engineering andconstruction contracts. The warranty periods typically extend for a limited duration following substantialcompletion of the company’s work on a project. Historically, warranty claims have not resulted in materialcosts incurred, and any estimated costs for warranties are included in the individual project cost estimatesfor purposes of accounting for long-term contracts.
Service Contracts
For service contracts (including maintenance contracts) that do not satisfy the criteria for revenuerecognition using the percentage-of-completion method, revenue is recognized when services areperformed. Revenue recognized on service contracts that have not been billed to clients is classified as acurrent asset under contract work in progress. Amounts billed to clients in excess of revenue recognized onservice contracts to date are classified as a current liability under advance billings on contracts.
F-9

FLUOR CORPORATION
NOTES TO CONSOLIDATED FINANCIAL STATEMENTS (Continued)
Research and Development
The company maintains a controlling interest in NuScale Power, LLC (‘‘NuScale’’), the operations ofwhich are primarily research and development activities. In May 2014, NuScale entered into a cooperativeagreement establishing the terms and conditions of a funding award totaling $217 million under the DOE’sSmall Modular Reactor Licensing Technical Support Program. This cost-sharing award requires NuScale touse the DOE funds to cover first-of-a-kind engineering costs associated with small modular reactor designdevelopment and certification. The DOE is to provide cost reimbursement for up to 43 percent of qualifiedexpenditures incurred during the period from June 1, 2014 to May 31, 2019, up to the total funding awardof $217 million. The company anticipates that it will have received cost reimbursements from the DOEtotaling $217 million by the end of the first quarter of 2018. Costs associated with NuScale’s research anddevelopment activities, net of qualifying reimbursements under the cost-sharing award, are expensed asincurred and reported as a reduction of ‘‘Total cost of revenue’’ in the Consolidated Statement of Earnings.In December 2016, NuScale submitted its design certification application to the U.S. Nuclear RegulatoryCommission for approval of NuScale’s small modular nuclear reactor commercial power plant design.Aside from the operations of NuScale, the company generally does not engage in significant research anddevelopment activities for new products and services.
Property, Plant and Equipment
Property, plant and equipment are recorded at cost. Leasehold improvements are amortized over theshorter of their economic lives or the lease terms. Depreciation is calculated using the straight-line methodover the following ranges of estimated useful service lives, in years:
EstimatedUsefulDecember 31, Service
(cost in thousands) 2017 2016 Lives
Buildings $ 316,398 $ 322,495 20 – 40Building and leasehold improvements 177,306 167,552 6 – 20Machinery and equipment 1,501,452 1,364,231 2 – 10Furniture and fixtures 155,423 157,104 2 – 10
Goodwill and Intangible Assets
Goodwill is not amortized but is subject to annual impairment tests. Interim testing for impairment isperformed if indicators of potential impairment exist. For purposes of impairment testing, goodwill isallocated to the applicable reporting units based on the current reporting structure. When testing goodwillfor impairment quantitatively, the company compares the fair value of each reporting unit with its carryingamount. If the carrying amount of a reporting unit exceeds its fair value, an impairment loss is recognized.During 2017, the company completed its annual goodwill impairment test and quantitatively determinedthat none of the goodwill was impaired. The company recorded $417 million of goodwill during 2016 inconjunction with the Stork acquisition (see Note 18). The increase in goodwill during 2017 was entirelyrelated to foreign currency translation gains. Goodwill for each of the company’s segments is presented inNote 17.
In September 2017, the company voluntarily changed the date of its annual goodwill impairmenttesting for all reporting units previously assessed as of March 1 to October 1. Prior to this change, goodwillimpairment testing for certain reporting units was performed as of March 1, while goodwill impairmenttesting for certain recent acquisitions was performed as of October 1. This voluntary change is preferableas it better aligns the timing of the goodwill impairment testing with the completion of the company’sstrategic and annual operating planning process. The voluntary change in accounting principle related to
F-10

FLUOR CORPORATION
NOTES TO CONSOLIDATED FINANCIAL STATEMENTS (Continued)
the annual testing date will not delay, accelerate or avoid an impairment charge. This change is not appliedretrospectively as it is impracticable to do so because retrospective application would require application ofsignificant estimates and assumptions with the use of hindsight. Accordingly, the change will be appliedprospectively.
The following table provides a summary of the net carrying value of acquired intangible assets as ofDecember 31, 2017 and 2016, including the weighted average life of each major intangible asset class, inyears:
WeightedDecember 31, Average(in thousands) 2017 2016 Life
Customer relationships (finite-lived) $103,374 $111,616 8Trade names (finite-lived) 7,279 8,034 13Trade names (indefinite-lived) 53,004 47,425 —In-process research and development (indefinite-lived) 16,900 19,038 —Other (finite-lived) 7,795 4,184 10
Total intangible assets $188,352 $190,297
Intangible assets with finite lives are amortized on a straight-line basis over the useful lives of thoseassets. The aggregate amortization expense for intangible assets with finite lives is expected to be$19 million during 2018, 2019, 2020 and 2021 and $18 million during 2022. Intangible assets with indefinitelives are not amortized but are subject to annual impairment tests. Interim testing for impairment is alsoperformed if indicators of potential impairment exist. An intangible asset with an indefinite life is impairedif its carrying value exceeds its fair value. As of December 31, 2017, none of the company’s intangibleassets with indefinite lives were impaired. In-process research and development associated with thecompany’s investment in NuScale is considered indefinite lived until the related technology is available forcommercial use.
Income Taxes
Deferred tax assets and liabilities are recognized for the expected future tax consequences of eventsthat have been recognized in the company’s financial statements or tax returns. The company evaluates therealizability of its deferred tax assets and maintains a valuation allowance, if necessary, to reduce certaindeferred tax assets to amounts that are more likely than not to be realized. The factors used to assess thelikelihood of realization are the company’s forecast of future taxable income and available tax planningstrategies that could be implemented to realize the net deferred tax assets. Failure to achieve forecastedtaxable income in the applicable taxing jurisdictions could affect the ultimate realization of deferred taxassets and could result in an increase in the company’s effective tax rate on future earnings.
Income tax positions must meet a more-likely-than-not recognition threshold to be recognized.Income tax positions that previously failed to meet the more-likely-than-not threshold are recognized inthe first subsequent financial reporting period in which that threshold is met. Previously recognized taxpositions that no longer meet the more-likely-than-not threshold are derecognized in the first subsequentfinancial reporting period in which that threshold is no longer met. The company recognizes potentialinterest and penalties related to unrecognized tax benefits within its global operations in income taxexpense.
Judgment is required in determining the consolidated provision for income taxes as the companyconsiders its worldwide taxable earnings and the impact of the continuing audit process conducted byvarious tax authorities. The final outcome of these audits by foreign jurisdictions, the Internal Revenue
F-11

FLUOR CORPORATION
NOTES TO CONSOLIDATED FINANCIAL STATEMENTS (Continued)
Service and various state governments could differ materially from that which is reflected in theConsolidated Financial Statements.
Derivatives and Hedging
The company limits exposure to foreign currency fluctuations in most of its engineering andconstruction contracts through provisions that require client payments in currencies corresponding to thecurrencies in which cost is incurred. Certain financial exposure, which includes currency and commodityprice risk associated with engineering and construction contracts, currency risk associated with monetaryassets and liabilities denominated in nonfunctional currencies and risk associated with interest ratevolatility, may subject the company to earnings volatility. In cases where financial exposure is identified,the company generally implements a hedging strategy utilizing derivatives or hedging instruments tomitigate the risk. The company’s hedging instruments are designated as either fair value or cash flowhedges in accordance with ASC 815, ‘‘Derivatives and Hedging.’’ The company formally documents itshedge relationships at inception, including identification of the hedging instruments and the hedged items,as well as its risk management objectives and strategies for undertaking the hedge transaction. Thecompany also formally assesses, both at inception and at least quarterly thereafter, whether the hedginginstruments are highly effective in offsetting changes in the fair value of the hedged items. The fair valuesof all hedging instruments are recognized as assets or liabilities at the balance sheet date. For fair valuehedges, the effective portion of the change in the fair value of the hedging instrument is offset against thechange in the fair value of the underlying asset or liability through earnings. For cash flow hedges, theeffective portion of the hedging instrument’s gain or loss due to changes in fair value is recorded as acomponent of accumulated other comprehensive income (loss) (‘‘AOCI’’) and is reclassified into earningswhen the hedged item settles. Any ineffective portion of a hedging instrument’s change in fair value isimmediately recognized in earnings. For derivatives that are not designated or do not qualify as hedginginstruments, the change in the fair value of the derivative is offset against the change in the fair value ofthe underlying asset or liability through earnings. The company does not enter into derivative instrumentsfor speculative purposes. Under ASC 815, in certain limited circumstances, foreign currency paymentprovisions could be deemed embedded derivatives. If an embedded foreign currency derivative isidentified, the derivative is bifurcated from the host contract and the change in fair value is recognizedthrough earnings. The company maintains master netting arrangements with certain counterparties tofacilitate the settlement of derivative instruments; however, the company reports the fair value ofderivative instruments on a gross basis.
Concentrations of Credit Risk
Accounts receivable and all contract work in progress are from clients in various industries andlocations throughout the world. Most contracts require payments as the projects progress or, in certaincases, advance payments. The company generally does not require collateral, but in most cases can placeliens against the property, plant or equipment constructed or terminate the contract, if a material defaultoccurs. The company evaluates the counterparty credit risk of third parties as part of its project risk reviewprocess and in determining the appropriate level of reserves. The company maintains adequate reservesfor potential credit losses and generally such losses have been minimal and within management’s estimates.
Cash and marketable securities are deposited with major banks throughout the world. Such depositsare placed with high quality institutions and the amounts invested in any single institution are limited tothe extent possible in order to minimize concentration of counterparty credit risk.
The company’s counterparties for derivative contracts are large financial institutions selected based onprofitability, strength of balance sheet, credit ratings and capacity for timely payment of financialcommitments. There are no significant concentrations of credit risk with any individual counterpartyrelated to our derivative contracts.
F-12

FLUOR CORPORATION
NOTES TO CONSOLIDATED FINANCIAL STATEMENTS (Continued)
The company monitors the credit quality of its counterparties and has not incurred any significantcredit risk losses related to its deposits or derivative contracts.
Stock-Based Plans
The company applies the provisions of ASC 718, ‘‘Compensation — Stock Compensation,’’ in itsaccounting and reporting for stock-based compensation. ASC 718 requires all stock-based payments toemployees, including grants of employee stock options, to be recognized in the income statement based ontheir fair values. All unvested options outstanding under the company’s option plans have grant pricesequal to the market price of the company’s stock on the dates of grant. Compensation cost for restrictedstock and restricted stock units is determined based on the fair market value of the company’s stock at thedate of grant. Compensation cost for stock appreciation rights is determined based on the change in thefair market value of the company’s stock during the period. Stock-based compensation expense is generallyrecognized over the required service period, or over a shorter period when employee retirement eligibilityis a factor. Certain awards that may be settled in cash or company stock are classified as liabilities andremeasured at fair value at the end of each reporting period until the awards are settled.
Other Comprehensive Income (Loss)
ASC 220, ‘‘Comprehensive Income,’’ establishes standards for reporting and displayingcomprehensive income and its components in the consolidated financial statements. The company reportsthe cumulative foreign currency translation adjustments, unrealized gains and losses on available-for-salesecurities and derivative contracts, ownership share of equity method investees’ other comprehensiveincome (loss), and adjustments related to defined benefit pension and postretirement plans, ascomponents of accumulated other comprehensive income (loss).
The tax effects of the components of other comprehensive income (loss) are as follows:
Year Ended December 31,
2017 2016 2015
Tax Tax TaxBefore-Tax (Expense) Net-of-Tax Before-Tax (Expense) Net-of-Tax Before-Tax (Expense) Net-of-Tax
(in thousands) Amount Benefit Amount Amount Benefit Amount Amount Benefit Amount
Other comprehensive income (loss):Foreign currency translation
adjustment $110,291 $(35,867) $74,424 $(102,707) $38,327 $(64,380) $(166,487) $ 61,892 $(104,595)Ownership share of equity
method investees’ othercomprehensive income (loss) (1,163) 462 (701) 8,734 (2,698) 6,036 (12,226) 4,713 (7,513)
Defined benefit pension andpostretirement plan adjustments 22,052 (6,443) 15,609 (5,518) 381 (5,137) 257,414 (94,799) 162,615
Unrealized gain (loss) onderivative contracts 7,593 (2,850) 4,743 (1,064) 402 (662) (302) 176 (126)
Unrealized gain (loss) onavailable-for-sale securities (711) 267 (444) 332 (125) 207 (337) 126 (211)
Total other comprehensive income(loss) 138,062 (44,431) 93,631 (100,223) 36,287 (63,936) 78,062 (27,892) 50,170
Less: Other comprehensive lossattributable to noncontrollinginterests (796) — (796) (42) — (42) (1,267) — (1,267)
Other comprehensive income (loss)attributable to Fluor Corporation $138,858 $(44,431) $94,427 $(100,181) $36,287 $(63,894) $ 79,329 $(27,892) $ 51,437
F-13
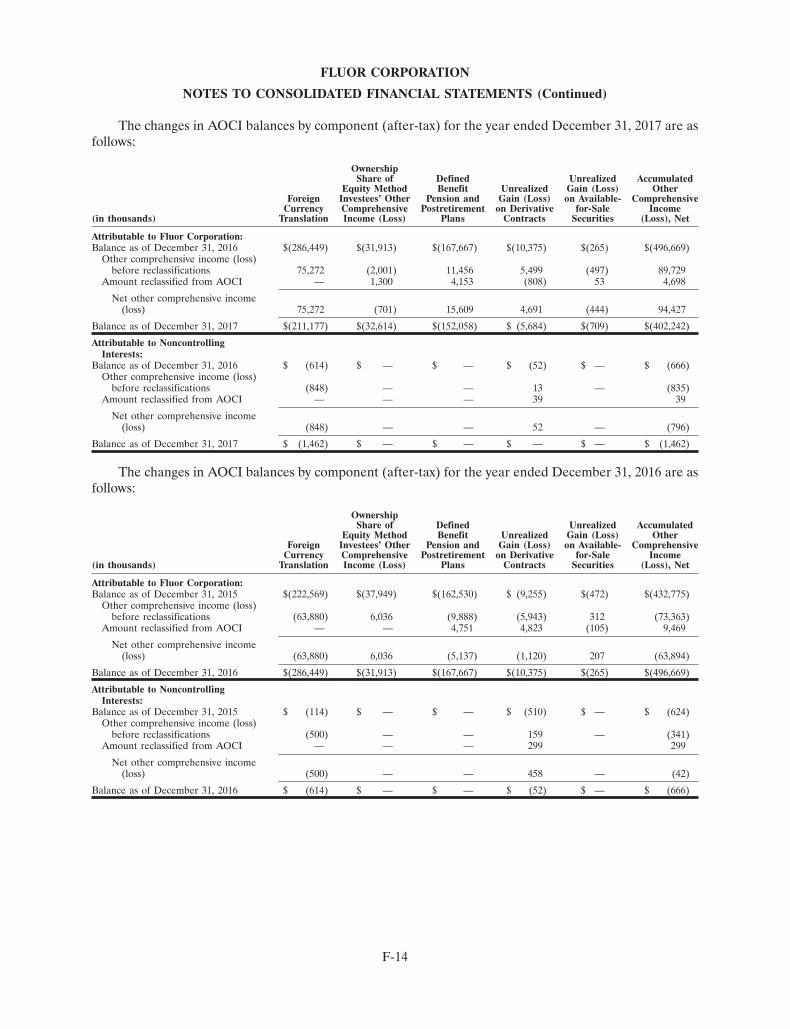
FLUOR CORPORATION
NOTES TO CONSOLIDATED FINANCIAL STATEMENTS (Continued)
The changes in AOCI balances by component (after-tax) for the year ended December 31, 2017 are asfollows:
OwnershipShare of Defined Unrealized Accumulated
Equity Method Benefit Unrealized Gain (Loss) OtherForeign Investees’ Other Pension and Gain (Loss) on Available- Comprehensive
Currency Comprehensive Postretirement on Derivative for-Sale Income(in thousands) Translation Income (Loss) Plans Contracts Securities (Loss), Net
Attributable to Fluor Corporation:Balance as of December 31, 2016 $(286,449) $(31,913) $(167,667) $(10,375) $(265) $(496,669)
Other comprehensive income (loss)before reclassifications 75,272 (2,001) 11,456 5,499 (497) 89,729
Amount reclassified from AOCI — 1,300 4,153 (808) 53 4,698
Net other comprehensive income(loss) 75,272 (701) 15,609 4,691 (444) 94,427
Balance as of December 31, 2017 $(211,177) $(32,614) $(152,058) $ (5,684) $(709) $(402,242)
Attributable to NoncontrollingInterests:
Balance as of December 31, 2016 $ (614) $ — $ — $ (52) $ — $ (666)Other comprehensive income (loss)
before reclassifications (848) — — 13 — (835)Amount reclassified from AOCI — — — 39 39
Net other comprehensive income(loss) (848) — — 52 — (796)
Balance as of December 31, 2017 $ (1,462) $ — $ — $ — $ — $ (1,462)
The changes in AOCI balances by component (after-tax) for the year ended December 31, 2016 are asfollows:
OwnershipShare of Defined Unrealized Accumulated
Equity Method Benefit Unrealized Gain (Loss) OtherForeign Investees’ Other Pension and Gain (Loss) on Available- Comprehensive
Currency Comprehensive Postretirement on Derivative for-Sale Income(in thousands) Translation Income (Loss) Plans Contracts Securities (Loss), Net
Attributable to Fluor Corporation:Balance as of December 31, 2015 $(222,569) $(37,949) $(162,530) $ (9,255) $(472) $(432,775)
Other comprehensive income (loss)before reclassifications (63,880) 6,036 (9,888) (5,943) 312 (73,363)
Amount reclassified from AOCI — — 4,751 4,823 (105) 9,469
Net other comprehensive income(loss) (63,880) 6,036 (5,137) (1,120) 207 (63,894)
Balance as of December 31, 2016 $(286,449) $(31,913) $(167,667) $(10,375) $(265) $(496,669)
Attributable to NoncontrollingInterests:
Balance as of December 31, 2015 $ (114) $ — $ — $ (510) $ — $ (624)Other comprehensive income (loss)
before reclassifications (500) — — 159 — (341)Amount reclassified from AOCI — — — 299 299
Net other comprehensive income(loss) (500) — — 458 — (42)
Balance as of December 31, 2016 $ (614) $ — $ — $ (52) $ — $ (666)
F-14

FLUOR CORPORATION
NOTES TO CONSOLIDATED FINANCIAL STATEMENTS (Continued)
The changes in AOCI balances by component (after-tax) for the year ended December 31, 2015 are asfollows:
OwnershipShare of Defined Unrealized Accumulated
Equity Method Benefit Unrealized Gain (Loss) OtherForeign Investees’ Other Pension and Gain (Loss) on Available- Comprehensive
Currency Comprehensive Postretirement on Derivative for-Sale Income(in thousands) Translation Income (Loss) Plans Contracts Securities (Loss), Net
Attributable to Fluor Corporation:Balance as of December 31, 2014 $(119,416) $(30,436) $(325,145) $(8,954) $(261) $(484,212)
Other comprehensive loss beforereclassifications (109,361) (9,000) (5,382) (3,260) (116) (127,119)
Amount reclassified from AOCI 6,208 1,487 167,997 2,959 (95) 178,556
Net other comprehensive income(loss) (103,153) (7,513) 162,615 (301) (211) 51,437
Balance as of December 31, 2015 $(222,569) $(37,949) $(162,530) $(9,255) $(472) $(432,775)
Attributable to NoncontrollingInterests:
Balance as of December 31, 2014 $ 1,328 $ — $ — $ (685) $ — $ 643Other comprehensive loss before
reclassifications (1,442) — — (101) — (1,543)Amount reclassified from AOCI — — — 276 276
Net other comprehensive income(loss) (1,442) — — 175 — (1,267)
Balance as of December 31, 2015 $ (114) $ — $ — $ (510) $ — $ (624)
During 2017, functional currency exchange rates for most of the company’s international operationsstrengthened against the U.S. dollar, resulting in unrealized translation gains. During 2016 and 2015,functional currency exchange rates for most of the company’s international operations weakened againstthe U.S. dollar, resulting in unrealized translation losses.
F-15
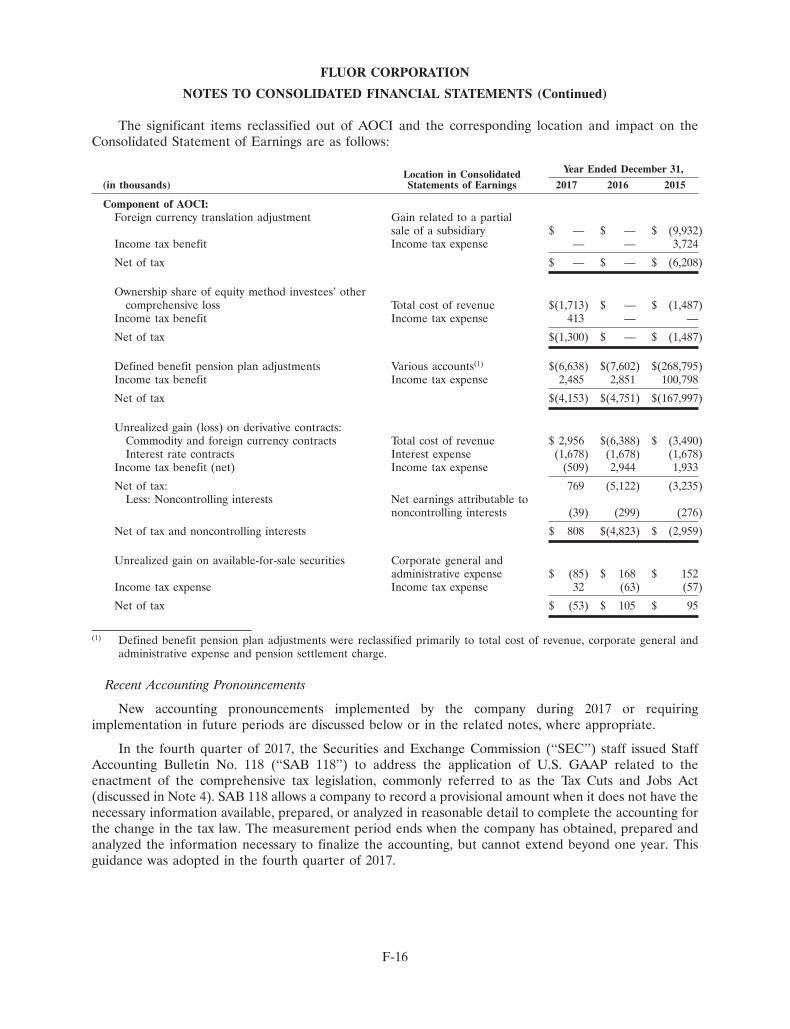
FLUOR CORPORATION
NOTES TO CONSOLIDATED FINANCIAL STATEMENTS (Continued)
The significant items reclassified out of AOCI and the corresponding location and impact on theConsolidated Statement of Earnings are as follows:
Year Ended December 31,Location in Consolidated(in thousands) Statements of Earnings 2017 2016 2015
Component of AOCI:Foreign currency translation adjustment Gain related to a partial
sale of a subsidiary $ — $ — $ (9,932)Income tax benefit Income tax expense — — 3,724
Net of tax $ — $ — $ (6,208)
Ownership share of equity method investees’ othercomprehensive loss Total cost of revenue $(1,713) $ — $ (1,487)
Income tax benefit Income tax expense 413 — —
Net of tax $(1,300) $ — $ (1,487)
Defined benefit pension plan adjustments Various accounts(1) $(6,638) $(7,602) $(268,795)Income tax benefit Income tax expense 2,485 2,851 100,798
Net of tax $(4,153) $(4,751) $(167,997)
Unrealized gain (loss) on derivative contracts:Commodity and foreign currency contracts Total cost of revenue $ 2,956 $(6,388) $ (3,490)Interest rate contracts Interest expense (1,678) (1,678) (1,678)
Income tax benefit (net) Income tax expense (509) 2,944 1,933
Net of tax: 769 (5,122) (3,235)Less: Noncontrolling interests Net earnings attributable to
noncontrolling interests (39) (299) (276)
Net of tax and noncontrolling interests $ 808 $(4,823) $ (2,959)
Unrealized gain on available-for-sale securities Corporate general andadministrative expense $ (85) $ 168 $ 152
Income tax expense Income tax expense 32 (63) (57)
Net of tax $ (53) $ 105 $ 95
(1) Defined benefit pension plan adjustments were reclassified primarily to total cost of revenue, corporate general andadministrative expense and pension settlement charge.
Recent Accounting Pronouncements
New accounting pronouncements implemented by the company during 2017 or requiringimplementation in future periods are discussed below or in the related notes, where appropriate.
In the fourth quarter of 2017, the Securities and Exchange Commission (‘‘SEC’’) staff issued StaffAccounting Bulletin No. 118 (‘‘SAB 118’’) to address the application of U.S. GAAP related to theenactment of the comprehensive tax legislation, commonly referred to as the Tax Cuts and Jobs Act(discussed in Note 4). SAB 118 allows a company to record a provisional amount when it does not have thenecessary information available, prepared, or analyzed in reasonable detail to complete the accounting forthe change in the tax law. The measurement period ends when the company has obtained, prepared andanalyzed the information necessary to finalize the accounting, but cannot extend beyond one year. Thisguidance was adopted in the fourth quarter of 2017.
F-16

FLUOR CORPORATION
NOTES TO CONSOLIDATED FINANCIAL STATEMENTS (Continued)
In the third quarter of 2017, the company elected to adopt Accounting Standards Update (‘‘ASU’’)2017-04, ‘‘Simplifying the Test for Goodwill Impairment’’ before its effective date. ASU 2017-04 removesthe second step of the goodwill impairment test, which requires a hypothetical purchase price allocation.Goodwill impairment will now be the amount by which a reporting unit’s carrying value exceeds its fairvalue, not to exceed the carrying amount of goodwill. Management does not expect the adoption ofASU 2017-04 to have any impact on the company’s financial position, results of operations or cash flows.
In the first quarter of 2017, the company adopted ASU 2016-17, ‘‘Interests Held through RelatedParties That Are Under Common Control’’ which amends the consolidation requirements that apply to asingle decision maker’s evaluation of interests held through related parties that are under common controlwhen it is determining whether it is the primary beneficiary of a variable interest entity. The adoption ofASU 2016-17 did not have any impact on the company’s financial position, results of operations or cashflows.
In the first quarter of 2017, the company adopted ASU 2016-09, ‘‘Improvements to Employee Share-Based Payment Accounting.’’ This ASU is intended to simplify various aspects of accounting for share-based payment awards, including income tax consequences, classification of awards as either equity orliabilities, classification on the statement of cash flows and forfeiture rate calculations. As a result of theadoption of ASU 2016-09, the excess tax benefits and tax deficiencies associated with option exercises andvested share awards are now recognized as income tax benefit or expense in the Condensed ConsolidatedStatement of Earnings instead of in additional paid-in capital. Additionally, the excess tax benefits are nowpresented as an operating activity on the Condensed Consolidated Statement of Cash Flows, rather than asa financing activity. ASU 2016-09 also changed the method the company uses to calculate shares fordiluted earnings per share (discussed further in Note 11). The company adopted the provision ofASU 2016-09 on a prospective basis; therefore, these changes were effective beginning in the first quarterof 2017. The adoption of ASU 2016-09 did not have a material impact on the company’s financial position,results of operations or cash flows.
In the first quarter of 2017, the company adopted ASU 2016-07, ‘‘Simplifying the Transition to theEquity Method of Accounting’’ which eliminates the requirement to retrospectively apply equity methodaccounting when an investor obtains significant influence over a previously held investment. The adoptionof ASU 2016-07 did not have any impact on the company’s financial position, results of operations or cashflows.
In the first quarter of 2017, the company adopted ASU 2016-05, ‘‘Effect of Derivative ContractNovations on Existing Hedge Accounting Relationships.’’ This ASU clarifies that the novation of aderivative contract in a hedge accounting relationship does not, in and of itself, require dedesignation ofthat hedge accounting relationship. The adoption of ASU 2016-05 did not have any impact on thecompany’s financial position, results of operations or cash flows.
New accounting pronouncements requiring implementation in future periods are discussed below.
In February 2018, the Financial Accounting Standards Board (‘‘FASB’’) issued ASU 2018-02,‘‘Reclassification of Certain Tax Effects from Accumulated Other Comprehensive Income,’’ which allows areclassification from accumulated other comprehensive income to retained earnings for stranded taxeffects resulting form the Tax Cuts and Jobs Act. ASU 2018-02 is effective for interim and annual reportingperiods beginning after December 15, 2018, with early adoption permitted. Management is currentlyevaluating the impact that the adoption of ASU 2018-02 will have on the company’s financial position,results of operations and cash flows.
In August 2017, the FASB issued ASU 2017-12, ‘‘Targeted Improvements to Accounting for HedgingActivities.’’ This ASU amends the FASB’s hedge accounting model to enable entities to better portray theirrisk management activities in the financial statements. ASU 2017-12 expands an entity’s ability to hedge
F-17

FLUOR CORPORATION
NOTES TO CONSOLIDATED FINANCIAL STATEMENTS (Continued)
nonfinancial and financial risk components and eliminates the requirement to separately measure andreport hedge ineffectiveness. ASU 2017-12 is effective for interim and annual reporting periods beginningafter December 15, 2018, with early adoption permitted. Management does not expect the adoption ofASU 2017-12 to have a material impact on the company’s financial position, results of operations or cashflows.
In May 2017, the FASB issued ASU 2017-09, ‘‘Compensation — Stock Compensation (Topic 718):Scope of Modification Accounting,’’ which clarifies when changes to the terms or conditions of a share-based payment award must be accounted for as a modification. Entities should apply the modificationaccounting guidance if the value, vesting conditions or classification of the award changes. ASU 2017-09 iseffective for interim and annual reporting periods beginning after December 15, 2017. Early adoption ispermitted and prospective application is required. Management does not expect the adoption ofASU 2017-09 to have a material impact on the company’s financial position, results of operations or cashflows.
In March 2017, the FASB issued ASU 2017-07, ‘‘Improving the Presentation of Net Periodic PensionCost and Net Periodic Postretirement Benefit Cost.’’ ASU 2017-07 requires employers to present theservice cost component of net periodic benefit cost in the same income statement line item as othercompensation costs arising from services rendered during the period. The other components of netperiodic benefit cost are required to be presented separately from the service cost component.ASU 2017-07 is effective for interim and annual reporting periods beginning after December 15, 2017.Management does not expect the adoption of ASU 2017-07 to have a material impact on the company’sfinancial position, results of operations or cash flows.
In January 2017, the FASB issued ASU 2017-01, ‘‘Business Combinations (Topic 805): Clarifying theDefinition of a Business’’ which changes the definition of a business to assist entities with evaluating whena set of transferred assets and activities is a business. ASU 2017-01 requires an entity to evaluate ifsubstantially all of the fair value of the gross assets acquired is concentrated in a single identifiable asset ora group of similar identifiable assets; if so, the set of transferred assets and activities is not a business.ASU 2017-01 is effective for interim and annual reporting periods beginning after December 15, 2017.Management does not expect the adoption of ASU 2017-01 to have any impact on the company’s financialposition, results of operations or cash flows.
In November 2016, the FASB issued ASU 2016-18, ‘‘Statement of Cash Flows (Topic 230): RestrictedCash (a consensus of the FASB Emerging Issues Task Force).’’ ASU 2016-18 requires an entity to includein its cash and cash-equivalent balances in the statement of cash flows those amounts that are deemed tobe restricted cash and restricted cash equivalents. ASU 2016-18 is effective for interim and annualreporting periods beginning after December 15, 2017. Management does not expect the adoption ofASU 2016-18 to have a material impact on the company’s financial position, results of operations or cashflows.
In August 2016, the FASB issued ASU 2016-15, ‘‘Classification of Certain Cash Receipts and CashPayments.’’ ASU 2016-15 amends the guidance in Accounting Standards Codification (‘‘ASC’’) 230, whichoften requires judgment to determine the appropriate classification of cash flows as operating, investing orfinancing activities, and has resulted in diversity in practice in how certain cash receipts and cash paymentsare classified. ASU 2016-15 is effective for interim and annual reporting periods beginning afterDecember 15, 2017 and should be applied on a retrospective basis. Management does not expect theadoption of ASU 2016-15 to have a material impact on the company’s cash flows.
In June 2016, the FASB issued ASU 2016-13, ‘‘Measurement of Credit Losses on FinancialInstruments.’’ The amendments in this ASU replace the incurred loss impairment methodology in currentpractice with a methodology that reflects expected credit losses and requires consideration of a broaderrange of reasonable and supportable information to estimate credit losses. ASU 2016-13 is effective for
F-18

FLUOR CORPORATION
NOTES TO CONSOLIDATED FINANCIAL STATEMENTS (Continued)
interim and annual reporting periods beginning after December 15, 2019. Management does not expect theadoption of ASU 2016-13 to have a material impact on the company’s financial position, results ofoperations or cash flows.
In February 2016, the FASB issued ASU 2016-02, ‘‘Leases: Amendments to the FASB AccountingStandards Codification,’’ and issued subsequent amendments to the initial guidance in September 2017within ASU 2017-13 which continues to amend the existing guidance on accounting for leases. The newstandard requires lessees to apply a dual approach, classifying leases as either finance or operating leasesbased on the principle of whether or not the lease is effectively a financed purchase by the lessee. Thisclassification will determine whether lease expense is recognized based on an effective interest method oron a straight-line basis over the term of the lease, respectively. ASU 2016-02 also requires the recognitionof lease assets and lease liabilities on the balance sheet, and the disclosure of key information about leasingarrangements. ASU 2016-02 is effective for interim and annual reporting periods beginning afterDecember 15, 2018. Early adoption is permitted and modified retrospective application is required forleases that exist or are entered into after the beginning of the earliest comparative period in the financialstatements. Management is currently evaluating the impact of adopting ASU 2016-02 on the company’sfinancial position, results of operations and cash flows.
In January 2016, the FASB issued ASU 2016-01, ‘‘Financial Instruments — Overall — Recognitionand Measurement of Financial Assets and Financial Liabilities.’’ This ASU requires entities to measureequity investments that do not result in consolidation and are not accounted for under the equity methodat fair value and to recognize any changes in fair value in net income unless the investments qualify for apracticability exception. ASU 2016-01 is effective for interim and annual reporting periods beginning afterDecember 15, 2017. Management does not expect the adoption of ASU 2016-01 to have a material impacton the company’s financial position, results of operations or cash flows.
Revenue Recognition
In May 2014, the FASB issued ASU 2014-09, ‘‘Revenue from Contracts with Customers,’’ whichoutlines a single comprehensive model for entities to use in accounting for revenue arising from contractswith customers and supersedes most current revenue recognition guidance, including industry-specificguidance. ASU 2014-09 outlines a five-step process for revenue recognition that focuses on transfer ofcontrol, as opposed to transfer of risk and rewards, and also requires enhanced disclosures regarding thenature, amount, timing and uncertainty of revenues and cash flows from contracts with customers. Majorprovisions include determining which goods and services are distinct and represent separate performanceobligations, how variable consideration (which may include change orders and claims) is recognized,whether revenue should be recognized at a point in time or over time and ensuring the time value ofmoney is considered in the transaction price.
As a result of the deferral of the effective date in ASU 2015-14, ‘‘Revenue from Contracts withCustomers — Deferral of the Effective Date,’’ the company will now be required to adopt ASU 2014-09for interim and annual reporting periods beginning after December 15, 2017. ASU 2014-09 can be appliedeither retrospectively to each prior period presented or as a cumulative-effect adjustment as of the date ofadoption.
In March 2016, the FASB issued ASU 2016-08, ‘‘Principal versus Agent Considerations (ReportingRevenue Gross versus Net)’’ which clarifies the principal versus agent guidance in ASU 2014-09.ASU 2016-08 clarifies how an entity determines whether to report revenue gross or net based on whether itcontrols a specific good or service before it is transferred to a customer. ASU 2016-08 also reframes theindicators to focus on evidence that an entity is acting as a principal rather than as an agent.
In April 2016, the FASB issued ASU 2016-10, ‘‘Identifying Performance Obligations and Licensing,’’which amends certain aspects of ASU 2014-09. ASU 2016-10 amends how an entity should identify
F-19

FLUOR CORPORATION
NOTES TO CONSOLIDATED FINANCIAL STATEMENTS (Continued)
performance obligations for immaterial promised goods or services, shipping and handling activities andpromises that may represent performance obligations. ASU 2016-10 also provides implementationguidance for determining the nature of licensing and royalties arrangements.
In May 2016, the FASB issued ASU 2016-12, ‘‘Narrow-Scope Improvements and PracticalExpedients,’’ which also clarifies certain aspects of ASU 2014-09 including the assessment of collectability,presentation of sales taxes, treatment of noncash consideration, and accounting for completed contractsand contract modifications at transition.
In December 2016, the FASB issued ASU 2016-20, ‘‘Technical Corrections and Improvements toTopic 606, Revenue from Contracts with Customers,’’ which allows an entity to determine the provision forloss contracts at either the contract level or the performance obligation level as an accounting policyelection.
In February 2017, the FASB issued ASU 2017-05, ‘‘Clarifying the Scope of Asset DerecognitionGuidance and Accounting for Partial Sales of Nonfinancial Assets,’’ which clarifies that the scope andapplication of ASC 610-20 on accounting for the sale or transfer of nonfinancial assets and in substancenonfinancial assets to noncustomers, including partial sales, applies only when the asset (or asset group)does not meet the definition of a business. ASU 2017-05, 2016-20, 2016-12, 2016-10 and 2016-08 areeffective upon adoption of ASU 2014-09. The company will adopt ASU 2014-09 during the first quarter of2018 using the modified retrospective method that will result in a cumulative effect adjustment as of thedate of adoption.
In September 2017, the FASB issued ASU 2017-13, ‘‘Amendments to SEC Paragraphs Pursuant to theStaff Announcement at the July 20, 2017 EITF Meeting and Rescission of Prior SEC Staff Announcementsand Observer Comments,’’ which also provides additional implementation guidance on the previouslyissued ASU 2014-09. The amendments represent guidance related to the effective dates of the standardsnoted above, therefore, the amendments themselves do not have an effective date.
In 2014, the company established a cross-functional implementation team which includedrepresentatives from the company’s four operating segments. The implementation team has evaluated theimpact of adopting the new standard on the company’s contracts expected to be uncompleted as ofJanuary 1, 2018 (the date of adoption). The evaluation included reviewing the company’s accountingpolicies and practices to identify differences that would result from applying the requirements of the newstandard. The company has identified and made changes to its processes, systems and controls to supportrecognition and disclosure under the new standard. The implementation team has worked closely withvarious industry groups to conclude on certain interpretative issues.
Management continues to evaluate the impact of adopting ASU 2014-09, 2016-08, 2016-10, 2016-12,2016-20, 2017-05 and 2017-13 on the company’s financial position, results of operations, cash flows andrelated disclosures. Under the new standard, the company will continue to recognize engineering andconstruction contract revenue over time using the percentage-of-completion method, based primarily oncontract cost incurred to date compared to total estimated contract cost. Revenue on the majority of thecompany’s contracts will continue to be recognized over time because of the continuous transfer of controlto the customer. However, adoption of the new standard will affect the manner in which the companydetermines the unit of account for its projects (i.e., performance obligations). Under existing guidance, thecompany typically segments revenue and margin recognition between the engineering and constructionphases of its contracts. Upon adoption, the entire engineering and construction contract will typically be asingle unit of account (a single performance obligation), which will result in a more constant recognition ofrevenue and margin over the term of the contract. Based on the company’s most recent assessment ofexisting contracts, the adoption of ASU 2014-09 is expected to result in a cumulative effect adjustment todecrease retained earnings by a range of $300 million to $350 million as of January 1, 2018.
F-20

FLUOR CORPORATION
NOTES TO CONSOLIDATED FINANCIAL STATEMENTS (Continued)
2. Discontinued Operations
During 2015, the company recorded an after-tax loss from discontinued operations of $6 millionresulting from the settlement of lead exposure cases related to the divested lead business of St. JoeMinerals Corporation and The Doe Run Company in Herculaneum, Missouri, which the company sold in1994, and the payment of legal fees incurred in connection with a pending indemnification action againstthe buyer of the lead business for these settlements and others. The tax effect associated with this loss was$3 million.
3. Consolidated Statement of Cash Flows
The changes in operating assets and liabilities as shown in the Consolidated Statement of Cash Flowsare comprised of:
Year Ended December 31,
(in thousands) 2017 2016 2015
(Increase) decrease in:Accounts and notes receivable, net $ 162,655 $(337,775) $190,141Contract work in progress 140,556 (72,419) 80,742Other current assets (138,638) 19,311 (20,861)Other assets (3,944) 250,332 (54,726)
Increase (decrease) in:Trade accounts payable (137,441) 200,480 (57,317)Advance billings on contracts 60,808 43,985 243,996Accrued liabilities (65,207) 40,088 (38,529)Other liabilities (30,688) (8,609) (39,550)
Increase (decrease) in cash due to changes in operating assetsand liabilities $ (11,899) $ 135,393 $303,896
Cash paid during the year for:Interest $ 61,560 $ 72,057 $ 40,585Income taxes (net of refunds) 175,045 164,836 249,921
4. Income Taxes
The Tax Cuts and Jobs Act (‘‘the Act’’) was enacted into law on December 22, 2017. Income taxeffects resulting from changes in tax laws are accounted for by the company in accordance with theauthoritative guidance, which requires that these tax effects be recognized in the period in which the law isenacted and the effects are recorded as a component of the provision for income taxes from continuingoperations. As a result, the company recorded provisions for income tax resulting from the enactment ofthe Act for the year ended December 31, 2017, as described below.
As of December 31, 2017, the company had not fully completed its accounting for the tax effects of theenactment of the Act. The company’s provision for income taxes for the year ended December 31, 2017 isbased in part on a reasonable estimate of the effects on its transition tax and existing deferred tax balances.For the amounts that the company was able to reasonably estimate, the company recognized tax expense of$37 million relating to the enactment of the Act. As the company completes its analysis of the Act, collectsand prepares necessary data, and interprets any additional guidance issued by the U.S. TreasuryDepartment, the U.S. Internal Revenue Service (‘‘IRS’’), and other standard-setting bodies, the companymay make adjustments to the provisional amounts. These amounts may materially impact the company’s
F-21

FLUOR CORPORATION
NOTES TO CONSOLIDATED FINANCIAL STATEMENTS (Continued)
provision for income taxes in the period in which adjustments are made. The primary components of the$37 million tax expense resulting from the Act include:
• Tax expense in the amount of $76 million related to the revaluation of deferred tax assets andliabilities due to the reduction of the U.S. corporate tax rate from 35% to 21% under the Act.
• A tax benefit of $39 million as a result of the one-time transition tax on previously unremittedforeign earnings. This included the release of deferred tax liabilities for unremitted foreignearnings, which exceeded $34 million of additional tax on the one-time transition tax. The transitiontax deems a repatriation of the post-1986 earnings and profits not previously distributed (or deemeddistributed). The company has made adjustments related to the withholding taxes that would beimposed by foreign jurisdictions should the deemed repatriations be followed by actual cashrepatriations but has not made any policy decisions regarding whether to indefinitely reinvest anyamounts deemed repatriated. While the company has accrued the transition tax on the deemedrepatriation of unremitted foreign earnings, the company was unable to determine a reasonableestimate of the remaining tax liability, if any, under the Act for its remaining outside basisdifferences. Therefore, the company has not included a provisional amount for this item in itsfinancial statements for the year ended December 31, 2017. The company will record amounts asneeded for this item beginning in the first reporting period during the measurement period in whichthe company obtains necessary information and is able to analyze and prepare a reasonableestimate.
The Act includes provisions for Global Intangible Low-Taxed Income (‘‘GILTI’’), under which taxeson foreign income are imposed in excess of a deemed return on tangible assets of foreign corporations. Ingeneral this income will effectively be taxed at a 10.5% tax rate. As a result, the company’s deferred taxassets and liabilities are being evaluated to determine if the deferred tax assets and liabilities should berecognized for the basis differences expected to reverse as a result of GILTI provisions that are effectivefor the company after the year ending December 31, 2017. Because of the complexity of the new GILTI taxrules, the company is continuing to evaluate this provision of the Act and the application of the relevantU.S. GAAP provisions. Under U.S. GAAP, the company is allowed to make an accounting policy electionof either (i) treating taxes due on future U.S. inclusions in taxable income related to GILTI as a current-period expense when incurred (the ‘‘period cost method’’), or (ii) factoring such amounts into a company’smeasurement of its deferred taxes (the ‘‘deferred method’’). Currently, the company has not elected amethod and will only do so after its completion of the analysis of the GILTI provisions. Its election methodwill depend, in part, on analyzing its global income to determine whether the company expects to havefuture U.S. inclusions in its taxable income related to GILTI and, if so, the impact that is expected.
F-22

FLUOR CORPORATION
NOTES TO CONSOLIDATED FINANCIAL STATEMENTS (Continued)
The income tax expense (benefit) included in the Consolidated Statement of Earnings fromcontinuing operations is as follows:
Year Ended December 31,
(in thousands) 2017 2016 2015
Current:Federal $(119,875) $120,798 $ 22,465Foreign 145,064 95,198 203,125State and local (3,503) 11,067 15,623
Total current 21,686 227,063 241,213
Deferred:Federal 15,720 58,601 8,867Foreign 75,688 (65,656) (5,630)State and local 8,878 (857) 1,438
Total deferred 100,286 (7,912) 4,675
Total income tax expense $ 121,972 $219,151 $245,888
A reconciliation of U.S. statutory federal income tax expense to income tax expense is as follows:
Year Ended December 31,
(in thousands) 2017 2016 2015
U.S. statutory federal tax expense $135,255 $191,310 $254,293
Increase (decrease) in taxes resulting from:State and local income taxes 6,326 5,785 11,518Other permanent items, net (1,072) (11,101) (5,828)Worthless stock (15,175) — —Noncontrolling interests (25,582) (16,117) (21,873)Foreign losses, net (1,055) 24,288 8,640Valuation allowance, net 22,860 6,978 5,611Statute expirations and tax authority settlements — (13,280) (7,827)Revaluation due to Section 987 tax law change — 24,156 —Impact of tax reform 37,423 — —International restructuring (46,295) — —Other, net 9,287 7,132 1,354
Total income tax expense $121,972 $219,151 $245,888
F-23

FLUOR CORPORATION
NOTES TO CONSOLIDATED FINANCIAL STATEMENTS (Continued)
Deferred taxes reflect the tax effects of differences between the amounts recorded as assets andliabilities for financial reporting purposes and the amounts recorded for income tax purposes. The taxeffects of significant temporary differences giving rise to deferred tax assets and liabilities are as follows:
December 31,
(in thousands) 2017 2016
Deferred tax assets:Accrued liabilities not currently deductible:
Employee compensation and benefits $ 28,410 $ 117,981Employee time-off accrual 58,500 94,134Project and non-project reserves 40,966 46,219
Tax basis of investments in excess of book basis — 69,195Net operating loss carryforward 184,517 180,450U.S. foreign tax credit carryforward 168,027 —Other comprehensive loss 71,537 271,878Other 66,286 34,147
Total deferred tax assets 618,243 814,004Valuation allowance for deferred tax assets (99,529) (81,360)
Deferred tax assets, net $ 518,714 $ 732,644
Deferred tax liabilities:Book basis of property, equipment and other capital costs in excess of tax
basis (86,780) (88,262)Residual U.S. tax on unremitted non-U.S. earnings — (161,827)Dividend withholding on unremitted non-U.S. earnings (42,201) —Other (73,261) (28,446)
Total deferred tax liabilities (202,242) (278,535)
Deferred tax assets, net of deferred tax liabilities $ 316,472 $ 454,109
The company had non-U.S. net operating loss carryforwards related to various jurisdictions ofapproximately $794 million as of December 31, 2017. Of the total losses, $557 million can be carriedforward indefinitely and $237 million will begin to expire in various jurisdictions starting in 2018.
The company had U.S. foreign tax credits of approximately $168 million as of December 31, 2017,which will expire in 2028.
The company maintains a valuation allowance to reduce certain deferred tax assets to amounts thatare more likely than not to be realized. The valuation allowance for 2017 and 2016 is primarily due to thedeferred tax assets established for certain net operating loss carryforwards and certain reserves oninvestments. In 2017 and 2016, the company released valuation allowances on branch net operating lossesof $5 million and $127 million, respectively. In 2016, the strong earnings history of our U.K. branchprovided enough positive evidence to release a $127 million valuation allowance on its net operating losscarryforward. This release did not impact total tax expense as it related to branch income which is includedin the U.S. tax return.
On December 7, 2016, the U.S. Treasury issued regulations under Internal Revenue Code Section 987(‘‘Section 987 Regulations’’) which prescribes how companies are required to calculate foreign currencytranslation gains and losses for income tax purposes for branches that have functional currencies otherthan the U.S. dollar. The issuance of the Section 987 Regulations necessitated the reduction of deferredtax assets in the amount of $24 million in 2016.
F-24

FLUOR CORPORATION
NOTES TO CONSOLIDATED FINANCIAL STATEMENTS (Continued)
The company conducts business globally and, as a result, the company or one or more of itssubsidiaries files income tax returns in the U.S. federal jurisdiction and various state and foreignjurisdictions. In the normal course of business, the company is subject to examination by taxing authoritiesthroughout the world, including such major jurisdictions as Australia, Canada, the Netherlands, SouthAfrica, the United Kingdom and the United States. Although the company believes its reserves for its taxpositions are reasonable, the final outcome of tax audits could be materially different, both favorably andunfavorably. With a few exceptions, the company is no longer subject to U.S. federal, state and local, ornon-U.S. income tax examinations for years before 2013.
In 2016, the company concluded an audit with the IRS for tax years 2012-2013. This resulted in a netreduction in tax expense of $11 million.
The unrecognized tax benefits as of December 31, 2017 and 2016 were $61 million and $59 million, ofwhich $13 million and $9 million, if recognized, would have favorably impacted the effective tax rates at theend of 2017 and 2016, respectively. The company does not anticipate any significant changes to theunrecognized tax benefits within the next twelve months.
A reconciliation of the beginning and ending amount of unrecognized tax benefits including interestand penalties is as follows:
(in thousands) 2017 2016
Balance at beginning of year $58,881 $ 42,203Change in tax positions of prior years 3,024 30,034Change in tax positions of current year — —Reduction in tax positions for statute expirations — (1,044)Reduction in tax positions for audit settlements (1,249) (12,312)
Balance at end of year $60,656 $ 58,881
The company recognizes accrued interest and penalties related to unrecognized tax benefits in incometax expense. The company had $8 million of accrued interest and penalties as of both December 31, 2017and 2016.
U.S. and foreign earnings from continuing operations before taxes are as follows:
Year Ended December 31,
(in thousands) 2017 2016 2015
United States $(222,979) $(33,414) $ 12,520Foreign 609,420 580,014 714,032
Total $ 386,441 $546,600 $726,552
Earnings from continuing operations before taxes in the United States decreased in 2017 compared to2016 primarily due to pre-tax charges totaling $260 million related to forecast revisions for estimated costgrowth at three fixed-price, gas-fired power plants in the southeastern United States. Earnings fromcontinuing operations before taxes in foreign jurisdictions were relatively flat as compared to 2016.Earnings from continuing operations before taxes in foreign jurisdictions decreased in 2016 compared to2015 primarily due to lower contributions from the Energy, Chemicals & Mining segment.
5. Retirement Benefits
The company sponsors contributory and non-contributory defined contribution retirement anddefined benefit pension plans for eligible employees worldwide.
F-25

FLUOR CORPORATION
NOTES TO CONSOLIDATED FINANCIAL STATEMENTS (Continued)
Defined Contribution Retirement Plans
Domestic and international defined contribution retirement plans are available to eligible salaried andcraft employees. Contributions to defined contribution retirement plans are based on a percentage of theemployee’s eligible compensation. The company recognized expense of $165 million, $167 million and$146 million associated with contributions to its defined contribution retirement plans during 2017, 2016and 2015, respectively.
Defined Benefit Pension Plans
Certain defined benefit pension plans are available to eligible international salaried employees. Adefined benefit pension plan was previously available to U.S. salaried and craft employees; however, theU.S. defined benefit pension plan (the ‘‘U.S. plan’’) was terminated on December 31, 2014 (see furtherdiscussion below). Contributions to defined benefit pension plans are at least the minimum amountsrequired by applicable regulations. Benefit payments under these plans are generally based upon length ofservice and/or a percentage of qualifying compensation.
The company’s Board of Directors previously approved amendments to freeze the accrual of futureservice-related benefits for salaried participants of the U.S. plan as of December 31, 2011 and craftparticipants of the U.S. plan as of December 31, 2013. During the fourth quarter of 2014, the company’sBoard of Directors approved an amendment to terminate the U.S. plan effective December 31, 2014. InDecember 2015, the company settled the remaining obligations associated with the U.S. plan. Planparticipants received vested benefits from the plan assets by electing either a lump-sum distribution,roll-over contribution to other defined contribution or individual retirement plans, or an annuity contractwith a third-party provider. As a result of the settlement, the company was relieved of any furtherobligation. During 2015, the company recorded a pension settlement charge of $251 million, of which$11 million was reimbursable and included in ‘‘Total cost of revenue’’ and $240 million was recorded as‘‘Pension settlement charge’’ in the Consolidated Statement of Earnings. The settlement charge consistedprimarily of unrecognized actuarial losses included in AOCI. The settlement of the plan obligations did nothave a material impact on the company’s cash position.
The company’s defined benefit pension plan in the Netherlands was closed to new participants onDecember 31, 2013. The company previously approved an amendment to freeze the accrual of futureservice-related benefits for eligible participants of the U.K. pension plan as of April 1, 2011.
Net periodic pension expense for the U.S. and non-U.S. defined benefit pension plans included thefollowing components:
U.S. Pension Plan Non-U.S. Pension Plans
Year Ended December 31, Year Ended December 31,
(in thousands) 2017 2016 2015 2017 2016 2015
Service cost $ — $ — $ 6,800 $ 18,780 $ 19,507 $ 20,517Interest cost — — 16,116 22,525 26,435 26,511Expected return on assets — — (19,711) (40,272) (39,535) (49,066)Amortization of prior service cost/
(credits) — — 867 (828) (813) (814)Recognized net actuarial loss — — 9,714 7,890 8,819 7,681Loss on settlement — — 250,946 184 396 390
Net periodic pension expense $ — $ — $264,732 $ 8,279 $ 14,809 $ 5,219
F-26

FLUOR CORPORATION
NOTES TO CONSOLIDATED FINANCIAL STATEMENTS (Continued)
The ranges of assumptions indicated below cover defined benefit pension plans in the United States,the Netherlands, the United Kingdom, Germany, the Philippines and Australia and are based on theeconomic environment in each host country at the end of each respective annual reporting period. Thediscount rates for the non-U.S. defined benefit pension plans were determined primarily based on ahypothetical yield curve developed from the yields on high quality corporate and government bonds withdurations consistent with the pension obligations in those countries. The discount rate for the U.S. planwas determined based on assumptions which reflected the intended settlement of the plan in 2015.Benefits that were assumed to be settled as lump-sum payments to plan participants were estimated usinginterest rates prescribed by law. Benefits that were assumed to be settled through an annuity purchasewere estimated using a blend of U.S. Treasury and high-quality corporate bond discount rates. Theexpected long-term rate of return on asset assumptions utilizing historical returns, correlations andinvestment manager forecasts are established for all relevant asset classes including public U.S. andinternational equities and government, corporate and other debt securities.
U.S. Pension Plan Non-U.S. Pension Plans
December 31, December 31,
2017 2016 2015 2017 2016 2015
For determining projectedbenefit obligation atyear-end:Discount rates N/A N/A N/A 1.90-5.50% 1.90-5.00% 2.35-5.50%Rates of increase in
compensation levels N/A N/A N/A 2.25-7.00% 2.25-7.00% 2.25-7.00%For determining net periodic
cost for the year:Discount rates N/A N/A 1.95% 1.90-5.00% 1.90-5.50% 2.20-5.00%Rates of increase in
compensation levels N/A N/A N/A 2.25-7.00% 2.25-7.00% 2.25-8.00%Expected long-term rates
of return on assets N/A N/A 2.95% 1.90-7.40% 4.30-7.00% 4.90-7.00%
The company evaluates the funded status of each of its retirement plans using the above assumptionsand determines the appropriate funding level considering applicable regulatory requirements, taxdeductibility, reporting considerations and other factors. The funding status of the plans is sensitive tochanges in long-term interest rates and returns on plan assets, and funding obligations could increasesubstantially if interest rates fall dramatically or returns on plan assets are below expectations. Assumingno changes in current assumptions, the company expects to contribute up to $25 million to its definedbenefit pension plans in 2018, which is expected to be in excess of the minimum funding required. If thediscount rates were reduced by 25 basis points, plan liabilities for the defined benefit pension plans wouldincrease by approximately $57 million.
The following table sets forth the target allocations and the weighted average actual allocations ofplan assets:
December 31,
Target Allocation 2017 2016
Asset category:Debt securities 65% - 75% 68% 68%Equity securities 20% - 30% 25% 26%Other 0% - 10% 7% 6%Total 100% 100%
F-27

FLUOR CORPORATION
NOTES TO CONSOLIDATED FINANCIAL STATEMENTS (Continued)
The company’s investment strategy is to maintain asset allocations that appropriately address riskwithin the context of seeking adequate returns. Investment allocations are determined by each plan’sgoverning body. Asset allocations may be affected by local regulations. Long-term allocation guidelines areset and expressed in terms of a target range allocation for each asset class to provide portfoliomanagement flexibility. Short-term deviations from these allocations may exist from time to time fortactical investment or strategic implementation purposes.
Investments in debt securities are used to provide stable investment returns while protecting thefunding status of the plans. Investments in equity securities are utilized to generate long-term capitalappreciation to mitigate the effects of increases in benefit obligations resulting from inflation, longer lifeexpectancy and salary growth. While most of the company’s plans are not prohibited from investing in thecompany’s common stock or debt securities, there are no such direct investments at the present time.
Plan assets included investments in common or collective trusts (or ‘‘CCTs’’), which offer efficientaccess to diversified investments across various asset categories. The estimated fair value of theinvestments in the common or collective trusts represents the net asset value of the shares or units of suchfunds as determined by the issuer. A redemption notice period of no more than 30 days is required for theplans to redeem certain investments in common or collective trusts. At the present time, there are no otherrestrictions on how the plans may redeem their investments.
Debt securities are comprised of corporate bonds, government securities, repurchase agreements andcommon or collective trusts with underlying investments in corporate bonds, government and asset backedsecurities and interest rate swaps. Corporate bonds primarily consist of investment-grade rated bonds andnotes, of which no significant concentration exists in any one rating category or industry. Governmentsecurities include international government bonds, some of which are inflation-indexed. Corporate bondsand government securities are valued based on pricing models, which are determined from a compilationof primarily observable market information, broker quotes in non-active markets or similar assets.
Equity securities are diversified across various industries and are comprised of common stocks ofinternational companies as well as common or collective trusts with underlying investments in common andpreferred stocks. Publicly traded corporate equity securities are valued based on the last trade or officialclose of an active market or exchange on the last business day of the plan’s year. Securities not traded onthe last business day are valued at the last reported bid price. As of both December 31, 2017 and 2016,direct investments in equity securities were concentrated in international securities.
Other is primarily comprised of common or collective trusts, short-term investment funds, guaranteedinvestment contracts and foreign currency contracts. Common or collective trusts hold underlyinginvestments in a variety of asset classes including commodities and foreign currency contracts. Theestimated fair value of foreign currency contracts is determined from broker quotes. Guaranteedinvestment contracts are insurance contracts that guarantee a principal repayment and a stated rate ofinterest. The estimated fair value of these insurance contracts represents the discounted value ofguaranteed benefit payments. These insurance contracts were classified as Level 3 investments, as definedbelow.
The fair value hierarchy established by ASC 820, ‘‘Fair Value Measurement,’’ prioritizes the use ofinputs used in valuation techniques into the following three levels:
• Level 1 — quoted prices in active markets for identical assets and liabilities• Level 2 — inputs other than quoted prices in active markets for identical assets and liabilities that
are observable, either directly or indirectly• Level 3 — unobservable inputs
F-28

FLUOR CORPORATION
NOTES TO CONSOLIDATED FINANCIAL STATEMENTS (Continued)
The company measures and reports assets and liabilities at fair value utilizing pricing informationreceived from third parties. The company performs procedures to verify the reasonableness of pricinginformation received for significant assets and liabilities classified as Level 2.
The following table presents, for each of the fair value hierarchy levels required under ASC 820-10,the plan assets and liabilities of the company’s defined benefit pension plans that are measured at fairvalue on a recurring basis as of December 31, 2017 and 2016:
December 31, 2017 December 31, 2016
Fair Value Hierarchy Fair Value Hierarchy
(in thousands) Total Level 1 Level 2 Level 3 Total Level 1 Level 2 Level 3
Assets:Equity securities:
Common stock $ 4,806 $4,806 $ — $ — $ 3,187 $3,187 $ — $ —
Debt securities:Corporate bonds 155,337 — 155,337 — 139,243 — 139,243 —Government securities 305,831 — 305,831 — 276,266 — 276,266 —
Other:Guaranteed investment
contracts 21,030 — — 21,030 19,075 — — 19,075Foreign currency contracts and
other 12,225 — 12,225 — 5,244 — 5,244 —
Liabilities:Debt securities:
Repurchase agreements (110,282) — (110,282) — (107,328) — (107,328) —
Other:Foreign currency contracts and
other (11,138) — (11,138) — (5,113) — (5,113) —
Plan assets measured at fair value,net $ 377,809 $4,806 $ 351,973 $21,030 $ 330,574 $3,187 $ 308,312 $19,075
Plan assets measured at net assetvalue:
CCTs — equity securities 265,647 240,203CCTs — debt securities 380,419 337,265CCTs — other 58,900 41,744
Plan assets not measured at fairvalue, net 3,431 1,161
Total plan assets, net $1,086,206 $ 950,947
F-29

FLUOR CORPORATION
NOTES TO CONSOLIDATED FINANCIAL STATEMENTS (Continued)
The following table presents a reconciliation of the beginning and ending balances of the fair valuemeasurements using significant unobservable inputs (Level 3):
(in thousands) 2017 2016
Balance at beginning of year $19,075 $ —Actual return on plan assets:
Assets still held at reporting date 3,388 (1,268)Assets sold during the period — —
Acquisitions — 21,923Purchases 16 —Sales — —Settlements (1,449) (1,580)
Balance at end of year $21,030 $19,075
The following table presents expected benefit payments for the company’s defined benefit pensionplans:
(in thousands)
Year Ended December 31,2018 $ 39,7532019 39,0552020 40,8562021 52,8482022 42,0982023 — 2027 218,507
F-30
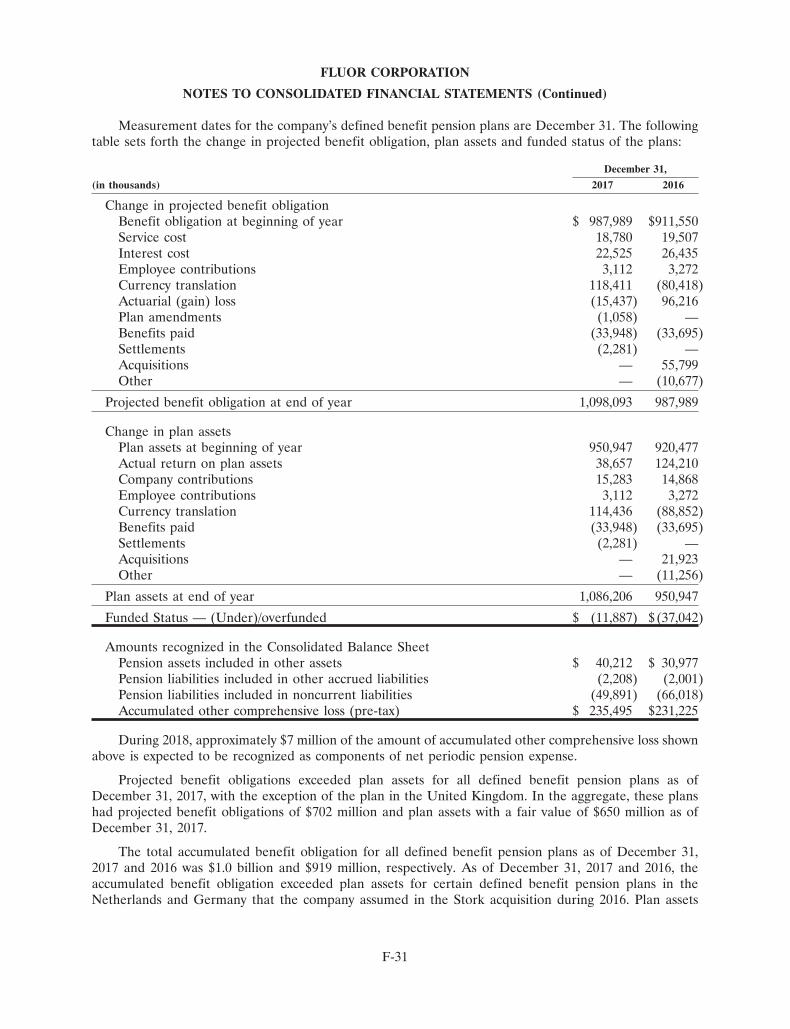
FLUOR CORPORATION
NOTES TO CONSOLIDATED FINANCIAL STATEMENTS (Continued)
Measurement dates for the company’s defined benefit pension plans are December 31. The followingtable sets forth the change in projected benefit obligation, plan assets and funded status of the plans:
December 31,
(in thousands) 2017 2016
Change in projected benefit obligationBenefit obligation at beginning of year $ 987,989 $911,550Service cost 18,780 19,507Interest cost 22,525 26,435Employee contributions 3,112 3,272Currency translation 118,411 (80,418)Actuarial (gain) loss (15,437) 96,216Plan amendments (1,058) —Benefits paid (33,948) (33,695)Settlements (2,281) —Acquisitions — 55,799Other — (10,677)
Projected benefit obligation at end of year 1,098,093 987,989
Change in plan assetsPlan assets at beginning of year 950,947 920,477Actual return on plan assets 38,657 124,210Company contributions 15,283 14,868Employee contributions 3,112 3,272Currency translation 114,436 (88,852)Benefits paid (33,948) (33,695)Settlements (2,281) —Acquisitions — 21,923Other — (11,256)
Plan assets at end of year 1,086,206 950,947
Funded Status — (Under)/overfunded $ (11,887) $(37,042)
Amounts recognized in the Consolidated Balance SheetPension assets included in other assets $ 40,212 $ 30,977Pension liabilities included in other accrued liabilities (2,208) (2,001)Pension liabilities included in noncurrent liabilities (49,891) (66,018)Accumulated other comprehensive loss (pre-tax) $ 235,495 $231,225
During 2018, approximately $7 million of the amount of accumulated other comprehensive loss shownabove is expected to be recognized as components of net periodic pension expense.
Projected benefit obligations exceeded plan assets for all defined benefit pension plans as ofDecember 31, 2017, with the exception of the plan in the United Kingdom. In the aggregate, these planshad projected benefit obligations of $702 million and plan assets with a fair value of $650 million as ofDecember 31, 2017.
The total accumulated benefit obligation for all defined benefit pension plans as of December 31,2017 and 2016 was $1.0 billion and $919 million, respectively. As of December 31, 2017 and 2016, theaccumulated benefit obligation exceeded plan assets for certain defined benefit pension plans in theNetherlands and Germany that the company assumed in the Stork acquisition during 2016. Plan assets
F-31

FLUOR CORPORATION
NOTES TO CONSOLIDATED FINANCIAL STATEMENTS (Continued)
exceeded the accumulated benefit obligation for each of the other plans (including the company’s legacyplan in the Netherlands) as of December 31, 2017 and 2016.
Multiemployer Pension Plans
In addition to the company’s defined benefit pension plans discussed above, the company participatesin multiemployer pension plans for its union construction and maintenance craft employees. Contributionsare based on the hours worked by employees covered under various collective bargaining agreements.Company contributions to these multiemployer pension plans were $118 million, $108 million and$22 million during 2017, 2016 and 2015, respectively. The increase in contributions during 2017 and 2016primarily resulted from an increase in craft employees at two nuclear power plant projects in the UnitedStates and a refinery project in Canada. The company is not aware of any significant future obligations orfunding requirements related to these plans other than the ongoing contributions that are paid as hours areworked by plan participants. None of these multiemployer pension plans are individually significant to thecompany.
The preceding information does not include amounts related to benefit plans applicable to employeesassociated with certain contracts with the U.S. Department of Energy because the company is notresponsible for the current or future funded status of these plans.
6. Fair Value of Financial Instruments
The fair value hierarchy established by ASC 820, ‘‘Fair Value Measurement,’’ prioritizes the use ofinputs used in valuation techniques into the following three levels:
• Level 1 — quoted prices in active markets for identical assets and liabilities• Level 2 — inputs other than quoted prices in active markets for identical assets and liabilities that
are observable, either directly or indirectly• Level 3 — unobservable inputs
The company measures and reports assets and liabilities at fair value utilizing pricing informationreceived from third parties. The company performs procedures to verify the reasonableness of pricinginformation received for significant assets and liabilities classified as Level 2.
F-32

FLUOR CORPORATION
NOTES TO CONSOLIDATED FINANCIAL STATEMENTS (Continued)
The following table presents, for each of the fair value hierarchy levels required under ASC 820-10,the company’s assets and liabilities that are measured at fair value on a recurring basis as of December 31,2017 and 2016:
December 31, 2017 December 31, 2016
Fair Value Hierarchy Fair Value Hierarchy
(in thousands) Total Level 1 Level 2 Level 3 Total Level 1 Level 2 Level 3
Assets:Cash and cash equivalents(1) $ 1,301 $ 701 $ 600 $ — $ 21,035 $21,035 $ — $ —Marketable securities, current(2) 57,783 — 57,783 — 54,840 — 54,840 —Deferred compensation trusts(3) 23,256 23,256 — — 37,510 37,510 — —Marketable securities,
noncurrent(4) 113,622 — 113,622 — 143,553 — 143,553 —Derivative assets(5)
Commodity contracts — — — — 83 — 83 —Foreign currency contracts 29,766 — 29,766 — 34,776 — 34,776 —
Liabilities:Derivative liabilities(5)
Commodity contracts $ — $ — $ — $ — $ 129 $ — $ 129 $ —Foreign currency contracts 29,127 — 29,127 — 43,574 — 43,574 —
(1) Consists of registered money market funds and investments in U.S. agency securities with maturities of threemonths or less at the date of purchase. The fair value of the money market funds represents the net asset value ofthe shares of such funds as of the close of business at the end of the period. The fair value of the investments inU.S. agency securities is based on pricing models, which are determined from a compilation of primarilyobservable market information, broker quotes in non-active markets or similar assets.
(2) Consists of investments in U.S. agency securities, U.S. Treasury securities, corporate debt securities andcommercial paper with maturities of less than one year that are valued based on pricing models, which aredetermined from a compilation of primarily observable market information, broker quotes in non-active marketsor similar assets.
(3) Consists of registered money market funds and an equity index fund valued at fair value. These investments,which are trading securities, represent the net asset value of the shares of such funds as of the close of business atthe end of the period based on the last trade or official close of an active market or exchange.
(4) Consists of investments in U.S. agency securities, U.S. Treasury securities and corporate debt securities withmaturities ranging from one year to three years that are valued based on pricing models, which are determinedfrom a compilation of primarily observable market information, broker quotes in non-active markets or similarassets.
(5) See Note 7 for the classification of commodity and foreign currency contracts in the Consolidated Balance Sheet.Commodity and foreign currency contracts are estimated using standard pricing models with market-basedinputs, which take into account the present value of estimated future cash flows.
All of the company’s financial instruments carried at fair value are included in the table above. All ofthe above financial instruments are available-for-sale securities except for those held in the deferredcompensation trusts (which are trading securities) and derivative assets and liabilities. The company hasdetermined that there was no other-than-temporary impairment of available-for-sale securities withunrealized losses, and the company expects to recover the entire cost basis of the securities. Theavailable-for-sale securities are made up of the following security types as of December 31, 2017: moneymarket funds of $1 million, U.S. agency securities of $3 million, U.S. Treasury securities of $69 million,corporate debt securities of $97 million and commercial paper of $3 million. As of December 31, 2016,available-for-sale securities consisted of money market funds of $21 million, U.S. agency securities of$11 million, U.S. Treasury securities of $87 million and corporate debt securities of $100 million. The
F-33

FLUOR CORPORATION
NOTES TO CONSOLIDATED FINANCIAL STATEMENTS (Continued)
amortized cost of these available-for-sale securities is not materially different from the fair value. During2017, 2016 and 2015, proceeds from sales and maturities of available-for-sale securities were $159 million,$286 million and $336 million, respectively.
In addition to assets and liabilities that are measured at fair value on a recurring basis, the company isrequired to measure certain assets and liabilities at fair value on a nonrecurring basis. See Notes 18 forfurther discussion of nonrecurring fair value measurements related to the company’s acquisition of Stork.
The carrying values and estimated fair values of the company’s financial instruments that are notrequired to be measured at fair value in the Consolidated Balance Sheet are as follows:
December 31, 2017 December 31, 2016Fair Value(in thousands) Hierarchy Carrying Value Fair Value Carrying Value Fair Value
Assets:Cash(1) Level 1 $1,104,316 $1,104,316 $1,133,295 $1,133,295Cash equivalents(2) Level 2 698,458 698,458 696,106 696,106Marketable securities, current(3) Level 2 103,351 103,351 56,197 56,197Notes receivable, including
noncurrent portion(4) Level 3 26,006 26,006 29,458 29,458Liabilities:
1.750% Senior Notes(5) Level 2 $ 597,674 $ 622,277 $ 523,629 $ 551,5823.375% Senior Notes(5) Level 2 496,859 512,475 496,011 512,5103.5% Senior Notes(5) Level 2 493,320 513,480 492,360 508,230Revolving Credit Facility(6) Level 2 — — 52,735 52,735Other borrowings, including
noncurrent portion(7) Level 2 31,106 31,106 35,457 35,457
(1) Cash consists of bank deposits. Carrying amounts approximate fair value.(2) Cash equivalents consist of held-to-maturity time deposits with maturities of three months or less at
the date of purchase. The carrying amounts of these time deposits approximate fair value because ofthe short-term maturity of these instruments.
(3) Marketable securities, current consist of held-to-maturity time deposits with original maturitiesgreater than three months that will mature within one year. The carrying amounts of these timedeposits approximate fair value because of the short-term maturity of these instruments. Amortizedcost is not materially different from the fair value.
(4) Notes receivable are carried at net realizable value which approximates fair value. Factors consideredby the company in determining the fair value include the credit worthiness of the borrower, currentinterest rates, the term of the note and any collateral pledged as security. Notes receivable areperiodically assessed for impairment.
(5) The fair value of the 1.750% Senior Notes, 3.375% Senior Notes and 3.5% Senior Notes wereestimated based on quoted market prices for similar issues.
(6) Amounts represent borrowings under the company’s A125 million Revolving Credit Facility whichexpired in April 2017, as discussed in Note 8. The carrying amount of the borrowings under thisrevolving credit facility approximates fair value because of the short-term maturity.
(7) Other borrowings primarily represent bank loans and other financing arrangements resulting from theacquisition of Stork. See Note 18 for a further discussion of the acquisition. The majority of theseborrowings mature within one year. The carrying amount of borrowings under these arrangementsapproximates fair value because of the short-term maturity.
F-34

FLUOR CORPORATION
NOTES TO CONSOLIDATED FINANCIAL STATEMENTS (Continued)
7. Derivatives and Hedging
As of December 31, 2017, the company had total gross notional amounts of $828 million of foreigncurrency contracts outstanding (primarily related to the British Pound, Kuwaiti Dinar, Indian Rupee,Philippine Peso and South Korean Won) that were designated as hedging instruments. The foreigncurrency contracts are of varying duration, none of which extend beyond December 2019. There were nocommodity contracts outstanding as of December 31, 2017. The impact to earnings due to hedgeineffectiveness was immaterial for the years ended December 31, 2017, 2016 and 2015.
The fair values of derivatives designated as hedging instruments under ASC 815 as of December 31,2017 and 2016 were as follows:
Asset Derivatives Liability Derivatives
Balance Sheet December 31, December 31, Balance Sheet December 31, December 31,(in thousands) Location 2017 2016 Location 2017 2016
Commodity contracts Other current assets $ — $ 83 Other accrued liabilities $ — $ 129Foreign currency contracts Other current assets 18,667 13,231 Other accrued liabilities 19,046 16,543Foreign currency contracts Other assets 6,472 21,545 Noncurrent liabilities 8,654 27,031
Total $25,139 $34,859 $27,700 $43,703
The pre-tax net gains (losses) recognized in earnings associated with the hedging instrumentsdesignated as fair value hedges for the years ended December 31, 2017, 2016 and 2015 were as follows:
Fair Value Hedges (in thousands) Location of Loss 2017 2016 2015
Foreign currency contracts Corporate general and administrative expense $5,415 $(2,886) $(5,191)
The pre-tax amount of gain (loss) recognized in earnings associated with the hedging instrumentsdesignated as fair value hedges noted in the table above offset the amount of gain (loss) recognized inearnings on the hedged items in the same locations in the Consolidated Statement of Earnings.
The after-tax amount of gain (loss) recognized in OCI and reclassified from AOCI into earningsassociated with the derivative instruments designated as cash flow hedges for the years endedDecember 31, 2017, 2016 and 2015 was as follows:
After-Tax Amount of GainAfter-Tax Amount of Gain (Loss) Reclassified from(Loss) Recognized in OCI AOCI into Earnings
Cash Flow Hedges (in thousands) 2017 2016 2015 Location of Gain (Loss) 2017 2016 2015
Commodity contracts $ 44 $ 401 $ (728) Total cost of revenue $ 52 $ (550) $ (385)Foreign currency contracts 5,455 (6,344) (2,532) Total cost of revenue 1,805 (3,224) (1,525)Interest rate contracts — — — Interest expense (1,049) (1,049) (1,049)
Total $5,499 $(5,943) $(3,260) $ 808 $(4,823) $(2,959)
As of December 31, 2017, the company also had total gross notional amounts of $106 million offoreign currency contracts outstanding that were not designated as hedging instruments. These contractsprimarily related to engineering contract obligations and monetary assets and liabilities denominated innonfunctional currencies. As of December 31, 2017, the company had total gross notional amounts of$81 million associated with contractual foreign currency payment provisions that were deemed embeddedderivatives. Net gains of $1.1 million associated with the company’s derivatives and embedded derivativeswere included in Cost of Revenue for the year ended December 31, 2017. A gain of less than $0.1 millionassociated with the company’s derivatives were included in Cost of Revenues for the year endedDecember 31, 2016.
F-35

FLUOR CORPORATION
NOTES TO CONSOLIDATED FINANCIAL STATEMENTS (Continued)
8. Financing Arrangements
As of December 31, 2017, the company had both combination of committed and uncommitted lines ofcredit available to be used for revolving loans and letters of credit. As of December 31, 2017, letters ofcredit and borrowings totaling $1.7 billion were outstanding under these committed and uncommitted linesof credit. The committed lines of credit include a $1.7 billion Revolving Loan and Letter of Credit Facilityand a $1.8 billion Revolving Loan and Letter of Credit Facility. Both facilities mature in February 2022.The company may utilize up to $1.75 billion in the aggregate of the combined $3.5 billion committed linesof credit for revolving loans, which may be used for acquisitions and/or general purposes. Each of thecredit facilities may be increased up to an additional $500 million subject to certain conditions, and containcustomary financial and restrictive covenants, including a maximum ratio of consolidated debt to tangiblenet worth of one-to-one and a cap on the aggregate amount of debt of the greater of $750 million orA750 million for the company’s subsidiaries. Borrowings under both facilities, which may be denominatedin USD, EUR, GBP or CAD, bear interest at rates based on the Eurodollar Rate or an alternative baserate, plus an applicable borrowing margin.
In connection with the Stork acquisition, the company assumed a A110 million Super Senior RevolvingCredit Facility that bore interest at EURIBOR plus 3.75%. In April 2016, the company repaid andreplaced the A110 million Super Senior Revolving Credit Facility with a A125 million Revolving CreditFacility which was used for revolving loans, bank guarantees, letters of credit and to fund working capital inthe ordinary course of business. This replacement facility, which bore interest at EURIBOR plus .75%,expired in April 2017. Outstanding borrowings of $53 million under the A125 million Revolving CreditFacility were repaid in 2017.
Letters of credit are provided in the ordinary course of business primarily to indemnify the company’sclients if the company fails to perform its obligations under its contracts. Surety bonds may be used as analternative to letters of credit.
Consolidated debt consisted of the following:
December 31,
(in thousands) 2017 2016
Current:Revolving Credit Facility $ — $ 52,735Other borrowings 27,361 29,508
Long-Term:1.750% Senior Notes $597,674 $523,6293.375% Senior Notes 496,859 496,0113.5% Senior Notes 493,320 492,360Other borrowings 3,745 5,949
In March 2016, the company issued A500 million of 1.750% Senior Notes (the ‘‘2016 Notes’’) dueMarch 21, 2023 and received proceeds of A497 million (or approximately $551 million), net of underwritingdiscounts. Interest on the 2016 Notes is payable annually on March 21 of each year, beginning onMarch 21, 2017. Prior to December 21, 2022, the company may redeem the 2016 Notes at a redemptionprice equal to 100 percent of the principal amount, plus a ‘‘make whole’’ premium described in theindenture. On or after December 21, 2022, the company may redeem the 2016 Notes at 100 percent of theprincipal amount plus accrued and unpaid interest, if any, to the date of redemption. Additionally, thecompany may redeem the 2016 Notes at any time upon the occurrence of certain changes in U.S. tax laws,as described in the indenture, at 100 percent of the principal amount plus accrued and unpaid interest, ifany, to the date of redemption.
F-36

FLUOR CORPORATION
NOTES TO CONSOLIDATED FINANCIAL STATEMENTS (Continued)
In November 2014, the company issued $500 million of 3.5% Senior Notes (the ‘‘2014 Notes’’) dueDecember 15, 2024 and received proceeds of $491 million, net of underwriting discounts. Interest on the2014 Notes is payable semi-annually on June 15 and December 15 of each year, and began on June 15,2015. Prior to September 15, 2024, the company may redeem the 2014 Notes at a redemption price equalto 100 percent of the principal amount, plus a ‘‘make whole’’ premium described in the indenture. On orafter September 15, 2024, the company may redeem the 2014 Notes at 100 percent of the principal amountplus accrued and unpaid interest, if any, to the date of redemption.
In September 2011, the company issued $500 million of 3.375% Senior Notes (the ‘‘2011 Notes’’) dueSeptember 15, 2021 and received proceeds of $492 million, net of underwriting discounts. Interest on the2011 Notes is payable semi-annually on March 15 and September 15 of each year, and began on March 15,2012. The company may, at any time, redeem the 2011 Notes at a redemption price equal to 100 percent ofthe principal amount, plus a ‘‘make whole’’ premium described in the indenture.
For the 2016 Notes, the 2014 Notes and the 2011 Notes, if a change of control triggering event occurs,as defined by the terms of the respective indentures, the company will be required to offer to purchase theapplicable notes at a purchase price equal to 101 percent of their principal amount, plus accrued andunpaid interest, if any, to the date of redemption. The company is generally not limited under theindentures governing the 2016 Notes, the 2014 Notes and the 2011 Notes in its ability to incur additionalindebtedness provided the company is in compliance with certain restrictive covenants, includingrestrictions on liens and restrictions on sale and leaseback transactions. We may, from time to time,repurchase the 2016 Notes, the 2014 Notes or the 2011 Notes in the open market, in privately-negotiatedtransactions or otherwise in such volumes, at such prices and upon such other terms as we deemappropriate.
In conjunction with the acquisition of Stork on March 1, 2016, the company assumed Stork’soutstanding debt obligations, including its 11.0% Super Senior Notes due 2017 (the ‘‘Stork Notes’’),borrowings under the A110 million Super Senior Revolving Credit Facility, and other debt obligations. OnMarch 2, 2016, the company gave notice to all holders of the Stork Notes of the full redemption of theoutstanding A273 million (or approximately $296 million) principal amount of Stork Notes plus aredemption premium of A7 million (or approximately $8 million) effective March 17, 2016. Theredemption of the Stork Notes was initially funded with additional borrowings under the company’s$1.7 billion Revolving Loan and Letter of Credit Facility, which borrowings were subsequently repaid fromthe net proceeds of the 2016 Notes. Certain other outstanding debt obligations assumed in the Storkacquisition of A20 million (or approximately $22 million) were settled in March 2016. See Note 18 for afurther discussion of the acquisition.
Other borrowings of $31 million and $35 million as of December 31, 2017 and 2016, respectively,primarily represent bank loans and other financing arrangements resulting from the acquisition of Stork,exclusive of the Stork Notes.
As of December 31, 2017, the company was in compliance with all of the financial covenants related toits debt agreements.
9. Other Noncurrent Liabilities
The company has deferred compensation and retirement arrangements for certain key executiveswhich generally provide for payments upon retirement, death or termination of employment. The deferralscan earn either market-based fixed or variable rates of return, at the option of the participants. As ofDecember 31, 2017 and 2016, $395 million and $356 million, respectively, of obligations related to theseplans were included in noncurrent liabilities. To fund these obligations, the company has establishednon-qualified trusts, which are classified as noncurrent assets. These trusts primarily hold company-ownedlife insurance policies, reported at cash surrender value, and marketable equity securities, reported at fair
F-37

FLUOR CORPORATION
NOTES TO CONSOLIDATED FINANCIAL STATEMENTS (Continued)
value. These trusts were valued at $382 million and $348 million as of December 31, 2017 and 2016,respectively. Periodic changes in value of these trust investments, most of which are unrealized, arerecognized in earnings, and serve to mitigate changes to obligations included in noncurrent liabilities whichare also reflected in earnings.
The company maintains appropriate levels of insurance for business risks, including workerscompensation and general liability. Insurance coverages contain various retention amounts for which thecompany provides accruals based on the aggregate of the liability for reported claims and an actuariallydetermined estimated liability for claims incurred but not reported. Other noncurrent liabilities included$56 million and $65 million as of December 31, 2017 and 2016, respectively, relating to these liabilities. Forcertain professional liability risks, the company’s retention amount under its claims-made insurancepolicies does not include an accrual for claims incurred but not reported because there is insufficientclaims history or other reliable basis to support an estimated liability. The company believes that retainedprofessional liability amounts are manageable risks and are not expected to have a material adverse impacton results of operations or financial position.
10. Stock-Based Plans
The company’s executive stock-based plans provide for grants of nonqualified or incentive stockoptions, restricted stock awards or units, stock appreciation rights and performance-based Value DriverIncentive (‘‘VDI’’) units. All executive stock-based plans are administered by the Organization andCompensation Committee of the Board of Directors (‘‘Committee’’) comprised of outside directors, noneof whom are eligible to participate in the executive plans. Recorded compensation cost for stock-basedpayment arrangements, which is generally recognized on a straight-line basis, totaled $26 million,$28 million and $36 million for the years ended December 31, 2017, 2016 and 2015, respectively, net ofrecognized tax benefits of $16 million, $17 million and $21 million for the years ended 2017, 2016 and 2015,respectively.
F-38

FLUOR CORPORATION
NOTES TO CONSOLIDATED FINANCIAL STATEMENTS (Continued)
The following table summarizes restricted stock, restricted stock unit and stock option activity:
Restricted Stock orRestricted Stock Units Stock Options
WeightedAverage Weighted
Grant Date AverageFair Value Exercise Price
Number Per Share Number Per Share
Outstanding as of December 31, 2014 868,521 $66.35 3,173,008 $62.92
Granted 556,323 58.85 963,288 59.05Expired or canceled (30,484) 64.74 (118,356) 63.60Vested/exercised (456,052) 62.92 (46,414) 38.25
Outstanding as of December 31, 2015 938,308 $63.62 3,971,526 $62.25
Granted 553,415 46.50 662,001 46.07Expired or canceled (16,298) 54.26 (63,229) 50.25Vested/exercised (443,062) 64.55 (88,917) 41.13
Outstanding as of December 31, 2016 1,032,363 $54.19 4,481,381 $60.45
Granted 402,783 54.88 1,103,817 55.35Expired or canceled (48,005) 51.58 (285,434) 63.07Vested/exercised (453,677) 59.89 (229,808) 40.82
Outstanding as of December 31, 2017 933,464 $51.85 5,069,956 $60.08
Options exercisable as of December 31, 2017 3,323,462 $63.41
Remaining unvested options outstanding and expectedto vest 1,694,099 $53.75
As of December 31, 2017, there was a maximum of 12,819,674 shares available for future grant underthe company’s various stock-based plans. Shares available for future grant included shares which may begranted by the Committee as either stock options, on a share-for-share basis, or restricted stock awards,restricted stock units and VDI units on the basis of one share for each 3.0 available shares.
Restricted stock units and restricted shares issued under the plans provide that shares awarded maynot be sold or otherwise transferred until service-based restrictions have lapsed and any performanceobjectives have been attained as established by the Committee. Restricted stock units are rights to receiveshares subject to certain service and performance conditions as established by the Committee. Generally,upon termination of employment, restricted stock units and restricted shares which have not vested areforfeited. For the company’s executives, the restricted units granted in 2017, 2016 and 2015 generally vestratably over three years. For the company’s directors, the restricted units and shares granted in 2017, 2016and 2015 vest or vested on the first anniversary of the grant. For directors and certain executives, restrictedstock units are subject to a post-vest holding period of three years. The fair value of restricted stock unitsand restricted shares represents the closing price of the company’s common stock on the date of grantdiscounted for the post-vest holding period, when applicable. For the years 2017, 2016 and 2015,recognized compensation expense of $21 million, $27 million and $31 million, respectively, is included incorporate general and administrative expense related to restricted stock awards and units. The fair value ofrestricted stock units and shares that vested during 2017, 2016 and 2015 was $25 million, $22 million and$26 million, respectively. The balance of unamortized restricted stock expense as of December 31, 2017was $8 million, which is expected to be recognized over a weighted-average period of 1.1 years.
F-39

FLUOR CORPORATION
NOTES TO CONSOLIDATED FINANCIAL STATEMENTS (Continued)
Option grant amounts and award dates are established by the Committee. The exercise price ofoptions represents the closing price of the company’s common stock on the date of grant. Options normallyextend for 10 years and become exercisable over a vesting period determined by the Committee. Theoptions granted in 2017, 2016 and 2015 vest ratably over three years. The aggregate intrinsic value,representing the difference between market value on the date of exercise and the option price, of stockoptions exercised during 2017, 2016 and 2015 was $2 million, $1 million and $1 million, respectively. Thebalance of unamortized stock option expense as of December 31, 2017 was $5 million, which is expected tobe recognized over a weighted-average period of 1.2 years. Expense associated with stock options for theyears ended December 31, 2017, 2016 and 2015, which is included in corporate general and administrativeexpense in the accompanying Consolidated Statement of Earnings, totaled $13 million, $10 million and$15 million, respectively.
The fair value of options on the grant date and the significant assumptions used in the Black-Scholesoption-pricing model are as follows:
December 31,
2017 2016
Weighted average grant date fair value $14.23 $12.55Expected life of options (in years) 5.8 6.1Risk-free interest rate 2.3% 1.6%Expected volatility 27.8% 32.4%Expected annual dividend per share $ 0.84 $ 0.84
The computation of the expected volatility assumption used in the Black-Scholes calculations is basedon a 50/50 blend of historical and implied volatility.
Information related to options outstanding as of December 31, 2017 is summarized below:
Options Outstanding Options Exercisable
Weighted WeightedAverage Weighted Average Weighted
Remaining Average Remaining AverageNumber Contractual Exercise Price Number Contractual Exercise Price
Range of Exercise Prices Outstanding Life (In Years) Per Share Exercisable Life (In Years) Per Share
$30.46 - $35.00 76,750 1.2 $30.46 76,750 1.2 $30.46$42.75 - $62.50 3,940,424 6.9 56.53 2,193,930 5.6 58.74$68.36 - $80.12 1,052,782 4.6 75.54 1,052,782 4.6 75.54
5,069,956 6.3 $60.08 3,323,462 5.2 $63.41
As of December 31, 2017, options outstanding and options exercisable had an aggregate intrinsicvalue of approximately $6 million and $4 million, respectively.
During 2017, 2016 and 2015, performance-based VDI units totaling 249,204; 296,052; and 430,970,respectively, were awarded to executives. These awards vest after a period of approximately three yearsand contain annual performance conditions for each of the three years of the vesting period. Beginning in2016, the performance targets for each year were generally established in the first quarter of that year.Under ASC 718, performance-based awards are not deemed granted for accounting purposes untilperformance targets have been established. Accordingly, only one-third of the units awards in any givenyear are deemed to be granted each year of the three year vesting period. VDI awards granted during 2017and 2016 are also subject to a post-vest holding period restriction for the period of three years. During2017, units totaling 83,068 and 92,094 under the 2017 and 2016 VDI plans, respectively, were granted atweighted-average grant date fair values of $53.35 per share and $51.62 per share, respectively. The grantdate fair value is determined by adjusting the closing price of the company’s common stock on the date ofgrant for the post-vest holding period discount and for the effect of the market condition, when applicable.
F-40

FLUOR CORPORATION
NOTES TO CONSOLIDATED FINANCIAL STATEMENTS (Continued)
For awards granted under the 2017 VDI plan, the number of units will be adjusted at the end of eachperformance period based on achievement of certain performance targets and market conditions, asdefined in the VDI award agreement. For awards granted under the 2016 VDI plan, the number of units isadjusted at the end of each performance period based only on the achievement of certain performancetargets, as defined in the VDI award agreement. Units granted under the 2017, 2016 and 2015 VDI planscan only be settled in company stock and are accounted for as equity awards in accordance with ASC 718.Compensation expense of $8 million, $8 million and $11 million related to stock-based VDI units isincluded in corporate general and administrative expense in 2017, 2016 and 2015, respectively. The balanceof unamortized compensation expense associated with VDI units as of December 31, 2017 was $1 million,which is expected to be recognized over a weighted-average period of less than one year. During 2017, thecompany paid $26 million for fully vested VDI awards granted in 2014 that were settleable in cash.
11. Earnings Per Share
Basic EPS is calculated by dividing net earnings attributable to Fluor Corporation by the weightedaverage number of common shares outstanding during the period. Potentially dilutive securities includeemployee stock options, restricted stock units and shares, VDI units and the 1.5% Convertible SeniorNotes (in 2015). Diluted EPS reflects the assumed exercise or conversion of all dilutive securities using thetreasury stock method. As a result of the adoption of ASU 2016-09 in the first quarter of 2017, the excesstax benefits and tax deficiencies that were previously recorded to additional paid-in capital have beenexcluded from the hypothetical proceeds used to calculate the repurchase of shares under the treasurystock method beginning in the first quarter of 2017.
The calculations of the basic and diluted EPS for the years ended December 31, 2017, 2016 and 2015under the treasury stock method are presented below:
Year Ended December 31,
(in thousands, except per share amounts) 2017 2016 2015
Amounts attributable to Fluor Corporation:Earnings from continuing operations $191,377 $281,401 $418,170Loss from discontinued operations, net of taxes — — (5,658)Net earnings $191,377 $281,401 $412,512
Basic EPS attributable to Fluor Corporation:Weighted average common shares outstanding 139,761 139,171 144,805
Earnings from continuing operations $ 1.37 $ 2.02 $ 2.89Loss from discontinued operations, net of taxes — — (0.04)Net earnings $ 1.37 $ 2.02 $ 2.85
Diluted EPS attributable to Fluor Corporation:Weighted average common shares outstanding 139,761 139,171 144,805
Diluted effect:Employee stock options, restricted stock units and shares and VDI
units 1,132 1,741 1,827Conversion equivalent of dilutive convertible debt — — 90Weighted average diluted shares outstanding 140,893 140,912 146,722
Earnings from continuing operations $ 1.36 $ 2.00 $ 2.85Loss from discontinued operations, net of taxes — — (0.04)Net earnings $ 1.36 $ 2.00 $ 2.81Anti-dilutive securities not included above 4,706 3,843 3,408
F-41

FLUOR CORPORATION
NOTES TO CONSOLIDATED FINANCIAL STATEMENTS (Continued)
During the years ended December 31, 2016 and 2015, the company repurchased and canceled 202,650and 10,104,988 shares of its common stock, respectively, under its stock repurchase program for$10 million and $510 million, respectively.
12. Lease Obligations
Net rental expense amounted to approximately $144 million, $152 million and $169 million in theyears ended December 31, 2017, 2016 and 2015, respectively. The company’s lease obligations relateprimarily to office facilities, equipment used in connection with long-term construction contracts and otherpersonal property. Net rental expense in 2017 and 2016 was lower compared to 2015, primarily due to adecrease in rental equipment and facilities required to support project execution activities in the Energy,Chemicals & Mining segment.
The company’s obligations for minimum rentals under non-cancelable operating leases (excludingproject lease agreements which are fully reimbursable by the client) are as follows:
Year Ended December 31, (in thousands)
2018 $86,3002019 70,9002020 55,8002021 35,5002022 22,700Thereafter 55,500
During 2015, the company sold two office buildings located in California for net proceeds of$82 million and subsequently entered into a twelve year lease with the purchaser. The resulting gain on thesale of the property was approximately $58 million, of which $7 million was recognized during the fourthquarter of 2015 and $4 million was recognized during both 2017 and 2016. These gains were included incorporate general and administrative expense in the Consolidated Statement of Earnings. The remainingdeferred gain of approximately $43 million is being amortized over the remaining life of the lease on astraight-line basis.
13. Noncontrolling Interests
The company applies the provisions of ASC 810-10-45, which establishes accounting and reportingstandards for ownership interests in subsidiaries held by parties other than the parent, the amount ofconsolidated net earnings attributable to the parent and to the noncontrolling interests, changes in aparent’s ownership interest and the valuation of retained noncontrolling equity investments when asubsidiary is deconsolidated.
As required by ASC 810-10-45, the company has separately disclosed on the face of the ConsolidatedStatement of Earnings for all periods presented the amount of net earnings attributable to the companyand the amount of net earnings attributable to noncontrolling interests. For the years ended December 31,2017, 2016 and 2015, net earnings attributable to noncontrolling interests were $73 million, $46 million and$62 million, respectively. Income taxes associated with earnings attributable to noncontrolling interestswere immaterial in all periods presented. Distributions paid to noncontrolling interests were $47 million,$58 million and $59 million for the years ended December 31, 2017, 2016 and 2015, respectively. Capitalcontributions by noncontrolling interests were $6 million, $9 million and $5 million for the years endedDecember 31, 2017, 2016 and 2015, respectively.
14. Contingencies and Commitments
The company and certain of its subsidiaries are subject to litigation, claims and other commitmentsand contingencies arising in the ordinary course of business. Although the asserted value of these matters
F-42

FLUOR CORPORATION
NOTES TO CONSOLIDATED FINANCIAL STATEMENTS (Continued)
may be significant, the company currently does not expect that the ultimate resolution of any open matterswill have a material adverse effect on its consolidated financial position or results of operations.
Fluor Australia Ltd., a wholly-owned subsidiary of the company (‘‘Fluor Australia’’), completed a costreimbursable engineering, procurement and construction management services project for Santos Ltd.(‘‘Santos’’) involving a large network of natural gas gathering and processing facilities in Queensland,Australia. On December 13, 2016, Santos filed an action in Queensland Supreme Court against FluorAustralia, asserting various causes of action and seeking damages of approximately AUD $1.47 billion.Santos has joined Fluor Corporation to the matter on the basis of a parent company guarantee issued forthe project. The company believes that the claims asserted by Santos are without merit and is vigorouslydefending these claims. Based upon the present status of this matter, the company does not believe it isprobable that a loss will be incurred. Accordingly, the company has not recorded a charge as a result of thisaction.
Other Matters
The company has made claims arising from the performance under its contracts. The companyrecognizes revenue, but not profit, for certain claims (including change orders in dispute and unapprovedchange orders in regard to both scope and price) when it is determined that recovery of incurred costs isprobable and the amounts can be reliably estimated. Under claims accounting (ASC 605-35-25), theserequirements are satisfied when (a) the contract or other evidence provides a legal basis for the claim,(b) additional costs were caused by circumstances that were unforeseen at the contract date and not theresult of deficiencies in the company’s performance, (c) claim-related costs are identifiable and consideredreasonable in view of the work performed, and (d) evidence supporting the claim is objective andverifiable. Similarly, the company recognizes disputed back charges to suppliers or subcontractors as areduction of cost when the same requirements have been satisfied. The company periodically evaluates itspositions and amounts recognized with respect to all its claims and back charges. As of December 31, 2017and 2016, the company had recorded $124 million and $61 million, respectively, of claim revenue for costsincurred to date and such costs are included in contract work in progress. Additional costs, which willincrease the claim revenue balance over time, are expected to be incurred in future periods. The companyhad also recorded disputed back charges totaling $18 million and $41 million as of December 31, 2017 and2016, respectively. The company believes the ultimate recovery of amounts related to these claims andback charges is probable in accordance with ASC 605-35-25.
From time to time, the company enters into significant contracts with the U.S. government and itsagencies. Government contracts are subject to audits and investigations by government representativeswith respect to the company’s compliance with various restrictions and regulations applicable togovernment contractors, including but not limited to the allowability of costs incurred under reimbursablecontracts. In connection with performing government contracts, the company maintains reserves forestimated exposures associated with these matters.
The company’s operations are subject to and affected by federal, state and local laws and regulationsregarding the protection of the environment. The company maintains reserves for potential futureenvironmental cost where such obligations are either known or considered probable, and can bereasonably estimated. The company believes, based upon present information available to it, that itsreserves with respect to future environmental cost are adequate and such future cost will not have amaterial effect on the company’s consolidated financial position, results of operations or liquidity.
15. Guarantees
In the ordinary course of business, the company enters into various agreements providingperformance assurances and guarantees to clients on behalf of certain unconsolidated and consolidatedpartnerships, joint ventures and other jointly executed contracts. These agreements are entered into
F-43

FLUOR CORPORATION
NOTES TO CONSOLIDATED FINANCIAL STATEMENTS (Continued)
primarily to support the project execution commitments of these entities. The performance guaranteeshave various expiration dates ranging from mechanical completion of the project being constructed to aperiod extending beyond contract completion in certain circumstances. The maximum potential amount offuture payments that the company could be required to make under outstanding performance guarantees,which represents the remaining cost of work to be performed by or on behalf of third parties underengineering and construction contracts, was estimated to be $14 billion as of December 31, 2017. Amountsthat may be required to be paid in excess of estimated cost to complete contracts in progress are notestimable. For cost reimbursable contracts, amounts that may become payable pursuant to guaranteeprovisions are normally recoverable from the client for work performed under the contract. For lump-sumor fixed-price contracts, the performance guarantee amount is the cost to complete the contracted work,less amounts remaining to be billed to the client under the contract. Remaining billable amounts could begreater or less than the cost to complete. In those cases where costs exceed the remaining amounts payableunder the contract, the company may have recourse to third parties, such as owners, co-venturers,subcontractors or vendors for claims. The company assessed its performance guarantee obligation as ofDecember 31, 2017 and 2016 in accordance with ASC 460, ‘‘Guarantees,’’ and the carrying value of theliability was not material.
Financial guarantees, made in the ordinary course of business in certain limited circumstances, areentered into with financial institutions and other credit grantors and generally obligate the company tomake payment in the event of a default by the borrower. These arrangements generally require theborrower to pledge collateral to support the fulfillment of the borrower’s obligation.
16. Partnerships and Joint Ventures
In the normal course of business, the company forms partnerships or joint ventures primarily for theexecution of single contracts or projects. The majority of these partnerships or joint ventures arecharacterized by a 50 percent or less, noncontrolling ownership or participation interest, with decisionmaking and distribution of expected gains and losses typically being proportionate to the ownership orparticipation interest. Many of the partnership and joint venture agreements provide for capital calls tofund operations, as necessary. Accounts receivables related to work performed for unconsolidatedpartnerships and joint ventures included in ‘‘Accounts and notes receivable, net’’ on the ConsolidatedBalance Sheet were $83 million and $392 million as of December 31, 2017 and 2016, respectively. Thedecrease in this receivable balance in 2017 resulted primarily from collections from one Energy,Chemicals & Mining joint venture project in the United States. Notes receivable from unconsolidatedpartnerships and joint ventures included in ‘‘Accounts and notes receivable, net’’ and ‘‘Other assets’’ on theConsolidated Balance Sheet were $22 million and $19 million as of December 31, 2017 and 2016,respectively.
For unconsolidated construction partnerships and joint ventures, the company generally recognizes itsproportionate share of revenue, cost and profit in its Consolidated Statement of Earnings and uses theone-line equity method of accounting on the Consolidated Balance Sheet, which is a common applicationof ASC 810-10-45-14 in the construction industry. The equity method of accounting is also used for otherinvestments in entities where the company has significant influence. The company’s investments inunconsolidated partnerships and joint ventures accounted for under these methods amounted to$726 million and $454 million as of December 31, 2017 and 2016, respectively, and were classified under‘‘Investments’’ and ‘‘Other accrued liabilities’’ on the Consolidated Balance Sheet. The following is asummary of aggregate, unaudited balance sheet data for these unconsolidated partnerships and jointventures where the company’s investment is presented as a one-line equity method investment: As ofDecember 31, 2017, current assets of $3.7 billion, noncurrent assets of $1.7 billion, current liabilities of$2.1 billion and noncurrent liabilities of $1.7 billion; as of December 31, 2016, current assets of $3.5 billion,noncurrent assets of $1.3 billion, current liabilities of $3.0 billion and noncurrent liabilities of $628 million.Additionally, the following is a summary of aggregate, unaudited income statement data for
F-44

FLUOR CORPORATION
NOTES TO CONSOLIDATED FINANCIAL STATEMENTS (Continued)
unconsolidated partnerships and joint ventures where the equity method of accounting is used to recognizethe company’s share of net earnings or losses of investees: Revenue of $1.5 billion, $1.6 billion and$961 million for 2017, 2016 and 2015, respectively; cost of revenue of $1.4 billion, $1.5 billion and$926 million for 2017, 2016 and 2015, respectively; and net earnings of $26 million, $30 million and$14 million for 2017, 2016 and 2015, respectively.
In February 2016, the company made an initial cash investment of $350 million in COOEC FluorHeavy Industries Co., Ltd. (‘‘CFHI’’), a joint venture in which the company has a 49% ownership interestand Offshore Oil Engineering Co., Ltd., a subsidiary of China National Offshore Oil Corporation, has 51%ownership interest. Through CFHI, the two companies own, operate and manage the Zhuhai FabricationYard in China’s Guangdong province. The company made additional investments of $62 million in 2016and $26 million in 2017 and has a future funding commitment of $52 million.
Variable Interest Entities
In accordance with ASC 810, ‘‘Consolidation,’’ the company assesses its partnerships and jointventures at inception to determine if any meet the qualifications of a VIE. The company considers apartnership or joint venture a VIE if it has any of the following characteristics: (a) the total equityinvestment is not sufficient to permit the entity to finance its activities without additional subordinatedfinancial support, (b) characteristics of a controlling financial interest are missing (either the ability tomake decisions through voting or other rights, the obligation to absorb the expected losses of the entity orthe right to receive the expected residual returns of the entity), or (c) the voting rights of the equity holdersare not proportional to their obligations to absorb the expected losses of the entity and/or their rights toreceive the expected residual returns of the entity, and substantially all of the entity’s activities eitherinvolve or are conducted on behalf of an investor that has disproportionately few voting rights. Upon theoccurrence of certain events outlined in ASC 810, the company reassesses its initial determination ofwhether the partnership or joint venture is a VIE. The majority of the company’s partnerships and jointventures qualify as VIEs because the total equity investment is typically nominal and not sufficient topermit the entity to finance its activities without additional subordinated financial support.
The company also performs a qualitative assessment of each VIE to determine if the company is itsprimary beneficiary, as required by ASC 810. The company concludes that it is the primary beneficiary andconsolidates the VIE if the company has both (a) the power to direct the economically significant activitiesof the entity and (b) the obligation to absorb losses of, or the right to receive benefits from, the entity thatcould potentially be significant to the VIE. The company considers the contractual agreements that definethe ownership structure, distribution of profits and losses, risks, responsibilities, indebtedness, voting rightsand board representation of the respective parties in determining if the company is the primarybeneficiary. The company also considers all parties that have direct or implicit variable interests whendetermining whether it is the primary beneficiary. As required by ASC 810, management’s assessment ofwhether the company is the primary beneficiary of a VIE is continuously performed.
The net carrying value of the unconsolidated VIEs classified under ‘‘Investments’’ and ‘‘Other accruedliabilities’’ on the Consolidated Balance Sheet was a net asset of $216 million as of December 31, 2017 anda net liability of $9 million as of December 31, 2016. Some of the company’s VIEs have debt; however,such debt is typically non-recourse in nature. The company’s maximum exposure to loss as a result of itsinvestments in unconsolidated VIEs is typically limited to the aggregate of the carrying value of theinvestment and future funding necessary to satisfy the contractual obligations of the VIE. Future fundingcommitments as of December 31, 2017 for the unconsolidated VIEs were $39 million.
In some cases, the company is required to consolidate certain VIEs. As of December 31, 2017, thecarrying values of the assets and liabilities associated with the operations of the consolidated VIEs were$1.2 billion and $700 million, respectively. As of December 31, 2016, the carrying values of the assets andliabilities associated with the operations of the consolidated VIEs were $959 million and $566 million,
F-45

FLUOR CORPORATION
NOTES TO CONSOLIDATED FINANCIAL STATEMENTS (Continued)
respectively. The assets of a VIE are restricted for use only for the particular VIE and are not available forgeneral operations of the company.
The company has agreements with certain VIEs to provide financial or performance assurances toclients. See Note 15 for a further discussion of such agreements.
17. Operations by Business Segment and Geographic Area
The company provides professional services in the fields of engineering, procurement, construction,fabrication and modularization, commissioning and maintenance, as well as project management services,on a global basis and serves a diverse set of industries worldwide.
During the first quarter of 2017, the company changed the name of the Maintenance, Modification &Asset Integrity segment to Diversified Services. The company reports its operating results in the followingfour reportable segments: Energy, Chemicals & Mining; Industrial, Infrastructure & Power; Government;and Diversified Services.
The Energy, Chemicals & Mining segment is the company’s commodity-related segment whichfocuses on opportunities in the upstream, midstream, downstream, chemical, petrochemical, offshore andonshore oil and gas production, liquefied natural gas, pipeline, metals and mining markets. This segmenthas long served a broad spectrum of commodity-based industries as an integrated solutions provideroffering a full range of design, engineering, procurement, construction, fabrication and projectmanagement services. The revenue of a single customer and its affiliates of the Energy, Chemicals &Mining segment amounted to 13 percent, 10 percent and 11 percent of the company’s consolidatedrevenue during the years ended December 31, 2017, 2016 and 2015, respectively.
The Industrial, Infrastructure & Power segment provides design, engineering, procurement,construction and project management services to the transportation, life sciences, advancedmanufacturing, water and power sectors. The Industrial, Infrastructure & Power segment includes theoperations of NuScale Power, LLC, a small modular nuclear reactor technology company, which ismanaged as a separate operating segment within the Industrial, Infrastructure & Power segment.
The Government segment provides engineering, construction, logistics, base and facilities operationsand maintenance, contingency response and environmental and nuclear services to the U.S. governmentand governments abroad. The percentage of the company’s consolidated revenue from work performed forvarious agencies of the U.S. government was 15 percent, 13 percent and 12 percent during the years endedDecember 31, 2017, 2016 and 2015, respectively.
The Diversified Services segment includes Stork, which provides facility start-up and management,plant and facility maintenance, operations support and asset management services to the oil and gas,chemicals, life sciences, mining and metals, consumer products and manufacturing industries. TheDiversified Services segment also includes the operations of the company’s equipment and temporarystaffing businesses and power services.
The reportable segments follow the same accounting policies as those described in Major AccountingPolicies. Management evaluates a segment’s performance based upon segment profit. The company incurscost and expenses and holds certain assets at the corporate level which relate to its business as a whole.Certain of these amounts have been charged to the company’s business segments by various methods,largely on the basis of usage. Total assets not allocated to segments and held in ‘‘Corporate and other’’primarily include cash, marketable securities, income-tax related assets, pension assets, deferredcompensation trust assets and corporate property, plant and equipment.
Segment profit is an earnings measure that the company utilizes to evaluate and manage its businessperformance. Segment profit is calculated as revenue less cost of revenue and earnings attributable tononcontrolling interests excluding: corporate general and administrative expense; interest expense; interest
F-46

FLUOR CORPORATION
NOTES TO CONSOLIDATED FINANCIAL STATEMENTS (Continued)
income; domestic and foreign income taxes; other non-operating income and expense items; and loss fromdiscontinued operations.
Operating Information by Segment
Year Ended December 31,
(in millions) 2017 2016 2015
External revenueEnergy, Chemicals & Mining $ 9,376.7 $ 9,754.2 $11,865.4Industrial, Infrastructure & Power 4,367.5 4,094.5 2,264.0Government 3,232.7 2,720.0 2,557.4Diversified Services 2,544.1 2,467.8 1,427.2
Total external revenue $19,521.0 $19,036.5 $18,114.0
Segment profit (loss)Energy, Chemicals & Mining $ 454.7 $ 401.5 $ 866.6Industrial, Infrastructure & Power (170.8) 135.8 (44.9)Government 127.9 85.1 83.1Diversified Services 133.6 121.9 127.4
Total segment profit $ 545.4 $ 744.3 $ 1,032.2
Depreciation and amortization of fixed assetsEnergy, Chemicals & Mining $ — $ — $ —Industrial, Infrastructure & Power 4.7 3.9 4.0Government 2.8 2.3 3.2Diversified Services 137.6 139.5 113.4Corporate and other 61.0 65.4 68.1
Total depreciation and amortization of fixed assets $ 206.1 $ 211.1 $ 188.7
Capital expendituresEnergy, Chemicals & Mining $ — $ — $ —Industrial, Infrastructure & Power 27.7 2.2 6.1Government 4.2 2.1 3.9Diversified Services 187.1 153.1 158.9Corporate and other 64.1 78.5 71.3
Total capital expenditures $ 283.1 $ 235.9 $ 240.2
Total assetsEnergy, Chemicals & Mining $ 1,815.2 $ 2,348.0Industrial, Infrastructure & Power 926.3 750.1Government 732.0 493.7Diversified Services 2,120.4 1,952.7Corporate and other 3,733.8 3,671.9
Total assets $ 9,327.7 $ 9,216.4
GoodwillEnergy, Chemicals & Mining $ 15.8 $ 15.5Industrial, Infrastructure & Power 14.6 13.6Government 58.0 58.0Diversified Services 476.3 445.1
Total goodwill $ 564.7 $ 532.2
F-47

FLUOR CORPORATION
NOTES TO CONSOLIDATED FINANCIAL STATEMENTS (Continued)
• Energy, Chemicals & Mining. Segment profit for 2017 was adversely affected by pre-tax chargestotaling $44 million (or $0.20 per diluted share) resulting from forecast revisions for estimated costincreases on a downstream project. Segment profit for 2016 was adversely affected by pre-taxcharges totaling $265 million (or $1.20 per diluted share) related to forecast revisions for estimatedcost increases on a petrochemicals project in the United States. The decrease in total assets in theEnergy, Chemicals & Mining segment resulted from decreased working capital in support of projectexecution activities.
• Industrial, Infrastructure & Power. Segment profit for 2017 was adversely affected by pre-tax chargestotaling $260 million (or $1.18 per diluted share) resulting from forecast revisions for estimated costgrowth at three fixed-price, gas-fired power plant projects in the southeastern United States.Segment profit for 2015 included a loss of $60 million (or $0.26 per diluted share) resulting fromforecast revisions for a large gas-fired power plant in Brunswick County, Virginia. Segment profitfor all periods included the operations of NuScale, which are primarily for research anddevelopment activities associated with the licensing and commercialization of small modularnuclear reactor technology. NuScale expenses included in the determination of segment profit were$76 million, $92 million and $80 million during 2017, 2016 and 2015, respectively. NuScale expensesfor 2017, 2016 and 2015 were reported net of qualified reimbursable expenses of $48 million,$57 million and $65 million, respectively. (See Note 1 for a further discussion of the cooperativeagreement between NuScale and the DOE.) The increase in total assets in the Industrial,Infrastructure & Power segment resulted from increased working capital in support of projectexecution activities.
Total assets in the Industrial, Infrastructure & Power segment as of December 31, 2017 includedaccounts receivable related to the two subcontracts with Westinghouse to manage the constructionworkforce at the Plant Vogtle and V.C. Summer nuclear power plant projects. On March 29, 2017(‘‘the bankruptcy petition date’’), Westinghouse filed for Chapter 11 bankruptcy protection in theU.S. Bankruptcy Court, Southern District of New York. In the third quarter of 2017, the V.C.Summer project was cancelled by the owner. In the fourth quarter of 2017, the remaining scope ofwork on the Plant Vogtle project was transferred to a new contractor. In addition to amounts duefor post-petition services, total assets as of December 31, 2017 included amounts due of $66 millionand $2 million for services provided to the V.C. Summer and Plant Vogtle projects, respectively,prior to the date of the bankruptcy petition. The company filed mechanic’s liens in South Carolinaagainst the property of the owner of the V.C. Summer project for amounts due for pre-petitionservices rendered to Westinghouse. Based on the company’s evaluation of available information, thecompany does not expect the close-out of these projects to have a material impact on the company’sresults of operations.
• Government. The increase in total assets in the Government segment resulted from increasedworking capital in support of project execution activities for the Power Infrastructure RestorationProject in Puerto Rico.
• Diversified Services. During 2017, 2016 and 2015, intercompany revenue for the Diversified Servicessegment, excluded from the amounts shown above, was $589 million, $524 million and $439 million,respectively. The increase in total assets in the Diversified Services segment resulted from increasedworking capital in support of project execution activities.
F-48

FLUOR CORPORATION
NOTES TO CONSOLIDATED FINANCIAL STATEMENTS (Continued)
Reconciliation of Total Segment Profit to Earnings from Continuing Operations Before Taxes
Year Ended December 31,
(in millions) 2017 2016 2015
Total segment profit $ 545.4 $ 744.3 $1,032.2Gain related to a partial sale of a subsidiary — — 68.2Pension settlement charge — — (239.9)Corporate general and administrative expense (192.2) (191.1) (168.3)Interest income (expense), net (39.9) (52.6) (28.1)Earnings attributable to noncontrolling interests 73.1 46.0 62.5
Earnings from continuing operations before taxes $ 386.4 $ 546.6 $ 726.6
• Corporate general and administrative expense. Foreign currency exchange losses of $21 million andforeign currency exchange gains of $35 million were included in corporate general andadministrative expense during 2017 and 2016, respectively. Corporate general and administrativeexpense also included organizational realignment expenses (primarily severance and facility exitcosts) of $20 million and $38 million during 2017 and 2016, respectively. Additionally, corporategeneral and administrative expense in 2016 included transaction and integration costs associatedwith the Stork acquisition of $25 million.
Operating Information by Geographic Area
Engineering services for international projects are often performed within the United States or acountry other than where the project is located. Revenue associated with these services has been classifiedwithin the geographic area where the work was performed.
External Revenue Total AssetsYear Ended December 31, As of December 31,
(in millions) 2017 2016 2015 2017 2016
United States $10,071.1 $ 9,891.9 $ 7,857.3 $4,808.1 $4,842.4Canada 1,447.5 2,170.1 2,459.3 490.5 749.5Asia Pacific (includes Australia) 985.5 1,010.2 870.4 729.3 645.8Europe 4,358.3 3,372.1 2,509.2 2,238.0 2,103.7Central and South America 968.2 1,006.2 2,560.4 675.0 499.7Middle East and Africa 1,690.4 1,586.0 1,857.4 386.8 375.3
Total $19,521.0 $19,036.5 $18,114.0 $9,327.7 $9,216.4
Non-Operating (Income) Expense
Non-operating income (net of expenses) of $6 million and $7 million was included in corporategeneral and administrative expense in 2017 and 2015, respectively. Non-operating expenses (net ofincome) of $1 million were included in corporate general and administrative expense in 2016.
18. Acquisitions of Stork Holding B.V.
On March 1, 2016 (‘‘the acquisition date’’), the company acquired 100 percent of Stork for anaggregate purchase price of A695 million (or approximately $756 million), including the assumption of debtand other liabilities. Stork, based in the Netherlands, is a global provider of maintenance, modification andasset integrity services associated with large existing industrial facilities in the oil and gas, chemicals,petrochemicals, industrial and power markets. The company paid A276 million (or approximately
F-49
FLUOR CORPORATION
NOTES TO CONSOLIDATED FINANCIAL STATEMENTS (Continued)
$300 million) in cash consideration. The company borrowed A200 million (or approximately $217 million)under its $1.7 billion Revolving Loan and Letter of Credit Facility, and paid A76 million (or approximately$83 million) of cash on hand to initially finance the Stork acquisition. The A200 million borrowed under the$1.7 billion Revolving Loan and Letter of Credit Facility was subsequently repaid from the net proceeds ofthe 2016 Notes as discussed in Note 8.
In conjunction with the acquisition, the company assumed Stork’s outstanding debt obligations,including the Stork Notes, borrowings under a A110 million Super Senior Revolving Credit Facility, andother debt obligations. On March 2, 2016, the company gave notice to all holders of the Stork Notes of thefull redemption of the outstanding A273 million (or approximately $296 million) principal amount of StorkNotes plus a redemption premium of A7 million (or approximately $8 million) effective March 17, 2016.The redemption of the Stork Notes was initially funded with additional borrowings under the company’s$1.7 billion Revolving Loan and Letter of Credit Facility, which borrowings were subsequently repaid fromthe net proceeds of the 2016 Notes. Certain other outstanding debt obligations assumed in the Storkacquisition of A20 million (or approximately $22 million) were settled in March 2016. In April 2016, thecompany repaid and replaced the A110 million Super Senior Revolving Credit Facility with a A125 millionRevolving Credit Facility that was available to fund working capital in the ordinary course of business. Thisreplacement facility, which bore interest at EURIBOR plus .75%, expired in April 2017. Outstandingborrowings of $53 million under the A125 million Revolving Credit Facility were repaid in the first quarterof 2017.
The company completed its valuation of Stork’s assets and liabilities at the end of 2016. The aggregatepurchase price noted above was allocated to the major categories of assets acquired and liabilities assumedbased upon their estimated fair values as of the acquisition date. The excess of the purchase price over theestimated fair value of the net tangible and identifiable intangible assets acquired, totaling A384 million (orapproximately $417 million), has been recorded as goodwill.
The fair value of acquired intangible assets, which consisted primarily of customer relationships andtrade names, as well as below market contracts and leases were determined using income-basedapproaches that utilized unobservable Level 3 inputs, including significant management assumptions suchas forecasted revenue and operating margins, customer attrition, and weighted average cost of capital.Customer relationships are being amortized on a straight-line basis over their estimated useful lives of8 years. Acquired trade names with finite lives are being amortized on a straight-line basis over theirestimated useful lives, ranging from 2 to 15 years. Trade names with indefinite lives are not amortized, butare subject to annual impairment testing (See Note 1).
The fair value of property, plant and equipment was determined using a cost-based approach thatconsiders the estimated reproductive cost of the assets adjusted for depreciation factors, which includephysical deterioration and functional or economic obsolescence. This approach uses Level 3 inputs that aregenerally unobservable in the marketplace. A market-based approach was also applied as a secondarymethod to estimate the fair value of certain assets. The market-based approach utilized observable Level 2inputs for similar assets in active markets.
Goodwill represents the excess of the purchase price over the fair value of the underlying net assetsacquired. Factors contributing to the goodwill balance include the acquired established workforce and theestimated future synergies associated with the combined operations. Of the total goodwill recorded inconjunction with the Stork acquisition, none is expected to be deductible for tax purposes. The goodwillrecognized in conjunction with the Stork acquisition has been reported in the Diversified Services segment.
F-50

FLUOR CORPORATION
NOTES TO CONSOLIDATED FINANCIAL STATEMENTS (Continued)
The following table summarizes the fair values of assets acquired and liabilities assumed as of theacquisition date:
(in thousands) In EUR In USD
Cash and cash equivalents A 54,441 $ 59,204Accounts and notes receivable 167,894 182,585Contract work in process 96,667 105,125Other current assets 51,065 55,533Property, plant and equipment 162,525 176,746Investments 1,487 1,617Intangible assets 171,000 185,963Goodwill 383,734 417,310Deferred taxes, net 9,867 10,730Other assets 900 979Trade accounts payable (113,898) (123,864)Advance billings on contracts (21,364) (23,234)Other accrued liabilities (205,034) (222,975)Revolving credit facility and other borrowings (400,228) (435,248)Long-term debt (15,295) (16,633)Noncurrent liabilities (65,001) (70,689)Noncontrolling interests (2,947) (3,205)
Net assets acquired A 275,813 $ 299,944
Since the acquisition date, revenue and earnings from Stork of $1.2 billion and $10 million,respectively, for the year ended December 31, 2016 have been included in the Consolidated Statement ofEarnings. Integration costs of $14 million and transaction costs of $11 million were included in corporategeneral and administrative expense for the year ended December 31, 2016.
The following pro forma financial information reflects the Stork acquisition as if it had occurred onJanuary 1, 2015 and includes adjustments for debt refinancing and transaction costs.
Year Ended December 31,
(in thousands) 2016 2015
Pro forma revenue $19,262,991 $19,786,167Pro forma net earnings attributable to Fluor Corporation 283,705 413,040
19. Partial Sale of a Subsidiary
On September 30, 2015, the company sold 50% of its ownership of Fluor S.A., its principal Spanishoperating subsidiary, to Sacyr Industrial, S.L.U. for a cash purchase price of approximately $46 million,subject to certain purchase price adjustments. The company deconsolidated the subsidiary and recorded apre-tax non-operating gain of $68 million during the third quarter of 2015, which was determined based onthe sum of the proceeds received on the sale and the estimated fair value of the company’s retained 50%noncontrolling interest, less the carrying value of the net assets associated with the former subsidiary. Theestimated fair value of the company’s retained noncontrolling interest was $44 million as of the transactiondate. The fair value was estimated using a combination of income-based and market-based valuationapproaches utilizing unobservable Level 3 inputs, including significant management assumptions such asforecasted revenue and operating margins, weighted average cost of capital and earnings multiples.Observable inputs, such as the cash consideration received for the divested share of the entity, were alsoconsidered.
F-51
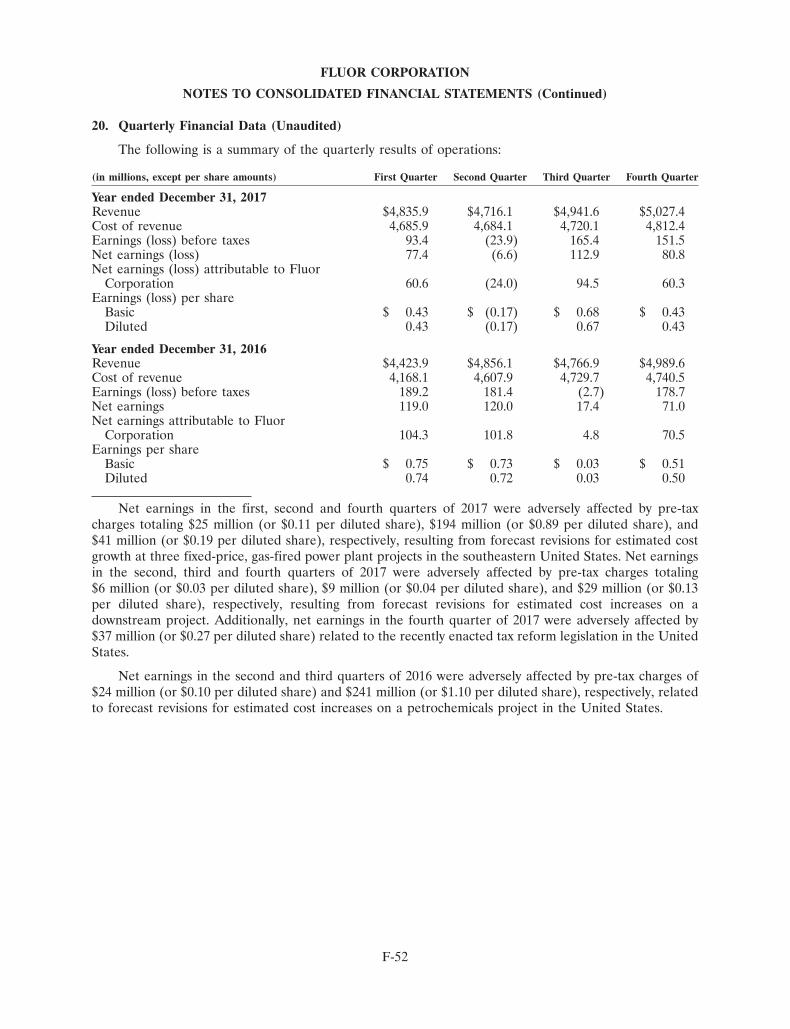
FLUOR CORPORATION
NOTES TO CONSOLIDATED FINANCIAL STATEMENTS (Continued)
20. Quarterly Financial Data (Unaudited)
The following is a summary of the quarterly results of operations:
(in millions, except per share amounts) First Quarter Second Quarter Third Quarter Fourth Quarter
Year ended December 31, 2017Revenue $4,835.9 $4,716.1 $4,941.6 $5,027.4Cost of revenue 4,685.9 4,684.1 4,720.1 4,812.4Earnings (loss) before taxes 93.4 (23.9) 165.4 151.5Net earnings (loss) 77.4 (6.6) 112.9 80.8Net earnings (loss) attributable to Fluor
Corporation 60.6 (24.0) 94.5 60.3Earnings (loss) per share
Basic $ 0.43 $ (0.17) $ 0.68 $ 0.43Diluted 0.43 (0.17) 0.67 0.43
Year ended December 31, 2016Revenue $4,423.9 $4,856.1 $4,766.9 $4,989.6Cost of revenue 4,168.1 4,607.9 4,729.7 4,740.5Earnings (loss) before taxes 189.2 181.4 (2.7) 178.7Net earnings 119.0 120.0 17.4 71.0Net earnings attributable to Fluor
Corporation 104.3 101.8 4.8 70.5Earnings per share
Basic $ 0.75 $ 0.73 $ 0.03 $ 0.51Diluted 0.74 0.72 0.03 0.50
Net earnings in the first, second and fourth quarters of 2017 were adversely affected by pre-taxcharges totaling $25 million (or $0.11 per diluted share), $194 million (or $0.89 per diluted share), and$41 million (or $0.19 per diluted share), respectively, resulting from forecast revisions for estimated costgrowth at three fixed-price, gas-fired power plant projects in the southeastern United States. Net earningsin the second, third and fourth quarters of 2017 were adversely affected by pre-tax charges totaling$6 million (or $0.03 per diluted share), $9 million (or $0.04 per diluted share), and $29 million (or $0.13per diluted share), respectively, resulting from forecast revisions for estimated cost increases on adownstream project. Additionally, net earnings in the fourth quarter of 2017 were adversely affected by$37 million (or $0.27 per diluted share) related to the recently enacted tax reform legislation in the UnitedStates.
Net earnings in the second and third quarters of 2016 were adversely affected by pre-tax charges of$24 million (or $0.10 per diluted share) and $241 million (or $1.10 per diluted share), respectively, relatedto forecast revisions for estimated cost increases on a petrochemicals project in the United States.
F-52

Performance Graph
Shareholder Reference
The graph to the right depicts the Company’s total return to shareholders from December 31, 2012, through December 31, 2017, relative to the performance of the S&P 500 Composite Index and the Dow Jones Heavy Construction Industry Group Index (“DJ Heavy”), which is a published industry index. This graph assumes the investment of $100 on December 31, 2012, in each of Fluor Corporation, the S&P 500 Composite Index and the DJ Heavy, and the reinvestment of dividends paid since that date.
Environmental Benefits Statement Environmental impact estimates were made using the Environmental Defense Paper Calculator.
For More Information Visit: www.papercalculator.org
By using Sappi McCoy Silk, Fluor saved the following resources:
Trees: 8 trees plantedWater: 3,500 gallonsSolid Waste: 234 poundsGreenhouse Gases: 646 pounds
Fluor $100.00 $137.10 $105.44 $83.47 $94.38 $94.51
S&P 500 $100.00 $131.86 $150.48 $152.55 $170.78 $208.05
DJ Heavy $100.00 $129.61 $97.77 $86.50 $106.71 $112.44
20172012 2013 2014 2015 2016
Common Stock Information At February 16, 2018, there were 139,907,306 shares outstanding and approximately 4,687 shareholders of record of Fluor’s common stock.
Registrar and Transfer Agent Computershare P.O. Box 505000Louisville, KY 40233-5000Telephone: (877) 870-2366 Web: www.computershare.com/investor
Independent Registered PublicAccounting Firm Ernst & Young LLP One Victory Park Suite 2000 2323 Victory Avenue Dallas, TX 75219
Annual Shareholders’ Meeting Please visit investor.fluor.com forinformation regarding the time and location of our shareholders’ meeting.
Stock Trading Fluor’s stock is traded on the New York Stock Exchange. Common stock domestic trading symbol: FLR
Company Contacts Shareholders may call (888) 432-1745
Investor Relations: Geoffrey D. Telfer(469) 398-7070
Electronic Delivery of Annual Report and Proxy Statements To expedite shareholders’ receipt of materials, lower the costs of the annual meeting and conserve natural resources, we are offering you, as a Fluor shareholder, the option of viewing future Fluor Annual Reports and Proxy Statements on the internet. Please visit investor.fluor.com to register and learn more about this feature.
Unless indicated otherwise, all trade and service marks are the intellectual property of Fluor Corporation or its subsidiaries.
© 2018 Fluor Corporation. All Rights Reserved.
$0
$100
$200
$300
B R I D G I N G T H E G A P 2 0 1 7 A N N U A L R E P O R T
819586.indd 29 2/28/18 1:58 PM

F L U O R C O R P O R A T I O N
6 7 0 0 L A S C O L I N A S B L V D , I R V I N G , T X 7 5 0 3 9
F L U O R . C O M
819586.indd 30 2/28/18 1:58 PM