The Future of Video - d2dpa77enk4uif.cloudfront.net · The Future of Video Q2 2016. 2 So what’s...
34
1 Jason Hirschhorn: @jasonhirschhorn Matthew Ball: @ballmatthew Tal Shachar: @tweettal The Future of Video Q2 2016
Transcript of The Future of Video - d2dpa77enk4uif.cloudfront.net · The Future of Video Q2 2016. 2 So what’s...

1
Jason Hirschhorn: @jasonhirschhornMatthew Ball: @ballmatthew
Tal Shachar: @tweettal
The Future of VideoQ2 2016

2
So what’s the future look like?Agenda:
1. Where the Video Industry was (and why)
3. What’s Driving this Change (and what that means)
2. The Underlying Fragility of Pay TV Today
4. The Digital Future of Video Services

3
The Traditional Video Ecosystem was Defined by its Constraints
Severe bottlenecks to content production and distribution reduced industry competition and consumer choice
Bottlenecks
Sources: REDEF Analysis

4
Inflation-Adjusted Pay TV Ecosystem Revenues(US Only)
…And These Constraints Were Terrific for Anyone in the Business
For almost all content creators, there was only one path to audiences – and audiences had only one path to video. This enabled phenomenal growth and (virtually unstoppable) profitability in television
• Thanks to its reach, immersive experience and record levels of consumption, television quickly became the most valuable medium on earth
• It was also highly concentrated, with a clear business model (eyeballs) and immense barriers to entry
• Furthermore, there was no “failing out” of carriage, no struggle to find revenue and ease discoverability
• For all its critics, growth remains robust by 2016
Sources: SNL Kagan
150B
125B
100B
75B
50B
25B
0B’10’08’06’04’02’00’98’96’94’92’90’88 ’14’12’86’84’821980
Affiliate Fees
Network Ad Revenues
Net Pay TV Revenue
Bo
x O
ffic
e

5
Even Today, Pay TV Subscriptions Have not Materially Declined
Despite rampant coverage of ‘cord cutting’, the number of US Pay TV subscriptions has remained around 99M for close to a decade – an astounding 85% penetration rate
Total Pay TV Subscriptions(US Only)
80M
70M
60M
90M
100M
40M
10M
0M
50M
20M
30M
2000 2001 2002 2003 2004 2005 2006 2007 2008 2009 2010 2011 2012 2013 2014 2015 2016
Sources: MoffettNathanson

6
So what’s the future look like?
But TV’s dominance is coming to an end…

7
Change in Time Spent Watching Traditional TV by Age Group(Live + VOD + DVR, Based on Q2s)
Change in Hours Spent Watching Traditional TV per Month(Live + VOD + DVR, Q2 2016 v Q2 2010)
(1) Audiences are Moving on from Traditional TV
No matter how strong CPMs remain or long-term carriage agreements are, no industry can sustain the type of “volume” losses currently experienced by the TV business; engagement is the leading indicator to cord cutting
Sources: Nielsen
20152011 2012 20132010 2014 2016
5%
0%
-5%
-10%
-15%
-25%
-30%
-35%
-40%
10%
-20%
65++8%
25-34-30%
12-17-40%
18-24-42%
US POP.-11%
35-49-13%
2-11-22% -23
-41
-48
-39
-18-16
2
16
2-1112-1750-64 25-3465+ 35-49 18-24US POP.
50-64+1%

8
Share of Major Media Advertising Spend by Medium(US Only)
Total National Ad Spend as a Percentage of GDP(US Only)
(2) TV Ad Spend Will Soon be Hit by Digital
If digital ad spend continues to grow, it will need to eat into TV’s share of advertising; contrary to popular belief, new mediums do not “grow” the total amount of ad dollars available; ad spend is zero-sum
Sources: Bloomberg, eMarketer
Wo
rld
Wa
r 2
0.0%
0.5%
1.0%
1.5%
2.0%
2.5%
3.0%
3.5%
4.0%
4.5%
5.0%
195019401930 201020001990198019701960
0%
10%
20%
30%
40%
50%
60%
70%
80%
90%
100%
’70’65’60’55’50’45’40’35’30 ’15’10’052000’95’90’85’80’75
Mobile
Digital
Radio
Magazines
Newspaper
Television

9
# of New Primetime Original Scripted Series per Year & Their Survival Rate(US Only)
(3) The Network Business Model is Bursting at the Seams
Despite massive increases in video consumption, the cancellation rates for Primetime Original Scripted Series have surged from 10% per year to nearly 60%. More shows were cancelled in 2014 than aired 15 years earlier
Sources: FX Research, NY Mag, REDEF Analysis
Tota
l Nu
mb
er
of
Seri
es
Ren
ewal R
ate
0
50
100
150
200
250
300
350
400
0%
10%
20%
30%
40%
50%
60%
70%
80%
90%
100%
20032002200120001999 201520142013201220112010200920082007200620052004
CancelledRenewed Renewal Rate

10
(4) Pay TV is in Secular Decline
Though the number of Pay TV homes has been flat for years, penetration is plummeting for the first time in history – leading to a never-before-seen increase in the number of video-watching homes without Pay TV
Pay TV Penetration(US)
Number of Non-Pay TV Households(US)
70%
72%
74%
76%
78%
80%
82%
84%
86%
88%
90%
-7.3%
25M
20M
5M
15M
10M
0M
+82%
2000 2002 2004 2006 2008 2010 2012 2014 2016 2000 2002 2004 2006 2008 2010 2012 2014 2016
Sources: MoffettNathanson

11
Monthly Minutes Delivered by Network Group(US Only, Inclusive of Broadcast + Basic Cable + Premium Cable, C7 Live + VOD + DVR, Season-to-Date through February 28th)
How has this Affected Incumbents?
Big Media has yet to fully adapt to this new environment and new challengers are moving quickly to capitalize on this inertia
150B
300B
0B
100B
50B
250B
200B
Disney(Ex-ESPN)
NBCU A+ECBSTime Warner
-35%
-16%
21st Century Fox
-11%
NetflixDiscoveryESPN
-14%
Viacom
+669%+33%-30%
-21%
2015 – 2016 Season through February
2010 – 2011 Season through February
Sources: SNL Kagan

12
So what’s the future look like?
Why Has This Happened?

13
The Entertainment Ecosystem has been Unbound
The traditional bottlenecks to content production and distribution have been opened up by technology, reducing the power and value of gatekeepers and creating a new bottleneck: consumer attention
Sources: REDEF Analysis

14
This Has Led to Seven Critical Trends
Massive Increases in Content Production1
Brand New Capabilities3
The Emergence of New Content Formats4
The Concentration of Digital Ad Revenues7
The Rise of the Product Experience5
2 Commoditization of (Units of) Content
The Power of Distribution6

15
#1: Massive Increases in Content Production (1)
As technology improved, production costs fell, and distributional controls were relaxed, the industry experienced a massive influx in “professional” content
Sources: Box Office Mojo, FX Research, NY Mag, UNESCO, Forbes, REDEF Analysis
Number of Movies Released per Year(US & Canada)
Number of New Original Scripted Series per Year(US)
Books Publisher per Year(Global)
0
100
200
300
400
500
600
700
800
1980 ‘90 ‘10‘000
50
100
150
200
250
300
350
400
’00 ’10’9019800.0M
0.5M
1.0M
1.5M
3.0M
2.5M
2.0M
’00’901980 ’10

16
Video Hours Uploaded per Year(Global)
Photos Uploaded per Day(Global)
Posts per Day(Global)
#1: Massive Increases in Content Production (2)
At the same time, UGC content absolutely exploded thanks to free distribution platforms, the proliferation of inexpensive media hardware, and the rise of web/mobile
Sources: KPCB, Twitch, YouTube, Twitter, Tumblr, REDEF Analysis
800M
700M
600M
500M
400M
300M
200M
100M
0M’12’11’10’09’08’072006 ’15’14’13
1.50B
1.25B
1.00B
0.75B
0.50B
0.25B
0.00B’08’072006 ’15’14’13’12’11’10’09
Tumblr
Tweets
Snapchat
Facebook1.0M
0.8M
0.6M
0.4M
0.2M
0.0M’15’14’13’12’11’10’09’08’072006
Twitch
YouTube

17
Fanfiction Stories Publisher on Wattpad per Year(Global)
Active Podcasts on iTunes(Global)
#1: Massive Increases in Content Production (3)
Entertainment no longer requires established media brands or established distributors; and new brands can scale and build empires faster than has ever been possible
Sources: WattPad, Josh Morgan, REDEF Analysis
0M
10M
20M
30M
40M
50M
60M
70M
80M
90M
100M
’11’10’09’08’072006 ’15’14’13’12
100K
90K
80K
70K
60K
50K
40K
30K
20K
10K
0K’15’14’13’12’11’10’09’08’072006

18
#2: Commoditization of (Units of) Content
It’s no longer good enough to make “good” or even “great content” – the reality is that many now can and do. And those that own both distribution and customer relationships are thriving
Music Industry Revenues(US)
Newspaper Industry Revenues(US)
Number of AAA Game Studios (Global)
$20B
$15B
$10B
$5B
$0B
-71%
20142004199419841974
~23
20142006
~125$70B
$10B
$0B
$20B
$30B
$40B
$50B
$60B
1950 1970 1990 2010
Sources: RIAA, Carpe Diem, DICE

19
#3: Brand New Capabilities
New capabilities have created new business models leading to new competitive fronts, opening up the ecosystem to new players, and rewarding different strategies
• No need for intermediary distributor• In many cases, intermediaries are
impediments and hurt the consumer
• Scale no longer a prerequisite for profit• Targeted, niche offerings are suddenly
capable of being profitable
• The same service can act as many different things to many different people
• New categories have emerged, from live interactive broadcast to eSports
• Netflix spends less on non-content costs per sub than HBO despite handling all billing, service, Apple Tax + marketing
• Know not just what’s watched, but how, when, why and from where
• Native ads, referral revenue, crowdfunding• Replacing windowing with price
discrimination
• Can now form meaningful – and two-way – consumer relationships
D2C Offerings
Niche Offerings
Personalization
Consumer Relationships
New Types of Content
Low Cost Support
Customer Data
New Monetization
Models
Sources: REDEF Analysis

20
Expansion of Storytelling Formats & Content as Delivery Technologies Evolve
#4: The Emergence of New Content Formats
No matter how resilient traditional TV remains, digital – like every medium before it – offers the opportunity to entertain (and create value) in ways never before possible. And new empires will be built doing so
Sources: REDEF Analysis

21
#5: The Rise of the Product Experience
Experiences are created by content and product – not enough to just deliver good content. Audiences demand exceptional product experiences on top of great content, with the two increasingly intermingled
Sources: REDEF Analysis
• In the cable era, distributors handled only the delivery of content, with media companies handling the rest
• In OTT, content + distribution + experience converge
• Furthermore, emerging video platforms are aggressively investing in capabilities that fundamentally challenge what content consumption looks and feels like
• While first wave of OTT services succeeded through core deliver excellence, the impetus for product differentiation and content integration will only grow
• It is no longer enough to put video on a different rectangle – doing so, in fact, is unnecessarily confining
22
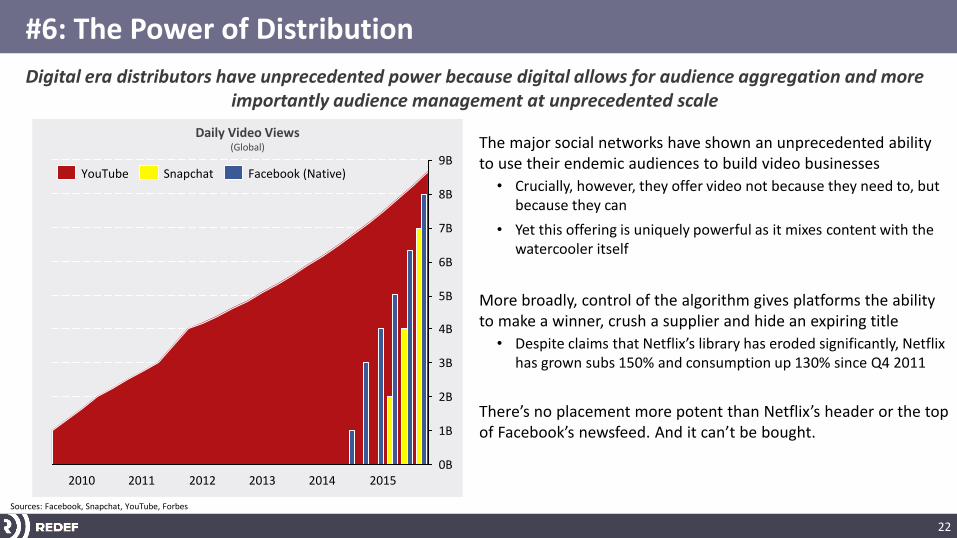
Daily Video Views(Global)
#6: The Power of Distribution
Digital era distributors have unprecedented power because digital allows for audience aggregation and more importantly audience management at unprecedented scale
The major social networks have shown an unprecedented ability to use their endemic audiences to build video businesses
• Crucially, however, they offer video not because they need to, but because they can
• Yet this offering is uniquely powerful as it mixes content with the watercooler itself
More broadly, control of the algorithm gives platforms the ability to make a winner, crush a supplier and hide an expiring title
• Despite claims that Netflix’s library has eroded significantly, Netflix has grown subs 150% and consumption up 130% since Q4 2011
There’s no placement more potent than Netflix’s header or the top of Facebook’s newsfeed. And it can’t be bought.
Sources: Facebook, Snapchat, YouTube, Forbes
8B
9B
7B
6B
5B
4B
3B
2B
1B
0B201520142013201220112010
YouTube Facebook (Native)Snapchat
23
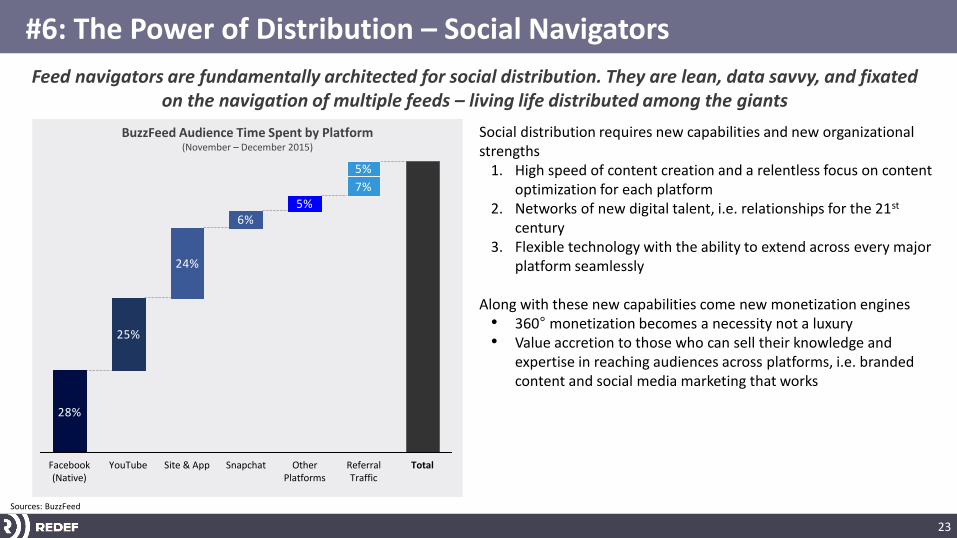
BuzzFeed Audience Time Spent by Platform(November – December 2015)
#6: The Power of Distribution – Social Navigators
Feed navigators are fundamentally architected for social distribution. They are lean, data savvy, and fixated on the navigation of multiple feeds – living life distributed among the giants
Social distribution requires new capabilities and new organizational strengths
1. High speed of content creation and a relentless focus on content optimization for each platform
2. Networks of new digital talent, i.e. relationships for the 21st
century3. Flexible technology with the ability to extend across every major
platform seamlessly
Along with these new capabilities come new monetization engines• 360° monetization becomes a necessity not a luxury• Value accretion to those who can sell their knowledge and
expertise in reaching audiences across platforms, i.e. branded content and social media marketing that works
Sources: BuzzFeed
28%
25%
24%
6%
7%
5%
5%
Other Platforms
SnapchatSite & AppYouTubeFacebook(Native)
TotalReferral Traffic

24
Percent of Basic Cable Ad Revenue by Network Group(US Only)
Percent of Digital Ad Revenue by Company(US Only)
#7: The Concentration of Digital Ad Revenues
Advertising revenues used to scale proportionately; today, they’re overwhelmingly concentrated among those with the largest audience, greatest reach and best data
Sources: SNL Kagan, MoffettNathanson
0%
10%
20%
30%
40%
50%
60%
70%
80%
90%
100%
20142013201220112010 2015
0%
10%
20%
30%
40%
50%
60%
70%
80%
90%
100%
201520142013201220112010
Time Warner
NBCUniversal
Disney
Viacom
21st Century Fox
Discovery
Scripps
A+E
AMC
All Other Network Groups (Max 1.25%)
YahooIAC
TwitterAOL
All Other Companies (Max 1.5%)
25
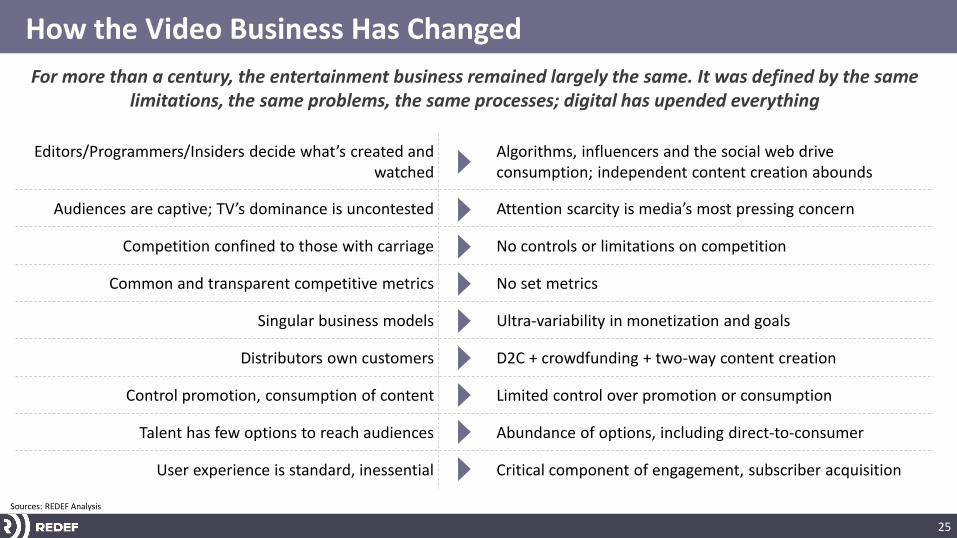
How the Video Business Has Changed
For more than a century, the entertainment business remained largely the same. It was defined by the same limitations, the same problems, the same processes; digital has upended everything
Editors/Programmers/Insiders decide what’s created and watched
Algorithms, influencers and the social web drive consumption; independent content creation abounds
Audiences are captive; TV’s dominance is uncontested Attention scarcity is media’s most pressing concern
Competition confined to those with carriage No controls or limitations on competition
Common and transparent competitive metrics No set metrics
Singular business models Ultra-variability in monetization and goals
Distributors own customers D2C + crowdfunding + two-way content creation
Control promotion, consumption of content Limited control over promotion or consumption
Talent has few options to reach audiences Abundance of options, including direct-to-consumer
User experience is standard, inessential Critical component of engagement, subscriber acquisition
Sources: REDEF Analysis

26
So what’s the future look like?
So What Does the Future of Video Look Like?

27
We Thought the Future Looked Like This
“An app for every network or show”
But it was just a digital adaption of the old model. And it isn’t resonating with users.

28
The New Models of Video Distribution
The traditional network business was straightforward: get carriage, grow eyeballs, and sell ads. Online will work very differently. It’ll be more complex, more diverse and more precarious
Library Size
Co
nte
nt
Var
iety
Social Feeds
Dedicated SVOD
Scale Feeds
Identity Feeds
Social Feed
Navigators
In the digital era, media companies have several positional levers:
• Vertical / Genres
• Volume of Content
• Variety of Content
… Each of which will affect their consumer adoption/scale, profitability and product/content needs
We believe there will five dominant models, including three content feeds, one feed-less offering and one-multi feed model
Sources: REDEF Analysis

29
Relationship Between Network Revenue and Minutes Delivered(US Only, Basic Cable Networks, 2011 – 2014)
Relationship Between Network Cash Flow and Minutes Delivered(US Only, Basic Cable Networks, 2011 – 2014)
Feeds will be the Most Potent Iteration
Value in media has always accrued to those able to build a “feed”. The more popular a network, the easier it is to launch a show, build an audience, attract advertisers, extract high fees, force bundling
But the feeds of the digital era will be fundamentally dissimilar to those of the linear, lean-back era
100,000M
10,000M
1,000M
100M
10M
$3.0B$2.5B$2.0B$1.5B$1.0B$0.5B$0.0B
Mo
nth
ly M
inu
tes
Del
iver
ed (
Log
Scal
e)
Inflation Adjusted Annual Revenue
Mo
nth
ly M
inu
tes
Del
iver
ed (
Log
Scal
e)
Inflation Adjusted Annual Cash Flow
100,000M
10,000M
1,000M
100M
10M
$1.75B$1.50B$1.25B$1.00B$0.75B$0.50B$0.25B$0.00B-$0.25B
Sources: SNL Kagan

30
Monthly Minutes Watched by Network + Netflix(US Only, Q1 2016)
Scale Feeds
• Massive library containing all types/genres of video content• Primary video destination for 100+ million globally• Personalization enables the service to be all things to all people
What it Is
• Converge all network apps and programming strategies• Accept ST cannibalization to build a LT platform• Expand globally• Secure all rights (all windows, all seasons)
How to Build One
• Soft performance metrics – engagement, churn, adds, binge rates• Prioritize passionate fandom over total views• No set amount of budget, original series, hours – invest up to ROI• Algorithm-led programming, design, content recommendations
How it Works
Netflix now delivers more entertainment than any broadcast network or consolidated cable group; it isn’t HBO. It’s HBO + The Disney Channel + AMC + NBC + The Food Network
• Winner takes all markets (consumers don’t need 5 Netflixes)• Hard to grow from sub-scale• Commoditized life as content supplier• Licensing likely better than operating own sub-scale scale feed
Risks
0 225Networks
80B
100B
160B
120B
140B
0B
60B
20B
40B
As at Q4 2014
Cable
Broadcast
Sources: SNL Kagan
Network

31
Social Feeds
Social feeds are the spiritual digital successors to Pay TV distribution, providing hours of leanback entertainment, with more content, more formats, and more stickiness than any previous feed
• The bundle or “feed” in its most potent iteration to date• Blends together all types of content: photos, premium, UGC, video,
communications, networking, video• Accessed dozens of times per day
What it Is
• Can’t (anymore)• Can work with them (will come back to this)
How to Build One
• Obsessive focus on engagement optimization• Content delivered via algorithm or social shares – fully outside the
purview of content owners or creators
How it Works
• Suppliers are modularized without feed (poor economics, data)• Platforms don’t need/care for any particular supplier• Unless dedicated to social distributions, they’re likely tools not
businesses
Risks

32
Identity Feeds
Identity Feeds will not be “smaller scale feeds”, they will be fundamentally different in structure, content, and monetization
• Bundles together all related multi-media: video, podcasts, commentary, merchandise, news, live events
• Creates a community around a focal idea/genre/theme/identity• T-Shirt Test: If fans won’t wear the shirt, it’s not an identity feed• Won’t just be “media companies”; will include content marketing
What it Is
• Build an authentic relationship with most passionate seed users• Developed over time, not declared or push-marketed• Focus on a specific identity/sub-culture
How to Build One
• Single P&L across all content offerings• Highly skewed customer value, requiring a rigid user funnel• Whale customer economics (not “hit show”)
How it Works
• Layered management, brand guidelines are anathema• Low ceiling to growth (can’t broaden service too much)• Old media not staffed up for Identity Feed businesses
Risks

33
What If You Don’t Have a Feed?
Life without a feed will be possible, but it will be much more difficult and challenging than it was inside the relative protection of the pay TV bundle
Content Supplier3
Feed Navigator2
Non-Feed SVOD Services1
• There will be scores of profitable video services with small-to-moderate audiences
• But they won’t be particularly valuable unless they own a “feed”
• Without it, growth will be difficult, audiences fluid, and economics modest, thanks to unfavorable market dynamics and price/value
• Profit will, by and large, be limited to content license arbitrage
• Architected for social distribution: lean, data savvy, and fixated on all multiple feeds; a life among giants
• For most, social navigation will be a tool to launch content and build relationships with audiences; not a business in and of itself
• Costs need to be very low to achieve meaningful margin
• Challenge for traditional media companies to innovate their way down vs. challengers growing up
• Hyper-competition as the amount of available and catalog content increases
• The concept of “premium” versus “non-premium” continues to erode
• ‘Winner Takes All’ distribution reduces the number of prospective buyers
• Huge negotiating imbalance with platforms due to data / value

34
Jason Hirschhorn: @jasonhirschhornMatthew Ball: @ballmatthew
Tal Shachar: @tweettal
The Future of VideoQ2 2016