DEVEX 2021 Day 1 Monday 7 June 2021 A Novel Sampling and ...

The Future of the North Sea:
Tackling the Challenges Facing our
Industry
Presentation to DEVEX
6th May 2014
CONFIDENTIAL AND PROPRIETARY
Any use of this material without specific permission of McKinsey & Company is strictly prohibited
Dan Cole

McKinsey & Company | 1
A view of the oil industry from the late 1990s
“$10 might actually be too optimistic. We may be heading for $5.”
“Thanks to new technology and productivity gains, you might expect the price of oil, like that of most other commodities, to fall slowly over the years. Judging by the oil market in the pre-OPEC era, a ‘normal’ market price might now be in the $5-10 range.”
- The Economist, March 4th 1999

McKinsey & Company | 2
1997 forecast of UK decommissioning
21 kboe/dExpected 2006
production
Expected decommission dates for U.K. end of field life assets

McKinsey & Company | 3
Just three fields actually decommissioned
McKinsey & Company | 4
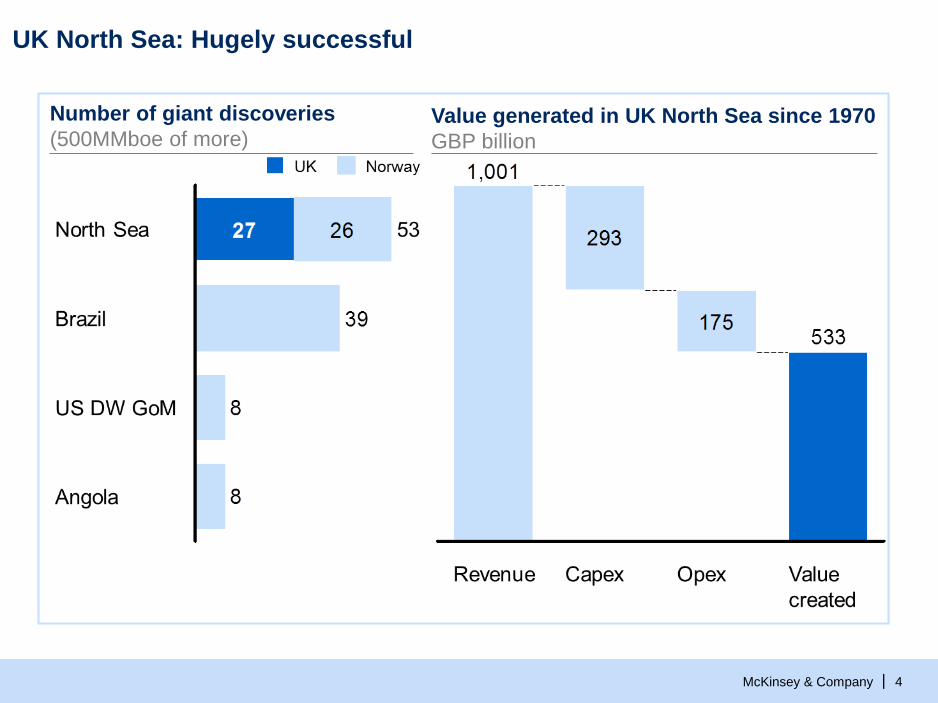
UK North Sea: Hugely successful
Number of giant discoveries
(500MMboe of more)Value generated in UK North Sea since 1970
GBP billion

McKinsey & Company | 5
What we are going to need to get right
Ability to manage costs
Delivering safety & asset integrity
Adding resources
Keeping production efficiency high

McKinsey & Company | 6
What we are going to need to get right
Ability to manage costs
Delivering safety & asset integrity
Adding resources
Keeping production efficiency high

McKinsey & Company | 7
Offshore efficiency decreased in the North Sea over the last decade
Asset Efficiency
SOURCE: McKinsey Global Offshore Asset Efficiency Database
Country averages, % of estimated production potential based on monthly production

McKinsey & Company | 8
Asset Efficiency
Norway appears to follow the UK trend – with a 10-year lag
SOURCE: McKinsey Global Offshore Asset Efficiency Database
Country averages, % of estimated production potential based on monthly production

McKinsey & Company | 9SOURCE: McKinsey Global Offshore Asset Efficiency Database
The range of AE performance in the North Sea has widened sharply over
the past decade
Note: North Sea includes UK and Norway only, and excludes dry gas fields
% of estimated production potential based on monthly production

McKinsey & Company | 10
Possible causes for the fall in efficiency
▪ Increasing average age
▪ Higher dependency on
more vulnerable export
routes
▪ Different types of asset
(e.g., more subsea)
▪ Less redundancy in
production systems
▪ More challenging
production (e.g., higher
water cut, more HPHT)
▪ More challenging locations
Changes in the structural
characteristics of the assets,
infrastructure, reservoir
▪ Poorer maintenance and
reliability practices
▪ Low previous investment
▪ Lower risk appetite/ and
increased focus on asset
integrity
▪ Changes in contracting
strategy (e.g., outsourcing)
▪ Lower focus in operators’
portfolios
▪ Changes in organizational
set-up
Changes in operator
approaches
▪ Higher commodity prices
“allowing” lower efficiency
▪ Regulatory changes
▪ Supply chain constraints
▪ Increasing impact of “train-
wreck” events
▪ Increasing exposure to
harsh weather (e.g., more
production in NNS, WoS)
Changes in operating
environment, and other
external factors

McKinsey & Company | 11
Possible causes for the fall in efficiency
▪ Increasing average age
▪ Higher dependency on
more vulnerable export
routes
▪ Different types of asset
(e.g., more subsea)
▪ Less redundancy in
production systems
▪ More challenging
production (e.g., higher
water cut, more HPHT)
▪ More challenging locations
▪ Poorer maintenance and
reliability practices
▪ Low previous investment
▪ Lower risk appetite/ and
increased focus on asset
integrity
▪ Changes in contracting
strategy (e.g., outsourcing)
▪ Lower focus in operators’
portfolios
▪ Changes in organizational
set-up
▪ Higher commodity prices
“allowing” lower efficiency
▪ Regulatory changes
▪ Supply chain constraints
▪ Increasing impact of “train-
wreck” events
▪ Increasing exposure to
harsh weather (e.g., more
production in NNS, WoS)
1
2
3 4
Changes in the structural
characteristics of the assets,
infrastructure, reservoir
Changes in operator
approaches
Changes in operating
environment, and other
external factors

McKinsey & Company | 12SOURCE: McKinsey Global Offshore Asset Efficiency Database
Age alone does not explain lower asset production efficiency
Asset production efficiency of UK installations by age
% of estimated production potential based on monthly production
1

McKinsey & Company | 13
Indirect hubs have significantly lower efficiency than direct hubs
SOURCE: McKinsey Global Offshore Asset Efficiency Database
2
Asset efficiency of UK installation by network position
% of estimated production potential based on monthly production
McKinsey & Company | 14
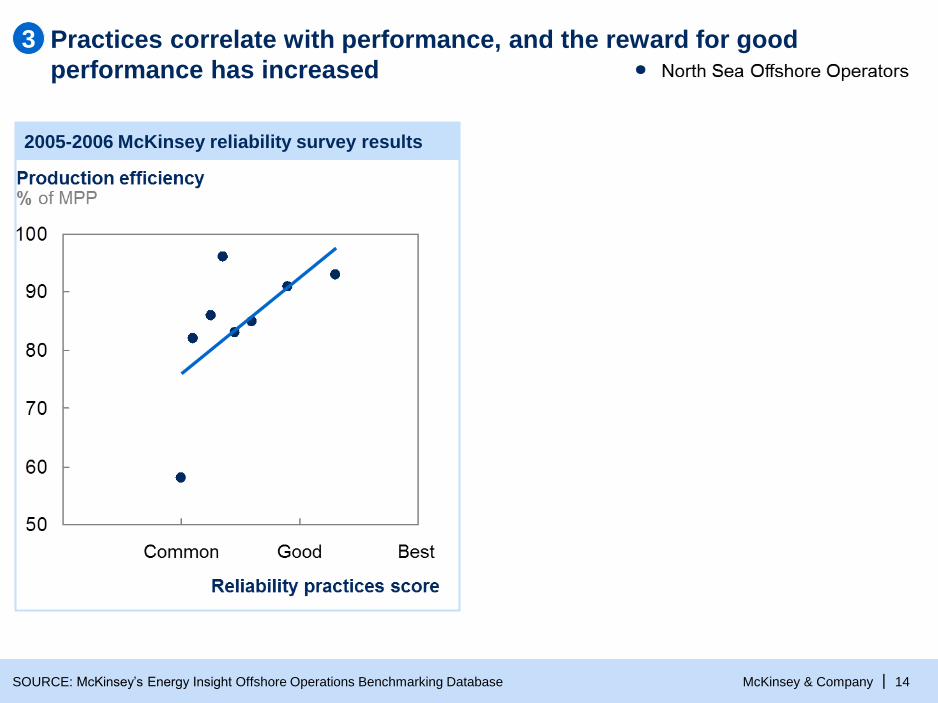
Practices correlate with performance, and the reward for good
performance has increased
2005-2006 McKinsey reliability survey results
3
SOURCE: McKinsey’s Energy Insight Offshore Operations Benchmarking Database

McKinsey & Company | 15
Practices correlate with performance, and the reward for good
performance has increased
SOURCE: McKinsey’s Energy Insight Offshore Operations Benchmarking Database
3
2010-2013 McKinsey reliability survey results

McKinsey & Company | 16
Clear correlation with the oil price – but is there any causation?
SOURCE: McKinsey Global Offshore Asset Efficiency Database, BP Statistical Review
4

McKinsey & Company | 17
What we are going to need to get right
Ability to manage costs
Delivering safety & asset integrity
Adding resources
Keeping production efficiency high

McKinsey & Company | 18
Change in costs 2001-2010
% of 2001 costs
Cost inflation

McKinsey & Company | 19
Cost inflation
1 Unweighted average of total lifting cost for 14 platforms (total cost, not cost per barrel)
Change in costs 2001-2010
% of 2001 costs
SOURCE: McKinsey’s Energy Insight Offshore Operations Benchmarking Database

McKinsey & Company | 20
We have remained optimistic that improvements are around the corner!
SOURCE: Oil & Gas UK 2012 Economic Report

McKinsey & Company | 21
But no sign of them yet
#% Annual change
1 Money of the day; based on a “basket” of installations
SOURCE: McKinsey’s Energy Insight Offshore Operations Benchmark
Lifting cost trends (North Sea example)1
Index, 1992 = 100, GBP base currency

McKinsey & Company | 22
What is behind the 10% increase?
Increased activity

McKinsey & Company | 23
What is behind the 10% increase?

McKinsey & Company | 24
What is behind the 10% increase?
McKinsey & Company | 25
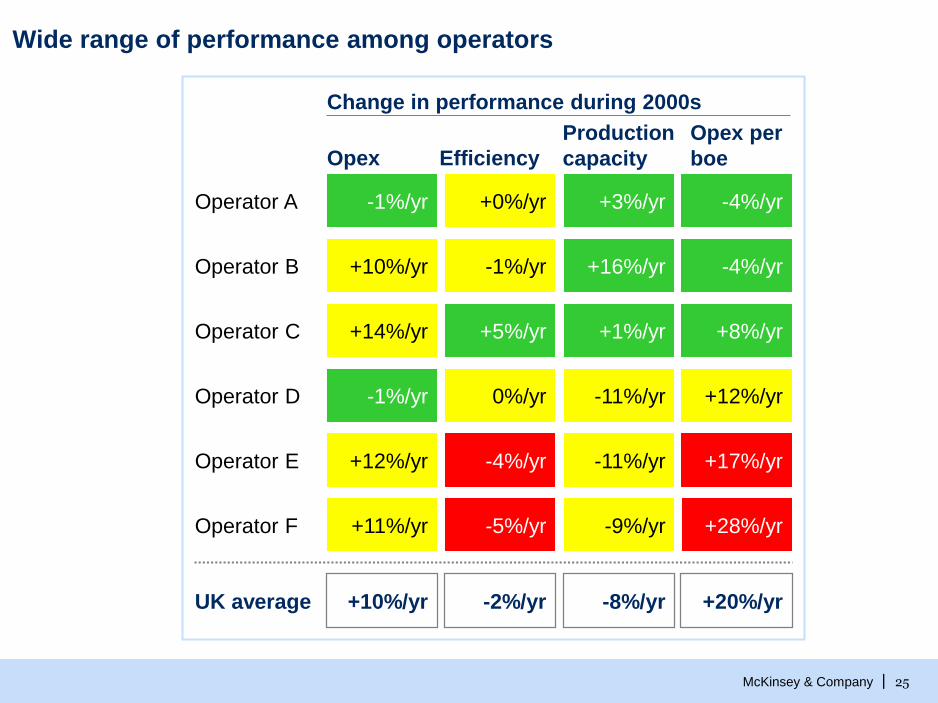
Wide range of performance among operators
Change in performance during 2000s
Opex Efficiency
Production
capacity
Opex per
boe
+10%/yr -2%/yr -8%/yr +20%/yrUK average
Operator A -1%/yr +0%/yr +3%/yr -4%/yr
Operator E +12%/yr -4%/yr -11%/yr +17%/yr
Operator F +11%/yr -5%/yr -9%/yr +28%/yr
Operator D -1%/yr 0%/yr -11%/yr +12%/yr
Operator C +14%/yr +5%/yr +1%/yr +8%/yr
Operator B +10%/yr -1%/yr +16%/yr -4%/yr

McKinsey & Company | 26
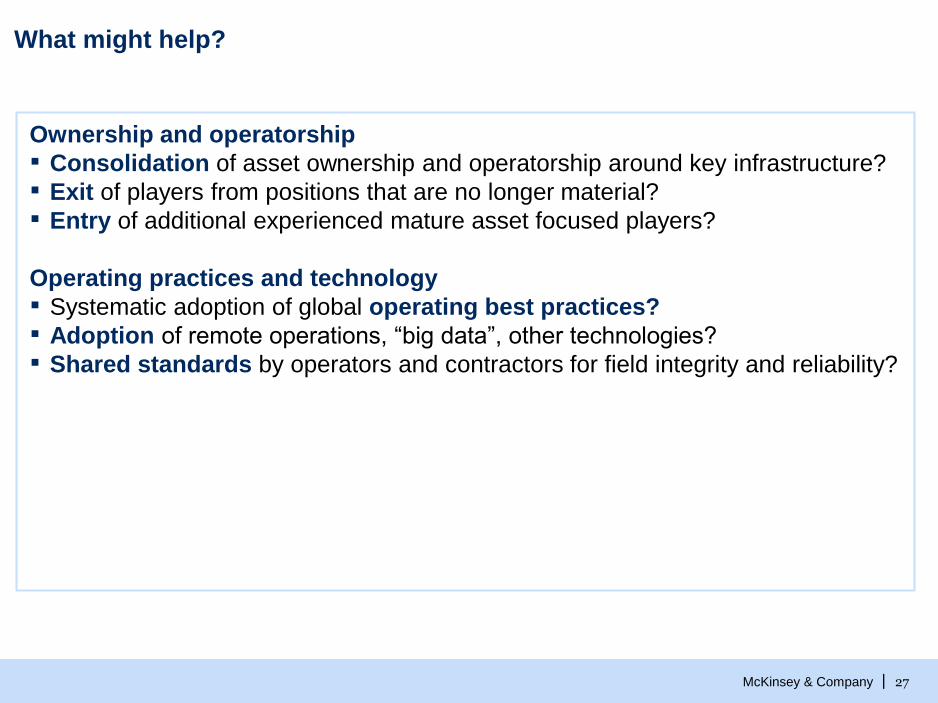
What might help?
Ownership and operatorship
▪ Consolidation of asset ownership and operatorship around key infrastructure?
▪ Exit of players from positions that are no longer material?
▪ Entry of additional experienced mature asset focused players?
McKinsey & Company | 27
What might help?
Ownership and operatorship
▪ Consolidation of asset ownership and operatorship around key infrastructure?
▪ Exit of players from positions that are no longer material?
▪ Entry of additional experienced mature asset focused players?
Operating practices and technology
▪ Systematic adoption of global operating best practices?
▪ Adoption of remote operations, “big data”, other technologies?
▪ Shared standards by operators and contractors for field integrity and reliability?
McKinsey & Company | 28
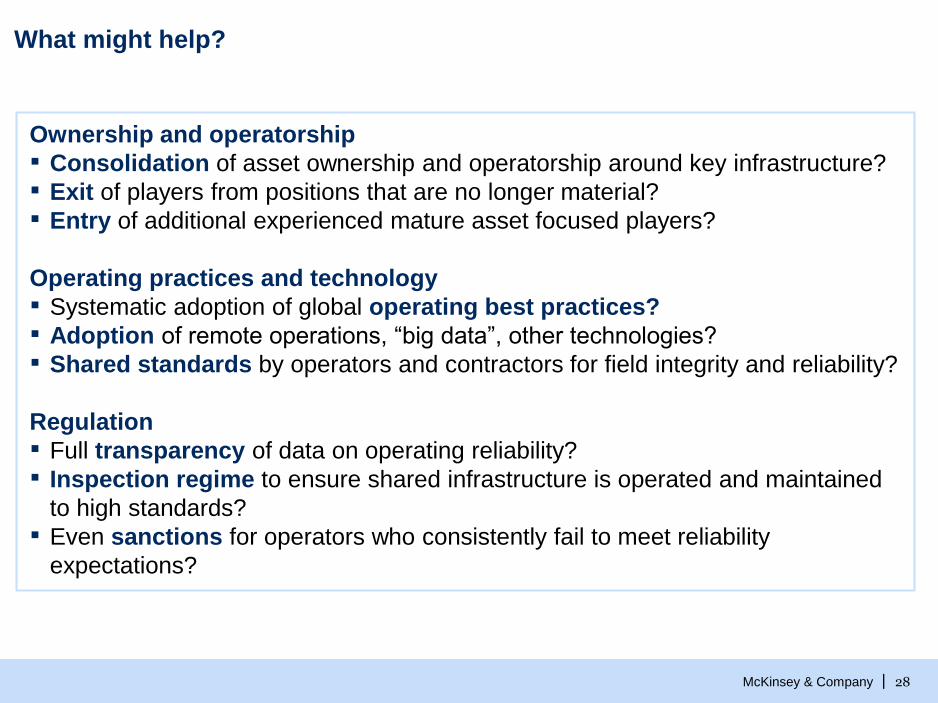
What might help?
Ownership and operatorship
▪ Consolidation of asset ownership and operatorship around key infrastructure?
▪ Exit of players from positions that are no longer material?
▪ Entry of additional experienced mature asset focused players?
Operating practices and technology
▪ Systematic adoption of global operating best practices?
▪ Adoption of remote operations, “big data”, other technologies?
▪ Shared standards by operators and contractors for field integrity and reliability?
Regulation
▪ Full transparency of data on operating reliability?
▪ Inspection regime to ensure shared infrastructure is operated and maintained
to high standards?
▪ Even sanctions for operators who consistently fail to meet reliability
expectations?


![At Scale Deployment of Enhanced Oil Recovery in BP Devex 2012v7)-MakingE... · Title: Microsoft PowerPoint - DEVEX 2012 (v7) - Making EOR Happen - Devex web.ppt [Compatibility Mode]](https://static.fdocuments.in/doc/165x107/5e4383bcde82b064140e1792/at-scale-deployment-of-enhanced-oil-recovery-in-bp-devex-v7-makinge-title.jpg)