The Future of TDM: Technology and Demographic Shifts and ... · Demographic Shifts and Their...
35
The Future of TDM: Technology and Demographic Shifts and Their Implications for Transportation Demand Management Final report PRC 15-25F
Transcript of The Future of TDM: Technology and Demographic Shifts and ... · Demographic Shifts and Their...

The Future of TDM: Technology and
Demographic Shifts and Their Implications for
Transportation Demand Management
Final report
PRC 15-25F

2
The Future of TDM: Technology and Demographic
Shifts and Their Implications for Transportation
Demand Management
Texas A&M Transportation Institute
PRC 15-25F
June 2015
Authors
Stacey Bricka
Maarit Moran
Kristi Miller
Joan Hudson
3
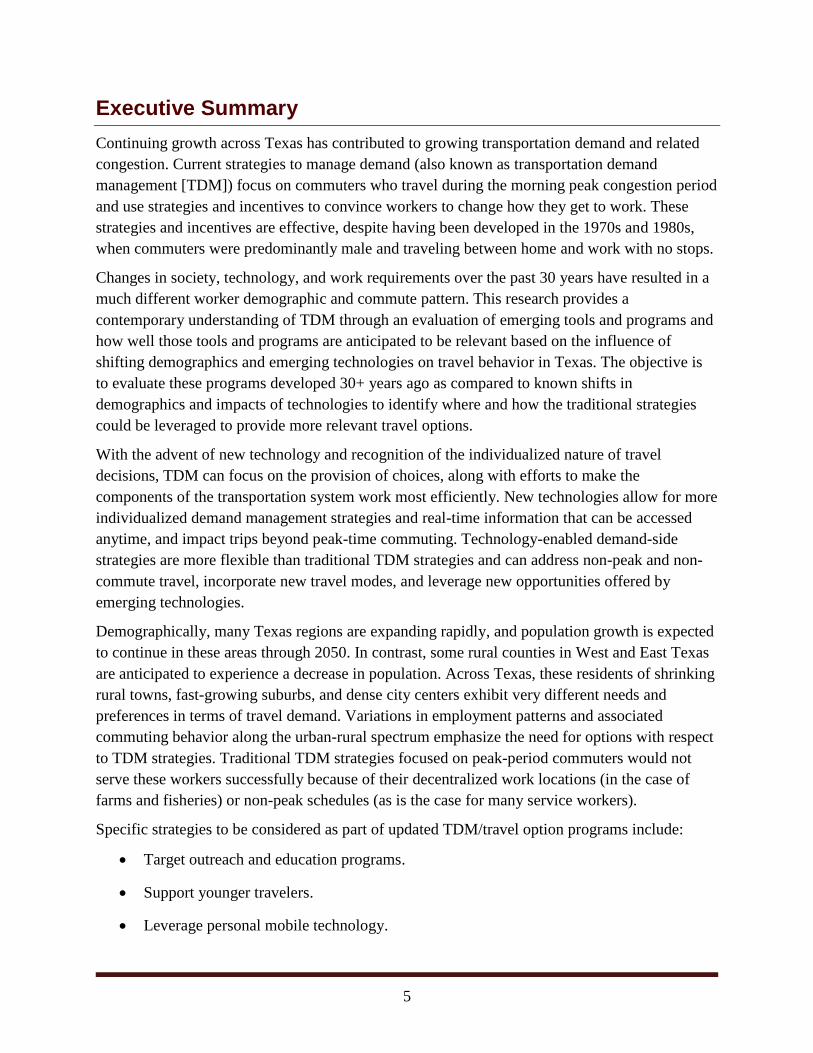
Table of Contents
List of Figures ................................................................................................................................ 4
List of Tables ................................................................................................................................. 4
Executive Summary ...................................................................................................................... 5
Introduction ................................................................................................................................... 7
Redefining TDM............................................................................................................................ 8
The Role of Emerging Technology in TDM ............................................................................. 10
Advanced Travel Information Systems ..................................................................................... 11
Advanced Parking Management Systems ................................................................................. 11
Road Pricing .............................................................................................................................. 12
Zone Pricing ....................................................................................................................................................... 12 Dynamic Tolling ................................................................................................................................................. 13
Dynamic Real-Time Ride-Sharing ............................................................................................ 14
Technologies for Transit ........................................................................................................... 15
Future Demand and Texas Demographic Trends ................................................................... 16
Geography: Urban-Rural Spectrum .......................................................................................... 17
Age and Life Cycle: Baby Boomers and Millennials ............................................................... 19
Millennials .......................................................................................................................................................... 20 Baby Boomers .................................................................................................................................................... 21
Texas’ Hispanic Population ...................................................................................................... 22
Foreign-Born Population ........................................................................................................... 23
Implications for the Future of TDM ......................................................................................... 28
Target Outreach and Education Programs ................................................................................ 28
Support Younger Travelers ....................................................................................................... 29
Leverage Personal Mobile Technology ..................................................................................... 29
Focus on Non-Commute Travel ................................................................................................ 29
Support Complementary Strategies ........................................................................................... 29
Quantify the Benefits of TDM .................................................................................................. 30
References .................................................................................................................................... 32

4
List of Figures
Figure 1. Carma Riders in Austin. ................................................................................................ 14
Figure 2. Texas Total Population by Migration Rate 2010 to 2050. ............................................ 16
Figure 3. U.S. Census Reports on High Growth Cities in United States, 2012 to 2013. .............. 17
Figure 4. Texas Travel Mode to Work.......................................................................................... 19
Figure 5. VMT by Age Group, 2009. ........................................................................................... 20
Figure 6. Baby Boomer Population Pyramid 2012 to 2060. ......................................................... 21
Figure 7. Attributes of Seniors’ Technology Adoption. ............................................................... 22
Figure 8. Population Projections by Ethnicity, 2010 to 2050. ...................................................... 23
Figure 9. Net International Migration and Natural Increase, 2012 to 2060. ................................. 24
Figure 10. Mode Split (Percent of Trips). ..................................................................................... 25
List of Tables
Table 1. Key Demographic and Travel Characteristics of New Immigrants. ............................... 25
Table 2. Summary Table: Texas Demographic Trends and TDM Strategies to Target
Groups. ................................................................................................................................... 26
Table 3. Impact of Selected Employer-Based Demand Management Strategies. ........................ 30
5
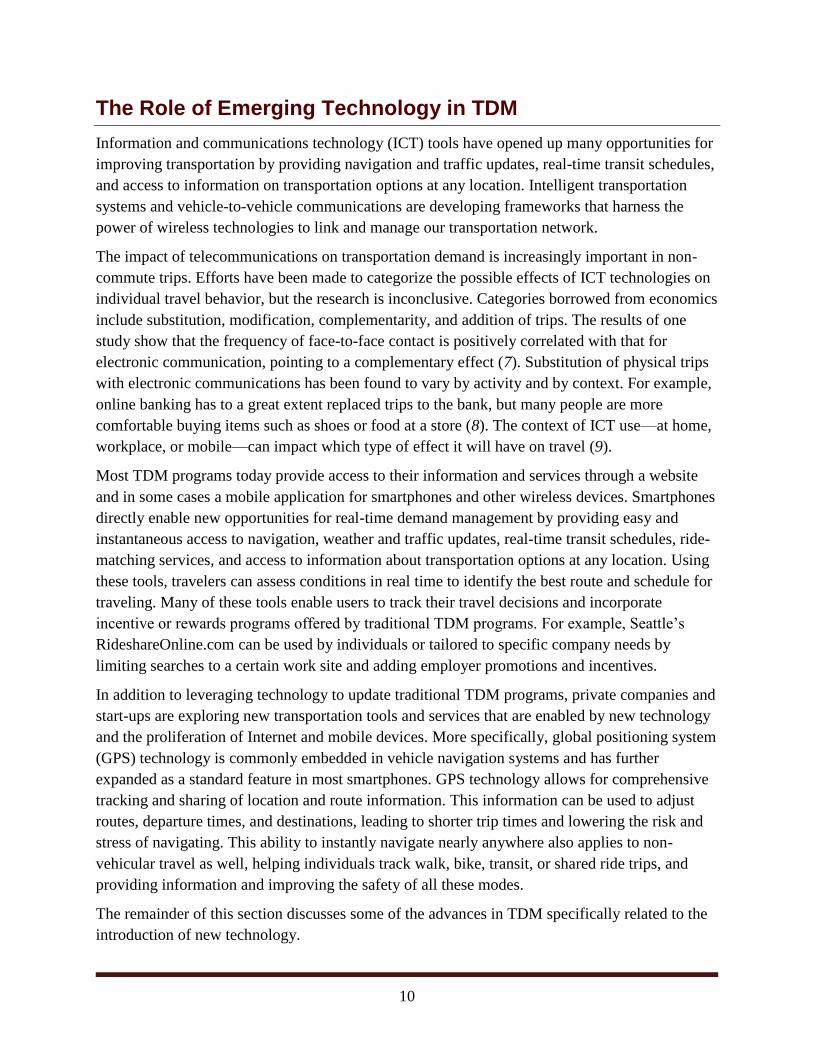
Executive Summary
Continuing growth across Texas has contributed to growing transportation demand and related
congestion. Current strategies to manage demand (also known as transportation demand
management [TDM]) focus on commuters who travel during the morning peak congestion period
and use strategies and incentives to convince workers to change how they get to work. These
strategies and incentives are effective, despite having been developed in the 1970s and 1980s,
when commuters were predominantly male and traveling between home and work with no stops.
Changes in society, technology, and work requirements over the past 30 years have resulted in a
much different worker demographic and commute pattern. This research provides a
contemporary understanding of TDM through an evaluation of emerging tools and programs and
how well those tools and programs are anticipated to be relevant based on the influence of
shifting demographics and emerging technologies on travel behavior in Texas. The objective is
to evaluate these programs developed 30+ years ago as compared to known shifts in
demographics and impacts of technologies to identify where and how the traditional strategies
could be leveraged to provide more relevant travel options.
With the advent of new technology and recognition of the individualized nature of travel
decisions, TDM can focus on the provision of choices, along with efforts to make the
components of the transportation system work most efficiently. New technologies allow for more
individualized demand management strategies and real-time information that can be accessed
anytime, and impact trips beyond peak-time commuting. Technology-enabled demand-side
strategies are more flexible than traditional TDM strategies and can address non-peak and non-
commute travel, incorporate new travel modes, and leverage new opportunities offered by
emerging technologies.
Demographically, many Texas regions are expanding rapidly, and population growth is expected
to continue in these areas through 2050. In contrast, some rural counties in West and East Texas
are anticipated to experience a decrease in population. Across Texas, these residents of shrinking
rural towns, fast-growing suburbs, and dense city centers exhibit very different needs and
preferences in terms of travel demand. Variations in employment patterns and associated
commuting behavior along the urban-rural spectrum emphasize the need for options with respect
to TDM strategies. Traditional TDM strategies focused on peak-period commuters would not
serve these workers successfully because of their decentralized work locations (in the case of
farms and fisheries) or non-peak schedules (as is the case for many service workers).
Specific strategies to be considered as part of updated TDM/travel option programs include:
Target outreach and education programs.
Support younger travelers.
Leverage personal mobile technology.

6
Provide options for non-commute travel.
Support complementary strategies.

7
Introduction
Travel demand management is a term that encompasses a wide range of public- and private-
sector programs that seek to reduce congestion through reducing the number of single-occupant
vehicle (SOV) trips during weekday peak travel periods. These programs have been shown to
reduce vehicle miles traveled, increase mobility, and reduce emissions. TDM is an important tool
to make the most of our current transportation infrastructure supply and provide reliable
transportation choices to meet growing demand.
Originally started in the 1970s in response to the energy crisis, TDM programs traditionally have
focused on providing alternatives to commuters working 8–5 Monday through Friday through
organizing and promoting preferential parking for carpools and vanpools, encouraging
employers to allow alternative work schedules, and promoting transit options. Over time, the
focus of TDM has expanded to include telework, managed lanes, and parking pricing strategies
to achieve a more efficient use of existing facilities. Motivated by the reality that there are
significant physical and financial limitations to increasing roadway capacity, new tools are
emerging that focus on better managing demand on the system and a renewed interest in
alternative travel choices for the work commute and other travel as well.
Two sweeping trends are reflected in the current evolution of traditional TDM programs and
tools. First, changes in technology are impacting both the supply (e.g., road pricing, intelligent
corridor management, dynamic ride-sharing) and the demand (e.g., changing travel behavior
related to telecommunications and improved information for travelers on travel choices) for
transportation. As traditional TDM tools are updated with new technological capabilities, an
entire new set of demand management tools are also emerging, many from the private sector.
Second, significant demographic shifts are occurring in Texas and the United States that are
beginning to influence the demand for transportation. As the population of Texas grows, the
characteristics of its population are also changing. Factors such as age, culture, income, and
place of residence influence travel demand and traveler behavior. A better understanding of the
current and future demographic composition of Texas travelers can be used to inform efforts to
manage demand and identify enhancements to TDM tools to meet the needs of this changing
audience (when combined with the traditional tools and strategies).
This research provides a contemporary understanding of TDM through an evaluation of
emerging tools and programs and how well those tools and programs capture the changes in
travel behavior based on shifting demographics and emerging technologies in Texas. To that end,
this report presents a discussion of how new technology can be leveraged to influence demand,
followed by an analysis of demographic changes that are expected to influence changes in the
demand for transportation. The report concludes with thoughts on the combined influences of
both factors.

8
Redefining TDM
TDM refers to a set of tools and strategies used to reduce the demand for travel, typically by
reducing overall travel, encouraging the use of higher-occupancy modes, or shifting travel away
from heavily congested periods. High fuel costs, environmental concerns, and increased
congestion motivated the creation of TDM programs that first appeared in the United States in
the 1970s. TDM programs traditionally focus on the commute trip, with a goal of reducing peak-
period congestion through the promotion of alternatives. Traditional TDM strategies can be
summarized as:
Improvements in alternative modes of transportation to SOV.
Financial or time incentives for the use of alternative modes.
Information dissemination and marketing activities to promote these modes.
Supporting services that make the use of alternatives more convenient or that remove
psychological impediments to their use (1).
TDM strategies and programs are offered through various levels of the public- and private-sector
employers and non-profit organizations. Typically, TDM efforts are implemented through
coordinated programs often called commute solutions, trip reduction, or emissions reduction
programs. In some cases participation may be mandatory, for example, if required by ordinance,
development code, or environmental standards. But generally participation by employers or
individuals is voluntary. TDM marketing will often point to the potential financial and
productivity benefits for employers; for example, the voluntary federal “Qualified Transportation
Fringe Benefit” enables employers to offer employees tax-free transit benefits that can then
generate tax savings for the employer (2).
In Texas, commute solutions programs exist in both Austin and Houston where metropolitan
planning organization staff promote alternative work schedules, flextime, and teleworking, as
well as help plan transit trips, map bicycle routes, and form carpools. These programs are
operated by the air quality program of the Houston-Galveston Area Council (H-GAC) and the
Capital Area Metropolitan Planning Organization (3). H-GAC summarizes the goals of its
program:
1. Move more people in fewer vehicles.
2. Use transportation that does not contribute to congestion and pollution.
3. Reduce the number of people commuting during rush hours.
4. Reduce the number of SOVs.
5. Eliminate the need to commute to work (4).

9
TDM programs generally include a combination of strategies and education. By offering or
incentivizing choices of location, route, time, and mode, these programs encourage a shift from
SOV trips to alternative modes or travel during non-peak periods. These programs can include or
support a variety of TDM strategies, including ride-share programs, transit services, bicycle and
pedestrian amenities, changes in work patterns, parking management, and marketing and
promotions.
Continuing growth across Texas has contributed to growing transportation demand and related
congestion. The Federal Highway Administration (FHWA) writes that “managing demand is
about providing travelers, regardless of whether they drive alone, with travel choices, such as
work location, route, time of travel and mode. In the broadest sense, demand management is
defined as providing travelers with effective choices to improve travel reliability” (5).
This definition broadens the scope of TDM to address:
Non-commute travel, which can include travel for school or leisure, special events,
special locations (such as national parks), and other non-recurrent congestion (including
highway construction) as well as recognizing the current trend of building personal
errands into the work commute (also known as trip chaining).
Redistribution of demand through efficiency improvements and reductions to overall
demand.
Concurrent with this need to consider an expanded definition of demand is significant investment
in intelligent technologies on the operations side that seek to address demand actively and
dynamically. Active transportation and demand management (ATDM) is a dynamic approach to
managing demand on the transportation network. ATDM leverages technology to enable regional
agencies to dynamically manage recurrent and non-recurrent congestion in real time, using
information and technology to redistribute and/or reduce travel.
Considered an extension of traditional TDM, ATDM is made possible by advancements and
investments in transportation operations and monitoring infrastructure such as monitoring
detectors, advisory systems (message signs), traffic management centers, traffic signals and
controls, and advanced public information portals (5-1-1, websites). ATDM builds upon
traditional TDM efforts by applying continual and often real-time assessment and dynamic
actions to manage the demand as it is happening (6).
This report seeks to explore the role of emerging technology, alongside the changes in the
demographic composition of Texas, to identify where and how TDM programs can be improved
to take advantage of both phenomena.
10
The Role of Emerging Technology in TDM
Information and communications technology (ICT) tools have opened up many opportunities for
improving transportation by providing navigation and traffic updates, real-time transit schedules,
and access to information on transportation options at any location. Intelligent transportation
systems and vehicle-to-vehicle communications are developing frameworks that harness the
power of wireless technologies to link and manage our transportation network.
The impact of telecommunications on transportation demand is increasingly important in non-
commute trips. Efforts have been made to categorize the possible effects of ICT technologies on
individual travel behavior, but the research is inconclusive. Categories borrowed from economics
include substitution, modification, complementarity, and addition of trips. The results of one
study show that the frequency of face-to-face contact is positively correlated with that for
electronic communication, pointing to a complementary effect (7). Substitution of physical trips
with electronic communications has been found to vary by activity and by context. For example,
online banking has to a great extent replaced trips to the bank, but many people are more
comfortable buying items such as shoes or food at a store (8). The context of ICT use—at home,
workplace, or mobile—can impact which type of effect it will have on travel (9).
Most TDM programs today provide access to their information and services through a website
and in some cases a mobile application for smartphones and other wireless devices. Smartphones
directly enable new opportunities for real-time demand management by providing easy and
instantaneous access to navigation, weather and traffic updates, real-time transit schedules, ride-
matching services, and access to information about transportation options at any location. Using
these tools, travelers can assess conditions in real time to identify the best route and schedule for
traveling. Many of these tools enable users to track their travel decisions and incorporate
incentive or rewards programs offered by traditional TDM programs. For example, Seattle’s
RideshareOnline.com can be used by individuals or tailored to specific company needs by
limiting searches to a certain work site and adding employer promotions and incentives.
In addition to leveraging technology to update traditional TDM programs, private companies and
start-ups are exploring new transportation tools and services that are enabled by new technology
and the proliferation of Internet and mobile devices. More specifically, global positioning system
(GPS) technology is commonly embedded in vehicle navigation systems and has further
expanded as a standard feature in most smartphones. GPS technology allows for comprehensive
tracking and sharing of location and route information. This information can be used to adjust
routes, departure times, and destinations, leading to shorter trip times and lowering the risk and
stress of navigating. This ability to instantly navigate nearly anywhere also applies to non-
vehicular travel as well, helping individuals track walk, bike, transit, or shared ride trips, and
providing information and improving the safety of all these modes.
The remainder of this section discusses some of the advances in TDM specifically related to the
introduction of new technology.

11
Advanced Travel Information Systems
Advanced travel information systems (ATISs) refer to technologies that provide pre-trip and en-
route travel information to travelers about road conditions. An ATIS depends on the quality and
availability of information gathered from advanced traffic management systems. These programs
demonstrate the growing link between demand management and transportation system
operations.
Taking advantage of the wealth of information collected on traffic patterns, new actors and tools
aim to affect travel decisions based on real-time information. Two such new entries are Metropia
and RideScout:
Metropia is an app-based advanced TDM application designed to incentivize travelers to
change their travel behavior in real time. Using an algorithm to analyze historical and
real-time travel data, Metropia predicts future travel conditions and can determine where
additional capacity exists. Drivers make a reservation and are assigned to the shortest
route and optimal departure time. Metropia optimizes daily commutes and other trips, and
rewards drivers for trips taken outside peak hours and routes that avoid congestion.
Metropia recently conducted a pilot study in Los Angeles, California, that found travel
time could be reduced by 20 percent for users that change travel behavior. The study also
determined that Metropia had a 15 percent prediction error (Metropia claims that similar
applications, such as Waze and other travel time mobile applications, typically have a
40 percent prediction error). Metropia began testing the application in Los Angeles in
summer 2014 and in May 2015 will launch a beta test in Austin, Texas (10).
RideScout is another privately developed mobile application that helps travelers review
and take advantage of their transportation choices. The app works by providing a map
dotted with comparative real-time information about available transportation options
nearby, and costs and detailed navigation for each option. This includes driving,
carsharing, public transit, ridesharing, bike sharing, walking, taxi, and other local
partners. The company continues to expand its offerings as it builds new partnerships
with transportation services. RideScout launched in Washington, D.C., in 2013 and has
since expanded to dozens of other North American cities including Austin, Dallas,
El Paso, Fort Worth, Houston, and San Antonio, Texas. The app provides the unique
opportunity to assess travel options quick and easy—for all trips, not just commute trips.
Advanced Parking Management Systems
Parking management has long played a role in demand management, particularly in the use of
parking pricing policies to encourage higher vehicle occupancy levels. A range of tools,
collectively called advanced parking management systems, can provide pre-trip information,
help people find parking spots, improve circulation in parking lots, and reduce illegal parking.

12
Parking management is also being applied to other situations such as at airports or major events
(11).
A pilot parking management tool, SFpark, evaluated the effectiveness of demand-responsive
pricing and real-time information on parking availability for reducing congestion in
San Francisco (12). A total of 7,000 of San Francisco’s 28,800 metered spaces and 12,250 spaces
in 15 of the parking garages managed by the San Francisco Metropolitan Transit Authority were
tested (13). The free mobile application used smart pricing to enable drivers to quickly find open
spaces by periodically adjusting prices at meters and garage spaces to match demand. This
pricing scheme encouraged drivers to park in underused areas and garages, which reduced
demand in overused areas while also smoothing out traffic on the roadway network.
Road Pricing
Pricing strategies have been found to be effective at reducing congestion and influencing travel
behavior. Road pricing systems have been implemented in various forms in the United States and
worldwide, including toll roads, lane pricing, zone pricing, and high-occupancy toll (HOT) lanes.
Advancements in operations and monitoring technology allow for more flexible pricing schemes
that can quickly adjust in direct relation to congestion levels or other travel conditions.
Road pricing systems can be flat rate or variable. Flat-rate tolling has historically been used as a
revenue-generation tool rather than for demand management, but more recent efforts are using
variable and even dynamic road pricing to actively manage roadway congestion and reduce delay
(14). Variable pricing can be based on factors such as time of day, location, vehicle type, or
occupancy. Traditional high-occupancy vehicle (HOV) lanes, which restrict lane access to high-
occupancy vehicles, can be redefined as HOT lanes that grant free access for HOVs and charge
lower-occupancy or SOVs for use. The lanes can be dynamically priced to maintain a reliable
free flow of traffic (15).
Two emerging methods of road pricing are zone pricing and dynamic tolling.
Zone Pricing
The first congestion-based pricing system was introduced in Singapore in 1975; it converted to a
fully automated electronic road pricing system in 1998. Rates vary by facility and time of day
depending on traffic conditions, encouraging motorists to change their mode, route, and time of
travel (16, 17). In-vehicle electronic devices allow for payment by smart card, while cameras and
license plate reading equipment are used for enforcement. Congestion pricing on Singapore’s
highways has resulted in a 13 percent decrease in traffic and a 22 percent increase in vehicle
speed (18). Other similar programs have been implemented in Stockholm, Sweden, and London,
England. A five-year study of Stockholm’s congestion pricing system revealed substantial
reductions of traffic, congestion, and travel time variability (19). All three of these examples
identified air quality improvements in addition to congestion reductions.

13
In 2003, a congestion-based area charging system was introduced in London, charging motorists
5 Great Britain pounds (about $8 USD) per day to drive into a defined central zone during the
congested daytime period. Within the first year of operation, delay reductions of 30 percent,
traffic reduction of 15 percent, and increased vehicle speeds of 37 percent were measured (18).
In 2007, the amount of traffic entering the charging zone was 21 percent less than in 2002.
Economic activity within the zone was not found to be negatively affected by the program, and
businesses in the zone did relatively well in relation to the rest of the city (20).
Zone pricing requires successful enforcement, which relies on a network of traffic cameras,
license plate recognition equipment, and tools to transmit and process this information. London
has cameras at every entry and exit point to the zone that transfer photos of vehicles to a license
plate recognition system, and in 2006, added vans equipped to read licenses from parked cars
while traveling in general traffic. A web-based interface is then used to match vehicles to their
registered owner to request payment. In Singapore, in-vehicle electronic devices are used to
allow for payment by smart card.
Dynamic Tolling
Dynamic tolling seeks to maintain free-flow traffic in tolled lanes through adjusting prices
according to real-time traffic conditions. Several examples of dynamic tolling that have
demonstrated increased travel speeds, decreased traffic volumes, and increased use of alternative
travel modes exist in the United States, such as:
The Miami-Ft. Lauderdale region implemented a managed-lane facility on I-95 between
I-395 and I-595, one of two projects in the nation to increase the occupancy requirement
on HOV lanes, in this case from HOV 2+ to HOV 3+. On this facility, toll rates are
adjusted as often as every three minutes based on demand to maintain free-flowing
conditions on the managed-lane network. According to the Florida Department of
Transportation (DOT), the project has helped increase travel speeds by more than
200 percent on both local lanes and express lanes, and increased transit usage by
145 percent (21, 22).
The Washington State Department of Transportation (WSDOT), in collaboration with the
Puget Sound Regional Council and several other agencies, introduced variable tolling on
the SR 520 floating bridge in Seattle in December 2011 with dual goals of reducing
congestion and financing a newer, safer bridge. Since tolling began, transit and vanpool
trips have increased and total peak-period traffic volumes have declined by 6 percent.
Weekday transit ridership is up 25 percent from 2010 and vanpools increased by more
than 40 percent, removing more than 1,000 daily vehicle trips from the corridor (23, 24).
Average travel times for both directions on SR 520 have decreased by about 4 minutes.
WSDOT’s April 2011 survey found 42 percent of 800 households would take an
alternative route rather than pay the SR 520 toll and 9 percent would adjust their time of
day of travel if the toll rate was lower (12).

14
Dynamic Real-Time Ride-Sharing
Private companies and individuals are pushing technology-based transportation networks, and
new programs such as Uber® and Lyft
® are challenging traditional definitions of ride-sharing and
taxi services. These mobile applications allow users to arrange a pick-up in real time, choose the
type of service at several different price points, and calculate a preliminary fare quote. Uber uses
dynamic pricing based on local conditions and even special events, with what they call surge
prices at peak times, intended to trigger an increase in the supply of drivers in order to meet
demand spikes. These services provide additional benefits enabled by real-time tracking of the
program’s activity including the location of nearby drivers, a description of an assigned vehicle
pick-up, updates on arrival time, and a GPS-based map detailing a completed ride as part of the
receipt. These amenities provide efficiency, reliability, and safety benefits for users and drivers.
In addition to these ride-sharing services, agencies are seeking smartphone-based applications to
promote dynamic real-time yet informal ride-sharing. Two examples include Carma and
iCarpool:
Carma (Figure 1) is a real-time ride-sharing program designed to provide a marketplace
for drivers to offer their unused seats to other travelers in real time. The Central Texas
Regional Mobility Authority recently partnered with Carma to offer this marketplace,
using funds received by the Federal Transit Administration (25). With this software, a
driver running the GPS-enabled app is matched in real time with anyone searching for a
ride along the same route. The system combines ride-matching with fully automated
payment transaction management, real-time passenger information, safety features, and
commute reporting to enable more flexible and verifiable carpooling. This model builds
upon casual carpooling, offering drivers a convenient method of saving money on their
commute without having to stick to rigid carpooling schedules. Riders are provided with
a convenient and affordable alternative to public transport (26).
Source: TTI, 2014.
Figure 1. Carma Riders in Austin.

15
El Paso’s Economic Development and Sustainability Division launched iCarpool in 2013
for the purpose of reducing vehicle emissions and oil consumption through a web-based
reporting and rewards system (27, 28). iCarpool software provides incentives and
subsidies to users by tracking reduced carbon dioxide (CO2) emissions, vehicle miles
traveled (VMT), and associated fuel savings. To support ride-sharing decisions, iCarpool
identifies route information, time agreements, pick-up and drop-off locations, and
provides an emergency ride home program.
Technologies for Transit
New tools are being used to address the real and perceived concerns about transit convenience,
reliability, and safety. One of the most important strategies improving public transit service is the
provision of real-time wait time information at transit stops and stations across the country. This
information is also offered via the Internet and cell phones, alongside trip planners that help
travelers find and select a route. These features can shorten total trip times, reduce wait times,
improve satisfaction, and have been shown to increase the number of transit trips (29).
Private companies are combining new technologies with traditional bus services to serve
travelers who may not be well served by existing public transit service and routes. A start-up
transportation service, Bridj, launched a data-driven express shuttle network in Boston,
Massachusetts, that provides dynamic, flexible travel. The company designs routes based on user
information to determine routes with fixed stops and reliable schedules that best serve the
demand of the users. The shuttles are intended to fill gaps in traditional transit service, cost more
than public transit, and include Wi-Fi and other amenities (30).
Private employers have even led efforts to provide transportation service to their employees.
Companies including Google®, Microsoft
®, and Apple
® offer shuttles equipped with state-of-the-
art equipment to facilitate productive work sessions while in transit to the offices. The high-tech
employers provide the service as amenities along with storage for bicycles and guaranteed rides
home, car-share and bike-share programs, intercampus shuttles, numerous on-site services,
transit subsidies of up to $100 per month for riding public transit two or more days per week, and
bike subsidies of up to $20 per month.

16
Future Demand and Texas Demographic Trends
At a most basic level, people travel in order to participate in activities. A region’s travel patterns
are a compilation of the activities of its residents. These travel patterns vary based on
demographics, land use patterns, transportation options, and other regional characteristics. As the
population grows, the amount of travel increases as well, both from the introduction of new
residents in the region and changes in the characteristics of the travelers themselves.
From 2000 to 2010, Texas experienced a population growth rate of over 20 percent, more than
double the national average. Houston and San Antonio ranked second and fourth, respectively,
among U.S. cities for the largest numerical increases in population from 2012 to 2013. San
Marcos, Frisco, and Cedar Park, Texas, rank among the five fastest growing cities (by
percentage) in the United States in the same period (31).
This growth is expected to continue into the future. Texas population projections through 2050
as generated by the Texas Office of the State Demographer are presented in Figure 2. Projections
are based on three different migration rates:
A rate equal to the 2000–2010 state migration rate.
Half the 2000–2010 rate.
No migration.
Source: Texas State Data Center, 2012 population projections using 2010 U.S. Census data.
Figure 2. Texas Total Population by Migration Rate 2010 to 2050.

17
Figure 3. U.S. Census Reports on High Growth Cities in United States, 2012 to 2013.
The mid-range scenario estimates the Texas population will include over 41 million persons by
2050 (Texas State Data Center, Population Projections Tool). In any of these scenarios, millions
of new travelers will add more demand for travel and exacerbate congestion on Texas roads.
Age, culture, race, income, and place of residence have all proven to be predictors of
transportation demand and traveler habits. By understanding the needs and activities of changing
traveler groups, TDM programs can be identified and tailored to each group by expanding upon
traditional workplace-based programs that are designed only for a few traveler groups.
The remainder of this section discusses different segments of the Texas population deemed likely
to have a significant impact in its future transportation demand and a broad review of the travel
or activity characteristics associated with each group. The goal is to identify where existing
TDM programs fit the needs of these traveling groups and where new programs may be needed.
Geography: Urban-Rural Spectrum
Many Texas regions are expanding rapidly, and population growth is expected to continue in
these areas through 2050. In contrast, some rural counties in West and East Texas are anticipated
to experience a decrease in population. The largest numerical increases in population are
expected in the large urban counties: Bexar, Dallas, Harris, Tarrant, and Travis. The largest

18
percentage increases are expected in the suburban counties that surround these urban centers.
Although the rural population has been decreasing in the last few decades, the more than
3 million Texans who currently live in rural areas make Texas the home of the largest rural
population in the United States (32). Across Texas, these residents of shrinking rural towns, fast-
growing suburbs, and dense city centers exhibit very different needs and preferences in terms of
travel demand.
According to the 2008–2012 American Community Survey (ACS), nearly 80 percent of all
Texas workers currently drive to work alone, as shown in Figure 4. Commuters from rural Texas
regions are more likely to drive alone to work than urban commuters in Texas, while urban areas
are more likely to have public transit networks and accordingly a higher share of transit
commuters among residents. ACS data show that 1.8 percent of urban commuters use public
transit versus only 0.2 percent among rural Texas commuters. Texans in rural areas are more
likely to work at home than their urban counterparts, which may be attributed to more
agricultural jobs. Carpooling/vanpooling is used equally in both types of region.
At the national level, ACS data show that walking to work is more common among workers in
core cities (4.3 percent) versus those in the suburbs (2.4 percent). Bicycling to work has
increased by 60 percent in the last decade but still accounts for only 0.6 percent of all commuters
(33). According to the Texas Transportation Poll, one-third of Texans reported walking and one-
tenth reported bicycling for a non-recreational trip in the previous 30 days (34).
Employment patterns and associated commuting behavior that vary along the urban-rural
spectrum emphasize the need for options with respect to TDM strategies. Farming and fishing
industries are more prevalent in rural areas, whereas urban areas tend to have a higher proportion
of service jobs (35). Traditional TDM strategies focused on peak-period commuters would not
serve these workers successfully because of their decentralized work locations (in the case of
farms and fisheries) or non-peak schedules (as is the case for many service workers).

19
Source: (36).
Figure 4. Texas Travel Mode to Work.
Vanpools have been successful in some rural areas in the United States, taking advantage of
innovative partnerships involving area employers and support from local political leaders
emphasizing ease of use for commuters and ensuring a guaranteed ride home (37). Given the
long commutes for many rural residents, strategies that support or incentivize ridesharing have
the potential to reduce the number of vehicles on the road, make commuting less stressful and
saving money relative to the cost of driving alone. Another important consideration is that
residents without vehicles and individuals with limitations that prevent driving may face
heightened isolation as a result of lack of non-automobile options in rural areas. Ride-sharing
and carpooling can provide mobility for travelers who do not have the choice to drive alone.
New variations on these tools, such as peer-to-peer car-sharing of personal vehicles, may also
offer rural travelers new opportunities.
Age and Life Cycle: Baby Boomers and Millennials
Many of the factors that influence travel demand, such as family composition, employment, and
life stage, vary with age. As shown in Figure 5, travel behavior indicators such as VMT reflect
the different habits of age groups. Two generational groups in particular, Millennials and Baby
Boomers, are expected to have a large impact on travel trends in the United States. Part of this
influence stems from the fact that these groups together comprise about half of the U.S.
population. Furthermore, Baby Boomers are reaching retirement age and Millennials are poised
to become the dominant group in the working-age population.

20
Source: (43).
Figure 5. VMT by Age Group, 2009.
Millennials
Millennials (defined here as those born from 1983 to 2000) make up approximately 25 percent of
the population in the United States. By 2030, they will represent the majority of the American
population and influence the composition of the peak driving age category of 35 to 54 year olds.
In the last century, Americans in this 30–54-year-old age bracket drove more in tandem with life
milestones such as securing jobs, having children, and moving to suburban communities.
Considerable evidence shows that in comparison to other cohorts, Millennials—currently
teenage to early 30s—are driving less, are buying fewer cars, prefer dense and walkable
neighborhoods, and are starting families later (38, 39). Owning a car and a home, once
considered conventional rites for Americans as they age into adulthood, appears less popular
among young Americans. Millennials are more likely to live with roommates or family members
than alone, and more than two-thirds are renters (40). Car usage and ownership has declined
among younger Americans. VMT per capita for those age 16 to 36 decreased by 23 percent
between 2001 and 2009 (38). In 2007, 73 percent of households headed by someone younger
than 25 owned at least one vehicle. By 2011, that proportion decreased to 66 percent (41). Other
studies have shown greater reductions in miles traveled for personal business and shopping
among younger (16–30) travelers versus older cohorts (42). It is not clear whether these current
trends will be sustained as Millennials get married and have children, characteristics typically
associated with suburban living, vehicle ownership, and more typical commuting patterns.
Millennials are also defined by their comfort with and affinity for technology, having grown up
with the Internet and mobile phones. These technologies are conducive and sometimes critical to
the operation of many TDM tools. Internet usage is nearly universal among Millennials
(95 percent of 18 to 29 year olds use the Internet), and two-thirds of young adults own
smartphones (43).
21
While it is difficult to separate the temporary effects of the recent economic recession and the
potential for Millennials’ preferences to change as they enter new life stages, some systemic
shifts that have contributed to the current trends are likely to remain. Fuel prices have increased
between 2000 and 2010, and the U.S. Energy Information projects a further 26 percent increase
from 2010 to 2020 (38). The economic and environmental effects of transportation are common
considerations for individuals, businesses, and public agencies. The culture of driving has also
changed. Between 1996 and 2006, all 50 states enacted new graduated drivers’ licensing laws,
limiting driving privileges for young drivers by way of learner’s permits and driving restrictions.
These laws make getting a license more challenging and more expensive, and sometimes make
driving opportunities more restricted. Even if some of these conditions prove temporary, these
experiences may prove to have lasting effects on the preferences and habits of Millennials as
they age. Increasing fuel costs, more restrictive driving laws, and the new opportunities afforded
by the use of technology suggest a permanent change to the conditions affecting travel demand.
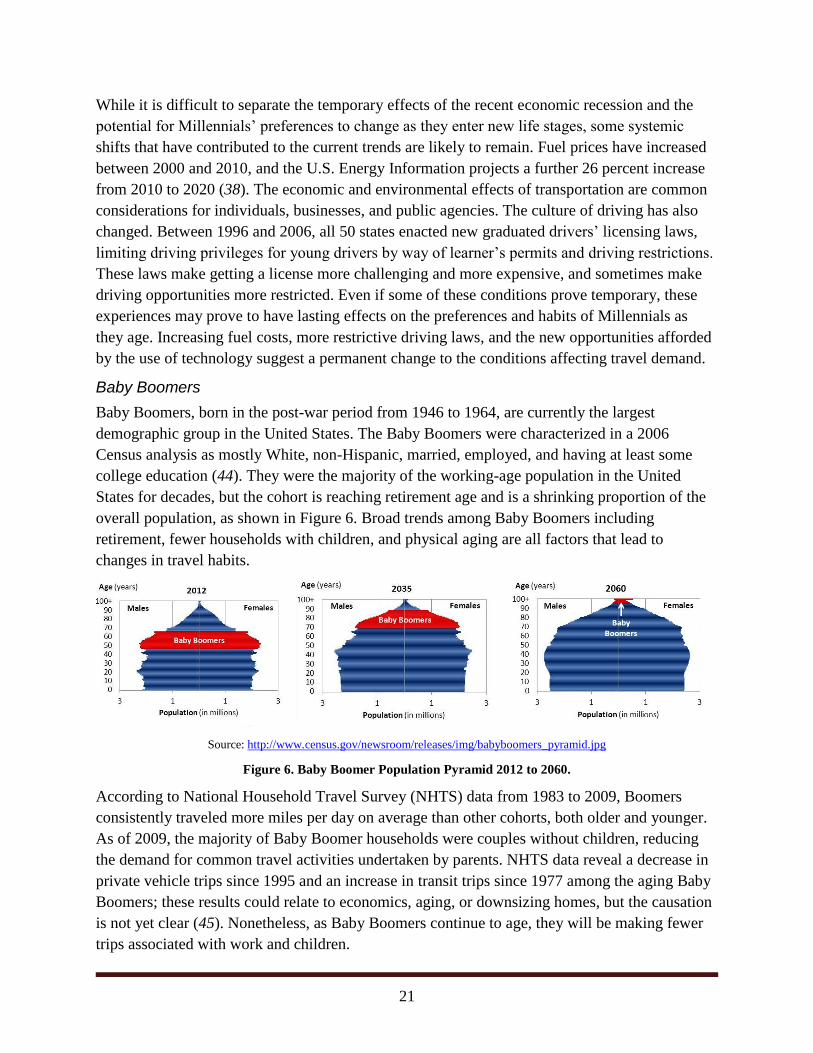
Baby Boomers
Baby Boomers, born in the post-war period from 1946 to 1964, are currently the largest
demographic group in the United States. The Baby Boomers were characterized in a 2006
Census analysis as mostly White, non-Hispanic, married, employed, and having at least some
college education (44). They were the majority of the working-age population in the United
States for decades, but the cohort is reaching retirement age and is a shrinking proportion of the
overall population, as shown in Figure 6. Broad trends among Baby Boomers including
retirement, fewer households with children, and physical aging are all factors that lead to
changes in travel habits.
Source: http://www.census.gov/newsroom/releases/img/babyboomers_pyramid.jpg
Figure 6. Baby Boomer Population Pyramid 2012 to 2060.
According to National Household Travel Survey (NHTS) data from 1983 to 2009, Boomers
consistently traveled more miles per day on average than other cohorts, both older and younger.
As of 2009, the majority of Baby Boomer households were couples without children, reducing
the demand for common travel activities undertaken by parents. NHTS data reveal a decrease in
private vehicle trips since 1995 and an increase in transit trips since 1977 among the aging Baby
Boomers; these results could relate to economics, aging, or downsizing homes, but the causation
is not yet clear (45). Nonetheless, as Baby Boomers continue to age, they will be making fewer
trips associated with work and children.

22
Researchers in Illinois studied travel behavior among preretirement Baby Boomers (55 to 64)
and senior citizens (65 to 74). The daily timing of trips for seniors is different from that of
preretirement Baby Boomers and is relatively variable, largely because seniors have fewer
mandatory activities. The study found that seniors’ peak activity times on weekdays were at
approximately noon and 4 p.m., while working-age Boomers traveled during the typical morning
peak. Another study found that senior citizens are less likely to perform the standard home-to-
work travel and their travel habits may be complicated by mobility restrictions (46). Traditional
TDM strategies focused on work trips will not serve the needs of the aging Baby Boomers.
Instead, they would be better served by strategies that are available on short notice, accessible
off-peak, or provide for decreased mobility.
While Internet usage is increasing among all age groups, including Baby Boomers, seniors are
still far less likely to be Internet users than younger adults, according to the Pew Research Center
(47). As shown in Figure 7, more than half (59 percent) of seniors, defined as those over 65 years
of age, were Internet users as of 2013 compared to 86 percent of the adult (18 and older)
population. Forty-seven percent of seniors have high-speed broadband connections at home, and
77 percent have a cell phone. Still, this population group lags behind the younger generations in
technology use and ability. Smartphone use is very low; only 18 percent of seniors own
smartphones.
Many emerging TDM strategies rely on the use of the Internet and mobile devices to
communicate with users; older, less educated, and lower-income seniors are less likely to be
reached by these strategies.
Figure 7. Attributes of Seniors’ Technology Adoption.
Texas’ Hispanic Population
Census predictions estimate that the Hispanic population in the United States will increase from
17 percent to 31 percent of the total population from 2012 to 2060. In the Texas State Data
Center mid-range scenario, the Hispanic population in Texas increases from 37 percent in 2010

23
to nearly 54 percent in 2050, as shown in Figure 8. Socioeconomic characteristics of this
growing population group, including family size, vehicle ownership, and employment status,
have been shown to vary from travel by similarly situated non-Hispanic population groups.
Source: Texas State Data Center
Figure 8. Population Projections by Ethnicity, 2010 to 2050.
The Hispanic population itself is diverse, with many native Texans identifying as “White and
Hispanic” and Hispanic residents accounting for nearly three-quarters of the immigrant
population in Texas. A 2009 study of Texas household travel data investigated differences in
travel behavior of U.S.-born Hispanic and foreign-born Hispanic cohorts in relation to a White
cohort. Results indicated U.S.-born Hispanic travel behavior was similar to White households,
despite having lower incomes, larger average household size, and lower vehicle ownership. U.S.-
born Hispanic households had similar work trip rates as White households but more church and
school trips per person (48).
Hispanic residents in the United States are generally just as likely to own a cell phone,
smartphone, and access the Internet and social networking sites from a mobile device as other
Americans. Personal computer ownership is lower among Hispanic Americans than White
Americans, but the digital divide has been decreasing for the Hispanic population overall (49).
Foreign-Born Population
The U.S. Census Bureau predicts that international migration will surpass natural increase as the
primary driver of population growth in the United States by 2027 (see Figure 9). As of 2010,
foreign-born residents made up 13 percent of the United States population. Data from the 2012
5-Year ACS indicated that Texas ranked 7th
among U.S. states, with a 16 percent share of
foreign-born residents. Houston, as one of the largest urban areas in the state, has the highest

24
proportion, with 1 in 4 residents originating in foreign countries (50). Foreign-born populations
in Texas are more likely to be Latin American and Asian than European or African (50).
Source: U.S. Census Bureau, 2012 National Projections
Figure 9. Net International Migration and Natural Increase, 2012 to 2060.
The 2001 NHTS showed that new immigrant households were larger than U.S.-born households,
had fewer drivers and fewer vehicles, and tended to make more trips per day. Work trips tended
to be shorter in distance and time. New immigrants were also more likely to take trips on public
transit or by walking. Figure 10 details the difference in mode choice between new immigrants
and native-born households.
Another study by UC-Davis also found that foreign-born survey respondents walk more than
U.S.-born respondents. It reported that transit use was less likely among more established
immigrants compared to newer immigrants (51). Table 1 shows a summary of characteristics of
new immigrants. Factors such as more household workers, fewer vehicles, and fewer drivers per
household make new immigrants a logical target for TDM campaigns, as they may be more in
need of alternative transportation options.

25
Figure 10. Mode Split (Percent of Trips).
Table 1. Key Demographic and Travel Characteristics of New Immigrants.
Demographic Characteristics New Immigrants National Average
Average Household Size (persons) 3.6 2.6
Average Workers per Household 2.0 1.4
Average Vehicles per Household 1.3 1.7
Home Ownership (%) 16.1 72.3
Travel Characteristics
Percent Drivers (16+) (%) 60.6 91.5
Usual Distance to Work (miles) 9.5 13.2
Usual Time to Work (minutes) 24.6 25.5
Average Daily Trips per Household 10.2 9.6
Source: (52) New immigrants are defined as foreign-born persons living in the United States for three years or less.
Foreign-born populations were less likely to be high school graduates than the native-born, but
still two-thirds were high school graduates and more than one-quarter over the age of 25 had at
least a bachelor’s degree. Overall, the foreign-born were more likely than native-born to be in the
labor force. One-quarter of foreign-born residents worked in service occupations, according to an
ACS summary (53). Service workers are not likely to be served by traditional commute-focused
TDM.
The demographic groups discussed in this section and the potential to reach them via TDM
techniques are summarized in Table 2. Table 2 also summarizes the major trends, demographic
characteristics, and other considerations that impact the selection and effectiveness of various
TDM strategies on specific population groups. TDM strategies that would be most applicable to
each group are listed in the last column.

26
Table 2. Summary Table: Texas Demographic Trends and TDM Strategies to Target Groups.
Summary Table: Texas Demographic Trends and TDM Strategies to Target Groups
Demographic Group
Trends Demographic
Characteristics Considerations
Neo-TDM Strategies with Potential to Serve This Market
Ge
ogr
aph
ic T
ype
Urban
Texas is increasingly urban; large numerical increases in population in large cities
Diverse immigrant populations; younger; higher propensity toward transit and non-motorized travel modes
More existing transit accessibility; revitalization of city centers and increased urban development/ construction; high density
Telework and Flexible Work Arrangements
Dynamic Parking Management
Car-sharing, Bike-sharing
Advanced Traveler Information
Road Pricing
Outreach and Education Programs
Suburban
Growing faster than other geographic areas types; high level of overall travel
Traditionally family households; growing diversity
Sprawl development limits travel options
Telework and Flexible Work Arrangements
Dynamic Real-time Ride-sharing
Advanced Traveler Information
Road Pricing
Outreach and Education Programs
Rural
Shrinking in size but still 3 million rural residents in Texas
Older, less diverse, lower workforce participation, and less commuter travel than other geographies
Low density is a barrier for transit and access; tech-enabled low-barrier tools may offer new solutions (e.g., peer-to- peer car-sharing)
Telework and Flexible Work Arrangements
Dynamic Real-time Ride-sharing
Outreach and Education Programs
Advanced Traveler Information
Road Pricing
Life
Cyc
le
Millennials
25% of US population, will be reaching peak travel years by 2030; delaying traditional life cycle activities (e.g., marriage, home ownership); migrating to cities
Drive less than previous generations; more diverse than previous generations
Preferences may change with life cycle; currently show strong interest in alternatives to driving and vehicle ownership; high levels of technological connectivity
Telework and Flexible Work Arrangements
Dynamic Real-time Ride-sharing
Car-sharing, Bike-sharing
Advanced Traveler Information
Outreach and Education Programs
Baby Boomers
Once the largest demographic group, no longer majority of working-age population; starting to
Highly variable travel times; off-peak travel
Fewer working adults due to retirement; decreased mobility due to aging; historically high levels of overall travel; technology use not common to all
Dynamic Real-time Ride-sharing
Advanced Traveler Information
Outreach and Education Programs

27
Summary Table: Texas Demographic Trends and TDM Strategies to Target Groups
Demographic Group
Trends Demographic
Characteristics Considerations
Neo-TDM Strategies with Potential to Serve This Market
work less
Retirees
Baby Boomers overlap with this group, especially in the future; employment status has big impact on travel habits (less travel, off-peak travel)
Special mobility needs; few mandatory travel needs
Technology use more limited; decreased mobility and disabilities
Dynamic Real-time Ride-sharing
Advanced Traveler Information
Outreach and Education Programs
Rac
e a
nd
Eth
nic
ity
Hispanic
Rapidly growing portion of Texas population
Large families, some first generations; travel behavior in line with U.S. trends despite larger households and lower average income
Larger households tend to take more trips; technology is not a barrier; language must be considered in program design and outreach
Dynamic Parking Management
Dynamic Real-time Ridesharing
Advanced Traveler Information
Outreach and Education Programs
Foreign-Born
Fast population growth; 16% of Texas population; diversity of origins (mainly Latin America and Asia)
Larger households; fewer drivers per household; low homeownership rates
Tend to make more trips per day with fewer vehicles; language must be considered in program design and outreach, more variation in languages
Dynamic Parking Management
Dynamic Real-time Ridesharing
Advanced Traveler Information
Outreach and Education Programs

28
Implications for the Future of TDM
The expanded definition of TDM, and the wealth of new TDM techniques being implemented
and tested, means there is a wealth of experience and information to pull from in shaping the
future of TDM programs. With the advent of new technology and recognition of the
individualized nature of travel decisions, TDM can focus on the provision of choices, along with
efforts to make the components of the transportation system work most efficiently. New
technologies allow for more individualized demand management strategies and real-time
information that can be accessed anytime, and impact trips beyond peak-time commuting.
Technology-enabled demand-side strategies are more flexible than traditional TDM strategies
and can address non-peak and non-commute travel, incorporate new travel modes, and leverage
new opportunities offered by emerging technologies.
Target Outreach and Education Programs
Changes in technology and demographics lead to changes in travel patterns. Most significantly,
what was once a stand-alone trip to and from work has evolved into a multi-purpose trip that
includes stops for household and personal errands in an effort to achieve a better work-life
balance. In response, new outreach and education programs that consider the entire travel pattern
of the households are emerging in the United States. These comprehensive programs target
neighborhoods or sub-regions to raise awareness of alternative transportation options and TDM
programs. Individual households are educated on options such as transit routes, HOV lanes,
flexible schedules, parking management, bicycle accommodations, and provided transportation
maps tailored to the home location. Examples of comprehensive TDM programs include:
The Portland SmartTrips program was initiated to promote the use of alternative
transportation (54). The program focused on specific areas within Portland, Oregon. For
each identified area, individualized marketing and outreach informed area residents and
employees of non-auto alternatives. A 2006 program resulted in a 13 percent reduction in
drive-alone trips from the 7,400 participating households (31 percent of households in the
targeted region) (55). A similar program targeting an area near the Interstate MAX light-
rail line resulted in a 14 percent decrease in VMT (56). Today, SmartTrips continues to
offer customized information for residents interested in reducing vehicle use or a
multimodal lifestyle.
King County Metro in Washington targeted three neighborhoods within its service area
for a social marketing pilot project. This project used new branding and marketing
materials to promote transit, including posters, events, incentives, focus groups, and
direct mail. Metro conducted before and after surveys of participants and tracked bus
ridership counts. The annualized results of the pilot program were estimated by
comparing the before and after data and showed 2,564 trips shifted from cars to
alternative modes, with an associated decrease of 31,522 VMT (57).

29
A comprehensive effort that extends even further and considers the travelers, employers,
local and regional governments, business owners, and developers has been piloted in
several regions of Australia (58).
Support Younger Travelers
In addition to their high rate of technology use, Millennials have been leading the movement to
use emerging transportation programs such as dynamic real-time ride-sharing and transportation
network company services such as Uber and Lyft. Even if Millennials have the potential to shift
back into traditional suburban patterns seen in previous generations, there is an opportunity to
solidify their relationship with alternative transportation options.
Leverage Personal Mobile Technology
Smartphone applications and real-time transportation information systems can be broadly
applicable among several growing population groups in Texas. Fifty-one percent of Texans
surveyed in the 2014 Texas Transportation Poll reported using a smartphone app to make travel
decisions (34). National data reveal that a majority of individuals have a smartphone, and that
even among low-income and minority populations smartphone usage is high. Leveraging these
technologies can bring TDM tools to Hispanic and immigrant populations in Texas, who
demonstrate higher propensities for alternative travel modes but may not be reached by
traditional outreach.
Technology continues to change and is likely to be an important element in expanding
transportation options and improving the efficiency of existing ones. It has also been argued that
the integration of current technologies helps to engage new users. The ability to innovate is likely
to help TDM programs improve their operations and continue to appeal to growing markets.
Focus on Non-Commute Travel
TDM programs have traditionally focused on the commute trip that, while important, only
accounts for 16 percent of all person trips in 2009 (59). The emerging view is to also address
non-recurrent congestion (such as for special events), non-work travel needs, and generally aim
to offer a range of travel choices at various periods of time. New tools and the ability to
customize TDM suggestions further enable this approach.
Support Complementary Strategies
TDM has demonstrated better success when multiple strategies are in place. The use of emerging
technology and other innovations to reduce SOVs has become more prevalent alongside the
more traditional program approaches. In most cases, combined strategies are more effective than
individual approaches. Table 3 demonstrates how the combined impact of such strategies on
employee vehicle trip reduction varies. The London transport agency emphasizes that the highly
publicized congestion charging program was one element of a larger demand management plan

30
that included additional bus service, a range of discounts and exemptions, and other traffic
management measures. Net revenue from the system in 2006–2007 was applied mainly to bus
network operations improvements, road and bridge projects, safety, walking, and cycling.
Table 3. Impact of Selected Employer-Based Demand Management Strategies.
Strategy Details Employee Vehicle Trip Reduction Impact (%)
Parking Charges Previously Free Parking 20–30
Information Alone Information on Available SOV Alternatives
1.4
Services Alone Ride Matching, Shuttles, Guaranteed Ride Home
8.5
Monetary Incentives Alone Subsidies for Carpool, Vanpool, Transit
8–18
Services and Monetary Incentives
Example: Transit Vouchers and Guaranteed Ride Home
25
Cash-Out Cash Benefit Offered in Lieu of Accepting Free Parking
17
Source: (60).
Quantify the Benefits of TDM
The emergence of new TDM tools, their variability across geographies, and the individualized
nature of travel behavior make it difficult to translate TDM’s successes. Still, TDM has shown
success for air quality improvements, reducing emissions, improved workplace productivity, and
cost savings, and many of its tools are also featured in public health initiatives. Reducing work
commute trips directly contributes to reductions in VMT. The London congestion charge project
instigated significant investment in the monitoring of impacts, measuring new indicators and
increased traffic surveying, providing support for the TDM effort and broader effects on the city.
London’s monitoring reviewed economic activity, social and environmental impacts, and
congestion and transportation impacts. Identifying the overlapping and far-reaching benefits of a
TDM program can demonstrate its value and cost-benefit ratio more accurately. Several U.S.
states have established strong programs that demonstrate quantifiable results:
The Telework Arizona program for state employees in the Phoenix metropolitan area has
evolved into a key strategy for reducing congestion and improving air quality. As of
2007, more than 20 percent of state employees in Maricopa County participated in the
program. Telework Arizona estimates that these workers saved 5,250,000 miles of
vehicle travel and 181,000 hours of personal commute time in 2008 (57).
Eligible state employees in Georgia can participate in the statewide Work Away telework
initiative. As of 2012, 5 percent of Georgia’s 80,000 state employees participate in the
program. If Georgia state employees telework at least once a week, 416,000 trips are

31
saved per year, which equates to an estimated VMT savings of 5,470,400 miles annually
(57).

32
References
1 Federal Highway Administration. 1994. Overview of Travel Demand Management
Measures: Final Report. DOT-T-94-11, U.S. Department of Transportation.
2 Internal Revenue Service. 2014. IRS Employer’s Tax Guide to Fringe Benefits.
3 Commute Solutions. How Much Is Your Commute?
http://www.commutesolutions.com/commute-cost-calculator/.
4 Houston-Galveston Area Council. Commute Solutions. http://www.h-
gac.com/taq/airquality/commute-solutions.aspx.
5 Federal Highway Administration. 2012. Integrating Demand Management into the
Transportation Planning Process: A Desk Reference. U.S. Department of Transportation.
6 Kuhn, B., Gopalakrishna, D., and Schreffler, E. 2013. The Active Transportation and
Demand Management Program (ATDM): Lessons Learned. FHWA-HOP-13-018, Federal
Highway Administration, U.S. Department of Transportation.
7 Tillema, T., Dijst, M., and Schwanen, T. 2010. Decisions Concerning Communication Modes
and the Influence of Travel Time: A Situational Approach. Environment and Planning A,
42(9), 2058–2077. http://www.rug.nl/research/portal/publications/decisions-concerning-
communication-modes-and-the-influence-of-travel-time(b02ef78c-ad67-47dc-b8ff-
ed13f95368e1).html.
8 Handy, S. L., and Yantis, T. 1997. The Impacts of Telecommunications Technologies on
Nonwork Travel Behavior. Research Report UCD-ITS-RR-97-27, Institute of Transportation
Studies, University of California, Davis.
http://www.its.ucdavis.edu/research/publications/publication-detail/?pub_id=556.
9 Viswanathan, K., and Goulias, K.G. 2001. Travel Behavior Implications of Information and
Communications Technology (ICT) in the Puget Sound Region. Paper presented at the 80th
Annual Meeting of the Transportation Research Board.
10 Dugan, A. 2013. New App Rewards Drivers for Avoiding Congestion. KXAN.
September 17. http://kxan.com/2014/09/17/new-app-rewards-drivers-for-avoiding-
congestion/.
11 Federal Highway Administration. 2007. Advanced Parking Management Systems: A Cross-
Cutting Study. U.S. Department of Transportation.
12 Federal Highway Administration Office of Operations. 2014. Urban Partnership Agreements.
U.S. Department of Transportation.
http://www.ops.fhwa.dot.gov/congestionpricing/urb_partner_agree.htm.
13 San Francisco Municipal Transportation Agency. 2014. SFPark. http://sfpark.org/.

33
14 Machemehl, R., Kockelman, K., Chen, D., Bienkowski, B., Smith, L., and Zhang, Z. 2013.
Travel Demand Management Guidebook. 6-0702-P2, Center for Transportation Research.
15 Federal Highway Administration Office of Operations. 2014. High-Occupancy Toll Lanes
(Partial Facility Pricing). U.S. Department of Transportation, August 26.
http://www.ops.fhwa.dot.gov/congestionpricing/strategies/involving_tolls/hot_lanes.htm.
16 Land Transport Authority. 2014. Electronic Road Pricing. Singapore.
17 Menon, A.P. 2000. ERP in Singapore—A Perspective One Year On. Traffic Engineering and
Control, 41(2), 40–45.
18 Federal Highway Administration. 2006. Congestion Pricing: A Primer. FHWA-HOP-07-074,
U.S. Department of Transportation.
19 Borjesson, M., Eliasson, J., Hugosson, M., and Brundell-Freij, K. 2012. The Stockholm
Congestion Charges—5 Years On. Effects, Acceptability and Lessons Learnt. Transport
Policy 20.
20 Transport for London. 2007. Central London Congestion Charging: Impacts Monitoring—
5th Annual Report.
21 Florida Department of Transportation. 2014. 95 Express.
22 Federal Highway Administration. 2014. Chapter 1: Household Travel and Freight
Movement. 2013 Status of the Nation’s Highways, Bridges, and Transit. U.S. Department of
Transportation.
23 Puget Sound Regional Council. 2014. Transportation 2040 Update: Appendix T, Travel
Demand Management Action Plan 2013–2018.
24 Washington State Department of Transportation. 2008. State Route 520 High Capacity
Transit Plan.
25 PR Newswire. 2014. Carma Carpool Launches in Austin. February 27, 2014.
http://www.prnewswire.com/news-releases/carma-carpooling-launches-in-austin-
247596611.html.
26 Carma. Carma website. 2014. https://carmacarpool.com/.
27 The City of El Paso. 2014. City of El Paso Announces Citywide Ride-Sharing Program.
News release, February 27.
28 iCarpool. iCarpool website. http://www.icarpool.com.
29 Ferris, B., Watkins, K., and Borning, A. 2010. OneBusAway: Results from Providing Real-
Time Arrival Information for Public Transit. CHI 2010, April 10–15.
http://homes.cs.washington.edu/~borning/papers/ferris-chi2010-onebusaway.pdf.
30 Bridj. Bridj FAQ. http://www.bridj.com/faq.

34
31 U.S. Census Bureau. 2014. Ten U.S. Cities Now Have 1 Million People or More; California
and Texas Each Have Three of These Places, Newsroom. May 22.
http://www.census.gov/newsroom/press-releases/2015/cb15-89.html .
32 Texas Comptroller of Public Accounts. Texas in Focus: Demographics. January 2008.
http://comptroller.texas.gov/specialrpt/tif/03_Demographics.pdf
33 U.S. Census Bureau. 2014. Biking to Work Increases 60 Percent over Last Decade, Census
Bureau Reports. https://www.census.gov/newsroom/press-releases/2014/cb14-86.html.
34 Simek, C., and Geiselbrecht, T. 2014. Texas Transportation Poll, Final Report. PRC
14-16-F, Texas A&M Transportation Institute, September.
35 Council of Economic Advisors. Strengthening the Rural Economy—The Current State of
Rural America. http://www.whitehouse.gov/administration/eop/cea/factsheets-
reports/strengthening-the-rural-economy/the-current-state-of-rural-america.
36 U.S. Census Bureau. ACS 2008–2012 5-Year Estimates Commute Mode to Work, Workers 16
Years and Older.
37 Community Transportation Association of America. 2009. Profiles of Innovative Rural
Vanpool Programs.
38 U.S. PIRG. 2012. Transportation and the New Generation.
39 International Transport Forum. 2013. Demographic Trends: Youth Issues, Population Growth
and Structure, and Urbanisation. Presentation, Organisation for Economic Co-operation and
Development.
40 Nielsen. 2014. Millennials Prefer Cities to Suburbs, Subways to Driveways. Nielson
Newswire. March 4. http://www.nielsen.com/us/en/newswire/2014/millennials-prefer-cities-
to-suburbs-subways-to-driveways.html.
41 Fry, R. 2013. Young Adults after the Recession: Fewer Homes, Fewer Cars, Less Debt. Pew
Research Center.
42 Contrino, H., and McGuckin, N. 2009. Demographics Matter: Travel Demand, Options, and
Characteristics among Minority Populations. Public Works Management Policy, 13(4), 361–
368.
43 U.S. PRIG Education Fund. 2013. A New Direction Our Changing Relationship with
Driving.
44 U.S. Census Bureau. 2006. Selected Characteristics of Baby Boomers 42 to 60 Years Old in
2006.
45 McGuckin, N. Travel Trends of the Baby Boom Generation. http://travelbehavior.us/Nancy-
pdfs/Travel%20Trends%20of%20the%20Baby%20Boom%20Generation.pdf .

35
46 Mohammadian, K., Karimi, B., Pourabdollahi, Z., and Frignani, M. 2013. Modeling Seniors’
Activity-Travel Data. FHWA-ICT-13-026, University of Illinois at Chicago, August.
https://www.ideals.illinois.edu/bitstream/handle/2142/45748/FHWA-ICT-13-
026.pdf?sequence=2.
47 Pew Research Center. 2014. Older Adults and Technology Use.
48 Jimenez, G., and Mattingly, S. 2009. Travel Behavior of Largest Minority Cohorts in Texas.
Transportation Research Board of the National Academies.
49 Lopez, M.H., Gonzalez-Barrera, A., and Patten, E. 2013. Closing the Digital Divide: Latinos
and Technology Adoption. Hispanic Trends Project, March 7.
50 MacLeggan, C. 2014. Share of Foreign-Born Texans Growing. The Texas Tribune,
January 2.
51 Tal, G., and Handy, S. 2005. The Travel Behavior of Immigrants and Race/Ethnicity Groups.
University of California, Davis.
52 Federal Highway Administration. 2001. National Household Travel Survey.
53 Grieco, E.M., Acosta, Y.D., de la Cruz, G.P., Gambino, C., Gryn, T., Larsen, L.J., Edward N.
Trevelyan, and Walters, N.P. 2012. The Foreign-Born Population in the United States: 2010.
American Community Survey Reports, May. https://www.census.gov/prod/2012pubs/acs-
19.pdf.
54 City of Portland. 2006. SmartTrips Northeast Hub Comprehensive Evaluation Report.
55 Bricka, S.G. 2008. Trip Chaining: Linking the Influences and Implications. Doctoral
dissertation, The University of Texas at Austin.
56 Socialdata. 2005. Portland Interstate Large-Scale Individualized Marketing—TravelSmart
Project. City of Portland.
57 Obermann, W.R. 2012. Travel Demand Management: A Toolbox of Strategies to Reduce
Single-Occupant Vehicle Trips and Increase Alternate Mode Usage in Arizona. Final Report
654, Arizona Department of Transportation.
58 Australian Greenhouse Office. 2006. Evaluation of Australian TravelSmart Projects in the
ACT, South Australia, Queensland, Victoria, and Western Australia: 2001–2005. Department
of the Environment and Heritage.
59 Federal Highway Administration. 2009. National Household Travel Survey.
60 Nelson/Nygaard Consulting Associates, Inc. 2013. Transportation Demand Management
State of the Practice. Michigan Sustainable Communities, Smart Growth America.