
The Future of State Technology Support for Instructional Improvement Kentucky Department of...
21
The Future of State Technology Support for Instructional Improvement Kentucky Department of Education
-
Upload
gwendolyn-reeves -
Category
Documents
-
view
216 -
download
2
Transcript of The Future of State Technology Support for Instructional Improvement Kentucky Department of...

The Future of State Technology Support for
Instructional ImprovementKentucky Department of Education

The Impetus for CIITS Senate Bill 1 (2009) laid out an
aggressive plan to transform education in Kentucky – Unbridled Learning• new more rigorous standards• new assessments• assessment literacy for educators• new accountability system
Designed to better prepare students for life after high school and to compete globally
College/career-readiness for ALL

The Impetus for CIITS In 2010, Kentucky wrote what would
be the first of three Race to the Top Applications seeking funding to transform our education system by focusing on four key areas• New core academic standards with aligned
assessments• New data systems to support educators• New teacher and leader effectiveness
systems• New systems of support for the lowest
performing schools

The Impetus for CIITS The concept of CIITS in all three
applications was described by Commissioner Holliday in Kentucky’s first oral presentation of its plan to the U.S. Department of Education and later affirmed by the Teacher Effectiveness Steering Committee:
“CIITS will connect standards, electronically stored instructional resources, curriculum, formative assessments, instruction, professional learning and evaluation of teachers and principals in one place, thereby improving instructional outcomes, teacher effectiveness and leadership.”

Continuous Improvement
Achieving the Vision

What outcomes were expected?I. (B)(3) Performance Measures
Standards and Assessments
End of SY 2012-2013
End of SY 2013-2014
End of SY 2014-2015
Percentage of participating LEAs who create and publish aligned curriculum maps through the Continuous Instructional Improvement Technology System (CIITS).
25%
31%
50%
54%
75%
Percentage of teachers in participating LEAs who create and publish lesson plans through the Continuous Instructional Improvement Technology System (CIITS).
20%
41%
50%
64%
75%
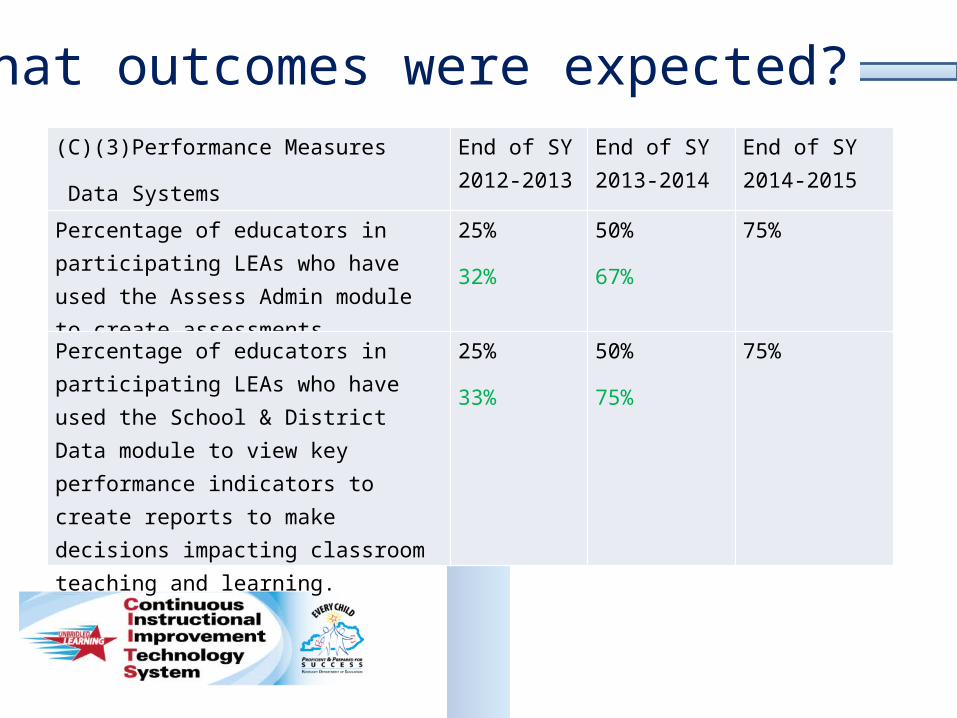
What outcomes were expected?(C)(3)Performance Measures
Data Systems
End of SY 2012-2013
End of SY 2013-2014
End of SY 2014-2015
Percentage of educators in participating LEAs who have used the Assess Admin module to create assessments
25%
32%
50%
67%
75%
Percentage of educators in participating LEAs who have used the School & District Data module to view key performance indicators to create reports to make decisions impacting classroom teaching and learning.
25%
33%
50%
75%
75%
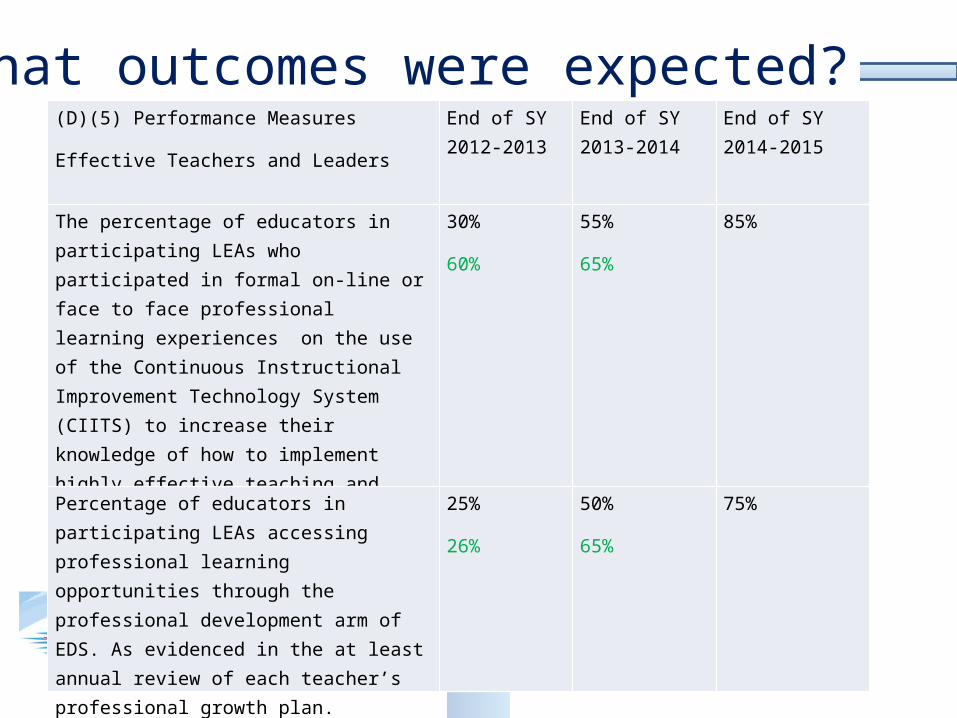
What outcomes were expected?(D)(5) Performance Measures
Effective Teachers and Leaders
End of SY 2012-2013
End of SY 2013-2014
End of SY 2014-2015
The percentage of educators in participating LEAs who participated in formal on-line or face to face professional learning experiences on the use of the Continuous Instructional Improvement Technology System (CIITS) to increase their knowledge of how to implement highly effective teaching and learning in the classroom
30%
60%
55%
65%
85%
Percentage of educators in participating LEAs accessing professional learning opportunities through the professional development arm of EDS. As evidenced in the at least annual review of each teacher’s professional growth plan.
25%
26%
50%
65%
75%

What outcomes were expected?(D)(5) Performance Measures
Effective Teachers and Leaders
End of SY 2012-2013
End of SY 2013-2014
End of SY 2014-2015
Percentage of teachers in participating LEAs who were evaluated as exemplary under the common statewide evaluation system.
<1%
N/A
<1%
N/A
10%
Percentage of teachers in participating LEAs who were evaluated as accomplished or developing under the common statewide evaluation system.
<1%
N/A
<1%
N/A
75%
Percentage of teachers in participating LEAs who were evaluated as ineffective under the common statewide evaluation system.
<1%
N/A
<1%
N/A
15%

How much has CIITS cost? FY 2011 FY 2012 FY 2013 FY 2014 FY 2015* TOTAL
CIITS 2,109,056.15
4,089,032.06
1,857,501.43
1,704,222.00
1,516,900.00
11,276,711.64
EDS 4,237,000.00
465,833.00
1,264,900.00
1,547,900.00
7,515,633.00
PD 360 4,493,811.00
4,000,000.00
4,000,000.00
12,493,811.00
ASSIST 1,000,000.00
1,000,000.00
1,000,000.00
1,000,000.00
4,000,000.00
2,109,056.15
9,326,032.06
7,817,145.43
7,969,122.00
8,064,800.00
35,286,155.64
35,286,155.64
*FY 2015 CIITS and EDS are budgeted numbers
PLEASE NOTE: Initial expenditures were paid for with a combination of one-time state and federal funds. Recurring annual expenditures are paid from several restricted funding sources, including federal administrative and indirect funding, and would not be transferable, in the event these projects ended at the state level.

CIITS –IMS By the Numbers 2014
21,700,958 Total
Successful Logins

CIITS –IMS By the Numbers 2014
43,950 Unique Teacher Logins
95% Unique Logins as a % of Teachers

CIITS –IMS By the Numbers 2014
3,574 Unique Leader Logins
98% Unique Logins as % of Leaders

CIITS –IMS By the Numbers 2014
2,271,048 Total Student Logins
3.03 Average # Logins per student

CIITS –IMS By the Numbers 2014
270, 772 Total Assessments Created527,445 Total Lesson Plans Created
98 Districts with District Curriculum Maps92,140 Instructional resources Available
Over 225 Reports Available

CIITS Milestones
• It’s recognized as best deployment of an IIS out of all the RTT states.
• All the assessment data is in one place for the first time in KY history.
• 200,000 students taking assessments each month.

EDS – By the Numbers
26-Jan-
152-Feb-
159-Feb-
1516-Feb-
1523-Feb-
15
Self Reflection
Submitted 12,003 12,035 12,037 12,057 12,061
In Progress 28,648 28,887 28,985 29,072 29,119
Total 40,651 40,922 41,022 41,129 41,180
Total Unique Users 35,454 35,524 35,564 35,605 35,631
PGPs
Pending Approval 7,137 7,085 6,857 6,848 6,738
Revisions Requested 1,324 1,321 1,297 1,266 1,275
Approved 32,365 32,655 33,064 33,224 33,371
Total 40,826 41,061 41,218 41,338 41,384

EDS – By the NumbersStudent Growth Goals 26-Jan- 15 2-Feb-15 9-Feb-15 16-Feb-15 23-Feb-15In Progress 20,536 20,232 20,153 20,075 20,060
Draft 7,881 8,029 7,856 7,939 7,826
Approved 21,064 21,538 21,910 22,071 22,228
Completed 29 23 54 75 96
Total 49,510 49,822 49,973 50,160 50,210
Total Unique Users 42,983 43,112 43,189 43,270 43,295
Observations
In Progress 6,515 8,041 8,776 9,117 9,065
Draft 5,260 5,847 6,337 6,745 7,053
Complete 24,345 26,191 28,052 29,744 30,438
Total 36,120 40,079 43,165 45,606 46,556
Total Unique Users 21,534 22,498 23,509 24,473 24,790

ASSIST – Challenges
Stakeholders tell us that ASSIST:• Is not always user friendly.• CSIPs/CDIPs are too cumbersome because you can’t
print just your “plan” (Executive summary, title page, etc…)
• Consolidated Monitoring ---requires districts to upload too much information into ASSIST before the review
• Superintendents frustrated about having to upload SPGES assurances in ASSIST

“Will we still have to?”If KDE decides to abandon CIITS, it doesn’t mean abandoning legal requirements: PGES – All the requirements of 704 KAR
3:370 will still have to be met CSIP/CDIP – Each school and district must
complete a CSIP or CDIP per 703 KAR 5:225 KCAS – The Kentucky Core Academic
Standards (704 KAR 3:303) are still in place and expectations of teaching and assessing those standards in each classroom is still an expectation

The Decision
Should KDE continue to provide a statewide solution for continuous improvement (CIITS, EDS, ASSIST, PD360)?
ORShould KDE abandon the statewide solution and allow districts to pursue local options?