THE FUTURE OF SHIPPING - Breaking Waves 2019 · THE FUTURE OF SHIPPING 4. GROWTH 3. Marke ting 2....
34
THE FUTURE OF SHIPPING Martin Stopford Non-Exec President, Clarkson Research Breaking waves 2018, Helsinki 3-4- December 2018
Transcript of THE FUTURE OF SHIPPING - Breaking Waves 2019 · THE FUTURE OF SHIPPING 4. GROWTH 3. Marke ting 2....

THE FUTURE OF SHIPPING
Martin Stopford
Non-Exec President, Clarkson Research
Breaking waves 2018, Helsinki 3-4- December 2018

20/12/2018 Martin Stopford – SMI 22 November 20th 2018 2
1. Four “re-alignments” in maritime business
2. Meeting IMO emissions targets 2050
3. Spec out shipping’s long term business strategy
4. Make ships work better
5. Make sea transport systems work better.
6. Develop people & organizations to manage all this
THE FUTURE OF SHIPPING
4.
GROWTH
3. Marke
ting
2. Produc
t development
1.
idea

20/12/2018 Martin Stopford – SMI 22 November 20th 2018 3
1. FOUR RE-ALIGNMENTS IN MARITIME BUSINESS
20/12/2018 Martin Stopford – SMI 22 November 20th 2018 4
A. Trade trend re-alignment – is 3.2% growth trend sustainable?
0
5 000
10 000
15 000
20 000
25 000
30 000
35 000
40 000
19
65
19
70
19
75
19
80
19
85
19
90
19
95
20
00
20
05
20
10
20
15
20
20
20
25
20
30
20
35
20
40
20
45
20
50
Imp
ort
s –
mill
ion
to
nn
es
Sea Trade grew at 3.2% between 1965 and 2018
If the trend continues it will be over 30 billion tonnes in 2050.
Dr Martin Stopford, President, Clarkson Research
Source: data collected by martin stopford from various sources, mainly United Nations and UNCTAD
Is this trend sustainable?

20/12/2018 Martin Stopford – SMI 22 November 20th 2018 5
20%
30%
40%
50%
60%
70%
80%
1950 1955 1960 1965 1970 1975 1980 1985 1990 1995 2000 2005 2010
Shows the of OECD & Non-OECD Imports as a % of world seaborne imports
1965: OECD 67% imports
Today Non-OECD is 67% imports –
new cargo matrix
B. Regional re-alignment – big change in control of sea imports
Source: United Nations, UNCTAD, compilation by Martin Stopford
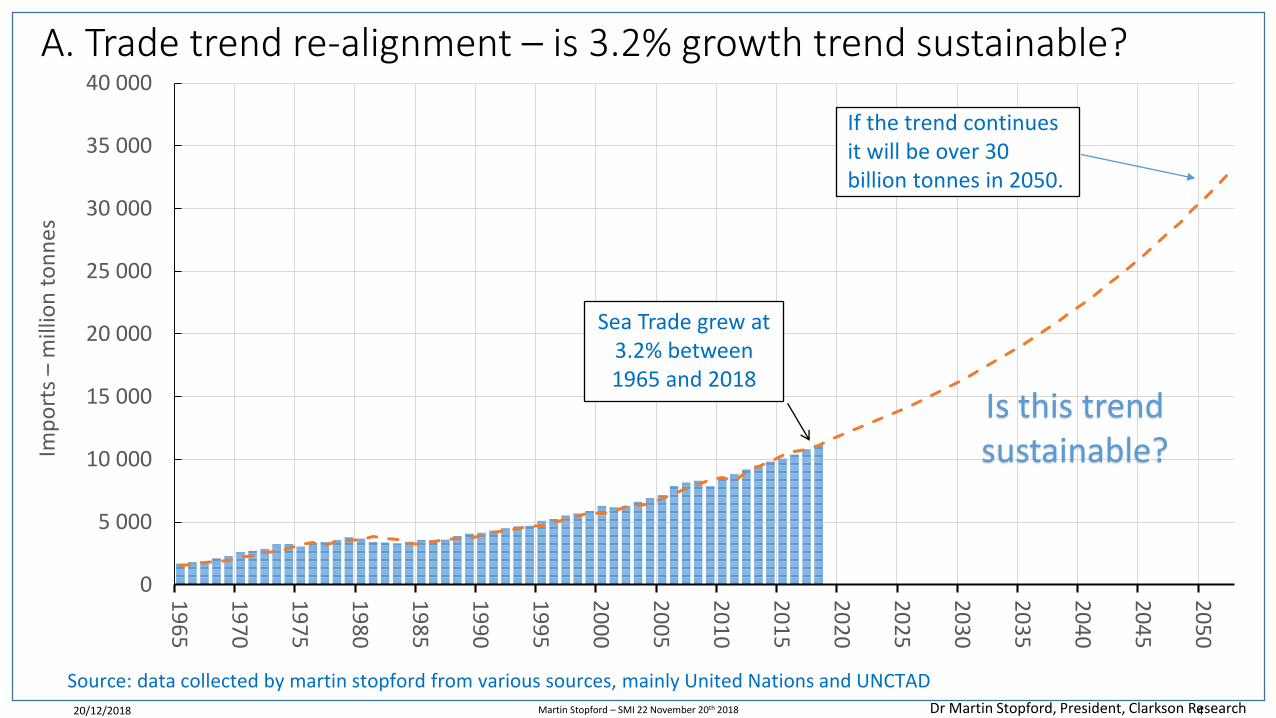
C. Country re-alignment – who will grow and who might decline?
0,0 2,0 4,0 6,0 8,0 10,0 12,0
Japan
Europe
N. America
China
Other Asia
World 2015
6,42
1,47
1,006
1,65
3,55
1,39
Martin Stopford, September 2018
Average 3.5 tonnes/capita1 billion OECD import 3.5
billion tonnes of cargo
Other Asia 1.0 tonne/capita3 billion population, import 3 bill tonnes cargo
Tonnes imports per capita in 2015
China1.3 billion population, imports 2 bill tonnes cargo

5 0
98
4 0
62
4 1
71
3 3
37
4 2
01
4 7
96
5 2
86
4 7
92
3 3
81
4 6
70
6 9
22
5 8
72
6 6
84
7 6
43
7 7
63
11
69
9
14
65
2
17
25
3
23
59
5
17
69
1
22
41
1
31
00
0
31
95
0
29
70
0 26
65
0
13
25
0
10
65
0
15
25
0
18
30
0
0
5 000
10 000
15 000
20 000
25 000
30 000
35 000
40 000
19
90
19
91
19
92
19
93
19
94
19
95
19
96
19
97
19
98
19
99
20
00
20
01
20
02
20
03
20
04
20
05
20
06
20
07
20
08
20
09
20
10
20
11
20
12
20
13
20
14
20
15
20
16
20
17
20
18
$0
00
PER
DA
Y B
un
ker
cost
$ T
C r
ate
Aframax 1 year timecharter rate
in $/day
Based on Aframax tanker, 1 year TC rate and bunker cost at 50 TPD, 14.5 KTS, Rotterdam 380cst
In 2004 the daily cost of an Aframax tanker
was 4X cost of bunkers
NOW BUNKERS
COST MORE THAN SHIP
D. Factor price re-alignment – fuel now costs more than the ship
Bunker cost in $/day

Conclusion: OECD Europe’s share of global trade
and its influence on the way the industry uses ships is already slipping.
What preparations needed?
20/12/2018 Martin Stopford – SMI 22 November 20th 2018 9
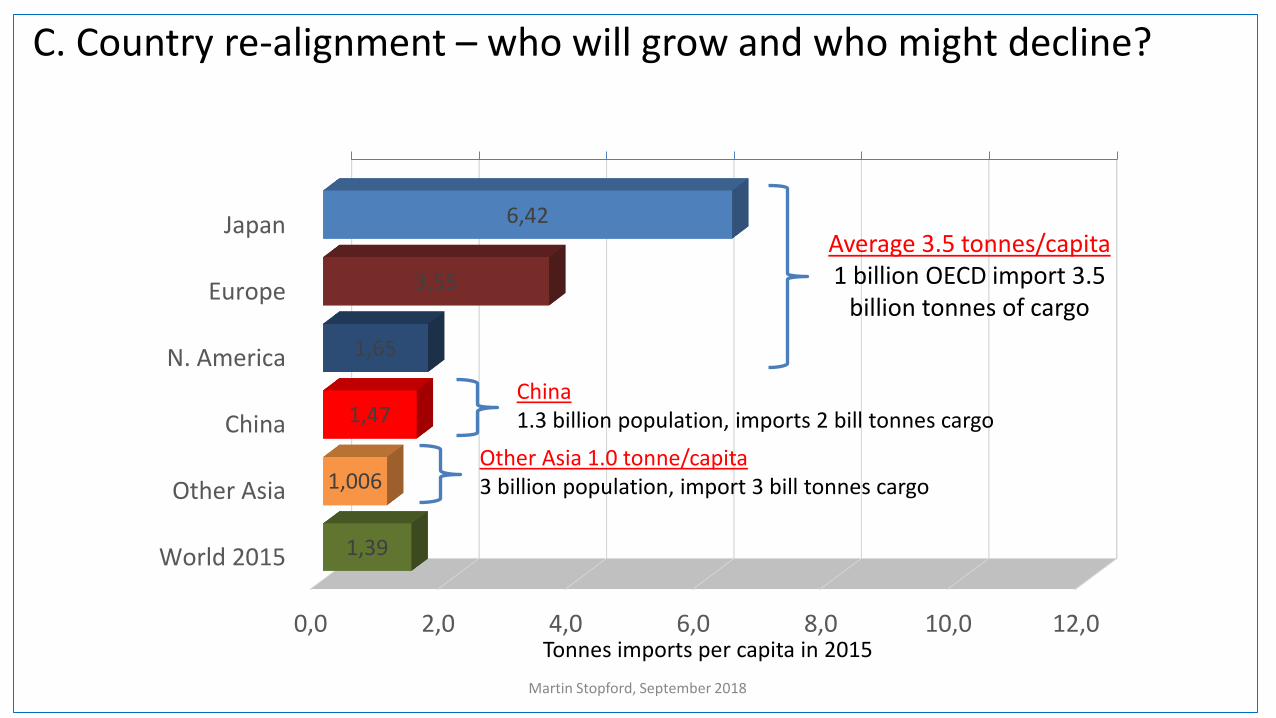
2: MEETING IMO EMISSIONS TARGETS IN 2050
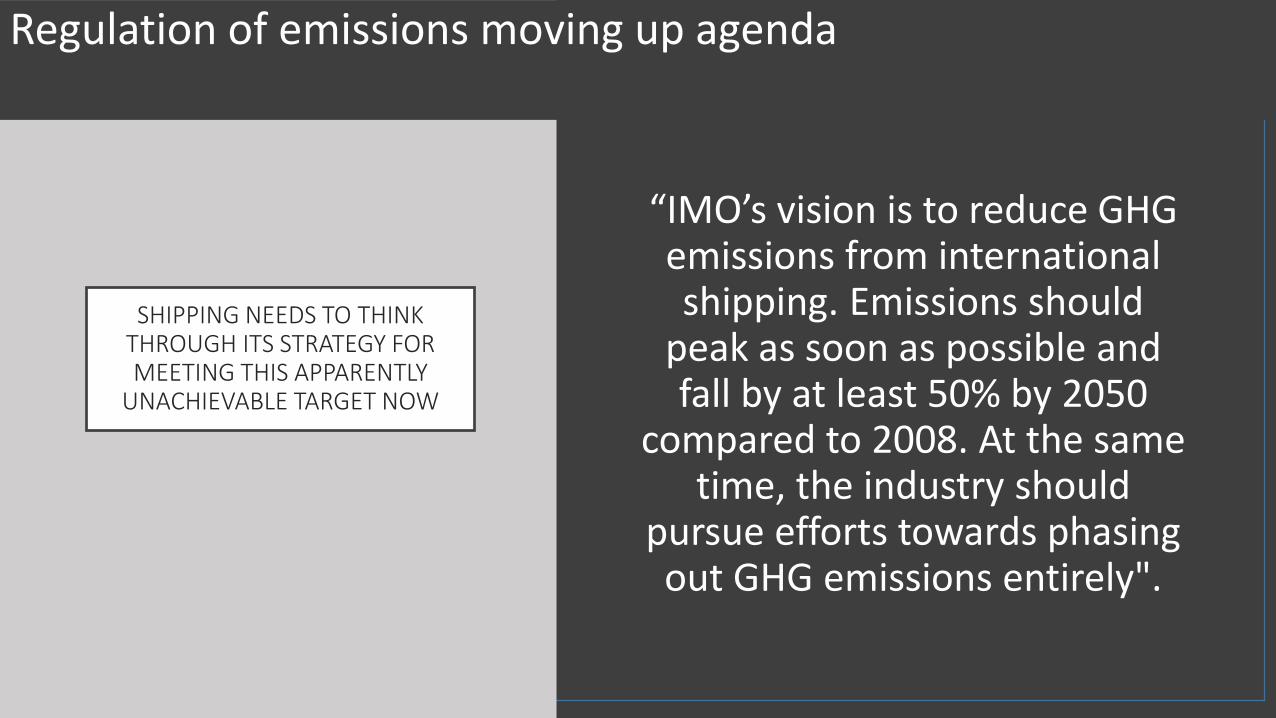
SHIPPING NEEDS TO THINK THROUGH ITS STRATEGY FOR MEETING THIS APPARENTLY
UNACHIEVABLE TARGET NOW
“IMO’s vision is to reduce GHG emissions from international shipping. Emissions should
peak as soon as possible and fall by at least 50% by 2050
compared to 2008. At the same time, the industry should
pursue efforts towards phasing out GHG emissions entirely".
Regulation of emissions moving up agenda
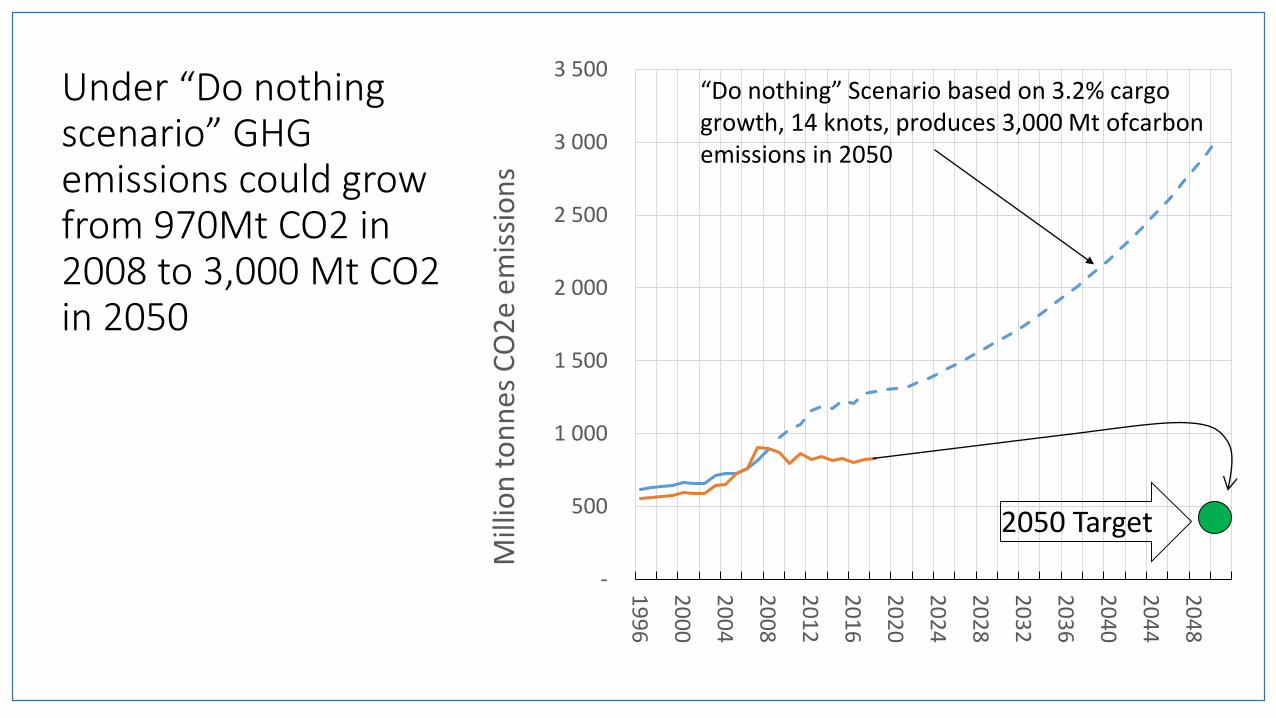
Under “Do nothing scenario” GHG emissions could grow from 970Mt CO2 in 2008 to 3,000 Mt CO2 in 2050
-
500
1 000
1 500
2 000
2 500
3 000
3 500
19
96
20
00
20
04
20
08
20
12
20
16
20
20
20
24
20
28
20
32
20
36
20
40
20
44
20
48
Mill
ion
to
nn
es C
O2
e em
issi
on
s
“Do nothing” Scenario based on 3.2% cargo growth, 14 knots, produces 3,000 Mt ofcarbonemissions in 2050
2050 Target

20/12/2018 Martin Stopford – SMI 22 November 20th 2018 13
Four ways to CO2 emissions in 2050 from 3,000 Mt to 470 Mt
• Step 1: Transport less cargo by changing trading patterns, transport policies, pricing and better information systems (38% saving)
• Step 2: Cut carbon emissions/ship km by slowing down to 10.1 knots; using bigger “small” ships; designs; retrofitting for safe operation at slow speeds etc (40% saving)
• Step 3: Develop zero carbon propulsion systems. Electric fuel cells look the best bet for volume and performance (8.5% saving)
• Step 4: Finally make solutions 1-4 effective by a complete re-think of the industry’s organization and personnel structures

20/12/2018 Martin Stopford – SMI 22 November 20th 2018 14
CO2 Emissions by the world cargo fleet -5 ways to cut them
-
500
1 000
1 500
2 000
2 500
3 000
3 500
19
96
19
98
20
00
20
02
20
04
20
06
20
08
20
10
20
12
20
14
20
16
20
18
20
20
20
22
20
24
20
26
20
28
20
30
20
32
20
34
20
36
20
38
20
40
20
42
20
44
20
46
20
48
20
50
Mill
ion
to
nn
es
CO
2e
emis
sio
ns
2050 IMO target 470 Mt CO2e
4. 10.1 knots, 2.2% pa cargo
2.Double ship size
from 32,000 dwt to
70,000 dwt
Key conclusion…“We must start actively planning for ships to go much slower in future. And introduce hydrogen (e.g. powering fuel cells or internal combustion engines), as soon as possible to finish the job”

20/12/2018 Martin Stopford – SMI 22 November 20th 2018 15
3. SHAPING SHIPPING’S 2050 STRATEGY
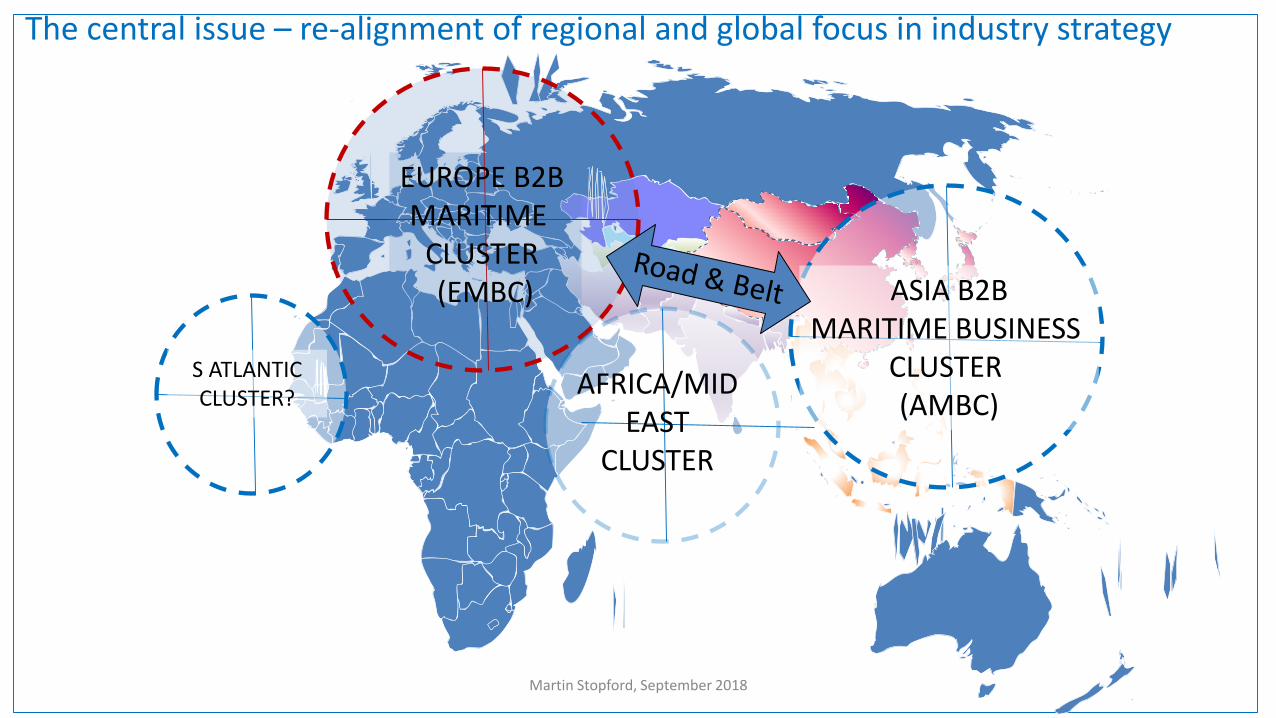
Martin Stopford, September 2018
The central issue – re-alignment of regional and global focus in industry strategy
EUROPE B2B MARITIME
CLUSTER (EMBC) ASIA B2B
MARITIME BUSINESS CLUSTER (AMBC)
AFRICA/MID EAST
CLUSTER
S ATLANTIC CLUSTER?
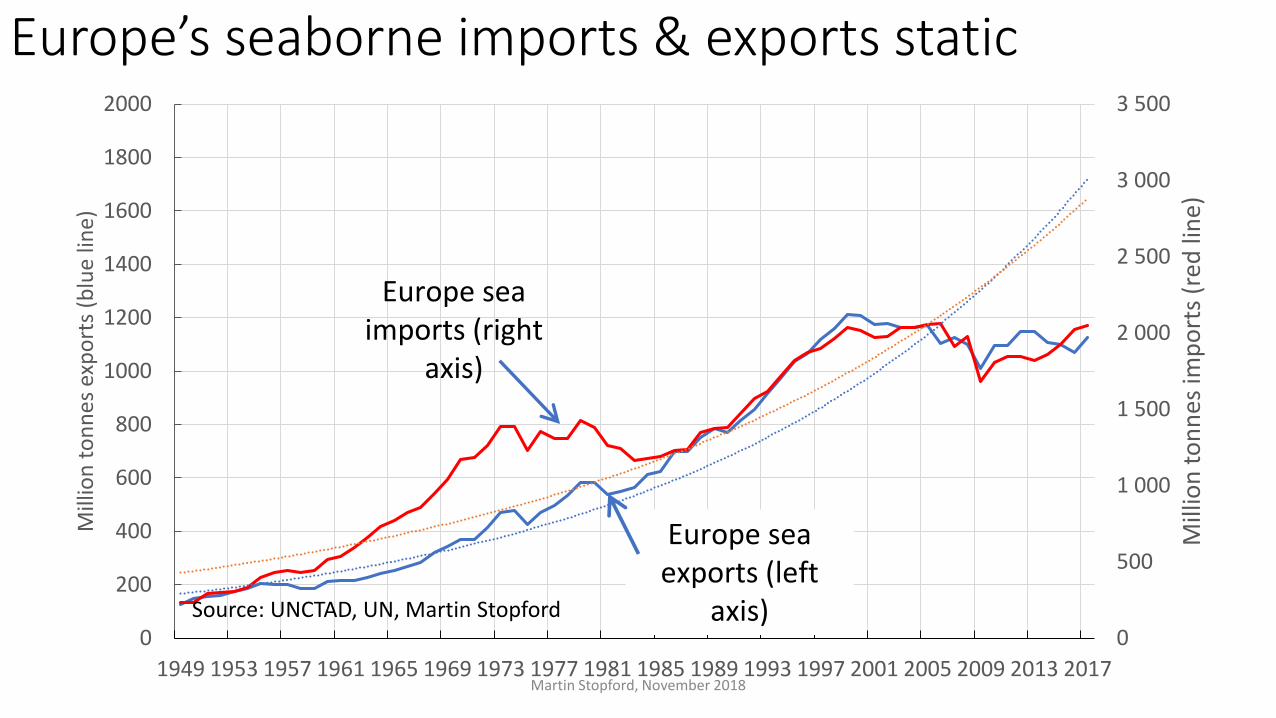
Europe’s seaborne imports & exports static
0
500
1 000
1 500
2 000
2 500
3 000
3 500
0
200
400
600
800
1000
1200
1400
1600
1800
2000
1949 1953 1957 1961 1965 1969 1973 1977 1981 1985 1989 1993 1997 2001 2005 2009 2013 2017
Mill
ion
to
nn
es im
po
rts
(red
lin
e)
Mill
ion
to
nn
es
exp
ort
s (b
lue
lin
e)
Europe sea imports (right
axis)
Europe sea exports (left
axis)
Martin Stopford, November 2018
Source: UNCTAD, UN, Martin Stopford
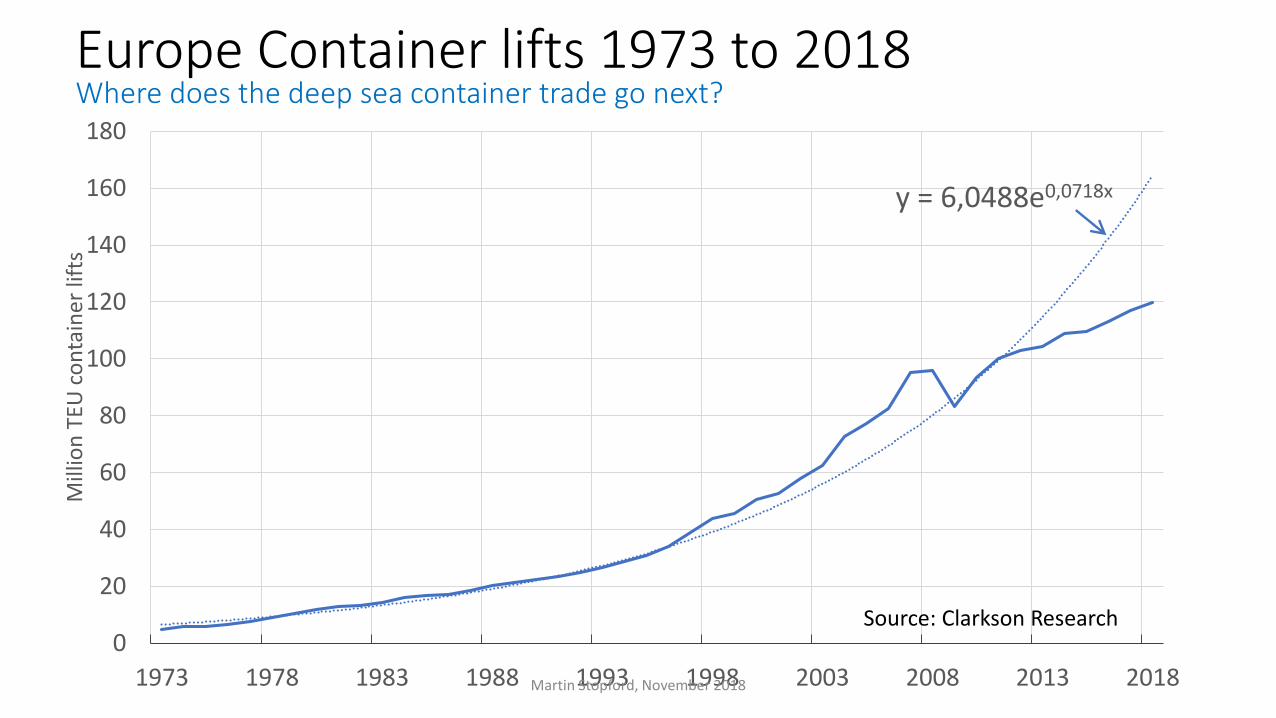
Europe Container lifts 1973 to 2018
y = 6,0488e0,0718x
0
20
40
60
80
100
120
140
160
180
1973 1978 1983 1988 1993 1998 2003 2008 2013 2018
Mill
ion
TEU
co
nta
iner
lift
sWhere does the deep sea container trade go next?
Martin Stopford, November 2018
Source: Clarkson Research
20/12/2018 Martin Stopford – SMI 22 November 20th 2018 20
PART 4: MAKING
SHIPS WORK BETTER BY
2050
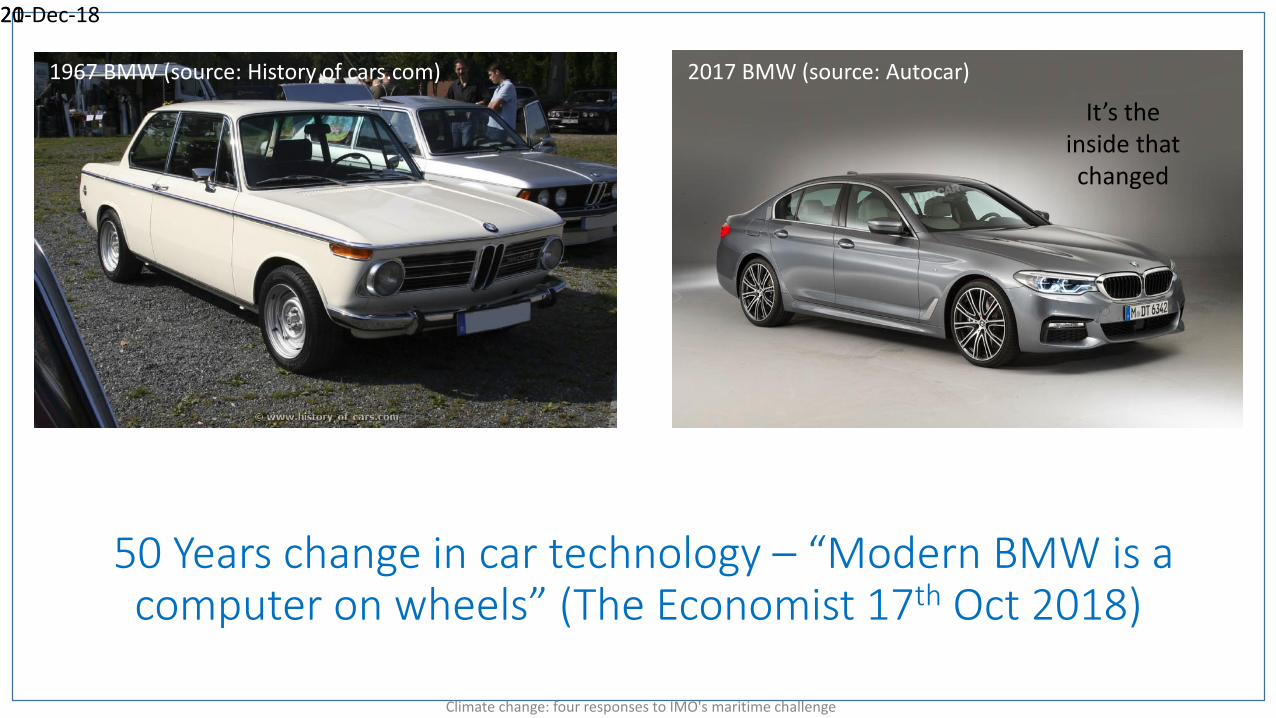
50 Years change in car technology – “Modern BMW is a computer on wheels” (The Economist 17th Oct 2018)
Climate change: four responses to IMO's maritime challenge
1967 BMW (source: History of cars.com) 2017 BMW (source: Autocar)
It’s the inside that changed
20-Dec-1821
20/12/2018 Martin Stopford – SMI 22 November 20th 2018 22
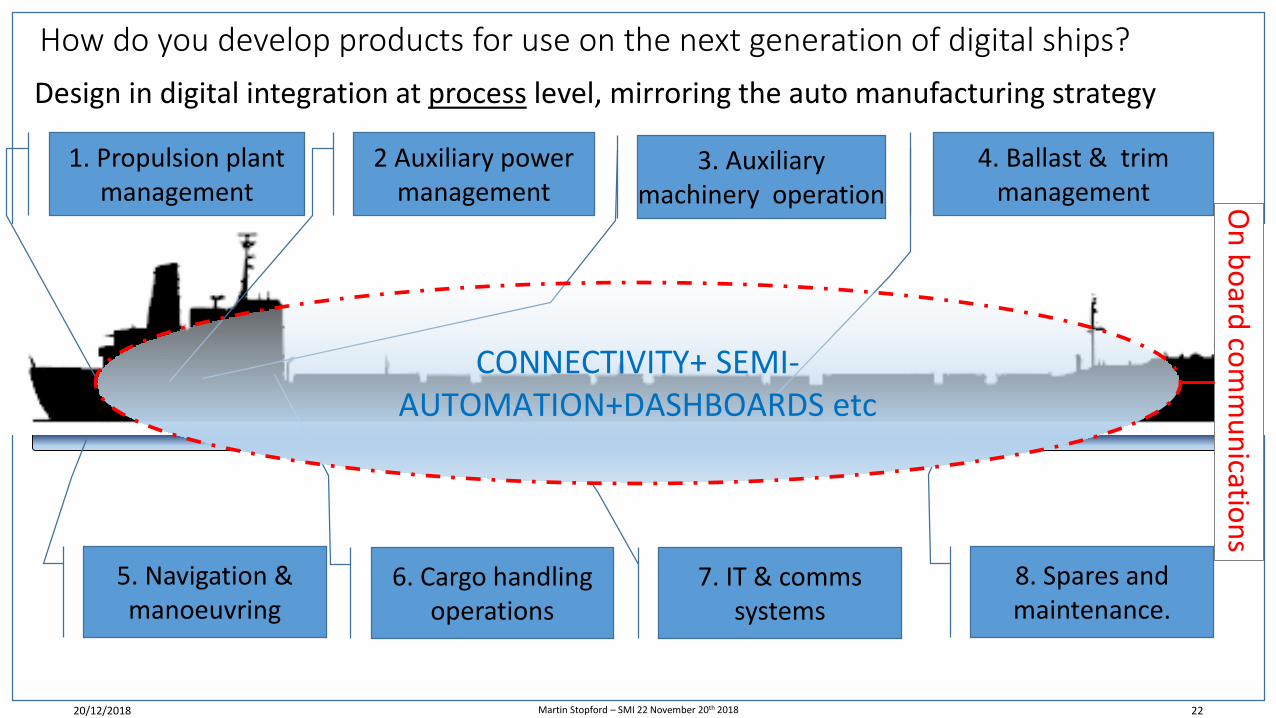
How do you develop products for use on the next generation of digital ships?
5. Navigation & manoeuvring
1. Propulsion plant management
2 Auxiliary power management
3. Auxiliary machinery operation
4. Ballast & trim management
6. Cargo handling operations
7. IT & comms systems
8. Spares and maintenance.
Design in digital integration at process level, mirroring the auto manufacturing strategy
CONNECTIVITY+ SEMI-AUTOMATION+DASHBOARDS etc
On
bo
ard co
mm
un
ication
s

Example 1: Seamless - voyage management systems
Shipping office voyage analysis team
Fleet management dashboardFleet liaison managerShip managers
Terminal management dashboard
Terminal scheduling team
Martin Stopford, November 2018
Voyage monitoring and weather planning systemData exchange to & from ships

Example 2: Improved -mooring systems
• Hawser mooring is dangerous and labour intensive
• For example officer on Zara (top left) suffered severe head injuries when he was struck by a parted HMPE mooring rope
• Big ships needs to carry five or six people to manage the mooring
• Dynamic magnetic and suction cup systems are in operation for bunkering and mooring deep sea vessels.
Moormaster 400 units, each have two
suction cup panels of twenty tons power.
Combined whole system delivers a
mooring force of 160 tons. Martin Stopford, November 2018

Example 3: autonomous cargo handling - 25,600 dwt LNG self-discharging bulk carrier
• Haaga and Viikki are first bulkers with autonomous self-discharging cranes. This function should be operative in the next few months.
• Using sensor technology, cameras and laser scanners, the cranes analysethe topography of each cargo hold and determine the optimal lifting points.
• An 'intelligent' self-learning algorithm ensures the bucket is not overloaded and compensates for heeling to ensure even unloading. The algorithm also calculates which shoreside hopper to discharge into.
• Some of the technology, such as the grab’s learning capability, will be adapted for use with other systems such as small container ships
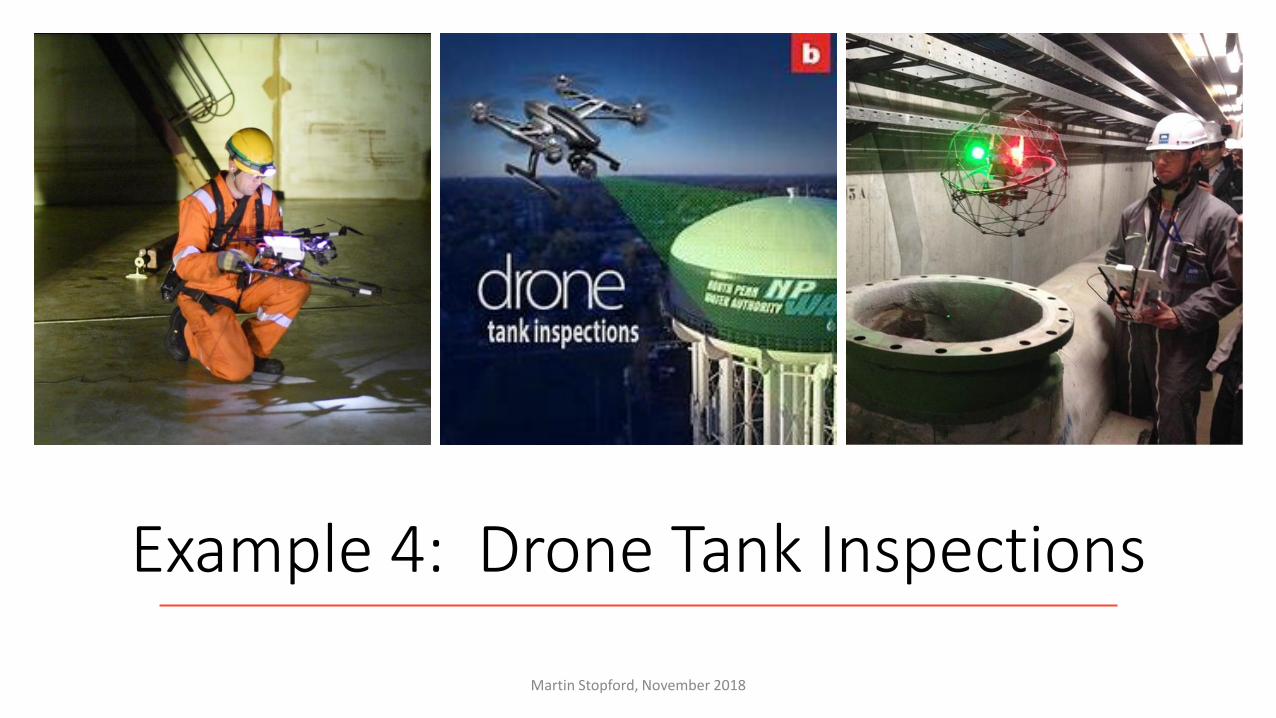
Example 4: Drone Tank Inspections
Martin Stopford, November 2018
20/12/2018 Martin Stopford – SMI 22 November 20th 2018 27
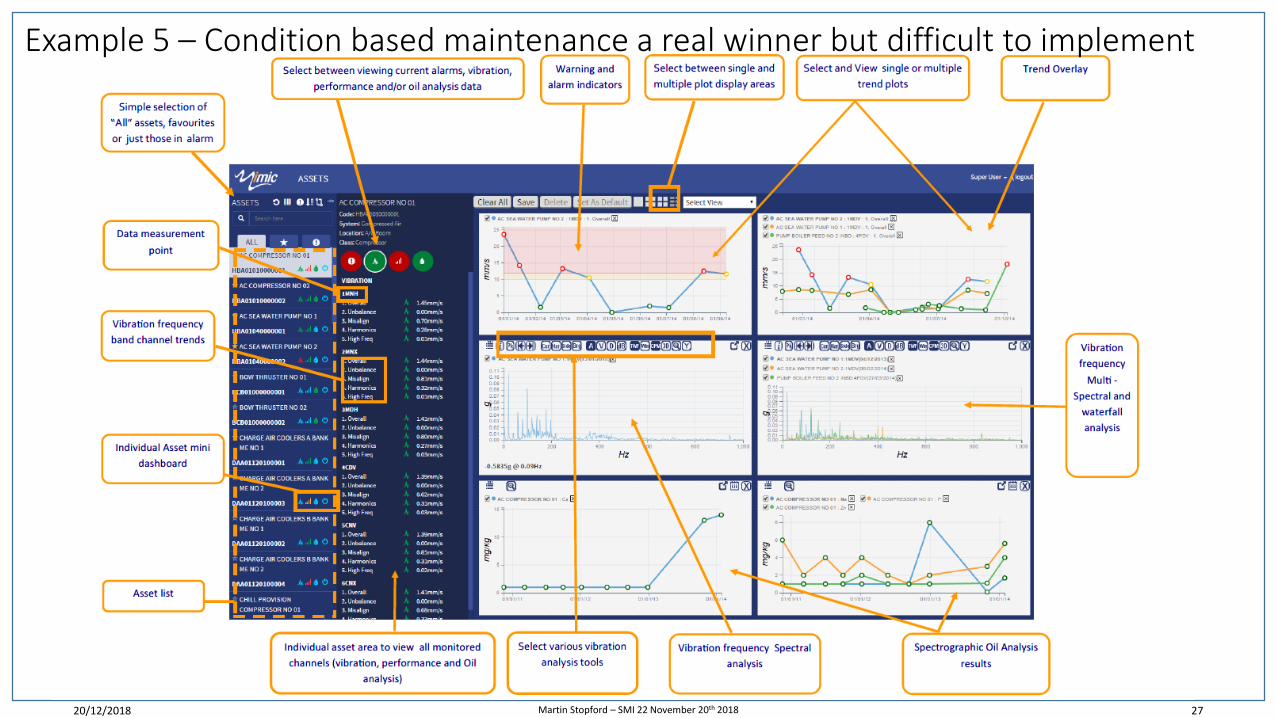
Example 5 – Condition based maintenance a real winner but difficult to implement
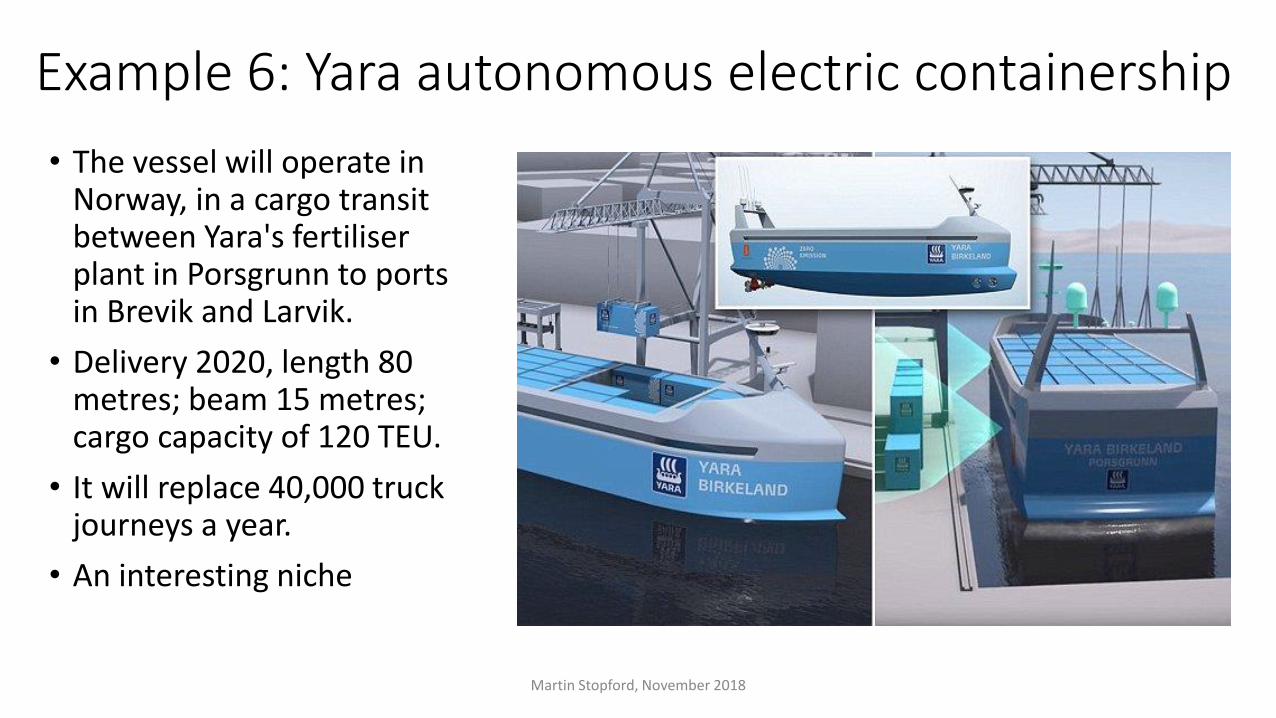
Example 6: Yara autonomous electric containership
• The vessel will operate in Norway, in a cargo transit between Yara's fertiliser plant in Porsgrunn to ports in Brevik and Larvik.
• Delivery 2020, length 80 metres; beam 15 metres; cargo capacity of 120 TEU.
• It will replace 40,000 truck journeys a year.
• An interesting niche
• es
Martin Stopford, November 2018

20/12/2018 Martin Stopford – SMI 22 November 20th 2018 29
PART 5: MAKING SEA
TRANSPORT SYSTEMS WORK BETTER BY 2050

The Fleet: manage the fleet of ships as an I4 “Transport Factory”
Martin Stopford, September 2018
Source: Martin Stopford 2016
DATA READY SHIPS
1. Navigation 2. Operations3. Comms.
Core systems
1. SHIP TEAMS
ship servers managing data, apps & comms
6. SHIPBUILDERS & EQUIPMENT
SUPPLIERS
5.CUSTOMERS WITH CARGO SYSTEMS
7. PORTS & THROUGH
TRANSPORT
Warehouse(on cloud?)
Company Systems:-1. Process management2. STQ monitoring3. Messaging system4. Intranet & dashboards5. Fleet maintenance6. LPWAN & APIs
3. SYSTEM
S. TEAM
S
1. Support systems2. Process data3. Automation4. Build apps5. Manage stats
1. Technical support 2. Maintenance systems3. Regulatory reports4. Fleet performance5. Personnel management
4. TEC
HN
ICA
L TEAM
S
2. SH
OR
E TEAM
S
Fleet managementBut… how do you link all these
systems together?

PART 6:HELPING PEOPLE WORK BETTER BY
2050
20-Dec-18 Climate change: four responses to IMO's maritime challenge
32
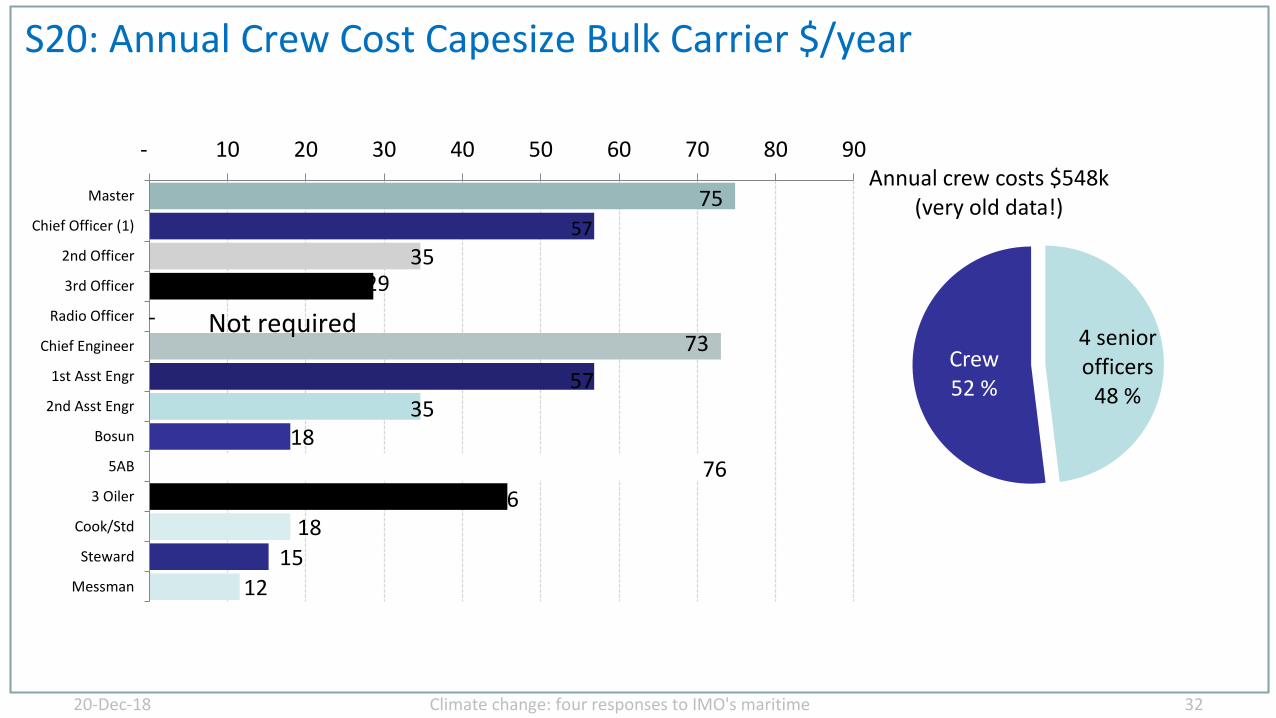
S20: Annual Crew Cost Capesize Bulk Carrier $/year
75
-
57
35 29
73
57 35
18
76
46 18
15
12
- 10 20 30 40 50 60 70 80 90
Master
Chief Officer (1)
2nd Officer
3rd Officer
Radio Officer
Chief Engineer
1st Asst Engr
2nd Asst Engr
Bosun
5AB
3 Oiler
Cook/Std
Steward
Messman
4 senior officers
48 %
Crew52 %
Annual crew costs $548k(very old data!)
Not required

Manage the fleet as a Transport Factory (teamwork across group & with others)
DATA READY SHIPS
6. SHIPBUILDERS & EQUIPMENT
SUPPLIERS
5.CUSTOMERS WITH CARGO SYSTEMS
7. PORTS & THROUGH
TRANSPORT
TRA
NSP
OR
T FA
CTO
RY
Warehouse(on cloud?)
Company Systems:-1. Process management2. STQ monitoring3. Messaging system4. Intranet & dashboards5. Fleet maintenance6. LPWAN & APIs
3. SYSTEM
S. TEAM
S 2
. SHO
RE TEA
MS
Fleet management
Performance measurement is key!!
4. TEC
HN
ICA
L TEAM
S
1. Technical support 2. Maintenance systems3. Regulatory reports4. Fleet performance5. Personnel management
1. Support systems2. Process data3. Automation4. Build apps5. Manage stats
1. Navigation 2. Operations3. Comms.
Core systems
1. SHIP TEAMS
ship servers managing data, apps & comms
Better balanced personnel system? Spot the difference!

Climate change: four responses to IMO's maritime challenge
Conclusions1. The maritime trade role of the OECD Europe is slipping.
2. B2B maritime logistics and GHG reduction are super strategic goals – we can excel in both, so lets go for it!!
3. We need smart trade management to ensure trade adds value in commercial & carbon terms.
4. Also increase ship size, focussing on the smaller end.
5. ASAP cut GHG emissions with a new generation of ships optimised for e.g. 10 knots and low carbon.
6. Replace diesel engines with hydrogen power (e.g. fuel cells/plasma) from the mid-20s onwards.
7. Massively improve performance measurement
8. Re-think of organisation structures for smart management, teamwork and more balanced workforce
20-Dec-18 34
The trick is to decide where you
want to go, get your head down,
and GO
20/12/2018 Martin Stopford – SMI 22 November 20th 2018 35
THE END

20/12/2018 Martin Stopford – SMI 22 November 20th 2018 36
“The statistical, graphical information contained in this paper are drawn from the Clarkson Research Services Limited ("CRSL") database and other sources. CRSL advises that: (i) some information in CRSL's database is derived from estimates or subjective judgments; and (ii) the information in the databases of other maritime data collection agencies may differ from the information in CRSL's database; and (iii) whilst CRSL has taken reasonable care in the compilation of the statistical and graphical information and believes it to be accurate and correct, data compilation is subject to limited audit and validation procedures and may accordingly contain errors; and (iv) CRSL, its agents, officers and employees do not accept liability for any loss suffered in consequence of reliance on such information or in any other manner; and (v) the provision of such information does not obviate any need to make appropriate further enquiries; (vi) the provision of such information is not an endorsement of any commercial policies and/or any conclusions by CRSL; and (vii) shipping is a variable and cyclical business and anyone who thinks they can forecast it needs their head examining. Where views are expressed they are in the context of this general presentation and should not be used or relied on in any other context without appropriate investigation, validation and the written permission of the author
Disclaimer


![Deterroinin ftxed and operat n costs o£ ]o in £qu pment](https://static.fdocuments.in/doc/165x107/615a0afcc0db1800ce0a4f58/deterroinin-ftxed-and-operat-n-costs-o-o-in-qu-pment.jpg)