
The Future of Science, Technology and Innovation...
25
Paper to be presented at the SPRU 40th Anniversary Conference, The Future of Science, Technology and Innovation Policy SPRU, University of Sussex, September 11 - 13, 2006 Innovation studies an emerging discipline (or what)? A study of the global network of innovation scholars Jan Fagerberg & Bart Verspagen TIK, University of Oslo, Norway [email protected] Abstract Although innovation is not a new topic for scholarly research, the academic literature on innovation was, for a long time, not very voluminous. However, more recently innovation has become a major focus among scholars of different backgrounds, and this change is also reflected in an increasing number of academic publications in this area. In parallel with this we have seen the emergence of a number of new journals and professional associations devoted to the subject. The research reported in this paper is motivated by these trends. We wish to find an answer to the question to what extent it now exists a unified community of innovation scholars that identify themselves with innovation studies as a field rather than particular sub-fields within other, more traditional disciplines. Moreover, we want to explore the factors (sources of inspiration, academic leadership, professional societies, publishing outlets etc.) that bind scholars together or alternatively continue to keep them divided. The research reported in this paper is based on a web-survey carried out in during 2004 and 2005. The results suggest that a global innovation studies community exists as a collection of a large number of relatively small groups (characterized dense internal relationships) defined along geographical and disciplinary lines. Although the field has spread over many countries and disciplines, it is particularly developed in Europe and among scholars with a background in economics. These smaller groups, however, are embedded in larger transnational groups or clusters that are kept together by what is commonly referred to as weak ties. Leading scholars, professional associations and journals all play an important role in keeping these larger groups together (as well as distinguishing them from each other). A few keywords: Innovation, Networks JEL code: O10
Transcript of The Future of Science, Technology and Innovation...

Paper to be presented at the SPRU 40th Anniversary Conference,
The Future of Science, Technology and Innovation Policy
SPRU, University of Sussex, September 11 - 13, 2006
Innovation studies � an emerging discipline (or what)? A study of the global network of innovation scholars
Jan Fagerberg & Bart Verspagen TIK, University of Oslo, Norway
Abstract
Although innovation is not a new topic for scholarly research, the academic literature on innovation was, for a long time, not very voluminous. However, more recently innovation has become a major focus among scholars of different backgrounds, and this change is also reflected in an increasing number of academic publications in this area. In parallel with this we have seen the emergence of a number of new journals and professional associations devoted to the subject. The research reported in this paper is motivated by these trends. We wish to find an answer to the question to what extent it now exists a unified community of innovation scholars that identify themselves with innovation studies as a field rather than particular sub-fields within other, more traditional disciplines. Moreover, we want to explore the factors (sources of inspiration, academic leadership, professional societies, publishing outlets etc.) that bind scholars together or � alternatively � continue to keep them divided. The research reported in this paper is based on a web-survey carried out in during 2004 and 2005. The results suggest that a global innovation studies community exists as a collection of a large number of relatively small groups (characterized dense internal relationships) defined along geographical and disciplinary lines. Although the field has spread over many countries and disciplines, it is particularly developed in Europe and among scholars with a background in economics. These smaller groups, however, are embedded in larger transnational groups or clusters that are kept together by what is commonly referred to as �weak ties�. Leading scholars, professional associations and journals all play an important role in keeping these larger groups together (as well as distinguishing them from each other).
A few keywords: Innovation, Networks
JEL � code: O10

1
Introduction1 �Innovation� is one of those catch words that suddenly seems to be on everybody lips. Glossy magazines, posters, newspapers, the concept seems to be everywhere. But there is more to it than a sudden hype. Among scholars within various disciplines, innovation has increasingly been recognized as an important social phenomenon worthy of serious study. But despite the pioneering work of the Austrian-American innovation-theorist Joseph Schumpeter during the first part of the previous century, there was very little scholarly work on the subject before the 1960s. Since then scholarly work on innovation has soared, though, with particularly rapid growth during the last ten years or so (Fagerberg 2004).2 Many new departments or centres focusing on innovation studies have been founded and several new journals and professional associations wholly or partly devoted to innovation research have emerged. The topic we wish to address in this paper is how these recent developments are to be understood. Are we witnessing the development of a new scientific field within the social sciences, with its own social organisation, institutions, standards etc., something that perhaps in the course of time may develop into a new discipline? Studies of the social organisation of science have demonstrated that scientists in rapidly changing fields tend to work together in relatively small groups, characterized by dense internal interaction and coordination (Grifith and Mullins 1972). Previous research using bibliographic data has in particular emphasized the crucial role commonly played by small number of highly productive researchers in such dynamics (Crane 1969, 1972, see Chubin 1983 for an overview). However, as pointed out by Soderqvist and Silverstein (1993), relying solely on bibliographic evidence may lead the researcher to underestimate the important role that institutions and organisations, such as for instance scientific associations and meetings, may play for the development of such fields, as well as the role played by other types of links not reflected in publications. To be able to allow for the inclusion of such factors into the analysis we have chosen to base the analysis presented in this paper on a (web-based) survey among innovation scholars worldwide. Particular emphasis was placed on mapping the diverse links that exist between these scholars, the sources of inspiration for their scholarly work, their participation in conferences and meetings and their views on what the most important publishing outlets are.
The next section presents the survey. Then, in the third section, we use a methodology based on social network analysis (Newman and Girvan 2004) to identify a set of closely knit groups of interacting scholars within the broader network of innovation scholars covered by the analysis. This division of the network into smaller groups is based on what is commonly called �strong links� (Granovetter 1973), e.g., links to people with whom the respondents regularly interact (or work). Having demonstrated that such close relationships to colleagues (as co-workers or co-authors) or PhD students (supervision) tend to support the formation of smaller, dense groups of interacting scholars, we then, in the fourth section, turn our attention to the question of what binds these smaller groups together (if at all) into broader intellectual communities. Providing effective coordination across geographical and disciplinary boundaries is a daunting task, and it is made all the more difficult by the lack of institutions and organisations of the type that characterize established academic disciplines (Cummings and Kiesler 2005). But could it be that effective coordination mechanisms have nevertheless evolved (despite geographical and disciplinary fragmentation)? Three possible ways through
1 We thank Håkon Normann and Ovar Andreas Johansson for excellent research assistance, Tommy Clausen for help in data collection and management and Diana Crane and Torben Hviid Nielsen for good advice. Responsibility for the views expressed and remaining errors and omissions is with the authors only. 2 For an overview of scholarly work in this area see Fagerberg, Mowery and Nelson (2004).

2
which this might occur are through common sources of inspiration (leading academic scholars), participation in professional associations/conferences and use of particular scientific publishing outlets (focusing especially on this area). We use cluster-analysis to explore the extent to which these factors contribute to embed the many smaller groups that exits in this area into one or more broader intellectual communities (spanning different disciplines and geographical locations).
The sample The web-based survey was carried out January 2004 and July 2005. The recipients were sent an email, asking them to fill in a questionnaire, and submit it electronically.3 Respondents who identified themselves with innovation studies were asked for relatively detailed information about the persons with whom they cooperate (at various levels of intensity).4 In addition, the respondents were asked questions about their sources of scholarly inspiration, important publishing outlets and their favourite �meeting places� (organisations / professional associations). In this way, we obtain a range of network relationships of varying �strength�, ranging from �strong� to �weak" ties (Granovetter 1973).
We started with an initial (relatively small) population obtained by studying lists of contributors to central journals in this area, reference lists in central books / papers and lists of participants in relevant projects within EU framework programmes. Particular attention was paid to the need to identify central researchers outside economics and in countries not belonging to the European Union (to avoid a biased sample). However, most of the people invitated to participate in the survey were identified by the respondents themselves, i.e., we invited all people mentioned as contacts by other respondents to take part in the survey as well (we asked for email addresses along with the names, but also searched ourselves for email addresses when these were not given).5, 6 In this way the entire community of innovation scholars was allowed to �self-organize�. We took stock of the database in July 2005. At that time, there were 5199 identified persons in our database, among which 3484 had been approached with an invitation to participate in the survey (for the remaining we were not able to identify an email address). 1115 responses were obtained, implying a response rate of 32%, which we consider to be quite satisfactory. About one fifth (218) of these respondents said they did not consider to be working in innovation studies, or, in a few cases, failed to demonstrate any strong links with one or more of the respondents. The analysis in the paper will be based on the responses from the 897 remaining respondents.
3 The questionnaire is available from the authors on request. 4 Those who responded but said they did not belong to the area were allowed to exit after having confirmed their identity. 5 This method of defining the sample is known in the literature as the �name generator mechanism� (Lin, 1999). 6 A related survey aimed towards �evolutionary economists� (an important strand within innovation studies) had been carried out earlier by Verspagen and Werker (2003, 2004). When our survey �encountered� a respondent of the earlier survey, we invited these to revise their answers to the earlier survey in light of our broader focus, as well as to answer some additional questions.
3
Other
Policy
Psychology
Sociology
ManagementHumanities
History
Geography
Engineering
Economics
S&T studies
Multidisciplinary
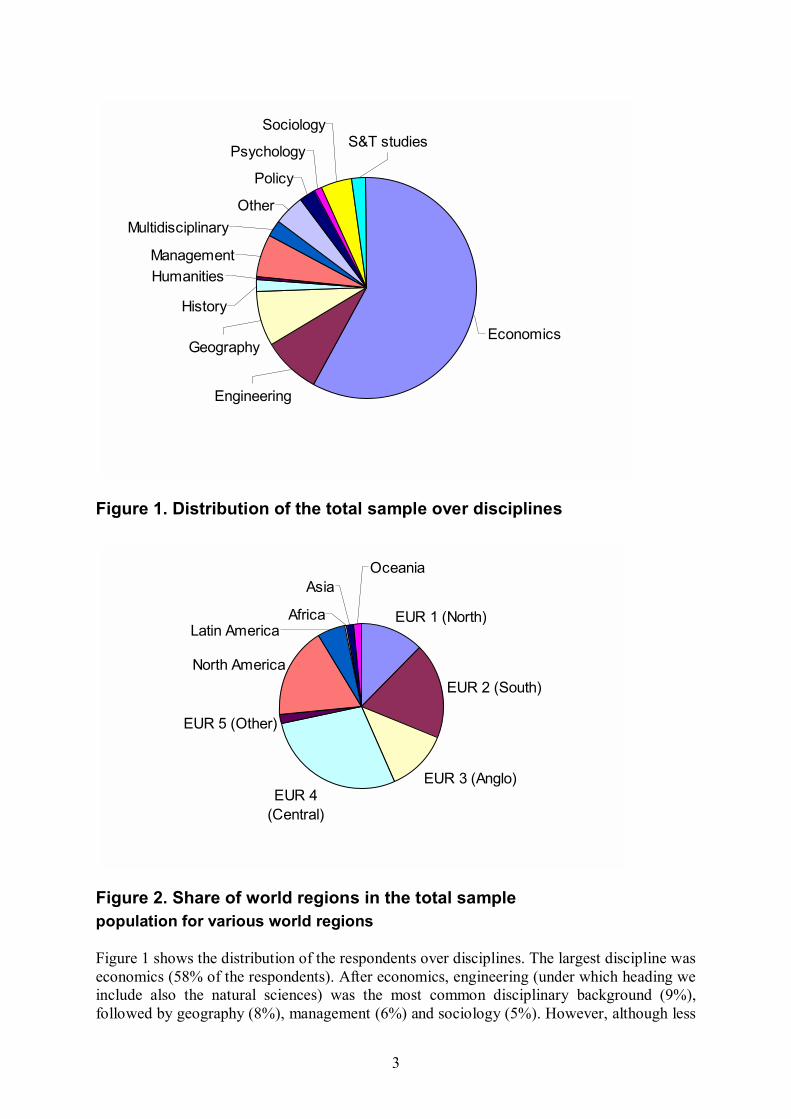
Figure 1. Distribution of the total sample over disciplines
EUR 1 (North)
EUR 2 (South)
EUR 3 (Anglo)EUR 4
(Central)
EUR 5 (Other)
North America
Asia
Africa
Oceania
Latin America
Figure 2. Share of world regions in the total sample population for various world regions Figure 1 shows the distribution of the respondents over disciplines. The largest discipline was economics (58% of the respondents). After economics, engineering (under which heading we include also the natural sciences) was the most common disciplinary background (9%), followed by geography (8%), management (6%) and sociology (5%). However, although less

4
frequent, there were also researchers with other backgrounds. Similarly, Figure 2 gives the distribution of the respondents over world regions. As is evident from the figure, Europe (71 percent) joined by North America (17 percent) dominate the sample. Latin-America is also relatively well represented, while there are very few researchers in the sample coming from Africa and Asia. Because of the large number of respondents in Europe, we divide this group of countries further into five categories. The largest of these (in terms of respondents) is central Europe (Austria, Belgium, Switzerland, Luxemburg, Germany and the Netherlands), followed, respectively, by South Europe (Spain, France, Portugal, Greece and Italy), North Europe (Denmark, Finland, Sweden and Norway), and Anglo-Saxon Europe (United Kingdom and Ireland).
The role of �strong ties�� The central idea underlying our analysis is that strong and weak ties play quite different roles when it comes to fostering scholarly interaction. Strong ties, we assume, tend to bind scholars together in relatively small groups characterized by strong interaction between group members, and � at least for most group members � a relatively modest amount of interaction with members of other groups. The role of weak ties, then, is to counteract this tendency toward insularity by embedding such smaller groups in broader intellectual communities characterized by shared cognitive frameworks, sources of scholarly inspiration, �meeting places� and publication channels. Three sets of research questions come out of this:
- To what extent do strong ties divide the scholars of our sample into a set of smaller groups with dense internal relationships?
- Do weak ties bring these smaller groups into broader intellectual communities, if so how many and what characterizes them?
- What do these results tell us about �innovation studies� as a field? How much do the researchers in this area actually have in common? What are the likely future prospects?
To answer the first question we limit the focus to what we consider as strong links,7 e.g., student-supervisor relationships, colleagues within your own institution and co-authors (independently of were they work). To identify the �community structure� of our network we adopt a method developed by Newman and Girvan (2004). Assume, for instance, that a network consists of pockets of dense (or �thick�) interaction (e.g., groups) linked together by a smaller number of cross-group links. The more efficient a particular cross-group link is in bringing groups together, the more �busy� it will tend to be. What the Newman-Girvin method does, then, is to identify these �busy� cross-group links (so-called �edges�) and eliminate them one by one using an iterative procedure. As a consequence, the network will split into successively smaller groups. To find out when to stop partitioning they calculate an index of �community strength� (the maximum of which is assumed to reflect the optimal partitioning of the network).
7 We assume that a link exists if at least one of the participants in a relationship reports it.

5
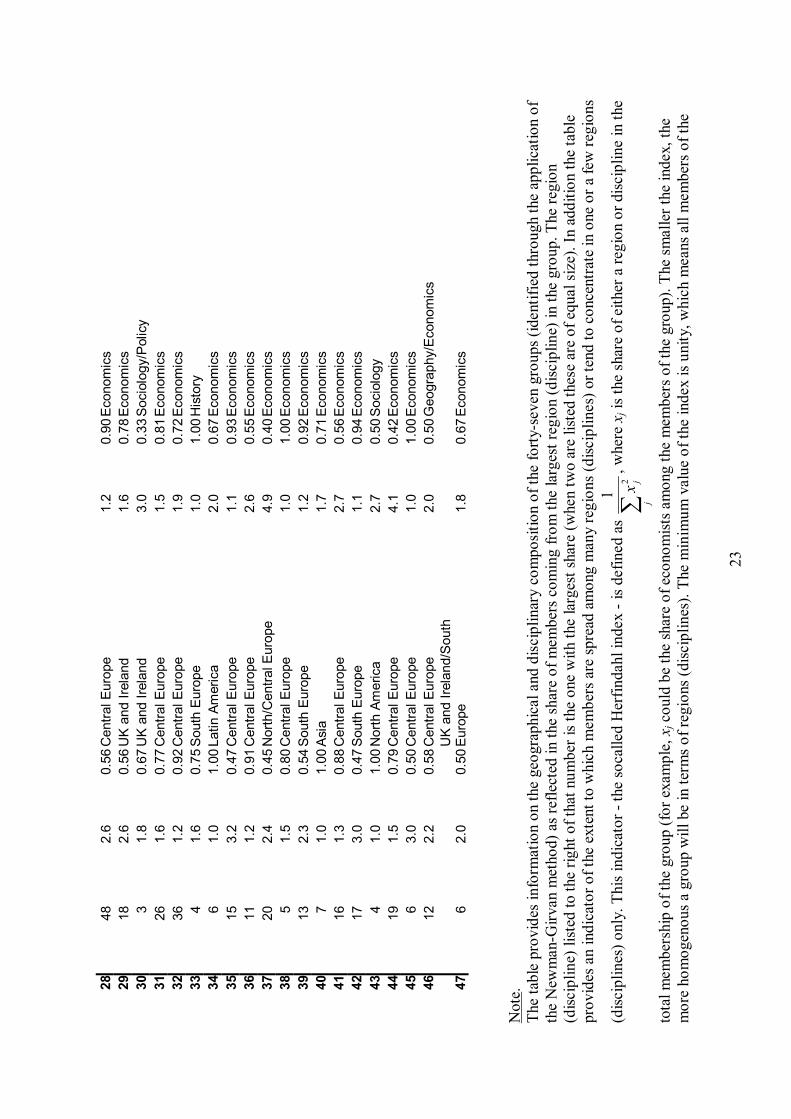
Figure 3 Community Strength Figure 3 presents the community-strength indicator for our network at different levels of partition. The indicator rises sharply in the beginning, indicating strong support for the idea that strong ties tend to lead to the formation of smaller groups characterized by dense internal interaction. The indicator peaks at forty-seven implying that an average group has slightly above twenty members.8 However, in reality the group size varied a lot, from three to sixty-one members. Further details on the forty-seven groups may be found in Table A1 in the Appendix to this paper.
The question we wish to address now is to what extent these groups tend to be bound to particular geographical locations and/or disciplinary settings. To explore this we report in Figure 4 on the distribution of a measure of geographical (disciplinary) concentration, the so-called (inverse) Herfindahl index (with respect to geography and discipline, respectively). The Herfindahl index is calculated on the basis of the share of each discipline (region) in membership of each group.9 The greater the spread of the members of a particular group across different locations or disciplines, the larger the value of the index will be. If all the members of a group belong to the same region (or discipline) the index will be equal to 1 (minimum value). The maximum value of the index is given by the numbers of regions or disciplines in the data set (10 and 12, respectively).
8 Detailed information on the membership, location and disciplinary orientation of the forty-seven groups may be found in Table A1 in the appendix to this paper.
9 The formal definition of the inverse Herfindahl index is 1/∑=
n
iis
1
2 , where 2is is the squared share of discipline /
region i in the community.

6
0
5
10
15
20
25
30
1 2 3 4 5 6 7 8 9 10
Herfindahl Index
Num
ber
of g
roup
s
GeographyDiscipline
Figure 4 Geographical and Disciplinary Concentration � Groups defined through �strong ties� As is evident from the graph the groups bound together by strong links tend to be fairly concentrated in terms of geography and/or discipline. In fact, in both cases the majority of the groups cluster close to the lower end of the index and the upper end of the (potential) distribution is totally empty. Thus, geographically distributed, cross-disciplinary groups of researchers that work closely together (e.g., bound together by strong ties) appear to be extremely rare.
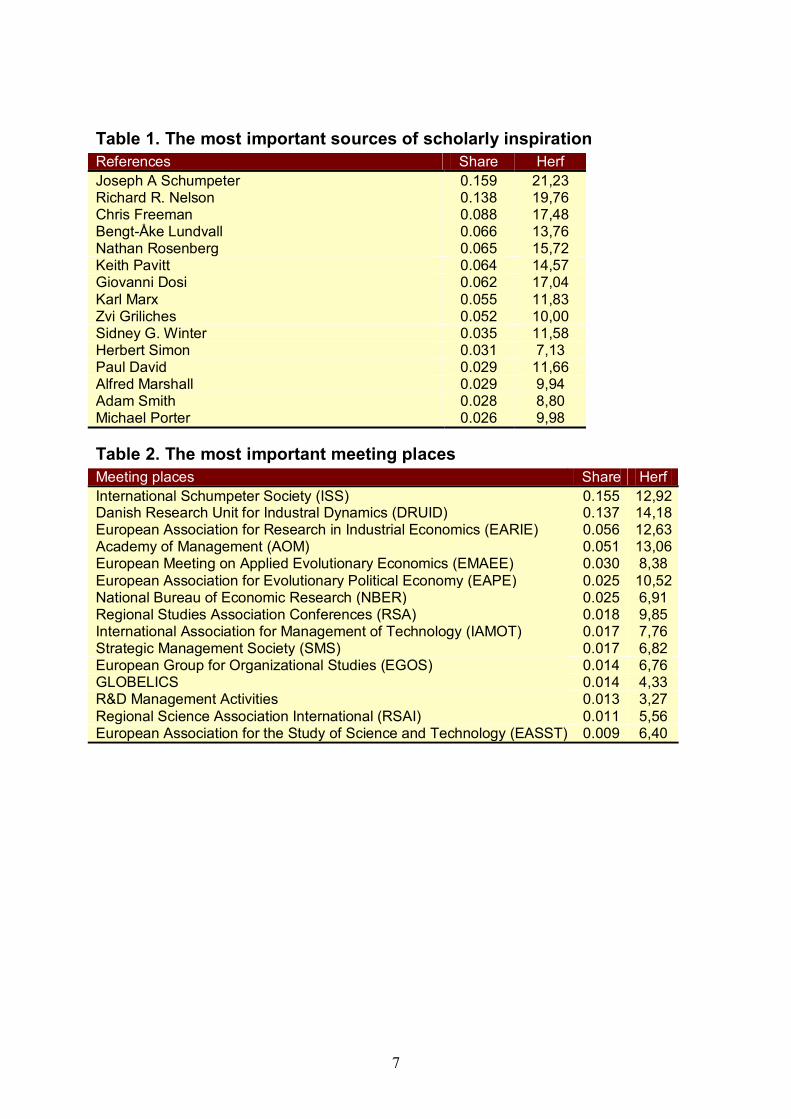
�. and �weak ties� Having answered affirmatively our first research question (about the existence of smaller groups defined through strong ties) we now move to the central topic of this paper, namely what binds these groups together (and to what extent). To explore this we take into account the information supplied by the respondents on sources of scholarly inspiration, favourite �meeting places� and the most important publication channels. In each case the respondent was asked to mention five (ranked from most important to least important on a five to one scale). Tables 1-3 report the fifteen most frequent answers in each category. The column �share� counts the share of respondents that include a particular source of inspiration, meeting place or publication channel among the five most important ones. The column �Herf� displays the corresponding value of the (inverse) Herfindahl index. This time the index reflects the extent to which a source of inspiration, meeting place or publication channel is widely shared among the smaller groups (large values), or appreciated by one or a few groups only (small values). The more widely shared, the larger the index will be. As before, the minimum of the index is 1 (unity), while the maximum will be equal to the number of groups ( 47).
7
Table 1. The most important sources of scholarly inspiration References Share Herf Joseph A Schumpeter 0.159 21,23 Richard R. Nelson 0.138 19,76 Chris Freeman 0.088 17,48 Bengt-Åke Lundvall 0.066 13,76 Nathan Rosenberg 0.065 15,72 Keith Pavitt 0.064 14,57 Giovanni Dosi 0.062 17,04 Karl Marx 0.055 11,83 Zvi Griliches 0.052 10,00 Sidney G. Winter 0.035 11,58 Herbert Simon 0.031 7,13 Paul David 0.029 11,66 Alfred Marshall 0.029 9,94 Adam Smith 0.028 8,80 Michael Porter 0.026 9,98
Table 2. The most important meeting places Meeting places Share Herf International Schumpeter Society (ISS) 0.155 12,92Danish Research Unit for Industral Dynamics (DRUID) 0.137 14,18European Association for Research in Industrial Economics (EARIE) 0.056 12,63Academy of Management (AOM) 0.051 13,06European Meeting on Applied Evolutionary Economics (EMAEE) 0.030 8,38 European Association for Evolutionary Political Economy (EAPE) 0.025 10,52National Bureau of Economic Research (NBER) 0.025 6,91 Regional Studies Association Conferences (RSA) 0.018 9,85 International Association for Management of Technology (IAMOT) 0.017 7,76 Strategic Management Society (SMS) 0.017 6,82 European Group for Organizational Studies (EGOS) 0.014 6,76 GLOBELICS 0.014 4,33 R&D Management Activities 0.013 3,27 Regional Science Association International (RSAI) 0.011 5,56 European Association for the Study of Science and Technology (EASST) 0.009 6,40

8
Table 3. The most important journals Journals Share Herf Research Policy (RP) 0.456 24,84Industrial and Corporate Change (ICC) 0.193 11,46Journal of Evolutionary Economics (JEE) 0.144 14,02Economics of Innovation and New Technology (EINT) 0.138 15,72Structural Change and Economic Dynamics (SCED) 0.079 12,21Rand Journal of Economics (RAND) 0.048 14,11American Economic Review (AER) 0.043 15,75R&D Management 0.040 7,04 Regional Studies (RS) 0.039 10,65Technovation 0.039 14,76International Journal of Industrial Organization (IJIO) 0.037 10,37Journal of Industrial Economics (JIE) 0.035 12,48Management Science (MS) 0.032 9,24 Strategic Management Journal (SMJ) 0.032 14,75Journal of Product Innovation Management (JPIM) 0.030 2,93 The most important source of inspiration is clearly Joseph Schumpeter, way ahead of the three other �classics� on among the top fifteen, Karl Marx, Alfred Marshall and Adam Smith. The two sources of inspiration that came closest to Schumpeter were Richard R. Nelson and Christopher Freeman, arguably two of the most influential scholars in this field from the 1970s onwards on their respective sides of the Atlantic. Nelson, together with Sidney Winter (also on the list), authored a very influential book in this area, �An Evolutionary Theory of Economic Change� (1982), bridging evolutionary thinking with (behavioralist) organisation theory in the tradition from Herbert Simon (also among the top fifteen). Freeman, working in the tradition from Schumpeter, was the first director of Science Policy Research Unit at the University of Sussex (SPRU), one of the oldest and most successful academic institutions in this area (founded 1965), and the first editor of the leading journal of the field, Research Policy (started in 1972). Keith Pavitt, a bit further down the list, succeeded Freeman as Professor at SPRU and editor of Research Policy. Giovanni Dosi, editor of the journal Industrial Dynamics and Corporate Change (ICC), also has a SPRU background. But the three remaining sources of inspiration from the upper part of the list, Bengt Åke Lundvall, Nathan Rosenberg and Zvi Griliches, all have different backgrounds from those mentioned so far (and from each other), hence illustrating the diversity of the field. For instance, while Lundvall is a heterodox economist from Scandinavia, known for his advocacy of the �national system of innovation� concept (Lundvall 1992), Griliches was a famous mainstream economist (econometrician) from the United States.
Among the favourite meeting places, two stand out, the International Schumpeter Society (ISS) and the Danish Research Unit for Industrial Dynamics (DRUID). Both are of fairly recent origin, dating back to 1986 (ISS) and 1995 (DRUID). The latter, although initially a relative local Danish affair (hence the name), has developed into a large, annual conference with broad international participation. Several of the smaller meetings are also fairly recent, albeit some, such as the American �Academy of Management� (AOM), the European Association for Research in Industrial Economics (EARIE) and the regional associations (RSAI and RSI) are fairly well established events catering for large audiences (transcending innovation studies proper).
While the answers to the questions on sources of inspiration and favourite meeting places reveal a significant amount of diversity among the respondents, there appears to be

9
more coherence in the assessment of important publication outlets. In particular the journal Research Policy (RP) tends to be popular with many respondents. Three other specialized journals, all of fairly recent origin, also get high marks (although far behind Research Policy): Industrial and Corporate Change (ICC), Journal of Evolutionary Economics (JEE) and Journal of the Economics of Innovation and New Technology (EINT). Further down the list are some general economics journals, such as the American Economic Review, and a number of specialized journals focusing on fields bordering innovation studies, such as, for instance, management, regional studies and industrial economics.
Comparing the three types of �weak ties� that we have been able to take into account results in a quite telling picture. The first thing that strikes the eye is that the shares and concentration indexes generally tend to be rather low. This indicates a considerable diversity among the respondents in what they value highly as important sources of inspiration, meeting places and publishing outlets. The only strong exception to this trend, and this is our second important observation, is the journal Research Policy, which was pointed to as important by slightly less than one half of the respondents. The third finding that we wish to emphasize here is that sources of inspiration and journals both seem to be more important in bringing the field together than do meeting places. In fact, there are six sources of scholarly inspiration and five journals that are more widely spread across the groups of our network than the most widely shared meeting place. A similar observation may be made for journals, two of the three largest journals have in fact relatively low values on the inerse Herfindahl index, indicating that these are highly popular with a limited number of groups only. Thus, and this will be our fourth point, while some �weak ties� may be important for a large number of groups, and thus may be seen as important for the integration of the entire field, others may be important for some groups only (and may hence play a more �divisive� role).
Cluster Analysis
The descriptive evidence reported above gives some hints on the social organization of the field. For instance, we have been able to identify some leading academics, some of which have a common background (from the Science Policy Research Unit � SPRU � at the University of Sussex) and a clear relationship to the leading journals in this area (Research Policy and ICC). However, other leading academics have quite different backgrounds, thus raising the question to what extent the scholars in this area should be seen as part of a common social organisation, characterized by a shared cognitive framework and appropriate institutions and organisations, or if it is more a loose association of different (perhaps competing) strands.
But how to empirically distinguish between different hypotheses on how the field is socially structured? In order to do this we shall assume that a social organisation of the type discussed above is characterized by a specific combination of leading academics (sources of inspiration), publishing outlets and meeting places. To test for the existence (or lack of such) of one or more such combinations in this area, we use the information given by the respondents to produce a vector of (�weak tie�) characteristics (with three times fifteen, e.g. forty-five, elements) for each of the forty-seven groups previously identified.10 We then apply
10 In constructing the vector of (�weak tie�) characteristics, we use a 9 � 5 scoring method in order to eliminate the strong element of progressivity that would result from a 5 � 1 scoring method. In the latter case, listing an element first weights five times higher than listing it fifth, while in our method the difference is only about two. However, we have also experimented with the 5 � 1 scoring method, and the results are qualitatively similar to those using the 9 � 5 method. If an element was not listed by a respondent, it gets a score of zero.

10
hierarchical cluster analysis11 to explore the question of how (and to what extent) these �weak links� contribute to embed the small groups defined by strong links into one or more clearly distinguishable social organisations or intellectual communities. Hence, groups that have similar scores on similar �weak ties�, will tend to be clustered together into larger wholes. At the highest level of aggregation there is one cluster only (Figure 5), which splits into four, seven and twelve clusters at progressively lower levels of aggregation. We chose to focus on the seven clusters case. Two of these seven clusters are very small, however, with only five and seven members respectively, and will be disregarded in the following. This leaves us with five main clusters (shaded).
11 The method is "Hierarchical Cluster Analysis: Ward's Method" from SPSS 14.0.0.

11
ENTI
RE
NET
WO
RK
(897
)
(316
) M
ANAG
EMEN
T(2
2)
(488
) IN
DU
STR
IAL
ECO
NO
MIC
S(7
1)
SCH
UM
PETE
R
CR
OW
D(3
09)
CO
RE
SCH
UM
PETE
RIA
NS
(159
)
SCH
UM
PETE
RIA
N
FOLL
OW
ERS
(150
)
(5)
(68)
(3
)
GEO
GR
APH
YAN
D P
OLI
CY
(298
)
(7)
PER
IPH
ERY
(185
)
(286
) (1
2)
ECO
NO
MIC
S M
AIN
STR
EAM
PE
RIP
HER
Y(1
12)
MAN
AGEM
ENT
PER
IPH
ERY
(28)
EXTR
EME
PER
IPH
ERY
(45)
LEVE
L 0
LEVE
L 1
LEVE
L 2
LEVE
L 3
12
34
2.1
2.2
3.1
3.2
3.3
2.1.
12.
1.2
3.1.
13.
1.2
3.2.
13.
2.2
3.2.
34.
14.
2
Figu
re 5
. Clu
ster
s of
Inno
vatio
n Sc
hola
rs
(Not
e: N
umbe
rs in
bra
cket
s rep
rese
nt th
e nu
mbe
r of s
chol
ars
in th
e cl
uste
r)

12
Table 4 reports some characteristics for the five main clusters of our sample. For each cluster we report the two most important sources of inspiration, meeting places and journals (e.g. what the respondents value most). In addition we report the bias in these assessments, e.g., significant, positive deviations in these assessments from those of the rest of the sample (5% level of significance). We also report the size of the cluster and its disciplinary and geographical orientation (shares of ten percent or above of a discipline or region are reported). Cluster 1 (Management) is a relatively small cluster composed mainly by sociologists and management scholars, with a geographical bias towards the USA. Members in this cluster go to the American Academy of Management (AOM) and DRUID meeting. They also like the European Group of Organisational Studies (EGOS). Apart from Research Policy they see management journals as the most relevant publishing outlets. Sources of inspiration generally get a low score, indicating perhaps that the most important sources of inspiration for the members of this group do not coincide with those of the sample as a whole. Cluster 2.1 (Schumpeter crowd) is a large cluster with more than three hundred members. Although the majority among those are economists, there are also many scholars with a multidisciplinary background (or from other social sciences). The cluster is particularly strong in Europe. Members in this cluster share a strong interest in the meetings of the International Joseph Schumpeter Society (ISS) and DRUID. They are also much more likely than others to participate in other meetings with an evolutionary leaning, e.g., the European Meeting for Applied Evolutionary Economics (EMAEE) and the European Association for Evolutionary Political Economy (EAEPE). Schumpeter is their main source of inspiration, and they value him more highly than do members of any other cluster. They also show strong appreciation for a number of other well-known scholars with a Schumpeterian or evolutionary leaning, Nelson and Freeman in particular. Among the journals they fancy, Research Policy and Industrial Change and Corporate Dynamics (ICC) deserve particular mentioning, but they are also very fond of the Journal of Evolutionary Economics (JEE), Economics of Innovation and New Technology (EINT) and SCED (Structural Change and Economic Dynamics). At a lower level of aggregation this cluster divides into two, one with very high values on most indicators (�core Schumpeterians�), and cluster with essentially the same distribution of characteristics but lower absolute values (�Schumpeterian followers�) . Cluster 3.1 (Geography & Policy) The members of Cluster 3.1, which is comparable in size to the previous one, are generally less inclined than the members of that cluster to take part in conferences and meetings. Although the DRUID and ISS receive most attention in this cluster too, what particularly characterizes the members of this cluster is their pronounced interest for the regional science meetings. This is perhaps understandable given the high share of geographers in this cluster (20%). In fact, 80% of the geographers in our sample belong to this cluster, as do 48% of the sociologists and 42% of the management scholars. Hence, this cluster is clearly more cross-disciplinary in its orientation than, say, cluster 2.1 or the network as a whole (the economists are actually in a minority in this cluster in contrast to the sample as a whole). It also has more dispersed geographical basis (for instance the majority of the Latin-American scholars in our sample belong to this cluster). The members of this cluster have high esteem for Schumpeter�s work (although not more than for the sample as whole). However, what really characterizes the members of this cluster compared to the rest of the sample is the importance attached to inspiration from Lundvall and Porter, two scholars that in different ways have done influential work on spatial issues and related policy matters.

13
Generally, there are few journals that are held in particularly high esteem by the members of this cluster, with a partial exception for those that focus on spatial/regional issues (although they join in on the general enthusiasm for Research Policy). Cluster 3.2 Periphery This cluster contains around one fifth of the members of the total network. US scholars are more inclined to take part in this cluster than in the sample as a whole. Economists dominate but a range of other disciplines is also present (though in smaller numbers). Among all the clusters this contains the members that are least interested in taking part in meetings/associations. Neither the ISS nor the DRUID seems to appeal to the members of this cluster. The highest values were reported for the National Bureau of Economic Research meetings (NBER) and the Academy of Management. Hence, the members of this cluster have few if any meeting-places in common with the members from largest clusters of our network. Still they join in on the general appreciation of Schumpeter�s work. However, what particularly inspire them is the work by the American neoclassical economist (and econometrican) Griliches. Their preferences for journals also differ from the sample as a whole (and in particular from those of Cluster 2.1) by emphasizing more strongly economics mainstream journals such as the American Economic Review (AER) and Rand Journal of Economics (in addition to Research Policy). At a lower level this cluster divides in three, with one group consisting of mainstream economists, a second of management scholars and a third (�extreme periphery�) with more mixed participation (characterized by very low values - appreciation � of all factors taken into account by the present analysis, confirming their peripheral status in the network).

14
Table 4. Characteristics of main clusters of innovation scholars
Cluster 1 Management
Cluster 2.1 Schumpeter Crowd
Cluster 3.1 Geography & Policy
Cluster 3.2 Periphery
Cluster 4. Industrial Economics
Number of groups
3 13 14 11 5
Number of scholars
22 309 298 185 71
Most important conferences
AOM, DRUID
ISS, DRUID DRUID, ISS NBER, AOM
EARIE, ISS
Conference bias
AOM, EGOS ISS, DRUID, EMAEE, EAPE
RSAI, RSA, IAMT
NBER, R&D Man.
EARIE, ISS
Most important sources of inspiration
Nelson, Griliches
Schumpeter, Nelson
Schumpeter, Lundvall
Griliches, Schumpeter
Griliches, Schumpeter
Inspiration bias
None Schumpeter, Freeman, Nelson, Rosenberg, Simon, Pavitt, Dosi, Winter, Smith, David
Lundvall, Porter
Griliches Griliches
Most important journals
RP, MS RP, ICC RP, JEE RP, RAND RP, AER
Journal bias JPIM, MS, SMJ
RP, JEE, ICC, EINT, SCED
RS, Technovation
AER, RAND, R&D Man.
EINT, AER, RAND, JIE
Most important disciplines
Sociology (27%), Manage-ment (18%), Engineering (18%), Economics (10%)
Economics (68%)
Economics (40%), Geography (20%), Engineering (10%)
Economics (61%), Engineering (11%)
Economics (93%)
Most important locations
North-America (73%)
South Europe (26%), Central Europe (19%), UK and Ireland (19%), North Europe (12%)
Central Europe (34%), North America (16%), North Europe (15%), Latin America (10%)
North America (31%), Central Europe (26%), South Europe (16%)
Central Europe (39%), South Europe (23%), North Europe (17%)

15
Cluster 4 Industrial Economics The members of this medium-sized cluster are predominantly economists (more than 90%) with a bias towards Europe. They hold the meetings of the European Association for Research in Industrial Economics in high regard. However, in contrast to the members of the previous cluster (with whom they otherwise have much in common) they also participate in the ISS meetings, thus connecting up with some of the larger groups of our network. As for the network as a whole they recognize the importance of Schumpeter. But what they particularly value highly is - as in the previous cluster - the inspiration from Griliches. Their interests in journals have also much in common with the members of that cluster with a generally high appreciation of Research Policy supplemented by a taste for mainstream economics journals (AER, Rand) and � in this case � also the Journal of Industrial Economics. Compared to the sample as whole the members of thus cluster also hold EINT in especially high esteem (as do the �Schumpeter crowd�).
It is clear from the analysis that, consistent with expectations, �weak ties� contribute to embed the many groups bound together by �strong ties� together in a smaller number of �intellectual communities�. �Scholarly inspiration� turns out to be an important feature in delimiting these communities. Apart from Schumpeter, the �founding father� of this body of knowledge, who is highly appreciated by almost everybody (with the exception of the small �Management� cluster), most such sources tend be highly valued by a one or a few clusters only. For instance, the �Schumpeter Crowd� is closely associated with Nelson, Freeman and Dosi, the �Geography and Policy� community with Porter and Lundvall and the �Periphery� and �Industrial Economics� communities with Griliches. This may reflect a division between �schools of thought� since Griliches is associated with neoclassical (mainstream) economics, while, say, Nelson, Freeman and Dosi represent the evolutionary strand within economics.
However, it might be argued that a thriving intellectual field may learn to live with � and even gain momentum from - such differences in perspective. Common meeting places, e.g., associations and conferences, may play an important role in mediating such differences, by providing a framework for interaction between people with similar interests but different theoretical and disciplinary backgrounds. For instance, the Schumpeter Society (ISS) meetings are very popular both with the evolutionary �Schumpeter crowd� and the neoclassical �Industrial Economics� cluster, while the DRUID conference similarly bridges the �Schumpeter crowd�, �Geography and Policy� and �Management�. Finally, the Academy of Management (AOM) brings together the Management� and �Periphery� clusters. It should be noted, though, that there is no common �meeting place� for innovation studies a whole. This is different when it comes to publication outlets, since the journal Research Policy spans the entire field. This is a clear exception though. Most journals were found to be of much more specific interest, such as for instance Management Science for the �Management� cluster, ICC and SCED for the �Schumpeter crowd�, Regional Studies and Technovation for the �Geography and Policy� cluster and mainstream economics journals for the �Periphery and �Industrial Economics� clusters.
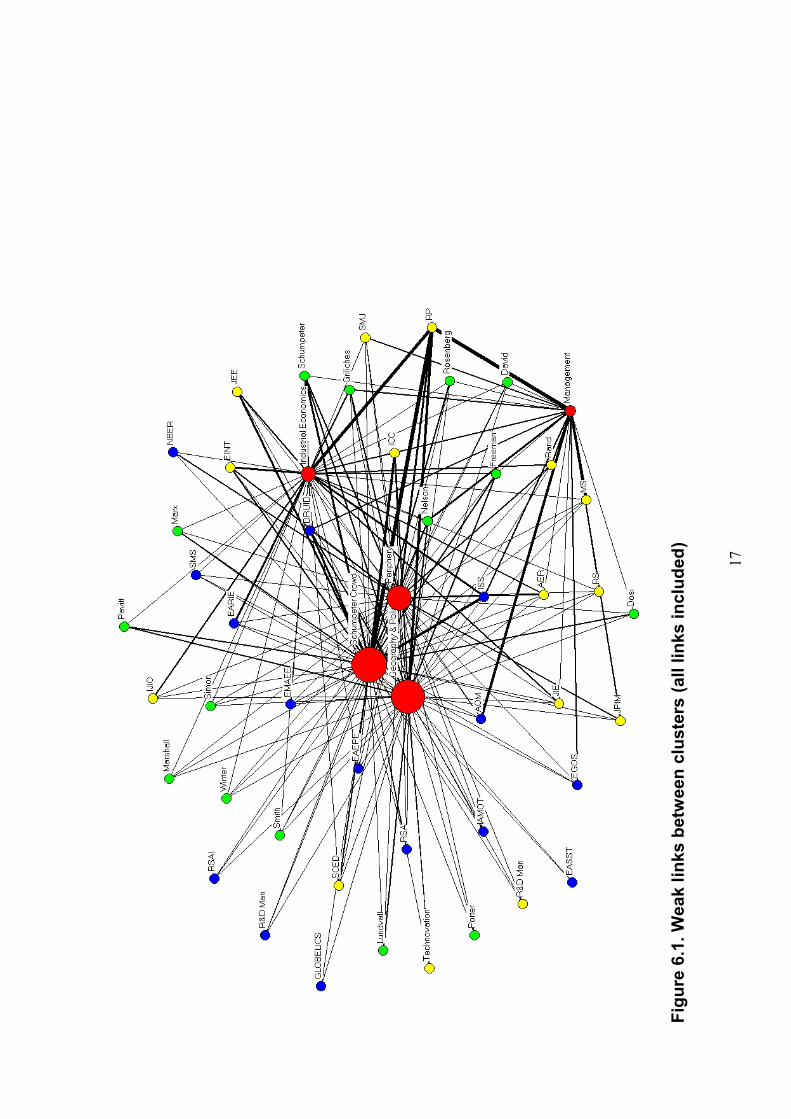
Figures 6.1-3 further illustrate the different roles that weak ties may play in (a) defining clusters of likeminded innovation scholars and (b) linking these clusters together.12 The figures treat the five clusters and the �weak ties� that characterize them (e.g., sources of scholarly inspiration, meeting places and journals) as a network. The lines in the figures are links between a cluster and a particular �weak tie�, and the thickness of a line reflects how
12 The graphs, included here as illustrations only, are based on a spring-embedding algorithm (using Ucinet / Netdraw). The lines in the graphs reflect how the members of a cluster on average assess a certain weak tie. These assessments are measured on a scale of 5 � 9 with 7 as the middle point. Hence, the 0.9 cut-off corresponds one in every 7.78 members scoring a 7 (and none of the other members scoring anything). Similarly, the 1.6 cut-off means that one in every 4.38 members scores a 7 (and none of the other members scoring anything).

16
important (�busy�) a particular link is. In Figure 6.1, we include all positive links, no matter how important they are. What results is a densely populated network in which the five clusters of scholars are linked by many �weak ties�. However, when the least important links are removed (Figure 6.2), a clearer structure emerges. Most of the retained �weak ties� now contribute to differentiate clusters from each other rather than unite them. In fact, the �Periphery� cluster, which used to be connected to the other clusters through a number of ties, only has one tie left to the other clusters, through the common appreciation for Research Policy (RP), confirming the peripheral role of the scholars in this cluster. Apart from Research Policy, what keeps the network integrated at this level of intensity is a number of �bridges� (consisting of combinations of �weak ties�) between the main clusters. At an even higher threshold level for which links to retain (Figure 6.3), there are only eleven weak ties lefts, nine of which contribute to differentiate the clusters from each other and two (Research Policy and the Schumpeter Society) that continue to keep the network integrated. Hence, the Schumpeter Society and, in particular, the journal Research Policy evidently play a very important role in keeping the network together.
17
Fi
gure
6.1
. Wea
k lin
ks b
etw
een
clus
ters
(all
links
incl
uded
)

18
Fi
gure
6.2
. Wea
k lin
ks b
etw
een
clus
ters
, cut
-off
valu
e =
0.9

19
Fi
gure
6.3
. Wea
k lin
ks b
etw
een
clus
ters
, cut
-off
valu
e =
1.6
20
Conclusion Scholarly work on innovation has increased very rapidly in recent years. In parallel with this we have seen the emergence of a number of new journals and meeting places. This raises the question of how these developments are to be understood. Is there a new body of knowledge and teaching developing that backed by the emergence of new institutions and organisations eventually may develop into a new discipline within the social sciences? Or is it more a loose associations of scholars from different disciplines and settings with little more in common than a (vaguely) related thematic focus? This is a difficult question to research, so we felt a compelling need to collect our own data on the subject (in the form of a web-based survey). In one sense the answer is clear. 80 % of the more than 1100 respondents identified themselves with �innovation studies�. Surely this is something new. Who talked about �innovation studies� ten or twenty years ago? But this does of course not imply that we necessarily are talking about something is developing into a new discipline. It could equally well be a sub-field within an existing discipline or something that crosses existing disciplines without challenging them in their basic foundations. But what is a discipline after all? The term has different connotations. First of all it is a body of knowledge. Second it has to do with teaching (that body of knowledge) to others. And thirdly it also has to do �discipline� in the more traditional sense of the word, e.g. the need for any body of knowledge (and teaching) to have norms, institutions and organisations that allow the knowledge worker to distinguish between what is true and untrue, substantiated by the evidence or purely speculative, useful and not so useful etc. All of this involves social organisation in one form or another, and this is what we have tried to explore through our survey and the ensuing analysis.
What we have found is that there is solid evidence backing the proposition that a commonly recognized body of knowledge has developed (related to the work of Schumpeter and others) and that new institutions and organisations have developed in the form of journals, associations and meetings to facilitate the continuing growth and spread of this knowledge. But our research also indicates that there is something �half-baked� about these institutions and organisations. Although there is a substantial part of the network, the �Schumpeter crowd� in particular, that is very closely associated with the central organisations and activities in this area, others � while continuing to see themselves as part of �innovation studies� � have a much more distant relationship. In fact, as we have shown, the strongest integrating feature of the area is not a set of leading academics or a professional society but a journal. Hence, there is a possibility that the existing social organisation of the field will not be strong enough to allow for a common base of knowledge to continue to develop, and that the field instead will fragment into several different intellectual communities with little common interaction (not to say insights). Arguably, for this field to prosper, and for a common body of knowledge to continue to develop and spread, stronger organisations, particularly in the form of common �meeting places�, may be needed.
References Crane, D. (1969) �Social Structure in a Group of Scientists: A Test of the �Invisible College�
Hypothesis, American Sociological Review 34: 335-352
21
Crane D. (1972) Invisible Colleges: diffusion of knowledge in scientific communities, Chicago: University of Chicago Press
Cummings, J. N. and S, Kiesler (2005) �Collaborative Research Across Disciplinary and Organizational Bounderies�, Social Studies of Science 35: 703-722
Fagerberg, J. (2003). �Schumpeter and the revival of evolutionary economics: an appraisal of the literature.� Journal of Evolutionary Economics 13: 125-159.
Fagerberg, J. (2004). �Innovation. A Guide to the Literature�. In: Oxford Handbook of Innovation. J. Fagerberg, D. C. Mowery and R. R. Nelson (eds) . Oxford University Press.
Fagerberg, J, D. C. Mowery and R. R. Nelson (eds, 2004) Oxford Handbook of Innovation. Oxford University Press.
Freeman, C. and L. Soete (1997) The Economics of Industrial Innovation, Third Ed., London: Pinter (first edition by Freeman 1974)
Granovetter, M.S. 1973. �The strength of weak ties.� American Journal of Sociology, 78, pp. 1360-1380.
Griffith, B.C. and N.C. Mullins (1972) �Coherent Social Groups in Scientific Change: �Invisible Colleges� May be Consistent Throughout Science�, Science 197: 959-96
Kline, S.J. and N. Rosenberg (1986) �An Overview of Innovation�, in R. Landau and N. Rosenberg (eds) The Positive Sum Strategy: Harnessing Technology for Economic Growth, Washington D.C.: National Academy Press, pp. 275-304
Lin, N. 1999. Building a Network Theory of Social Capital, Connections, 22 (1): 28-51
Lundvall, B. Å. (1992) National Systems of Innovation: Towards a Theory of Innovation and Interactive Learning, London: Pinter
Nelson, R.R. and S.G. Winter (1982) An Evolutionary Theory of Economic Change, Cambridge, Mass: Harvard University Press
Newman, M. E. J. and M. Girvan (2004). �Finding and evaluating community structure in networks.� Phys. Rev. E 69: 026113.
Soderqvist, T. and A.M. Silverstein (1994) �Participation in Scientific Meetings: A New Prosopographical Approach to the Disciplinary History of Science � The Case of Immunology, 1951-1972� Social Studies of Science 25: 513-548
Verspagen, B. and C. Werker (2003). �The Invisible College of The Economics of Innovation and Technological Change.� Estudios De Economía Aplicada 21(3): 203-220.
Verspagen, B., Werker, C. (2004), �Keith Pavitt and the Invisible College of the Economics of Technology and Innovation�, Research Policy, vol 33, pp. 1419-1431.

22
Tabl
e A
1. R
ole
of g
eogr
aphy
and
dis
cipl
ine
in th
e pa
rtiti
on o
f the
net
wor
k G
roup
Num
ber
of
scho
lars
Inve
rse
Her
finda
hl
Reg
ion
Shar
e of
la
rges
t R
egio
n La
rges
t reg
ion
Inve
rse
Her
finda
hl
Dis
cipl
ine
Shar
e of
la
rges
t di
scip
line
Larg
est d
isci
plin
e 1
112.
7 0.
55N
orth
Am
eric
a
3.7
0.36
Soc
iolo
gy
261
3.9
0.34
UK
and
Irel
and
2.
1 0.
67E
cono
mic
s 3
231.
3 0.
87N
orth
Eur
ope
5.
1 0.
26E
cono
mic
s/E
ngin
eerin
g 4
81.
0 1.
00O
ther
(=Tu
rkey
) 1.
0 1.
00E
cono
mic
s 5
171.
7 0.
76N
orth
Am
eric
a
3.6
0.47
Eco
nom
ics
617
3.0
0.41
Sou
th E
urop
e
1.6
0.76
Eco
nom
ics
722
2.4
0.59
Cen
tral E
urop
e
6.4
0.23
Geo
grap
hy/E
ngin
eerin
g 8
202.
5 0.
55La
tin A
mer
ica
2.
2 0.
65E
cono
mic
s 9
82.
5 0.
50La
tin A
mer
ica
1.
0 1.
00E
cono
mic
s 10
242.
2 0.
58N
orth
Am
eric
a
3.1
0.50
Eco
nom
ics
113
1.8
0.67
UK
and
Irel
and
1.
0 1.
00E
cono
mic
s 12
352.
2 0.
66N
orth
Am
eric
a
2.0
0.69
Geo
grap
hy
1327
3.0
0.44
Latin
Am
eric
a
3.4
0.44
Eng
inee
ring
145
1.0
1.00
Sou
th E
urop
e
1.9
0.60
Eco
nom
ics
1522
2.5
0.50
Nor
th E
urop
e
1.2
0.91
Eco
nom
ics
1628
3.2
0.46
Cen
tral E
urop
e
4.2
0.36
Man
agem
ent
1745
3.7
0.44
Sou
th E
urop
e
1.5
0.80
Eco
nom
ics
1836
3.3
0.47
UK
and
Irel
and
2.
9 0.
56E
cono
mic
s 19
181.
7 0.
72S
outh
Eur
ope
2.
1 0.
67E
cono
mic
s 20
314.
0 0.
35La
tin A
mer
ica
5.
8 0.
32E
cono
mic
s 21
71.
3 0.
86N
orth
Am
eric
a
2.0
0.57
Eng
inee
ring
2213
1.2
0.92
Nor
th A
mer
ica
1.
2 0.
92E
cono
mic
s 23
181.
7 0.
72C
entra
l Eur
ope
1.
1 0.
94E
cono
mic
s 24
171.
9 0.
71N
orth
Eur
ope
4.
7 0.
29M
anag
emen
t 25
365.
8 0.
25C
entra
l Eur
ope
3.
9 0.
39G
eogr
aphy
26
232.
0 0.
70S
outh
Eur
ope
1.
3 0.
87E
cono
mic
s 27
302.
9 0.
53N
orth
Eur
ope
2.
1 0.
67E
cono
mic
s
23
2848
2.6
0.56
Cen
tral E
urop
e
1.2
0.90
Eco
nom
ics
2918
2.6
0.56
UK
and
Irel
and
1.
6 0.
78E
cono
mic
s 30
31.
8 0.
67U
K a
nd Ir
elan
d
3.0
0.33
Soc
iolo
gy/P
olic
y 31
261.
6 0.
77C
entra
l Eur
ope
1.
5 0.
81E
cono
mic
s 32
361.
2 0.
92C
entra
l Eur
ope
1.
9 0.
72E
cono
mic
s 33
41.
6 0.
75S
outh
Eur
ope
1.
0 1.
00H
isto
ry
346
1.0
1.00
Latin
Am
eric
a
2.0
0.67
Eco
nom
ics
3515
3.2
0.47
Cen
tral E
urop
e
1.1
0.93
Eco
nom
ics
3611
1.2
0.91
Cen
tral E
urop
e
2.6
0.55
Eco
nom
ics
3720
2.4
0.45
Nor
th/C
entra
l Eur
ope
4.9
0.40
Eco
nom
ics
385
1.5
0.80
Cen
tral E
urop
e
1.0
1.00
Eco
nom
ics
3913
2.3
0.54
Sou
th E
urop
e
1.2
0.92
Eco
nom
ics
407
1.0
1.00
Asi
a
1.7
0.71
Eco
nom
ics
4116
1.3
0.88
Cen
tral E
urop
e
2.7
0.56
Eco
nom
ics
4217
3.0
0.47
Sou
th E
urop
e
1.1
0.94
Eco
nom
ics
434
1.0
1.00
Nor
th A
mer
ica
2.
7 0.
50S
ocio
logy
44
191.
5 0.
79C
entra
l Eur
ope
4.
1 0.
42E
cono
mic
s 45
63.
0 0.
50C
entra
l Eur
ope
1.
0 1.
00E
cono
mic
s 46
122.
2 0.
58C
entra
l Eur
ope
2.
0 0.
50G
eogr
aphy
/Eco
nom
ics
476
2.0
0.50
UK
and
Irel
and/
Sou
th
Eur
ope
1.8
0.67
Eco
nom
ics
Not
e.
The
tabl
e pr
ovid
es in
form
atio
n on
the
geog
raph
ical
and
disc
iplin
ary
com
posit
ion
of th
e fo
rty-s
even
gro
ups (
iden
tifie
d th
roug
h th
e ap
plic
atio
n of
th
e N
ewm
an-G
irvan
met
hod)
as r
efle
cted
in th
e sh
are
of m
embe
rs c
omin
g fro
m th
e la
rges
t reg
ion
(disc
iplin
e) in
the
grou
p. T
he re
gion
(d
iscip
line)
list
ed to
the
right
of t
hat n
umbe
r is t
he o
ne w
ith th
e la
rges
t sha
re (w
hen
two
are
liste
d th
ese
are
of e
qual
siz
e). I
n ad
ditio
n th
e ta
ble
prov
ides
an
indi
cato
r of t
he e
xten
t to
whi
ch m
embe
rs a
re sp
read
am
ong
man
y re
gion
s (di
scip
lines
) or t
end
to c
once
ntra
te in
one
or a
few
regi
ons
(disc
iplin
es) o
nly.
Thi
s in
dica
tor -
the
soca
lled
Her
finda
hl in
dex
- is d
efin
ed a
s ∑ j
jx2
1, w
here
xj i
s the
sha
re o
f eith
er a
regi
on o
r disc
iplin
e in
the
tota
l mem
bers
hip
of th
e gr
oup
(for e
xam
ple,
xj c
ould
be
the
shar
e of
eco
nom
ists a
mon
g th
e m
embe
rs o
f the
gro
up).
The
smal
ler t
he in
dex,
the
mor
e ho
mog
enou
s a g
roup
will
be
in te
rms o
f reg
ions
(disc
iplin
es).
The
min
imum
val
ue o
f the
inde
x is
unity
, whi
ch m
eans
all
mem
bers
of t
he

24
grou
p be
long
to th
e sa
me
regi
on (
disc
iplin
e). T
he in
dex
reac
hes
its m
axim
um v
alue
(ide
ntic
al to
the
num
bers
of r
egio
ns (1
0) o
r disc
iplin
es (1
2))
whe
n th
e m
embe
rs a
re sp
read
equ
ally
am
ong
the
alte
rnat
ives
.