The Future of Rice Production and Consumptionageconsearch.umn.edu/bitstream/27145/1/35010128.pdf ·...
15
The Future of Rice Production and Consumption Masayoshi Kubo and Minjmaa Purevdorj Rice is the fundamental principal food for about half of the world’s population, and it supplies 20% of the calories consumed worldwide. Rice consumption increases with population. In the 21 st century, a large increase in population is anticipated. Most of the increase will occur in Asia and Africa, where the population lives on rice. The food problem will become as important as the environmental problem. We present basic data for thinking about the food problem in the future. In this research, we consider Asia, Africa, Europe, the Americas and Oceania as model areas and examine rice production and consumption in each area. We study rice-deficit areas, rice-surplus areas, and their total balance. rice consumption for industrial countries, and he uses harvest area and yield per hectare to predict production for developing countries, but no specific regional predictions were made, nor was research on transportation carried out. This paper studies rice production and consump- tion from the viewpoint of supply and demand in each region. Using population predictions through 2030 made by the United Nations and the U.S., production and consumption amounts for each re- gion are estimated through 2020. The surplus and deficit of rice in each region are investigated, and the amount of international grain-carrier demand (mainly sea transport) is calculated. Rice in the World Worldwide Supply and Demand for Cereal In 35 years, the cereal harvest area will increase 15% and the rice harvest area will increase 11% (Figure 1). The harvest area of rice composes about 23.5% of the cereal harvest area; rice accounts for 26.6% of worldwide cereal production and consumption. Rice is a principal food, especially in Asia, and its production worldwide has been growing steadily. Since rice production and consumption areas in Asia are areas of high population growth rates, the consumption of rice is growing steadily. Rice Protects Asian Areas from Starvation An important theme at the 1 st annual convention of the World Food Council (WFC) in 1974 was the prevention of starvation in Asia and Africa. The conclusion and recommendations at the 10 th an- Rice is the fundamental principal food for about half of the world’s population, supplying 20% of the calories consumed worldwide. Rice consumption increases with the population. In the 21 st century, a large population increase is predicted. Most of the increase will occur in Asia and Africa, where the population lives on rice. There are many indications that the food problem will become as important as the environmental problem. With mankind’s food crisis becoming an issue in the future (Schwartz 1991), this research seeks to clarify the future re- lationship of supply and demand of rice, which is intimately connected with Asia. The International Rice Research Institute (IRRI 2000) studied the food problem in relation to world population, and they predict that 800 million tons of rice will be required in 2025. The Food and Agriculture Organization (FAO) reported that worldwide rice production is currently expanding by 1.3%—slightly less than the 1.9% growth rate between 1984 and 1994—and they predict pro- duction to reach 424 million tons and demand to reach 422 million tons by 2005 (FAO 2000). The FAO report makes a prediction for the world and for Asian nations only through 2005; longer-term predictions are not made. Yap (1997) conducted research on the main factors that may have a negative influence on the supply and demand for rice in the future. He predicted that rice consumption worldwide would be 482 million tons in 2010, with 19 million tons consumed in industrial countries and 463 million tons in developing countries. Yap predicts per-capita The authors are members of the Faculty of Maritime Sciences, Kobe University, Japan.
Transcript of The Future of Rice Production and Consumptionageconsearch.umn.edu/bitstream/27145/1/35010128.pdf ·...
The Future of Rice Production and ConsumptionMasayoshi Kubo and Minjmaa Purevdorj
Rice is the fundamental principal food for about half of the world’s population, and it supplies 20% of the calories consumed worldwide. Rice consumption increases with population. In the 21st century, a large increase in population is anticipated. Most of the increase will occur in Asia and Africa, where the population lives on rice. The food problem will become as important as the environmental problem. We present basic data for thinking about the food problem in the future. In this research, we consider Asia, Africa, Europe, the Americas and Oceania as model areas and examine rice production and consumption in each area. We study rice-deficit areas, rice-surplus areas, and their total balance.
rice consumption for industrial countries, and he uses harvest area and yield per hectare to predict production for developing countries, but no specific regional predictions were made, nor was research on transportation carried out.
This paper studies rice production and consump-tion from the viewpoint of supply and demand in each region. Using population predictions through 2030 made by the United Nations and the U.S., production and consumption amounts for each re-gion are estimated through 2020. The surplus and deficit of rice in each region are investigated, and the amount of international grain-carrier demand (mainly sea transport) is calculated.
Rice in the World
Worldwide Supply and Demand for Cereal
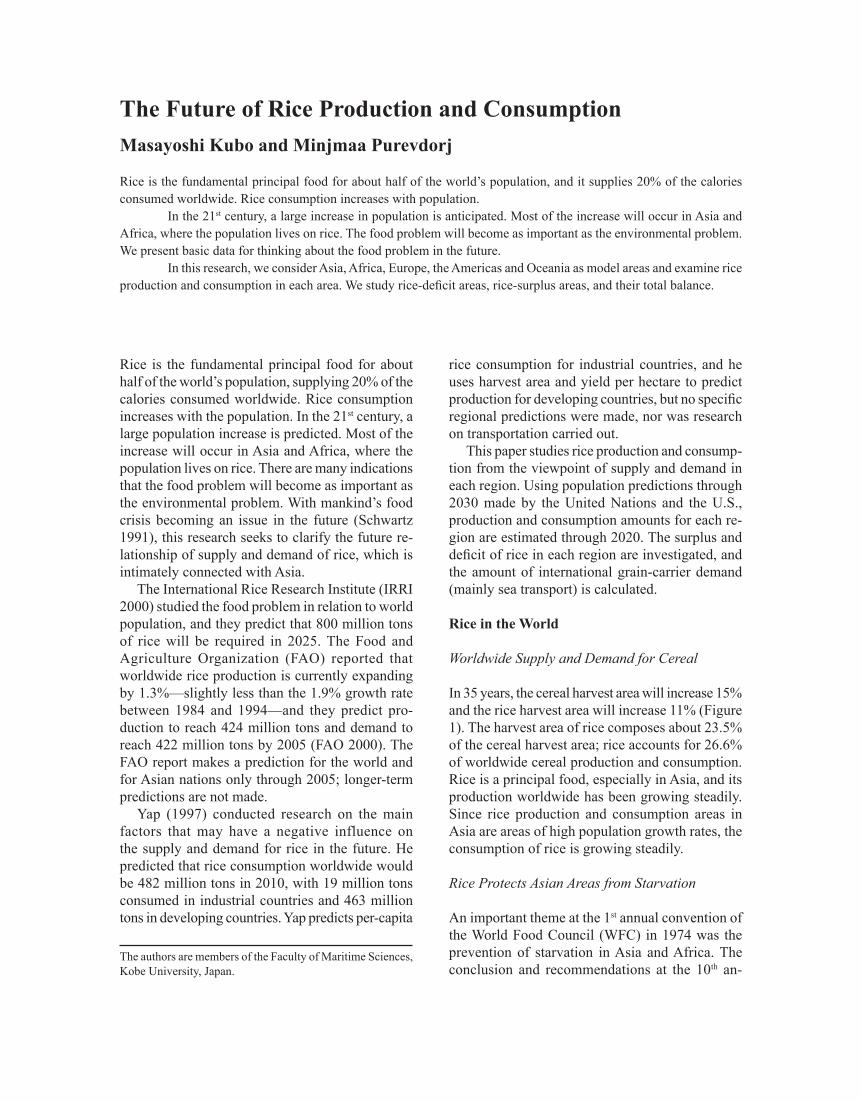
In 35 years, the cereal harvest area will increase 15% and the rice harvest area will increase 11% (Figure 1). The harvest area of rice composes about 23.5% of the cereal harvest area; rice accounts for 26.6% of worldwide cereal production and consumption. Rice is a principal food, especially in Asia, and its production worldwide has been growing steadily. Since rice production and consumption areas in Asia are areas of high population growth rates, the consumption of rice is growing steadily.
Rice Protects Asian Areas from Starvation
An important theme at the 1st annual convention of the World Food Council (WFC) in 1974 was the prevention of starvation in Asia and Africa. The conclusion and recommendations at the 10th an-
Rice is the fundamental principal food for about half of the world’s population, supplying 20% of the calories consumed worldwide. Rice consumption increases with the population. In the 21st century, a large population increase is predicted. Most of the increase will occur in Asia and Africa, where the population lives on rice. There are many indications that the food problem will become as important as the environmental problem. With mankind’s food crisis becoming an issue in the future (Schwartz 1991), this research seeks to clarify the future re-lationship of supply and demand of rice, which is intimately connected with Asia.
The International Rice Research Institute (IRRI 2000) studied the food problem in relation to world population, and they predict that 800 million tons of rice will be required in 2025. The Food and Agriculture Organization (FAO) reported that worldwide rice production is currently expanding by 1.3%—slightly less than the 1.9% growth rate between 1984 and 1994—and they predict pro-duction to reach 424 million tons and demand to reach 422 million tons by 2005 (FAO 2000). The FAO report makes a prediction for the world and for Asian nations only through 2005; longer-term predictions are not made.
Yap (1997) conducted research on the main factors that may have a negative influence on the supply and demand for rice in the future. He predicted that rice consumption worldwide would be 482 million tons in 2010, with 19 million tons consumed in industrial countries and 463 million tons in developing countries. Yap predicts per-capita
The authors are members of the Faculty of Maritime Sciences, Kobe University, Japan.

Kubo and Purevdoj The Future of Rice Production and Consumption 129
nual convention in 1984 were to work to eradicate starvation around the world within the 20th century and to emphasize the importance of food strategies to solve the serious food problem, which occurs mainly in Africa (Imoki 1984). Asian starvation was almost solved during those 10 years; countries such as India and China that had serious problems at that time have now become self-sufficient.
Method of Research
Rice production varies greatly in each country from year to year, so a country may be an import country one year and an export country the next. It is there-fore very difficult to build a long-term prediction model. In this paper, we look at the rice problem by continent. Looking at each region individually, the annual change becomes very smooth, and the relationship between the production and consump-tion of rice can be obtained. The annual changes in production and consumption thereby become smooth, and we can improve the approximating precision of the function.
We used data from the annual production report by the United Nations and the FAO to consider the
population changes in each country from 1961 to 2000 and examine various changes in rice condi-tions. The regions investigated are Asia, Africa, Europe, the Americas, Oceania, and the world as a whole. Since 40 years of data are being used, we think that it is possible to make predictions 30 years in the future.
Figure 2 shows the scheme of our model. The factors used to predict rice production in each region of the world are harvest area and yield per hectare; an approximating model of rice production quantity is developed for each region. The harvest area and yield per hectare are applied to a logistics function and a linear function. The function with the highest correlation will be used as a prediction model.
The relationship between population and rice consumption is approximated by simple and mul-tiple regression curves. An approximating model for rice consumption is developed using population as a variable, and predictions are made.
Trends in Rice Production
Rice production worldwide and in each region tends to increase with yield per hectare and harvest area.
����������������������������������
�
���
���
���
���
���
���
���
���� ���� ���� ���� ���� ���� ���� ����
�������������
�
���
����
����
����
����
����
����
����
����
�����������������
cereals ricecereals rice
mil.h kg/haharvestyield
����������������������������������
����
����
����
����
����
����
��������
��
��
��
��
��
��
��
��
���� ���� ���� ���� ���� ���� ���� ����
harvest area�
��������������������������������������������
�
���
����
����
����
����
���� ���� ���� ���� ���� ���� ���� ����
����������
�
���
����
����
����
����
�����������
�������������������������������������������������� �� �������
��� �����
���������������������������������
��
��
��
��
��
��
��
��
��
���� ���� ���� ���� ���� ���� ���� ����
productionconsumption
�
Figure 1. Annual Shares of Rice Cereal World Wide.
Sources: 1) Sekaikokuseize, 1964-2002, Yano Tune Budo Foundation, Japan. 2) International Statistical Yearbook, 1998. (note: This totals are comprised of the total of wheat and the fault grain cereals, the cereal year is measured from July to June, and consumption = production + imports – exports.)

130 March 2004 Journal of Food Distribution Research 35(1)
As shown in Figure 3, since the green revolution in the latter half of the 1960s, yield per hectare in Asia has increased from 2014 kg/ha to 3960 kg/ha. This increasing trend is consistent with the trend around the world. The green revolution became the moti-vating force for the diffusion of new rice varieties which produced a high yield per hectare (Yamada 1997). In other words, the expansion of rice produc-tion was brought on by the improvement of yield per hectare, or the improvement of technology.
The yield per hectare in Oceania is the highest in the world. The first successful harvest of rice in
Oceania took place in 1911. The yield per hectare has increased from 4242 kg/ha to 11,658 kg/ha in the past 40 years due to favorable environmental conditions and technological improvements. The yield per hectare also has increased steadily in the Americas with technological improvements.
In Africa, the yield per hectare increased from 1514 kg/ha to 2230 kg/ha over the past 40 years. However, it is the lowest in the world; Figure 3 shows that improvements are not clearly visible. This may be due to factors such as low production technology and highland cultivation.
Production.Production.EqEq Consumption.Consumption.EqEq
EstimationEstimation
PopulationPopulation
Per capitaPer capitaYield per hectareYield per hectare
Harvest areaHarvest area
TransportationTransportation
Future populationFuture population
Scarcity,Surplus and Total BalanceScarcity,Surplus and Total Balance
YearYear
Figure 2. Scheme of the Rice Model.
0
3000
6000
9000
12000
1960 1970 1980 1990 2000years
yiel
d pe
r he
ctar
e(kg
/ha)
OceaniaAmericaAsiaWorldAfrica
Figure 3. Yield Per Hectare of Rice in Each Region.
Sources: 1) Sekaikokuseize, 1964-2002, Yano Tune Budo Foundation, Japan. 2) International Statistical Yearbook, 1998.
Kubo and Purevdoj The Future of Rice Production and Consumption 131
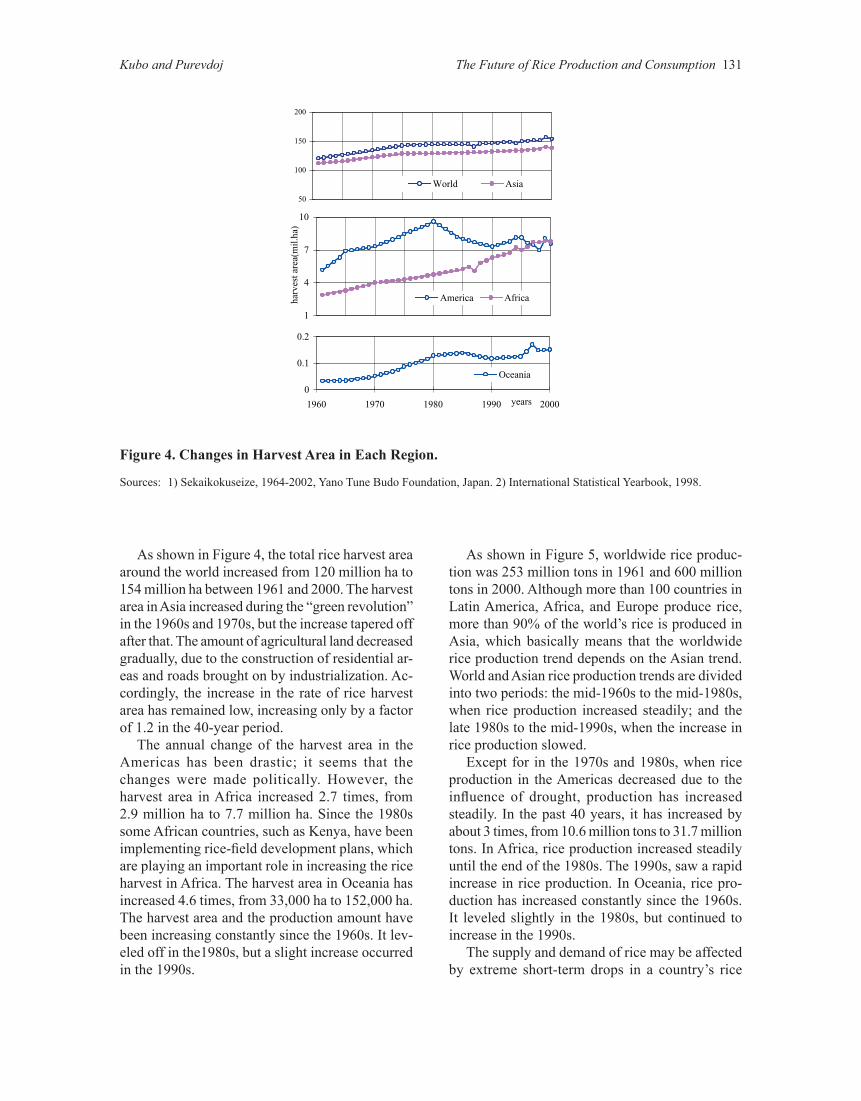
As shown in Figure 4, the total rice harvest area around the world increased from 120 million ha to 154 million ha between 1961 and 2000. The harvest area in Asia increased during the “green revolution” in the 1960s and 1970s, but the increase tapered off after that. The amount of agricultural land decreased gradually, due to the construction of residential ar-eas and roads brought on by industrialization. Ac-cordingly, the increase in the rate of rice harvest area has remained low, increasing only by a factor of 1.2 in the 40-year period.
The annual change of the harvest area in the Americas has been drastic; it seems that the changes were made politically. However, the harvest area in Africa increased 2.7 times, from 2.9 million ha to 7.7 million ha. Since the 1980s some African countries, such as Kenya, have been implementing rice-field development plans, which are playing an important role in increasing the rice harvest in Africa. The harvest area in Oceania has increased 4.6 times, from 33,000 ha to 152,000 ha. The harvest area and the production amount have been increasing constantly since the 1960s. It lev-eled off in the1980s, but a slight increase occurred in the 1990s.
As shown in Figure 5, worldwide rice produc-tion was 253 million tons in 1961 and 600 million tons in 2000. Although more than 100 countries in Latin America, Africa, and Europe produce rice, more than 90% of the world’s rice is produced in Asia, which basically means that the worldwide rice production trend depends on the Asian trend. World and Asian rice production trends are divided into two periods: the mid-1960s to the mid-1980s, when rice production increased steadily; and the late 1980s to the mid-1990s, when the increase in rice production slowed.
Except for in the 1970s and 1980s, when rice production in the Americas decreased due to the influence of drought, production has increased steadily. In the past 40 years, it has increased by about 3 times, from 10.6 million tons to 31.7 million tons. In Africa, rice production increased steadily until the end of the 1980s. The 1990s, saw a rapid increase in rice production. In Oceania, rice pro-duction has increased constantly since the 1960s. It leveled slightly in the 1980s, but continued to increase in the 1990s.
The supply and demand of rice may be affected by extreme short-term drops in a country’s rice
50
100
150
200
World Asia
1
4
7
10
harv
est a
rea(
mil.
ha)
America Africa
0
0.1
0.2
1960 1970 1980 1990 2000years
Oceania
Figure 4. Changes in Harvest Area in Each Region.
Sources: 1) Sekaikokuseize, 1964-2002, Yano Tune Budo Foundation, Japan. 2) International Statistical Yearbook, 1998.

132 March 2004 Journal of Food Distribution Research 35(1)
production due to drought. When that happens, the price of rice suddenly rises to make up for the deficit, and the freight costs of cereal bulk carriers also rise suddenly. Figure 5 shows that American rice production fell significantly several times dur-ing from 1960 to 2000. Such short-term problems, however, are not covered in this research.
Climate is an important factor for predicting rice production in each country. For global scale predictions like the FAO’s, climate change is not counted as a variable. In this paper, continents are treated as units, so climate is not introduced as an explanatory variable.
To accurately predict rice production in each region of the world, the year was taken as a vari-able. Because production is the product of the yield per hectare and the harvest area, we obtained the annual changes of these factors and then tried to obtain their approximation equations. However, an-nual changes in yield and area are drastic, as seen in the American example, so it is difficult to apply a simple function. Therefore the year is adopted as a variable. As shown in equation (1), regression analysis is performed for rice production, with the year adopted as the explanatory variable:
P0(t) = 9.9746 t – 19344 DW = 1.03 (45.5**) (44.5**) R2 = 0.982 R = 0.991 F = 2064**
P1(t) = 9.0403 t – 17528 DW = 0.75 (48.5**) (47.5**) R2 = 0.984 R = 0.992 F = 2353**
P2(t) = 0.5173 t – 1003.6(1) DW = 1.73 (20.8**) (20.4**)
R2 = 0.919 R = 0.959 F = 434**
P3(t) = 0.3025 t – 589.3 DW = 0.22 (18.3**) (17.9**) R2 = 0.897 R = 0.947 F = 332**
P4(t) = 0.03167 t – 62.08 DW = 1.47 (17.3**) (17.1**) R2 = 0.887 R = 0.942 F = 299**
where z is the region (0 = World, 1 = Asia, 2 = Americas, 3 = Africa, 4 = Oceania), Pz is the pro-duction of rice (million tons) in region z, and t is the year. T-values are in parentheses, and ** indi-cates a 1% level of significance. The coefficients of determination and multiple correlation are high. From this, the applicability of the model can be considered fairly good.
3
11
19
27
35
prod
ucti
on(m
il.t�
AmericaAfrica
0
1
2
1960 1970 1980 1990 2000years
Oceania
130
260
390
520
650
World
Asia
Figure 5. Changes in Rice Production in Each Region.
Sources: 1) Sekaikokuseize, 1964-2002, Yano Tune Budo Foundation, Japan. 2) International Statistical Yearbook, 1998.
Kubo and Purevdoj The Future of Rice Production and Consumption 133
Relationship between Population and Rice Consumption
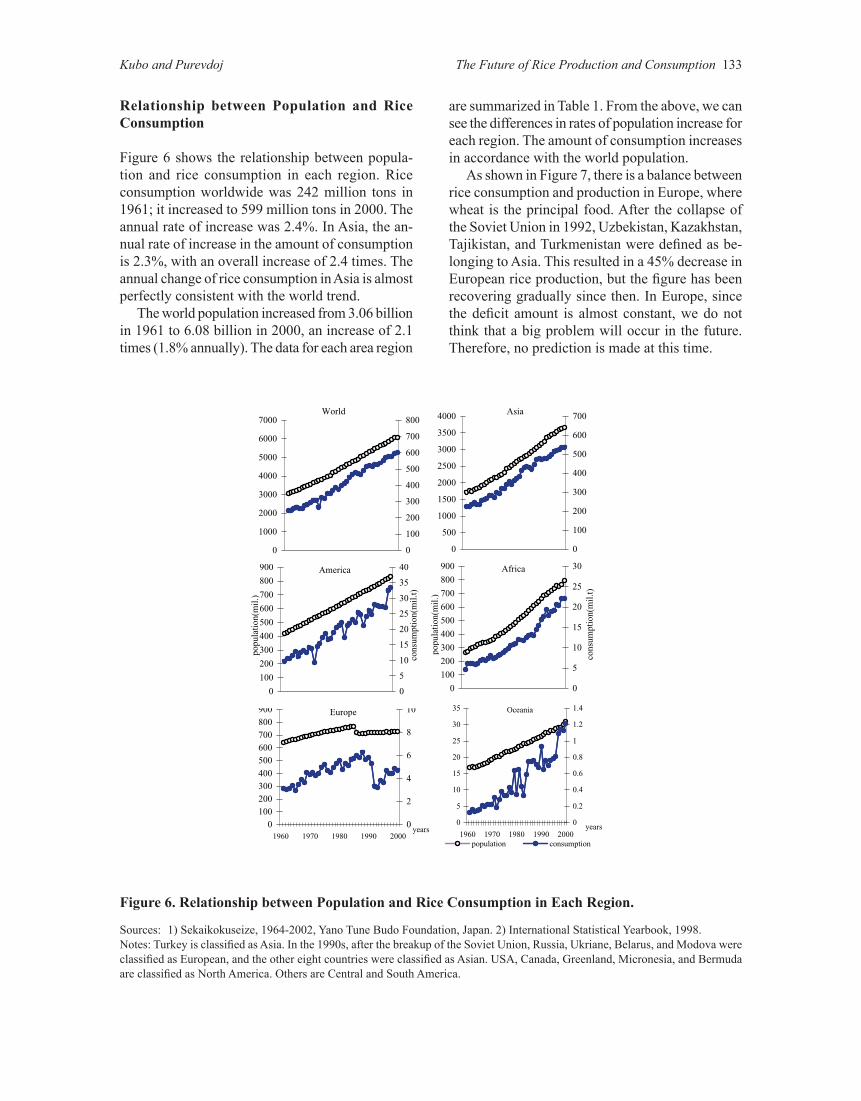
Figure 6 shows the relationship between popula-tion and rice consumption in each region. Rice consumption worldwide was 242 million tons in 1961; it increased to 599 million tons in 2000. The annual rate of increase was 2.4%. In Asia, the an-nual rate of increase in the amount of consumption is 2.3%, with an overall increase of 2.4 times. The annual change of rice consumption in Asia is almost perfectly consistent with the world trend.
The world population increased from 3.06 billion in 1961 to 6.08 billion in 2000, an increase of 2.1 times (1.8% annually). The data for each area region
are summarized in Table 1. From the above, we can see the differences in rates of population increase for each region. The amount of consumption increases in accordance with the world population.
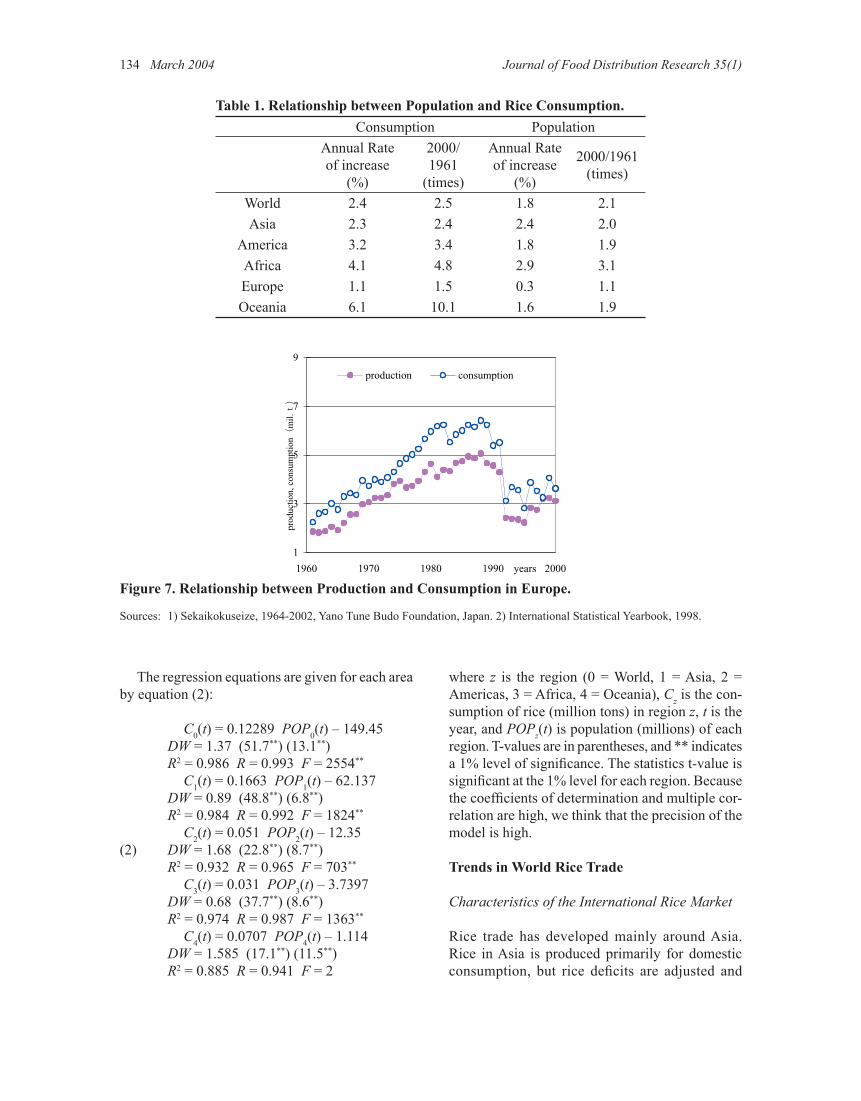
As shown in Figure 7, there is a balance between rice consumption and production in Europe, where wheat is the principal food. After the collapse of the Soviet Union in 1992, Uzbekistan, Kazakhstan, Tajikistan, and Turkmenistan were defined as be-longing to Asia. This resulted in a 45% decrease in European rice production, but the figure has been recovering gradually since then. In Europe, since the deficit amount is almost constant, we do not think that a big problem will occur in the future. Therefore, no prediction is made at this time.
Asia
0
500
1000
1500
2000
2500
3000
3500
4000
0
100
200
300
400
500
600
700
Africa
0
100
200
300
400
500
600
700
800
900
0
5
10
15
20
25
30
popu
latio
n(m
il.)
cons
umpt
ion(
mil.
t)
Europe
0100200300400500600700800900
1960 1970 1980 1990 2000years
0
2
4
6
8
10
America
0
100
200
300
400
500
600
700
800
900
0
5
10
15
20
25
30
35
40
popu
latio
n(m
il.)
cons
umpt
ion(
mil.
t)
Oceania
0
5
10
15
20
25
30
35
1960 1970 1980 1990 2000years0
0.2
0.4
0.6
0.8
1
1.2
1.4
population consumption
World
0
1000
2000
3000
4000
5000
6000
7000
0
100
200
300
400
500
600
700
800
Figure 6. Relationship between Population and Rice Consumption in Each Region.
Sources: 1) Sekaikokuseize, 1964-2002, Yano Tune Budo Foundation, Japan. 2) International Statistical Yearbook, 1998.Notes: Turkey is classified as Asia. In the 1990s, after the breakup of the Soviet Union, Russia, Ukriane, Belarus, and Modova were classified as European, and the other eight countries were classified as Asian. USA, Canada, Greenland, Micronesia, and Bermuda are classified as North America. Others are Central and South America.
134 March 2004 Journal of Food Distribution Research 35(1)
The regression equations are given for each area by equation (2):
C0(t) = 0.12289 POP0(t) – 149.45 DW = 1.37 (51.7**) (13.1**) R2 = 0.986 R = 0.993 F = 2554**
C1(t) = 0.1663 POP1(t) – 62.137 DW = 0.89 (48.8**) (6.8**) R2 = 0.984 R = 0.992 F = 1824**
C2(t) = 0.051 POP2(t) – 12.35(2) DW = 1.68 (22.8**) (8.7**)
R2 = 0.932 R = 0.965 F = 703**
C3(t) = 0.031 POP3(t) – 3.7397 DW = 0.68 (37.7**) (8.6**) R2 = 0.974 R = 0.987 F = 1363**
C4(t) = 0.0707 POP4(t) – 1.114 DW = 1.585 (17.1**) (11.5**) R2 = 0.885 R = 0.941 F = 2
where z is the region (0 = World, 1 = Asia, 2 = Americas, 3 = Africa, 4 = Oceania), Cz is the con-sumption of rice (million tons) in region z, t is the year, and POPz(t) is population (millions) of each region. T-values are in parentheses, and ** indicates a 1% level of significance. The statistics t-value is significant at the 1% level for each region. Because the coefficients of determination and multiple cor-relation are high, we think that the precision of the model is high.
Trends in World Rice Trade
Characteristics of the International Rice Market
Rice trade has developed mainly around Asia. Rice in Asia is produced primarily for domestic consumption, but rice deficits are adjusted and
Table 1. Relationship between Population and Rice Consumption.Consumption Population
Annual Rate of increase
(%)
2000/1961
(times)
Annual Rate of increase
(%)
2000/1961 (times)
World 2.4 2.5 1.8 2.1Asia 2.3 2.4 2.4 2.0
America 3.2 3.4 1.8 1.9Africa 4.1 4.8 2.9 3.1Europe 1.1 1.5 0.3 1.1Oceania 6.1 10.1 1.6 1.9
1
3
5
7
9
1960 1970 1980 1990 2000years
prod
uctio
n, c
onsu
mpt
ion�
mil.��
production consumption
Figure 7. Relationship between Production and Consumption in Europe.
Sources: 1) Sekaikokuseize, 1964-2002, Yano Tune Budo Foundation, Japan. 2) International Statistical Yearbook, 1998.

Kubo and Purevdoj The Future of Rice Production and Consumption 135
supplemented between neighboring countries. As shown in Figure 8, a worldwide food crisis occurred in 1973, and this led to an increase in the amount of the rice traded around the world. Trade continued to increase from the late 1970s to the early 1980s. In the 1980s a worldwide surplus in agricultural prod-ucts had an influence on rice trade. Each country strengthened its agriculture protection policies as a result of the food crisis in 1973–74. Both exporting and importing countries increased production, so the demand for imports stagnated rapidly after 1980. These changes in the rice trade continued until the end of the 1980s.
In order to stop the vicious circle of financial expansion caused by the increased production and stockpiling of agricultural products, and to adjust the interests of each country, the General Agreement on Tariffs and Trade (GATT) Uruguay Round agriculture negotiations began in September 1986. The results began to affect the international rice market in the 1990s, and the amount of trade increased rapidly.
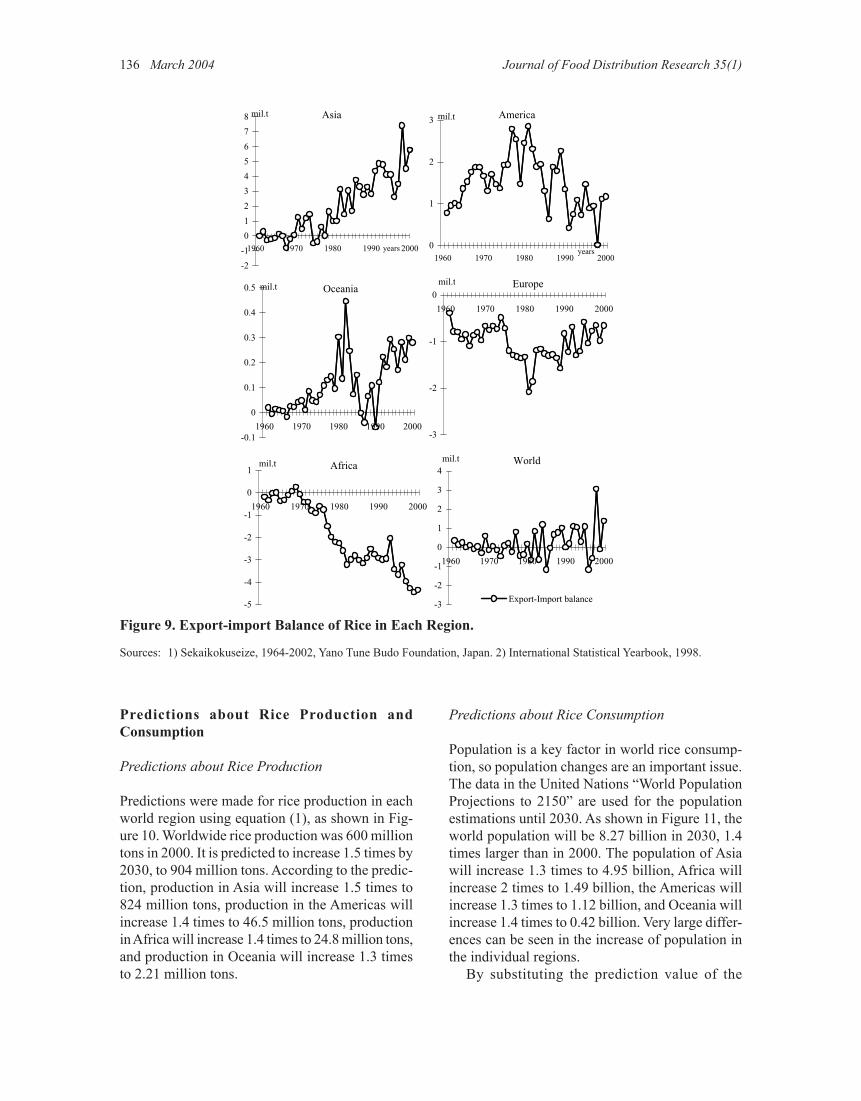
Figure 9 shows the trend of world trade, which fluctuates considerably. One reason for this is that rice is produced and consumed in each region, and 90% of production and consumption occurs in Asia. The production area is concentrated, so changes in world rice trade are drastic. Asia followed a policy of self-sufficiency in the 1960s and 1970s; this was maintained even in the major importing countries until the 1980s. With the improvement of self-suf-
ficiency rates in the 1990s, Asia exported a surplus of 5.7 million tons in 2000.
The Americas were a rice-exporting area before the 1980s. Policies weakened price competitive-ness, causing a rapid decline in rice exports in 1985. Rice exports at the world market price were made possible by the agriculture law in 1985, so exports began to recover after 1986. Consumption increased in the 1990s, so exports decreased.
Oceania increased production and exports after 1960. In the 1980s, rice production decreased with the onset of drought, and rice exports also de-creased. In the 1990s there was a slight recovery, and this trend continued through the present.
In Europe, imports of rice from the Americas continued to increase from the 1960s until the begin-ning of the 1990s. India, Indonesia, and Burma were colonies of France and the UK, and when the Suez Canal was opened the import of rice from Southeast Asia increased. Imports have been decreasing since the 1990s due to the collapse of the Soviet Union. In 1961, 1.15 million tons were imported; in 2000, 0.65 million tons were imported.
In Africa, the amount of foreign currency in-creased in the 1970s due to rapid economic devel-opment and the rise in crude oil prices, causing imports of rice to increase rapidly. Since the 1980s, rice imports have been expanding rapidly. In 2000, the import surplus of rice in Africa reached 4.35 million tons, making it the top rice-importing region in the world.
-10
0
10
20
30
1960 1970 1980 1990 2000years
impo
rt a
nd e
xpor
t (m
il.t�
ExportImportExport-Import
Figure 8. World-wide Changes in Rice Trade.
Sources: 1) Sekaikokuseize, 1964-2002, Yano Tune Budo Foundation, Japan. 2) International Statistical Yearbook, 1998.
136 March 2004 Journal of Food Distribution Research 35(1)
Predictions about Rice Production and Consumption
Predictions about Rice Production
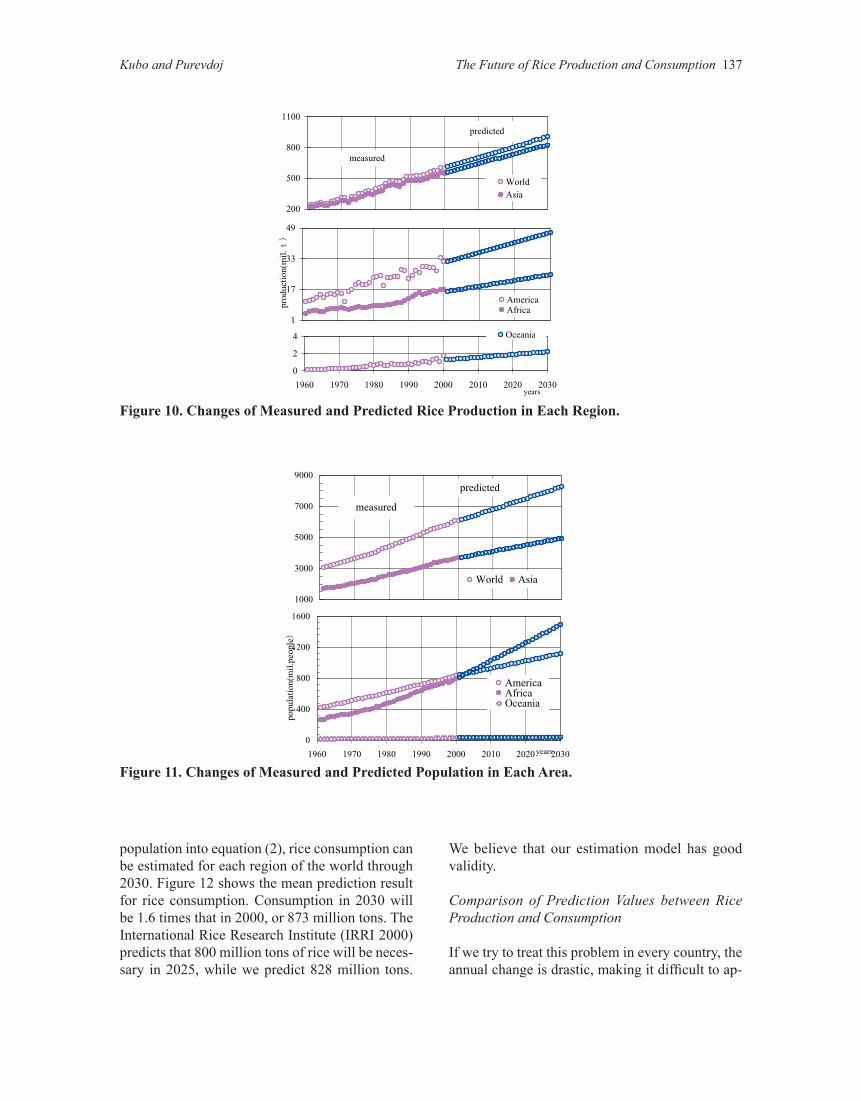
Predictions were made for rice production in each world region using equation (1), as shown in Fig-ure 10. Worldwide rice production was 600 million tons in 2000. It is predicted to increase 1.5 times by 2030, to 904 million tons. According to the predic-tion, production in Asia will increase 1.5 times to 824 million tons, production in the Americas will increase 1.4 times to 46.5 million tons, production in Africa will increase 1.4 times to 24.8 million tons, and production in Oceania will increase 1.3 times to 2.21 million tons.
Predictions about Rice Consumption
Population is a key factor in world rice consump-tion, so population changes are an important issue. The data in the United Nations “World Population Projections to 2150” are used for the population estimations until 2030. As shown in Figure 11, the world population will be 8.27 billion in 2030, 1.4 times larger than in 2000. The population of Asia will increase 1.3 times to 4.95 billion, Africa will increase 2 times to 1.49 billion, the Americas will increase 1.3 times to 1.12 billion, and Oceania will increase 1.4 times to 0.42 billion. Very large differ-ences can be seen in the increase of population in the individual regions.
By substituting the prediction value of the
America
0
1
2
3
1960 1970 1980 1990 2000years
mil.t
Africa
-5
-4
-3
-2
-1
0
1
1960 1970 1980 1990 2000
mil.t
Europe
-3
-2
-1
0
1960 1970 1980 1990 2000
mil.tOceania
-0.1
0
0.1
0.2
0.3
0.4
0.5
1960 1970 1980 1990 2000
mil.t
World
-3
-2
-1
0
1
2
3
4
1960 1970 1980 1990 2000
Export-Import balance
mil.t
Asia
-2
-1
0
1
2
3
4
5
6
7
8
1960 1970 1980 1990 2000years
mil.t
Figure 9. Export-import Balance of Rice in Each Region.
Sources: 1) Sekaikokuseize, 1964-2002, Yano Tune Budo Foundation, Japan. 2) International Statistical Yearbook, 1998.
Kubo and Purevdoj The Future of Rice Production and Consumption 137
population into equation (2), rice consumption can be estimated for each region of the world through 2030. Figure 12 shows the mean prediction result for rice consumption. Consumption in 2030 will be 1.6 times that in 2000, or 873 million tons. The International Rice Research Institute (IRRI 2000) predicts that 800 million tons of rice will be neces-sary in 2025, while we predict 828 million tons.
We believe that our estimation model has good validity.
Comparison of Prediction Values between Rice Production and Consumption
If we try to treat this problem in every country, the annual change is drastic, making it difficult to ap-
200
500
800
1100
WorldAsia
measured
predicted
1
17
33
49
prod
uctio
n(m
il.��
AmericaAfrica
0
2
4
1960 1970 1980 1990 2000 2010 2020 2030years
Oceania
0
400
800
1200
1600
1960 1970 1980 1990 2000 2010 2020 2030years
popu
latio
n(m
il.pe
ople�
AmericaAfricaOceania
1000
3000
5000
7000
9000
World Asia
measured
predicted
Figure 10. Changes of Measured and Predicted Rice Production in Each Region.
Figure 11. Changes of Measured and Predicted Population in Each Area.

138 March 2004 Journal of Food Distribution Research 35(1)
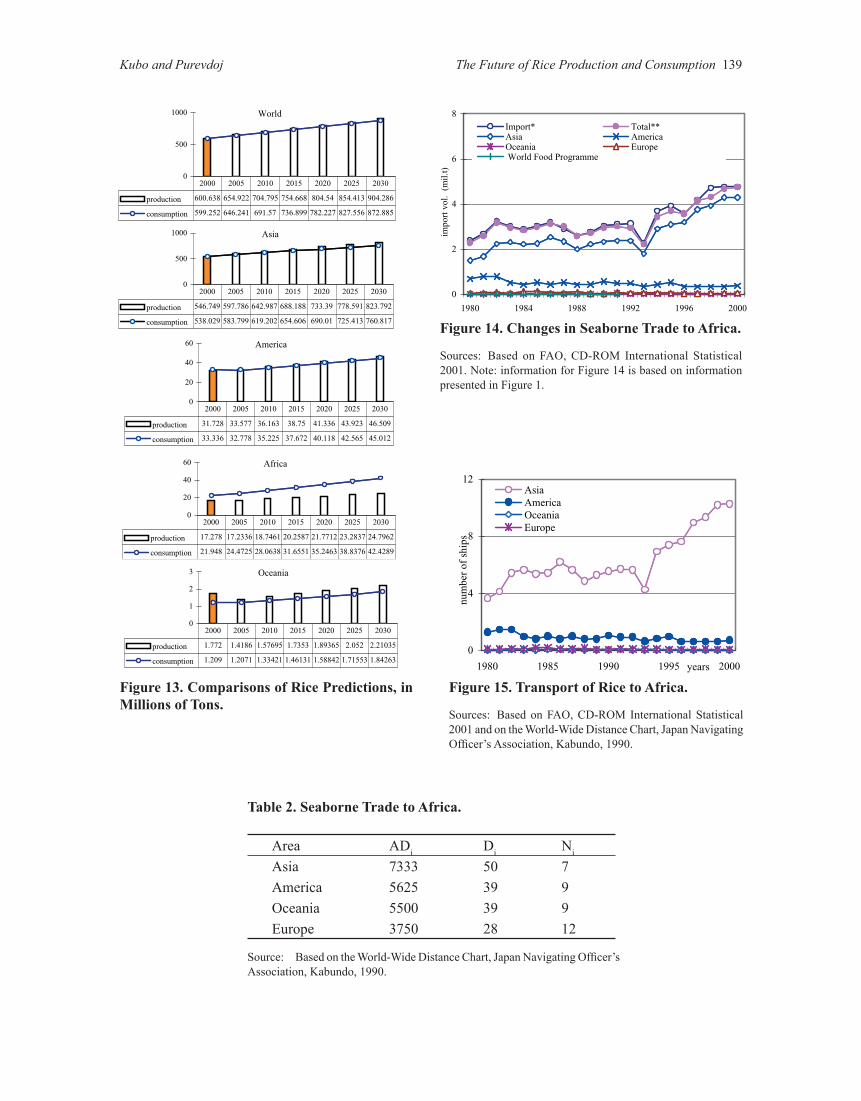
proximate the tendency by a simple function. We overcame this problem by treating the subject on a continental scale. This approach enables us to understand which regions are in deficit and which are in surplus. The prediction values for rice con-sumption and production are shown in Figure 13. The system of self-sufficiency will continue in Asia, but an enormous shortage of rice is anticipated in Africa. Although rice consumption will increase in the Americas and Oceania, these regions will continue to export rice.
Rice Shipments to Africa
Maritime Transport to Africa
The amount of rice exported to Africa is examined using FAO data. Export countries were examined, and the results are shown in Figure 14. The number of vessel navigation days per year is thought to be 95% of 365 days. The number of navigation days, the annual number of voyages, and the required annual number of ships in the export navigation route to Africa from each region were found using the following equations. The results are shown in Table 2 and Figure 15.
(3) Di = ADi
× 2 + DED + DIU
v × 24
365 × 0.95(4) Ni = Di
(5) TSi = Wi
DWT × Ni
Di is navigation days necessary for making the circuit between region i (1 = Asia, 2 = Americas, 3 = Africa, 4 = Oceania), ADi is navigation distance from region i to Africa (miles), v is the speed of the grain bulk carrier (miles/hour), DED is the days required to enter and depart ports in one circuit (3 days), DLU is the days required to load and unload in ports in one circuit (3 days), Ni is the annual number of voyages from region i, TSi is the number of ships required for region i, Wi is the amount of annual transportation from region i to Africa (tons), DWT is the dead-weight tonnage of a grain bulk carrier (60,000DWT). From the above results, four grain carriers from Asia and one from the Americas were required in 1980. In 2000, ten carriers from Asia and one from the Americas were required.
5
20
35
50
cons
umpt
ion(
mil.
t)
AmericaAfrica
100
400
700
1000
WorldAsiaIRRI
measured
predicted
0
1
2
1960 1970 1980 1990 2000 2010 2020 2030years
Oceania
Figure 12. Changes in Measured and Predicted Rice Consumption in Each Area.
Kubo and Purevdoj The Future of Rice Production and Consumption 139
Asia
0
500
1000
production 546.749 597.786 642.987 688.188 733.39 778.591 823.792
consumption 538.029 583.799 619.202 654.606 690.01 725.413 760.817
2000 2005 2010 2015 2020 2025 2030
Africa
0
20
40
60
production 17.278 17.2336 18.7461 20.2587 21.7712 23.2837 24.7962
consumption 21.948 24.4725 28.0638 31.6551 35.2463 38.8376 42.4289
2000 2005 2010 2015 2020 2025 2030
America
0
20
40
60
production 31.728 33.577 36.163 38.75 41.336 43.923 46.509
consumption 33.336 32.778 35.225 37.672 40.118 42.565 45.012
2000 2005 2010 2015 2020 2025 2030
Oceania
0
1
2
3
production 1.772 1.4186 1.57695 1.7353 1.89365 2.052 2.21035
consumption 1.209 1.2071 1.33421 1.46131 1.58842 1.71553 1.84263
2000 2005 2010 2015 2020 2025 2030
World
0
500
1000
production 600.638 654.922 704.795 754.668 804.54 854.413 904.286
consumption 599.252 646.241 691.57 736.899 782.227 827.556 872.885
2000 2005 2010 2015 2020 2025 2030 ������
�����
0
2
4
6
8
1980 1984 1988 1992 1996 2000
impo
rt v
ol.
(mil.
t)
Import* Total**Asia AmericaOceania Europe World Food Programme
0
4
8
12
1980 1985 1990 1995 2000years
num
ber
of s
hips
AsiaAmericaOceaniaEurope
Table 2. Seaborne Trade to Africa.
Area ADi Di Ni
Asia 7333 50 7America 5625 39 9Oceania 5500 39 9Europe 3750 28 12
Source: Based on the World-Wide Distance Chart, Japan Navigating Officer’s Association, Kabundo, 1990.
Figure 13. Comparisons of Rice Predictions, in Millions of Tons.
Figure 14. Changes in Seaborne Trade to Africa.
Sources: Based on FAO, CD-ROM International Statistical 2001. Note: information for Figure 14 is based on information presented in Figure 1.
Figure 15. Transport of Rice to Africa.
Sources: Based on FAO, CD-ROM International Statistical 2001 and on the World-Wide Distance Chart, Japan Navigating Officer’s Association, Kabundo, 1990.

140 March 2004 Journal of Food Distribution Research 35(1)
Maritime Transport to Africa in the Future
The amounts of rice surplus and deficit in each re-gion in the future are shown in Figure 16. The deficit in African is 5 million tons at present. According to the prediction, it will reach 18 million tons in 2030. We examine which areas will compensate for Africa’s rice deficit in the future. In 1980, Asia’s share was 63%, as shown in Figure 17. In 2000, Asia’s share was 90%, America’s was 9.8%, and Oceania’s was 0.1%.
We researched the export share of each region compared to total African imports in the future. The export shares are plotted on the vertical axis of Figure 18, the years are plotted on the horizontal axis, and an approximated curve is given using a logarithmic function. The results are shown in fol-lowing equations:
log(ESasia) = 1.792 + 0.108log(t – 1979) R2 = 0.76(6) log(ESamerica) = 1.557 - 0.425log(t – 1979) R2 = 0.71
log(ESoceania) = -0.027 - 0.363log(t – 1979) R2 = 0.12
Figure 16. Surplus and Deficit Volume of Rice in Each Region.
Figure 17. Shares of Rice Exports to Africa.
4
44
84
Asia
-20
-15
-10
-5
0
5
2000 2010 2020 2030
years
surp
lus
and
defi
cot v
ol.�
mil.
t�
America
Oceania
Africa
0
20
40
60
80
100
1980 1984 1988 1992 1996 2000years
expo
rt s
hare
(%
)
Asia America Oceania
ES=61.93(t-1979)0.11
ES=36.1(t-1979)-0.43
Kubo and Purevdoj The Future of Rice Production and Consumption 141
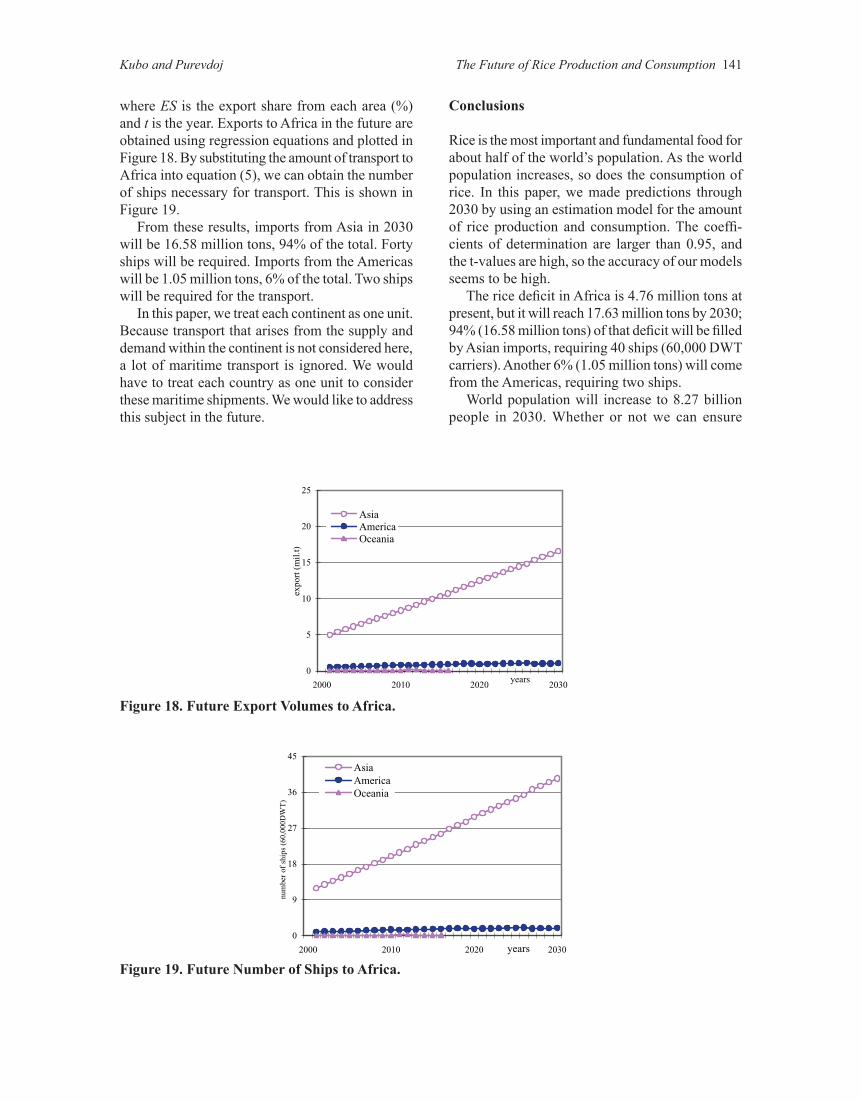
where ES is the export share from each area (%) and t is the year. Exports to Africa in the future are obtained using regression equations and plotted in Figure 18. By substituting the amount of transport to Africa into equation (5), we can obtain the number of ships necessary for transport. This is shown in Figure 19.
From these results, imports from Asia in 2030 will be 16.58 million tons, 94% of the total. Forty ships will be required. Imports from the Americas will be 1.05 million tons, 6% of the total. Two ships will be required for the transport.
In this paper, we treat each continent as one unit. Because transport that arises from the supply and demand within the continent is not considered here, a lot of maritime transport is ignored. We would have to treat each country as one unit to consider these maritime shipments. We would like to address this subject in the future.
Conclusions
Rice is the most important and fundamental food for about half of the world’s population. As the world population increases, so does the consumption of rice. In this paper, we made predictions through 2030 by using an estimation model for the amount of rice production and consumption. The coeffi-cients of determination are larger than 0.95, and the t-values are high, so the accuracy of our models seems to be high.
The rice deficit in Africa is 4.76 million tons at present, but it will reach 17.63 million tons by 2030; 94% (16.58 million tons) of that deficit will be filled by Asian imports, requiring 40 ships (60,000 DWT carriers). Another 6% (1.05 million tons) will come from the Americas, requiring two ships.
World population will increase to 8.27 billion people in 2030. Whether or not we can ensure
������
�����
0
5
10
15
20
25
2000 2010 2020 2030years
expo
rt (
mil.
t)
AsiaAmericaOceania
0
9
18
27
36
45
2000 2010 2020 2030years
num
ber
of s
hips
(60
,000
DW
T)
AsiaAmericaOceania
Figure 18. Future Export Volumes to Africa.
Figure 19. Future Number of Ships to Africa.
142 March 2004 Journal of Food Distribution Research 35(1)
enough rice for the increasing population will de-pend on rice production in Asia. Rice production exceeds consumption in Asia and the Americas, both of which will continue to be exporting areas.
References
FAO. 2000. “World Agriculture Towards 2005.” New York.
Imoki, A. 1984. “Rice Production and Consumption of the World.” The World International Problem Report.
IRRI. 2000. “Bigger Harvest a Cleaner Planet.”
http://www.irri.org/publications/annual/pdfs/ar2000/biggerharvests.pdf
Schwartz, S. J. 1991. “World Rise Trade: Prospects and Issue for the Nineties.” Rice Situation and Outlook Report. USDA Economic Research Service.
Yamada, S. 1997. “Appraisal and Future of the Green Revolution.” The Asian Population and Development Association Report, pp.95–102. March.
Yap, C. L. 1997 “Major Issue of Concern for the World Rice Economy in Medium Term.” FAO. International Rice Commission. Newsletter 46.