The future of industry in Europe
140
The future of industry in Europe
Transcript of The future of industry in Europe

The future of industry
in Europe

This report was written by Michele Alessandrini, Pietro Celotti,
Andrea Gramillano, and Marco Lilla (t33).
It does not represent the official views of the Committee of the Regions.
More information on the European Union and the Committee of the Regions is
available online at http://www.europa.eu and http://www.cor.europa.eu
respectively.
Catalogue number: QG-04-17-373-EN-N
ISBN: 978-92-895-0918-3
doi:10.2863/471264
© European Union, 2017
Partial reproduction is permitted, provided that the source is explicitly
mentioned.

Table of Contents
Executive Summary ................................................................................................. 1
1. Industry in Europe and its regions ................................................................... 3
1.1 Industry in the European regions: an overview ............................................. 5
1.2 Trade specialisation and attractiveness of European regions ...................... 10
1.3 Workers in industry ..................................................................................... 16
1.4 Innovation in industry .................................................................................. 23
2. The future of traditional industries and industries of the future: the
evolving reality of industry in a global context ............................................. 27
2.1 Towards a new vision for a future oriented EU industrial policy .................. 27
2.2 The changing role of industry in the global economy ................................... 31
3. Key challenges for European industry and their territorial implications . 45
3.1 Designing the pattern of industrial specialisation .......................................... 46
3.2 Enhancing industrial enterprise efficiency in the use of inputs ..................... 51
3.3 Supporting industrial enterprises to become more market connected ........... 53
3.4 Adapt institutional capabilities to new industrial challenges ......................... 56
4. How LRAs are responding to the challenges ................................................... 59
4.1 LRAs designing the pattern of industrial specialisation ................................ 60
4.2 LRAs supporting industrial enterprise efficiency for using inputs ................ 69
4.3 LRAs supporting industry become more market connected .......................... 75
4.4 LRAs adopting solutions to be more responsive to industrial enterprise
needs ............................................................................................................. 78
5. Conclusions and recommendations .................................................................. 81
Annex 1. Maps and figures .................................................................................... 85
Annex II. Methodology ........................................................................................ 113
Annex III. References .......................................................................................... 123
Annex IV. Main findings, recommendations and policy options (Power
Point presentation) ................................................................................... 131


List of abbreviations CoR Committee of the Regions
EC European Commission
EPO European Patent Office
ESPON European Observation Network, Territorial Development and
Cohesion
ET 2020 Education and Training 2020
EU European Union
EU15 Austria (AT), Belgium (BE), Denmark (DK), Finland (FI), France
(FR), Germany (DE), Greece (EL), Ireland (IE), Italy (IT),
Luxembourg (LU), Netherlands (NL), Portugal (PT), Spain (ES),
Sweden (SE), United Kingdom (UK)
EU13 Bulgaria (BG), Croatia (HR), Cyprus (CY), Czech Republic (CZ),
Estonia (EE), Hungary (HU), Latvia (LV), Lithuania (LT), Malta
(MT), Poland (PL), Romania (RO), Slovakia (SK), Slovenia (SI)
FDI Foreign Direct Investment
GDP Gross Domestic Product
ICT Information and Communication Technology
IoT Internet of Things
KIT Knowledge, Innovation, Territory
LRAs Local Regional Authorities
NEET Not in Education, Employment or Training
NUTS Nomenclature of Units for Territorial Statistics
OECD Organisation for Economic Co-operation and Development
OSCE Organisation for Security and Co-operation in Europe
R&D Research and Development
RDTI Research, Development, Technology and Innovation
RIS3 Research and Innovation Strategy for Smart Specialisation


1
Executive Summary
This study analyses the key challenges for Local and Regional Authorities
(LRAs) in developing a long-term, structured industrial policy, with a global
view. The policy should promote structural change and raise the industrial
contribution to GDP to the 20% target set by the European Commission (EC) in
December 2014.
New means of production incorporate a mix of processes located in both high-
cost and low-cost countries and are based on a wide range of factors enabled by
technological developments. Significant changes in consumption are
increasingly driven by individual needs which are more sensitive to social and
environmental aspects. Together these require a more flexible, hybrid and
servitisation-oriented industrial paradigm.
The way LRAs can guide this shift strictly depends on their ability to combine
strengths in traditional sectors with innovative trajectories of industrial
development in dynamic new sectors. Faced with a growing complexity of
industrial challenges, LRAs are called on to design and implement a systemic
industrial policy coordinated with national and EU level policies, pulled by
vision and pushed by competition.
The report is structured as follows:
• Chapter 1 presents an overview of the current situation of industry in
European Union (EU) regions. It describes trends of industrial
specialisation in regions, the key characteristics of industrial enterprises,
trade specialisation in EU regions and their capacity to attract foreign
direct investments (FDI). It then focuses on key characteristics of the
industrial labour force, such as the role of education and labour
productivity. It also offers an analysis of regional industrial capacity to
innovate and invest in R&D. Finally, the chapter investigates the regional
institutional framework, by looking at the quality of government and
infrastructure.
• Chapter 2 reviews the future of regional industrial specialisation in the
EU. Firstly is a review of the industrial policy vision of the EC, looking at
key industrial sectors on which European institutions are concentrating
policy strategy. The chapter then focuses on the future role of industry in
the global economy, by looking at the expected changing trends in both
supply and demand. Finally, by looking at key variables, the chapter

2
analyses the potential future direction of industrial specialisation in EU
regions.
• Chapter 3 analyses the key challenges for LRAs in designing and
implementing an industrial policy in the evolving industrial landscape. It
explores the challenges faced by LRAs in designing the pattern of
specialisation, the enhancement of industrial enterprise efficiency in the
use of inputs, support for industrial enterprises to become more globally
connected and the adaptation of institutional capabilities to the new
industrial challenges.
• Chapter 4 describes how LRAs are responding to the challenges
identified in Chapter 3, by looking at current approaches and strategies.
This chapter includes case examples from EU territories.
• Chapter 5 summarises the main policy conclusions of the report and
presents key recommendations for LRAs.
• Annex I contains the maps and figures used in Chapter 1 and Chapter 2.
• Annex II presents the methodology used for the analysis carried out in
Chapter 1 and Chapter 2 and the main data sources.
• Annex III contains references to the studies, reports and academic
research used in the report.
• Annex IV presents the slides in Power Point containing the main
findings, recommendations and policy options.

3
1. Industry in Europe and its regions
In recent years the European Commission has put more emphasis on the
importance of the real economy and strong industry as an engine of economic
growth and employment1. According to its policy vision, the target for the
contribution of industry to GDP by 2020 has been raised to 20%2.
A strong industrial base is perceived as fundamental for Europe’s economic
recovery and competitiveness. Some figures highlight the current significance of
industry in generating growth and job opportunities, in Europe industry3:
• in terms of value added, makes up 17.3% of European GDP (2015)4;
• attracts 80% of private research and innovation5;
• employs 23.6% of European workers and, for each additional job in
manufacturing, creates 0.5-2 jobs in other sectors6;
• accounts for over 80% of Europe’s exports, generating a €365 billion
surplus in the trade of manufactured products7;
• has a high domestic content of manufacturing exports, at around 85% of
value added and more sophistication and complexity than goods exported
by many other economies8;
Moreover, the EU is a major producer of new knowledge in Key Enabling
Technologies (KETs). Products based on industrial biotechnology or advanced
materials have higher technology content than competing North American or
East Asian products9.
However, although industry still provides a significant contribution to the
European economy, this share has steadily declined10
. Industry's share of gross
value added has followed this declining path in all western European countries
______________________
1 European Commission (2010a); European Commission (2014a); European Commission (2014b). 2 European Commission (2014a), p.23. 3 According to NACE Rev. 2, the definition of industry in this study includes Mining and quarrying (B);
Manufacturing (C); Electricity, gas, steam and air conditioning supply (D); Water supply, sewerage, waste
management and remediation (E). See Table A.2 in Annex II. 4 According to Eurostat nama_10_a10. 5 European Commission (2014a), p.1. 6 European Commission (2014a), p.1, based on Rueda-Cantuche, José M., Sousa, N., Andreoni, V. and Arto, I.
"The Single Market as an engine for employment growth through the external trade", Joint Research centre,
IPTS, Seville, 2012. 7 European Commission (2014a), p.1. 8 European Commission (2014c), p.12. 9 European Commission (2013a), p.3. 10 Value added over European GDP was 21% in 1995 and 18% in 2005.

4
in the 2000s. The only exception is Germany, where this proportion has
remained more or less unchanged. In the EU-1311
, this trend is less remarkable.
Although the declining importance of industry can be explained by a stronger
contribution to GDP growth of the service sector, in some countries this trend
can also be attributed to deteriorating international competitiveness.
On one hand, most European countries are moving to the tertiary sector of the
economy. This is not a surprising economic phenomenon, since the normal
pattern of economic development is from agriculture to industry and from
industry to services12
. All countries considered as developed followed this
pattern and, with a few exceptions such as India, developing countries are
following the same path. Looking at the pattern in the last twenty years13
, the
contribution of value added of services to GDP in the EU increased from 61.4%
in 1995 to 66.1% in 2015, while that of industry declined from 21% to 17.3% in
the same period. In some Member States such as the United Kingdom, the
Netherlands and France, value added services share over GDP has reached more
than 70%.
The shift of the economy to the tertiary sector is positive when the service sector
is an important engine of innovative activities and spillovers for other sectors.
For example, business services such as consultancy, design and marketing play
an increasing role as production inputs, including in terms of consultancy,
design and marketing, contributing to different degrees both upstream and
downstream along the value chain of the industrial process14
. However, the
productivity of services affecting the performance of industry strictly
depends on the framework conditions, such as the role of the internal
market and regulatory systems. For example, inappropriate labour or product
market regulation can dampen innovation and inhibit the uptake of information
and communication technology (ICT)15
. Administrative burden, barriers to trade
and investment, price controls and costs for starting up a company can
negatively impact the performance of services and any spillover effect on other
sectors. An inefficient transport and logistical system can impede industrial
sectors from becoming effectively integrated in global value chains16
.
______________________
11 Bulgaria (BG), Croatia (HR), Cyprus (CY), Czech Republic (CZ), Estonia (EE), Hungary (HU), Latvia (LV),
Lithuania (LT), Malta (MT), Poland (PL), Romania (RO), Slovakia (SK), Slovenia (SI). 12 Dasgupta and Singh (2006); Nickell, Redding and Swaffield (2008); Matsuyama (2009); Rodrik (2015). 13 Eurostat provides statistics from 1995. 14 ECSIP Consortium (2014), p.18. 15 ECSIP Consortium (2014), p.15. 16 European Parliament (2014), p.38.

5
A more challenging problem for the European industrial area is increasing
international competition from developing countries, not only in traditional
industry, but also in the highest value-added and dynamic manufacturing
sectors. The comparative advantage of labour cost in these emerging economies
can have major negative consequences:
• it can push European enterprises to de-localise production with
consequent declining employment and job opportunities for European
workers;
• international demand can substitute European industrial products with
lower-price products;
• foreign direct investments (FDI) can be displaced from Europe to
emerging areas.
These effects can be amplified with an inadequate policy to re-allocate European
industry in the most advanced sectors, or in the presence of higher energy prices
and obstacles to basic inputs which increase production costs.
The next sections will analyse the current situation of industry in EU regions, in
order to understand not only the potential industrial pattern of specialisation in
the near future for local and regional economies but also to identify the key
challenges Local Registration Authorities (LRAs) face to enhance and exploit
the process of re-industrialisation.
1.1 Industry in the European regions: an overview
Key findings:
• The value added contribution of industry excluding construction to EU-28 GDP
was 17.3% in 2015, following a steady decrease since the mid-1990s;
• In recent decades, industrial production has been relocated eastward towards
new member countries and emerging peripheral regions in central Europe;
• Regions from the EU-13 have more industrial growth than those in the EU-15
and have responded better to the crisis;
• A common trend towards the tertiary sector is affecting most European regions;
• The net business population17 growth for industry was generally negative across
European regions with obvious consequences for job creation and destruction;
• Industrial enterprises are agglomerated in clusters especially in Italy, Germany
and Spain and, in the EU-13, Poland and the Czech Republic.
______________________
17 Number of enterprise births minus the number of enterprise deaths over number of active enterprises. See
Table A.1 for additional detail.

6
Industry is a thriving sector in the world economy, with its value added still
contributing to almost 27.7% of world GDP in 201418
. The sector accounts for
80% of Europe’s exports and private innovation whilst the value added
contribution of industry excluding construction to EU-28 GDP was 17.3% in
2015, although this has been shrinking from a 21% share in 1995.
Figure 1.1: Industry share of total value added by region (%, 2013)
Source: own calculation based on Eurostat (see Annex II for detail
______________________
18 World Development Indicators, World Bank.

7
The geography of European industry was initially defined around the ‘blue
banana’19
but has quickly changed, with an eastward relocation towards new
member countries and emerging regions in central Europe in the last few
decades. Industry makes up a large proportion of the latter’s total added value,
so they are in the top quintile in Figure 1.1 and include, for example, Ditiki
Makedonia and Sterea Ellada in Greece, and eastern regions like Lubuskie and
Opolskie in Poland, Yugoiztochen and Yuzhen Tsentralen in Bulgaria, Eszak-
Magyarorszag in Hungary, as well as Sud-Vest Oltenia in Romania. However,
their share of total EU industrial production remains low. On the contrary, some
heavily industrialised regions in the EU-15 contribute also to a high share of
European industrial production. They are in the top quintile in both Figures 1.1
and 1.2. These include Stuttgart, Arnsberg, Karlsruhe, Tubingen, Braunschweig,
Freiburg, Rheinhessen-Pfalz, Schwaben in Germany, northern Italy, Groningen
in the Netherlands, Oberösterreich in Austria, Pais Vasco in Spain, as well as
Slaskie in Poland.
Figure 1.3: Industry value added growth (by region, % yearly average change, 2002-
2014), left side. Industry value added average yearly growth 2008-2014 vs. industry
value added share in 2008, right side
Source: own calculation based on Eurostat (see Annex II for detail)
In terms of industrial growth (Figure 1.3), regions from the EU-13 perform
better than those in the EU-15, with the noticeable exception of Germany
(Oberbayern, Oberpfalz, Leipzig, and Sachsen-Anhalt) and Northern Sweden
(Ovre Norrland). Moreover, industry in regions from the EU-13, in particular
those in Poland, Romania, Bulgaria, and Baltic new Member States, seems
to have responded better to the crisis. Since 2008, value added growth for
______________________
19 This refers to the almost continuous corridor where Europe’s industrial heartland has been traditionally
located, from North-West England to Northern Italy though Benelux, Western Germany and Eastern France. See
Brunet (1989) and Hospers (2003).

8
industry has been more significant in regions from EU-13 countries than in
EU-15 countries. However, overall, more industrialised regions had a higher
share of value added from industry in their local economies in 2008. A common
trend towards the tertiary sector is in fact affecting most European regions,
with a few noticeable exceptions in Poland (Lubuskie and Dolnoslaskie) and
Germany (Leipzig and Oberbayern) as shown in Figure 1.4. In many cases,
especially in some of the EU-15 (West Midlands and Outer London-South in the
United Kingdom, France-Comté and Lorraine in France, Southern Italy)
industry value added diminished in nominal terms or grew moderately from
2002 to 2014 while services performed better on average.
In terms of industrial enterprises, the availability of regional level data is
limited20
. In 2014, the EU-28 had around 26 million active enterprises21
, with
nearly 143 million employees. The highest number of active enterprises was in
Italy (3.9 million), followed by France (3.4 million), Spain (2.9 million),
Germany (2.8 million) and the United Kingdom (2.2 million). Over the seven
years around the crisis, from 2008 to 2014, industry in Europe suffered. The
number of industrial enterprises fell
during the period with obvious
consequences for job creation and destruction. As highlighted in Figure 1.5,
while western and central regions saw a decline in their net business population,
some eastern regions (Praha and Strednì Cechy in the Czech Republic, Sud-
Muntenia and Nord-Vest in Romania) experienced high growth, where the
number of new industrial firms exceeded those closing. It is worth noting that in
the majority of cases more industrial enterprises closed than opened and only the
upper two quintiles refer to positive growth. In addition, most of the new
industrial enterprises are large, especially in eastern countries and eastern Spain.
______________________
20 Data is only available for 102 NUTS2 regions in only 13 countries (Austria, Bulgaria, the Czech Republic,
Denmark, Spain, Finland, Croatia, Hungary Italy, Lithuania, Portugal, Romania, Slovakia). See Annex II for
detail. 21 The figure is based on 27 Member States and estimates of missing Greece data. See Annex II for detail.

9
Figure 1.6: Clusters in EU Member States by enterprises (2011)
Source: clusterobservatory.eu

10
Regarding the clusters22
in industrial sectors (Figure 1.6), the greatest
concentration of enterprises is in Italy, Germany and Spain, while in the EU-13
there are significant clusters in Poland and the Czech Republic. Some countries
such as Italy, Germany, Spain and Poland also have strong enterprise
agglomerations in service activities, especially business services. In other
countries, where enterprises are less concentrated in industrial clusters, there is
strong clustering in service activities, as in France, the Netherlands and Sweden.
1.2 Trade specialisation and attractiveness of European
regions
Key findings:
• High-income regions on average tend to specialise in high-technology intensive
exports, but are less competitive in less technology-intensive goods;
• On the other hand, low-income regions tend to be more specialised in medium-
low and low-technology-intensive exports and have deficits in high-technology
trade;
• However the link between high incomes and specialisation in high-technology
goods may be more a trend than a general rule: some low-income regions are
developing advantages in high-technology exports, presumably via FDI and
global value chains;
• Most of the major economies from the EU-15 have a strong national industrial
sector; the EU-13, on the contrary, rely more on FDI for their industrial
development;
• Most regions in the south-western Member States lag behind in terms of
______________________
22 The term business cluster, also known as an industry cluster, competitive cluster, or Porterian cluster, was
introduced and popularized by Michael Porter in The Competitive Advantage of Nations (1990). Three terms can
be distinguished: Clusters are geographic agglomerations of companies, suppliers, service providers, and
associated institutions in a particular field, linked by externalities and complementarities of various types;
Cluster initiatives are organised efforts taken by actors in a cluster to increase the cluster's growth and
competitiveness; Cluster programmes are organised efforts taken by government to increase the growth and
competitiveness of clusters in its constituency. Clusters share four critical characteristics. Proximity: the
companies need to be sufficiently close in space to allow any positive spillovers and the sharing of common
resources to occur. Linkages: they need to share a common goal (for example, final market demand) for them to
be able to profit from proximity and interaction. Interactions: being close and working on related issues is not
enough. For positive cluster effects to occur, some level of active interaction has to be present. Critical mass:
there needs to be sufficient number of participants present for the interactions to have a meaningful impact on
companies’ performance. Because of their proximity (both in terms of geography and activities) the clusters
members are driven by various types of externalities specific to their location. These externalities include, for
instance, the access to specialized labour markets and suppliers, the knowledge spillovers, a pressure to reach
higher economic performance to face the increasing competitiveness, and a continuous learning thanks to a close
interaction between the customers and the specialized suppliers.

11
attractiveness for FDI;
• In most Member States, capital and metropolitan regions have the highest levels
of competitiveness;
• Regions in central Europe have better infrastructure; this group includes
northern and central Italy, eastern Spain as well as capital and metropolitan
regions in the EU-13.
The trade specialisation of industry is an important source of economic growth
and development also for local and regional economies. Openness to
international trade can ensure more goods and services for local customers. It
can provide lower cost inputs and raw materials for local producers. It can
increase the spread of ideas and technology as well as information on new
products and production processes. It can enhance the quality of goods and
services as well as production efficiency, thanks to increased competition
between firms. FDI can increase the availability of capital and financing for
SMEs.
Figure 1.7: Revealed export advantages in different technology-intensive goods (2011)
Source: reproduced from Cordes et al. (2016)’
The main problem in analysing trade specialisation in EU regions is the lack of
available data, since trade data are usually collected at the national level. The
most recent and detailed analysis is provided by Cordes et al. (2016) who
developed a methodology to break down national trade data to the regional level
and assess the export advantage23
of EU regions. As displayed in Figure 1.7,
______________________
23 The analysis is based on the RXA (Revealed Export Advantage), which ‘compares the export share of a certain
industry in all manufacturing exports in a given region with the global export shares of this industry in the global
exports in manufacturing goods. The RXA, thus, indicates whether the significance of a certain industry in a
country’s (region’s) total manufacturing exports is higher or lower compared to the significance the industry has

12
high-income regions on average tend to specialise in high-technology
intensive exports, but are less competitive in less technology-intensive
goods. On the other hand, low-income regions tend to specialise more in
medium-low and low-technology-intensive exports and have deficits in high-
technology trade. Medium income regions are somewhere in between, having
slight disadvantages in high-technology trade, and more or less balanced
specialisation in medium-low- and low-technology exports.
Concerning high-technology intensive exports, most German regions have a
high comparative advantage, together with Ireland and the majority of United
Kingdom regions. Other central European Member States, instead, have fewer
regions specialised in high-technology exports (such as Paris and Alsace in
France, Brussels and its surrounding regions in Belgium, Lazio and Piemonte in
Italy). There are also some regions from the EU-13, mostly low-income, which
present a high comparative advantage in high-technology intensive exports:
these include the three western Hungarian regions (including the region around
Budapest), the majority of Czech Republic regions, two Slovenian regions, the
three western Polish regions, the western parts of Slovakia, and three Romanian
regions. As stressed by Cordes et al. (2016), the link between high income and
specialisation in high-technology goods may be more a trend than a general
rule and also low-income regions can develop advantages in high-
technology exports, presumably via FDI and global value chains and
potentially enhancing long-run economic growth potential24
. Regions highly
specialised in medium-low- and low-technology-intensive exports are mostly
concentred in the southern and eastern low-income peripheries such as Bulgaria,
Greece, and southern Spain. Portugal, most of southern Italy, east Poland and
north Romania are exclusively specialised in low-technology-intensive exports.
An important variable to consider in assessing regional trade specialisation is the
capacity of regional economies to attract FDI. FDI have an important impact on
growth in host economies which can gain access to advanced technology as well
as managerial knowledge and skills, enhancing industrial potential. For
regional location choices, foreign investors tend to prefer regions with a
high level of development and efficient infrastructure such as international
airports25
. Moreover, another explanation for investment in these regions can be
low labour costs. The level of tertiary education also helps attract FDI. In 2015,
total FDI inflows to Europe reached $504 billion (around €450 billion) – 29%
of global inflows26
. Ireland and the Netherlands became the two largest
in global manufacturing exports’, Cordes, et al. (2016), p.8. 24 Cordes, et al. (2016), p. 10. 25 Antonescu (2015). 26 UNCTAD (2016), p.4.

13
recipients in the EU. Other major recipients were France and Germany, both of
which recovered sharply from low points in 2014. Inflows into the United
Kingdom – the largest recipient in 2014 – fell back to $40 billion (€35.7 billion)
but remained among the largest in Europe. In the 11 central and eastern
European member countries of the EU, combined inflows almost halved, to $19
billion (€17 billion). The decline was particularly pronounced in 2014’s larger
recipients such as Poland (down 40% to $7.5 billion - €6,7 billion), Hungary
(down 83% to $1.3 billion - €1.16 billion) and the Czech Republic (down 78%
to $1.2 billion - €1.07 billion). Bulgaria and Romania, however, maintained their
levels of inflows.
Figure 1.8: Foreign controlled manufacturing firms value added at factor cost, over total
manufacturing firms value added (%, 2014), left side; foreign controlled manufacturing
firms value added at factor cost yearly average change (%, 2008-2014), right side
Source: own calculation based on Eurostat (see Annex II for detail)
With respect to the importance of FDI in industrial sectors, Figure 1.8 shows for
201427
the share of total value added in industry due to foreign controlled firms
within each country. Most of the major economies from the EU-15 have a
strong national industrial sector with the exception of the United Kingdom
and Ireland, while the Czech Republic, Slovakia, Hungary and Romania
rely on foreign investment for their industrial development more than the
others.
From 2008 to 2014 (right side of Figure 1.8), the growth of foreign controlled
industrial firms in terms of value added was modest because of the crisis in most
______________________
27 Except for a few countries, namely Belgium and Finland (2013), Ireland (2012) and Malta (2008).

14
of Member States with the exception of Croatia, Slovakia, Bulgaria, Latvia and
Lithuania. Unfortunately, there are no updated data on FDI at regional level. The
only detailed study was provided by Capello, Fratesi and Resmini in 2011 and
analyses FDI at regional and local level for 2005-2007 (Figure 1.9). This
therefore captures data from before the crisis. Regions which attracted the most
FDI in manufacturing28
between 2005 and 2007 were in Ireland, the United
Kingdom, Poland, Romania and Baltic countries. These regions, in particular
those in the EU-13, are experiencing a long period of FDI inflows, which
started in the late 1990s’ with intra-European inflows29
and were then
further enhanced by extra-European FDI. On the contrary, most of the
regions in the south-western Member States (Greece, Portugal, Spain and Italy)
lag behind in terms of attractiveness for FDI.
Further indications on the attractiveness of European industrial regions can be
extrapolated from the Regional Competitiveness Index, which measures ‘the
ability to offer an attractive and sustainable environment for firms and residents
to live and work’30
by summing-up 11 indicators31
. According to Figure 1.10,
the most competitive regions in the EU are in the north-west of Europe,
including most regions in the Benelux countries, Denmark, Germany,
Austria, Sweden, Finland, the south-east of the United Kingdom and
northern France. In contrast, the least competitive regions were generally in
the south-east of Europe, in particular in Bulgaria, Greece, Romania, the south
of Spain, and the south of Italy. The highest ranking region in 2013 was Utrecht
in the Netherlands, while the least competitive region was Severozapaden (in
Bulgaria).
______________________
28 See Table A.2 in Annex II. 29 Capello, Fratesi and Resmini (2011), p. 97. 30 European Commission (2013b), p.4. 31 These are: Institutions; Macroeconomic stability; Infrastructure; Health; Basic education; Higher education;
Labour market efficiency; Market size; Technological readiness; Business sophistication; Innovation.

15
Figure 1.10: Regional Competitiveness Index (2013)
Source: reproduced from European Commission (2013b), p.iii (see Annex II for detail)
Interestingly, most Member State capital and metropolitan regions exhibit
the highest levels of competitiveness. The only capital region with a
competitiveness index below its national average is Berlin. Some capital regions
are surrounded by similarly competitive regions (for example, in the
Netherlands and the United Kingdom), whereas in other countries (such as
Spain, France and many of the EU-13), several regions around the capital were
less competitive. Figure 1.10 also offers an overview of the variance in the
Regional Competitiveness Index within Member States. The biggest differences
are in France and Spain even if these results were exacerbated by overseas
regions for both of these countries. Particular geographical divisions affect Italy
(north–south divide, with the south less competitive) and the United Kingdom
(north-west–south-east with Northern Ireland, northern Scotland, parts of Wales,
Cumbria and Cornwall being less competitive).
Among the indicators in the Regional Competitiveness Index, the infrastructure
indicator32
is of particular significance for industrial development. Modern and
effective infrastructure contributes to economic efficiency helping to maximise
local economic potential and the optimal use of resources33
. Infrastructure can
______________________
32 This indicator is based on: Motorway Length per km 2; Motorway Length per vehicle; Length of Railway per
km2; Air Freight Disembarked per 1,000 inhabitants; Air Passengers Disembarked per 1,000 inhabitants;
Number of Vehicles per 1,000 inhabitants; Broadband Access Lines per 1,000 inhabitants (national data only);
Secure Servers per 100,000 inhabitants (national data only). 33 Dijkstra, Annoni and Kozovska (2011).

16
influence the location of economic activity and the kinds of activities and sectors
that develop. Moreover, high-quality infrastructure guarantees easy access to
other regions and countries, inside and outside the EU, contributes to better
integration of peripheral and lagging regions, and facilitates the movement of
goods, people and services. Especially in low-income regions of Europe, in fact,
strategic investments in infrastructure, and especially in transport infrastructure,
become a precondition for economic development34
. Figure 1.11 illustrates the
infrastructure indicator by EU region. Regions in central Europe are better
equipped in terms of infrastructure. This group includes northern and
central Italy, eastern Spain as well as capital and metropolitan regions in
the EU-13. Regions with the lowest indicator for infrastructure are in eastern
Europe and in less populated parts of the Scandinavian peninsula.
1.3 Workers in industry
Key findings:
• Industrial enterprises provide work for 23.6% of employed people;
• Most EU regions were below the 2020 target of 75% employment for the active
population in the 20-65 age group; moreover, growth in industrial employment in
the last few years was heavily affected by the economic crisis. The general trend
was for lower employment following the economic downturn;
• Few regions experienced increased industrial employment in 2008-2015;
moreover, employment growth in industry was more effective in regions where
employment in industry was already stronger;
• Very few regions are both heavily industrialised and specialised in high-tech
industries;
• The highest participation in education is in regions along the axis from France,
through the United Kingdom and the Netherlands to Denmark and Sweden;
• Southern and eastern less industrialised regions suffer from many young people
Not in Education, Employment, or Training (NEETs);
• EU-citizens tend to move more towards central Europe regions, which are more
knowledge and innovation intensive;
• There is still a huge variation in yearly average gross wage of industrial workers
within the common market, which reflects the wide variation of labour
productivity;
• Highest values for labour productivity in industry are in northern and central
Europe and southern French regions and Ireland; however, the highest labour
productivity growth is in eastern regions.
______________________
34 European Commission (2017b).

17
Industry is a key sector for job creation and still has a major role in boosting
employment in Europe. In 2014 only 9.9% of active enterprises in the EU
were in industry, even though these provided work for 23.6% of employed
people. The difference between these shares is because the average size of
industrial enterprises (as measured by the number of employees), is considerably
higher for industry than for services35
.
As shown in Figure 1.12, in 2015, most EU regions were below the 2020
target of 75% employment for the active population in the 20-65 age group.
The highest regional employment rates were in Germany (Freiburg, Tubingen,
and Oberbayern), Sweden (Smaland Med Oarna and Vastsverige) and the
United Kingdom (North Eastern Scotland and Berkshire). However, almost 80%
of regions were below the target, with some areas, especially in southern
Europe, dramatically below (Calabria and Sicilia in Italy, Dikiti Makedonia in
Greece, Extremadura and Andalucia in Spain).
Figure 1.13: Employment in industry, share of total employment (%, 2015), left side;
employment in industry, yearly average change (%, 2008-2015), right side
Source: own calculation based on Eurostat (see Annex II for detail)
The leading regions for industrial employment in 2015 are shown in Figure 1.13.
When compared to total employment, industry’s share is highest in central and
eastern European regions (Vest in Romania, Severovychod in Czech Republic,
Slaskie in Poland, Kozep-Dunantul in Hungary, and Stuttgart and Tubingen in
Germany) and a few others, such as northern Italy (Piemonte, Lombardia and
Emilia Romagna). In terms of growth in industrial employment (right side of
Figure 1.13), the last few years were heavily affected by the economic crisis
______________________
35 Industrial enterprises employed 13 people on average across the 27 Member States, compared to an average of
5 people for services.

18
and the general trend was a reduction in employment following the
economic downturn. Indeed, few regions experienced an increase in
industrial employment over the period 2008-2015 (Oberösterreich and
Vorarlberg in Austria, Bretagne in France, Cumbria and North Yorkshire in the
United Kingdom, Pomorskie in Poland). Nonetheless, employment growth in
industry was more effective in regions where industrial employment was
already stronger at the beginning of the period (Oberösterreich and Vorarlberg
in Austria, Pomorskie in Poland, Eszak-Alfold and Del-Alfold in Hungary)
though there is a huge variation between regions.
Figure 1.14: Manufacturing employment share of sectors by
technology-intensity (2015)
Source: own calculation based on Eurostat (see Annex II for detail).

19
By looking at manufacturing36
, it is possible to analyse the share of total
employment relative to its technological content (Figure 1.14). Different
patterns of specialisation emerge as many industrialised areas specialise, in
terms of employment, in medium-low- and low-technology manufacturing,
while very few are both heavily industrialised and specialised in high-tech
industries. The exceptions are German regions like Baden-Wurttemberg,
Bayern, Hessen, Niedersachsen and Rheinland-Pfalz.
An important source for industrial development is human capital in the
workforce. Human capital accumulation contributes to the development of the
most advanced industries and more sustainable industrialisation across Europe.
The third industrial revolution is going to be driven more by knowledge than in
the past, as Ross (2016)37
puts it “Land was the raw material of the agricultural
age. Iron was the raw material of the industrial age. Data is the raw material of
the information age”, calling for an urgent shift in the skills of the workforce to
cope with the new paradigm. Within this framework, the EU supported national
actions with Education and Training 2020 (ET 2020)38
defining benchmarks for
2020 such as:
- at least 40% of people aged 30-34 should have completed some form of higher
education;
- at least 15% of adults should participate in lifelong learning;
- at least 20% of higher education graduates and 6% of 18-34 year-olds with an
initial vocational qualification should have spent time studying or training
abroad;
- 82% of graduates should be employed (aged 20-34 with at least upper
secondary education and having left education 1-3 years ago).
In particular, lifelong learning and upgrading skills seem to be an urgent policy
challenge with the computerisation of many tasks and occupations thanks to
rapid advances in machine learning (Data Mining, Machine Vision,
Computational Statistics and other sub-fields of Artificial Intelligence)39
. From
this perspective, the highest participation in education is in regions located
along the axis from France through the United Kingdom and the
Netherlands to Denmark and Sweden as shown in Figure 1.15. However,
there is a huge variation between regions which reflects various factors such as
______________________
36 The disaggregation in terms of technological content is available only for manufacturing. See Table A.2 in
Annex II. 37 Ross (2016), p.18. 38 European Commission (2012a). 39 See Frey and Osborne (2017) for an interesting estimation of computerisation on US occupations.

20
the population structure, the economic situation and different national policies.
On the other hand, the picture changes a lot when looking at tertiary education
only (left side of Figure 1.15), with more polarisation within each country,
which reflects the historical location of major universities.
Figure 1.15: Participation rate in education and training (2015), left side; participation
rates in tertiary education (2015), right side
Source: own calculation based on Eurostat (see Annex II for detail)
The picture can be enriched by looking at two other dimensions (Figure 1.16),
which contribute to the overall outcome for human capital accumulation, NEETs
and vocational programmes which relate to technical jobs required by modern
industry. Raising educational attainments and anticipating the skills needed for
the labour market are key aspects of ET 2020. Regions vary according to the
general economic situation but also in relation to their specific policies to
activate new cohorts and prepare them for the labour market. The NEET rate
for people aged 15-24 is particularly high at more than 20% in many
southern and eastern less industrialised regions (especially in Calabria and
Sicilia in Italy, Centru in Romania and Severozapaden in Bulgaria). Many
industrialised regions, on the contrary, are pushing work-based learning,
vocational education and training programmes (especially in Tirol and
Vorarlberg in Austria, Pohjois-Ja Ita-Suomi and Etela-Suomi in Finland,
Flevoland and Zeeland in the Netherlands, Vzhodna Slovenija in Slovenia, and
Zapadne Slovensko in Slovakia). The highest share of such programmes in
upper secondary education was in central-eastern industrial areas along with the
Netherlands and Finland.
Labour in industry is also subject to migration flows and population structure
changes which may impact future economic development. Migration plays an
important role, along with migrant characteristics, in terms of age, skills,

21
education and work experience. Even if there is not enough data to encompass
the recent migrant flows which had a major impact on some European regions, it
is still worth analysing figures from 2011 census data, which are the most
complete and recent updates at regional level. Figure 1.17 shows the total
immigrant share and separates out the European component to focus on internal
market mobility. The most attractive regions for migrants are in Ireland,
western Spain, northern Italy and the Baltic regions. EU-citizens migrate
mainly to central European regions in Germany, Belgium, the Netherlands,
northern France and southern United Kingdom. A CoR study published in
201640
concludes that EU inter-regional labour mobility is more efficiently used
(i.e. shows a greater elasticity41
) in regions that are more knowledge and
innovation intensive. On the other hand, regions with low levels of R&D
spending as well as a narrow innovation profile, including imitative
innovation areas, do not benefit from the mobility of skilled workers,
because their elasticity for knowledge is not significant.
Two other variables to consider are industrial labour cost and productivity. The
geography of industrial labour cost at regional level as shown in Figure 1.18,
represents both a country’s economic development and the comparative
advantages of new developing regions. There is still a huge variation of
average gross wages in industry within the common market42
ranging from
about €5 000 to about €85 000 in 2013. The lowest is in eastern countries with
the exception of Norte and Algarve in Portugal. On the other hand, the highest
values are in regions in northern and central Europe and the United Kingdom.
It is important to take into consideration labour productivity as a key factor in
determining the productive industrial potential of the economy. When looking at
labour productivity43
in Figure 1.19, the highest values for industry are in
northern and central Europe and southern French regions and Ireland. Overall,
there is a correspondence between industry wages and labour productivity
across EU regions.
______________________
40 Committee of the Regions (2016), p.26. 41 Elasticity measures the impact of labour mobility on the capacity of the region to transform knowledge into
R&D. See ESPON (2012), pp. 140-141. 42 The yearly average gross wage has been calculated as the total yearly employee compensation in industry from
national accounts divided by the number of employees in industry: “In balance of payments statistics,
compensation of employees refers to gross wages, salaries and other benefits earned by individuals in economies
other than those in which they are resident, for work performed and paid for by residents of those economies.
Compensation of employees includes salaries paid to seasonal and other short-term workers (less than one year)
(…) Compensation of employees (D.1) consists of wages and salaries in cash or in kind (D.11) and employer's
actual and imputed social contributions (D.121 and D.122).” Eurostat, Statistics Explained – Glossary:
compensation of employees. 43 Labour productivity is defined as the amounts of output produced by one unit of work and is measured here as
the ratio between value added in industry and the hours worked by an employed person in industry.
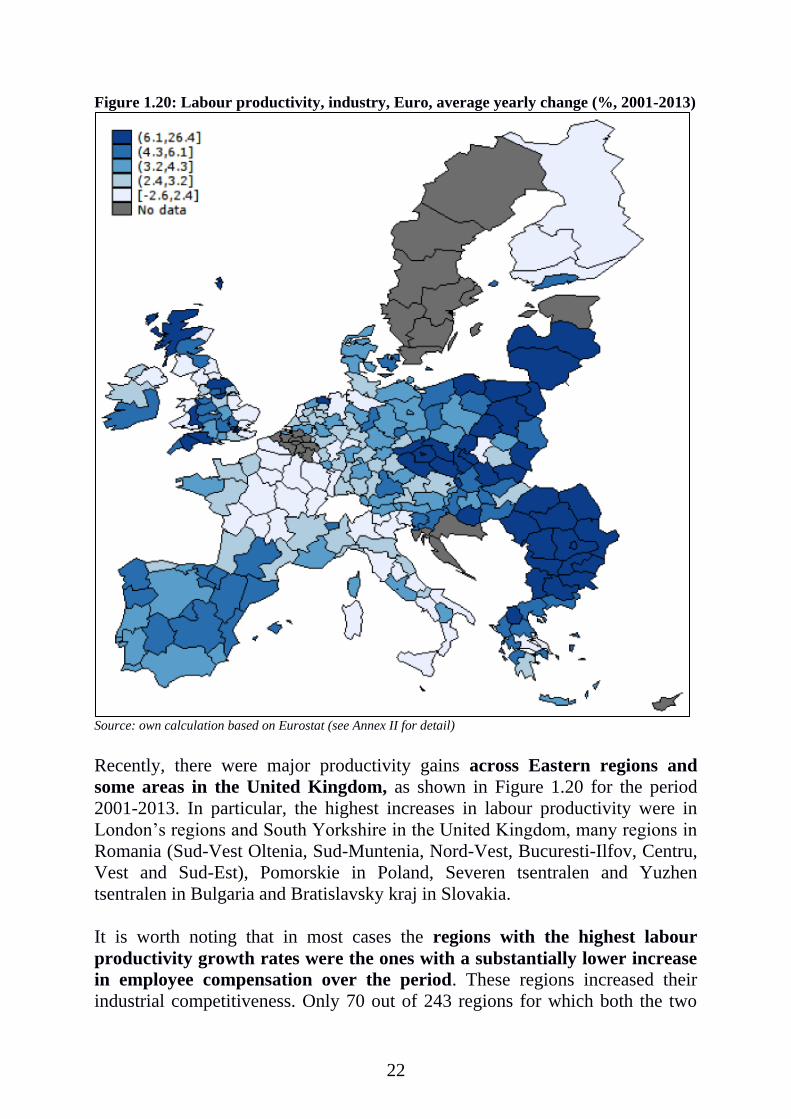
22
Figure 1.20: Labour productivity, industry, Euro, average yearly change (%, 2001-2013)
Source: own calculation based on Eurostat (see Annex II for detail)
Recently, there were major productivity gains across Eastern regions and
some areas in the United Kingdom, as shown in Figure 1.20 for the period
2001-2013. In particular, the highest increases in labour productivity were in
London’s regions and South Yorkshire in the United Kingdom, many regions in
Romania (Sud-Vest Oltenia, Sud-Muntenia, Nord-Vest, Bucuresti-Ilfov, Centru,
Vest and Sud-Est), Pomorskie in Poland, Severen tsentralen and Yuzhen
tsentralen in Bulgaria and Bratislavsky kraj in Slovakia.
It is worth noting that in most cases the regions with the highest labour
productivity growth rates were the ones with a substantially lower increase
in employee compensation over the period. These regions increased their
industrial competitiveness. Only 70 out of 243 regions for which both the two

23
measures are available – labour productivity change and yearly employee
compensation change for the period 2001-2013 – show a higher increase in
wages than in productivity. However, most regions were almost stagnating in
terms of both measures especially those with a higher industrial specialisation,
as shown in figure 1.21.
1.4 Innovation in industry
Key findings:
• Innovation capacity has been improving in the EU as a whole and for most
Member States in the last decade, despite a trend reversal when comparing the
years before and after 2012;
• Most innovative regions are in Denmark, Finland, Germany, the Netherlands,
Sweden, France and the United Kingdom;
• There is a partial convergence of regions with medium innovative capacity
towards innovation-leader regions, while regions with modest innovative
capacity are diverging;
• Regions with the greatest expenditure on R&D are in capital regions and
countries like Finland, Sweden, Denmark, the Netherlands, Germany, Austria,
the United Kingdom, and France;
• However, despite the low investment in R&D, some regions in southern and
eastern Europe perform better in terms of product, process, marketing or
organisational innovations.
As economic theory suggests, industry is generally characterised by
diminishing marginal returns on capital44
. That is, the incremental gain in
output decreases as additional capital is added with a constant labour input. This
would lead an economy to a steady state, where labour productivity is constant
and output and economic growth equal the rate of increase in the labour force. In
this situation, the only way for an economy to avoid a steady state is through
continuous investment in human capital, innovation, technology and knowledge.
Industrial innovation is therefore considered as an engine of economic growth45
.
In recent years (2008-2015), innovation capacity has improved for the EU
as a whole and for most Member States. However, there has been a trend
reversal when comparing the years before and after 2012, with many Member
States experiencing negative performance for 2012-2015. Most recently (2014-
______________________
44 Solow (1956). 45 Romer (1990), Aghion and Howitt (1992), and Grossman and Helpman (1994).

24
2015), as many as 17 Member States had a reduction in the innovation
capacity46
. As indicated in Figure 1.22, the most innovative regions are
typically in the most innovative countries (Figure 1.23), defined as Innovation
Leaders47
. These are Denmark, Finland, Germany, the Netherlands, and Sweden
and in two Strong Innovator countries, France and the United Kingdom48
. Only
in four countries, France, Italy, Spain and Germany, are there three different
performance groups. In terms of performance, it has been observed49
that Strong
and Moderate Innovator50
regions have improved, while regional Innovation
Leaders and Modest Innovators have declined51
. This suggests a partial
convergence of the two medium groups towards Innovation Leaders and a
partial further divergence of Modest Innovator regions from the other
groups.
A key variable of innovation performance for regions which also significantly
influences industrial development, is investment in R&D. In the EU, 80% of
private sector R&D investment comes from industry52
, in particular in the
automotive sector53
. Since there are no regional data at sector level, it is assumed
in this study that overall innovation capacity of EU regions is a proxy for
investment in innovation in industry at regional level. As underlined by the
European Commission itself, investments in R&D in the EU remain too low,
and, coupled with an inflexible environment and rigidities in some labour
markets, hamper the necessary modernisation of European industry with
negative effects for future EU competitiveness54
.
Figure 1.24 shows regional R&D expenditure and business enterprise sector
R&D expenditure 2005-2014, as a percentage of GDP. The highest values are
in capital regions and countries like Finland, Sweden, Denmark, the
______________________
46 European Commission (2016a), p.7. 47 According to the European Innovation Scoreboard 2016 (European Commission, 2016a) Innovation Leaders
are countries in which innovation performance is more than 20% above the EU average. 48 The second group of Strong Innovators includes Member States with a performance between 90% and 120%
of the EU average. Austria, Belgium, France, Ireland, Luxembourg, Slovenia, and the United Kingdom are
Strong Innovators (European Commission 2016a). 49 European Commission (2016a), p.5. 50 The third group of Moderate Innovators includes Member States where innovation performance is between
50% and 90% of the EU average. Croatia, Cyprus, Czech Republic, Estonia, Greece, Hungary, Italy, Latvia,
Lithuania, Malta, Poland, Portugal, Slovakia, and Spain belong to this group. Latvia has improved from being a
Modest Innovator to a Moderate Innovator (European Commission 2016a). 51 The fourth group of Modest Innovators includes Member States with innovation performance of less than 50%
of the EU average. This group comprises Bulgaria and Romania (European Commission 2016a). 52 European Commission (2014e). 53 The automotive industry is crucial for Europe’s prosperity. The sector provides jobs for 12 million people and
accounts for 4% of the EU’s GDP. The EU is among the world's biggest producers of motor vehicles and the
sector represents the largest private investor in R&D (see ACEA EU Automobile Industry, 2015). 54 European Commission (2014a), p.2.

25
Netherlands, Germany, Austria, the United Kingdom, and France. A similar
geographical distribution can be found in terms of business enterprise sector
R&D expenditure (Figure 1.24, right side), with the highest performers in
Nordic countries (Sydsverige in Sweden) and in north and central Europe
(Hovedstaden in Denmark, Stuttgart and Braunschweig in Germany, Cheshire in
the United Kingdom).
Figure 1.24: Total R&D expenditure (GERD), % of GDP (average 2005-2014), left side;
business enterprise sector R&D expenditure (GERD), % of GDP (average 2005-2014),
right side
Source: own calculation based on Eurostat (see Annex II for detail)
Additional information on the capacity of regional industries to innovate can be
derived by looking at the ability of SMEs to introduce product, process,
marketing or organisational innovations (Figure 1.25). In some cases, despite
the relatively low propensity to invest in R&D, there are regions in Italy
(such as Tuscany), Portugal (Algarve), Greece (Attiki and Kriti), Ireland
(Southern and Eastern), and eastern Europe (Severovychod in the Czech
Republic), which perform better in terms of product, process, marketing or
organisational innovations than regions with a higher propensity to invest
in R&D. On the contrary, some regions which perform better in terms of
investment in R&D – such as Lansi-Soumi in Finland or Midtjylland and
Syddanmark in Denmark, have fewer SMEs introducing product, process,
marketing or organisational innovations.

26
Figure 1.25: SMEs introducing product or process innovations as % of SMEs (2012), left
side; SMEs introducing marketing or organisational innovations as % of SMEs (2012),
right side
Source: own calculation based on Eurostat (see Annex II for detail)

27
2. The future of traditional
industries and industries of the
future: the evolving reality of
industry in a global context
2.1 Towards a new vision for a future oriented EU industrial
policy
Industrial policy and the need to enhance the industrialisation of Europe and its
regions has become an important issue for EU policy vision. This new
orientation has been driven not only by the need for an industrial renaissance
after many years of industrial decline, but also by the rise of innovative
industrial sectors based on new technology and technical changes,
knowledge-based and services-linked activities, new professions and new
customer needs and preferences.
As already stated, the European Commission intends to put effort into reversing
the declining role of industry in Europe from its current level (in terms of value
added) of around 17.3% of GDP to as much as 20% by 2020. This ambitious
goal should be complemented55
by higher levels of investment, greater intra-
European trade and a significant increase in the number of SMEs and exports to
third (non-EU) countries. There should be an industrial shift towards more
durable, more customer specific or ecologically sustainable products. Other
factors include aligning training, social innovations and more resource
efficiency.
The rationale behind this strategy is the ‘Third Industrial Revolution’. The
concept was taken from the work of Jeremy Rifkin (2011) and is based on
expected shifts in energy production. It puts forward the importance of internet
technology and renewable energy integrated into new business orientations. This
means a partial shift from a market- to a network-based organisation of
businesses where new management and business practices are gaining
importance. This includes collaborative relationships between suppliers and
users, shared interest, openness, collective trust and transparency.
In synthesis, as formulated by Karl Aiginger:
______________________
55 K. Aiginger (2014).

28
“A future oriented Industrial Policy has to start from the challenges revealed by
globalisation and those in the financial crisis. It has to be based on research
and education, and industrial policy merges with innovation policy. It has to
encompass small as well as large firms, and promote close relations between
firms and universities and cooperation between firms and universities (clusters);
the education policy needs to be able to provide equal opportunities at the outset
as well as to promote lifelong learning. Innovation systems are superior if they
actively draw from the common international knowledge pool, thus integrating
international researchers and also migrants and newcomers are important. The
manufacturing sector remains competitive if an economy is open to imports and
inward FDI so that it can make use of the division of labour along the value
chain. Industrial policy has to be systemic in the sense, that it is derived from
the goals of the society. If the welfare function of European citizen gives a large
weight so rising incomes, more social inclusion (less wage dispersion), regional
equilibria, a stable financial system and sustainability, then industrial policy has
to promote these goals e.g. shifting innovation towards social and ecological
innovation, while keeping competitiveness and the potential for rising incomes.
And industrial policy should make use of those forces which promote change,
and foster higher incomes, like competition and globalisation. Thus a Systemic
Industrial Policy is pulled by vision and pushed by competition.”56
As stated by the European Commission (2012b) the elaboration of such a
comprehensive and structured approach to industrial policy should be based on
four pillars: investment in innovation; better market conditions; access to
capital; human capital and skills. In particular, under the first pillar, there are
six priority action lines, which identify six markets where new technologies are
ready to deliver new products or contribute to increased industrial productivity.
These are57
:
• Advanced manufacturing technologies for clean production. In the wake of a
new industrial revolution, advanced manufacturing technologies are believed to
be key to delivering sustainable and clean solutions by using highly energy- and
material-efficient processes, employing renewable and recycled materials, and
increasingly adopting sustainable business models. Furthermore, in the light of
the growing importance of the industrial internet, the integration of digital
technology in the manufacturing process is seen to be a priority for the future58
.
These technologies represent an important business opportunity, with a global
market that is expected to double to over €750 billion by 2020. EU industry
______________________
56 K. Aiginger (2012), pp.11-12. See also .K. Aiginger (2014). 57 European Commission (2012b) pp. 8-13. 58 European Commission (2012a).

29
has already achieved a comparative advantage in this sector with a world market
share of over 35% and a patent share of over 50%59
.
• Key enabling technologies. Key enabling technologies (KETs) are of
exceptional importance for shaping future innovation and the competitiveness of
the EU. Moreover, these markets have experienced exceptional growth in recent
years60
. KETs include photonics, industrial biotechnology, nanotechnology,
advanced materials, micro-/nano-electronics and advanced manufacturing
systems. World leading industries such as automotive, chemicals, aeronautics,
space, health and energy are all users of KETs. Europe is a global leader in
KETs research and development with a more than 30% global share of
patent applications. In photonics, for example, a sector with a global market of
around €300 billion, Europe has already achieved a strong position with a share
of 20% and as much as 40% in key sectors such as lighting61
. Moreover, it
employs about 290,000 people directly, many of these in more than 5,000
photonics SMEs, with substantial leverage on the European economy and
workforce62
. Some 20-30% of the economy and 10% of the workforce depend
on photonics, directly impacting around 30 million jobs.
The development and deployment of KETs requires people with appropriate
skills63
. For Europe to be able to fully realise KETs growth potential in the
future, there is therefore a need to align the supply and demand for KETs skills.
In 2013 demand for KET skills was estimated at 2.2 million KETs professionals
and associates64
, including jobs at all skill levels. Highly-skilled KET
employment accounted for 55% of total employment, followed by 37% for
medium-skilled employment and 8% for low-skilled employment. Estimates of
future demand for KETs skills, show that by 2025 an additional 953 000 KETs
professionals and associates with technical skills are needed to satisfy
demand, corresponding to 79 000 KETs workers per year. The key share of
extra demand is for replacement (e.g. due to retirement or moving to other
sectors) with a total of 772 000 KETs professionals and associates. Expansion
demand (i.e. new jobs) is estimated to be a relatively small share till 2025, at
181,000 KETs jobs. Most jobs related to additional demand (62%) will require
highly skilled people, though there is also a relatively strong increase in demand
______________________
59 EPO (2016). 60 According to the European Commission the global market for KETs was estimated to be more than €1 trillion
by 2015, from €680 billion in 2008. See European Commission (2013), What are KETs and why are they
important? 61 European Technology Platform Phototonics21 (2013), p.7. 62 Photonics also offers solutions which address key social challenges, such as energy generation and energy
efficiency, healthy ageing of the population, climate change, and security. 63 European Commission (2016c) p.17. 64 European Commission (2016c) p.12.

30
expected for medium skilled people (30%).
• Bio-based products. Bio-based industries are believed to deliver a much wider
impact beyond economic performance, especially for environmental and social
benefits. Advances in bioeconomy research and innovation uptake will allow
Europe to improve the management of its renewable biological resources and to
open new and diversified markets in food and bio-based products. Establishing a
bioeconomy in Europe holds great potential. It can maintain and create
economic growth and jobs in rural, coastal and industrial areas, reduce fossil
fuel dependence and improve the economic and environmental sustainability of
primary production and processing industries65
. The growth of EU bio-based
chemical products (including bio-plastics, bio-lubricants, bio-solvents, bio-
surfactants and chemical feedstock) to 2020 is expected to be 5.3% p.a.,
resulting in a market worth €40 billion and providing over 90 000 jobs
within the biochemical industry alone66
. Significant growth is expected from
sustainable primary production, food processing, industrial biotechnology and
bio refineries. These lead to new bio-based industries, transform existing ones,
and open new markets for bio-based products. New high skilled jobs and
training options need to be developed to meet labour demands in these
industries, as well as in agriculture, forestry, fisheries and aquaculture67
.
• Sustainable industrial and construction policy and raw materials. Improving
energy efficiency in residential housing and supporting recycling and
sustainable waste management are seen as important actions benefiting
performance in the construction industry68
. The energy used in residential,
commercial and public buildings accounts for 40% of EU final energy
consumption and contributes to CO2 emissions and air pollution
69. Moreover, in
the EU, at least 30 million jobs depend on the availability of raw materials. New
investments in energy efficiency in residential and public buildings and
infrastructure have therefore strong growth potential and are expected to
be worth some €25-35 billion per year by 202070
. The Ecodesign directive71
has set the requirements for a number of energy-related products, including
motors, pumps, fans and chillers. Measures for other household goods and
industrial equipment are underway. Although energy has been the main resource
______________________
65 European Commission (2012c), p.2. 66 European Commission (2010b), p.23. 67 European Commission (2012c), p.5. 68 European Commission (2014a). 69 European Commission (2012b). 70 European Commission (2012b), p.10. 71 Directive 2009/125/EC of the European Parliament and of the Council of 21st October 2009 establishing a
framework for setting ecodesign requirements for energy-related products.

31
targeted so far, improvements related to all environmental aspects are expected,
including material efficiency. Improvements will affect a wider range of
industrial products with significant environmental benefits.
• Clean vehicles and vessels. Clean, energy-efficient and environmentally
friendly transport using alternative fuels and increased substitution of
combustion engines with electric ones (especially in personal vehicles) are seen
as a central element in achieving sustainable mobility throughout the EU. This
will also benefit future industry performance as the sustainable vehicle
market is expected to account for 7% of industry by 202072
. The deployment
of electrical mobility will require profound changes in industrial value chains,
business models, skills and customer attitudes, as well as recharging
infrastructure.
• Smart grids and digital infrastructure. Establishing smart energy grids is
considered necessary to integrate energy-efficient solutions (in housing,
transportation, industry, etc.) in an effective and efficient distribution system.
Developing and implementing a sound policy framework for smart energy
systems73
has to be underpinned by the implementation of intelligent metering in
at least 80% of households by 2020 together with accompanying investment
of €60 billion (by 2020), rising to around €480 billion by 203574
.
2.2 The changing role of industry in the global economy
Industry still matters and will continue to matter for the global economy, but its
role and nature are changing75
. The new era of industry will be marked by highly
agile, networked enterprises that use information and analytics as skillfully as
they employ talent and machinery, to deliver products and services to diverse
global markets and meet new demands. In advanced economies, industry will
continue to drive innovation, exports and productivity growth, while in
developing countries it will continue to provide a pathway to higher living
standards. The key features of industry changing in a global prospective are:
• Large developing economies are moving up in global manufacturing. In
terms of a gross value added, industrial output in large developing economies
continues to grow much faster than in advanced economies. Economies like
China, India, South Korea and Indonesia are rising to the level of the world’s
______________________
72 European Commission (2012b), p.11. 73 European Commission (2011). 74 European Commission (2012b), p.13. 75 McKinsey & Company (2012).

32
leading manufacturing industries, while Europe’s largest manufacturers
(Germany, France, Italy, the United Kingdom and Spain) continue to drop on
the global scale76
. Advanced economies are still more specialised in industries
with greater value added, while being less competitive in low-contribution
industries, like labour intensive ones. However, some developing countries are
moving towards high value added industry. China’s industrial production is
currently experiencing rapid growth in smart manufacturing. Chinese
frontrunner manufacturers and their advanced production lines will
increase global competitive pressure for high-tech industries, such as
electronics and machinery77
. They will actively challenge the leadership of
foreign manufacturers in industries that are key pillars to economic prosperity in
many industrial countries. The Chinese leadership sees smart manufacturing
as a key tool for challenging the technological dominance of industrial
countries while simultaneously defending China’s low-end industries
against growing competition from developing countries.
• Industry share of total employment drops as economy grows wealthier. In
major manufacturing economies - both advanced and developing - industry
provides more than 70% of total exports and accounts for up to 90% of business
R&D spending78
, but only adds 27.7% to global GDP79
. However, at the same
time, as economies mature, the share of services continues to increase together
with ongoing productivity improvements and specialisation in high-skill
activities. This leads to less employment in industry. The increasing use of
technology, especially automation technology, will make future
manufacturing processes less labour intensive, but nevertheless require an
increasing number of highly qualified staff. However, the global demand for
high-skill workers is outpacing supply. By 2020, the world may face a global
shortage of 40 million high-skill workers80
.
• Changing society requires new industrial responses81
. Global migration will
also increase, and will continue to be driven by political and economic factors as
well as increasingly by population imbalances and environmental factors. This
______________________
76 Among the 15 top manufacturer countries in terms of share of global nominal manufacturing gross value
added, China jumped from the 7th position in 1990 to the 2nd in 2010; India from the 14th to the 10th; South Korea
from the 11th to the 7th; Indonesia joined the group in 2010 at the 13th position. On the contrary, Germany
decreased from the 3rd position in 1990 to the 4th in 2010; France from the 6th to the 8th; Italy from the 4th to the
5th; the United Kingdom from the 5th to 9th; Spain from the 9th to the 14th. See McKinsey & Company (2012), p.
21. 77 Wübbeke et al. (2016), p.12. 78 McKinsey & Company (2012), p.3 (data refer to manufacturing). 79 World Development Indicators, World Bank. . 80 McKinsey & Company (2012), p.11. 81 European Commission (2014f).

33
will also result in increased urbanisation, especially in emerging industrialised
countries, as people seek work. Factories with zero environmental impact will
have a key role in this urbanisation trend as they become integrated into urban
society. Moreover, in the vast majority of global regions, and especially in the
EU, an ageing and dwindling society will have effects on demand for products
and services, with new markets serving older populations. Customer behaviour
will therefore also evolve. Customers, especially in more affluent, mature
economies, will increasingly choose products on the basis of their social and
environmental impact rather than on price alone. A new generation of
customers seem prepared to prefer access over ownership82
. This can be seen in
the increase of shared cars, machinery, and even articles of daily use. This is
driven by the fact that there is increased awareness of the ethical issues
surrounding product production. Customer choice will be better informed thanks
to the widespread use of social networking. This will result in a social ranking of
products, services and business practices.
• The share of services in manufacturing has increased. Manufacturing
industries of today conduct more service-like activities (like R&D, customer
support and marketing) than before. These activities usually account for 30% -
55% of manufacturing jobs in advanced economies. This is the result of changes
in demand and customer needs. Customers will increasingly demand a
package of products and services tailored to meet their individual needs.
The traditional model of ownership will evolve as social and environmental
pressures encourage people to demand more integrated products and services83
.
As a result, industrial enterprises and service providers will work more closely
together to build customer-driven solutions. Personalisation, enabled by new
production technologies such as robotics and additive manufacturing will be a
key driver for industry.
• Regional and local customisation will have a major effect on how industry
operates84
. Diverse global markets, distributed manufacturing and an
increasingly informed and prosperous global middle class will bring challenges
to industry. The new global market will lead to regional diversity of
costumer choice, with different regions often requiring very particular products,
with different features and different pricing policies. Industry will have to
respond by significantly improving its market analysis capabilities to capture
costumer requirements adequately. The production of goods and services will
therefore have to address mass customisation, and become localised and
______________________
82 The Ellen MacArthur Foundation (2013). 83 European Commission (2014f), p.32. 84 European Commission (2014f), p.32.

34
networked to be closer to customers, to respond to local demand, and to
decrease costs.
• Local comparative advantages in terms of factors of production will
influence more the location of enterprises. Depending on the sectors, factors
such as energy and labour costs or proximity to talent, markets, and
partners such as suppliers and researchers, will have greater weight. Five
groups85
of industrial sectors highlight where industrial activities are most likely
to take place, and help understand the role of innovation in various industries
(see Table 2.1).
The first group is global innovation for local markets, covering sectors such as
chemicals (including pharmaceuticals), automobiles, other transportation
equipment, and machinery, equipment, and appliances. Sectors in this group
have moderately highly R&D and depend on a steady stream of innovations and
new models to compete. Also, the nature of their products requires production
facilities close to customers to minimise transportation costs. The footprints of
these industries may also be influenced by regulation (e.g., safety standards) and
trade agreements.
The second group includes regional processing industries covering food
processing and other industries located close to demand and sources of raw
materials. Their products are not heavily traded and are not highly dependent on
R&D, but they are highly automated.
Energy- and resource-intensive commodities such as basic metals make up the
third group. For these sectors, energy prices are important, but they are also tied
to markets in which they sell, due to high capital and transportation costs.
Global technology sectors, the fourth group, such as computers and electronics
depend on global R&D and production networks. The high value density of
products such as electronic components and mobile phones, make them cheaper
to transport from production sites to customers around the globe.
The last group, labour-intensive tradables, such as clothing manufacturing,
covers goods that are highly tradable and enterprises require low-cost labour.
Production is globally traded and migrates to wherever labour rates are low and
transport is reliable.
• The supply chain will become more flexible. Industrial enterprises will also
seek to assure flexibility in their supply chain and that their production
______________________
85 McKinsey & Company (2012), pp.4-6.
35
lines can be reconfigured quickly (e.g. through self-adaptive and modular
machine tools and robots) to meet changing costumer requirements.
However, the regional customisation of demand will mean that the production
system will become more fragmented. Enterprises will therefore practise
‘hybrid manufacturing’, incorporating a mix of production processes
located in both high-cost and low-cost countries according to geographic
advantage86
and based on a wide range of factors (labour costs and skills,
infrastructure, regulation, policy, materials, market demand, etc.) enabled by
technological developments, especially in ICT. Different business models will
be developed to cope with the complexities of a global market. Clusters of
partners offering specialised services will form. These will be based on similar
technological skills, a common interest in a nearby source of raw materials, or
shared energy schemes. These partners will act as an ‘ecosystem’, applying
industrial symbiosis, feeding off each other in the value chain, and enabling the
‘cross-fertilisation’ of technology. The need for efficiency, and the realisation of
an increasing scarcity of natural resources, will drive some enterprises to seek
full control of their value chain through vertical integration. Enabled by new
technologies, the entire value chain will be controlled by individual enterprises
from the supply of raw materials to sale of products and services.
• Digitalisation and digital technological advances are creating new
development possibilities. Data will become the ‘new oil’87
. Increasingly
complex and large sets of data, supported by advanced analytical tools, will
enable manufacturing firms to better understand and optimise all stages of
their value chains. Ubiquitous computing has already become pervasive,
connecting all aspects of daily life, ranging from industrial processes to the
‘Internet of Things’ and cloud-based computing88
. These stages cover from
design to distribution, including supply chain management, production processes
and marketing. Moreover, in today’s highly competitive environment, digital
innovation is critical when it comes to addressing industrial enterprises’ key
business drivers and creating value89
. These key drivers include the potential to
cut costs, increase productivity, shorten time-to-market and increase customer
focus. Digital tools also allow for more efficient approach to capturing,
sharing and developing knowledge. Integrated knowledge management
systems allow industrial enterprises to build customer-tailored documentation,
user guides and technical specifications. Social technologies such as internal
social networks, wikis and micro-blogs can also be used as an aid to enhance
______________________
86 European Commission (2014f), p.33. 87 European Commission (2014f), p.33. 88 European Commission (2014d) p. 24 89 Capgemini Consulting (2012).

36
communication within the organization. Digital analytics helps also industrial
enterprises to reduce working capital costs through the use of centralized
data sources such as virtual factory. A central resource management database
also provides insights into the available and installed manufacturing means
while predictive maintenance reduces machine down-time. The result will be
agile manufacturing, enabled by new production processes and technologies,
such as additive manufacturing, software-enhanced added-value services, and
ICT. Companies will create more intelligent products based on cyber-physical
systems. The value chain, with complex logistics systems able to supply,
produce and distribute products flexibly, will result in a manufacturing
process that is more efficient and responsive to change.
• Materials will remain one of the critical factors for the competitiveness of
any advanced manufacturing company. The scarcity of many important
materials will continue to push the development of new, advanced materials.
These will provide industry with increased functionality, lower weight, lower
environmental burden, and energy efficiency. Smart, multifunctional
materials, able to change properties according to the environment (e.g.
temperature, pH, light, magnetic field, etc.) will become increasingly
available. These will enable the development of new, advanced and
environmentally friendly products, often based on organic, non-toxic, non-
harmful synthetic materials, which can be used endlessly in different product
cycles to enable a waste-free manufacturing system that can even protect and
enrich ecosystems. New technologies, arising from nanotechnologies and
associated nanomaterials, will underpin these developments.
• Industry of the future will enormously affect the way people work and live,
posing new social challenges90
. Increased application of robot-based solutions
in industry as well as in every-day life will revolutionise the global economy
(which will be further spurred by artificial intelligence and machine learning).
At the same time, dramatic advances in life sciences will undoubtedly yield
effects both on human longevity as well as on lifestyle, leading to demand for
new, specific and tailored products. Economic returns from these new sectors
and production processes will, most likely, be unevenly distributed. This
will generate deeper and possibly new global divisions of rich and poor
societies, which will have to find new ways to adapt. Contrary to the 20th
century when the left-right divide between political systems and markets
dominated, in the 21st century, the primary difference is between open and
closed political and economic models. Spurred by new competition, a series of
______________________
90 Ross (2016), pp.17-18.

37
hybrid political and economic models around the world are contributing to
greater uncertainty about which markets will dominate in the future.
2.3 Future pattern of specialisation of European regions
Forecast and data estimates of the evolution of regional industrial specialisation
across the EU in the coming years are not available. However, looking at current
key variables and taking into account industrial priorities foreseen in the EU
political agenda and the changing features of global industry discussed in
previous sections, it is possible to analyse the direction regions are moving in.
By looking at where regions have invested in human capital and innovation in
recent years, it is possible to identify trajectories for regional industry.
• Regions from central and northern Europe are expected to lead the
industrial innovation process in the coming years. Most of the technological
progress measured by the number of patent applications by technological
category to the European Patent Office related to the regional population (Figure
2.1), over the last decade has been in the central and northern Europe centres of
innovation. High-tech and ICT innovation areas almost perfectly overlap with
the most innovative regions in Noord-Brabant in Netherlands, Helsinki-Uusimaa
in Finland, Sydsverige and Stockholm in Sweden and Oberbayern and
Mittelfranken in Germany. Regions most innovative in biotechnology are
Brabant Wallon and Oost-Vlaanderen in Belgium, Hovedstaden in Denmark,
Oberbayern in Germany, Wien in Austria and Utrecht in the Netherlands.
Southern and eastern regions seem not to keep up the pace of innovation,
pointing to divergent paths of specialisation.
• Enhancement of human capital is expected to continue in eastern regions.
Despite regions from the EU-13 having a tendency to invest less in innovation,
they are investing significantly in human capital (right side of Figure 2.2) to
close the gap with the EU-15 (left side of Figure 2.2). Whether industries will be
able to produce goods in high-quality, high value added segments depends on
the skilled human capital in the regions. To this extent, human capital plays a
crucial role when designing and implementing long-term strategies and shaping
future patterns of specialisation towards more sophisticated products. Some
areas in eastern Europe and Portugal where high-tech industries are not yet well
developed, already have a lot of technical and scientific skills available with
respect to their active population. This makes a shift towards sectors requiring
high skills more feasible. Also when considering medium-term trends in the
technical and scientific professions (Figure 2.3), many peripheral areas that are
not standing out as innovation centres have a better perspective in terms of
human capital, indicating a path towards more knowledge-driven sectors.

38
Figure 2.2: Persons with tertiary education (ISCED) and employed in science and
technology, Percentage of active population Average yearly change (%), 2001-2015
2015
Source: own calculation based on Eurostat (see Annex II for detail)
• Specialisation of eastern regions in high and medium-high technology
industries have the potential to increase. As shown in figure 2.4, employment
increased in high and medium-high technology manufacturing across the
economic downturn in almost two regions out of five. Most of these are in the
EU-13, but also in Italy, Spain, Ireland and Portugal. Eastern regions seem to be
more competitive also in international markets for high-tech products (Figure
2.5). While most regions in the EU-15 maintained or lost their comparative
advantages in high-tech sectors, eastern regions, especially in Romania and the
Baltic Member States, have gained comparative advantage in exporting
technology intensive goods.

39
Figure 2.4: High and medium high-technology manufacturing, Percentage
of total employment, average yearly change (%, 2008-2015)
Source: own calculation based on Eurostat (see Annex II for detail)
Figure 2.6: Knowledge-intensive services, average yearly change in total employment
(%, 2008-2015) Market services, 2008-2015
Market services, 2015

40
High-tech services, 2008-2015
High-tech services, 2015
Source: own calculation based on Eurostat (see Annex II for detail)
• EU regions will further develop knowledge-intensive services related to
industry. Customising and providing high value added goods also requires
manufacturing products to include embedded services. Faced with a choice of
whether to produce internally or outsource the production of a component,
product or service, industrial enterprises tend to be reluctant to internalise such
activities. Outsourcing or establishing stable partnerships with service firms can
provide an opportunity for European manufacturers to experiment with service
implementation without internalising risks. In this regard, Knowledge-Intensive
Business Services (KIBS) firms are increasingly viewed as vital to maintaining
or enhancing the competitiveness of European industrial sectors. To this extent,
some regions are more ready to offer advanced services, allowing for a smoother
industrial transition. As Figure 2.6 points out, regions differ in their ability to
develop knowledge-intensive services recently. The highest growth has been in
Nord-Vest, Vest and Centru in Romania; Cornwall and Isles of Scilly, East
Yorkshire and Northern Lincolnshire, Highlands and Islands and North Eastern
Scotland in the United Kingdom; Ditiki Makedonia in Greece; Province de
Liege and Province de Limburg in Belgium. While for high-tech knowledge-
intensive services, the highest growth was in Inner London - West and
Lincolnshire in the United Kingdom, Basse-Normandie and Lorraine in France,
Cantabria and La Rioja in Spain; Centru, Nord-Est, Nord-Vest in Romania;
Vzhodna Slovenija in Slovenia and Lodzkie in Poland.
• There is a growing potential for re-shoring industrial activities. The recent
growth in Chinese wages in manufacturing sectors (Figure 2.7) has encouraged

41
some industrial activities to return to their original location91
. The development
of off-shore areas in terms of better working conditions and higher safety
regulations as well as the need to be closer to R&D centres and costumers, to
better anticipate their needs, may encourage the reshoring of some industrial
activities. The benefits from being redesigned in a local area can outweigh lower
production costs for some activities. While labour costs contribute to a lower
share of total costs, rising wages in China along with increased transport and
energy costs have contributed to a different perception of the global value chain
in some manufacturing sectors. The potential for relocating some parts of the
supply-chain is also connected to the increasing role of services in
manufacturing. Hence, by stimulating small scale specialisation and local
competencies linked to market opportunities, diversifying into related fields and
repositioning in the world value chain, activities can be successfully reshored for
some industries, e.g. automotive in the United Kingdom Midlands92
.
• Northern and central Europe will be the location for clusters in the most
dynamic emerging sectors. Regions in the EU-15, mostly in north and central
Europe, will be the location for emerging clusters (Figure 2.8). These have been
identified93
thanks to their cross-sector links in the most advanced sectors and
their potential in terms of internationalisation. Such industries include advanced
packaging, biopharmaceuticals, blue growth, creative industries, digital-based,
environmental, experience, logistical services, medical devices, and mobility
technology. Some of them are very broad and ubiquitous such as
environmental, digital-based and logistical services. These are cross-sector by
nature, span many other industries and are relevant to many types of cluster.
Other emerging industries have a well-defined core industry such as medical
devices, biopharmaceuticals, advanced packaging and mobility technology.
These demonstrate new industrial dynamics both through cross-technological
spill-overs and cross-industrial links. Blue growth is an emerging industry that
connects three big industrial themes; maritime, fisheries and off-shore drilling.
The creative and experience industries are diverse and include many design,
creative and recreational activities.
• Regions continue to invest in KETs, especially in Advanced Manufacturing
Systems and Advanced Materials. The consistent interest in KET-related RIS3
priorities has grown in recent years94
. Two out of every three regions and
countries have selected such priorities in their Smart Specialisation Strategies
______________________
91 Gibson (2014). 92 See Bailey and De Propris, (2014) and Bailey and De Propris (2016). 93 European Commission (2015a). 94 High-Level Expert Group on Key Enabling Technologies (2015), p.98.

42
(see Figure 2.9). Priorities in just two groups (Advanced Manufacturing Systems
and Advanced Materials) remain the largest share of all KET-related priorities.
Since 2013, their share has increased from 51.3% to 64.2% of all registered
KET-related priorities.
• European enterprises will increasingly adopt digital technologies. Looking at
the integration of digital technology (see Figure 2.10), European enterprises are
already increasingly adopting digital technologies, such as the use of a business
software for electronic information sharing (from 26% in 2013 to 36% of
enterprises in 2015), sending electronic invoices (from 11% in 2014 to 18% of
enterprises in 2016) or using social media to engage with customers and partners
(from 14% in 2013 to 20% of enterprises in 2016)95
. This pattern is expected
also for the incoming years. Moreover, it is estimated that digitisation of
products and services can add more than €110 billion of annual revenue in
Europe in the next five years96
. An additional contribution for the European
industrial development is expected from the ‘Internet of Things’ (IoT), which
has inaugurated a new age of ubiquitous connectivity and intelligence in which
components, products, services and platforms connect, virtualise and integrate
everything in a communication network for digital processing97
. The number of
IoT connections within the EU is estimated to increase from approximately 1.8
million in 2013 to almost 6 billion in 2020, leading to the EU IoT market being
higher than one trillion euros by 202098
. This growth in connectivity is expected
to bring vast economic benefits, whereby the IoT significantly reshapes industry
structures, with borders between products and services, as well as borders
between industrial sectors becoming less obvious than today. This may
materialise through, for example new innovative IoT services or applications;
improved products thanks to the addition of new services or applications coming
from connectivity; increased efficiency in processes; reduced consumption of
resources and energy; better understanding of customers' needs; increased
flexibility and possibility for sharing and co-creation99
.
• Industrial change will require a more holistic approach, combining different
tools. In many regions, there is a lack of systemic support architecture and
capable intermediaries. Single initiatives at universities or single investments
cannot replace them. To a certain extent, the smart specialisation agenda (RIS3)
of the European Commission has helped to establish local processes of
______________________
95 European Commission (2017a), p.4. 96 European Commission (2016), Digitising European Industry. 97 European Commission (2016d), p. 6. 98 European Commission (2016d), p. 7. 99 European Commission (2016d), p.8.

43
entrepreneurial discovery. However, much remains to be done in many regions
and therefore RIS3 will be more a key policy strategic tool for regions to take
full advantage of the benefits offered by the new industrial revolution. RIS3
strategies are integrated, place-based economic transformation agendas that do
five important things: they focus policy support and investments on key
national/regional priorities, challenges and needs for knowledge-based
development; they build on each country/region’s strengths, competitive
advantages and potential for excellence; they support technological as well as
practice-based innovation and aim to stimulate private sector investment; they
get stakeholders fully involved and encourage innovation and experimentation;
they are evidence-based and include sound monitoring and evaluation systems.


45
3. Key challenges for European
industry and their territorial
implications
As shown in Chapter 1, there are significant differences between EU regions in
terms of industrial specialisation, human capital endowment, innovation
capabilities, openness to trade flows, FDI attractiveness and infrastructure
efficiency. Challenges for LRAs and policy solutions that can be implemented
can therefore vary from region to region.
Countries and regions that fared best through the financial crisis had a systemic
industrial policy100
, based on pro-active actions supporting innovation,
investment in technology, education, openness, combining industrial
development with environmental and social goals and strengthening relations
between actors in the productive system101
. An effective industrial policy to
enhance local productivity, favour the upgrade of traditional industrial activities
or the creation of new segments in dynamic and modern sectors, should
therefore be “pulled by vision and pushed by competition102
”. It should
promote competition and be a discovery process in a cooperative climate
involving government and enterprises103
, be aligned with the long-term social
interests and be systemic, driven by a wider vision, instead of a standalone
policy in conflict with other strands of government policy.
Combining a policy vision that has long-term economic, social and
environmental objectives, with competitiveness, which is affected by
short-term economic factors and forces, is challenging for LRAs. This is
especially so when they are called on to design and implement a systemic
approach for sustainable and solid industrial growth while dealing with
continuous changes in demand and the fast emergence of new competitors.
This trade-off poses a series of questions for LRAs: which path to follow? What
are the key local sectors on which the industrial policy should be based? What
are the main constraints that dampen development of these sectors? How to
support these sectors to match the new demand needs, reach new markets and
______________________
100 Aiginger (2011). 101 Colletis (2014). 102 Aiginger (2014), p.10. 103 Aigineger (2014) p.24.

46
attract new investment? Is the institutional and governance framework adequate
to face these local industrial challenges?
The first group of challenges for LRAs relates to designing the pattern of
industrial specialisation. This means to identify the key sectors on which
industrial policy should be based. LRAs should understand if industrial policy
should be based on ‘comparative advantage-following’ – consolidating existing
strengths or on ‘comparative advantage-developing’ – seeking strategic
advantage in new sectors104
. Having identified the key sectors, LRAs should
then understand how to enhance industrial enterprise efficiency in the use of
inputs. This requires determining the key inputs to invest in to increase
industrial enterprise labour productivity (human and physical capital) or to
reduce production costs (raw materials and energy). A third group of challenges
is how LRAs support industrial enterprises to become more globally connected
to meet new demands and attract new investment. Finally, there are challenges
related to the adaptation of institutional capabilities to new industrial
challenges and how to make LRAs more responsive to industrial enterprise
needs.
The following sections will discuss these four groups of challenges.
3.1 Designing the pattern of industrial specialisation
The first challenge for LRAs promoting an industrial policy is to understand the
sectors to invest in and where to concentrate policy actions. There is no one-
size-fits-all approach to what is needed locally, or otherwise to foster an
industrial pattern of specialisation. Local specificity is both inevitable and
desirable. What works in one locality cannot be transferred in some context-free
way to another, no matter how similar. LRAs therefore need to analyse and
clearly understand the specific sectoral constraints and capabilities in the
territory. They can then identify economic activities that might be held back by
market failures and design policies to help these activities realise their full
potential.
LRAs are called on to identify the path industrial policy should take105
. This is a
choice between fostering industrial specialisation by enhancing traditional
sectors in which local industry already has a comparative advantage and
______________________
104Warwick (2013). 105 European Parliament (2013), p.23. See also Skokan (2009), p.774.

47
existing strengths, or supporting enterprises to move towards more
dynamic and high-technology sectors, which may be already established or
new106
:
• Path renewal, which denotes the rejuvenation of existing clusters or industries
and may imply severe changes in products, processes and organisations,
including the application of new technology in existing industries. Renewal is
associated with incremental change in old industrial regions, modifying their
development trajectory rather than altering it.
• Path formation of industries that are new for the region. This is based on
changes led by diversification. Diversification as way to renew old industrial
regions involves more significant change than the regeneration of mature
clusters. It opens up new directions of development, broadening the economic
base of the regional economy. Diversification is defined as the emergence of
clusters in established industries, that are, however, new in the region.
• Path creation implies a more radical change towards new high-tech and
knowledge intensive industries and results in radical changes in the technology
and knowledge base. This implies a major shift in the development trajectories
of these regions relying less on incumbent firms and more on completely new
enterprises.
3.1.1 Challenges for path renewal
Compared to the other development paths, revitalisation of traditional clusters in
most cases does not presuppose a far reaching transformation of the knowledge
generation and diffusion subsystem. This path means that LRAs need to discover
and elicit more information about the constraints that sectors face. This typically
requires close and strategic co-operation with the private sector. Regions
with very specialised traditional sectors that are experiencing decline107
may
______________________
106 Trippl and Tödtling (2008), p.8. 107 With changes in the international division of labour in the 1970s, the oil crisis and subsequent blows to
manufacturing in Europe, many industrial regions in the EU-15 relying on traditional sectors such as coal, steel,
textiles or machinery were suddenly confronted with shrinking businesses, unemployment and decline107. A
common feature of these regions was that they had experienced long periods of prosperity thanks to
specialisation on products that were basic inputs to other sectors (trains, rail infrastructure, chemical products,
electronics), or mass consumption goods (textiles, cars). The physical infrastructure as well as the qualification
of the workforce was completely focused on these basic industries and when these faced Europe-wide decline,
the crisis had a severe impact107. After EU enlargement similar issues of economic decline in huge
agglomerations were seen in some parts of new EU member states: decades of central planning left many regions
with even larger-scale problems of overdependence on basic industries, rapidly rising unemployment, and acute
environmental and infrastructure legacies. See European Parliament (2013).

48
find private investment insufficient and less profitable. Impediments are
physical infrastructure not adapted to the needs of industries, an extensive need
for land reclamation, a lack of future-oriented skills and R&D capacities, little
forward-looking entrepreneurship, physical distance from or poor connectivity
to future-oriented agglomerations, as well as institutional and cultural factors
that make it more difficult for forward looking firms to operate profitably. An
industrial policy aiming to modernise declining industries should be viewed as a
discovery process in which firms and government learn about underlying costs
and opportunities for traditional sectors and engage in strategic coordination108
.
The activities of research organisations, educational institutions and
technology transfer agencies can be vital to the restructuring process of
mature industries, pointing to the importance of the region’s knowledge
infrastructure.
The capacity of a sector to escape from lock-in and to regain its competitive
position is critically dependent on the restructuring strategies of large,
endogenous firms109
. In most cases a simple cost reduction response to a severe
crisis is not viable, whereas a search for market niches and an orientation to
innovation promises better results. To take the innovation path often
presupposes a major reorganisation of large dominant enterprises through
organisational innovation and changes such as decentralisation and enforcement
of innovation related functions and management tasks. However, in many cases
knowledge providers must also orientate strongly to the requirements of
smaller firms. Old industrial areas hosting heavy industries often have a supply
driven approach to technology transfer, which reaches larger firms better than
the smaller ones. A wider adjustment can only be realised if restructuring and
innovation are not confined to the larger enterprises. Smaller firms must also be
enabled to improve their innovation capabilities. This underscores the
importance for LRAs of improving the existing technology transfer system
by placing more emphasis on the needs of smaller enterprises.
An additional challenge for LRAs that embrace a pattern of revitalising
traditional industry, is to get rid of institutional legacy and ossified networks.
Breaking out of lock-ins and overcoming various forms of rigidities are key to
recovery for mature industries. Traditions and old patterns of behaviour and
thought can be long-lived, with institutional persistence negatively impacting
regional adaptation and change. For LRAs operating in these situations, there is
a strong need to renew business networks by substituting hierarchical inter-firm
links with more innovation-oriented interactions, leading to regional collective
______________________
108 Rodrik (2004). 109 Trippl and Tödtling (2008).

49
learning and innovation. Moreover, a substantial amount of policy learning is
crucial for mature industries to follow an innovation-oriented development
path. To break up petrified policy networks and to unlearn old patterns of
intervention such as providing subsidies for declining industries, in favour of
new growth coalitions and modern approaches of governance are crucial in
this respect.
3.1.2 Challenges for path formation or creation
A policy aimed at developing entirely new groups of enterprises in selected
established or new sectors could entail higher costs, higher risks and give rise
to destructive competition compared to renewal. The formation and growth of
high technology clusters presupposes a major transformation in the knowledge
generation and diffusion dimension of the regional innovation system. New
dynamic sectors and advanced manufacturing such as those based on KETs
require greater investments and policy initiative efforts. These industries are
associated with knowledge and capital-intensive technologies, necessitate
significant R&D, high capital expenditure and highly-skilled employment. They
also have rapid and integrated innovation cycles110
.
The key problem is that most leading technologies are developed by a few
frontier countries which dominate the entire global market111
. Innovation
follows different location criteria than production112
. Therefore, regions that lag
behind in terms of technological innovation capacity, can benefit by imitating
such technologies, for example by exploiting the benefits of inward investment.
Foreign enterprises with high value-added functions, which embed themselves
in the local economy by forming long-term links to regional suppliers and
partners, can give an important impetus to the emergence of new industrial
activities. The challenge for the LRAs in this case is to adopt policy tools to
ensure that these regional links are fully developed otherwise FDI projects
operating within global value chains may not be embed to the optimal degree
from a regional point of view.
In order to assimilate and exploit transferred knowledge, it is therefore
indispensable for industrial enterprises in laggard regions to develop a degree of
absorptive capacity113
, so they can reach a necessary level of technological
______________________
110 High-Level Expert Group on Key Enabling Technologies (2014). 111 European Commission (2013a). 112 McKinsey and Company (2012). See also Warwick (2013), p.36. 113 Cohen and Levinthal (1990) assigned the term “absorptive capacity” to the general capability of individuals,
groups, and enterprises to recognize the value of new information, choose what to adopt, and apply it to
innovation. Essential to the concept of absorptive capacity is the idea that accumulated experience with adoption

50
competence. Absorptive capacity is considered essential to close the gap with
technology leaders and spur economic growth. The formation of new
agglomerations in established industries can be heavily supported by an
accompanying reconfiguration of the regional innovation system for knowledge
generation and diffusion. Absorptive capacity can be increased through the
reorientation of research and educational organisations that are strongly
linked to the old industrial specialisation. The presence of excellent research
organisations, higher education institutes and supporting agents such as science
parks, academic spin-off centres, incubators, technology licensing offices or
innovation centres specialised in promoting young high tech enterprises, can
have an important impact on the emergence of high technology agglomerations.
However, taking the high tech road is strongly linked to intensive institution
building and institutional change. The emergence of new clusters in
established or new industries can only be effectively supported if key agents in
the political system promote reconfiguration of the region’s knowledge
infrastructure and if they redefine their role and learn to act as interlocutors and
facilitators of innovation networks. Strong institutions for knowledge
generation and diffusion are essential to help enterprises build bridges to
new technology paths or to differentiate their production. Stimulating new
industries cannot be done with old policy recipes and traditional instruments
such as subsidies, tax incentives or low cost labour. It requires a new mode of
LRA engagement, covering aspects such as investment in knowledge
infrastructure, securing risk capital and other measures to promote
entrepreneurship, assisting the formation of innovation links to encourage a
steady flow of knowledge.
This requires a long-term perspective and willingness to take risks within
the political system. Consequently, in old industrial regions a substantial
amount of policy learning is necessary as key agents in the political system have
experience of how to support traditional sectors but often lack a profound
understanding of the needs of high tech industries.
and invention improves the capacity to recognize and absorb high quality external ideas and create valuable
inventions. Absorptive capacity has two constituent components: 1) the capacity to adopt ideas from the outside
world, defined as “adoption capacity”; and 2) the capacity to create new inventions, defined as “invention
capacity”.

51
3.2 Enhancing industrial enterprise efficiency in the use of inputs
Once the key sectors and the industrial path have been identified, the second
group of challenges for LRAs is related to a more in-depth analysis of the main
factors (inputs) to enhance in order to raise industrial productivity, foster
competitiveness and encourage specialisation. Broadly, these are human and
physical capital, which are strictly related to labour productivity, as well as raw
materials and energy which affect production costs.
Regions with low labour productivity also spend less on R&D and have the
highest rates of NEET and fewer tertiary-educated people. For these regions in
particular, increasing public investment in R&D and supporting SME
innovation as well as enhancing the education and training system and the
employability of skilled workers, is vital. As seen in the previous section a
highly skilled labour force and production process innovations are a prerequisite
for the modernisation of local traditional sectors to make them more competitive
and for the launch and emergence of high-tech and dynamic sectors moving
industrial capability towards higher value added products.
A key challenge for regions that lag behind in terms of economic development is
to reverse the brain-drain of skilled workers114
. The departure of skilled
workers is a loss of public investment in education and of potential tax revenues.
This also affects innovation and technological progress and, in turn, industrial
productivity and growth. The drain of highly-skilled professionals leaving
Eastern and Southern Europe plays a major role in increased inequality,
contributing to the slowdown of the affected Members State economies.
However, regions with more innovation capacity can suffer skills
mismatches especially as progress in manufacturing technologies and changes
in customer needs will increase demand for specific skills and training.
Increasing the cross-border mobility of EU workers115
, which is still limited,
should favour knowledge transfer and match industrial demand for new
qualifications. Of course, industrial enterprises should be incentivised to take
______________________
114 Committee of the Regions (2016). 115 A CoR study on labour mobility reveal that EU-15 immigrants are much more highly educated than non-EU
immigrants and the national population in every country analysed. By contrast, the proportion of highly qualified
immigrants from new EU Member States varies substantially across destination countries: southern European
countries have a very low proportion of highly qualified immigrants from new EU Member States, while the
other destination countries have attracted a much larger proportion of highly qualified immigrants from the new
EU Member States. The education level of EU mobile workers has an important effect also on the capacity of
regions to generate knowledge and implement a definite pattern of innovation. Labour mobility is therefore more
efficiently used in regions that are more knowledge and innovation intensive. See Committee of the Regions
(2016).

52
on higher-skilled workers, ensuring proper wages for more qualified jobs but
without affecting production costs.
Empirical studies of the labour productivity gap between Europe and the US
found that the EU is not only still lagging behind the US, but the gap has
recently widened116
. In the EU there is insufficient investment in the skills and
organisational changes necessary to reap the benefits of ICT. Lower investment
in broadly conceived intangible assets such as R&D and human capital, are
likely to explain some of the US-EU productivity gap. These factors affect
countries' absorptive capacity and their ability to take advantage of technology
developed elsewhere (international technology transfers). European regions
and industrial enterprises cannot compete on low price and low quality
products. They must turn to productivity, resource-efficiency and high value-
added to compete in global markets, basing their comparative advantage on high
value added goods and services, the effective management of value chains and
access to markets across the world. Fostering absorption capacity is a key
challenge for regions that lag behind in terms of innovation capacity.
Favouring exchange of knowledge with science-based regions, enhancing
collaboration between universities and the productive sector, support for
collaborative research networks of inventors and the mobility of inventors
within the local labour market are all required to enhance local knowledge
creation117
.
Additional challenges relate to the use of inputs in the production process such
as raw materials and energy. EU industrial regions are mostly dependent on
raw materials from international markets, especially unprocessed minerals
and metals118
. They face a number of challenges regarding access to both
primary and secondary raw materials throughout the value chain of exploration,
extraction, processing and refining, recycling and substitution. This raises the
cost of production for industrial enterprises and reduces their capacity to
compete119
.
Moving to a strong bioeconomy and favouring adoption of a green model of
production would require LRAs to leverage further public and private
______________________
116 European Commission (2013a), p.75. 117 ESPON (2012). 118 European Commission (2014a), p.16. 119 In particular, regarding energy, EU industrial electricity prices are estimated to be twice as high as in the USA
and Russia and 20% higher than in China according to the International Energy Agency data. The price gap is
greater for gas: EU gas is three to four times more expensive for EU industry than for US, Russian and Indian
competitors, 12% more expensive than in China but cheaper than in Japan. Nevertheless, the prices effectively
paid by industrial users may vary from one Member State to another. See European Commission (2014a).

53
investment. This would increase the positive effects of spillover, improving
research productivity, launching public-private partnerships (PPPs), as well as
creating incentives for and reducing barriers to technology development and
research based innovation120
. The potential of green models of production can
be fully realised by working across several disciplines, policy areas and
sectors with a strong willingness to jointly address diverse responsibilities.
Greater benefit could be obtained from better policy coherence in the
identification and deployment of promising pathways for the green model.
These could cover next generation biofuels and bio-based products, facilitation
of their commercialisation and use, coordinated national planning for waste
management and use, better costumer acceptance of new technologies, and
understanding the links between non-food use of food commodities and
agricultural land, on the one hand, and food price levels and volatility on the
other hand to reduce or prevent adverse effects.
3.3 Supporting industrial enterprises to become more market
connected
Internationalisation is important for the growth of European industrial
enterprises. There is a positive correlation between being internationally active
and reporting high turnover growth, and higher employment growth. The
relationship between internationalisation and innovation is strong121
.
Internationalisation of European industry means not only support for
enterprises to exploit the advantages of operating in a single market with
more than 500 million potential customers, but also to enhance their
capacity to reach new fast growing markets outside the EU122
. However,
emerging markets have diverse customers in terms of cultures, living conditions
and income. This raises pressures to adapt manufacturing to new patterns of
demand. Greater variation in product requirements puts pressure on
manufacturing business models to support flexible production for more varied
products in different markets. Diverse customer demands are an opportunity for
enterprises that can use input from customers as a source of innovation.
Enterprises that also manage to modularise production processes through
______________________
120 European Commission (2012c). 121 European Commission (2015b). 122 Around half of SMEs (52%) in the EU are involved in international business inside or outside the Internal
Market. The EU is the main destination of goods or services for four fifths of SMEs that export; moreover,
among exporters, the local market still represented the largest proportion of sales in 2014; on average, 66% of
sales in 2014 were within a company’s own country. Moreover, the larger the company the more likely it is to
have exported to or imported from countries outside the EU. See EC (2015b).

54
digitalisation are more capable of tailoring products to different markets cost
effectively.
LRAs can play a significant role in stimulating SMEs to internationalise and
meet the new growing markets, reducing key obstacles to international trade.
The main obstacles to internationalisation are123
:
complicated administrative procedures as a barrier to exporting,
delivery costs as a problem when importing;
large financial investments required for SMEs to participate in
international markets;
complicated or costly foreign taxation or cross-border complaints and
disputes;
limited use of e-commerce124
, just over two thirds of SMEs across the EU
have a website which displays the products or services they have to offer;
it is possible to order goods or services online at less than a third of SMEs
and only a fifth accept payments online125
;
scarce information about the potential export market, (not knowing
the rules causes problems when exporting), and difficulties in identifying
partners abroad (SMEs are also generally not very aware of public support
programmes for internationalisation: for example, less than one in ten
SMEs have heard of the Enterprise Europe Network126
);
lack of skills such as foreign languages, or specialised staff to deal with
exports.
An additional challenge for LRAs that intend to push SMEs to be more
market connected and exploit the advantage of openness to trade, is
creating an economic and institutional environment to attract FDI. FDI may
complement local investment and can add to local production capacity127
.
______________________
123 EC (2015b), p.10. 124 EC (2015b), p.15. 125 Generally, countries located in northern and central Europe tend to have larger proportions of SMEs with a
website that presents products or services. For example, more than four fifths of SMEs in Denmark (89%),
Sweden (87%), Austria (85%) and Belgium (81%). Conversely, less than half of SMEs have this facility in
Bulgaria (34%), Italy (45%) and Romania (48%). Interestingly, no geographical patterns emerge with regard to
the possibility of ordering SME products or services online. At least four in ten SMEs in Poland (50%), the
Czech Republic (49%) and the UK (41%) have this capability, compared with less than a quarter in Italy (16%),
Spain (20%), Bulgaria and Germany (both 23%). Polish SMEs are by far the most likely to say that it is possible
to pay for their products or services online, with just under a third holding this claim in the Netherlands (31%),
the Czech Republic, Greece and Ireland (all 30%). By contrast, just over a tenth say this in Slovenia (11%),
Spain and Estonia (both 13%). See EC (2015b). 126 EC (2015b), p. 11. With some 600 member organisations covering more than 60 countries, the Network helps
enterprises take advantage of international business opportunities inside the EU and beyond. 127 Casi and Resmini (2011).

55
Moreover, it can promote growth by stimulating productivity gains from
spillovers to local firms. FDI is a primary mechanism for host economies to gain
access to advanced technology, managerial expertise and skills. The inward flow
of FDI also has a positive impact on employment. It may generate increased
demand for skilled workers and encourage inter-regional mobility128
.
To make local industrial sectors more attractive for FDI, LRAs should reduce
the following bottlenecks:
industrial stagnation reducing the attractiveness of foreign capital (fast
growing markets are associated with higher FDI inflows);
a less educated regional workforce and low level of R&D spending129
;
weak infrastructure, limited information, technology and access;
labour rigidities, as labour market flexibility is key for attracting FDI;
low institutional quality;
few clusters and agglomeration economies;
information asymmetries130
(investors typically do not have perfect
information about countries, regions and investment opportunities).
The internationalisation of industry poses new challenges for enterprises not
only in terms of how to reach new markets or attract new sources of investments
(FDI), but also in terms of where to locate production activities. A current
debate131
questions the key advantages and challenges for industrial enterprises
moving parts of their value chain to their home economies after decades of
production offshoring and outsourcing.
With labour costs making up a lower share of total costs, increased transport and
energy costs, rising wages in key areas of China (see Figure 2.6), and a greater
awareness of supply chain resilience, the reshoring of some production activities
can be an efficient option. Reshoring could generate significant spillover for
local economies, especially those specialised in industrial activities for which
demand is less price-elastic and where technology, knowledge and innovation
shape the competitiveness contest132
. Reshoring contributes to repopulating the
regional business network with domestic SMEs in the industrial supply chain.
These were squeezed out by large corporations in the past. This could create
new synergies with services requiring a co-location of activities to maximise
quality for customers. There is a new generation of products for which local co-
______________________
128 Driffield et al. (2013). 129 European Commission (2006). 130 Warwick (2013). 131 Bailey and De Propris (2014), Gibson (2014), and Bailey and De Propris (2016). 132 Bailey and De Propris (2016).

56
production between the producer and the user is necessary to the extent that
innovation tends to be embedded in the production itself. However, support for
reshoring production can be challenging especially in areas affected by133
high labour costs, limited access to finance, lack of skilled workers and high
energy and raw material costs.
3.4 Adapt institutional capabilities to new industrial challenges
Additional challenges for LRAs dealing with industrial policy concern their
ability to adapt the institutional framework to local industrial needs. The process
of upgrading the industrial structure to a level consistent with regional factor
endowments cannot rely solely on the market mechanism134
to promote
economic growth135
. A European Commission analysis136
indicates that the poor
quality of governance and institutions is the main obstacle to development in the
low-growth regions. Improving the quality of government can have multiple
benefits from a more efficient business environment, to better public services
and to improved regional development strategies. LRAs can shape incentives for
key economic actors, influence investments in physical and human capital and
technology137
and the organisation of production. LRAs can help allocate
resources to their most efficient use, help territories to adjust and react to
change, as well as generate ‘adaptive efficiency’ that enhances the willingness
and capacity of local actors to adopt new knowledge and to engage in innovative
and creative activities138
.
Policies to promote productive capabilities relate to different areas and require
a comprehensive and coordinated strategy. Education, training, trade,
investment, R&D, technology and migration policies can all play an important
role as they contribute to transforming and enriching knowledge structures in the
labour force and support the evolution of routines and institutions. LRAs can
therefore play a decisive role in creating a high competence institutional
framework to support rapid and sustained processes of learning and capability
______________________
133 Bailey and De Propris (2014). 134 UNCTAD and ILO (2014). 135 Acemoglu, Johnson and Robinson (2005). 136 European Commission (2017b). 137 According to Silve and Plekhanov (2015) exports of innovation-intensive industries grow relatively faster in
countries with stronger economic institutions, and this effect is statistically significant. In particular, the analysis
showed that industries with higher levels of innovation grow faster in countries with a higher quality of
economic institutions. Countries with better economic institutions therefore tend to develop more innovation-
intensive structures of exports as over time innovation-intensive industries increase their contribution to exports
from these countries. 138 Rodríguez-Pose (2013).

57
development, generating incentives and pressure to learn, encouraging
experimentation and learning from it, rewarding critical thinking and creativity
and providing direct support measures for such activities. Specific local
institutional arrangements can enable localities and regions to embark on a
sustainable trajectory to economic development. It is often thought that these
institutional arrangements work better locally and regionally, as the national
scale can be too distant, remote, and detached to be effective in mobilising
organisations139
.
Industrial policy has moved from a traditional approach, based on product
market interventions (subsidies, state ownership, tariff protection), through a
phase of correcting market failure with taxes and subsidies, operating mainly on
factor markets (R&D, training, access to finance) to a third stage of helping to
build up systems, create networks, develop institutions and align strategic
priorities140
. As manufacturing evolves, policy makers must adjust their
expectations and look at industry not as a source of mass employment in
traditional production work, but as a critical driver of innovation,
productivity and competitiveness141
. The role of policy in industry is not only
about enabling and creating an environment for competitive and innovative
enterprises to grow, nor just in terms of a more efficient use of inputs or a more
tailored matching of demands, but also about removing regulatory and
administrative barriers that dampen entrepreneurial initiatives, investing in
infrastructure supporting industrial development and coordinating policy
interventions with the private sector.
Industry production in Europe and the sale of goods and services are subject to
many administrative requirements and regulations142
. These include registration
of a firm, certification of products and services, their respective mutual
recognition schemes, requirements on emissions, the security of industrial
goods, safeguarding intellectual property rights and technical standards. All of
these factors have cost implications for industrial enterprises. Moreover,
differences in regulations or how regulations are implemented and
interpreted across Member States can lead to additional costs. So firms can
be at a competitive disadvantage in worldwide markets.
The centrality of institutions and policies in structural change highlights that the
general quality of institutions is important. The main role of public actors should
______________________
139 Rodríguez-Pose (2013). 140 Aiginger (2014), p.13. See also Warwick (2013). 141 McKinsey and Company (2012). 142 European Parliament (2014), p.36.

58
be to examine developments and anticipate the complementary abilities required
by enterprises. This will involve:
significant improvement in the quality of co-ordination between public
actors as well as strengthening relationships between public and
private actors;
a long-term vision for industrial policy, making each policy initiative part
of a long-term industrial plan;
within institutions, limiting the fragmentation of policy initiatives
across different departments and promoting well-coordinated initiatives;
implementing a comprehensive and coordinated strategy;
developing accountability and transparency mechanisms143
;
reducing the administrative burden for SMEs, as indicated by Principle
IV of the SBA144
, making public administration more responsive to
enterprise needs, by adopting for example, IT and e-government.
______________________
143 Rodrik (2004). 144 European Commission (2008).

59
4. How LRAs are responding to the
challenges
European regions have different industrial inputs, follow different patterns of
specialisation and face different challenges. Various policy actions can be designed
and activated by LRAs to solve industrial challenges and exploit local industrial
potential. A broad and inclusive definition provided by the OECD145
specifies that an
industrial policy is:
“… any type of intervention or government policy that attempts to improve the
business environment or to alter the structure of economic activity toward sectors,
technologies or tasks that are expected to offer better prospects for economic growth
or societal welfare than would occur in the absence of such intervention…”
This definition foresees a wide range of policy initiatives. It includes any type of
intervention, not just selective or targeted interventions, thus including functional or
horizontal policies as well as more targeted approaches. It includes policies to
improve the business environment, sometimes referred to as ‘framework
conditions’, not just those with the express aim of altering the structure of the
economy. It includes those that aim to alter the structure of economic activity, a
much broader term than ‘production’, which might be construed as relating only to
production industries or the manufacturing sector alone or, even more narrowly, the
fabrication stage of the manufacturing value chain. It may aim to switch resources not
only to particular sectors but also towards certain technologies (for example
biotech, ICT or clean-tech) or even ‘tasks’. It may target not only productivity,
employment or growth objectives, but may contribute to social welfare, ensuring
industrial policy is closely integrated with other policies as part of a broader
government social and economic strategy.
The next sections include examples showing how LRAs are responding to industrial
challenges, adopting different policy solutions with different rationales, domains,
orientation and target groups, to achieve different objectives146
.
______________________
145 Warwick (2013), p.16. 146 Warwick (2013) p.17. Target group: Is the policy aimed at a specific sector (or technology, or input, e.g. R&D, or
stage of the value chain), at individual firms or at local/regional clusters? Rationale: Is the philosophy that the
distribution of economic activity should generally be left to the market, is there a role seen for correcting market
failures or, indeed, is market failure regarded as endemic? To what extent does thinking based on new growth,
evolutionist and institutionalist models shape the approach taken to addressing market failure? How is systems failure
viewed? What about government failure? Are there areas where government action can be particularly effective in
reducing distortions or unlocking inertia? Policy domain: Do the instruments of industrial policy operate mainly on the
product market, or are they focused on factor markets – labour, capital, land and technology? What is the role for
policies aimed at developing entrepreneurship or facilitating co-ordination or at the creation of new systems and
networks? Policy orientation: Is policy horizontal/functional or vertical/selective? Is targeting done strategically or in

60
4.1 LRAs designing the pattern of industrial specialisation
4.1.1 Dealing with traditional sectors
As stressed in section 3.1.1, industrial path renewal necessitates an in-depth
understanding of the key problems that constrain modernisation in traditional sectors.
A successful strategy to enhance the competitiveness of a traditional sector requires
close co-operation with the private sector.
Marinha Grande147
is an industrial town in the central region of Portugal with a
traditional dependence on manufacturing (accounting for 63.2% of jobs), particularly
in advanced processing for glass and plastics. Faced with a need to reconvert the
glass-making industry, a partnership led by the local authority and including local
entrepreneurs, developed a strategy to increase the competitiveness of the town’s
glass and moulding industry for consideration by the Portuguese Government as a
‘zone of excellence’. Success of the partnership is attributed to strong leadership
provided by the local authority and the strength of involvement of local industry
representatives. This enabled identification of specifically local needs relating to
competitiveness, as well as the development of a customised local response.
Improving collaboration between universities and research centres and the
productive sector is another effective strategy for industrial policy initiatives
aiming at renewal.
Moravian-Silesian Region in the Czech Republic is a region with an old tradition of
steel production and a high concentration of metallurgical enterprises since the
1970s. After 1990 a new cluster in the region started as a joint initiative of VSB-
Technical University of Ostrava and the Regional Development Agency of Ostrava
supported by the Czech government agency CzechInvest148
. Interactions between the
highly developed industrial base and extensive education system with a range of
initiatives supporting research and development, have led to the region becoming the
Czech leader for clusters to support the local development of key economic sectors.
response to market pressures? Is intervention time-limited or longer-term? Is support conditional or unconditional? To
what extent does policy work with existing comparative advantage or explore new areas? 147 European Commission (2004). 148 European Commission (2004).

61
Box 4.1 The experience of Podkarpackie Voivodship (Poland)
The region in figures
Industry value added, share of total value added (%) 29,3
Industry value added, share of total value added. avg. yearly change 2001-2014 (%) 6,7
Services value added avg. yearly change 2001-2014 (%) 4,9
Employment in Industry avg. yearly change 2008-2015 (%) -0,7
Labour Productivity 2013 (EUR per hour) 10,7
Labour Productivity avg. yearly change 2001-2013 (%) 6,2
Business enterprise sector intramural R&D expenditure (% of GDP avg. 2014-2005) 0,5
Employment share of High and medium high-tech manufacturing 2015 (%) 6,0
Employment share of High and medium high-tech manufacturing avg. yearly change 2009-2015 (%) 1,2
Employment share of High-tech Knowledge Intensive services 2015 (%) 0,9
Employment share of High-tech Knowledge Intensive services avg. yearly change 2009-2015 (%) -1,4
Regional Competitiveness Index 2013 -0,7
Semi-peripheral position of Poland in the global economy leads to certain challenges
from the point of view of development and supporting it by means of industrial policy.
Firstly, Polish enterprises depend largely on foreign knowledge and technology, as
well as on decisions of leading multinationals in European production networks.
Secondly, Polish enterprises very often lack the scale and scope of activity that are
necessary to compete internationally, especially in the European Single Market. Low
scale means low margins and small own capitals. Thus, their strategies are oriented
mostly on the short-term, with low propensity and capability to invest and to innovate.
Finally, institutional surrounding of industrial policy in Poland remains
underdeveloped. It refers to such crucial aspects as capabilities of policy makers and
developmental agencies, existence of ‘intermediate institutions’ and channels of
coordination between the businesses and the state. For years, Polish policy was
oriented on attracting foreign capital and spending EU funds, and only recently the
government started to notice the need to enhance domestic capabilities.
The most prominent example of a successful regional industrial development in
Poland is represented by Podkarpackie Voivodship, related to the growth of the
aviation sector. The region as a whole, situated in Eastern Poland, is one of the poorest
in the country. Podkarpackie Voivodship is specialised in aviation since the inter-war
period, as an element of the Polish industrialization strategy. Technological
knowledge, specialized, high-skilled employees, as well as networks of suppliers
managed to survive the tough transition period of 1990’s. In 2003 a cluster ‘The
Aviation Valley Association’ was founded, to enhance cooperation between
enterprises in the sector. The cluster includes over 100 enterprises, with around 24
thousand workers employed. Main activities of the cluster have been: development of
a high-quality supply chain, cooperation with local universities (R&D, engineers) as
well as high-schools (skilled manual workers), participation in the processes of
regulation, promotion of the industry abroad. The industry has been supported by local
and state authorities, as well as by the European funds. Apart from involvement of
universities and schools, and financial support from the EU, important

62
intermediary institutions were formed, oriented at creation of networks and
knowledge. A key success factor for developing the cluster was in fact the tight
cooperation with local universities (R&D, engineers) as well as high-schools (skilled
manual workers). Moreover, the science and technology park, AEROPOLIS, strongly
supported individual enterprises and built links between firms. It also ran a ‘Pre-
incubator’, which facilitated the growth of small, student enterprises. The Centre of
Advanced Technology ‘AERONET - Aviation Valley’ was responsible for long-term
research and the commercialisation of technologies, involving actors from
business and science.
Nordrhein Westfalen in Germany had a concentration of old and established
industries for a long time. New universities, public science and technology institutes
and technology transfer centres were established and built up after reunification, to
re-structure the traditional industries149
. One major objective of the regional industrial
policy referred to improved links between enterprises, public R&D institutions,
technology transfer centres and consultants.
Box 4.2 The experience of Saxony (Germany)
The region in figures
Industry value added, share of total value added (%) 24,0
Industry value added, share of total value added. avg. yearly change 2001-2014 (%) 3,7
Services value added avg. yearly change 2001-2014 (%) 2,2
Employment in Industry avg. yearly change 2008-2015 (%) -0,6
Labour Productivity 2013 (EUR per hour) 40,0
Labour Productivity avg. yearly change 2001-2013 (%) 4,1
Business enterprise sector intramural R&D expenditure (% of GDP avg. 2014-2005) 1,2
Employment share of High and medium high-tech manufacturing 2015 (%) 8,7
Employment share of High and medium high-tech manufacturing avg. yearly change 2009-2015 (%) 0,2
Employment share of High-tech Knowledge Intensive services 2015 (%) 2,4
Employment share of High-tech Knowledge Intensive services avg. yearly change 2009-2015 (%) 1,0
Regional Competitiveness Index 2013 n.a.
Saxony was under socialist regime until 1989 and therefore was faced with the need to
reorganize its economic structure and innovation systems. Saxony has to be seen as an
industrial heartland of the Eastern Länder with a long tradition of industrial expertise.
After re-unification, large investments by leading multinational companies, e.g.
Volkswagen in Dresden and Mosel (Zwickau), Porsche and BMW in Leipzig, Infineon
in Dresden-Leipzig, indicate the importance of industries for the economic
development in this region. Moreover, Saxony has the largest population and is the
most closely settled Land of all East German Länder. Simultaneously Saxony is the
______________________
149 Helmut, Möller and Wink (2003).

63
most strongly industrialised economic region in East Germany. GDP and turnover as
well as export rates and investment rates indicate the leading position of Saxony
among the East German Länder.
Saxony is certainly the most successful East German region in terms of innovation
performance and technological restructuring150. Saxony was highly successful in
attracting outward investment (including R&D investment by multinationals) in high
technology industries. The regional government has played, and continues to play,
a critical role in this process. The experience of Saxony suggests in fact that strong
coordination between different policy levels can be essential for improved
innovation in local industries and technological restructuring. A differentiated
research and innovation policy has used strengths in science and industrial research
which were built up under the German Democratic Republic. By strongly interacting
with national initiatives and with EU structural funding, Saxony was able to develop a
strong research base in both the public and private sectors151. Policy actions of the
European Union, the national government, the regional government and the local
government are well-coordinated. Formal and informal coordination mechanisms
maintain these interactions. EU and national funding have played a major role in the
technology focus of R&D programmes. These address different target groups with
different instruments, offering a full range of support initiatives. Large projects by
enterprises with an international focus tend to be co-funded by the EU and national
sources, while large projects with a primarily national focus are typically funded by
the national government. National programmes are frequently oriented towards basic
research while smaller collaborative projects with a regional focus are almost all
funded by the region. These R&D policy initiatives and measures have a double aim.
One is to develop and maintain a strong research basis with a particular focus on
academic research with a clear link to potential commercialisation of research results,
including the potential to co-operate with enterprises. The other aim is to focus on
thematic research that is either closely linked to traditional strengths of the
regional economy (microelectronics, machinery, materials, automotive) or to growth
perspectives for successful industrial restructuring of the region (e.g.
biotechnology, environmental technology, medical technology).
Another successful policy instrument is to create a new local ‘image’, as in Marinha
Grande in Portugal. Here improved tourist facilities increase the attractiveness of the
region and put considerable attention on local services to encourage social integration
through sports and culture. While continuing to attract investment remains a priority,
local partnerships in old industrial and mining areas can also add a new ‘story’ to a
view of the future152
. ‘Rebranding’ the locality and ‘image’ are a means of drawing
______________________
150 Sellenthin and Rammer (2007). 151 Sellenthin and Rammer (2007). 152 European Commission (2004).

64
wealth as well as investment to particular locations. The strength and depth of local
partnerships and networks and the extent to which they share a positive view of
themselves and their city or region’s place in the world, is an attractive force for
new investment.
A similar strategy was implemented by the Municipality of Lyon in France, with the
ONLYLYON programme. This aims to make Lyon a top business location by
exploiting the city’s comparative advantages. The programme promotes Lyon as a
biotech capital with world-class clusters, boosts university standards to join the top
30 in Europe, develops infrastructure, strengthens financial and service systems and
develops the tourist industry. During 2011, 340 investment projects were successfully
created, creating 4,221 jobs. This added to the portfolio of 400 projects from
Aderly153
, the Economic Development Agency for Lyon. The 2012-2014 strategy
identifies performance indicators, target sectors and a plan to monitor international
investors in the region, adapting to new economic challenges affecting the business
environment.
4.1.2 Moving industrial specialisation towards new sectors
As already underlined in Chapter 3, adopting a strategy of formation or creation may
require greater policy efforts, entailing higher costs and risks, and potentially leading
to destructive competition. More investments enhancing R&D and human capital are
therefore needed and stronger cooperation between institutions and research centres,
the private sector and different policy levels is necessary.
This includes LRAs stimulating local enterprises to move towards industry 4.0
activities. The tremendous evolution of ICT is driving this digital transformation of
industry (but also society as a whole) with increasing speed. The establishment of
intelligent production processes as well as intelligent products and systems (‘Internet
of Things’154
) is the focus of industry 4.0. There are huge opportunities for new
businesses in Europe, but more importantly for existing industrial enterprises. The
European Commission estimates that 75% of the economic impact from the digital
economy will be captured by traditional industries. The speed of evolution will be
critical also for new job creation.
In Flanders, Belgium, the concept is promoted through Industrie 4.0155
. This platform
connects all industry 4.0 initiatives in Flanders and related concepts. The platform
highlights initiatives and organisations supporting industrial development in Flanders
such as Flanders Make, a strategic research centre for the manufacturing industry set
______________________
153 ECORYS (2013). 154 See European Commission (2014d), p.26. 155 Geerts et al. (2016).

65
up in in 2014. Its purpose is to create a top-level research network in Flanders that
delivers full support to industrial enterprise innovation projects. This includes new
products and processes for vehicles, machines and factories of the future. The
mission of Flanders Make is to strengthen the long-term international
competitiveness of the Flemish manufacturing industry, by carrying out excellent,
industrially relevant, pre-competitive research in the field of mechatronics, product
development and advanced production technologies. It builds an ecosystem in
which industry and knowledge institutes collaborate closely to translate the
results of fundamental research into product and process innovations.
The creation of new sectors and support for the start-up of new industrial enterprises
in most advanced activities is also beneficial for the re-vitalisation of enterprises
operating in traditional industries.
Baden-Württemberg in Germany156
is an innovation leader in Europe. The federal
state is highly specialised in manufacturing machinery and equipment as well as
motor vehicles, trailers and semi-trailers. Several big enterprises are based in the
region and already apply or produce industry 4.0 solutions. In order to combine
knowledge and activities in the region, Alliance Industry 4.0 was established in 2015.
This network was initiated and funded by the federal state of Baden-Württemberg to
assist enterprises in their digital transformation process by pooling resources and
know-how from production, information and communication technology. To promote
the application of industry 4.0 solutions on a broad scale, 15 learning factories are
being established at vocational schools. These facilities also contribute to spreading
technologies to SMEs. The emerging industry sectors stimulate innovation in the
entire region (both by supplying innovation as well as by creating a demand for
innovative solutions) and have a positive effect on the modernisation of other
industries. The best evidence of this process is the intensive transformation of the
car industry in recent years with modern production technologies,
microelectronics and new IT solutions. At present, the car industry in Baden-
Württemberg is a leader in robotics and other advanced technologies. It also allocates
more resources to research and development than all other industries in the region.
One key factor for the success of a formation or creation path is the presence of
high-level educational facilities that can establish collaborative synergies and
cooperation activities.
______________________
156 Technopolis (2016).

66
North Karelia in Finland has generated new clusters, thanks to its high-level research
centres157
. As a result of long-term development, North Karelia succeeded in creating
a cluster of high-quality expertise in materials and precision technology and
diffractive optics. The strong educational foundation in natural sciences at the
University of Eastern Finland combined with technological studies in the North
Karelia University of Applied Sciences have enabled the formation of a broad cluster
based on high-quality expertise. This has also generated new spin-off enterprises and
entirely new types of business based on plastics and metals and associated with
composite materials. The fields of materials and precision technology and diffractive
optics constitute strategically important interfaces for the technology industry. The
areas of expertise are based on hi-tech infrastructure and knowledge-intensive
research and development activity. The development work was funded by
mutually complementary investment and projects, implemented through a
cooperation network of local businesses and institutes of higher education.
Successfully generating a complex and differentiated cluster landscape was
developed in recent years also in, the already cited, Baden-Württemberg in
Germany158
. Many enterprises, research institutions and universities were
involved in regional cluster initiatives and state-wide networks. The
stakeholders of these cluster initiatives interact effectively, at a high level. With
this cluster approach, innovative processes were enabled through an interdisciplinary
and organised exchange of knowledge and expertise. Five agencies were established
and made responsible for the promotion of different sectors, financed by the regional
government. The sectors were chosen based on their potential to support the
necessary transformation of industries to stay competitive. In the region clusters are
seen as an ideal instrument for continuous organic innovation transfer to SMEs
(60% of cluster members in the region are SMEs).
The development of new clusters and the establishment of new high-tech sectors also
require strong cooperation between governments, research institutes and
industrial enterprises.
Upper Austria in Austria in 2006 created Clusterland Upper Austria, a centre of
competence for cross-company cooperation, to support networking through
clusters159
. This has six clusters and three networks. Upper Austria's regional
innovation agency (TMG) owns 61%, the Upper Austrian Chamber of Commerce
and the Federation of Austrian Industry each have 19.5%. More than 1,600
enterprises are cross-linked in clusters and networks. These were developed gradually
in sectors of regional strength such as automotive, plastics, furniture and timber
______________________
157 Regional Council for North Karealia (2010). 158 CluStrat (2013). 159 Technopolis (2012).

67
construction, health technology, mechatronics and environmental technology. Many
cooperation projects have developed new technologies and products. These represent
a successful proof-of-concept. Many factors influence a company’s competitiveness
and competence but they are not necessarily specific to the particular industry in
which the company operates. Experiences from one sector can often be used in
another just as well. Therefore, inter-sector networks have been developed in Upper
Austria covering human resources, design and media and energy efficiency. These
networks focus on non-technological innovations.
Box 4.3 The experience of Southern Denmark (Denmark) – Part 1
The region in figures
Industry value added, share of total value added (%) 19,0
Industry value added, share of total value added. avg. yearly change 2001-2014 (%) 0,7
Services value added avg. yearly change 2001-2014 (%) 3,4
Employment in Industry avg. yearly change 2008-2015 (%) -3,7
Labour Productivity 2013 (EUR per hour) 63,0
Labour Productivity avg. yearly change 2001-2013 (%) 4,1
Business enterprise sector intramural R&D expenditure (% of GDP avg. 2014-2005) 1,0
Employment share of High and medium high-tech manufacturing 2015 (%) 5,3
Employment share of High and medium high-tech manufacturing avg. yearly change 2009-2015 (%) -2,7
Employment share of High-tech Knowledge Intensive services 2015 (%) 2,1
Employment share of High-tech Knowledge Intensive services avg. yearly change 2009-2015 (%) 4,5
Regional Competitiveness Index 2013 0,3
Development and production of welfare and health technological solutions are an area
which comprises major economic and business growth potential on a global scale. The
welfare technological cluster in the Region of Southern Denmark seems to have
spotted this potential160. The number of companies in the cluster is growing. New
welfare technological entrepreneurial businesses are established while at the same
time the existing companies see new opportunities within the area and convert
their production completely or partially to the welfare technology. In addition, big,
already established companies, regard the cluster as access to a possible growth market
for selling their knowledge and products. Furthermore, the companies in the cluster
become more and more interested in cooperating with other companies in order to
develop together and bring new solutions to the market.
Denmark’s strong position in the field of welfare technology is due to the unique
competence and knowledge present in Danish companies, knowledge institutions,
investor and other players. Since 2008, the Region has had a special focus on cluster
development as a business-political tool for promoting growth, innovation and
______________________
160 Napier and Kethelz (2014).

68
employment. An active role in the development of the cluster is provided by the
Growth Forum of Southern Denmark. The Growth Forum is a hub for regional growth
initiatives and is made up of representatives of the regional council, local authorities,
research institutions, business communities and business organisations161. The Growth
Forum prepares a commercial development strategy and action plan, monitors regional
and local growth conditions and recommends co-financing of regional business
development activities. In particular, the Growth Forum enhances cluster infrastructure
in health and social innovation, sustainable energy and the experience economy
(tourism and design). This commercial-political infrastructure targets areas where
the challenges are greatest and offers a broad perspective for individual
businesses. The model supports the establishment of more enterprises along with more
and better products and services. It stimulates, organises and qualifies demand for new
products and services. It boosts enterprise access to venture capital and development
funds. It reinforces research, education and knowledge within the business areas and
provides enterprises with access to the relevant skills.
Cooperation between regions can help the development and strengthening of
clusters in new dynamic sectors.
The Alsace Region, in France, has the Strasbourg Parc d’Innovation d’Illkirch, one of
the largest techno poles in France162
. After political decentralisation in the early
1980s, new regional governments were established and new ‘regional techno poles’
were introduced. The new region of Strasbourg and local governments strongly
supported the establishment of a techno pole in the region. In 1985, 0.63 km² was
designated for the techno park (later extended to 1.7 km²). Planning and management
were delegated to the regional governmental development agency (SERS). The
techno-park focuses on biotech research and industries, genetics and space
technology. Twenty years later, 69 enterprises and institutions employ 9,600
employees. Since late 1996, the biotech industry has been connected with German
territories in the Upper Rhine Region as part of the Bio Valley Project, which, since
2003, has also included Baden-Württemberg in Germany, and the Constance Region
in Switzerland. Today the Bio Valley has 50,000 high-skilled employees, 15,000
scientists, 100,000 students, 600 pharmaceutical and MedTech enterprises covering
the whole value chain for pharmaceuticals and medical devices, 10 universities and
academic research institutes, 14 technology parks and two European reference points
for medical research (the European Pharmacopoeia and the European Science
Foundation).
______________________
161 OECD (2012). See also Region of Southern Denmark The Future of Business in the Region of Southern Denmark
and Strategy 2012-2020. 162 Salet and Gualini (2007) p.263.

69
4.2 LRAs supporting industrial enterprise efficiency for using inputs
4.2.1 Human capital and innovation capacity
Investing in human capital, supporting education institutions and research
centres, and the enhancement of collaboration between research and industrial
enterprises is central to industrial strategy aiming at renewal or
formation/creation. In some cases, higher education, research, cultural and scientific
institutions and industrial enterprises already collaborate without the need for policy
initiatives.
Munich in Germany has a remarkable network of higher education, research, cultural
and scientific institutions163
. This grew especially after investment in the post-war
period, and supports one of Europe’s most highly qualified labour markets. Munich
has emerged as an international leader in technology R&D and innovation, including
in biotechnology, medical, automotive and energy. Technological know-how,
outstanding education and high levels of human capital have made it Germany’s
leading technology city, also rated first in Europe for specialist knowledge164
. Munich
is distinctive in that 20% of the workforce is in export-led manufacturing, while
services and high tech capital-intensive clusters have also thrived. Munich’s firms
have few challenges accessing skilled workers because of strong connections to skill
suppliers. Large enterprises, employer associations and universities are seen as best
placed to understand the skills the city needs to provide and attract. There is a
profound dialogue between them and designers of the well-funded school system,
which enlists and integrates enterprises and universities as stakeholders in the
city. This places knowledge generating institutions and innovative thinking at
the heart of urban decision making. The curriculum in vocational training offers
Munich’s mid-ability students wide access to high-quality on-the-job apprenticeship
training, combined with classroom tuition as part of the German dual system.
Approximately 250,000 students are in vocational training in Bavaria, nearly as many
as are in higher education. Although Munich’s graduation rate is not outstanding, at
37% (London 63%, Copenhagen 47%, Madrid 46%, Paris 42%), the employment rate
of young people and women is one of the highest in the EU. The responsive
education ecosystem allows Munich to create a mid-skill, technical workforce
that continually sustains its manufacturing prowess.
LRAs can improve the capacity of enterprises to attract and employ high-skilled
workers.
______________________
163 Clark and Moonen (2014). 164 The metropolitan area alone produces 10-15 percent of Germany’s patents and is home to 13 higher education
establishments, while being consistently rated as one of the best student cities globally.

70
In North Karelia, Finland, the level of employment for higher education graduates
decreased with the global economic downturn165
. Moreover, regional businesses are
struggling with a lack of affordable highly skilled people and motivated experts. This
is hindering North Karelian enterprises from succeeding locally, but also from
integrating with the global economy. Enterprises, in particular SMEs, are also facing
growing challenges to strengthen their innovation capacity and competitive potential
to optimise trade and growth opportunities. To counter these, in 2009 the local
government launched the Innovation Assistant project. The project’s main goal is to
address identified needs of target groups by promoting the permanent
employment of graduates with a higher degrees in enterprises and organisations
in the region, and to improve the competitiveness and innovation capacity of
local SMEs. Under the project, job seekers are offered both intensive training as well
as practical training in a company. The project also has a parallel project
administered by the Centre for Economic Development, Transport and the
Environment, North Karelia implementing labour market measures. Other co-
operation partners include regional enterprises. The project, administrated by the
North Karelia University of Applied Sciences, is supported by the European Social
Fund, and funded by the Centre for Economic Development, Transport and the
Environment, North Karelia, and Josek Ltd with municipal financing.
To improve human capital, LRAs can support cross-border cooperation initiatives.
The Vidzeme Planning Region in Latvia recently initiated the BSR Lifelong Learning
for Smart Specialisation166
, bringing together partners from Latvia, Lithuania,
Sweden and Germany. This identifies improvements in lifelong learning and
implements them in the Baltic Sea Region. Under this initiative, adult education
programmes are structured for the needs of regional industries, according to the
business environment and culture. A common understanding is to educate
employees and also business and human resources managers who encourage
employees to further their skills and competences.
Coordination of stakeholders is fundamental to increase enterprise innovation
capacity, especially for traditional sectors.
To promote industrial competitiveness through cooperative innovation, Piemonte
region in Italy, created POINTEX in 2009167
. This association of enterprises and
research centres provides innovative, highly beneficial technological solutions to the
textile and textile machinery sector in the region. It offers tutoring and monitoring, as
well as support for finding financial resources. Cooperation with local bodies and
______________________
165 Regional Council for North Karealia (2010). 166 EUSBSR (2015). 167 Textile-future.com (2015).

71
institutions has always been very close in the textile sector in Piemonte, to the benefit
of the overall system, especially in the Biella district. Here handloom and power
loom enterprises have continued to maintain high quality production, extending it to
total quality, involving technological research and creativity, as well as customer
service. Continuous technological research, with in-depth knowledge of the needs of
fashion and stylistic creativity have allowed Biella to produce very high quality yarns
for any purpose, not just for weaving and knitting, but also for flat knitting and
hosiery, furnishing and technical textiles. Use of the best raw materials and
increasingly sophisticated machinery makes the excellent fabrics from Biella valued
around the world. In Piemonte textile development has focused on an interactive
approach, combining chemistry, physics, biology and engineering.
Providing incentives not only for knowledge production, but also for its transfer
to enterprises and application in production processes, is fundamental.
Baden-Württemberg in Germany founded Steinbeis in the 1970s168
an institute
headquartered in Stuttgart, dedicated to the transfer of academic findings and
knowledge into the field of business. In this foundation university professors are
offered administrative and market support to act as entrepreneurs and sell their
knowledge to SMEs. Steinbeis is now a world-wide company, very successful in the
field of knowledge transfer with a problem solving approach rather than a technology
push approach. Over 850 Steinbeis enterprises around the world produce a turnover
of €134 billion with 697 professors, 1,462 employees and 3,361 freelancers. Steinbeis
University is the biggest private university in Germany and at the same time the only
one not needing public money, as enterprises pay for education of their staff.
In other cases, LRAs use their public demand strategically to enhance enterprise
innovation capabilities and promote and create growth in specific clusters,
through public-private collaboration.
Box 4.4 The experience of Southern Denmark (Denmark) – Part 2
In Southern Denmark the local government has made considerable investments in
welfare technology to strengthen the potential for innovation and growth169. In this
context, the Region offers, among other things, test facilities, consultations and tools
facilitating public-private innovation and innovative public procurement. In addition,
enterprises can enter into partnerships with regional hospitals, as well as
psychiatric and social institutions to develop and implement technological welfare
solutions. A cluster organisation (Welfare Tech) has been established, and an elite
______________________
168 CluStrat (2013). 169 Napier and Kethelz (2014).

72
training programme (Accelerace Welfare) launched for entrepreneurs. An investment
fund has also been set up where health and welfare enterprises operating in Southern
Denmark can apply for venture capital (Welfare Tech Invest). Denmark’s biggest
welfare technological research and innovation project, Patient@Home is also based in
the region. The development of new super hospitals is expected to push forward
regional and national growth. Building works worth billions can give Danish
enterprises and enterprises in Southern Denmark excellent experience, competence and
networking, which can strengthen their global position. Numerous new innovative
solutions are planned in connection with the new building and hospital, which opens
up opportunities for cluster enterprises. Public (regional and municipal) demand for
the products and services of the cluster can drive its development.
4.2.2 Enhancing efficiency in the use of raw materials and energy
Pushing industry towards green models of production has a twofold scope. It supports
the adoption of high-tech production and advanced environment-friendly
materials. It also helps enterprises increase efficiency in using inputs, decreasing
production costs.
The entrepreneurial sector in Emilia-Romagna in Italy is very developed, articulated
and specialised in green production170
. In recent decades it has been progressively
structured around Productive Poles. These are homogeneous local production systems
with a high concentration of industrial enterprises (mainly SMEs) with high
production specialisation, large enterprises, cooperatives and widespread
entrepreneurship. These technological basins are supported by a network of
intermediate bodies including administrative bodies, representative
organisations and associations as well as technical facilities such as service
centres, schools and education centres, markets and trade fair and exhibition
centres. The green-industry sector is currently driven and promoted by several policy
documents and successful initiatives. For example, the Plastice project (concluded in
2014) promoted the development and use of environmentally friendly and sustainable
solutions in the packaging and end-user industries, particularly the use of
biodegradable plastics. The Plastice project in turn promoted the BiorefER project
that assessed the degree of development and potential of the regional bio-refining
supply chain that focuses on biodiesel and bio-plastics. In addition, specific support
could be provided by the Vanguard pilot bio economy project that will implement
and demonstrate synergies in new bio-based value chains and by the Green Lab
Valley Strategic Project. This will lead to a Consortium Research Lab ‘Biomass
HUB’ converting agro-industry biomass into high added value products for the health
and packaging industries.
______________________
170 Plasticeproject (2014).

73
As seen in the previous sections, cooperation within regions as well as between
regions can generate significant economic spillovers for local industries. This is
valid also for green models of production.
In Roubaix, France, a broad partnership involving the local authority, urban
community, national government, consular bodies, schools and training institutions,
trade associations and professional unions, major customers and funding bodies,
created the Cité de l’Initiative171
. This operates as a French association under the law
of non-profit organisation managed by a limited company (SARL) in the form of a
Union d'Economie Sociale (UES or Social Economy Union). Cité de l’Initiative is a
group of 26 textile and clothing enterprises based in Roubaix and engaged in
complementary activities. The group also includes partners linked to this production
chain. The basic principle is sharing resources, including techniques, technologies,
management and communication tools and human resources. The motto is: “We
will pool our resources, tools and expertise to meet all our customers’ expectations
more effectively, faster and at lower cost”. The aim is to reduce enterprise fixed
costs and allow them to use as many high-performance tools as possible to
enhance their competitiveness and reliability and to open up new markets.
Box 4.5 The experience of Nord-Pas-de-Calais (France)
The region in figures
Industry value added, share of total value added (%) 15,8
Industry value added, share of total value added. avg. yearly change 2001-2014 (%) -0,6
Services value added avg. yearly change 2001-2014 (%) 3,0
Employment in Industry avg. yearly change 2008-2015 (%) -1,5
Labour Productivity 2013 (EUR per hour) 45,8
Labour Productivity avg. yearly change 2001-2013 (%) 1,1
Business enterprise sector intramural R&D expenditure (% of GDP avg. 2014-2005) 0,4
Employment share of High and medium high-tech manufacturing 2015 (%) 4,1
Employment share of High and medium high-tech manufacturing avg. yearly change 2009-2015 (%) -0,9
Employment share of High-tech Knowledge Intensive services 2015 (%) 2,0
Employment share of High-tech Knowledge Intensive services avg. yearly change 2009-2015 (%) 4,6
Regional Competitiveness Index 2013 n.a
Nord-Pas-de-Calais is a region in France now part of Hauts de France after the union
with Picardie during the territorial reform of French Regions in 2014172. The region
was one of the very first to be industrialized in Europe. The industrial landscape is
characterized by the presence of textile industry factories in Roubaix/Tourcoing, slag
______________________
171 European Commission (2004). 172 TIR Consulting Group LLC (2013), Overbeek et al. (2016) and Ministère de l’Agriculture de l’Agroalimentaire et de
la Foret (2016).

74
heaps (“terrils”) in the mining “croissant” through the conurbation of Béthune-Lens-
Douai-Valenciennes, and the steel industry in Dunkirk or Maubeuges. The Region has
industrial strengths in rail (first region in France), the car industry (second), food
industry (third), and health research (fourth).
Nord-Pas de Calais is among those French regions that have the highest energy
consumption. Greenhouse gas emissions per inhabitant are 30 per cent higher than the
national average. The share of renewable energies is four times lower than the national
average. Against this scenario, the region is implementing its Third Industrial
Revolution to make the regional economy one of the most resource-efficient,
productive and sustainable in the world. The strategy is based on 5 Pillars: Pillar 1 –
The Shift to renewable energy; Pillar 2 – Buildings as micro-power plants; Pillar 3 –
Storage technologies; Pillar 4 – The Energy Internet; and Pillar 5 – Plug-in and fuel
cell transport. The Third Industrial Revolution aims to proactively develop the
economy and spawn jobs by creating synergies between the pillars and leveraging the
macro business case of energy efficiency. The process of elaborating the strategy
was supported by six regional working groups gathering experts, representatives
from regional public bodies, and enterprises. Each working group worked on one of
the 5 Pillars, and the last one worked on the transversal view of energy efficiency. The
Region Nord-Pas de Calais also mandated two additional working groups to work on
two other related topics that are transverse to the 5 Pillars of the Third Industrial
Revolution: the circular economy and functional economy. This enables it to deal with
two essential topics: the evolution of uses and consumer behaviour (functional
economy) and a new link with resources thanks to the circular economy, which
has a strong impact on consumption and energy efficiency.
As part of the Third Industrial Revolution, the region is also developing a specific
industrial policy to increase the weight of the bioeconomy locally. This is based on
strong agricultural and fishery production, several universities as well as research and
technology centres with dedicated expertise in renewable resources, the bioeconomy
and biorefining, and the establishment of important enterprises as well as SMEs and
start-ups active in numerous fields of the bioeconomy. The region has well-
developed innovation clusters covering the bioeconomy (renewable resource
production, food, feed, fibres, materials, chemicals and bioenergy). Some
organisations worked together before the merger of the two former regions. For
example, the clusters IAR, Up-Tex and Matikem founded CEEBIOS, the European
centre of excellence in biomimicry. First conceived in 2013, the centre helped to create
the first European biomimicry network, a process of innovation inspired by nature. It
is also committed to fostering collaborative and cross-cutting projects. Furthermore,
some clusters of the two former regions used to answer collaborative calls together at
the national level. However, despite some collaborative work there was no territorial
strategy. It was more a one shot strategy. The two former regions are very
complementary, so significant development of the bioeconomy is likely since the
territory is bigger, with more resources and biomass. The merger is also an
opportunity to provide complementary services proposed by technical and

75
innovation centres. Several projects, initiatives and instruments in recent years
have boosted the green industry. The most notable are the establishment of the
IFMAS Institute focusing on plant-based chemistry and the SAS PIVERT company
strengthening the regional green chemistry value chain. A further initiative hosted by
the region is the biannual Plant-based Summit, which has significant impact on the
regional green industry.
4.3 LRAs supporting industry become more market connected
One key initiative to help industrial enterprises reach new markets is to enhance
and modernise infrastructure and decrease transport costs.
Munich in Germany inherited a very strong infrastructure platform, both in terms of
public transport and international connectivity173
. The city is rated in the world’s top
five for electricity, water, transport and telecommunication systems. The re-
development of Munich airport has allowed it to become Lufthansa’s second most
important hub after Frankfurt and regular flights to North America and emerging
regions such as China and the Gulf have fostered strong transcontinental business
connections. This provides the whole metropolitan region with new diverse market
opportunities. Key inter-regional and international transport infrastructure have
stimulated Munich’s business attraction for over four decades. Periodic
investment in basic infrastructure and business parks has enabled Munich’s
enterprises to tap the entirety of the labour force and move people and goods with
few delays. Because of the expense of oil-based transport, Munich has efficient and
environmentally friendly public transport systems. A new high-speed train to
Nuremberg connects the two largest cities in Bavaria, and will eventually connect to
Berlin. The seamless intra-regional transport prompted Siemens recently to describe
Munich as ‘the model’ for cities “pursu[ing] the path of achieving a nearly carbon
free future over the coming decades”.
______________________
173 Clark and Moonen (2014).

76
Inter-regional cooperation reducing transport costs is also a successful strategy.
Northern England in the United Kingdom has suffered from decades of
underinvestment174
. Infrastructure in the area has been recognised as dated, poorly
integrated and lacking the large-scale investment it needs. In recent years several
actions have targeted making Northern England a strong investment location in the
global marketplace. In 2014 Transport for the North (TfN) was established to
improve connections between economic centres in the north. In 2015 it developed a
long term Northern Transport Strategy to build a ‘Northern Powerhouse’ which
capitalises on the strengths of northern cities and encourages economic growth and
investment. The three regions that make up the Northern Powerhouse are the North
West of England, the North East of England as well as Yorkshire and Humberside.
Northern Powerhouse promotes regional economic growth and is looking to
rebalance the national economy. Alongside investment in skills, support for business
and regenerating city centres, a transformation in connections between the northern
cities and beyond aims to increase their productivity to levels currently only seen in
London and the south east of England. After the announcement of the intention to
build a Northern Powerhouse the number of FDI projects increased
significantly. The Ernst and Young attractiveness survey175
, revealed that transport,
skills and business networks all rank highly in what investors are looking for.
The northern England effort to enhance infrastructure in the area has not only
reduced transport costs for local enterprises and workers, but has also increased
the attractiveness of the territory for foreign investors.
Several regions in Europe are implementing initiatives to attract FDI.
In Frankfurt Rhine-Main Metropolitan Region in Germany, FrankfurtRheinMain
GmbH is the region’s inward investment promotion agency that advises and supports
foreign investors176
. The agency proactively markets regional strengths and
implements targeted measures to improve regional competitiveness.
FrankfurtRheinMain connects investors with potential partners, identifies business
locations, helps establish enterprises, and provides information on taxes and legal
regulations. FrankfurtRheinMain attracts foreign investments through promotion
activities abroad with offices in Asia, America and Europe. Being in several
countries enables the agency to easily reach potential investors with market and
site information. The agency also has a number of industry experts to provide
advice on a variety of sectors. The agency’s website also promotes Germany’s
______________________
174 Cox and Raikes (2015). 175 Ernst and Young (2016). 176 ECORYS (2013).

77
competitive advantages and offers general economic, geographic and political
information.
Invest in Andalucía is an initiative to attract high value FDI and to support existing
foreign enterprises with expansion in Andalucía, Spain. The agency, based in Seville
and with 21 offices around the world, assists investors with planning, implementing
and expansion. Specific services include market analysis, site selection, tour
coordination and international promotion advice. Connecting with service
providers, technical contractors and suppliers, along with support in accessing
finance and funding are also part of Invest in Andalucía services. A unique
service that is not offered by the other international promotion agencies is ‘Soft-
landing’ to assist employees from large multinationals integrate in Andalucía.
As part of the already mentioned ONLYLYON initiative, Aderly177
, Lyon’s economic
development agency, was founded in 1974 making it one of the first economic
development agencies in France. Aderly guides investors through setting up or
expanding business in Lyon and the surrounding area. The agency assists with
conducting feasibility studies, finding locations and facilities, advising on regulatory,
fiscal and administrative issues, fundraising and introducing partners and local
authorities. The agency also offers services to welcome employees of foreign
multinationals and follow-up services after the business is established.
LRAs can promote the territory to incentivise inward investment and also help
local enterprises invest abroad and partner with multinationals.
Flanders in the Netherlands has the Flanders Investment and Trade (FIT) agency that
assists local and foreign enterprises to develop business in Flanders through trade and
investment178
. FIT was created in 2005 through the merger of Flanders Foreign
Investment Office and Export Vlaanderen. FIT offers information on sectors, trade
customs and regulations, as well as advice on how foreign businesses can set up or
expand in Flanders. FIT has offices in each of the five provinces in Flanders that
provide assistance and incentives to Flanders-based enterprises involved in
international activities. The agency also helps to form partnerships to facilitate
business and provides SMEs with financial support for trade fairs, prospective
investment trips, capital goods or feasibility studies. In 2011, FIT facilitated 174
projects valued at €1.72 billion, which created 3,720 jobs. Nearly half of the
investment projects were in greenfield investments, followed by 32% in mergers &
acquisitions and 18% in expansions. FIT was awarded top prize for the ‘Best Foreign
______________________
177 ECORYS (2013). 178 ECORYS (2013).

78
Direct Investment Strategy’ and ranked in the top ten for overall FDI attractiveness in
the Financial Times Magazine.
Policy actions to make local industrial potential more global can also target local
clusters rather than individual enterprises.
Baden-Württemberg in Germany has regional ministries that provide different
instruments for the internationalisation of clusters179
. The support programme is
provided by Baden-Württemberg International (Baden-Württemberg's competence
centre for the internationalisation of business, science and research). This supports
domestic and foreign enterprises, research institutions and universities
encouraging foreign capital investment, helping enterprises to settle in the
region and promoting cooperation between business and science. Services include
the initiation of international cooperation between enterprises through market-
penetration measures in the most important global markets, participation in location-
marketing campaigns in Germany and abroad, and back-up support for foreign
enterprises wishing to invest in Baden-Württemberg. There are also projects relating
to business promotion, training, qualification and management in selected target
countries.
4.4 LRAs adopting solutions to be more responsive to industrial
enterprise needs
In 2008 the EC set out the Small Business Act (SBA)180
, with 10 principles designed
to encourage entrepreneurship in the EU and to make it easier for small businesses to
thrive. The SBA foresees a number of principles that could help LRAs be more
responsive to industrial enterprise needs. These include solutions to make public
administration more responsive to the needs of SMEs, designing rules under the
‘think small first’ principle, adapting public policy tools to SME needs, facilitating
SME participation in public procurement and better use of State aid for SMEs.
A common strategy adopted by LRAs is to implement actions to reduce the
administrative burden.
In Trentino Alto Adige, a region in Italy, the Autonomous Province of Trento
(Trentino) considered streamlining administrative procedures and the computerisation
of services for businesses and residents as essential to recovering competitiveness, by
pursuing greater organisational efficiency at lower cost181
. Recent years have seen
______________________
179 Ministerium fur Wirtschaft, Arbeit und Wohnungsbau Baden-Wurttemberg (2016). 180 European Commission (2008). 181 Investi in Trentino (2012).

79
concrete and significant steps. For example, in 2013 it needed an average of 44 days
to conclude administrative procedures (as compared to 54 days in 2012). The
extraordinary plan of action to reduce bureaucracy for enterprises has reduced the
‘cost’ of procedures for enterprises by 25%. There is increasing use of
telecommunications technology and continuing simplification of procedures,
particularly in sectors considered to be strategic (including businesses, families and
agriculture). Furthermore, in 2013, 93% of public administration payments to
creditors were within 30 days. Moreover, it should be underlined that the average
time for these payments was 10 days against the national average of 90. The growth
of territorial competitiveness can be seen in improved services and reduced
burden for enterprises.
Murcia, in Spain, has implemented an approach to reduce the time required for
starting an activity, as well as to simplify and standardise the documentation required
for licensing182
. The time to process replacement of a business license with prior
notification has reduced from over three months to 15 days. There is limited
possibility for this timeframe to be further reduced without compromising protection
for the environment. In parallel, the approach has decreased the number of documents
handled during the process and also replaced physical files with electronic
documentation. Both these changes reduced working time and costs, though
quantified data are not available. This approach facilitates the establishment of
small businesses, supporting job creation and entrepreneurship.
In some cases, a simplified administrative approach could also be more targeted,
by integrating, for example, sustainability into management practices183
.
The Walloon Region in Belgium, has adopted the REGINE initiative (Referential
Environment: Integrated Management of Enterprises) offering a rational and
simplified approach to environmental monitoring and reporting. This allows
enterprises to exchange environmental information with the public administration in
line with the requirements of EC Directives, as well as national and regional laws.
Central to the approach is a user-friendly online application (environmental survey),
integrating information in a single inventory. This is used by the authorities to
monitor the environmental performance of enterprises and to produce sector reports
and indicators (which are then published on the internet). The environmental survey
was developed by the Walloon regional administration in consultation with
stakeholders such as the Walloon federation of enterprises and industrial federations.
It integrates all environmental requirements, which are applicable to the target group
of enterprises (initially about 300 operators of activities/installations covered by
______________________
182 Committee of the Regions (2011). 183 Committee of the Regions (2011).

80
local, national, EC or other regulations). REGINE has consolidated overlapping
regulations, significantly simplifying the environmental information requirements
applying to enterprises. Furthermore, the initiative has raised enterprise awareness
of environmental obligations. The majority of enterprises submit environmental
questionnaires on time.
Cross-border cooperation can also be an effective policy tool to make regional
public administration more responsive to enterprise needs.
Grenzoffensive is a cross border initiative launched in 2002 for workers and SMEs
wanting to operate in the adjacent regions of Bavaria (Germany), Upper Austria, and
Southern Bohemia (Czech Republic)184
. It aimed to minimise or eliminate
administrative obstacles faced by local SMEs when attempting to expand their
operations across the border. ‘Grenzoffensive’ facilitates cross-border services,
particularly procedures for posting workers. An internet site is accessible in German
and Czech, presenting the relevant legislation, explaining procedures and costs. All
the forms can be downloaded. Some formalities were eliminated between the three
regions, while other procedures were clarified. Moreover, 'Grenzoffensive' has
completed dozens of information and training seminars, and over 2,500 SMEs
received individual counselling.
______________________
184 High Level Group on Administrative Burdens (2014).

81
5. Conclusions and recommendations
This study has illustrated how there are still noticeable differences across European
regions in terms of industrial specialisation, production inputs, endowment and policy
solutions to respond to local industrial needs. Due to continuous transformations and
evolution in both supply and demand, industry will be a critical driver of
innovation, productivity, competitiveness, inter-sectoral spillovers, meeting
social and environmental goals and customer behaviour, rather than just a
source of mass employment in traditional production.
The way LRAs embrace this new paradigm depends on their ability to exploit and
modernise the strengths of specific industrial activities and to design and embrace
new industrial development trajectories in new sectors. In doing this, LRAs should be
aware that there is no one-size-fits-all approach and that local specificities can
represent an opportunity. The EU single market can compete better internationally,
offer greater job opportunities and better satisfy European customer needs if
perceived as a balanced industrial landscape of different coordinated industrial
patterns. Here regional and local peculiarities should be recognised rather than
adapted to a single industrial path vision. In shaping this landscape, LRAs can
therefore play a decisive role.
The EU will have to acknowledge this situation of pronounced regional
concentration of capacities with a view to technology generation, in particular in
emerging fields. At the same time, it will have to leverage the existing potential
more broadly outside of the existing frontrunners' ecosystems where both the
generation and use of advanced manufacturing technologies have reached already
internationally outstanding levels. The identified regional disparities with respect to
industrial modernisation should be tackled by facilitating the integration into
European value chains. Emerging of technological development outside of the
industrial heartland should be supported. This would not only ensure a more diffuse
absorptive capacity but also support and boost the efforts of Europe’s leading
industrial stakeholders. Research, evaluation and reporting related to Cohesion
policy needs to include the topic of old industrialized regions, by acknowledging
the specific problems of these areas. Efforts are needed to define such areas and
provide information on their long-term development, as well as to assess the success
or otherwise of reconversion strategies.
LRAs are the closest institutional level to territories, so they are better positioned to
identify local industrial strengths, weaknesses and the potential for development. The
first strategic step for an industrial policy is to discover and elicit more information
about what constrains industrial sectors. This requires LRAs to establish close and
strategic co-operation with a private sector that is rapidly evolving towards
more ‘hybrid’ models of production, is less place-based and is surrounded by

82
increasingly complex market dynamics. The involvement of local industry
representatives in designing an industrial strategy is fundamental to meet
entrepreneur needs, limit labour mismatches and strengthen the innovative
capabilities of enterprises. Moreover, monitoring and evaluation of entrepreneurial
industrial activities and the labour market, as well as collecting and elaborating data
on key industrial variables, are crucial for a clear overview of local industrial
problems.
If, as stated in Section 2.2, data becomes the ‘new oil’ for industrial development,
this also applies to the design and implementation of industrial policies. Alongside
industrial enterprises, LRAs should enhance the collection and analysis of data
in monitoring systems. Descriptive and predictive analytical techniques are
needed to better understanding and forecasting for the dynamics of local
industrial sectors. In doing this, the adoption of indicators used by the European
Commission (European Regional Competitiveness Index, Regional Innovation
Scoreboard, Industrial R&D Investment Scoreboard and others) or by the OECD (as
in the Regions at Glance report) can facilitate assessment of the competitiveness of
the regional industrial landscape. This will enable benchmarking and comparison of
its evolution with similar regions.
As the experiences of LRAs testify, whichever industrial path (renewal or creation) is
chosen, a skilled workforce, including researchers, scientists, and engineers, and the
ability to drive innovation, are the most important drivers of industrial
competitiveness. Favouring cooperation networks that include local institutions,
enterprises and institutes of higher education is essential for enhancing local
human capital. LRAs, especially those affected by a brain-drain, should also
encourage industrial enterprises to hire local skilled workers and offer job
opportunities to highly qualified young people, for example, by co-financing high-
quality on-the-job apprenticeship training programmes. Moreover, LRAs should
facilitate local industry in taking advantage of foreign nationals, who tend to be
among the most entrepreneurial in society, and often have higher skills than local
people, by improving the attractiveness of the territories where the industries are
located (housing, nurseries etc.). In parallel, EU citizens working in another EU
country should be encouraged to invest in their region of origin by providing, for
example, administrative simplification in the creation of new businesses, which
should become more promising than the simple transferring of remittances aimed at
building new houses.
Of particular importance for LRAs aiming to stimulate regional innovation, is to
incentivise not only the production of knowledge, but also its transfer to
enterprises and its application to production process. Enhancing synergies and
collaborative networks between industrial enterprises, research centres, and
technological parks, is vital to modernising traditional sectors and stimulating the
uptake of new dynamic industrial trajectories.

83
LRAs that encourage enterprises to invest in R&D and innovation, to adopt new
technology and to use new production processes, should ensure that incentives are
provided to entrepreneurs to finance high quality projects and reduce the risk of
failure. The use of financial instruments instead of grants to deliver public
financial support, could not only be a valid way to leverage additional resources
and re-use repaid support to finance more enterprises, but also could ensure
that better quality projects are supported, as investments must be repaid. This
applies to a vast array of investments, including start-ups, training and lifelong
learning, marketing and commercialisation.
LRAs should adopt strategies to make the territory more attractive for investors,
foreign enterprises, new talent and scientists, as well as for local enterprises looking
to re-shore activities. Diversifying and ‘rebranding’ the local economy
strategically, so industrial progress is seen as part of a holistic territorial system,
can increase attractiveness for investors. The strength and depth of local
partnerships and networks and the extent to which they can be seen as sharing a
positive view of themselves and their city or region’s place in the world is an
attractive force for new investment and human capital.
LRAs should favour local enterprise connections with international markets,
either as a source of new investment (outward and inward) and new customers.
Industry is becoming more ‘hybrid’, incorporating a mix of production processes
located in both high-cost and low-cost countries and based on a wide range of factors
enabled by technological developments, especially ICT. It is crucial to have
modern, efficient, smart and interoperable infrastructure, both physical and
digital, to reduce transport costs, ensure that enterprises can reach more customers
and suppliers, and to attract new investment. LRAs should also better focus regional
trade and investment agencies mission on preventing information asymmetries that
obstruct the efficient allocation of investment abroad or locally, especially in sectors
important to regional industrial specialisation.
The examples highlighted in this study indicate that effective industrial policies
favour cooperation and coordination at different levels. Within regions, LRAs
should encourage the exploitation of clusters, by incentivizing enterprises’
networks, favouring joint projects among enterprises, universities and research
institutions, supporting the creation of science parks and incubators, providing
advisory services, and creating labels and marketing of clusters. This creates
favourable innovation and creativity ecosystems and supply-chain networks,
enhancing individual enterprise access to raw materials, sophisticated machinery,
new technology and new ideas. It also generates new synergies and integration
mechanisms with services activities that help industrial enterprises better match
demand mainly driven by individual needs (servitisation). At an inter-regional level,
LRAs should establish coordinated projects and initiatives with other specialised
technology suppliers from other EU regions to favour technological and

84
knowledge transfer, enhance labour mobility, support inter-regional clusters and
foster ‘hybrid’ models of production.
LRAs should be more responsive to local industrial needs, by promoting actions
to reduce administrative burden, adopting e-government solutions, creating
monitoring and reporting systems to evaluate the progress of industrial initiatives,
and adjusting and adapting policy makers’ expectations and capabilities to industrial
changes and challenges. Moreover, LRAs should strengthen coordination of regional
industrial initiatives with European and national level policy actions. This would
avoid overlapping actions as well as fragmentation, so each initiative has a
specific industrial focus and targeted beneficiaries.
Finally, LRAs can also play an active role on the demand side. As final buyers,
establishing public-private partnerships or opting for pre-commercial procurement
procedures185
, the public sector is the driving force for particular products or services.
This potential turns to be particularly important when the new demands generated by
major trends such as ageing are concerned. Partnerships between LRAs and hospitals
(as it is the case of Southern Denmark) and pre-commercial procurement in the health
sector, f.i. in the area of rehabilitation or home automation for the elderly, can
contribute to a better future of the European industry. In addition LRAs can
stimulate customers to change behaviours and habits, moving towards products
with particular prerequisites. A strategy could incentivise industrial enterprises
towards a green production model (for example using solar panels in production
facilities) or to sell products that respect established social or environmental
requirements. This would be more effective when the demand choices are also
sensitised to social and environmental aspects (for example, by incentivizing the use
of solar panels in private houses, the consumption of organic food in the school
canteens, or stimulate the use of shared cars, machinery, and even articles of daily
use). One of the main factors that could successfully drive European industry is
the high-level of European customer expectations. The EU internal market
represents a potential that should be fully exploited to stimulate competitive industrial
development.
______________________
185 Procurement of research and development of new innovative solutions before they are commercially available.

85
Annex 1. Maps and figures Figure 1.1: Industry share of total value added by region (%, 2013)
Source: own calculation based on Eurostat (see Annex II for detail)

86
Figure 1.2: Regional industry share of total European industrial value added
(%, 2013)
Source: own calculation based on Eurostat (see Annex I for detail)
Figure 1.3: Industry value added growth (by region, % yearly average change, 2002-2014),
left side. Industry value added average yearly growth 2008-2014 vs. industry value added
share in 2008, right side
Source: own calculation based on Eurostat (see Annex II for detail)

87
Figure 1.4: Industry and services value added (by region, % yearly change 2002-2014)
Source: own calculation based on Eurostat (see Annex II for detail)
Figure 1.5: Net business population growth in industry, (%, 2012-2014), left side; average size
of newly born enterprises, industry (2011-2014), right side
Source: own calculation based on Eurostat (see Annex II for detail)

88
Figure 1.6: Clusters in EU Member States by enterprises (2011)
Source: clusterobservatory.eu

89
Figure 1.7: Revealed export advantages in different technology-intensive goods (2011)
Source: reproduced from Cordes et al. (2016)’
Figure 1.8: Foreign controlled manufacturing firms value added at factor cost, over total
manufacturing firms value added (%, 2014), left side; foreign controlled manufacturing firms
value added at factor cost yearly average change (%, 2008-2014), right side
Source: own calculation based on Eurostat (see Annex II for detail)

90
Figure 1.9: Manufacturing FDI on population (per-capita inward FDI 2005-2007)
Sources: reproduced from Capello, Fratesi and Resmini (2011), p.101

91
Figure 1.10: Regional Competitiveness Index (2013)
Source: reproduced from European Commission (2013b), p.iii (see Annex II for detail)

92
Figure 1.11: Infrastructure pillar, Regional Competitiveness Index 2013
Source: own calculation based on Eurostat (see Annex II for detail)

93
Figure 1.12: Employment rate of active population in the 20-64 age group (%, 2015)
Source: own calculation based on Eurostat (see Annex II for detail)

94
Figure 1.13: Employment in industry, share of total employment (%, 2015), left side;
employment in industry, yearly average change (%, 2008-2015), right side
Source: own calculation based on Eurostat (see Annex II for detail)
Figure 1.14: Manufacturing employment share of sectors by
technology-intensity (2015)
Source: own calculation based on Eurostat (see Annex II for detail).

95
Figure 1.15: Participation rate in education and training (2015), left side; participation rates
in tertiary education (2015), right side
Source: own calculation based on Eurostat (see Annex II for detail)
Figure 1.16: NEET rate for young people aged 15-24 (2015), left side; vocational programmes
share in upper secondary education, (2015 or most recent data; NUTS1 for DE and UK), right
side
Source: own calculation based on Eurostat (see Annex II for detail)

96
Figure 1.17: Foreign country total immigrants share (2011), left side; EU-countries
immigrants share (2011), right side
Source: own calculation based on Eurostat (see Annex II for detail)

97
Figure 1.18: Yearly employee gross compensation, Industry, Euro thousands, 2013
Source: own calculation based on Eurostat (see Annex II for detail)

98
Figure 1.19: Labour productivity, industry, Euro, 2013 (2012 for FR)
Source: own calculation based on Eurostat (see Annex II for detail)

99
Figure 1.20: Labour productivity, industry, Euro, average yearly change (%, 2001-2013)
Source: own calculation based on Eurostat (see Annex II for detail)

100
Figure 1.21: Labour productivity vs. yearly employee compensation, Industry, yearly average
change, (%, 2001-2013; size of circles represents the weight of industry over total value
added)
Source: own calculation based on Eurostat (see Annex II for detail)

101
Figure 1.22: Regional Innovation Scoreboard 2016
Source: reproduced from European Commission (2016b), p.16

102
Figure 1.23: European Innovation Scoreboard 2016
Source: Reproduced from European Commission (2016a), p.12
Figure 1.24: Total R&D expenditure (GERD), % of GDP (average 2005-2014), left side;
business enterprise sector R&D expenditure (GERD), % of GDP (average 2005-2014), right
side
Source: own calculation based on Eurostat (see Annex II for detail)

103
Figure 1.25: SMEs introducing product or process innovations as % of SMEs (2012), left side;
SMEs introducing marketing or organisational innovations as % of SMEs (2012), right side
Source: own calculation based on Eurostat (see Annex II for detail)
Table 2.1: The five groups of manufacturing
Source: reproduced from McKinsey & Company (2012),p.5.

104
Figure 2.1: Patents applications to EPO, per million inhabitants, 2002-2013 High-tech
ICT
Biotechnology
Source: own calculation based on Eurostat (see Annex II for detail)
Figure 2.2: Persons with tertiary education (ISCED) and employed in science and technology,
Percentage of active population Average yearly change (%), 2001-2015
2015
Source: own calculation based on Eurostat (see Annex II for detail)
Figure 2.3: Scientists and engineers, Percentage of active population Average yearly change (%), 2001-2015
2015
Source: own calculation based on Eurostat (see Annex II for detail)

105
Figure 2.4: High and medium high-technology manufacturing, Percentage of total
employment, average yearly change (%, 2008-2015)
Source: own calculation based on Eurostat (see Annex II for detail)

106
Figure 2.5: Change in competitiveness for high-tech goods (2000-2011)
Source: reproduced from Cordes et al. (2016)’

107
Figure 2.6: Knowledge-intensive services, average yearly change in total employment (%,
2008-2015) Market services, 2008-2015
Market services, 2015
High-tech services, 2008-2015
High-tech services, 2015
Source: own calculation based on Eurostat (see Annex II for detail)

108
Figure 2.7:Average yearly wages in manufacturing in China
Source: National Bureau of Statistics of China
Figure 2.8 Regions with dynamic cross-sectoral patterns related to emerging clusters (2014)
Advanced Packaging
Biopharmaceutical
Blue Growth Industries
Creative Industries

109
Digital-based industries
Environmental Industries
Experience industries
Logistical Services
Medical device
Mobility Technologies
Source: reproduced from European Commission (2015a)

110
Figure 2.9 Distribution of KETs-related priorities (2015) Regions with encoded KETs priorities
Regions with Advanced Materials priorities
Regions with Adv. Manufacturing Systems priorities
Regions with Industrial Biotechnology priorities
Regions with Photonics priorities Regions with Micro- and Nanoelectronics priorities

111
Regions with Nanotechnology priorities
Source: reproduced from High-Level Expert Group on Key Enabling Technologies (2015)

112
Figure 2.10 Integration of digital technology by businesses (2017)
Source: reproduced from European Commission (2017a)

113
Annex II. Methodology
The figures presented in Chapter 1 and Chapter 2 were mainly collected and
constructed from the regional statistics by NUTS classification dataset provided
by Eurostat. Table A.1 presents the data sources for all Figures included in
Chapter 1 and Chapter 2.
The thematic maps are based on the GISCO - the Geographic Information
System of the Commission - NUTS 2013 data provided by Eurostat geodata
portal186
. The choice to represent geographical data by means of statistical maps
has been made to focus on the location concept which best represent the
relevance and geographical patterns. In most cases, observations – whether they
are NUTS2 or NUTS1 units - or European countries - if regional data were not
available - are grouped into five classes, which represent the unweighted
quintiles for that specific distribution of interest. By doing so, no subjective
judgment in defining groups and classifying observations was taken, so that each
group includes twenty percent of the available observations for that specific
measure.
Whenever we refer to industry, the NACE revision 2 sectors from B to E are
included; therefore a narrow definition is adopted, which actually is ‘Industry
excluding construction’. With respect to Services we only include the NACE
revision 2 sectors from G to N, the ones belonging to business economy,
excluding the public sector. See Table A.2 for the broad structure of NACE Rev.
2 classification.
Eurostat uses the aggregation of the manufacturing sectors according to their
technological intensity and based on NACE Rev. 2 at 2-digit level for compiling
aggregates related to high-technology, medium-high-technology, medium-low-
technology and low-technology, as shown in Table A.3.. Following a similar
approach as for manufacturing, Eurostat classifies Services as knowledge-
intensive services (KIS) or as less knowledge-intensive services (LKIS), where
each is sub-divided in further sub-sectors (see table A.4), as we do in Chapter 3.
Important information used for Chapter 2, Chapter 3 and the regional
experiences in Boxes 4.1-4.5 contained in Chapter 4, derive from consultation
with the following academics and experts:
______________________
186 We acknowledge EUROSTAT and GISCO - the Geographic Information System of the Commission – for
the usage of the geographical data, © EuroGeographics for the administrative boundaries.

114
• Mr Grzegorz Drozd (European Commission, DG for Internal Market,
Industry, Entrepreneurship and SMEs, F/1 Innovation Policy and
Investment for Growth), consulted in relation to the industries of the
future, key challenges for LRAs and the role of the RIS3 strategy;
• Prof. Marco Cucculelli (Marche Polytechnic University, IT), consulted in
relation to the industries of the future;
• Prof. Pietro Alessandrini (Marche Polytechnic University, IT), consulted
in relation to the key challenges for LRAs;
• Prof. David Bailey (Aston University, UK), consulted in relation to the
industries of the future with a focus on automotive sector and reshoring;
• Ms Katharina Wolf, consulted in relation to the regional case of Saxony
(Box 4.2), key challenges for LRAs and industries of the future;
• Ms Aurelie Petillon, consulted in relation to the regional case of Nord-
Pas-de-Calais (Box 4.3 and 4.4) and key challenges for LRAs promoting
bioeconomy;
• Mr Maciej Grodzicki, consulted in relation to the regional case of
Podkarpackie Voivodeship (Box 4.1) and key challenges for eastern
industrial regions;
• Mr Allan Nordby Ottesen, consulted in relation to the regional case of
Southern Denmark (Box 4.5), key challenges for LRAs and industries of
the future.
Table A.1: Figures and data sources
Title Description Source
Figure 1.1: Industry
share of total value
added by region, (%,
2013)
Gross value added at basic prices, ratio of
regional industry to regional total
Eurostat
(nama_10r_3gva)
Figure 1.2: Regional
industry share of total
European industrial
value added, (%, 2013)
Gross value added at basic prices, ratio of
regional industry to European industry
Eurostat
(nama_10r_3gva)
Figure 1.3: Industry
value added growth (by
region, % yearly
average change, 2002-
2014), left side.
Industry value added
average yearly growth
2008-2014 vs. industry
value added share in
2008, right side
Gross value added at basic prices; yearly growth
for industry averaged for the period 2002-2014
(left panel) and 2008-2014 (right panel), regions
from BE missing 2002 and 2003 data, regions
from AT, CZ, DE, EL, FI, FR, HR, IE, IT, LT,
LV, NL, PL, PT, RO and SE missing 2014 data
Eurostat
(nama_10r_3gva)

115
Figure 1.4: Industry
and services value
added (by region, %
yearly change 2002-
2014)
Gross value added at basic prices; yearly growth
for industry and services averaged for the period
2002-2014, regions from BE missing 2002 and
2003 data, regions from AT, CZ, DE, EL, FI, FR,
HR, IE, IT, LT, LV, NL, PL, PT, RO and SE
missing 2014 data
Eurostat
(nama_10r_3gva)
Figure 1.5: Net
business population
growth in industry, (%,
2012-2014), left side;
average size of newly
born enterprises,
industry (2011-2014)
Left side: average yearly net business population
growth (number of enterprise births - number of
enterprise deaths / number of active enterprises),
regions from AT, DK, HR and LT missing 2014
data, regions from PT missing 2012 data, regions
from CZ missing 2012 and 2013 data;
Right side: average size of active enterprises
(number of persons employed in the reference
period (t) divided by the number of active
enterprises in t), regions from AT, DK, HR and
LT and PT15, PT17 and PT20 missing 2014
data, regions from CZ and PT missing 2012 and
2011 data, regions from FI missing 2011 data.
Missing data in both panels for regions from BE,
CY, DE, EE, EL, FR, IE, LU, LV, MT, NL, PL,
SE, SI and UK
Eurostat
(bd_hgnace2_r3)
Figure 1.8: Foreign
controlled
manufacturing firms
value added at factor
cost, over total
manufacturing firms
value added (%, 2014),
left side. Foreign
controlled
manufacturing firms
value added at factor
cost yearly average
change (%, 2008-
2014), right side.
Value added at factor cost for manufacturing
firms (sector C NACE rev. 2).
Left panel: share of total manufacturing firms
value added for 2014, 2013 for BE and FI, 2012
for IE, 2008 for MT.
Right panel: yearly average change for period
2008-2014, except BE 2010-2013, CY 2008-
2010 and 2013-2014, EL 2012-2014, FI 2008-
2013, HR 2010-2014, IE 2008-2012, LU 2010-
2014, MT 2008-2010.
Eurostat (fats_g1a_08)
Figure 1.9:
Employment rate of
active population, in
the 20-64 age group,
(%, 2015)
Employed people to active population ratio for
people aged between 20 and 64 years
Eurostat
(lfst_r_lfe2emprt)
Figure 1.10: Regional
Competitiveness Index,
2013
The RCI is an overall composite index of
competitiveness by weighting and aggregating
eleven dimensions (or pillars), 2013. Missing
data for AT12, AT13, BE10, BE24, BE31,
CZ01, CZ02, DE30, DE40, DED4, DED5, FI1B,
NL23, NL32, SI03, SI04, UKD6, UKD7, UKH2,
UKH3, UKI3, UKI4, UKI5, UKI6, UKI7
European Commission
(Joint Research Centre
and Directorate-
General for Regional
and Urban Policy),
European Commission
(2013b)

116
Figure 1.11:
Infrastructure pillar,
Regional
Competitiveness Index
2013
Third dimension or Infrastructure pillar from the
RCI, 2013.
Missing data for AT12, AT13, BE10, BE24,
BE31, CZ01, CZ02, DE30, DE40, DED4,
DED5, FI1B, NL23, NL32, SI03, SI04, UKD6,
UKD7, UKH2, UKH3, UKI3, UKI4, UKI5,
UKI6, UKI7
European Commission
(Joint Research Centre
and Directorate-
General for Regional
and Urban Policy),
European Commission
(2013b)
Figure 1.12:
Employment rate of
active population in the
20-64 age group (%,
2015)
Employed people to active population ratio for
people aged between 20 and 64 years
Eurostat
(lfst_r_lfe2emprt)
Figure 1.13:
Employment in
industry, share of total
employment, (%,
2015), left side.
Employment in
industry, yearly
average change (%,
2008-2014), right side
Employed people in industry.
Left panel: missing data for ES63, ES64, FI20,
FR83.
Right panel: missing data for EL51, EL52, EL53,
EL54, EL61, EL62, EL63, EL64, EL65, ES63,
ES64, FI20, FR83, SI03, SI04, UKI3, UKI4,
UKI5, UKI6 and UKI7
Eurostat
(lfst_r_lfe2en2)
Figure 1.14:
Manufacturing
employment share of
sectors by technology-
intensity
Thematic map by manufacturing employment
share of total employment for NUTS1 regions,
missing data for FI2 and PT3; pie charts for
employment by technological classification of
manufacturing activities, missing data for PT2
Eurostat
(htec_emp_reg2)
Figure 1.15:
Participation rate in
education and training
(2015), left side.
Participation rates in
tertiary education
(2015), right side
Left panel: people participating in education and
training from labour force surveys (last four
weeks), missing data for BG31, EL41 and FRA5.
Right panel: people enrolled in education levels
from 5 to 8, International Standard Classification
of Education (ISCED 2011), 2014 for regions
from BE, CZ, EE, EL, HR, IT and SE, NUTS1
regions for DE and UK, missing data for LU00
Eurostat (trng_lfse_04
and educ_uoe_enra15)
Figure 1.16: NEET rate
for young people aged
15-24, 2015, left side.
Vocational
programmes share in
upper secondary
education, 2015 or
most recent data
(NUTS1 for DE and
UK), right side
Left panel: people aged 15-24 not employed and
not in education or training from labour force
surveys (last four weeks).
Right panel: people in education level 35
(ISCED 2011), NUTS1 regions for DE and UK,
2014 for regions from BE, CY, CZ, EE, EL, HR,
IT, LU and SE, 2013 for regions from IE
Eurostat (edat_lfse_22
and educ_uoe_enra13)

117
Figure 1.17: Foreign
country total
immigrants share
(2011), left side. EU-
countries immigrants
share, (2011), right
side.
Immigrants to total population ratio, census data.
Left panel: total immigrants, missing data for
EL, SI, UKI3, UKI4, UKI5, UKI6 and UKI7.
Right panel: immigrants from other European
countries, missing data for EL, SI, UKI3, UKI4,
UKI5, UKI6 and UKI7
Eurostat
(cens_11ctzo_r2)
Figure 1.18: Yearly
employee
compensation,
Industry, Euro
thousands, 2013
Total gross yearly wages in industry divided by
people employed in industry from national
accounts, 2012 for regions from FR and UK,
missing data for CY00, HR03, HR04, UKI3,
UKI4, UKI5, UKI6 and UKI7
Eurostat
(nama_10r_2coe and
nama_10r_3empers)
Figure 1.19: Labour
productivity, industry,
Euro, 2013
Gross value added at basic prices for industry,
divided by the total hours worked by employed
people in industry, from national accounts, 2012
for FR, missing data for regions from BE, CY,
EE and HR
Eurostat
(nama_10r_3gva and
nama_10r_2emhrw)
Figure 1.20: Labour
productivity, industry,
Euro, average yearly
change, %, 2001-2013
Average yearly percentage change of gross value
added at basic prices for industry, divided by the
total hours worked by employed people in
industry, from national accounts, missing data
for regions from BE, CY, EE, HR and SE
Eurostat
(nama_10r_3gva and
nama_10r_2emhrw)
Figure 1.21: Labour
productivity vs. Yearly
employee
compensation,
Industry, yearly
average change, %,
2001-2013
Average yearly percentage change of gross value
added at basic prices for industry, divided by the
total hours worked by employed people in
industry, and average yearly percentage change
of Total gross yearly wages in industry divided
by people employed in industry from national
accounts, missing data for regions from BE, CY,
EE, HR, SE and London’s regions for UK
Eurostat
(nama_10r_3gva,
nama_10r_2emhrw,
nama_10r_2coe and
nama_10r_3empers)
Figure 1.24: Total
R&D expenditure
(GERD), % of GDP,
average 2005-2014, left
side. Business
enterprise sector R&D
expenditure
(GERD), % of GDP,
average 2005-2014,
right side.
The Research and Development expenditures
data are collected through sample or census
surveys, from administrative registers or through
a combination of sources.
Left panel: R&D from all the institutional sectors
(business enterprise, government, higher
education, and private non-profit), missing data
for DE22, DE23, UKI3, UKI4, UKI5, UKI6 and
UKI7.
Right panel: R&D from the business enterprise
sector only, missing data for regions from BE
Eurostat
(rd_e_gerdreg)

118
Figure 1.25: SMEs
introducing product or
process innovations as
percentage % of SMEs,
left side. SMEs
introducing marketing
or organisational
innovations as
percentage % of SMEs,
right side.
Number of Small-Medium Enterprises
innovating products and processes or marketing
and organisation, 2012 or most recent year.
NUTS1 regions for AT, BE, BG, FR and UK,
missing data for CY, EE, LT, LU, LV and MT
Eurostat, Community
Innovation Survey
Figure 2.1: Patents
applications to EPO,
per million inhabitants,
2002-2013
Based on the International Patent Classification
(IPC). High-Tech includes: Computer and
automated business equipment; micro-organism
and genetic engineering; aviation;
communications technology; semiconductors;
lasers. Regions with missing averaged data:
EL41 EL51 EL52 EL53 EL54 EL61 EL62 EL63
EL64 EL65 ES63 ES64 SI03 SI04 UKI3 UKI4
UKI5 UKI6 UKI7.
There are four ICT groups: Telecommunications,
Consumer electronics, Computers, office
machinery and other ICT. Regions with missing
averaged data: EL41 EL51 EL52 EL53 EL54
EL61 EL62 EL63 EL64 EL65 ES63 ES64 SI03
SI04 UKI3 UKI4 UKI5 UKI6 UKI7.
Biotechnology relates to IPS sectors belonging
to: Biogenetics, Medicine and analysing
materials. Regions with missing averaged data:
BG31 BG33 BG34 EL41 EL51 EL52 EL53
EL54 EL61 EL62 EL63 EL64 EL65 ES63 ES64
FI20 HR03 ITC2 PT20 RO21 RO22 RO41
RO42 SI03 SI04 UKI3 UKI4 UKI5 UKI6 UKI7.
Eurostat (pat_ep_rtec,
pat_ep_rict,
pat_ep_rbio)
Figure 2.2: Persons
with tertiary education
(ISCED) and employed
in science and
technology, Percentage
of active population
ISCED levels 5 and above. Active population is
the sum of employed and unemployed people.
Average yearly change as the mean value for the
yearly growth rates.
Eurostat (hrst_st_rcat)
Figure 2.3: Scientists
and engineers,
Percentage of active
population
Sub-group of Persons employed in science and
technology: individuals employed as Science
and engineering professionals (ISCO-08 COM
code 21); Health professionals (ISCO-08 COM
code 22); or Information and communications
technology professionals (ISCO-08 COM code
25). Missing 2015 data for FI20 and FR83.
Eurostat (hrst_st_rcat)

119
Table A.2 - Broad Structure of NACE Rev. 2
Section Title Divisions
A Agriculture, forestry and fishing 01 – 03
B Mining and quarrying 05 – 09
C Manufacturing 10 – 33
D Electricity, gas, steam and air conditioning supply 35
E Water supply; sewerage, waste management and remediation activities 36 – 39
F Construction 41 – 43
G Wholesale and retail trade; repair of motor vehicles and motorcycles 45 – 47
H Transportation and storage 49 – 53
I Accommodation and food service activities 55 – 56
J Information and communication 58 – 63
K Financial and insurance activities 64 – 66
L Real estate activities 68
M Professional, scientific and technical activities 69 – 75
N Administrative and support service activities 77 – 82
O Public administration and defence; compulsory social security 84
P Education 85
Q Human health and social work activities 86 – 88
R Arts, entertainment and recreation 90 – 93
S Other service activities 94 – 96
Figure 2.4: High and
medium high-
technology
manufacturing,
Percentage of total
employment, average
yearly change (%),
2008-2015
Average yearly percentage change of
manufacturing employment shares by
technological classification of manufacturing
activities, 2008-2015, missing data for EL41,
EL42, EL43, EL53, EL54, EL62, ES63, ES64,
FI20, FR83, ITC2 and PT15
Eurostat
(htec_emp_reg2)
Figure 2.5: Knowledge-
intensive services,
average yearly
change, %, 2008-2015
Average yearly percentage change of services
employment shares by knowledge intensity
classification of services activities, 2008-2015,
missing data for AT34, DEB2, EL41, EL53,
EL54, EL61, EL62, EL64, FI20, FR21, FR43,
FR63, FR83, ITC2, ITF2, PL43, PL52, PT15,
PT18, UKD1 and UKM6
Eurostat
(htec_emp_reg2)

120
T Activities of households as employers; undifferentiated goods-and
services-producing activities of households for own use
97 – 98
U Activities of extraterritorial organisations and bodies 99
Table A.3 – Manufacturing by its technological content
Manufacturing
Industries
NACE Rev. 2 codes – 2-digit level
High-technology 21 Manufacture of basic pharmaceutical products and
pharmaceutical preparations
26 Manufacture of computer, electronic and optical products
Medium-high-
technology
20 Manufacture of chemicals and chemical products
27 to 30 Manufacture of electrical equipment; Manufacture of
machinery and equipment n.e.c.; Manufacture of motor
vehicles, trailers and semi-trailers; Manufacture of other
transport equipment
Medium-low-
technology
19 Manufacture of coke and refined petroleum products
22 to 25 Manufacture of rubber and plastic products; Manufacture of
other non-metallic mineral products; Manufacture of basic
metals; Manufacture of fabricated metals products, excepts
machinery and equipment
33 Repair and installation of machinery and equipment
Low technology 10 to 18 Manufacture of food products, beverages, tobacco products,
textile, wearing apparel, leather and related products, wood
and of products of wood, paper and paper products, printing
and reproduction of recorded media
31 to 32 Manufacture of furniture; Other manufacturing
Table A.4 – Services aggregation according to their knowledge intensity
Knowledge-based
services
NACE Rev. 2 codes – 2-digit level
Knowledge-intensive
market services
(excluding high-tech
and financial services)
50 to 51 Water transport; Air transport
69 to 71 Legal and accounting activities; Activities of head offices,
management consultancy activities;
Architectural and engineering activities, technical testing
and analysis
73 to 74 Advertising and market research; Other professional,
scientific and technical activities

121
78 Employment activities
80 Security and investigation activities
High-tech
knowledge-
intensive services
59 to 63 Motion picture, video and television programme
production, sound recording and music
publish activities; Programming and broadcasting
activities; Telecommunications; computer
programming, consultancy and related activities;
Information service activities
72 Scientific research and development
Less knowledge-
intensive market
services
45 to 47 Wholesale and retail trade; Repair of motor vehicles and
motorcycles (section G)
49 Land transport and transport via pipelines
52 Warehousing and support activities for transportation;
55 to 56 Accommodation and food service activities (section I);
68 Real estate activities (section L);
77 Rental and leasing activities;
79 Travel agency, tour operator reservation service and related
activities;
81 Services to buildings and landscape activities;
82 Office administrative, office support and other business
support activities;
95 Repair of computers and personal and household goods;


123
Annex III. References
• Acemoglu, D., Johnson, S. and Robinson, J.A., (2005), Institutions as a
fundamental cause of long-run growth, Handbook of Economic Growth, pp.
386-472
• Aghion, P. and Howitt, P. (1992), A model of growth through creative
destruction, Econometrica, vol.60(2), pp.323-351
• Aiginger, K. (2011), Why growth performance differed across countries in the
recent crisis: the impact of pre-crisis conditions, Review of Economics and
finance, vol.4, pp.35-52.
• Aiginger, K. (2012), A systemic industrial policy to pave a new growth path
for Europe, WIFO Working Papers 421
• Aiginger, K. (2014), Industrial policy for a sustainable growth path,
WWWforEurope Policy Paper n°13
• Antonescu, D. (2014), Empirical analysis of foreign direct investment at
NUTS2 region in European Union and Romania, Procedia Economics and
Finance, vol. 22, pp.681-689
• Bailey, D. and De Propris, L. (2014), Manufacturing reshoring and its limits:
the UK automotive case, Cambridge Journal of Regions, Economy and Society,
Vol.7(3), pp.379-395.
• Bailey, D. and De Propris, L. (2016), Manufacturing reshoring: a UK
perspective, in R. Hira and J Eatie, (Ed.s.), Engineering globalization reshoring
& nearshoring: management & policy issues, Singapore: World Scientific
• Brunet, R. (1989), Les villes européennes, Rapport pour la DATA,
Montpellier: RECLUS
• Capello R., Fratesi U. and Resmini L. (2011), Globalization and regional
growth in Europe: past trends and future scenarios, Springer Verlag, Berlin
• Capgemini Consulting (2012), Are manufacturing companies ready to go
digital? Understanding the impact of digital
• Casi, L. and Resmini, L. (2011), Foreign direct investment and growth: a
regional European perspective

124
• Charron, N., Dijkstra, L. and Lapuente, V., (2013), Regional governance
matters: quality of government within European Union Member States, Regional
Studies, vol.48(1), pp.68-90
• Charron, N., Dijkstra, L. and Lapuente, V., (2015), Mapping the regional
divide in Europe: a measure for assessing quality of government in 206
European regions, Social Indicators Research, vol. 122(2), pp. 315-346
• Clark G. and Moonen T. (2014), Munich: a globally fluent metropolitan
economy, Global Cities Initiative: A Joint Project of Brookings and JPMorgan
Chase
• CluStrat (2013), Report on the regional potential of Baden-Württemberg
• Colletis G. (2014), An alternative European industrial policy?, in Transform!
Yearbook 2015, No.1
• Cohen, W.M., and Levinthal, D.A. (1990), Absorptive Capacity: A New
Perspective on Learning and Innovation, Administrative Science Quarterly Vol.
35, pp.128-152
• Committee of the Regions (2011), Administrative burden reduction at the local
and regional level
• Committee of the Regions (2016), Labour mobility and Local and Regional
Authorities: benefits, challenges and solutions
• Cordes, A., Gehrke, B., Rammer, C., Romisch, R., Schliessler, P. and
Wassmann P. (2016), Identifying revealed comparative advantages in an EU
regional context, WIIW, The Vienna Institute for International Economic
Studies, Research Report 412
• Cox and Raikes (2015), Transport for the North - A blueprint for devolving
and integrating transport powers in England, IPPR North
• Dasgupta, S. and Singh, A, (2006), Manufacturing, services and premature
deindustrialization in developing countries: a Kaldorian analysis, UNU-
WIDER, United Nations University Research Paper no. 2006/49
• Dijkstra,L., Annoni. P., and Kozovska, K., (2011), New Regional
Competitiveness Index: theory, methods and findings, Working Ppaers
n°102/2011, European Union, Regional Policy

125
• Driffield, N., Love, Lancheros, S. and Temouri Y. (2013), How attractive is
the UK for future manufacturing foreign direct investment? Future of
Manufacturing Project: Evidence Paper 7
• ECORYS (2013), Exchange of good practice in Foreign Direct Investment
promotion
• ECSIP Consortium (2014), Study on the relation between industry and services
in terms of productivity and value creation, Study for the Directorate-General
for Enterprise and Industry, compiled by wiiw, Ifo and Ecorys
• Ernst and Young (2016), EY’s attractiveness survey UK 2016 - Investing in the
North
• ESPON (2012), KIT – Knowledge, Innovation, Territory, Draft Final Scientific
Report, Volume 1
• EPO (2016), Annual Report 2016- Statistics at a glance, European Patent
Office
• European Commission (2004), Old industrial and mining areas: the added
value of local employment development, First Thematic report of the IDELE
Project
• European Commission (2006), Study on FDI and regional development, DG
for Regional Policy
• European Commission (2008), A ‘small business act’ for European SMEs,
COM(2008) 394 final
• European Commission (2010a), An integrated industrial policy for the
globalisation era putting competitiveness and sustainability at centre stage,
COM (2010) 614
• European Commission (2010b) – Report on the ‘Assessment of the bio-based
products market potential for innovation’, DG Enterprise and Industry
• European Commission (2011), Smart grids: from innovation to deployment,
COM(2011) 202
• European Commission (2012a), Rethinking education: investing in skills for
better socio-economic outcomes, COM(2012) 669

126
• European Commission (2012b), A stronger European industry for growth and
economic recovery industrial policy - Communication update, COM(2012) 582
• European Commission (2012c), Innovating for sustainable growth: a
bioeconomy for Europe, COM(2012) 60 final
• European Commission (2013a), European Competitiveness Report 2013 -
Towards knowledge driven reindustrialisation, Commission Staff Working
Document SWD(2013) 347 final
• European Commission (2013b), EU Regional Competitiveness Index - RCI
2013, JRC Scientific and Policy Reports, Joint Research Centre
• European Commission (2014a), For a European industrial renaissance,
COM(2014) 014
• European Commission (2014b), Enabling SMEs to turn environmental
challenges into business opportunities, COM(2014) 440
• European Commission (2014c), European Competitiveness Report 2014 -
Helping firms grow, Commission Staff Working Document SWD(2014)277
final
• European Commission (2014d), How will standards facilitate new production
systems in the context of EU innovation and competitiveness in 2025?, JRC
Foresight Study
• European Commission (2014e), Advancing manufacturing paves away for
future industry in Europe
• European Commission (2014f), Advancing manufacturing advancing Europe -
Report of the Task Force on Advanced Manufacturing for Clean Production,
DG Enterprise and Industry
• European Commission (2015a), European Cluster Trends – Report 2014, DG
Internal Market, Industry, Entrepreneurship and SMEs
• European Commission (2015b), Internationalisation of small and medium-
sized enterprises, Flash Eurobarometer 421 - TNS Political & Social
• European Commission (2016a), European Innovation Scoreboard 2016, DG
Internal Market, Industry, Entrepreneurship and SMEs

127
• European Commission (2016b), The 2016 EU Industrial R&D Investment
Scoreboard, DG Innovation and Growth and the DG for Research and
Innovation
• European Commission (2016c), Skills for Key Enabling Technologies in
Europe - State-of-play, supply and demand, strategy, recommendations and
sectoral pilot, study carried out by PricewaterhouseCoopers EU Services EESV
• European Commission (2016d), Digitising European Industry Reaping the full
benefits of a Digital Single Market, Commission Staff Working Document
SWD(2016) 110/2
• European Commission (2017a), Digital Economy and Society Index (DESI)
2017, Fact Sheet
• European Commission (2017b), Competitiveness in low-income and low-
growth regions - The lagging regions report, SWD(2017) 132 Final
• European Parliament (2013), Regional strategies for industrial areas, DG for
Internal Policies
• European Parliament (2014), How can European industry contribute to growth
and foster European competitiveness?, DG for Internal Policies, Study for the
ITRE Committee
• European Technology Platform Phototonics21 (2013), Towards 2020 –
Photonics driving economic growth in Europe – Multiannual Strategic
Roadmap 2014-2020
• EUSBSR (2015), Guide to funding opportunities provided by the European
Union for project initiatives in the policy areas of education, youth and labour
mobility within the EU Strategy for the Baltic Sea Region, PA Education –
Funding Opportunities for Projects
• Frey C. B. and Osborne M. A. (2017), The future of employment: how
susceptible are jobs to computerisation?, Technological Forecasting and Social
Change, Vol. 114, Pages 254–280
• Geerts N., Maris S., Van Langenhove M., Verdoodt P., Viaene P. (2016), STI
in Flanders - Science, Technology & Innovation Policy & Key Figures 2016,
Department Economy, Science and Innovation

128
• Gibson, M. (2014), Bringing manufacturing back - Is the tide of offshoring
beginning to turn towards reshoring?, Civitas: Institute for the Study of Civil
Society
• Grossman G.M. and Helpman, E. (1994), Endogenous innovation in the theory
of growth, The Journal of Economic Perspectives, vol.8(1), pp.23-44
• Helmut K., Möller A. and Wink R. (2003), Regional industrial policies in
Germany, Ceris-Cnr, W.P. N° 9 /2003
• High Level Group on Administrative Burdens (2014), Cutting red tape in
Europe - Legacy and outolook
• High-Level Expert Group on Key Enabling Technologies (2014), KETs for a
competitive Europe
• High-Level Expert Group on Key Enabling Technologies (2015), KETs: Time
to act
• Hospers J.G. (2003), Beyond the Blue Banana? Structural change in Europe’s
geo-economy, Intereconomics vol. 38(2), pp.76-85
• Investi in Trentino (2012), Trentino's public administration: increasing
productivity
• Matsuyama, K. (2009), Structural change in an interdependent world: a global
view of manufacturing decline, Journal of the European Economic Association,
vol.7(2-3), pp. 478-486
• McKinsey and Company (2012), Manufacturing of the future: the next era of
global growth and innovation
• Ministère de l’Agriculture de l’Agroalimentaire et de la Foret (2016),
Construire une stratégie nationale pour la bioéconomie, Build a national
strategy for bioeconomy
• Ministerium fur Wirtschaft, Arbeit und Wohnungsbau Baden-Wurttemberg
(2016), Regional Cluster Atlas - Baden-Wurttemberg
• Napier G. and Kethelz S. (2014), The welfare technological ecosystem in the
region of Southern Denmark, REG X – The Danish Cluster Academy

129
• Nickell, S., Redding S. and J.Swaffield (2008), The uneven pace of
deindustrailization in the OECD, Center for Economic Performace, Londion
School of Economics
• OECD (2012), OECD Reviews of regional innovation: Central and Southern
Denmark 2012, OECD Publishing
• Overbeek G., de Bakker E., Beekman V., Davies S., Kiresiewa Z., Delbrück
S., Ribeiro B., Stoyanov M., Manfredi V., Review of bioeconomy strategies at
regional and national levels, BioSTEP
• Plasticeproject (2014), The biorefining opportunities in Emilia-Romagna
• Regional Council for North Karealia (2010), Best practices from North Karelia
towards the Europe 2020 Strategy, EUFUND 2010 project
• Rifkin, J. (2011), The third industrial revolution: how lateral power is
transforming energy, the economy, and the world, Palgrave MacMillan
• Rodriguez-Pose, A. (2013), Do institutions matter for regional development?,
Regional Studies, vol.47(7), pp. 1034-1047
• Rodrik, D. (2004), Industrial policy in the twenty-first century, paper prepared
for UNIDO
• Rodrik, D. (2015), Premature deindustrialization, Economic Working Papers
107, School of Socila Science
• Romer, P.M. (1990), Endogenous technological change, Journal of Political
Economy, vol. 98(5), pp.71-102
• Ross, A. (2016), The industries of the future, Simon & Schuster eBook
• Salet W. and Gualini E. (2007), Framing strategic urban projects – Learning
from current experiences in European Urban regions, Routledge
• Silve, F. and Plekhanov, A. (2015), Institutions, innovation and growth: cross-
country evidence, Europeaank for Reconstruction and Development, Working
Paper n°77
• Skokan, K. (2009), Regional clusters and transformation of old industrial
regions, 3rd
Central European Conference in Regional Science , CERS 2009

130
• Sellenthin M.O. and Rammer C. (2007), R&D policy in Saxony: EU Structural
Funds and industrial restructuring, Monitoring and analysis of policies and
public fianncing instruments conducive to higher levels of R&D investments,
the ‘Policy mix’ project
• Solow, R. (1956), A contribution to the theory of economic growth, The
Quarterly Journal of Economics, vol.70(1), pp. 65-94
• Technopolis (2012), Regional Innovation Report (Upper Austria), Regional
Innovation Monitor
• Technopolis (2016), Regional Innovation Report Baden-Württemberg
(Industry 4.0 and smart systems), Regional Innovation Monitor Plus 2016
• Textile-future.com (2015), An Italian textile and textile machinery region of
excellence
• The Ellen MacArthur Foundation (2013), Towards the circular economy -
Economic and business rationale for an accelerated transition
• TIR Consulting Group LLC (2013), Nord-Pas-de-Calais - La troisième
révolution industrielle – Master Plan’
• Trippl, M. and Tödtling, F. (2008), Cluster renewal in old industrial regions:
continuity or radical change?, in Karlsson, C. (ed.) Handbook of research on
cluster theory, Handbooks of Research on Clusters series
• UNCTAD (2016), World Investment Report 2016, United Nations
• UNCTAD and ILO (2014), Transforming economies - Making industrial
policy work for growth, jobs and development, International Labour Office,
Geneva
• Union of the Baltic Cities (2008), Integrated Management – Towards local
and regional sustainability
• Warwick, K. (2013), Beyond industrial policy: Emerging issues and new
trends, OECD Science, Technology and Industry Policy Papers, No. 2, OECD
Publishing.
• Wübbeke, J., Meissner, M., Zenglein, M.J., Ives, J., Conrad, B. (2016), Made
in China 2025 - The making of a high-tech superpower and consequences for
industrial countries, Merics Papers on China n°2

131
Annex IV. Main findings,
recommendations and policy options
(Power Point presentation)

132

133

134