
The Future of Desktop Support - HDI Regina … · 70+ Key Performance Indicators ... Productivity,...
59
The Future of Desktop Support Desktop Support Best Practices Series What the KPIs Are Telling Us
Transcript of The Future of Desktop Support - HDI Regina … · 70+ Key Performance Indicators ... Productivity,...
The Future of Desktop Support
Desktop Support Best Practices Series
What the KPIs Are Telling Us
2
Download Today’s Presentation
http://www.metricnet.com/hdiregina/

Turbocharge Your Metrics with Benchmarking
Session 202
Wednesday, May 10 at 11:30 AM_
_______________________________________________________________________________________________________________
Any Time, Any Place:
The Ultimate Customer Experience!
Session 308
Wednesday, May 10 at 3:00 PM
4© MetricNet, LLC, www.metricnet.com
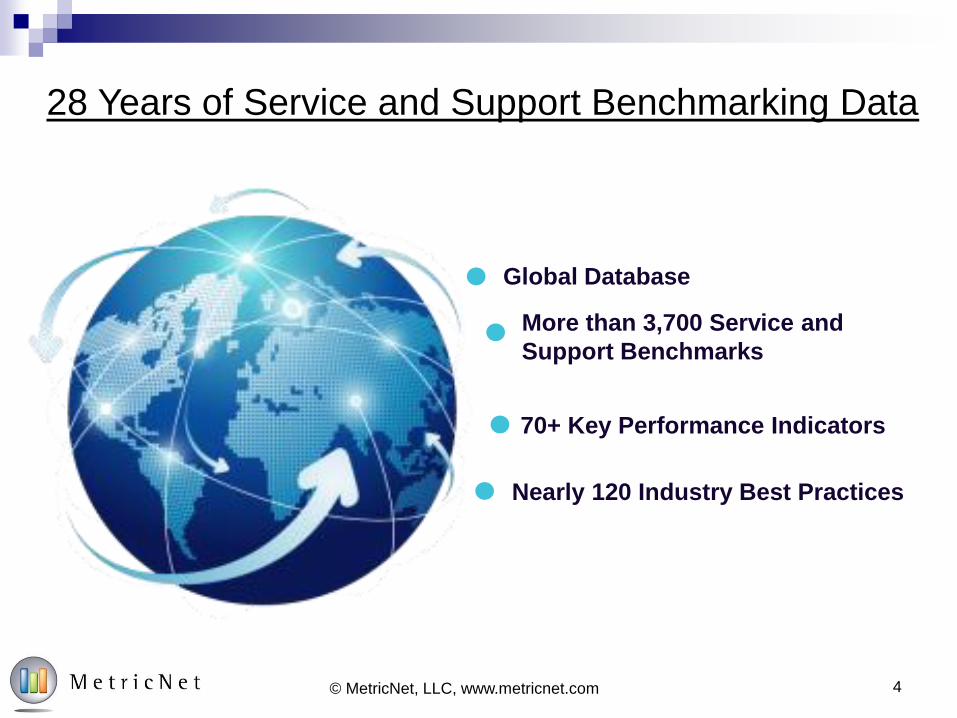
28 Years of Service and Support Benchmarking Data
More than 3,700 Service and
Support Benchmarks
Global Database
70+ Key Performance Indicators
Nearly 120 Industry Best Practices

Desktop Support Quiz
5© MetricNet, LLC, www.metricnet.com
1. Is headcount in desktop support increasing or decreasing? Why?
2. Is Cost per Ticket in desktop support increasing or decreasing? Why?
3. What are the two most important KPIs in Desktop Support?
4. How many tickets does the average desktop tech resolve in a month?
5. How many tickets does the average level 1 tech resolve in a month?
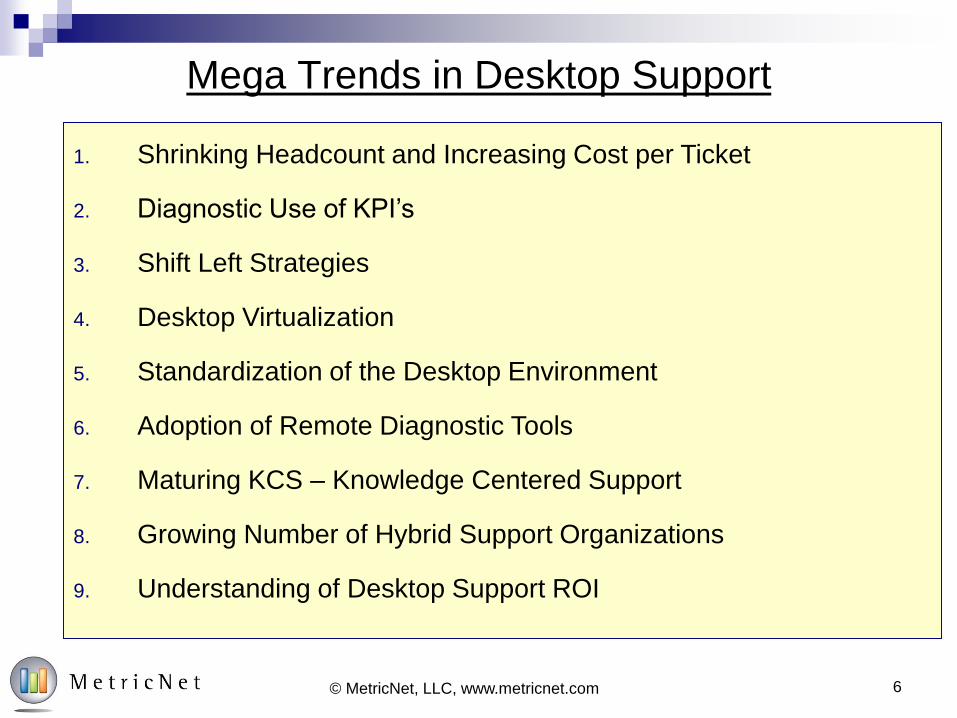
Mega Trends in Desktop Support
6© MetricNet, LLC, www.metricnet.com
1. Shrinking Headcount and Increasing Cost per Ticket
2. Diagnostic Use of KPI’s
3. Shift Left Strategies
4. Desktop Virtualization
5. Standardization of the Desktop Environment
6. Adoption of Remote Diagnostic Tools
7. Maturing KCS – Knowledge Centered Support
8. Growing Number of Hybrid Support Organizations
9. Understanding of Desktop Support ROI
Mega Trends in Desktop Support
7© MetricNet, LLC, www.metricnet.com
1. Shrinking Headcount and Increasing Cost per Ticket
2. Diagnostic Use of KPI’s
3. Shift Left Strategies
4. Desktop Virtualization
5. Standardization of the Desktop Environment
6. Adoption of Remote Diagnostic Tools
7. Maturing KCS – Knowledge Centered Support
8. Growing Number of Hybrid Support Organizations
9. Understanding of Desktop Support ROI
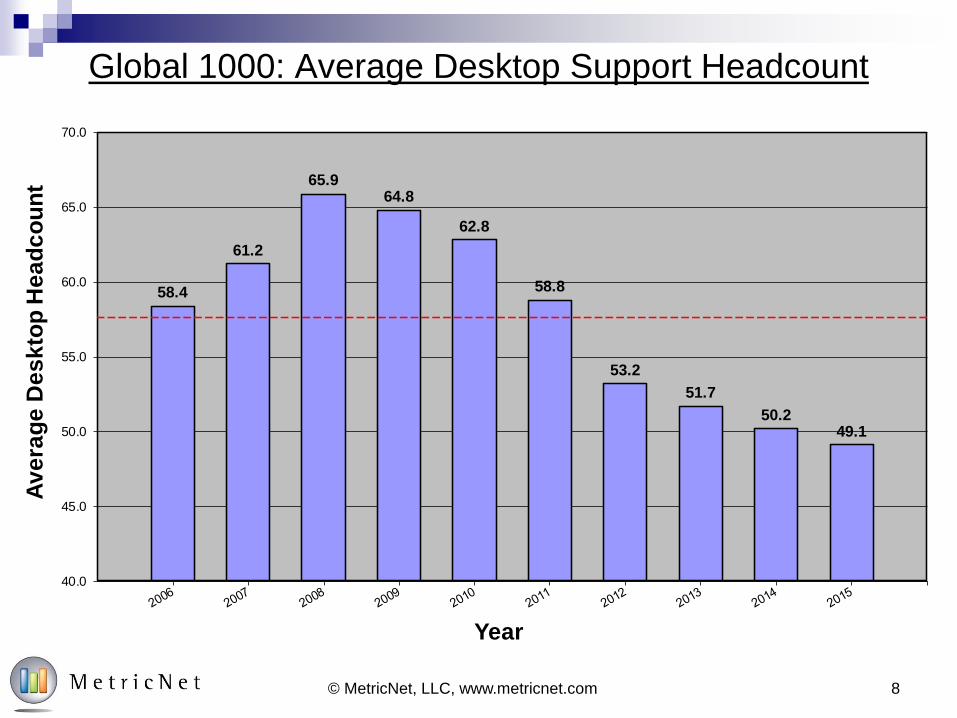
Global 1000: Average Desktop Support Headcount
© MetricNet, LLC, www.metricnet.com 8
58.4
61.2
65.964.8
62.8
58.8
53.2
51.7
50.249.1
40.0
45.0
50.0
55.0
60.0
65.0
70.0
Av
era
ge
De
sk
top
He
ad
co
un
t
Year
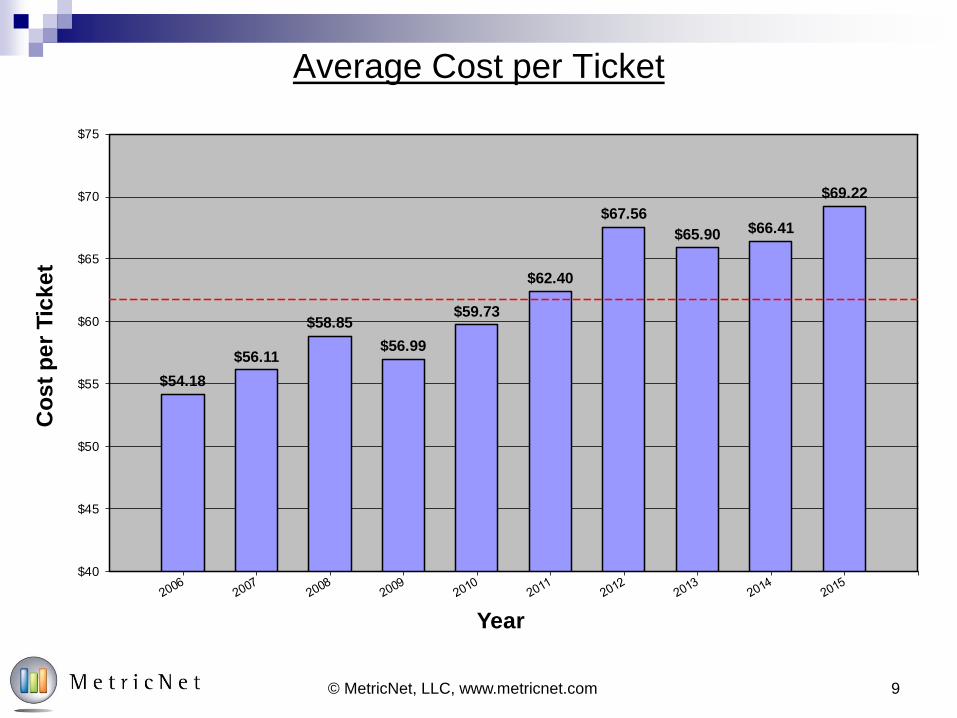
Average Cost per Ticket
© MetricNet, LLC, www.metricnet.com 9
$54.18
$56.11
$58.85
$56.99
$59.73
$62.40
$67.56
$65.90 $66.41
$69.22
$40
$45
$50
$55
$60
$65
$70
$75
Co
st
pe
r T
ick
et
Year
Mega Trends in Desktop Support
10© MetricNet, LLC, www.metricnet.com
1. Shrinking Headcount and Increasing Cost per Ticket
2. Diagnostic Use of KPI’s
3. Shift Left Strategies
4. Desktop Virtualization
5. Standardization of the Desktop Environment
6. Adoption of Remote Diagnostic Tools
7. Maturing KCS – Knowledge Centered Support
8. Growing Number of Hybrid Support Organizations
9. Understanding of Desktop Support ROI
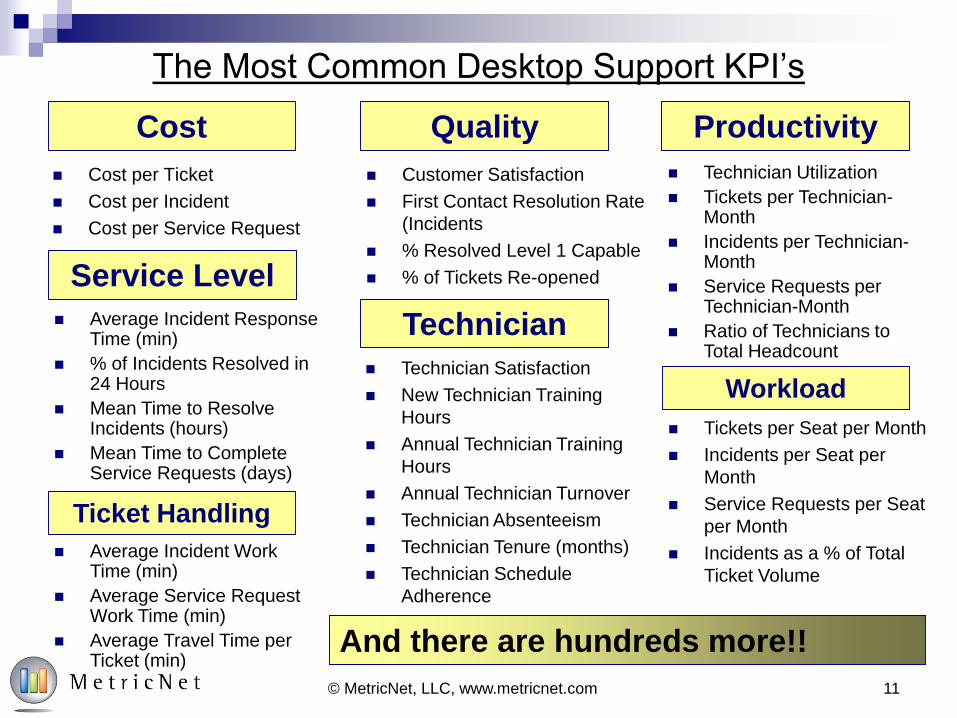
The Most Common Desktop Support KPI’s
Cost per Ticket
Cost per Incident
Cost per Service Request
Cost Productivity
Service Level
Quality
Ticket Handling
Technician Average Incident Response Time (min)
% of Incidents Resolved in 24 Hours
Mean Time to Resolve Incidents (hours)
Mean Time to Complete Service Requests (days)
Technician Utilization
Tickets per Technician-Month
Incidents per Technician-Month
Service Requests per Technician-Month
Ratio of Technicians to Total Headcount
Customer Satisfaction
First Contact Resolution Rate
(Incidents
% Resolved Level 1 Capable
% of Tickets Re-opened
Technician Satisfaction
New Technician Training
Hours
Annual Technician Training
Hours
Annual Technician Turnover
Technician Absenteeism
Technician Tenure (months)
Technician Schedule
Adherence
Average Incident Work Time (min)
Average Service Request Work Time (min)
Average Travel Time per Ticket (min)
And there are hundreds more!!
Workload
Tickets per Seat per Month
Incidents per Seat per
Month
Service Requests per Seat
per Month
Incidents as a % of Total
Ticket Volume
© MetricNet, LLC, www.metricnet.com 11
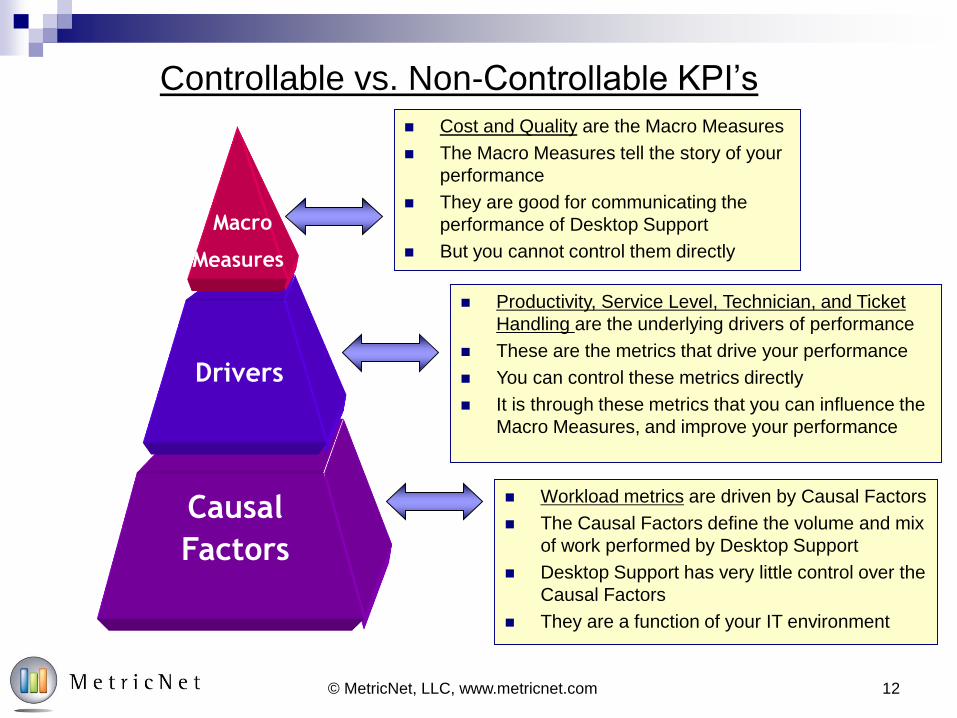
Controllable vs. Non-Controllable KPI’s
Causal
Factors
Drivers
Cost and Quality are the Macro Measures
The Macro Measures tell the story of your
performance
They are good for communicating the
performance of Desktop Support
But you cannot control them directly
Workload metrics are driven by Causal Factors
The Causal Factors define the volume and mix
of work performed by Desktop Support
Desktop Support has very little control over the
Causal Factors
They are a function of your IT environment
Productivity, Service Level, Technician, and Ticket
Handling are the underlying drivers of performance
These are the metrics that drive your performance
You can control these metrics directly
It is through these metrics that you can influence the
Macro Measures, and improve your performance
© MetricNet, LLC, www.metricnet.com 12
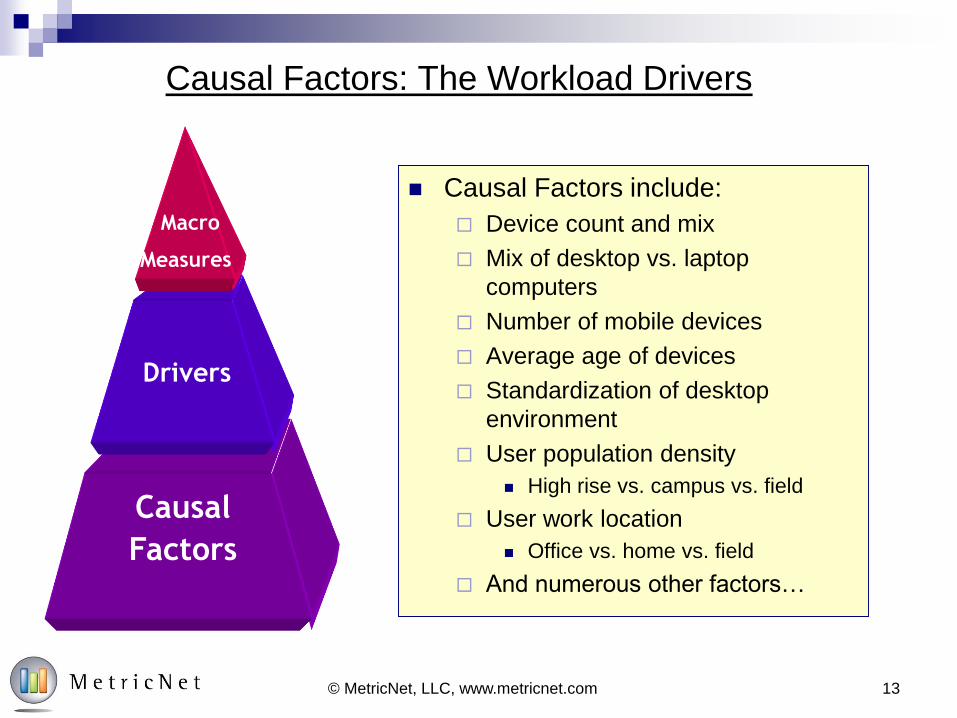
Causal Factors: The Workload Drivers
Causal
Factors
Drivers
Causal Factors include:
Device count and mix
Mix of desktop vs. laptop
computers
Number of mobile devices
Average age of devices
Standardization of desktop
environment
User population density
High rise vs. campus vs. field
User work location
Office vs. home vs. field
And numerous other factors…
© MetricNet, LLC, www.metricnet.com 13
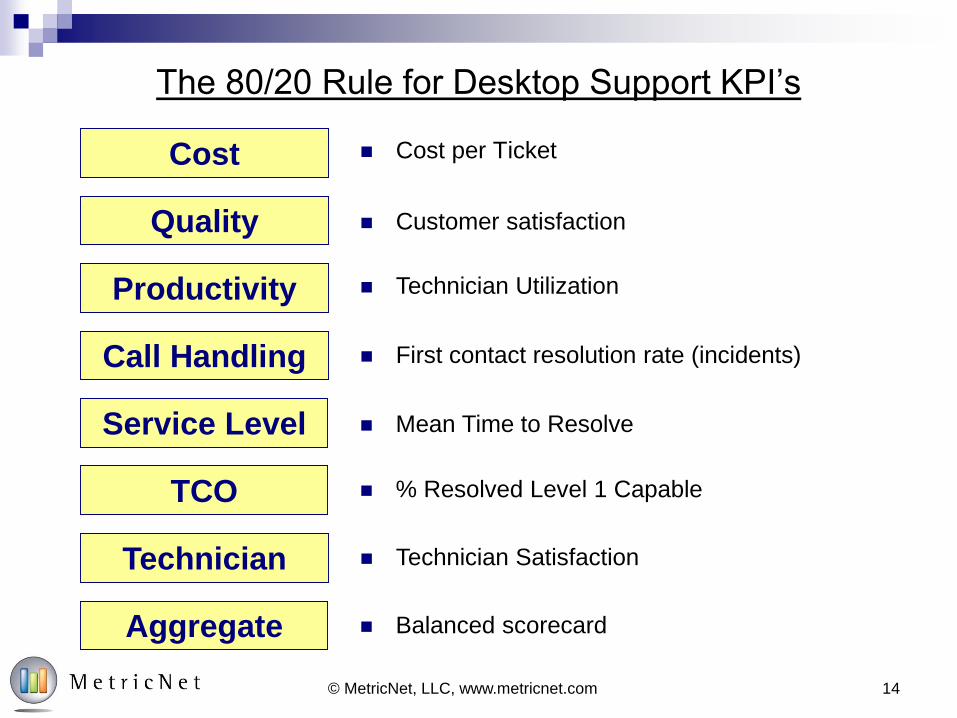
The 80/20 Rule for Desktop Support KPI’s
Cost per TicketCost
Productivity
Quality
Call Handling
Technician Utilization
Customer satisfaction
First contact resolution rate (incidents)
Technician Technician Satisfaction
Aggregate Balanced scorecard
TCO % Resolved Level 1 Capable
Service Level Mean Time to Resolve
© MetricNet, LLC, www.metricnet.com 14
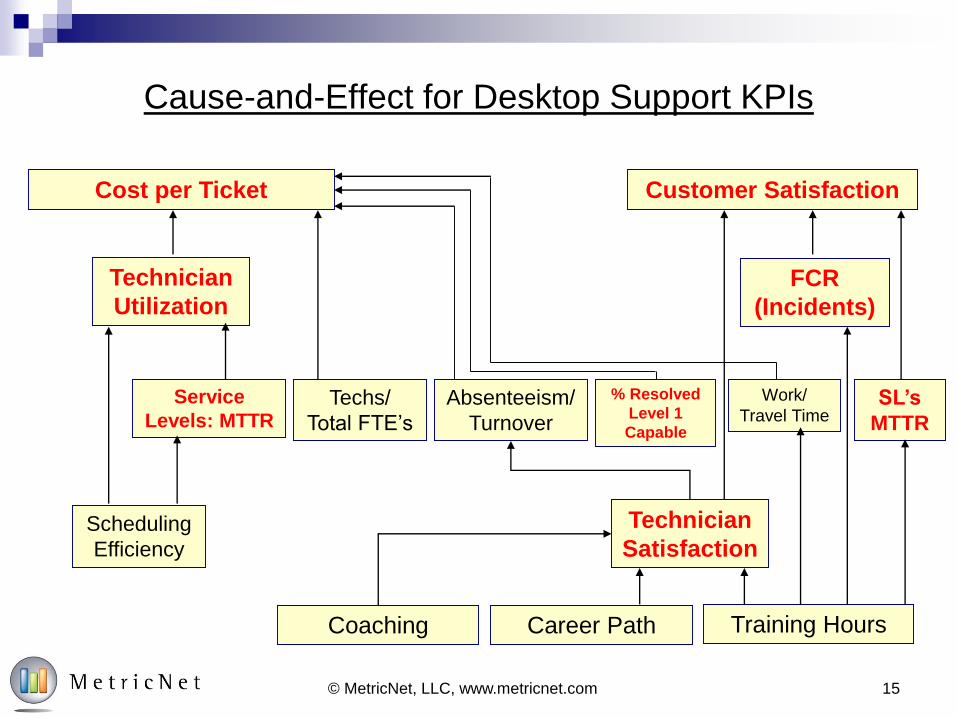
Cause-and-Effect for Desktop Support KPIs
Cost per Ticket Customer Satisfaction
Technician
UtilizationFCR
(Incidents)
Technician
Satisfaction
Coaching Career Path Training Hours
SL’s
MTTR
Work/
Travel TimeTechs/
Total FTE’s
Absenteeism/
Turnover
% Resolved
Level 1
Capable
Scheduling
Efficiency
Service
Levels: MTTR
© MetricNet, LLC, www.metricnet.com 15
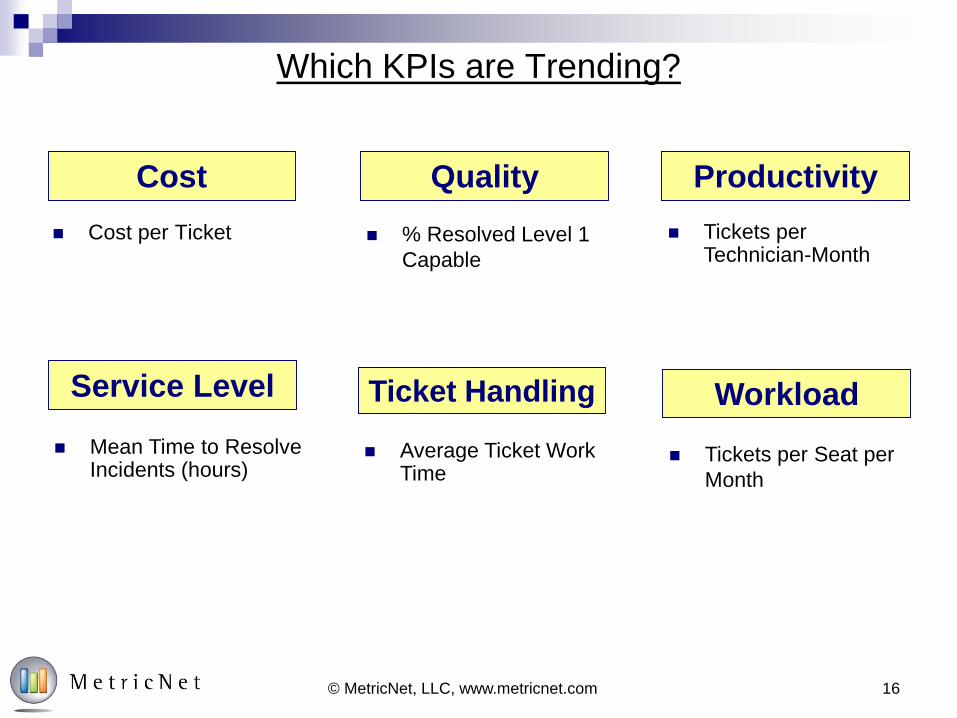
Which KPIs are Trending?
Cost per Ticket
Cost Productivity
Service Level
Quality
Ticket Handling
Mean Time to Resolve Incidents (hours)
Tickets per Technician-Month
% Resolved Level 1
Capable
Average Ticket Work Time
Workload
Tickets per Seat per
Month
© MetricNet, LLC, www.metricnet.com 16
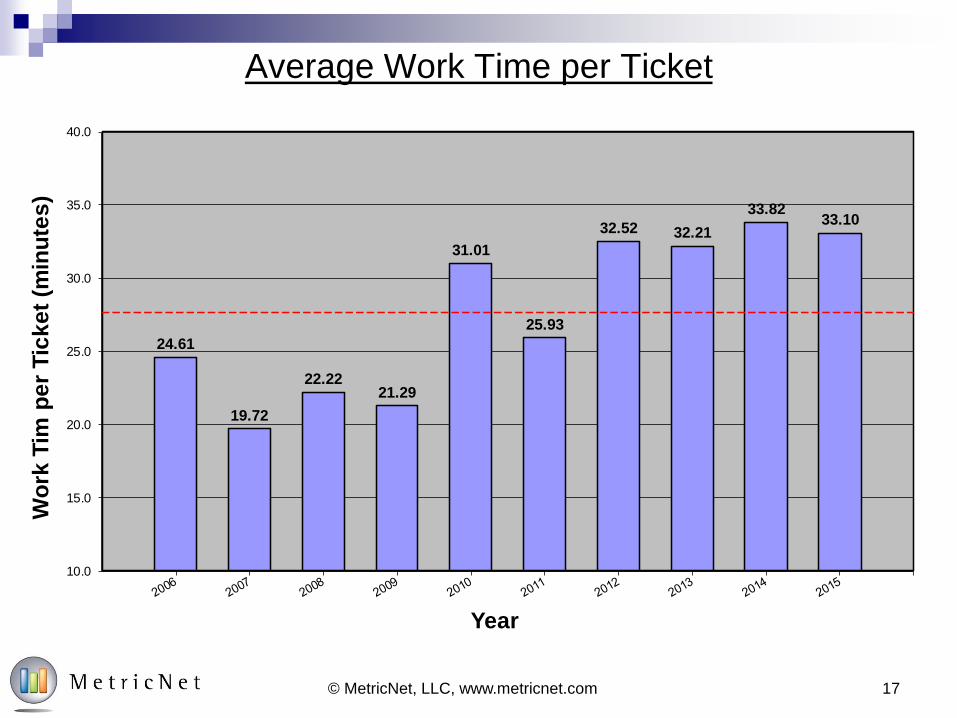
Average Work Time per Ticket
© MetricNet, LLC, www.metricnet.com 17
24.61
19.72
22.2221.29
31.01
25.93
32.52 32.21
33.8233.10
10.0
15.0
20.0
25.0
30.0
35.0
40.0
Wo
rk T
im p
er
Tic
ke
t (m
inu
tes
)
Year
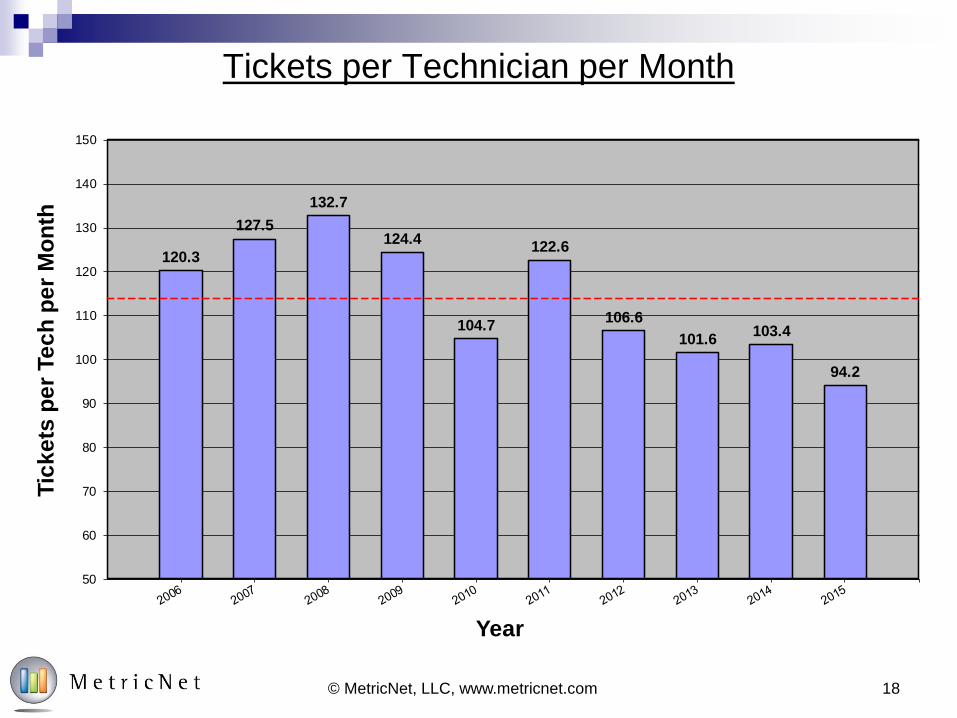
Tickets per Technician per Month
© MetricNet, LLC, www.metricnet.com 18
120.3
127.5
132.7
124.4
104.7
122.6
106.6
101.6103.4
94.2
50
60
70
80
90
100
110
120
130
140
150
Tic
ke
ts p
er
Te
ch
pe
r M
on
th
Year

Average Cost per Ticket
© MetricNet, LLC, www.metricnet.com 19
$54.18
$56.11
$58.85
$56.99
$59.73
$62.40
$67.56
$65.90 $66.41
$69.22
$40
$45
$50
$55
$60
$65
$70
$75
Co
st
pe
r T
ick
et
Year
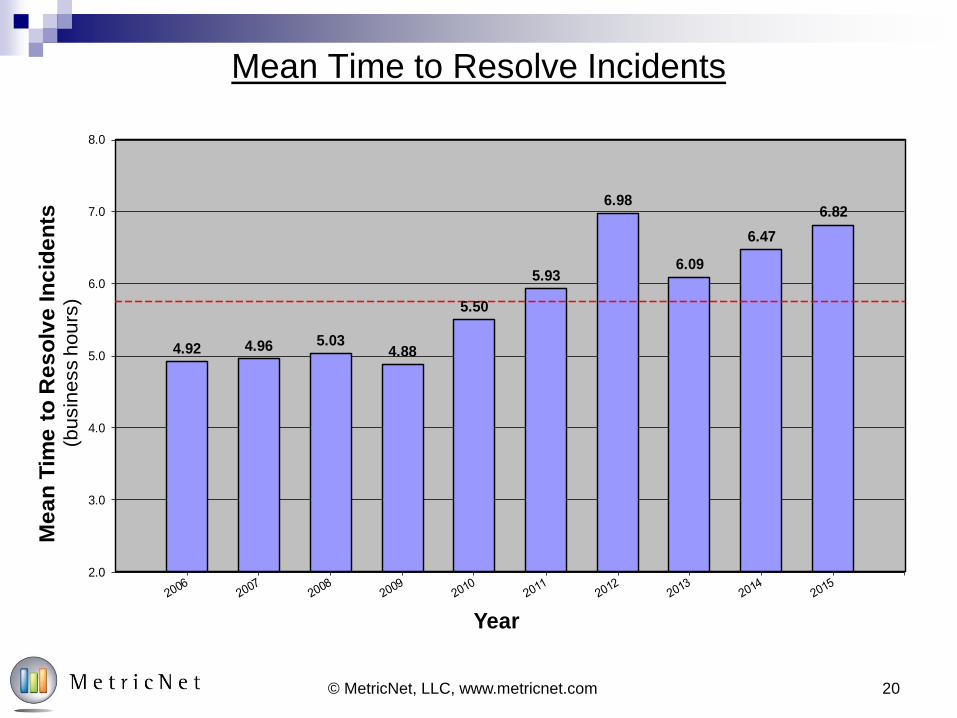
Mean Time to Resolve Incidents
© MetricNet, LLC, www.metricnet.com 20
4.92 4.96 5.034.88
5.50
5.93
6.98
6.09
6.47
6.82
2.0
3.0
4.0
5.0
6.0
7.0
8.0
Me
an
Tim
e t
o R
es
olv
e In
cid
en
ts
(bu
sin
ess h
ou
rs)
Year
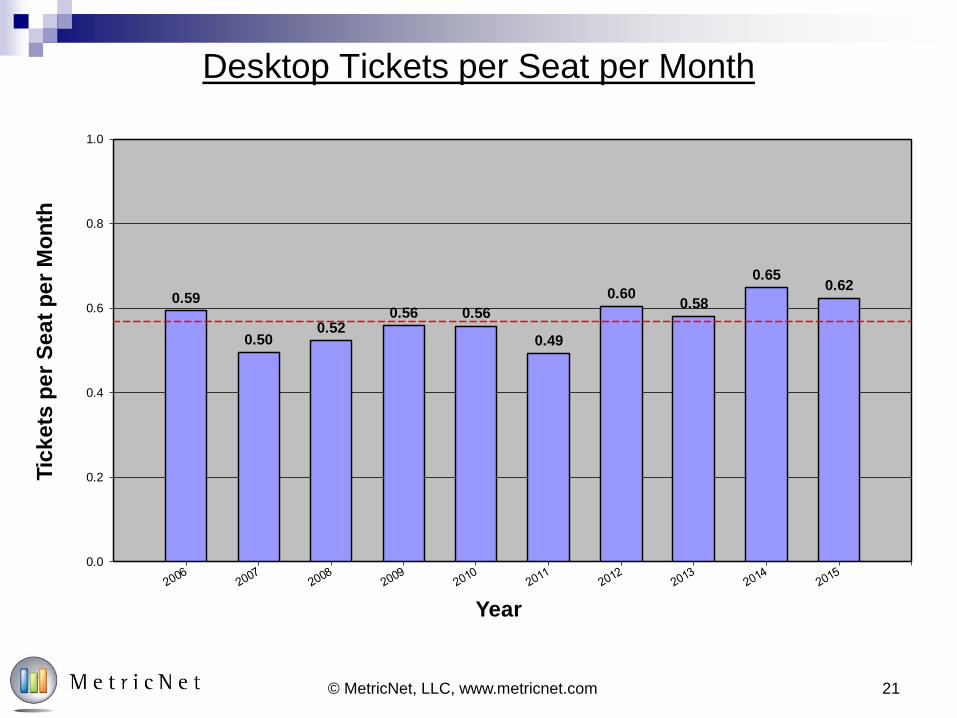
Desktop Tickets per Seat per Month
© MetricNet, LLC, www.metricnet.com 21
0.59
0.500.52
0.56 0.56
0.49
0.600.58
0.650.62
0.0
0.2
0.4
0.6
0.8
1.0
Tic
ke
ts p
er
Se
at
pe
r M
on
th
Year
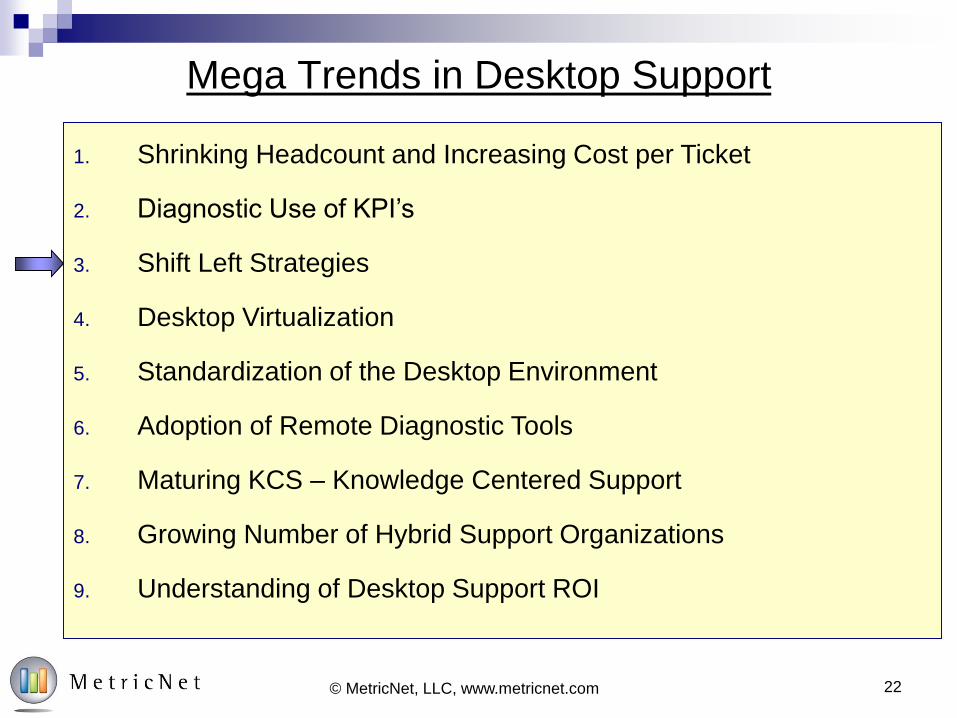
Mega Trends in Desktop Support
22© MetricNet, LLC, www.metricnet.com
1. Shrinking Headcount and Increasing Cost per Ticket
2. Diagnostic Use of KPI’s
3. Shift Left Strategies
4. Desktop Virtualization
5. Standardization of the Desktop Environment
6. Adoption of Remote Diagnostic Tools
7. Maturing KCS – Knowledge Centered Support
8. Growing Number of Hybrid Support Organizations
9. Understanding of Desktop Support ROI

23© MetricNet, LLC, www.metricnet.com
Shift Left Reduces Total Cost of Ownership
24© MetricNet, LLC, www.metricnet.com
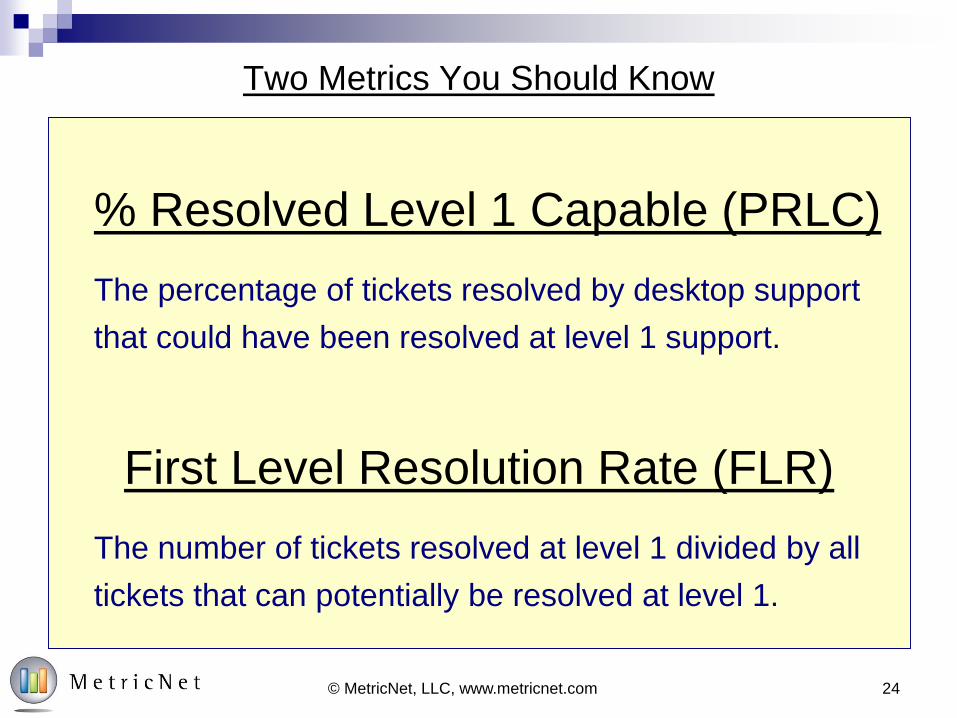
Two Metrics You Should Know
% Resolved Level 1 Capable (PRLC)
The percentage of tickets resolved by desktop support
that could have been resolved at level 1 support.
First Level Resolution Rate (FLR)
The number of tickets resolved at level 1 divided by all
tickets that can potentially be resolved at level 1.
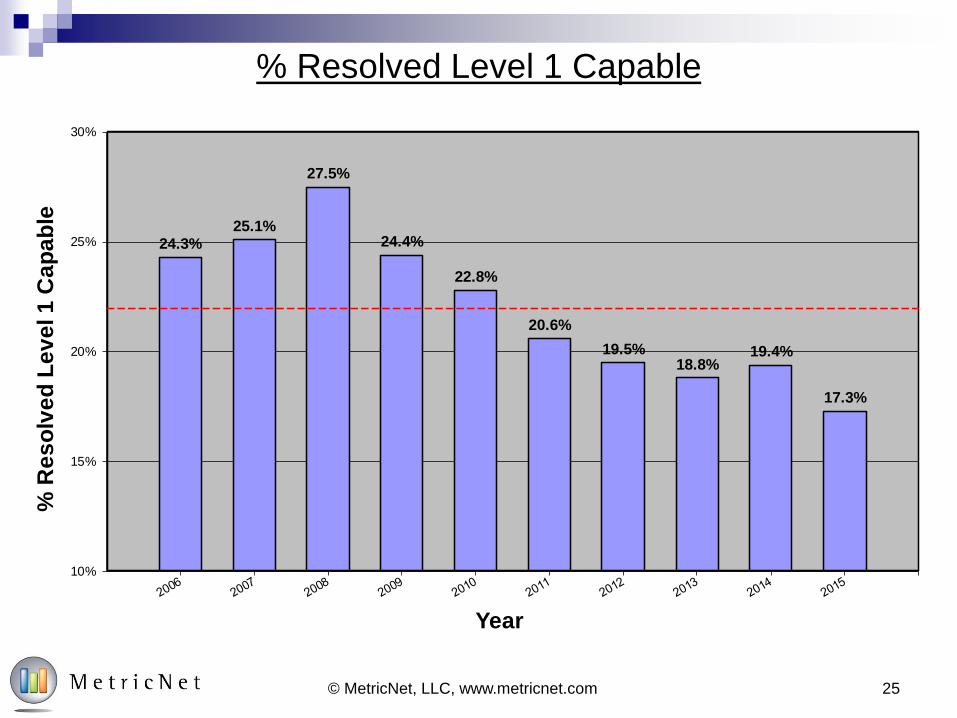
% Resolved Level 1 Capable
© MetricNet, LLC, www.metricnet.com 25
24.3%25.1%
27.5%
24.4%
22.8%
20.6%
19.5%18.8%
19.4%
17.3%
10%
15%
20%
25%
30%
% R
es
olv
ed
Le
ve
l 1
Ca
pa
ble
Year
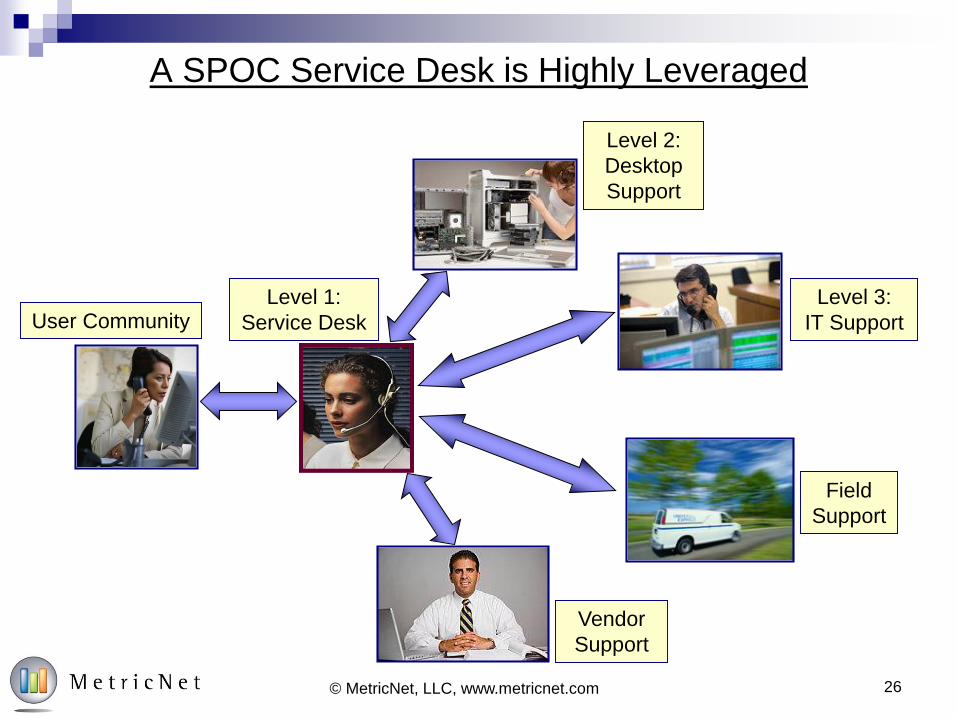
A SPOC Service Desk is Highly Leveraged
User CommunityLevel 1:
Service Desk
Level 2:
Desktop
Support
Field
Support
Level 3:
IT Support
Vendor
Support
26© MetricNet, LLC, www.metricnet.com
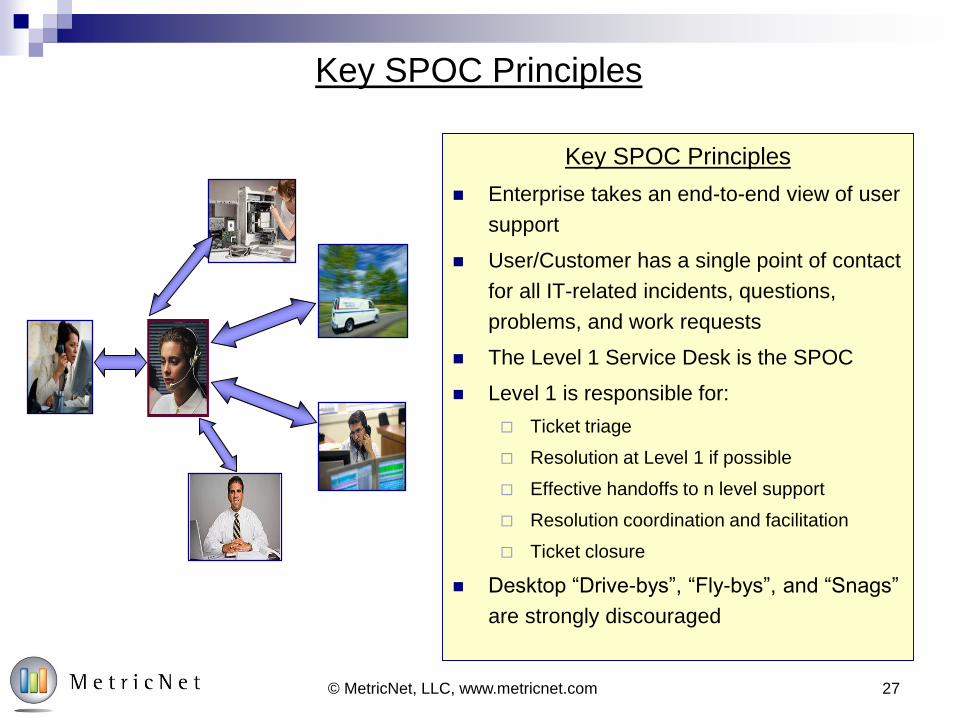
Key SPOC Principles
Key SPOC Principles
Enterprise takes an end-to-end view of user
support
User/Customer has a single point of contact
for all IT-related incidents, questions,
problems, and work requests
The Level 1 Service Desk is the SPOC
Level 1 is responsible for:
Ticket triage
Resolution at Level 1 if possible
Effective handoffs to n level support
Resolution coordination and facilitation
Ticket closure
Desktop “Drive-bys”, “Fly-bys”, and “Snags”
are strongly discouraged
© MetricNet, LLC, www.metricnet.com 27
28© MetricNet, LLC, www.metricnet.com
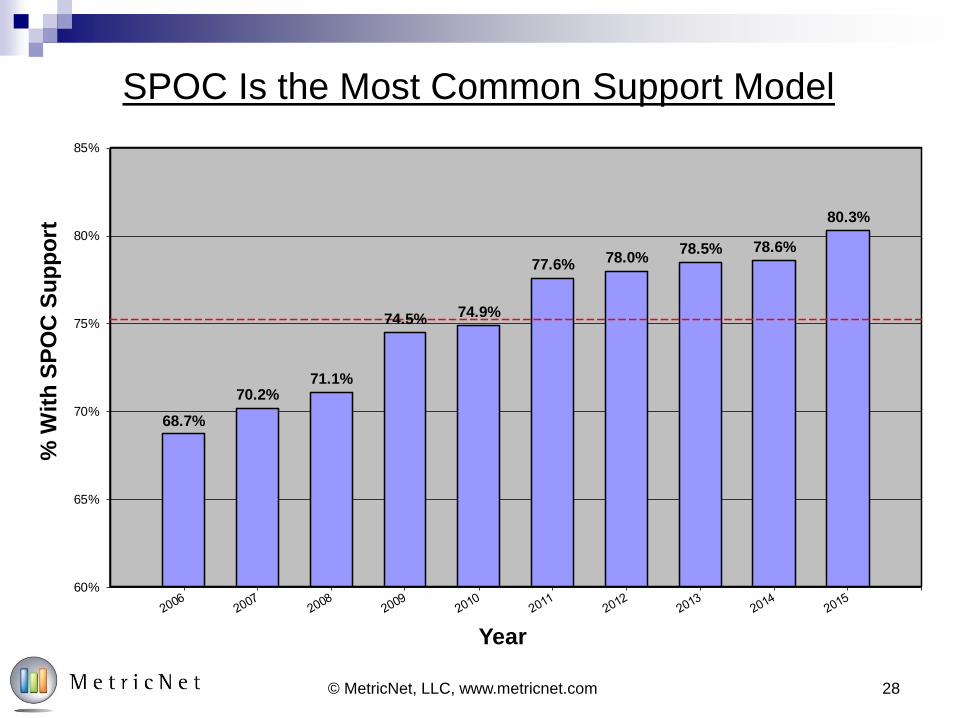
SPOC Is the Most Common Support Model
68.7%
70.2%71.1%
74.5% 74.9%
77.6% 78.0%78.5% 78.6%
80.3%
60%
65%
70%
75%
80%
85%
% W
ith
SP
OC
Su
pp
ort
Year
29© MetricNet, LLC, www.metricnet.com
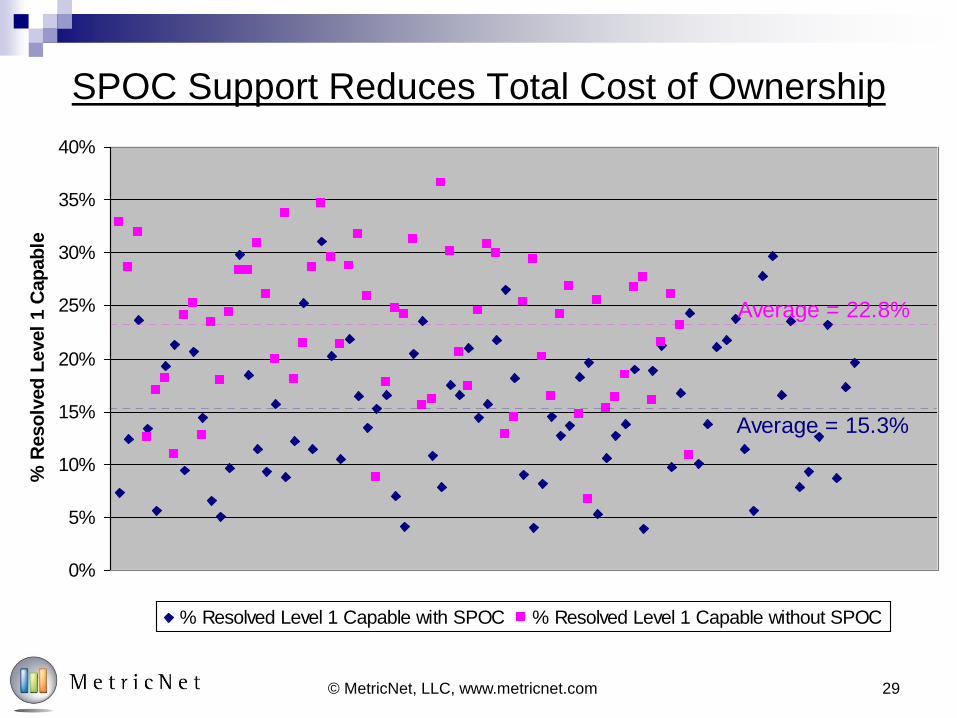
SPOC Support Reduces Total Cost of Ownership
0%
5%
10%
15%
20%
25%
30%
35%
40%
% R
eso
lved
Level
1 C
ap
ab
le
% Resolved Level 1 Capable with SPOC % Resolved Level 1 Capable without SPOC
Average = 22.8%
Average = 15.3%
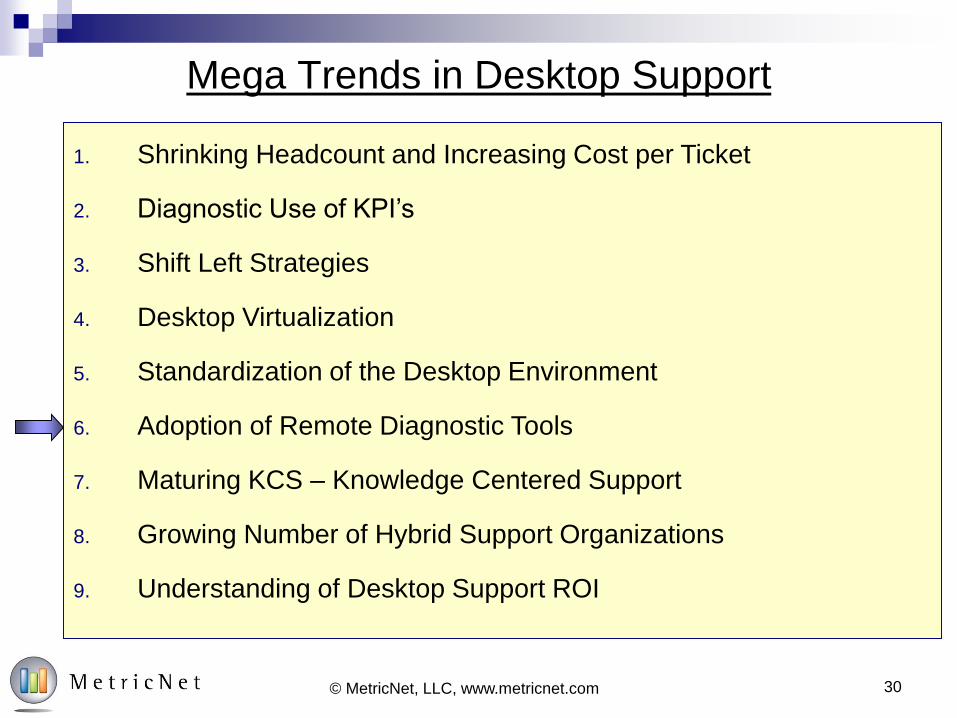
Mega Trends in Desktop Support
30© MetricNet, LLC, www.metricnet.com
1. Shrinking Headcount and Increasing Cost per Ticket
2. Diagnostic Use of KPI’s
3. Shift Left Strategies
4. Desktop Virtualization
5. Standardization of the Desktop Environment
6. Adoption of Remote Diagnostic Tools
7. Maturing KCS – Knowledge Centered Support
8. Growing Number of Hybrid Support Organizations
9. Understanding of Desktop Support ROI
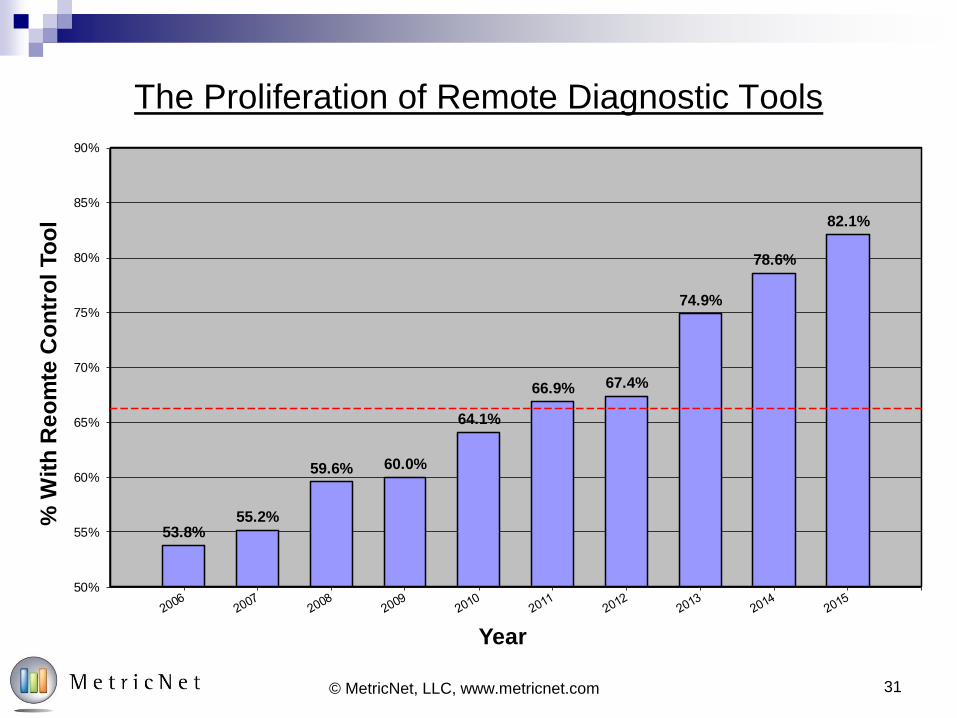
The Proliferation of Remote Diagnostic Tools
© MetricNet, LLC, www.metricnet.com
53.8%55.2%
59.6% 60.0%
64.1%
66.9% 67.4%
74.9%
78.6%
82.1%
50%
55%
60%
65%
70%
75%
80%
85%
90%
% W
ith
Re
om
te C
on
tro
l To
ol
Year
31
0.0%
10.0%
20.0%
30.0%
40.0%
50.0%
60.0%
70.0%
80.0%
90.0%
100.0%
Ne
t F
irs
t L
ev
el R
es
olu
tio
n
Remote Diagnostic Software No Remote Diagnostic Software
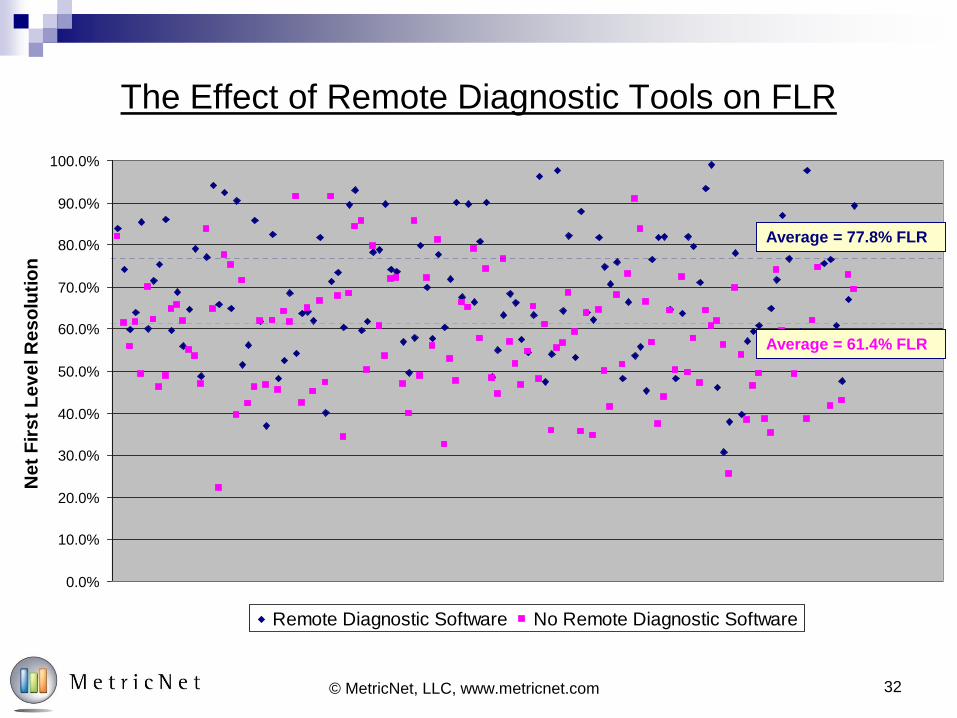
The Effect of Remote Diagnostic Tools on FLR
Average = 77.8% FLR
Average = 61.4% FLR
© MetricNet, LLC, www.metricnet.com 32
Mega Trends in Desktop Support
33© MetricNet, LLC, www.metricnet.com
1. Shrinking Headcount and Increasing Cost per Ticket
2. Diagnostic Use of KPI’s
3. Shift Left Strategies
4. Desktop Virtualization
5. Standardization of the Desktop Environment
6. Adoption of Remote Diagnostic Tools
7. Maturing KCS – Knowledge Centered Support
8. Growing Number of Hybrid Support Organizations
9. Understanding of Desktop Support ROI
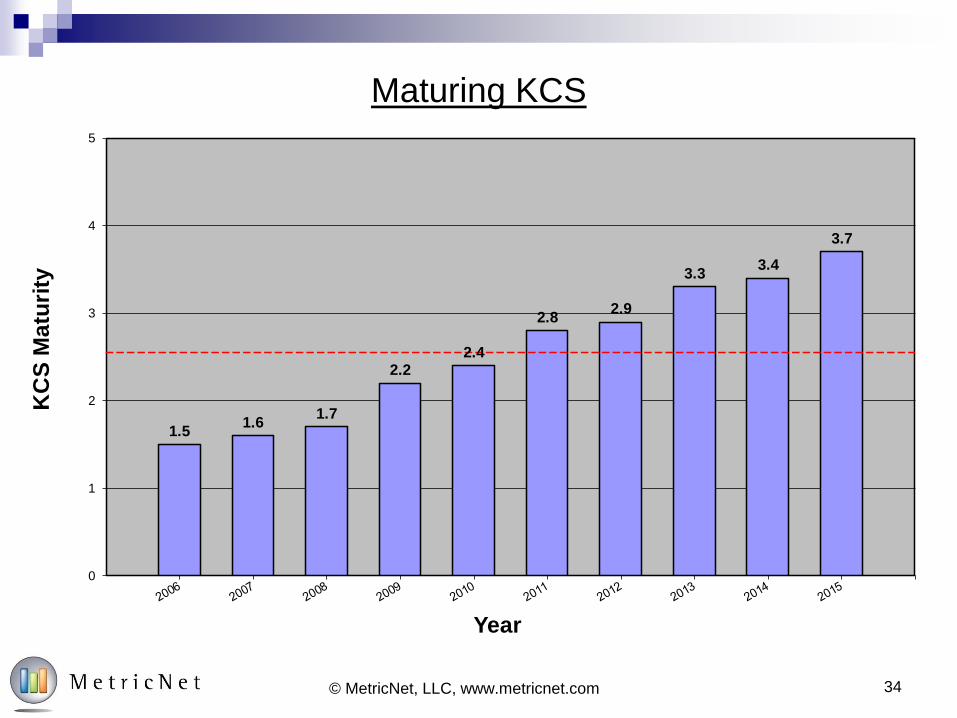
Maturing KCS
© MetricNet, LLC, www.metricnet.com
1.51.6
1.7
2.22.4
2.82.9
3.33.4
3.7
0
1
2
3
4
5
KC
S M
atu
rity
Year
34
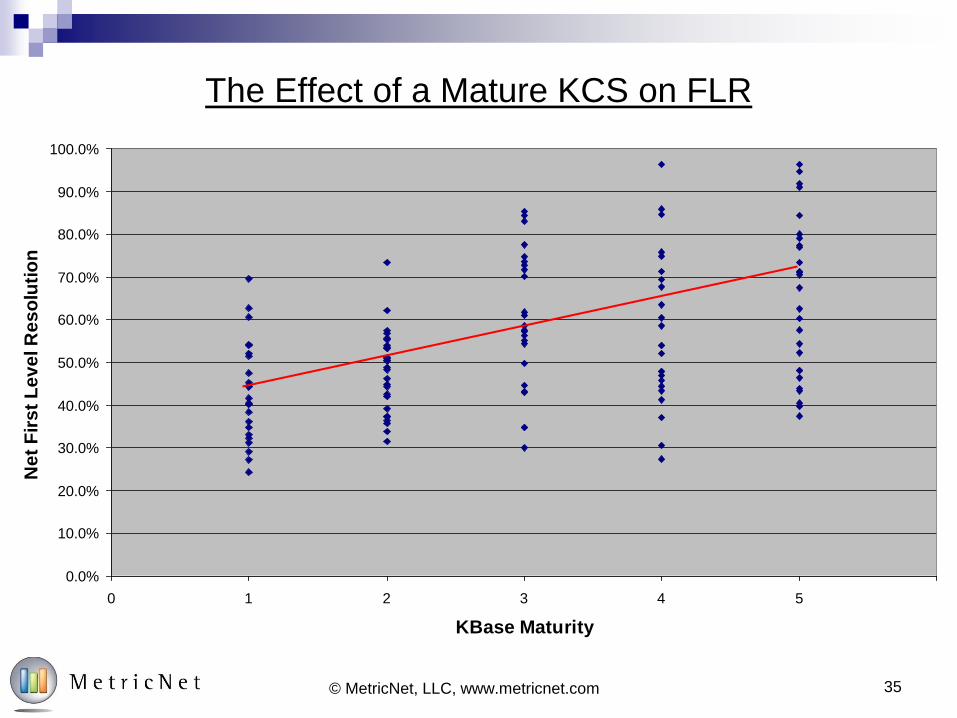
The Effect of a Mature KCS on FLR
© MetricNet, LLC, www.metricnet.com
0.0%
10.0%
20.0%
30.0%
40.0%
50.0%
60.0%
70.0%
80.0%
90.0%
100.0%
0 1 2 3 4 5 6
KBase Maturity
Ne
t F
irs
t L
ev
el R
es
olu
tio
n
35
Mega Trends in Desktop Support
36© MetricNet, LLC, www.metricnet.com
1. Shrinking Headcount and Increasing Cost per Ticket
2. Diagnostic Use of KPI’s
3. Shift Left Strategies
4. Desktop Virtualization
5. Standardization of the Desktop Environment
6. Adoption of Remote Diagnostic Tools
7. Maturing KCS – Knowledge Centered Support
8. Growing Number of Hybrid Support Organizations
9. Understanding of Desktop Support ROI
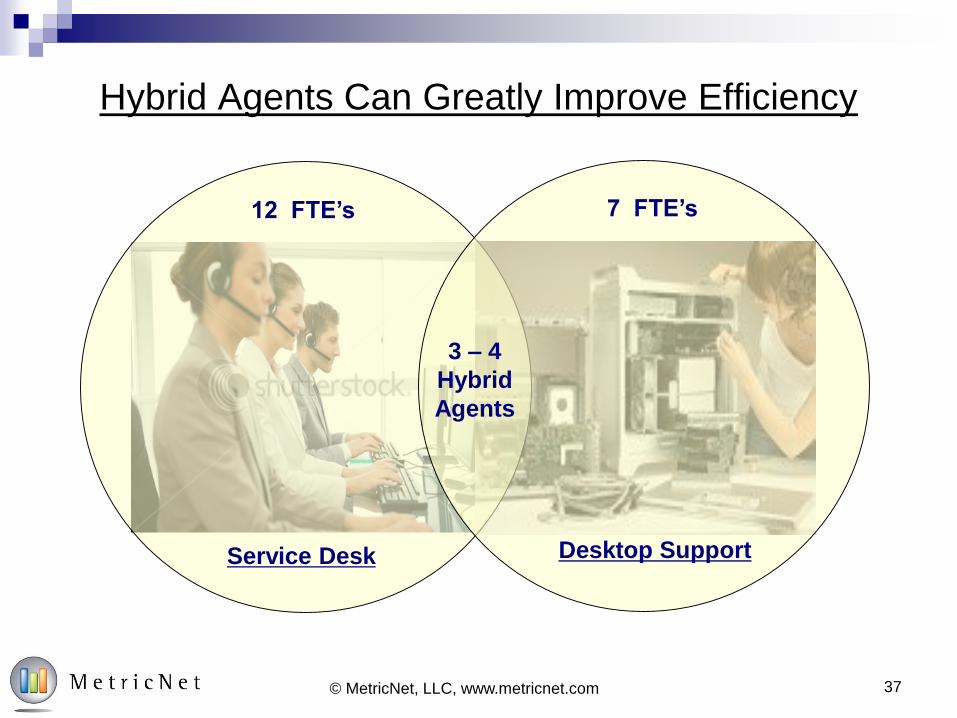
Hybrid Agents Can Greatly Improve Efficiency
37© MetricNet, LLC, www.metricnet.com
12 FTE’s 7 FTE’s
3 – 4
Hybrid
Agents
Service Desk Desktop Support
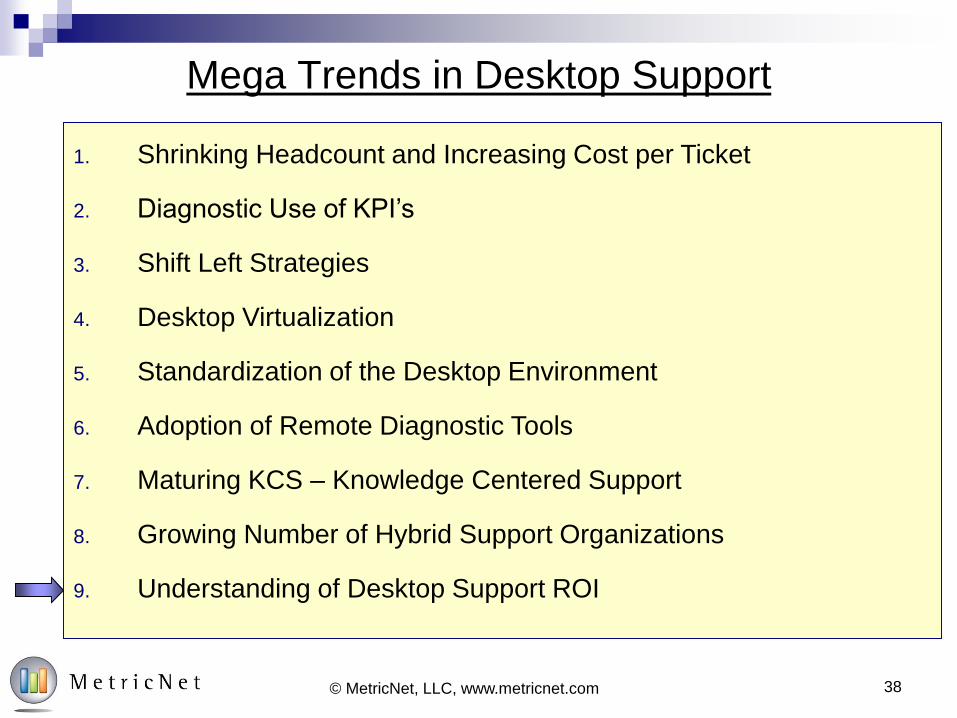
Mega Trends in Desktop Support
38© MetricNet, LLC, www.metricnet.com
1. Shrinking Headcount and Increasing Cost per Ticket
2. Diagnostic Use of KPI’s
3. Shift Left Strategies
4. Desktop Virtualization
5. Standardization of the Desktop Environment
6. Adoption of Remote Diagnostic Tools
7. Maturing KCS – Knowledge Centered Support
8. Growing Number of Hybrid Support Organizations
9. Understanding of Desktop Support ROI
39
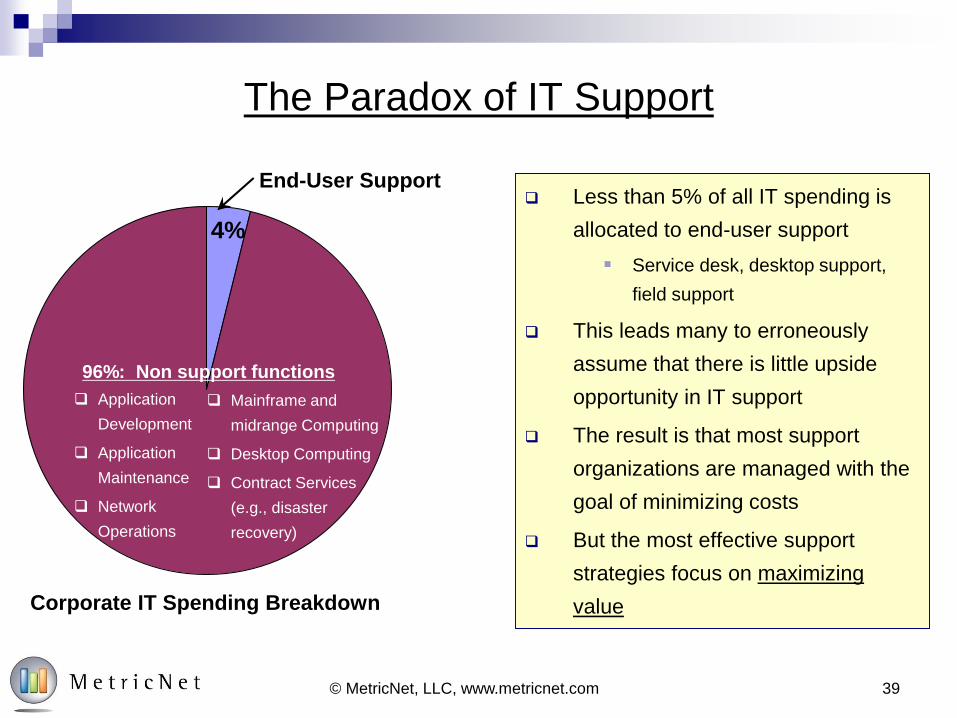
The Paradox of IT Support
Less than 5% of all IT spending is
allocated to end-user support
Service desk, desktop support,
field support
This leads many to erroneously
assume that there is little upside
opportunity in IT support
The result is that most support
organizations are managed with the
goal of minimizing costs
But the most effective support
strategies focus on maximizing
value
© MetricNet, LLC, www.metricnet.com
Corporate IT Spending Breakdown
4%
96%: Non support functions
End-User Support
Application
Development
Application
Maintenance
Network
Operations
Mainframe and
midrange Computing
Desktop Computing
Contract Services
(e.g., disaster
recovery)
40© MetricNet, LLC, www.metricnet.com
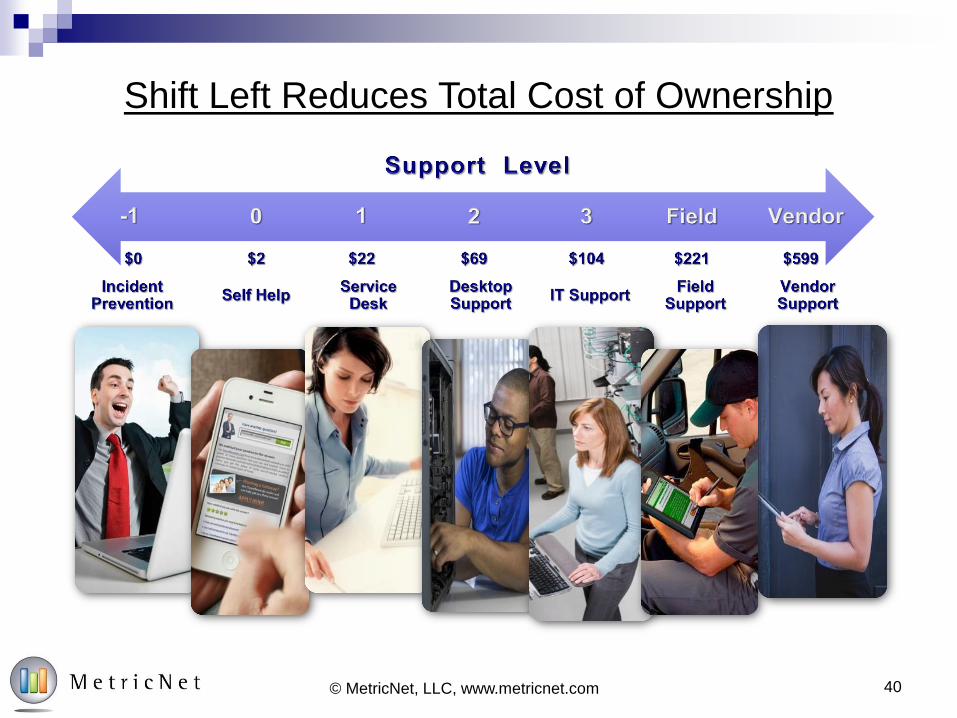
Shift Left Reduces Total Cost of Ownership
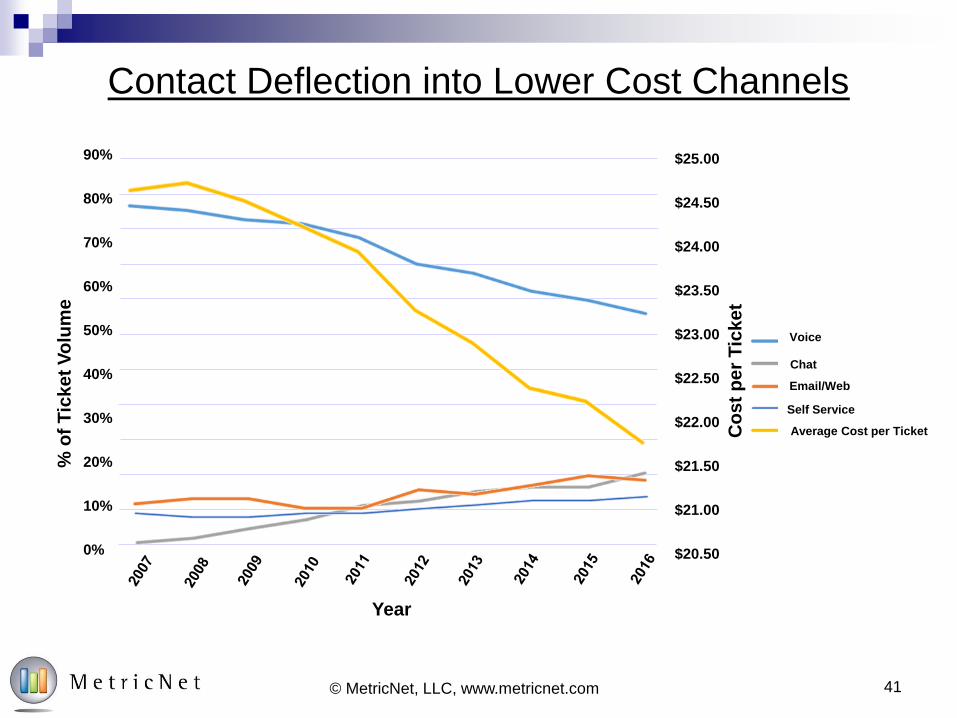
41© MetricNet, LLC, www.metricnet.com
90%
80%
70%
60%
50%
40%
30%
20%
10%
0%
Year
% o
f T
ick
et
Vo
lum
e
$25.00
$24.50
$24.00
$23.50
$23.00
$22.50
$22.00
$21.50
$21.00
$20.50
Co
st
pe
r T
ick
et
Self Service
Contact Deflection into Lower Cost Channels
Average Cost per Ticket
Email/Web
Chat
Voice
42
0
10
20
30
40
50
60
70
0 1 2 3 4 5
Pro
du
cti
ve H
ou
rs L
ost
per
Em
plo
yee p
er
Year
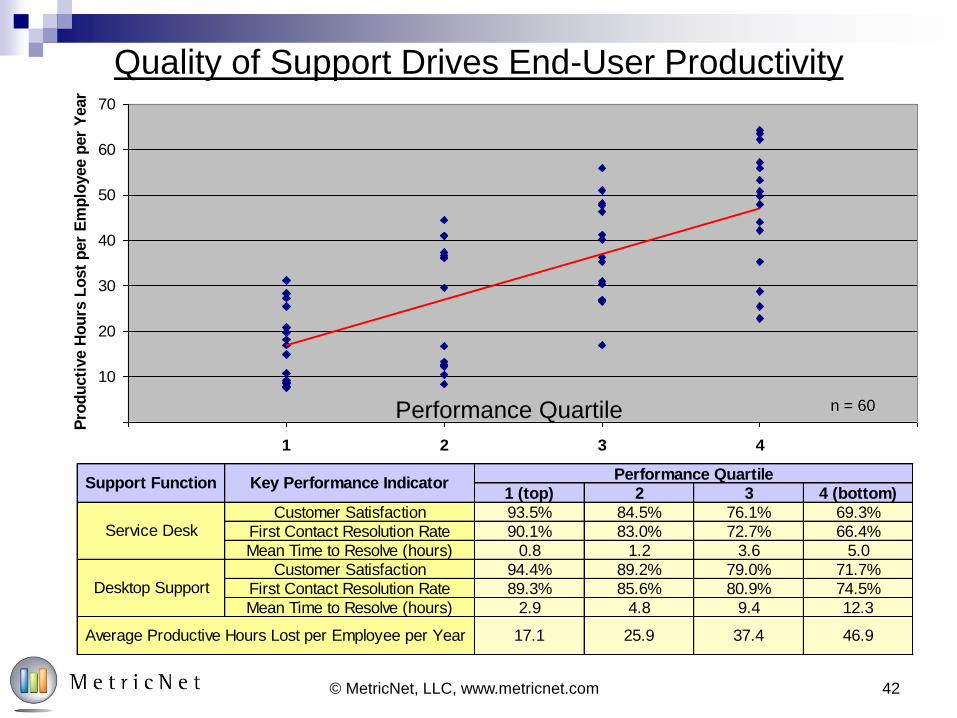
Quality of Support Drives End-User Productivity
1 (top) 2 3 4 (bottom)
Customer Satisfaction 93.5% 84.5% 76.1% 69.3%
First Contact Resolution Rate 90.1% 83.0% 72.7% 66.4%
Mean Time to Resolve (hours) 0.8 1.2 3.6 5.0
Customer Satisfaction 94.4% 89.2% 79.0% 71.7%
First Contact Resolution Rate 89.3% 85.6% 80.9% 74.5%
Mean Time to Resolve (hours) 2.9 4.8 9.4 12.3
Service Desk
Desktop Support
Performance QuartileSupport Function Key Performance Indicator
37.4 46.9Average Productive Hours Lost per Employee per Year 17.1 25.9
Performance Quartile n = 60
© MetricNet, LLC, www.metricnet.com
43© MetricNet, LLC, www.metricnet.com
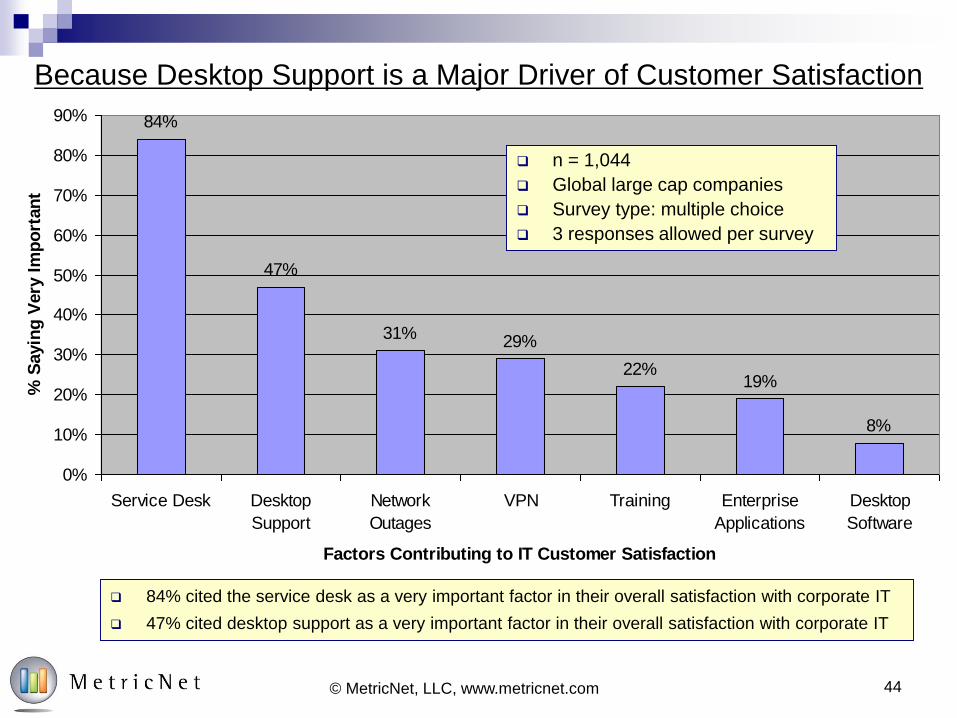
84%
47%
31%29%
22%19%
8%
0%
10%
20%
30%
40%
50%
60%
70%
80%
90%
Service Desk Desktop
Support
Network
Outages
VPN Training Enterprise
Applications
Desktop
Software
Factors Contributing to IT Customer Satisfaction
% S
ayin
g V
ery
Im
po
rtan
t
n = 1,044
Global large cap companies
Survey type: multiple choice
3 responses allowed per survey
84% cited the service desk as a very important factor in their overall satisfaction with corporate IT
47% cited desktop support as a very important factor in their overall satisfaction with corporate IT
44© MetricNet, LLC, www.metricnet.com
Because Desktop Support is a Major Driver of Customer Satisfaction
What About the Future?
45© MetricNet, LLC, www.metricnet.com
1. Shrinking Headcount and Increasing Cost per Ticket
2. Diagnostic Use of KPI’s
3. Shift Left Strategies
4. Desktop Virtualization
5. Standardization of the Desktop Environment
6. Adoption of Remote Diagnostic Tools
7. Maturing KCS – Knowledge Centered Support
8. Growing Number of Hybrid Support Organizations
9. Understanding of Desktop Support ROI
Desktop Support Quiz
46© MetricNet, LLC, www.metricnet.com
1. Is headcount in desktop support increasing or decreasing? Why?
2. Is Cost per Ticket in desktop support increasing or decreasing? Why?
3. What are the two most important KPIs in Desktop Support?
4. How many tickets does the average desktop tech resolve in a month?
5. How many tickets does the average level 1 tech resolve in a month?

Questions?
48© MetricNet, LLC, www.metricnet.com 48
Download Today’s Presentation
http://www.metricnet.com/hdiregina/
Turbocharge Your Metrics with Benchmarking
Session 202
Wednesday, May 10 at 11:30 AM_
_______________________________________________________________________________________________________________
Any Time, Any Place:
The Ultimate Customer Experience!
Session 308
Wednesday, May 10 at 3:00 PM
50© MetricNet, LLC, www.metricnet.com
Upcoming Webcasts
Sign Up Here
https://www.metricnet.com/webcasts/

Questions?

Thank You!

About MetricNet
Your Benchmarking Partner
53

Your Speaker: Jeff Rumburg
© MetricNet, LLC, www.metricnet.com
Co Founder and Managing Partner,
MetricNet, LLC
Winner of the 2014 Ron Muns
Lifetime Achievement Award
Former CEO, The Verity Group
Former Vice President, Gartner
Founder of the Service Desk
Benchmarking Consortium
Author of A Hands-On Guide to
Competitive Benchmarking
Harvard MBA, Stanford MS
54
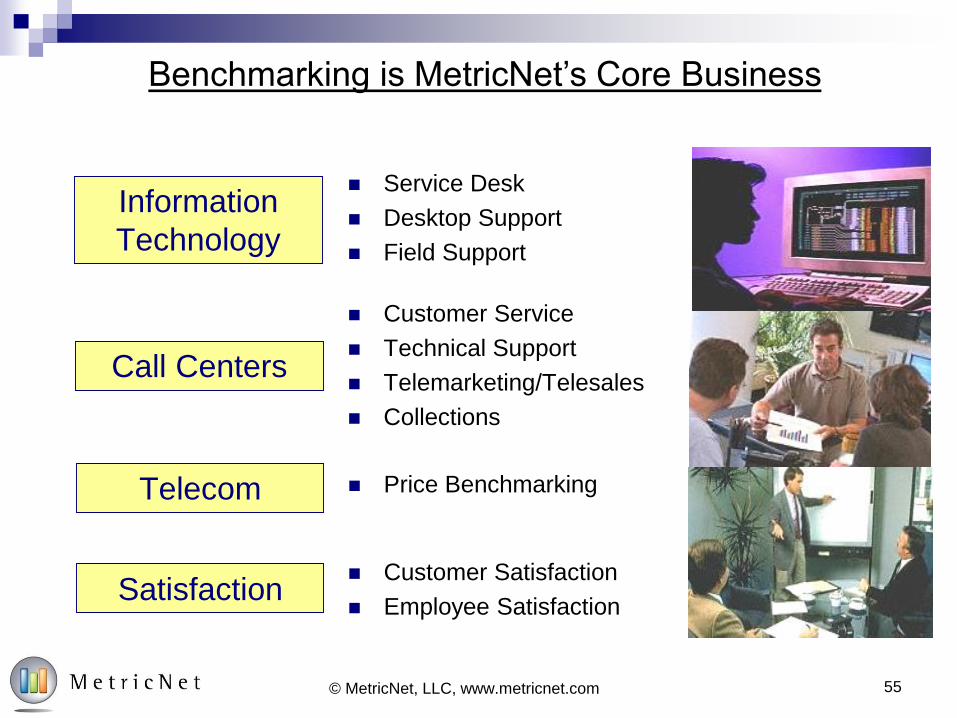
Benchmarking is MetricNet’s Core Business
Call Centers
Telecom
Information
Technology
Satisfaction
Customer Service
Technical Support
Telemarketing/Telesales
Collections
Service Desk
Desktop Support
Field Support
Price Benchmarking
Customer Satisfaction
Employee Satisfaction
55© MetricNet, LLC, www.metricnet.com

56© MetricNet, LLC, www.metricnet.com
28 Years of Service and Support Benchmarking Data
More than 3,700 Service and
Support Benchmarks
Global Database
70+ Key Performance Indicators
Nearly 120 Industry Best Practices
Meet a Sampling of Our Clients
MetricNet Conducts benchmarking for IT Service and Support
organizations worldwide, and across virtually every industry sector.
57© MetricNet, LLC, www.metricnet.com

Thank You!