The Future of Coal-Based Power Generation The Future of Coal-Based Power Generation (UN Sustainable...
14
1 The Future of Coal-Based Power Generation (UN Sustainable Development and CCS Meeting) (September 10-11, 2007) James R. Katzer* MIT Energy Initiative Introduction This paper is built fromthe MIT“The Future of Coal” report which can be viewed and downloaded from the MIT website [1]. As we think about the future of coal, we need to embrace the concept that “Times are Changing” and accept the statement attributed to Yogi Berra that “The Future Ain’t What It Used To Be”. Reflect on that for a minute . This paper focuses on the technologies for generating electricity from coal; including their cost and performance without CO 2 capture and with CO 2 capture. Because of coal’s image of being “Dirty” the paper also addresses criteria emissions performance. It then addresses the transport and sequestration of captured CO 2 . When we put all this information together, what does it mean to the future use of coal? And what are some considerations of the Path Forward. The bottom line is “C oal will, by necessity, remain a major component in our electricity generating portfolio for the foreseeable future. First, we need to define the design bases used for each generating technology in the study. Each unit was a Greenfield unit with 500 MW e net generating capacity Each technology was designed to control emissions to belowtoday’ s best demonstrated performance Costs were based on 2000 to 2004 detailed cost designs; indexed to the 2007 construction costs environment. Construction costs represent an update from the values in the published report. ______ * Contact at [email protected]
Transcript of The Future of Coal-Based Power Generation The Future of Coal-Based Power Generation (UN Sustainable...

1
The Future of Coal-Based Power Generation
(UN Sustainable Development and CCS Meeting)(September 10-11, 2007)
James R. Katzer*
MIT Energy Initiative
Introduction
This paper is built from the MIT “The Future of Coal” report which can be viewed and
downloaded from the MIT website [1]. As we think about the future of coal, we need to
embrace the concept that “Times are Changing” and accept the statement attributed to
Yogi Berra that “The Future Ain’t What It Used To Be”. Reflect on that for a minute.
This paper focuses on the technologies for generating electricity from coal; including
their cost and performance without CO2 capture and with CO2 capture. Because of coal’s
image of being “Dirty” the paperalso addresses criteria emissions performance. It then
addresses the transport and sequestration of captured CO2. When we put all this
information together, what does it mean to the future use of coal? And what are some
considerations of the Path Forward. The bottom line is“Coal will, by necessity, remain a
major component in our electricity generating portfolio for the foreseeable future.
First, we need to define the design bases used for each generating technology in the
study.
Each unit was a Greenfield unit with 500 MWe net generating capacity
Each technology was designed to control emissions to below today’s best
demonstrated performance
Costs were based on 2000 to 2004 detailed cost designs; indexed to the 2007
construction costs environment. Construction costs represent an update from the
values in the published report.
______
* Contact at [email protected]

2
We integrated existing commercially demonstrated technologies, and cost
estimates are for the Nth plant for those technologies that are still evolving.
We chose a single set of conditions (Illinois #6 high-sulfur coal, 85 % capacity
factor, etc.) for each technology and used EPRI recommended approach to
calculate levelized electricity cost (COE). This provides an indicative cost
comparison from technology to technology. It is critical to note that coal, site,
location, dispatch strategy, and a myriad of design and operating decisions will
affect cost.
The important issue here is comparison among technologies without CO2 capture and
with CO2 capture.
Pulverized Coal (PC) Power Generation.
Without CO2 Capture: To cover the total topic we move through the generation
technologies at a fairly high level. The details are in the report. Schematically, an
advanced PC plant can be viewed as shown in Figure 1. The design of the steam cycle
block largely determines the generating efficiency of the unit. For PC units, typical
The U. S. has built largely subcritical units in the past. A limited number of
supercritical units have been built and interest is increasing in supercritical
technology in the U. S. Europe and Japan have built about a dozen ultra-
supercritical units during the last decade. Moving from subcritical to ultra-
supercritical generation reduces coal consumption by over 20 % per unite electricity
generated. Obviously, the higher the efficiency the lower the CO2 emissions per unit
electricity generated.
At a bare minimum we need to move to the highest efficiency generation that is
Figure 1. Advanced Pulverized Coal Plant (Courtesy ASME)
3
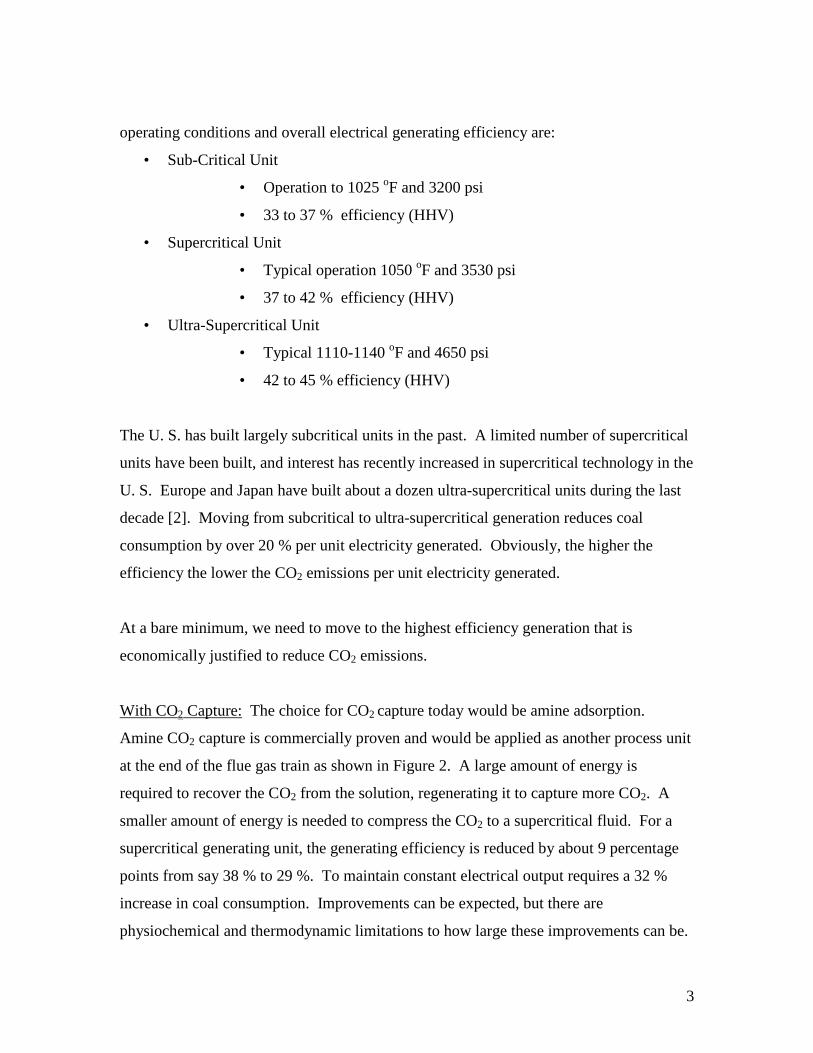
operating conditions and overall electrical generating efficiency are:
• Sub-Critical Unit
• Operation to 1025 oF and 3200 psi
• 33 to 37 % efficiency (HHV)
• Supercritical Unit
• Typical operation 1050 oF and 3530 psi
• 37 to 42 % efficiency (HHV)
• Ultra-Supercritical Unit
• Typical 1110-1140 oF and 4650 psi
• 42 to 45 % efficiency (HHV)
The U. S. has built largely subcritical units in the past. A limited number of supercritical
units have been built, and interest has recently increased in supercritical technology in the
U. S. Europe and Japan have built about a dozen ultra-supercritical units during the last
decade [2]. Moving from subcritical to ultra-supercritical generation reduces coal
consumption by over 20 % per unit electricity generated. Obviously, the higher the
efficiency the lower the CO2 emissions per unit electricity generated.
At a bare minimum, we need to move to the highest efficiency generation that is
economically justified to reduce CO2 emissions.
With CO2 Capture: The choice for CO2 capture today would be amine adsorption.
Amine CO2 capture is commercially proven and would be applied as another process unit
at the end of the flue gas train as shown in Figure 2. A large amount of energy is
required to recover the CO2 from the solution, regenerating it to capture more CO2. A
smaller amount of energy is needed to compress the CO2 to a supercritical fluid. For a
supercritical generating unit, the generating efficiency is reduced by about 9 percentage
points from say 38 % to 29 %. To maintain constant electrical output requires a 32 %
increase in coal consumption. Improvements can be expected, but there are
physiochemical and thermodynamic limitations to how large these improvements can be.

4
Boiler/Superheater
Steam Conditions163 atm/538°C
(2400psi/1000°F)Coal Feed284,000 kg/hr
Feed Air3,350,000 kg/hr
Electric Power500 MWe Net
SteamTurbine/
Generator
Steam
CO2 Capture90% Removal
Carbon Dioxide573,000 kg/hr150 atm
CompressionSystem
Low-Pressure Steam
Stack Gas3,210,000 kg/hr63°C, 1 atm
Ash & Wet Solids
Lime Slurry
Flue Gas Clean-up
Removal:Particulates 99.9 %
NOx ~ 90 %SO2 99+ %
Figure 2. Subcritical 500 MWe Pulverized Coal Unit with CO2 Capture
The main problem is the low CO2 concentration in the flue gas due to nitrogen dilution
from air combustion. This can be solved at a cost by substituting oxygen for air. For PC
combustion this is oxy-fuel PC combustion. Another approach is to gasify the coal with
oxygen and steam, and remove the CO2 at high pressure. This is IGCC.
Oxy-Fuel PC Combustion
Oxy-fuel combustion, addresses the issue of high capture and recovery costs but does so
at the expense of an air-separation unit and its associated energy costs [3, 4]. The
advantage is gained through being able to directly compress the flue gas stream, with
drying, to produce a supercritical CO2 stream for sequestration. The technology is in
active pilot plant development and the early stages of commercial development. At least
two 10 to 25 MWe commercial demonstrations are moving forward. Because of the early
state of commercial development, the performance and cost estimates are not as firm as
those for PC or IGCC. Oxy-fuel PC has the potential for lower COE and lower CO2
avoided cost than with PC capture. It is a technology to watch for further developments.

5
IGCC
Without CO2 Capture: The other option is integrated gasification combined cycle
(IGCC) generation (see Figure 3). Typically, oxygen is used to combust sufficient
carbon in the gasifier at 500 to 1000 psig to increase the temperature to around 1500 oF.
At this temperature water (steam) reacts with the remaining carbon to convert it to a
mixture of carbon monoxide and hydrogen with a range of minor impurities. The gases
are cleaned and are then burned in a turbine in a combined cycle power block that is very
much like a natural gas combined cycle unit. Because all the gases are contained at high
pressure, high levels of, particulate, sulfur and mercury removal are possible. Emissions
levels from an IGCC unit should be similar to those from a NGCC unit.
The gasifier is the biggest variable in the system in terms of type (water-slurry feed, dry
feed, operating pressure, etc) and the amount of heat removed from it. For electricity
generation without CO2 capture, radiant and convective cooling sections that produce
high-pressure steam for power generation lead to efficiencies that can approach or
somewhat exceed 40 %.
Radiant Cooling/Quench Gasifier
41.8 atm/1343°C(615 psi/2450°F)
Sulfur Removal99.4 % Removal
CombustionTurbine/
Generator
Coal Feed(Slurry or Dry)185,000 kg/hr
Bottom Slag21,500 kg/hr
Feed Air651,000 kg/hr Air Separation
Unit
Oxygen (95%)160,000 kg/hr
Nitrogen490,000 kg/hr
Combustion Air2,229,000 kg/hr
Electric Power
Electric Power500 MWe Net
Stack Gas2,770,000 kg/hr121°C, 1 atm
Heat Recovery SteamGenerator/Turbine/
Generator
Figure 3. 500 MWe IGCC Unit Without CO2 Capture
With CO2 Capture: To achieve CO2 capture with IGCC, two shift reactors are added that
react carbon monoxide with steam to produce hydrogen and CO2. (see Figure 4) The gas

6
clean-up process is effectively doubled in size to first remove sulfur and then CO2. The
CO2 capture and recovery is done at high concentration and pressure and, as such, is
cheaper than for CO2-capture from flue gas capture. All the technologies here are
commercial. However, they have yet to be integrated together and demonstrated at the
scale of operation here.
Quench Gasifier
41.8 atm/1343°C(615 psi/2450°F)
CoolingKnockout and
Water-GasShift
Coal Feed(Slurry or Dry)228,000 kg/hr
Bottom Slag29,900 kg/hr
Feed Air801,000 kg/hr Air Separation
Unit
Oxygen (95%)197,000 kg/hr
Nitrogen604,000 kg/hr
Combustion Air2,890,000 kg/hr
Electric Power500 MWe Net
Stack Gas3,140,000 kg/hr121°C, 1 atm
CombustionTurbine/Heat
Recovery SteamGenerator/Turbine/
Generators
SulfurRemoval99.9+ %Removal
CO2 Capture/Compression90 % Removal
Carbon Dioxide456,000 kg/hr, 150 atm
Figure 4. 500 MWe IGCC With CO2 Capture
Next, we will look at the component costs and the cost of electricity (COE) (see Table 1).
Table 1. Performance and Costs of Generating Technologies
Oxy-Fuel PCw/o capture w/ capture w/o capture w/ capture w/capture w/o capture w/capture
PERFORMANCEHeat Rate, Btu/kWe-h 9,950 13,600 8,870 11,700 11,200 8,890 10,900Efficiency (HHV) 34.3% 25.1% 38.5% 29.3% 30.6% 38.4% 31.2%CO2 emitted, g/kWe-h 931 127 830 109 104 824 101
COSTSTotal Plant Cost, $/kWe $1,580 $2,760 $1,650 $2,650 $2,350 $1,770 $2,340
Cost of ElectricityInv. Charge, ¢/kWe-h @15.1%
3.20 5.60 3.35 5.37 4.77 3.59 4.75
Fuel, ¢/kWe-h @$1.50/MMBtu
1.49 2.04 1.33 1.75 1.67 1.33 1.64
O&M, ¢/kWe-h 0.75 1.60 0.75 1.60 1.45 0.90 1.05
COE, ¢/kWe-h 5.45 9.24 5.43 8.72 7.89 5.82 7.44
Cost of CO2 avoided vs.same technology w/ocapture, $/tonne
47.1 45.7 34.0 22.3
IGCCSubcritical PC Supercritical PC
Basis: 500 MWe plant. Illinois # 6 coal, 85% capacity factor, COE at bus bar. Based ondesign studies between 2000 and 2004, a period of cost stability, indexed to 2007 $ usingconstruction cost index

7
Note again that these are indicative costs to allow comparison from technology to
technology indexed to 2007 construction costs. Without CO2 capture, PC has the lowest
COE; the COE for IGCC is about 8% higher. However, when we look at the COE with
CO2 capture, IGCC has the lowest COE. The cost of capture and compression for
supercritical PC is about 3.3 ¢/kWe-h; that for IGCC is about one half that or about 1.6
¢/kWe-h. The cost of CO2 avoided for PC is about $46/tonne of CO2; that for IGCC is
about $22/tonne. Oxy-fuel is between these at $34/tonne. These numbers include the
cost of capture and compression to a supercritical fluid, but do not include the cost of
CO2 transport and injection. We will look at these latter cost numbers below. This lower
COE would appear to make IGCC the technology of choice for CO2 management in
power generation. However as noted above, Oxy-fuel has significant development
potential. Further, if we move to a lower rank coal and move up in elevation, the cost
difference between IGCC and PC narrows. As such, potentially significant reductions in
the capture/recovery cost for PC could make it economically competitive with IGCC with
capture in certain applications. IGCC still has concerns about operability and availability
associated with it in the power industry. Thus, we cannot close the door on any of these
technologies at this point.
“Dirty Coal”
Coal has the reputation of being dirty, largely based in emissions issues. Table 2 gives
the commercially demonstrated and projected emissions performance of PC and IGCC [2,
5]. ESP or bag houses are employed on all PC units, and PM emissions are typically very
low. Improved ESP or wet ESP can reduce this further, but at a cost. FGD is applied on
only about 1/3 of U.S. capacity and thus typical emissions are quite high. The best
commercial performance gives the levels of emissions reductions that have been
demonstrated in full-scale commercially operating units. Further reductions are possible.
In fact with CO2 capture, emissions levels are expected to be even further reduced [6].
The best commercial performance levels with IGCC are 3- to 10- fold lower.
IGCC with CO2 capture should have even lower emissions. Although this does not
address the whole life-cycle for coal, coal use in the electricity generation step can in fact
be very clean.

8
Table 2. Commercially Demonstrated and Projected Emissions Performanceof PC and IGCC Power Generation
Technology Case Particulates SO2 NOx Mercurylb/MM Btu lb/MM Btu lb/MM Btu % removed
PC PlantTypical U.S. 0.02 0.25 0.12
0.015 (99.5%) 0.04 (99+%) 0.03 90
Design w CO2 Cap. 0.01 (99.5+%) 0.0006 (99.99%) 0.03 75-85
IGCC Plant0.001 0.015 (99.8%) 0.01 95
0.001 0.005 (99.9%) 0.01 >95
Best Commercial
Best Commercial
Design w CO2 Cap.
The estimated cost to accomplish emissions reductions somewhat below the best
demonstrated commercial performance today is shown here and is about 1 ¢/kWe-h out of
about 5.5 ¢/kWe-h or about 20 %. CO2 capture and recovery will cost somewhat more
than this, based on our understanding of today’s technology.Cost reductions can be
expected when this technically begins to be commercially practiced.
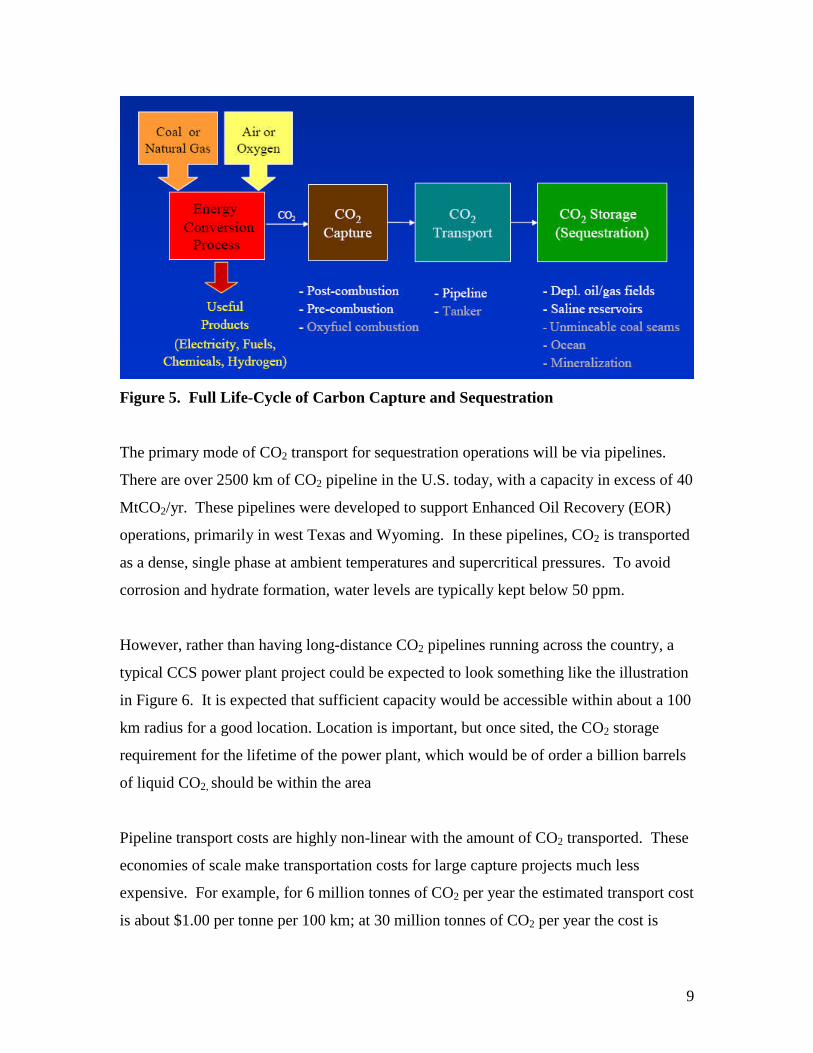
CCS Life Cycle
The entire life cycle of Carbon Capture and Sequestration (CCS) shown in Figure 5. We
will now focus on the last two boxes in the figure: pipeline transport and injection. Here
again we will look at the impact on the COE. Before we can do that however we need to
have a model of what a typical CCS project would look like. Although oil and gas
reservoirs and enhanced oil recovery are often talked about, these storage sites of
opportunity have limited long-term potential on the scale of CO2 CCS that will be needed
to make a major difference. Larger volume, long-term storage will probably be in deep
saline aquifers. These underlie large portions of the U. S., particularly those areas that
today have a lot of coal-based power generation and where additional capacity is
expected to be added.
9
Figure 5. Full Life-Cycle of Carbon Capture and Sequestration
The primary mode of CO2 transport for sequestration operations will be via pipelines.
There are over 2500 km of CO2 pipeline in the U.S. today, with a capacity in excess of 40
MtCO2/yr. These pipelines were developed to support Enhanced Oil Recovery (EOR)
operations, primarily in west Texas and Wyoming. In these pipelines, CO2 is transported
as a dense, single phase at ambient temperatures and supercritical pressures. To avoid
corrosion and hydrate formation, water levels are typically kept below 50 ppm.
However, rather than having long-distance CO2 pipelines running across the country, a
typical CCS power plant project could be expected to look something like the illustration
in Figure 6. It is expected that sufficient capacity would be accessible within about a 100
km radius for a good location. Location is important, but once sited, the CO2 storage
requirement for the lifetime of the power plant, which would be of order a billion barrels
of liquid CO2, should be within the area
Pipeline transport costs are highly non-linear with the amount of CO2 transported. These
economies of scale make transportation costs for large capture projects much less
expensive. For example, for 6 million tonnes of CO2 per year the estimated transport cost
is about $1.00 per tonne per 100 km; at 30 million tonnes of CO2 per year the cost is

10
about $0.25 per tonne per 100 km [7]. Although these are typical values, costs can be
highly
Figure 6. Conceptual Model of a Typical CCS Project
variable from project to project due to both physical (e.g., terrain pipeline must traverse)
and political considerations. For a 1 GWe coal-fired power plant, pipeline capacity of
about 6-7 million tonnes of CO2/yr would be needed. This would result in a transport
cost of about $1.00 per tonne of CO2 per 100 km.
The major cost for injection and storage is associated with drilling the wells. Other
significant costs include site selection and characterization, as well as flowlines and
connectors required for injection. In general, no additional pressurization of the CO2 is
required for injection because of the high pressure in the pipeline and the pressure gain

11
due to the gravity head of the CO2 in the wellbore. Monitoring costs are expected to be
small, of order $0.1 to $0.3 per tonne of CO2 [7].
Costs for injecting the CO2 into geologic formations will vary on the formation type and
its properties. For example, costs increase as reservoir depth increases and as reservoir
injectivity decreases. Lower injectivity requires drilling of more wells for a given rate of
CO2 injection. A range of typical injection costs has been reported as $0.5 to $8 per
tonne of CO2 [7]. Combining storage with Enhanced Oil Recovery (EOR) can help offset
some of the capture and storage costs. EOR credits of up to $20 per tonne of CO2 may be
obtained.
These projected costs, on a levelized basis per kWe-h, are shown in Table 3.
The costs for transport and injection are significant but both are small and do not
represent a potential economic show-stopper. Comprehensive geological reviews suggest
that there appear to be no technical show-stoppers for CO2 injection and storage either.
However, there are technical issues that require resolution. Transport and injection costs
include the cost of constructing the pipelines needed and of drilling the needed injection
wells, as well as the operating costs. The numbers used here are on the high end of the
current ranges cited above. The largest cost is in capture and compression. For IGCC the
projected cost of CCS would increase the bus bar cost of electricity by about 50 %, from
5.8 to about 8.2 ¢/kWe-h. This electricity would be very low emissions electricity,
including low CO2 emissions. Furthermore, it is economically competitive with
electricity from wind power and nuclear power.

12
Table 3. Costs of CCS Projected for PC and IGCC Generation with Capture
Technology PC IGCCCCS Step ¢/kWe-h ¢/kWe-h
Capture 2.7 1.21
Compression 0.6 0.4
Transport 0.19 0.18
Injection 0.68 0.64
Totals 4 2.4
Were does all this lead us. There are three key points to stress:
1. First, about 50% of our coal reserves are bituminous coal and 50% are
subbituminous coal and lignite. When we move to these lower rank coals and
move to higher elevations, the gap between IGCC with capture and PC with
capture narrows. Cost improvements for PC capture could make it economically
competitive with IGCC in certain applications. At the same time, Oxy-fuel PC
looks potentially competitive also. Thus, It is too early to pick winners for coal-
based power generation with CO2 capture.
2. Second, emissions from coal-based power generation can be very low; and with
CO2 capture, emissions can be even lower; to the extent of being very clean and
with very low CO2 emissions as well.
3. Third, with CO2 capture and sequestration, coal can provide electricity that is cost
competitive with wind and nuclear.
Thus, coal would appear to continue to be an economic choice for base-load generation
of very low emissions electricity , including low CO2 emissions.
Finally, what are the issues with respect to the path forward?
The technoloies for CO2 capture with generation are all commercial. Although
they have typically not been applied at the scale of interest here, they can be
expected to improve in cost and performance from operation at scale. We do not
need major R&D breakthroughs to begin applying them.

13
Current information indicates that it is technically feasible to safely and
effectively store large quantities of CO2 in saline aquifers, and the storage
capacity appears very large. Some technical issues need resolution.
A broad range of regulatory issues require resolution. These include: permitting
guidelines and procedures, liability and ownership, monitoring and certification,
site closure, remediation, etc.
For CCS to be available to apply on a large scale it is critical to gain political and
public confidence of the safety and efficacy of geologic sequestration.
To resolve the issues outlined above and quickly establish CCS as a viable technology for
managing CO2 emissions, it is necessary to establish 3 to 5 large-scale CCS
demonstration projects in the U.S. at 1 million tonnes CO2 per year, using different
generation technologies, focusing on different geologies, and operated for several years.
This if completed expeditiously, can provide the U. S. with technical options for
addressing CO2 emissions.
The central message of the MIT study is that demonstration of technical, economic, and
institutional features of carbon capture and sequestration at commercial scale coal
combustion and conversion plants, will: (1) give policymakers and the public confidence
that a practical carbon mitigation control option exists, (2) shorten the deployment time
and reduce the cost for carbon capture and sequestration should a carbon emission control
policy be adopted, and (3) maintain opportunities for the lowest cost and most widely
available energy form to be used tomeet the world’s pressing energy needs in an
environmentally acceptable manner.

14
Citations and Notes
1. MIT. The Future of Coal; Options in a Carbon-Constrained World. 2007March, 2007 [cited; Available from: http://web.mit.edu/coal/.
2. PowerClean, T.N., Fossil Fuel Power Generation State-of-the-Art, P.T.Network, Editor. 2004, University of Ulster: Coleraine, UK. p. 9-10.
3. Dillon, D.J., R. S. Panesar, R. A. Wall, R. J. Allam, V. White, J. Gibbins, andM. R. Haines, Oxy-combustion Processes for CO2 Capture from AdvancedSupercritical PF and NGCC Power Plant, in Greenhouse Gas TechnologiesConference 7. 2004: Vancouver, BC.
4. Jordal, K. and e. al, Oxyfuel Combustion of Coal-Fired Power Gernerationwith CO2 Capture -- Opportunities and Challenges. XDQ, 2004.
5. USEPA, Continuous Emissions Monitoring System (CEMS) Data Base of 2005Power Plant Emissions Data. 2005, EPA.
6. Holt, N., Preliminary Economics of SCPC & IGCC with CO2 Capture andStorage, in 2nd IGCC and Xtl Conference. 2007: Freiberg, Germany.
7. IPCC, ed. IPCC Special Report on Carbon Dioxide Capture and Storage. ed.B.e.a. Metz. 2005, Cambridge University: Cambridge.