Institutional Governance and Economic Growth, with special ...

The Future of Chinese Growth: Institutional Perspectives
Daron Acemoglu
MIT
December 19, 2013.
Acemoglu (MIT) Chinese Growth December 19, 2013. 1 / 39

Introduction
The Question
Why and how has China been so successful over the last 3 1/2decades and what does this imply for its future growth trajectory?
Still only partially understood how this has happened and what itimplies for economic growth in developing countries (and developedeconomies) more generally.
This talk: a political interpretation of the origins of Chinese growthand its future prospects based on Why Nations Fail (joint with JamesA. Robinson).
Acemoglu (MIT) Chinese Growth December 19, 2013. 2 / 39
Introduction
Interpretations of Chinese Growth
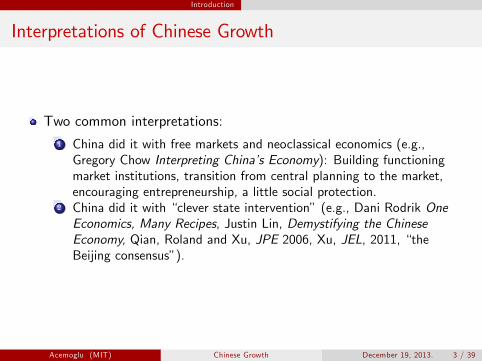
Two common interpretations:1 China did it with free markets and neoclassical economics (e.g.,Gregory Chow Interpreting China�s Economy): Building functioningmarket institutions, transition from central planning to the market,encouraging entrepreneurship, a little social protection.
2 China did it with �clever state intervention� (e.g., Dani Rodrik OneEconomics, Many Recipes, Justin Lin, Demystifying the ChineseEconomy, Qian, Roland and Xu, JPE 2006, Xu, JEL, 2011, �theBeijing consensus�).
Acemoglu (MIT) Chinese Growth December 19, 2013. 3 / 39

Introduction
But Perhaps More Thinking Necessary
Neither is entirely convincing (e.g., Barry Naughton, The ChineseEconomy, Richard McGregor, The Party: the Secret World of China�sCommunist Rulers, Fan, Morck and Yeung, 2011):
China looks nothing like a free market. Largest �rms and banks areunder government and party control, and political deals essential formarket access;Much of the state intervention appears self-interested and aimed atprotecting the Party�s or the rulers�interests.
Both interpretations entirely ignore politics:
Why were these choices made?What made them feasible?Will they be maintained?How will they be developed?
Acemoglu (MIT) Chinese Growth December 19, 2013. 4 / 39

An Institutional Framework
A Framework
We argue in Why Nations Fail that the institutional foundations arethe key to understand economic development and growth.
These institutional foundations are inherently political becausedi¤erent individuals and groups bene�t from di¤erent socialarrangements.
Sustained economic growth, which needs innovation and technologicalchange, is ultimately very di¢ cult under institutions that have beendesigned for the bene�t of the politically powerful� the elite.
Acemoglu (MIT) Chinese Growth December 19, 2013. 5 / 39

An Institutional Framework
Taxonomy of Institutions
Extractive economic institutions: Lack of law and order. Insecureproperty rights; entry barriers and regulations preventing functioningof markets and creating a nonlevel playing �eld.Extractive political institutions� in the limit �absolutism�:Political institutions concentrating power in the hands of a few,without constraints, checks and balances or �rule of law�.Inclusive economic institutions: Secure property rights, law andorder, markets and state support (public services and regulation) formarkets; open to relatively free entry of new businesses; upholdcontracts; access to education and opportunity for the great majorityof citizens.Inclusive political institutions: Political institutions allowing broadparticipation� pluralism� and placing constraints and checks onpoliticians; rule of law (closely related to pluralism).
But also some degree of political centralization for the states to be ableto e¤ectively enforce law and order.
Acemoglu (MIT) Chinese Growth December 19, 2013. 6 / 39
An Institutional Framework
Institutional Synergies
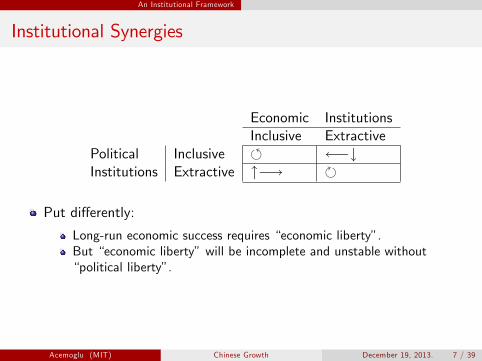
Economic InstitutionsInclusive Extractive
Political Inclusive �#Institutions Extractive "�! �
Put di¤erently:
Long-run economic success requires �economic liberty�.But �economic liberty�will be incomplete and unstable without�political liberty�.
Acemoglu (MIT) Chinese Growth December 19, 2013. 7 / 39
An Institutional Framework
Growth under Inclusive Institutions
Inclusive economic and political institutions (or inclusive institutionsfor short) create powerful forces towards economic growth by:
encouraging investment (because of well-enforced property rights)harnessing the power of markets (better allocation of resources, entryof more e¢ cient �rms, ability to �nance for starting businesses etc.)generating broad-based participation (education, again free entry, andbroad-based property rights).
Key aspect of growth under inclusive institutions: investment in newtechnology, innovation and creative destruction.The role of a level playing �eld: comparative advantage, skills andinnovation.
Acemoglu (MIT) Chinese Growth December 19, 2013. 8 / 39
An Institutional Framework
The Logic of Extractive Institutions
Main thesis is that growth is much more likely under inclusiveinstitutions than extractive institutions.
Growth, and inclusive institutions that will support it, will create bothwinners and losers. Thus there is a logic supporting extractiveinstitutions and stagnation:
economic losers: those who will lose their incomes, for example theirmonopolies, because of changes in institutions or introduction of newtechnologiespolitical losers: those who will lose their politically privileged position,their unconstrained monopoly of power, because of growth and itssupporting institutions� fear of creative destruction.both are important in practice, but particularly political losers are amajor barrier against the emergence of inclusive institutions andeconomic growth.
Acemoglu (MIT) Chinese Growth December 19, 2013. 9 / 39

An Institutional Framework Understanding Growth under Extractive Institutions
Growth under Extractive Institutions
Though sustained growth necessitates inclusive institutions, rapidgrowth is still possible under extractive institutions.
Why? ! Generate output and resources to extract.
Two types of growth under extractive (political) institutions:1 extractive economic institutions allocating resources to highproductivity activities controlled by the elites (e.g., the Caribbeanplantation economies).
2 when relatively secure in their position, the elites may wish to allow theemergence of relatively inclusive economic institutions under theircontrol.
Preconditions for extractive growth: Political centralization;Direct bene�ts; Only limited fear of creative destruction.
Acemoglu (MIT) Chinese Growth December 19, 2013. 10 / 39

An Institutional Framework Understanding Growth under Extractive Institutions
Why Growth under Extractive Institutions Limited?
No creative destruction and dynamics very di¤erent than inclusive growth.
In particular, potentially quite rapid growth at �rst but unlikely to translateinto sustained economic growth because
reallocation: the structural ine¢ ciencies of economies under extractiveinstitutions create room for improvements by reallocating resourcesaway from the more ine¢ cient parts of the economy or �rms. Butbene�ts from reallocation decline after a while.investment-based growth: Acemoglu, Aghion and Zilibotti, JEEA 2006:large �rms, monopolies and investment-based strategies are often notvery costly at early stages of development if they can mobilizeinvestment. But they become a real hindrance to growth wheninnovation and �creative destruction�are important.limits to inclusivity: mounting threat of creative destruction anddemands from new interests and groups empowered by economicgrowth likely to ultimately lead to reversals in the elites�willingness tosupport economic growth.freedom and creative innovations: Acemoglu, Akcigit and Celik, 2013.
Acemoglu (MIT) Chinese Growth December 19, 2013. 11 / 39

An Institutional Framework Understanding Growth under Extractive Institutions
Freedom and Creative Innovations
What matters for growth are �creative innovations�which introducetransformative technologies.
In terms of patents, these are the very highly cited patents or thosethat combine previously disparate ideas.
Acemoglu, Akcigit and Celik, 2013: Even more than total amount ofinnovation, creative innovations depend on economic, political andsocial freedom.
Inventor-level, �rm-level and country-level evidence consistent with this.
Acemoglu (MIT) Chinese Growth December 19, 2013. 12 / 39

An Institutional Framework Understanding Growth under Extractive Institutions
Freedom and Creative Innovations: Country-Level EvidenceFigure 1. Innovation Quality and Different Proxies for Openness to Disruption
AR
AT
AU
BE BG BR
CA
CH
CL
CN
CO
CZ
DE
DKES
FI
FR
GB
GR
HK
HR
HU
IDIEIL
INITJP
KR
LU
MT
MXMY
NL
NONZ
PL
PTRO
RU
SA
SE
SG
SI
SKTH
TR
US
VE
ZA
-50
510
1520
aver
age
num
ber
of c
itatio
ns
-.5 0 .5 1individualism
Individualism vs Innovation Quality
(a) Individualism vs Innovation Quality
AR
AT
AU
BEBGBR
CA
CH
CL
CN
CO
CZ
DE
DK ES
FI
FR
GB
GR
HK
HR
HU
IDIE IL
IN ITJP
KR
LU
MT
MXMY
NL
NONZ
PL
PTRO
RU
SA
SE
SG
SI
SKTH
TR
US
VE
ZA
-50
510
1520
aver
age
num
ber
of c
itatio
ns
-1 -.5 0 .5Uncertainty Avoidance
Uncertainty Avoidance vs Innovation Quality
(b) Uncertainty Avoidance vs Innovation Quality
AR
AT
AU
BEBR
CA
CH
CNCZ
DE
DK ES
FI
FR
GB
HK
HU
IE IL
IN ITJP
KR
LUMX MY
NL
NONZ
PL
RU
SA
SE
SG
US
VE
ZA
-50
510
1520
aver
age
num
ber
of c
itatio
ns
-10 -5 0 5average age
Manager Age vs Innovation Quality
(c) Average Manager Age vs Innovation Quality
AR
AT
AU
BEBGBR
CA
CH
CL
CN
CO
CU
CY
CZ
DE
DKES
FI
FR
GB
GR
HK
HRHU
IDIEIL
IN
IS
ITJPKR
LU
MT
MX MY
NL
NONZ
PL
PTRO
RU
SA
SE
SG
SI
SKTH
TR
UA
US
VE
ZA
-10
010
20av
erag
e nu
mbe
r of
cita
tions
-.6 -.4 -.2 0 .2rule of law
Rule of Law vs Innovation Quality
(d) Rule of Law vs Innovation QualityAcemoglu (MIT) Chinese Growth December 19, 2013. 13 / 39
An Institutional Framework Understanding Growth under Extractive Institutions
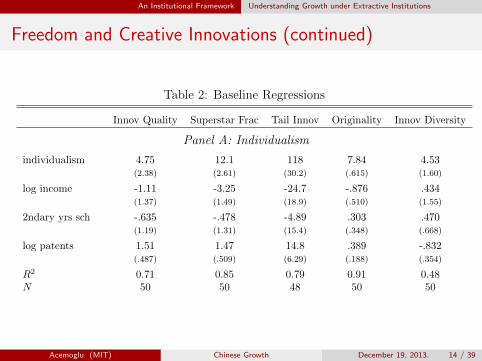
Freedom and Creative Innovations (continued)
Table 2: Baseline Regressions
Innov Quality Superstar Frac Tail Innov Originality Innov Diversity
Panel A: Individualism
individualism 4.75 12.1 118 7.84 4.53(2.38) (2.61) (30.2) (.615) (1.60)
log income -1.11 -3.25 -24.7 -.876 .434(1.37) (1.49) (18.9) (.510) (1.55)
2ndary yrs sch -.635 -.478 -4.89 .303 .470(1.19) (1.31) (15.4) (.348) (.668)
log patents 1.51 1.47 14.8 .389 -.832(.487) (.509) (6.29) (.188) (.354)
R2 0.71 0.85 0.79 0.91 0.48N 50 50 48 50 50
Panel B: Uncertainty Avoidance
uncertainty av -8.12 -15.8 -159 -8.80 -2.71(2.88) (3.06) (33.8) (1.32) (2.36)
log income -.264 -1.38 -6.12 .238 .928(1.13) (.604) (9.85) (1.04) (2.37)
2ndary yrs sch -.922 -.406 -4.91 .595 1.03(1.12) (1.26) (14.5) (.397) (.643)
log patents 1.57 1.60 16.2 .462 -.808(.431) (.476) (5.97) (.269) (.378)
R2 0.78 0.88 0.83 0.86 0.32N 50 50 48 50 50
Panel C: Average Manager Age
avg manager age -.463 -1.16 -11.2 -.687 -.343(.217) (.245) (2.69) (.081) (.172)
log income -.425 -1.55 -8.28 .203 1.11(1.31) (1.16) (15.8) (.610) (2.01)
2ndary yrs sch -1.16 -1.77 -16.9 -.303 .313(1.44) (1.66) (18.9) (.528) (.793)
log patents 2.08 2.91 28.7 1.23 -.409(.680) (.762) (9.13) (.300) (.363)
R2 0.71 0.86 0.79 0.88 0.43N 37 37 37 37 37
Panel D: Rule of Law
rule of law 15.3 30.8 307 15.5 3.92(7.60) (12.9) (130) (7.82) (7.62)
log income -2.75 -6.35 -55.7 -2.32 .210(1.46) (2.57) (25.9) (2.02) (2.58)
2ndary yrs sch -.567 .225 1.66 1.04 1.22(1.26) (1.85) (20.4) (.983) (.817)
log patents 1.95 2.37 23.8 .841 -.712(.693) (1.02) (11.4) (.525) (.394)
R2 0.68 0.70 0.66 0.69 0.28N 54 54 52 54 54
Notes: Cross-country regressions. Robust standard errors in parantheses. Observations are weighted by the number of
patent counts of the country. The dependent variables superstar fraction, tail innovation, and originality are multiplied by
100. Innovation diversity is multiplied by 10,000.
Acemoglu (MIT) Chinese Growth December 19, 2013. 14 / 39

An Institutional Framework Understanding Growth under Extractive Institutions
Freedom and Creative Innovations (continued)
Table 2: Baseline Regressions
Innov Quality Superstar Frac Tail Innov Originality Innov Diversity
Panel A: Individualism
individualism 4.75 12.1 118 7.84 4.53(2.38) (2.61) (30.2) (.615) (1.60)
log income -1.11 -3.25 -24.7 -.876 .434(1.37) (1.49) (18.9) (.510) (1.55)
2ndary yrs sch -.635 -.478 -4.89 .303 .470(1.19) (1.31) (15.4) (.348) (.668)
log patents 1.51 1.47 14.8 .389 -.832(.487) (.509) (6.29) (.188) (.354)
R2 0.71 0.85 0.79 0.91 0.48N 50 50 48 50 50
Panel B: Uncertainty Avoidance
uncertainty av -8.12 -15.8 -159 -8.80 -2.71(2.88) (3.06) (33.8) (1.32) (2.36)
log income -.264 -1.38 -6.12 .238 .928(1.13) (.604) (9.85) (1.04) (2.37)
2ndary yrs sch -.922 -.406 -4.91 .595 1.03(1.12) (1.26) (14.5) (.397) (.643)
log patents 1.57 1.60 16.2 .462 -.808(.431) (.476) (5.97) (.269) (.378)
R2 0.78 0.88 0.83 0.86 0.32N 50 50 48 50 50
Panel C: Average Manager Age
avg manager age -.463 -1.16 -11.2 -.687 -.343(.217) (.245) (2.69) (.081) (.172)
log income -.425 -1.55 -8.28 .203 1.11(1.31) (1.16) (15.8) (.610) (2.01)
2ndary yrs sch -1.16 -1.77 -16.9 -.303 .313(1.44) (1.66) (18.9) (.528) (.793)
log patents 2.08 2.91 28.7 1.23 -.409(.680) (.762) (9.13) (.300) (.363)
R2 0.71 0.86 0.79 0.88 0.43N 37 37 37 37 37
Panel D: Rule of Law
rule of law 15.3 30.8 307 15.5 3.92(7.60) (12.9) (130) (7.82) (7.62)
log income -2.75 -6.35 -55.7 -2.32 .210(1.46) (2.57) (25.9) (2.02) (2.58)
2ndary yrs sch -.567 .225 1.66 1.04 1.22(1.26) (1.85) (20.4) (.983) (.817)
log patents 1.95 2.37 23.8 .841 -.712(.693) (1.02) (11.4) (.525) (.394)
R2 0.68 0.70 0.66 0.69 0.28N 54 54 52 54 54
Notes: Cross-country regressions. Robust standard errors in parantheses. Observations are weighted by the number of
patent counts of the country. The dependent variables superstar fraction, tail innovation, and originality are multiplied by
100. Innovation diversity is multiplied by 10,000.
Table 2: Baseline Regressions
Innov Quality Superstar Frac Tail Innov Originality Innov Diversity
Panel A: Individualism
individualism 4.75 12.1 118 7.84 4.53(2.38) (2.61) (30.2) (.615) (1.60)
log income -1.11 -3.25 -24.7 -.876 .434(1.37) (1.49) (18.9) (.510) (1.55)
2ndary yrs sch -.635 -.478 -4.89 .303 .470(1.19) (1.31) (15.4) (.348) (.668)
log patents 1.51 1.47 14.8 .389 -.832(.487) (.509) (6.29) (.188) (.354)
R2 0.71 0.85 0.79 0.91 0.48N 50 50 48 50 50
Panel B: Uncertainty Avoidance
uncertainty av -8.12 -15.8 -159 -8.80 -2.71(2.88) (3.06) (33.8) (1.32) (2.36)
log income -.264 -1.38 -6.12 .238 .928(1.13) (.604) (9.85) (1.04) (2.37)
2ndary yrs sch -.922 -.406 -4.91 .595 1.03(1.12) (1.26) (14.5) (.397) (.643)
log patents 1.57 1.60 16.2 .462 -.808(.431) (.476) (5.97) (.269) (.378)
R2 0.78 0.88 0.83 0.86 0.32N 50 50 48 50 50
Panel C: Average Manager Age
avg manager age -.463 -1.16 -11.2 -.687 -.343(.217) (.245) (2.69) (.081) (.172)
log income -.425 -1.55 -8.28 .203 1.11(1.31) (1.16) (15.8) (.610) (2.01)
2ndary yrs sch -1.16 -1.77 -16.9 -.303 .313(1.44) (1.66) (18.9) (.528) (.793)
log patents 2.08 2.91 28.7 1.23 -.409(.680) (.762) (9.13) (.300) (.363)
R2 0.71 0.86 0.79 0.88 0.43N 37 37 37 37 37
Panel D: Rule of Law
rule of law 15.3 30.8 307 15.5 3.92(7.60) (12.9) (130) (7.82) (7.62)
log income -2.75 -6.35 -55.7 -2.32 .210(1.46) (2.57) (25.9) (2.02) (2.58)
2ndary yrs sch -.567 .225 1.66 1.04 1.22(1.26) (1.85) (20.4) (.983) (.817)
log patents 1.95 2.37 23.8 .841 -.712(.693) (1.02) (11.4) (.525) (.394)
R2 0.68 0.70 0.66 0.69 0.28N 54 54 52 54 54
Notes: Cross-country regressions. Robust standard errors in parantheses. Observations are weighted by the number of
patent counts of the country. The dependent variables superstar fraction, tail innovation, and originality are multiplied by
100. Innovation diversity is multiplied by 10,000.
Acemoglu (MIT) Chinese Growth December 19, 2013. 15 / 39

An Institutional Framework Understanding Growth under Extractive Institutions
Freedom and Creative Innovations (continued)
Table 2: Baseline Regressions
Innov Quality Superstar Frac Tail Innov Originality Innov Diversity
Panel A: Individualism
individualism 4.75 12.1 118 7.84 4.53(2.38) (2.61) (30.2) (.615) (1.60)
log income -1.11 -3.25 -24.7 -.876 .434(1.37) (1.49) (18.9) (.510) (1.55)
2ndary yrs sch -.635 -.478 -4.89 .303 .470(1.19) (1.31) (15.4) (.348) (.668)
log patents 1.51 1.47 14.8 .389 -.832(.487) (.509) (6.29) (.188) (.354)
R2 0.71 0.85 0.79 0.91 0.48N 50 50 48 50 50
Panel B: Uncertainty Avoidance
uncertainty av -8.12 -15.8 -159 -8.80 -2.71(2.88) (3.06) (33.8) (1.32) (2.36)
log income -.264 -1.38 -6.12 .238 .928(1.13) (.604) (9.85) (1.04) (2.37)
2ndary yrs sch -.922 -.406 -4.91 .595 1.03(1.12) (1.26) (14.5) (.397) (.643)
log patents 1.57 1.60 16.2 .462 -.808(.431) (.476) (5.97) (.269) (.378)
R2 0.78 0.88 0.83 0.86 0.32N 50 50 48 50 50
Panel C: Average Manager Age
avg manager age -.463 -1.16 -11.2 -.687 -.343(.217) (.245) (2.69) (.081) (.172)
log income -.425 -1.55 -8.28 .203 1.11(1.31) (1.16) (15.8) (.610) (2.01)
2ndary yrs sch -1.16 -1.77 -16.9 -.303 .313(1.44) (1.66) (18.9) (.528) (.793)
log patents 2.08 2.91 28.7 1.23 -.409(.680) (.762) (9.13) (.300) (.363)
R2 0.71 0.86 0.79 0.88 0.43N 37 37 37 37 37
Panel D: Rule of Law
rule of law 15.3 30.8 307 15.5 3.92(7.60) (12.9) (130) (7.82) (7.62)
log income -2.75 -6.35 -55.7 -2.32 .210(1.46) (2.57) (25.9) (2.02) (2.58)
2ndary yrs sch -.567 .225 1.66 1.04 1.22(1.26) (1.85) (20.4) (.983) (.817)
log patents 1.95 2.37 23.8 .841 -.712(.693) (1.02) (11.4) (.525) (.394)
R2 0.68 0.70 0.66 0.69 0.28N 54 54 52 54 54
Notes: Cross-country regressions. Robust standard errors in parantheses. Observations are weighted by the number of
patent counts of the country. The dependent variables superstar fraction, tail innovation, and originality are multiplied by
100. Innovation diversity is multiplied by 10,000.
Table 2: Baseline Regressions
Innov Quality Superstar Frac Tail Innov Originality Innov Diversity
Panel A: Individualism
individualism 4.75 12.1 118 7.84 4.53(2.38) (2.61) (30.2) (.615) (1.60)
log income -1.11 -3.25 -24.7 -.876 .434(1.37) (1.49) (18.9) (.510) (1.55)
2ndary yrs sch -.635 -.478 -4.89 .303 .470(1.19) (1.31) (15.4) (.348) (.668)
log patents 1.51 1.47 14.8 .389 -.832(.487) (.509) (6.29) (.188) (.354)
R2 0.71 0.85 0.79 0.91 0.48N 50 50 48 50 50
Panel B: Uncertainty Avoidance
uncertainty av -8.12 -15.8 -159 -8.80 -2.71(2.88) (3.06) (33.8) (1.32) (2.36)
log income -.264 -1.38 -6.12 .238 .928(1.13) (.604) (9.85) (1.04) (2.37)
2ndary yrs sch -.922 -.406 -4.91 .595 1.03(1.12) (1.26) (14.5) (.397) (.643)
log patents 1.57 1.60 16.2 .462 -.808(.431) (.476) (5.97) (.269) (.378)
R2 0.78 0.88 0.83 0.86 0.32N 50 50 48 50 50
Panel C: Average Manager Age
avg manager age -.463 -1.16 -11.2 -.687 -.343(.217) (.245) (2.69) (.081) (.172)
log income -.425 -1.55 -8.28 .203 1.11(1.31) (1.16) (15.8) (.610) (2.01)
2ndary yrs sch -1.16 -1.77 -16.9 -.303 .313(1.44) (1.66) (18.9) (.528) (.793)
log patents 2.08 2.91 28.7 1.23 -.409(.680) (.762) (9.13) (.300) (.363)
R2 0.71 0.86 0.79 0.88 0.43N 37 37 37 37 37
Panel D: Rule of Law
rule of law 15.3 30.8 307 15.5 3.92(7.60) (12.9) (130) (7.82) (7.62)
log income -2.75 -6.35 -55.7 -2.32 .210(1.46) (2.57) (25.9) (2.02) (2.58)
2ndary yrs sch -.567 .225 1.66 1.04 1.22(1.26) (1.85) (20.4) (.983) (.817)
log patents 1.95 2.37 23.8 .841 -.712(.693) (1.02) (11.4) (.525) (.394)
R2 0.68 0.70 0.66 0.69 0.28N 54 54 52 54 54
Notes: Cross-country regressions. Robust standard errors in parantheses. Observations are weighted by the number of
patent counts of the country. The dependent variables superstar fraction, tail innovation, and originality are multiplied by
100. Innovation diversity is multiplied by 10,000.
Acemoglu (MIT) Chinese Growth December 19, 2013. 16 / 39

An Institutional Framework Understanding Growth under Extractive Institutions
Country-Level Results:Distance to Frontier (I)
Table 5: Stock of Knowledge, Opportunity Cost and Creative Innovations
Innov Quality Superstar Frac Tail Innov Originality Innov Diversity
Panel A: Individualism
individualism 6.94 15.1 149 8.96 3.69(1.55) (1.39) (18.6) (.409) (1.34)
individualism × 3.52 4.72 48.8 1.79 -1.33log patents (.926) (.763) (10.9) (.298) (.632)
log patents 1.26 1.14 11.5 .264 -.739(.338) (.274) (3.92) (.141) (.305)
R2 0.81 0.94 0.88 0.94 0.52N 50 50 48 50 50
Panel B: Uncertainty Avoidance
uncertainty av -9.56 -20.7 -208 -11.8 -4.03(3.46) (3.08) (36.1) (.717) (2.58)
uncertainty av × -1.37 -4.62 -46.2 -2.90 -1.27log patents (1.41) (1.15) (16.2) (.658) (1.30)
log patents 1.51 1.35 13.7 .308 -.876(.367) (.297) (4.26) (.190) (.377)
R2 0.79 0.93 0.88 0.91 0.34N 50 50 48 50 50
Panel C: Average Manager Age
avg manager age -.462 -1.20 -11.4 -.711 -.220(.272) (.309) (3.42) (.091) (.170)
avg manager age × .001 -.040 -.257 -.529 .140log patents (.154) (.139) (1.89) (.852) (.134)
log patents 2.08 2.81 28.1 1.23 -.062(.729) (.747) (9.17) (.286) (.357)
R2 0.71 0.86 0.79 0.88 0.46N 37 37 37 37 37
Panel D: Rule of Law
rule of law 31.2 70.6 682 16.5 22.5(12.9) (15.7) (177) (8.73) (10.6)
rule of law × 5.38 13.5 127 -.298 6.33log patents (2.81) (3.49) (41.2) (.946) (2.17)
log patents 1.76 1.88 19.2 .858 -.942(.590) (.735) (8.84) (.541) (.362)
R2 0.72 0.83 0.76 0.69 0.44N 54 54 52 50 54
Notes: Cross-country regressions. Robust standard errors in parantheses. Observations are weighted by the number
of patent counts of the country. Controls include R&D intensity, log income, average secondary years of schooling, and
log patent count. The main effects of average manager age and log patent count are evaluated at the sample means.
The dependent variables superstar fraction, tail innovation, and originality are multiplied by 100. Innovation diversity is
multiplied by 10,000.
Acemoglu (MIT) Chinese Growth December 19, 2013. 17 / 39

An Institutional Framework Understanding Growth under Extractive Institutions
Example: The Soviet Miracle
Before the Chinese miracle, there was the Soviet miracle.Rapid growth under central planning based on reallocation ofresources from unproductive agriculture to industry� which was stillnot su¢ ciently organized.
Similar enthusiasm (to that we see about China) among pundits andacademics concerning the Soviet model.Acemoglu (MIT) Chinese Growth December 19, 2013. 18 / 39

An Institutional Framework Understanding Growth under Extractive Institutions
The Soviet Miracle in Samuelson�s Textbook
Paul Samuelson’sforecast for U.S. andUSSR relative economicgrowth in the 1961edition of his textbook.
Acemoglu (MIT) Chinese Growth December 19, 2013. 19 / 39

An Institutional Framework Understanding Growth under Extractive Institutions
The Soviet Miracle in Later Editions of Samuelson�sTextbook
Acemoglu (MIT) Chinese Growth December 19, 2013. 20 / 39

An Institutional Framework Understanding Growth under Extractive Institutions
The Soviet Miracle in Yet Later Editions of Samuelson�sTextbook
Acemoglu (MIT) Chinese Growth December 19, 2013. 21 / 39
An Institutional Framework Understanding Growth under Extractive Institutions
What Happened to the Soviet Miracle?
Lack of incentives � re�ecting lack of economic, political and socialfreedom � meant that the Soviet Union could not go beyondcollecting the low hanging fruit of reallocation and basic catch-upgrowth.
When it was time for innovation, the Soviet economy stagnated andthen collapsed.
No transition to sustained growth, technological change or innovation(except in the defense industry).
Acemoglu (MIT) Chinese Growth December 19, 2013. 22 / 39
An Institutional Framework Understanding Growth under Extractive Institutions
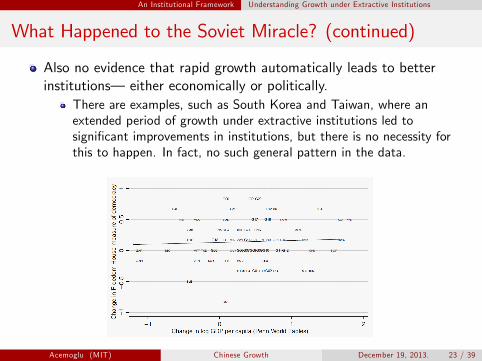
What Happened to the Soviet Miracle? (continued)
Also no evidence that rapid growth automatically leads to betterinstitutions� either economically or politically.
There are examples, such as South Korea and Taiwan, where anextended period of growth under extractive institutions led tosigni�cant improvements in institutions, but there is no necessity forthis to happen. In fact, no such general pattern in the data.
Acemoglu (MIT) Chinese Growth December 19, 2013. 23 / 39

Some Thoughts on the Chinese Miracle
Some Institutional Hypotheses on China
1 Chinese poverty had historical/institutional causes.2 �Rebirth� in China was an essentially political event, resulting from apower struggle within the Communist Party.
3 Economic liberalization was partly imposed on China.4 Chinese economic growth has been a form of �growth underextractive institutions,� largely due to catch up during a particularlypropitious time due to technological and geopolitical forces.
5 Chinese growth will not last without a fundamental politicaltransformation.
Acemoglu (MIT) Chinese Growth December 19, 2013. 24 / 39

Some Thoughts on the Chinese Miracle
Historical/Institutional Causes of Chinese Poverty
China became backward starting from a position of strength. Why?Perhaps a combination of the following factors:
1 Central elite generally weak in its ability to control much of China.This can be seen from the generally very low tax rates in China(compared to extraction rates in feudal Europe or the OttomanEmpire) and a very frequent tax riots. E.g., Bin Wong ChinaTransformed: Historical Change and the Limits of EuropeanExperience, Brandt, Ma and Rawski, 2012.
2 As a result, the Chinese elite was afraid of structural, technological andinstitutional change� fear of creative destruction.Especially under the the Ming and the Qing periods.Adm. Zheng He�s overseas missions and all overseas trade banned after1433 (until 1567). Other bans thereafter. For example, in 1661 theemperor Kangxi ordered that all people living along the (essentiallyentire) southern coast, once the most commercially active part ofChina, should move 17 miles inland to prevent overseas trade.
3 Very di¤erent institutional reactions to foreign threats.
Acemoglu (MIT) Chinese Growth December 19, 2013. 25 / 39

Some Thoughts on the Chinese Miracle
Historical/Institutional Causes of Chinese Poverty(continued)
Contrast with Japan, which also faced foreign threat in the 19thcentury (Commodore Matthew Perry in 1853), starting with a largelyextractive society.This led to the Meiji restoration of 1868 and particularly the spurtafter World War II was the role model for many other countries.What created Japanese growth? Until 1868 country divided intoterritories each run by a feudal lord, no real central state, no national�scal system (daimyo�s collected land taxes in kind), country closedto the outside world� very similar to China.Meiji restoration essentially a revolution by the �Satcho Alliance� ledby the Satsuma domain against the Tokogawa family who were theruling Shoguns after 1600 (Emperor marginalized).Political revolution generated an institutional transition away from anessentially feudal society towards something much more modern, ifnot completely inclusive.Acemoglu (MIT) Chinese Growth December 19, 2013. 26 / 39

Some Thoughts on the Chinese Miracle
Historical/Institutional Causes (continued)
Meiji�s regime�s slogan: �rich country, strong military�. Constructed amore centralized state, encouraging industrialization.
In the postwar period, this also involved a new constitution,fundamental democratization, mass land reform, and the breakup ofthe Zeibatsu the large business conglomerates.
Similar threat against the Chinese, coming to a head with the opiumwars, led to no e¤ective reform movement and to total collapse� dueto absence of any other powerful actor able to compete against theEmperor, even though the Emperor was weak both economically andpolitically.
Acemoglu (MIT) Chinese Growth December 19, 2013. 27 / 39

Some Thoughts on the Chinese Miracle
Rebirth in China
Little doubt that huge turnaround in Chinese growth comes fromeconomic reforms relaxing central planning and allowing private ormixed enterprises to respond to market incentives.In terms of our simple matrix, this corresponds to a move from thelower right corner towards the lower left corner� even if Chineseeconomic institutions have not yet become fully inclusive nor is itclear that they are on their way to becoming so.
Economic InstitutionsInclusive Extractive
Political Inclusive �#Institutions Extractive "�! �
Why the change? Standard answers: Deng Xiaoping introducedfarsighted reforms and economic liberalization; regional governmentsand bureaucrats started competing with each other in producinggrowth.But not entirely convincing.Acemoglu (MIT) Chinese Growth December 19, 2013. 28 / 39

Some Thoughts on the Chinese Miracle
Rebirth in China (continued)
Rebirth partly driven by power struggle within the Chinese leadership.
Deng Xiaoping managed to outmaneuver the Gang of Four after thedeath of Mao.
But this wasn�t because� or even majorly aided by the fact that� hewanted to reform economic institutions.In fact, this was most probably not part of the design. Deng Xiaoping,though opposed to the harsher line of the Gang of Four, especially onthe Cultural Revolution, was a leader of the �anti-rightist� of thecampaigns of the 1950s.Though he was sidelined and jailed in 1967, he was rehabilitated in1974 and had become �rst vice-premier.Until 1988, private �rms were not recognized.Only in 2001, �capitalists� admitted to the party.Deng Xiaoping and many other post-78 leaders were generally hostileto markets and private enterprises, not willing to remove barriers toprivate enterprise entry or hugely distortionary taxes on private �rms.
Acemoglu (MIT) Chinese Growth December 19, 2013. 29 / 39

Some Thoughts on the Chinese Miracle
Rebirth in China (continued)
Why did Deng Xiaoping lead economic reform in China?
Impossible to know with any certainty, but a couple of factors:
In his personal battle with the Gang of Four, he probably needed torally support using a di¤erent rhetoric.As we�ll discuss next, events on the ground may have forced his hand.Experimentation: not as a sophisticated strategy, but things that weredone or imposed early on �worked�.The preconditions for extractive growth were there:
1 Political centralization: Brandt, Ma and Rawski, 2012, Ma, 2011;political centralization increasing in China over time.
2 Direct bene�ts: the leadership�s control became stronger once part ofthe population bene�ted from some limited growth.
3 Limited fear of creative destruction: not much to be lost starting fromthe post-cultural revolution state of the economy and society.
Acemoglu (MIT) Chinese Growth December 19, 2013. 30 / 39

Some Thoughts on the Chinese Miracle
Liberalization from Bottom-Up
Economic growth in the early stages was driven by private initiative,not by the state.
The state did not provide a modern or independent legal system, butprivate capitalists got around this by creating their own institutions,using reputational mechanisms to raise capital and enforcecontracts� as late as the 2000s, China ranked at the very bottom ofthe rankings in terms of investor protection or ease of doing business.
It was only in 1988 that the state recognized the legal existence ofprivate �rms with more than 7 workers though the o¢ cial documentstill stated that they were supplements to the state owned economy.
Acemoglu (MIT) Chinese Growth December 19, 2013. 31 / 39

Some Thoughts on the Chinese Miracle
Liberalization from Bottom-Up (continued)
Widespread resistance to private �rms from the party.
Yasheng Huang Capitalism with Chinese Characteristics: the Party vs.small businesses.
Yasheng Huang Selling China: Foreign Direct Investment during theReform Era: missing domestic investment and access of foreign directinvestment because of discouragement and insecurity of privateChinese investors.
In the words of a Chinese economist:
�Big state companies can get involved in huge projects. Butwhen private companies do so, especially in competition with thestate, then trouble comes from every corner.�
Acemoglu (MIT) Chinese Growth December 19, 2013. 32 / 39

Some Thoughts on the Chinese Miracle
Liberalization from Bottom-Up (continued)
Most importantly, as argued by Victor Nee and Sonja OpperCapitalism from Below, early reforms were not instituted by the partyor outcomes of experimentation, but the party catching up withwhat�s been going on on the ground given the vacuum and crisiswrought by the Cultural Revolution.
Before Deng Xiaoping�s reforms partly because of economic hardshipsand partly because of the loss of control of the state in many regionsin the aftermath of the cultural revolution, privately-led experimentswith production for the market and ending collective incentives hadstarted. For example, in Anhui province, peasant households hadalready dissolved communes and collectives before any reforms, andhad started that land-lease system.
Such developments forced the hand of Deng Xiaoping and CommunistParty elites to start a slight loosening of central planning andcollectivization.
Acemoglu (MIT) Chinese Growth December 19, 2013. 33 / 39

Some Thoughts on the Chinese Miracle
Liberalization from Bottom-Up (continued)
Similarly, in �nancial markets, Nee and Opper argue centralgovernment was forced to open the national stock markets to regainstate control over the blossoming private �nancial activities.
Growth of private enterprise in the urban sector again leadsCommunist Party�s moves to recognize private �rms.
Acemoglu (MIT) Chinese Growth December 19, 2013. 34 / 39

Some Thoughts on the Chinese Miracle
Catch-up Growth
Growth based on reallocation, technology transfer, o¤shoring ofrelatively simple parts of the production chain (e.g., assembly) andexport.
Reallocation-based growth in China:
Hsieh and Klenow, QJE 2009, major reallocation in Chinese industrythat has declined over time.Song, Storeslettten and Zilibotti, AER 2010, growth driven byreallocation from ine¢ cient state �rms to entrepreneurial �rms in thepresence of credit market frictions.
Acemoglu (MIT) Chinese Growth December 19, 2013. 35 / 39

Some Thoughts on the Chinese Miracle
Catch-up Growth (continued)
Transfer of technology and o¤shoring perhaps more powerful today inthe past:
Before the 1990s, catch-up growth would have to take the form of acountry performing all the tasks necessary for production in a particularsector, and then supplying its own home market for the most part.This required a range of social changes, including growth of internaldemand and development of a range of competences (e.g., Germanyand Russia in the late 19th century).Now this is feasible without any of this, because a country can performjust a narrow set of facts and export all its production� much morefavorable to extractive catch-up growth without true institutionalchange.
But still there are hard limits:
Creative innovations still required for the next stage.O¤shoring and technologies directed to this activity will slow down asChinese wages increase (Acemoglu, Gancia and Zilibotti, 2012).
Acemoglu (MIT) Chinese Growth December 19, 2013. 36 / 39

Some Thoughts on the Chinese Miracle
The Future of Chinese Growth
Of course, we don�t know.
But the institutional framework suggests that even with the newworld order that facilitates technology transfer and catch-up growth,catch-up growth cannot last, and without a fundamental institutionaltransformation, it will not lead to inclusive growth.
Will gradual or radical institutional change take place in China?
This depends on our assessment of how China achieve this growth sofar, whether it will continue to undertake economic reforms toincrease the inclusivity of economic institutions (that �economicliberty�) and most importantly, how its politics will work out.
Acemoglu (MIT) Chinese Growth December 19, 2013. 37 / 39

Some Thoughts on the Chinese Miracle
The Future of Chinese Growth (continued)
Put di¤erently, according to this perspective, the future of Chinesegrowth turns on where China is in this matrix and whether it willmove:
Economic InstitutionsInclusive Extractive
Political Inclusive �#Institutions Extractive "�! �
Acemoglu (MIT) Chinese Growth December 19, 2013. 38 / 39

Conclusion
Conclusion
Much to be learned about China and from China.
But Chinese economic growth also has to be put in the context of abroader institutional and political study of economic growth.
THANK YOU
Acemoglu (MIT) Chinese Growth December 19, 2013. 39 / 39