STABILITY AND QUALITY OF FISH OIL DURING TYPICAL DOMESTIC APPLICATION

The Funding of the Irish Domestic Banking System
During the Boom�
Philip R. LaneTrinity College Dublin and CEPR
February 2015
Abstract
This paper analyses the funding of the Irish domestic banking system during the
boom period. We highlight: the shifting roles of deposit and bond funding; the
prominence of foreign banks as funding counterparties; the role of intero¢ ce funding;
and the scale of US dollar and Sterling funding. From August 2007, the deterioration
in funding conditions is clearly evident across a range of indicators.
�Revised version of paper presented to Statistical and Social Inquiry Society of Ireland meeting (15
January 2015). I thank my discussants (Dermot Coates, Greg Connor) and meeting participants for
comments. I thank Rahul Dewan, Caroline Mehigan, Rogelio Mercado, Tony O�Connor, Jonathan Rice,
George Sorgs-Langhan, Iain Snoddy and Clemens Struck for excellent research assistance. I also gratefully
acknowledge research support from the Irish Research Council. Email: [email protected].
1 Introduction
The aim of this paper is to examine the funding of the domestic Irish banking system during
the boom period (especially 2003-2008). While there has been considerable attention paid
to the asset side of the balance sheets of these banks (in particular, the rapid and overly-
concentrated growth in property-related loans), it is also important to examine in detail
the funding sources that underpinned the extraordinary credit boom. While it is well
understood that foreign funding in�ows (both deposits and other sources of liabilities)
played an important role in facilitating lending growth, a more comprehensive analysis of
funding patterns is warranted.
Understanding the funding dynamics is important for several reasons. First, it may
provide valuable lessons in terms of developing improved surveillance procedures in tracking
systemic risk in the banking system. Second, funding runs can be the trigger for the onset
of a banking crisis and it is important to probe the relative roles of solvency concerns
versus liquidity concerns in run dynamics. Third, the liability structure is important in
determining loss allocation in the event of a banking crisis.
In terms of data analysis, the Irish boom-bust cycle is especially challenging in view
of the dominance of externally-orientated foreign-owned banks in the aggregate banking
statistics.1 Since 2010, the Central Bank of Ireland has published more detailed banking
statistics (stretching back to 2003) that reports data for the �domestic market� group
(Irish banks plus the domestically-orientated subsidiaries of foreign-owned banks) and the
more narrow �Irish-headquartered�group of local banks (the six banks in this category in
relation to the boom period were Bank of Ireland, AIB Bank, Anglo-Irish Bank, Irish Life
1See also Coates and Everett (2013).
1

& Permanent, Irish Nationwide and Educational Building Society).2 Our primary focus is
on the latter group. In addition to the aggregate banking statistics, we also derive bank-
level data from the annual reports of these institutions and the Bankscope database. In
relation to bond funding, we also examine the bond issuance data contained in the Thomson
One database. In relation to cross-border funding, we supplement the data available from
the Bank of International Settlements with data from the Central Bank of Ireland and the
Bundesbank.
This paper builds on a rapidly-growing related literature. In the Irish context, Coates
and Everett (2013), Everett (2014), Everett et al (2014) and Coates et al (2015) analyse
important dimensions of the funding dynamics of the Irish banking system.3 The increase
in the net foreign liabilities of the Irish banking system is also studied by Honohan (2006,
2009, 2010a), Connor and O�Kelly (2012), Connor et al (2012) and Lane (2014).
At an international level, Bruno and Shin (2014) analyse the interaction between global
funding markets and credit dynamics in individual national economies, while Borio et
al (2011), Calderon and Kubota (2012), Carvalho (2014), Errico et al (2014) and Lane
and McQuade (2014) examine the interactions between international �nancial �ows and
domestic credit growth. The interest in this topic is elevated by the roles of credit growth
and external liabilities as predictors of �nancial crises (Gourinchas and Obstfeld 2012,
Catao and Milesi-Ferretti 2014). At a policy level, the conduct of macroprudential policies
and the operation of the European Union�s Macroeconomic Imbalances Procedure (MIP)
may be informed by a deeper analysis of bank funding patterns.
The structure of the paper is as follows. Section 2 brie�y outlines the nature of bank
2The latter group was previously described as as the �covered banks�group since these six banks took
advantage of the Irish State guarantee at the end of September 2008, while there were other banks that
were headquartered in Ireland but had an external focus and external ownership (such as Depfa Bank).
Since 201X, these other banks are no longer headquartered in Ireland.3Everett et al (2014) provides an important guide to the funding of the Irish banking system over
2001-2012.
2

balance sheets. In Section 3, we examine bank-level data derived from annual reports. In
Section 4, we focus on the money and banking statistics produced by the Central Bank of
Ireland. In Section 5, we examine additional dimensions of cross-border bank funding by
drawing on data newly assembled by the Central Bank of Ireland. In Section 6, we examine
some characteristics of bond funding. Finally, Section 7 concludes with a discussion of the
policy implications of the analysis.
2 The Structure of Bank Balance Sheets
At the high level of aggregation that is typically disclosed in annual reports and in aggregate
banking statistics, the balance sheet of a bank (or banking system) provides a decomposi-
tion by which assets are categorised into: (a) customer loans (LOANA); (b) inter-bank
deposit assets (INTERBANKA); and (c) other liquid assets (LIQAOTH).4 On the other
side, liabilities are categorised into: (a) customer deposits (DEPOSITSC); (b) inter-bank
deposit liabilities (INTERBANKL); (c) senior bond liabilities (BONDLSENIOR); (d)
capital (CAPITAL). In the CAPITAL category, the main instruments are equity and
subordinated bonds (BONDLSUBORD).
In thinking about funding dynamics, an important concept is the funding gap between
loans and customer deposits, which can be written as
GAP = LOANA�DEPOSITSC
= (INTERBANKL � INTERBANKA) +BONDLSENIOR +BONDLSUBORD + EQUITY L� LIQA
so banks can fund an above-unity loan-deposit ratio by being a net borrower in the interbank
market, through issuance of senior and subordinated bonds, through equity issuance and
by holding a low level of other liquid assets.
4In the context of the Irish banking system, the local banks were not large holders of bond portfolios
during the boom period, so I do not dwell too much on the composition of the liquid assets category.
3
Of course, it would be desirable to work with a �ner level of disaggregation. In addi-
tion to knowing more about the composition and maturity structure of loan assets, these
categories do not provide su¢ cient information about the nature of funding liabilities. In
particular, knowledge about the maturity structure and currency composition of customer
deposits, interbank deposit asset and liabilities and senior and subordinated bonds (to-
gether with o¤balance sheet items such as derivative positions) are essential for a complete
picture. Subject to this caveat, this paper analyses the aggregated information provided in
the available reports and data sets.
3 Bank-Level Data
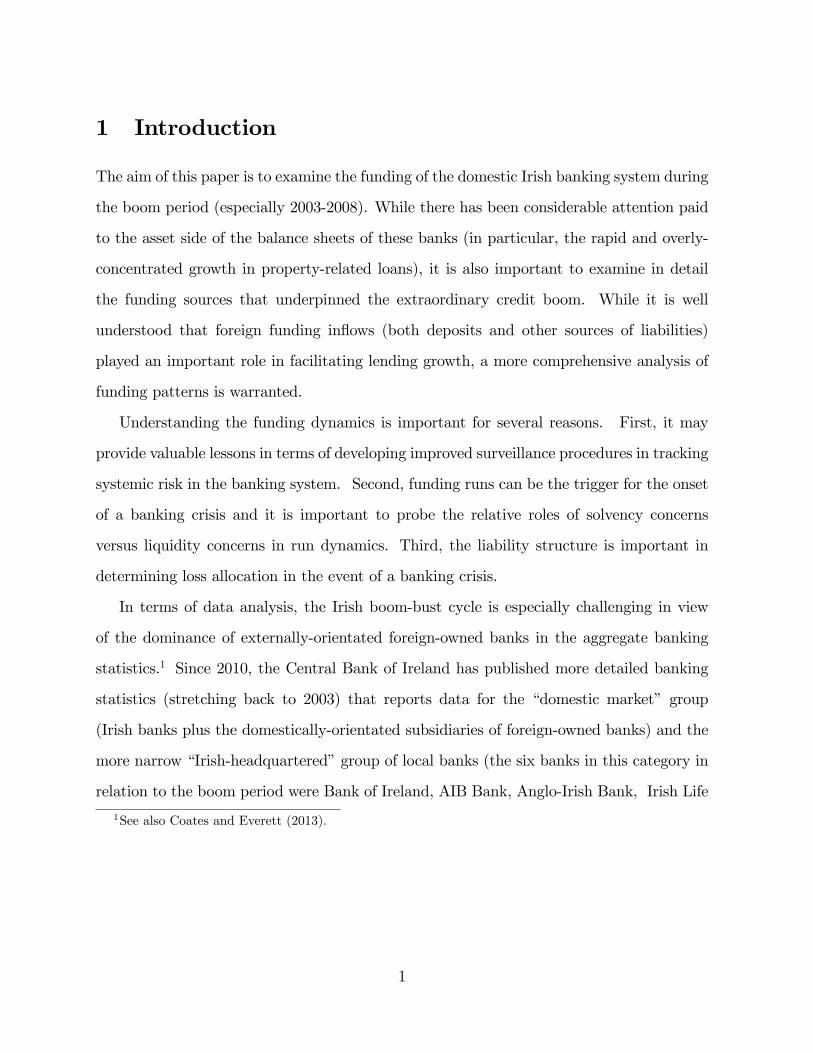
We begin by examining the data contained in the annual reports of the individual banks.
Annual reports are compiled on the basis of group-wide information, so that this source
combines the activities of the local and foreign operations of the banks. An analysis of
bank-level data is potentially helpful in identifying the relative contributions of common
and bank-speci�c factors in balance sheet dynamics.
Figure 1 compares aggregate liabilities from the annual reports compared to the aggre-
gate for the local units of the banks from the Central Bank�s aggregate money and banking
statistics. While there is a strong correspondence between the two series, the gap widens
during the mid-2000s indicating an increase in the scale of the activities of the overseas
a¢ liates of the banks.5
Figure 2 plots the relative size of each bank over 2000-2008. Throughout, AIB and Bank
of Ireland dominate the banking system, even if the increase in the relative size of Anglo
Irish Bank is visible in the mid-2000s. Despite the much smaller size of Anglo Irish Bank,
the main banks perceived it to be important to relax credit standards to compete with this
relatively minor player (Honohan 2010b, Regling and Watson 2010, Nyberg 2011).
5See also Kearns (2007).
4

Figures 3-8 show the dynamics of liabilities for each bank. While all banks saw a rapid
expansion in the scale of balance sheets over 2002-2007, the composition of liabilities varied
across the banks. For instance, while all banks saw an increase in the relative importance of
senior bond funding during 2002-2007, there was a spectacular increase in the cases of Irish
Life & Permanent and Irish Nationwide. However, the relative importance of senior bond
funding declined during 2008 with a rise in the relative share of bank-sourced deposits
acting as a substitute. Across the banks, non-capital liabilities dominated, broadly in
line with the procyclical pattern identi�ed by Adrian and Shin (2014). Moreover, within
the capital category, there was marked growth in subordinated bonds relative to ordinary
equity, which constituted a deterioration in terms of loss-absorbing capacity.
Figure 9 shows the dependence on net interbank funding (liabilities to banks minus
claims on banks) for each bank, which provides a more useful guide to the reliance on
interbank funding than the level of gross liabilities to other banks. The banks vary widely
in terms of net reliance on interbank funding, with some banks holding net interbank assets
for most of the period. However, a common pattern is a relative decline in this category
until 2006 but increasing reliance during 2007-2008. Again, this is consistent with the
decline in other funding options during 2007-2008.
4 Aggregate Banking Statistics
Since 2010, the Central Bank of Ireland has published disaggregated versions of its money
and banking statistics, with data available back to January 2003. In addition to the
aggregate banking data (which is distorted for analytical purposes by the inclusion of
externally-orientated IFSC-type banks), balance sheet data are also published for the �do-
mestic market�group (the local banks and the domestically-active subsidiaries of foreign-
owned banks) and the �Irish-headquartered�group (the main local banks). These data
are important in understanding the dynamics of the local banking system. In particular,
5
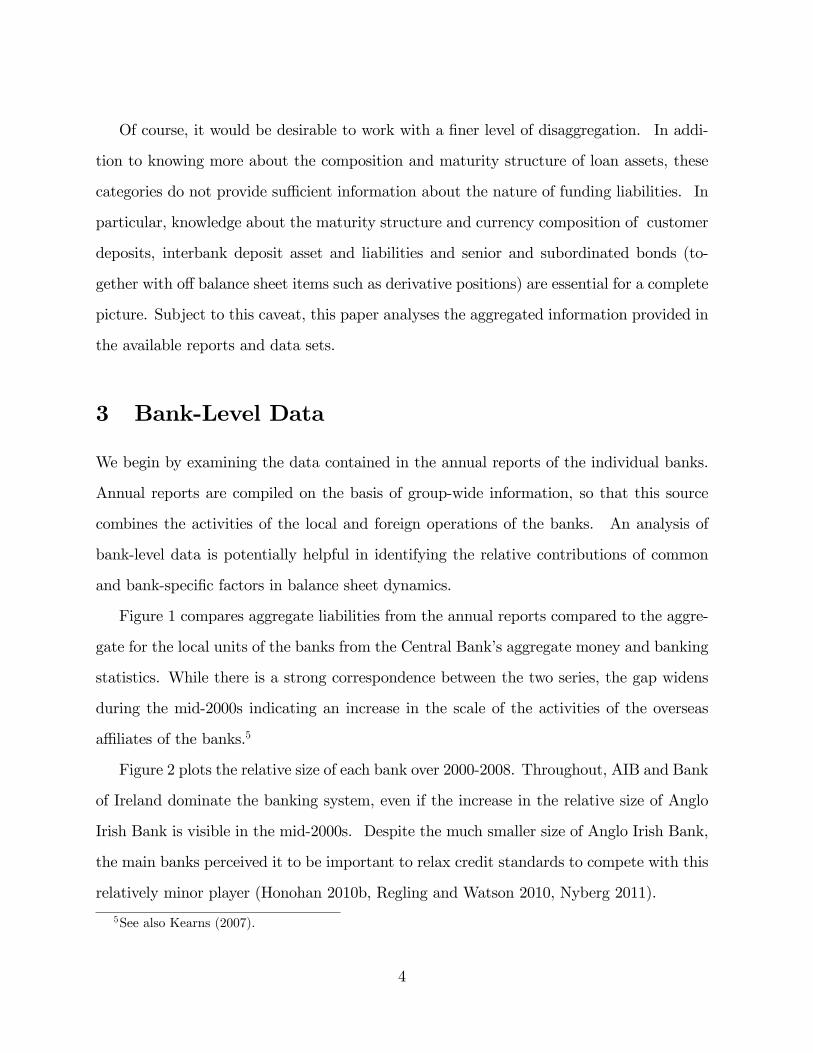
this dataset provides information that cannot be extracted from the annual reports of the
individual banks, which focus on consolidated group-level data that combines the domestic
and international activities of the banks.
In overall terms, Figure 10 shows the sharp growth in the total assets of the domestic
banking system over 2003.1-2008.9. While the local banks were dominant throughout,
Figure 11 does show a marked (if minor) increase in the market share of foreign-owned
banks until July 2005 which was subsequently unwound. This pattern is consistent with
the narratives in Honohan (2010b), Regling and Watson (2010) and Nyberg (2011) that a
loss of market share to foreign-owned banks was one factor behind more aggressive lending
behaviour by the local banks.
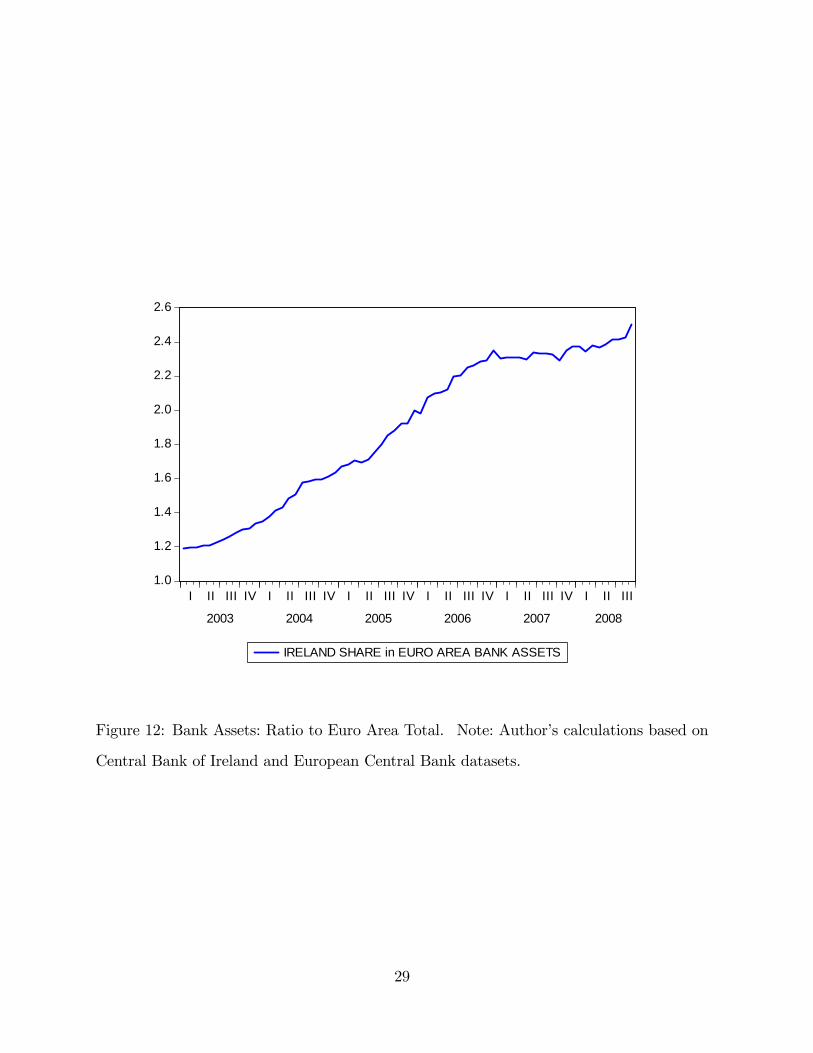
Figure 12 shows that the Irish banking system grew more quickly than the the aggregate
euro area system during 2003-2006 but its share then remained stable during 2007-2008.
Figure 13 plots the composition of liabilities for the local banks: the increase in bond
funding is quite marked over this period. Indeed, Figure 14 shows that the growth in bond
funding was quite exceptional relative to the aggregate euro area.
Honohan (2006, 2009, 2010a) drew attention to the sharp increase in the net foreign
liabilities of the Irish banking system that began around 2003. Figures 15-16 con�rm
this pattern: both local and foreign-owned banks saw a substantial increase in net foreign
liabilities (relative to total assets), even if the relative importance of foreign funding was far
greater for the latter group throughout the period. This is in line with the global literature
on the role of foreign-owned banks, which typically have much greater access to foreign
funding.
Figures 17-18 show a marked di¤erences between the local banks and the foreign-owned
banks in terms of the composition of net foreign liabilities. As shown in Figure 18, net
deposit liabilities were the predominant type of foreign funding for the foreign-owned banks
during this period, with relatively minor roles for bond funding and other funding. More-
over, Figure 17 shows a striking divergence in the behaviour of the net foreign liability
6
position in bank deposits and loans (foreign deposit liabilities minus foreign loan assets)
versus the net foreign position in bonds (holdings of foreign bond assets minus foreign bond
liabilities), with a reversal in relative funding patterns from August 2007 onwards (this be-
ing the month that marked the start of an international reversal in liquidity patterns).
Figure 18 for the foreign-owned banks clearly shows the decline in long-term net foreign
bond funding and the increasing dependence on net foreign deposit funding, which is more
likely to be short-term in nature. This reversal is consistent with narrative accounts of
the Irish banking crisis (Honohan 2010b, Regling and Watson 2010, Nyberg 2011) and
highlights the importance of examining the composition of foreign funding, in addition to
the aggregate net foreign position.
We capture this funding shift by running regressions of the form
NETFORLIABkt = �k + �kNETFORLIABkt�1 + �kLIQDUMt + "t (1)
NETFORLIABkt � (FORLIABkt � FORASSET kt )=ASSETSt
where FORLIABkt and FORASSETSkt denotes liabilities and assets in funding category
k, ASSETSt are the total assets of the banking system and LIQDUMt is a dummy variable
that takes the value 0 during 2003.1-2007.7 and 1 from 2007.8 to 2008.9. We consider four
foreign funding categories: (i) total; (ii) deposits/loans; (iii) bonds; and (iv) other. Table
1 shows the results. Consistent with Figure 17, there is a signi�cant shift towards net
deposit funding and away from net bond funding after August 2007.
5 The Sources of Cross-Border Funding
This section draws on newly-reconstructed data from the Central Bank of Ireland. While
there is some information on cross-border funding in the money and banking statistics
dataset that was analysed in the preceding section, it is desirable to know more about
the sources of cross-border funding. In particular, it is important to understand the
7

currency composition of external liabilities and the relative roles of bank and non-bank
funders in relation to both deposit liabilities and bond liabilities. At an international
level, these dimensions are reported through the International Banking Statistics dataset
compiled by the Bank of International Settlements (BIS). However, the headline BIS
dataset includes all resident banks (including the IFSC banks), while the BIS �locational
by nationality�dataset is distorted for Ireland during this period by the inclusion of the
German Pfandbrief banks that were foreign-owned and externally-orientated but registered
as Irish-headquartered banks whereas this new dataset is con�ned to the main locally-
owned domestically-active banks. Accordingly, it is necessary to construct an alternative
�locational by nationality�dataset that just includes the local Irish banks. To this end,
in what follows, I rely on data kindly provided by the Central Bank of Ireland.
Figure ?? shows that the external liabilities of the local banks comprised a minority
of the aggregate external liabilities of resident banks. However, the local share was not
constant but rather sharply increased during the mid-2000s. The time-varying share of
local banks in external liabilities mean that it is not possible to infer by proxy the external
position of the local banks from the aggregate BIS data, such that it is necessary to compile
a dedicated dataset for this group.
Figure 20 plots the share of external liabilities owed to non-bank investors. Throughout
the period, it is clear that foreign banks were the dominant source of funding for the
domestic banks. Moreover, the relative importance of bank-sourced funding increased
during the latter part of the period (2006-2008). Figure 21 plots the interbank share in
external deposit liabilities over 2003.Q1-2008.Q4. It shows that foreign banks were the
primary source of external deposit funding, with the inter-bank share climbing during 2003-
2006. However, the relative decline in this type of deposit funding began in early 2007 and
continued throughout 2007-2008. Within the inter-bank category, Figure 22 shows that
much of this funding came from the foreign a¢ liates of the local banks, especially during
2007-2008. This is also in line with the evidence presented by Everett et al (2014), which
8

shows that the net positions of the local banks vis-a-vis their foreign a¢ liates changed
sign in mid-2007, with the domestic units of the banks relying on the foreign a¢ liates for
substantial net funding during 2007-2008.
Figure 23 shows the share of external liabilities denominated in euro. The euro share
peaked at 44.8 percent in 2004.Q3 and had fallen back to 36.9 percent by 2008.Q1. The
high reliance on non-euro external liabilities is consistent with the strong linkages between
the Irish banks and the UK and US �nancial systems. Figure 24 a¢ rms this by showing
the currency shares of the euro, the US dollar and Sterling in external liabilities. The
expansion in the US dollar share from 2005 onwards is striking.
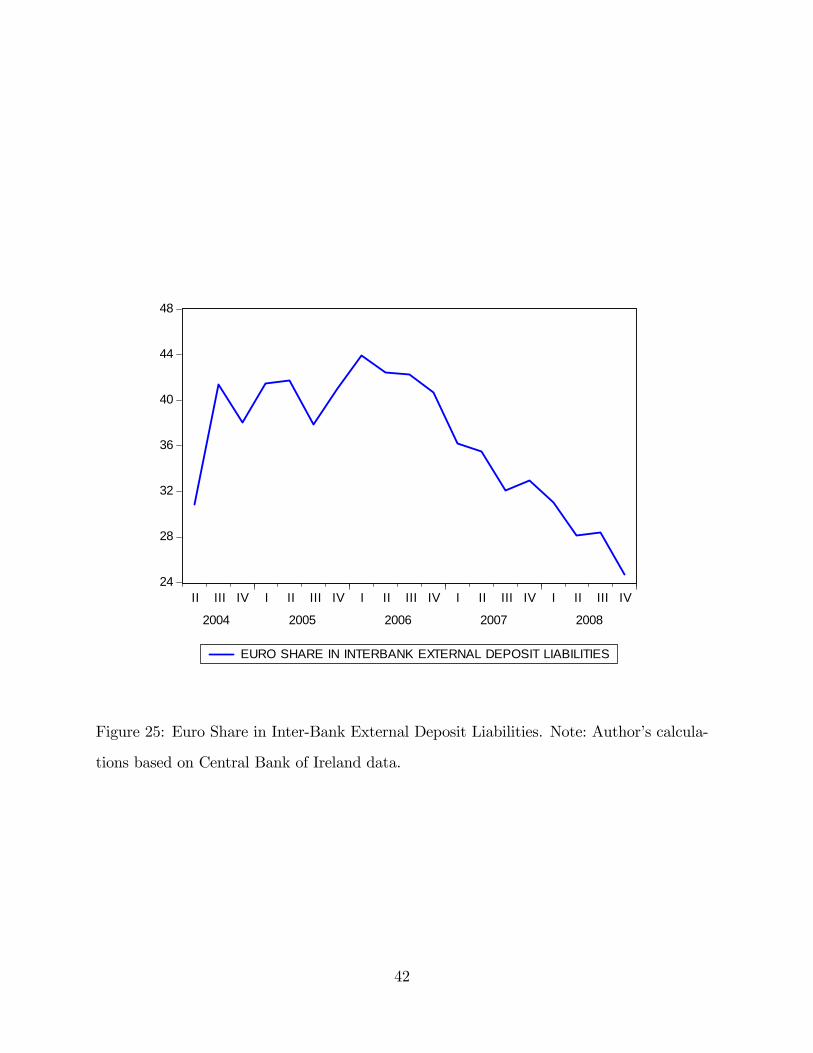
Figure 25 plots the share of euro-denominated deposits in interbank external deposit
liabilities. While this share climbed during 2002-2006, non-euro deposits accounted for
the majority of interbank deposits throughout the sample period. Figure 26 shows that
the euro-denominated share was especially low for inter-o¢ ce external deposit liabilities:
most of the funding raised through inter-o¢ ce channels was in foreign currencies. This
is consistent with the geographical location of the foreign o¢ ces of the Irish banks, which
were orientated towards the United Kingdom and the United States. Finally, Figure 27
shows the share of external bonds denominated in euro (in respect of bonds held by foreign
banks), which only climbed above 50 percent towards the end of the sample period.
6 Bond Funding
In this section, we look more closely at the bond issuance pattern by Irish banks. First,
we show that bond spreads during 2002-2006 were very low, so that Irish banks could
raise signi�cant funding. Moreover, contemporaneous reports suggest that the demand
for Irish bank bonds was geographically quite diverse, with investors from many countries
participating in the primary market. However, risk spreads increased in 2007-2008 and the
volume of bond issuance declined signi�cantly.
9

Table 2 provides a description of the subordinated bond issues by Bank of Ireland, AIB,
Anglo-Irish Bank and Irish Life & Permanent over 2002-2008. Table 2 shows that bonds
were issued at low spreads across a range of categories and maturities during 2002-2006.
For instance, Euroweek (June 18, 2004) reports on a e750 million ten-year lower tier two
bond issue by Anglo-Irish Bank that was priced at Euribor plus 50 basis points. According
to one bookrunner (ABN Amro): �We were oversubscribed and there were over 90 accounts
in the book from 17 di¤erent countries. It reached over e900 million after only a two-day
book building process, and the depth of demand and the diversi�cation of the order book
was unprecedented for the issuer, paving the way for future issuances for Anglo.�
According to another bookrunner on the same bond issue (Barclays): �The FRNmarket
in recent weeks, both on the senior and subordinated sides, has seen material involvement
from less traditional FRN buyers, such as high quality northern European asset managers
and insurance money. Given the uncertainty with rates and FRNs being viewed as defensive
products, this transaction saw material participation from this group of investors. As a
result, the order book was of an extremely high quality and diverse in terms of geographic
split. Distribution was as follows: by investor type, fund managers and asset managers took
71% of the bonds, banks 22%, and the remainder were sold to pension and retail money.
By geography, German investors were the largest takers with 24% of orders, followed by
the UK with 17%, Iberia 15%, France 13%, Scandinavia 10%, Ireland 8% and Asia 4%.�6
During the 2002-2006 period, contemporaneous reports pointed to low global bond
yields and the strong pro�tability of the Irish banks as drivers of international interest in
Irish bank bonds. CDIS spreads on these bonds were very low, suggesting that the markets
did not have major concerns about default risk during that period. Consistent with the
evidence in the earlier sections, Table 2 shows that bonds were issued in US dollars and
Sterling as well as in euro, in line with the strong ties of Irish banks to the UK and US
�nancial systems.
6FRN is the acronym for �oating-rate notes.
10

While the last subordinated bond issue by Anglo-Irish Bank was in May 2007 before
the tightening of market conditions, both AIB and Bank of Ireland issued dated lower
Tier Two subordinated bonds in mid-2008. By this late stage, spreads were considerably
higher than in previous years, while the range of investors was also more limited. The AIB
STG£ 700 million 15-year bond was priced at 250 basis points over mid-swaps at the end of
May 2008, while the Bank of Ireland STG£ 450 million 12-year bond was priced at 370 basis
points over mid-swaps at the end of July 2008. In relation to the AIB issue, Euroweek (30
May 2008) reported the comments of the bookrunners (HSBC, Lehman Brothers, Morgan
Stanley): �We opened the books at 2pm, and closed them an hour and a half later at
pound(s) 1bn. The majority (90%) of interest came from the UK and Ireland. The book
was distributed between 42 accounts, 83% of which were fund managers and pension funds,
and 12% were insurance �rms.� In relation to the Bank of Ireland issue, Euroweek (1
August 2008) reported the comments of the bookrunners (Merrill Lynch, Royal Bank of
Scotland): �Roughly 95% of the trade went to the UK and Ireland, with Scandinavia the
other notable player at 3%. More than 50% went to fund managers, around 25% went
to banks, and just under 10% to insurance �rms.� Euroweek also reported some market
views: �... this came at a wide level. They built a huge book, which is not surprising given
that they priced it at 70bp back from CDS. They paid up to ensure a smooth execution.�
Figures 28-29 show the evolution of CDS spreads on senior and subordinated bonds over
2007-2010.7 The decline in funding conditions is clearly seen from the second half of 2007
onwards, consistent with the balance sheet data in earlier sections. The higher spreads
on subordinated debt relative to senior debt is in line with the di¤erent risk exposures of
the two types of bonds, although the substantial spreads on senior bonds during various
intervals suggests that the markets took seriously the risk of default on senior bonds.
Finally, while data availability on the geographical distribution of bond holding is no-
toriously limited, a partial view on the dynamics of foreign holdings of Irish bank bonds
7Spreads prior to 2007 were much lower.
11

can be obtained from Bundesbank data in relation to German-resident investors.8 Fig-
ure 30 shows the Irish bank bond holdings of German banks (MFIs), non-bank �nancial
institutions (OFIs) and the non�nancial sector (households, non-pro�t institutions serving
households and non-�nancial corporates).9 Figure 30 shows that the MFI sector was
the largest investor in Irish bank bonds during the pre-crisis period but this position was
shrinking even before September 2008 and fell by a further 50 percent by September 2010.10
In contrast, the holdings of the other sectors actually climbed between 2008 and mid-2010
before falling back during the turmoil of late 2010.
7 Conclusions
The aim of this paper has been to provide an empirical pro�le of the funding of the Irish
banking system during the credit boom period.
Our data analysis highlights a number of patterns. First, the boom period was relatively
short: 2003 to mid-2007. From mid-2007, multiple indicators signalled that the funding
conditions of the Irish banks were deteriorating. Second, foreign-resident banks were a
primary counterparty for much of the foreign funding. Importantly, this category includes
the foreign o¢ ces of the local banks, with inter-o¢ ce funding growing in relative importance
as market conditions tightened during 2007-2008. Third, much of the funding was in US
dollars and Sterling, which is consistent with the strong links between Irish banks and these
�nancial systems. Undoubtedly, the capacity of Irish banks to raise considerable non-euro
funding can be linked to the hedging opportunities provided by the large euro-dollar and
euro-Sterling derivatives markets. Fourth, senior and subordinated bond issues were an
important source of funding during 2003-2006 but banks increasingly relied on interbank
8This does not include any holdings of the foreign a¢ liates of German institutions.9These data are an extract from the Bundesbank�s Securities Holdings database.10A limitation is that the data do not indicate the roles of net sales versus valuation losses in determining
the decline in positions.
12

deposit funding during 2007-2008.
While the broad nature of these funding patterns are captured in the narrative reports
of Honohan (2010b), Regling and Watson (2010) and Nyberg (2011), this paper provides
supporting quantitative evidence, while the importance of non-euro funding sources and
the role of foreign o¢ ces of local banks has received relatively little attention.11
In terms of the policy debate, the analysis of bank funding patterns should be an integral
element in macro-prudential surveillance. In the Irish case, the switch in the composition
of net external �nancial liabilities from long-term net bonds to shorter-term net deposits
from mid-2007 onwards was an important signal of the increasing market scepticism about
the health of the Irish banking system. Throughout, the high ratio of debt-type liabilities
to equity-type liabilities limited the loss absorption capacity in the system.
Finally, the publication of more granular data on the balance sheets of the banking
system would make it easier for analysts to probe incipient risk factors. To this end,
Ireland should fully participate in the various current international initiatives to expand
the scope of banking statistics and link better domestic sectoral and external �nancial
accounts (Ali et al 2012, Committee on the Global Financial System 2012, Lane 2015).
References
Adrian, Tobias and Hyun Song Shin (2014), �Procyclical Leverage and Value-At-Risk,�
Review of Economic Studies 27(2), 373-403.
Ali, Robleh D., Andrew Haldane and Paul Nahai- Williamson (2012), �Towards a Common
Financial Language,�mimeo, Bank of England.
Borio, Claudio, Robert McCauley and Patrick McGuire (2011), �Global Credit and Do-
mestic Credit Booms,�BIS Quarterly Review (September), 43-57.
11See also Coates and Everett (2013) on the role of intero¢ ce funding.
13
Bruno, Valentina and Hyun Song Shin (2014), �Cross-Border Banking and Global Liq-
uidity,�Review of Economic Studies, forthcoming.
Calderon, Cesar and Megumi Kubota (2012), �Gross In�ows Gone Wild: Gross Capital
In�ows, Credit Booms and Crises,�World Bank Policy Research Working Paper No.
6270.
Carvalho, Daniel (2014), �Financial Integration and the Great Leveraging,� Banco de
Portugal Working Paper No. 2014-07.
Catao, Luis and Gian Maria Milesi-Ferretti (2014), �External Liabilities and Crises,�
Journal of International Economics 94(1), 18-32.
Coates, Dermot and Mary Everett (2013), �Pro�ling the Cross-Border Funding of the
Irish Banking System,�Central Bank of Ireland Economic Letter No. 2013-4.
Coates, Dermot, Mary Everett, Joe McNeill and Aoife Moloney (2015), �Interpreting Data
for Ireland in International Banking Statistics,�Central Bank of Ireland Economic
Letter No. 2015-1.
Committee on the Global Financial System (2012), �Improving the BIS International
Banking Statistics,�CGFS Paper No. 47. the Shadow Banking System Through a
Global Flow of Funds Analysis,�IMF Working Paper No. 14/10.
Connor, Gregory and Brian O�Kelly (2012), �Sliding Doors Cost Measurement: The
Net Economic Cost of Lax Regulation of the Banking Sector,�The World Economy
35(10), 1256-1276.
Connor, Gregory, Thomas Flavin and Brian O�Kelly (2012), �The US and Irish Credit
Crises: Their Distinctive Di¤erencs and Common Features,�Journal of International
Money and Finance 31, 60-79.
14

Everett, Mary (2014), �Blowing the Bubble: The Global Funding of the Irish Credit
Boom,�mimeo, Central Bank of Ireland.
Everett, Mary, Jane Kelly and Fergal McCann (2014), �Banks� Internal Capital Mar-
kets, O¢ cial Liquidity, and International Shock Transmission: An Irish Illustration,�
mimeo, Central Bank of Ireland.
Forbes, Kristin and Francis E. Warnock (2012), �Capital Flow Waves: Surges, Stops,
Flight and Retrenchment,�Journal of International Economics 88(2), 235-251.
Galstyan, Vahagn and Philip R. Lane (2013), �Bilateral Portfolio Dynamics During the
Global Crisis,�European Economic Review 57(1), 63-74.
Gourinchas, Pierre-Olivier and Maurice Obstfeld (2012), �Stories of the Twentieth Cen-
tury for the Twenty-First,�American Economic Journal: Macroeconomics 4(1), 226-
265.
Honohan, Patrick (2006), �To What Extent Has Finance Been a Driver of Ireland�s Eco-
nomic Success?,�ESRI Quarterly Economic Commentary (December), 59-72.
Honohan, Patrick (2009), �Resolving Ireland�s Banking Crisis,�Economic and Social Re-
view 40(2), 207-231.
Honohan, Patrick (2010a), �Euro Membership and Bank Stability � Friends or Foes?
Lessons from Ireland,�Comparative Economic Studies 52, 133-157.
Honohan, Patrick (2010b), The Irish Banking Crisis: Regulatory and Financial Stability
Policy 2003-2008, Preliminary Report of the Commission of Investigation into the
Banking Sector in Ireland.
Kearns, Allan (2007), �A Financial Stability Perspective on Irish Banks�Foreign Busi-
ness,�in Financial Stability Report 2007, Central Bank of Ireland, 103-113.
15

Lane, Philip R. (2013), �Capital Flows in the Euro Area,�European Economy Economic
Paper No. 497.
Lane, Philip R. (2015), �Cross-Border Financial Linkages: Identifying and Measuring
Vulnerabilities,�CEPR Policy Insight No. 76.
Lane, Philip R. and Gian Maria Milesi-Ferretti (2011), �The Cross-Country Incidence of
the Global Crisis,�IMF Economic Review 59(1), 77-110.
Lane, Philip R. and Gian Maria Milesi-Ferretti (2012), �External Adjustment and the
Global Crisis,�Journal of International Economics 88(2), 252-265.
Lane, Philip R. and Gian Maria Milesi-Ferretti (2014), �Global Imbalances and External
Adjustment After the Crisis,� IMF Working Paper, forthcoming.
Lane, Philip R. and Peter McQuade (2014), �Domestic Credit Growth and International
Capital Flows,�Scandinavian Journal of Economics 116(1), 218-252.
Milesi-Ferretti, Gian Maria and Cedric Tille (2011), �The Great Retrenchment: Interna-
tional Capital Flows During the Global Financial Crisis,�Economic Policy 26(66),
285-342.
Nyberg, Peter (2011), Misjudging Risk: Causes of the Systemic Banking Crisis in Ireland,
Report of the Commission of Investigation into the Banking Sector in Ireland.
Obstfeld, Maurice (2012), �Does the Current Account Still Matter?,�American Economic
Review 102(3), 1-23.
Regling, Klaus and Max Watson (2010), A Preliminary Report on the Sources of Ire-
land�s Banking Crisis, Preliminary Report of the Commission of Investigation into
the Banking Sector in Ireland.
16
Rey, Helene (2013), �Dilemma not Trilemma: The Global Financial Cycle and Monetary
Policy Independence,�mimeo, London Business School.
17

100,000
200,000
300,000
400,000
500,000
600,000
700,000
2003 2004 2005 2006 2007 2008
LIAB_TOTAL LIAB_TOTAL_CB
Figure 1: Aggregate Liabilities: Group Level versus Resident O¢ ces. Note: Author�s
calculations based on annual reports of banks and Central Bank of Ireland data.
18

0
20
40
60
80
100
120
2000 2001 2002 2003 2004 2005 2006 2007 2008
SIZE_AIB SIZE_BOISIZE_ANGLO SIZE_ILIPSIZE_EBS SIZE_INBS
Figure 2: Shares in Aggregate Balance Sheet of Local Banks. Note: Author�s calculations
based on data in annual reports.
19

20,000
40,000
60,000
80,000
100,000
120,000
140,000
160,000
180,000
2000 2001 2002 2003 2004 2005 2006 2007 2008
RETAIL_AIB BD_AIBSENIOR_AIB SUBORD_AIBEQUITY_AIB
Figure 3: Composition of Liabilities: AIB. Note: Author�s calculations based on data from
annual reports.
20

20,000
40,000
60,000
80,000
100,000
120,000
140,000
160,000
180,000
2000 2001 2002 2003 2004 2005 2006 2007 2008
RETAIL_BOI BD_BOISENIOR_BOI SUBORD_BOIEQUITY_BOI
Figure 4: Composition of Liabilities: Bank of Ireland. Note: Author�s calculations based
on data from annual reports.
21

0
20,000
40,000
60,000
80,000
100,000
120,000
2000 2001 2002 2003 2004 2005 2006 2007 2008
RETAIL_ANGLO BD_ANGLOSENIOR_ANGLO SUBORD_ANGLOEQUITY_ANGLO
Figure 5: Composition of Liabilities: Anglo Irish Bank. Note: Author�s calculations based
on data from annual reports.
22

0
10,000
20,000
30,000
40,000
50,000
60,000
2000 2001 2002 2003 2004 2005 2006 2007 2008
RETAIL_ILIP BD_ILIPSENIOR_ILIP SUBORD_ILIPEQUITY_ILIP
Figure 6: Composition of Liabilities: Irish Life & Permanent. Note: Author�s calculations
based on data from annual reports.
23

0
4,000
8,000
12,000
16,000
20,000
24,000
2000 2001 2002 2003 2004 2005 2006 2007 2008
RETAIL_EBS BD_EBSSENIOR_EBS SUBORD_EBSEQUITY_EBS
Figure 7: Composition of Liabilities: Educational Building Society. Note: Author�s calcu-
lations based on data from annual reports.
24

0
2,000
4,000
6,000
8,000
10,000
12,000
14,000
16,000
2000 2001 2002 2003 2004 2005 2006 2007 2008
RETAIL_INBS BD_INBSSENIOR_INBS SUBORD_INBSEQUITY_INBS
Figure 8: Composition of Liabilities: Irish Nationwide Building Society. Note: Author�s
calculations based on data from annual reports.
25

20
10
0
10
20
30
40
2000 2001 2002 2003 2004 2005 2006 2007 2008
AIBBank of IrelandAnglo Irish BankIrish Life & PermanentEducational Building SocietyIrish Nationwide Building Society
Figure 9: Net Inter-Bank Funding. Note: Scaled by total liabilities. Author�s calculations
based on annual reports of the banks.
26

100,000
200,000
300,000
400,000
500,000
600,000
700,000
800,000
I II III IV I II III IV I II III IV I II III IV I II III IV I II III
2003 2004 2005 2006 2007 2008
LOCAL BANKS FOREIGNOWNED BANKS
Figure 10: Total Assets of Domestic Banking System. Note: e Millions. Author�s calcu-
lations based on Central Bank of Ireland dataset.
27

21.5
22.0
22.5
23.0
23.5
24.0
24.5
25.0
25.5
I II III IV I II III IV I II III IV I II III IV I II III IV I II III
2003 2004 2005 2006 2007 2008
ASSET SHARE OF FOREIGNOWNED BANKS
Figure 11: Asset Share of Foreign-Owned Banks. Note: Author�s calculations based on
Central Bank of Ireland dataset.
28
1.0
1.2
1.4
1.6
1.8
2.0
2.2
2.4
2.6
I II III IV I II III IV I II III IV I II III IV I II III IV I II III
2003 2004 2005 2006 2007 2008
IRELAND SHARE in EURO AREA BANK ASSETS
Figure 12: Bank Assets: Ratio to Euro Area Total. Note: Author�s calculations based on
Central Bank of Ireland and European Central Bank datasets.
29

100,000
200,000
300,000
400,000
500,000
600,000
700,000
I II III IV I II III IV I II III IV I II III IV I II III IV I II III
2003 2004 2005 2006 2007 2008
Deposits Bonds OtherEurosystem Capital
Figure 13: Composition of Liabilities: Local Banks. Note: Author�s calculations based on
Central Bank of Ireland dataset.
30

8
12
16
20
24
28
I II III IV I II III IV I II III IV I II III IV I II III IV I II III IV
2003 2004 2005 2006 2007 2008
BONDSHARE_EUROSAREABONDSHARE_LOCAL
Figure 14: Share of Bond Funding in Total Liabilities: Ireland and Euro Area. Note:
Author�s calculations based on data from European Central Bank and Central Bank of
Ireland.
31

8
9
10
11
12
13
14
I II III IV I II III IV I II III IV I II III IV I II III IV I II III
2003 2004 2005 2006 2007 2008
Net Foreign Liabilities
Figure 15: Net Foreign Liabilities: Local Banks. Note: Scaled by total assets. Author�s
calculations based on Central Bank of Ireland dataset.
32

15.0
17.5
20.0
22.5
25.0
27.5
30.0
32.5
35.0
I II III IV I II III IV I II III IV I II III IV I II III IV I II III
2003 2004 2005 2006 2007 2008
Net Foreign Liabilities
Figure 16: Net Foreign Liabilities: Foreign-Owned Banks. Note: Scaled by total assets.
Author�s calculations based on Central Bank of Ireland data.
33

4
2
0
2
4
6
8
10
12
I II III IV I II III IV I II III IV I II III IV I II III IV I II III
2003 2004 2005 2006 2007 2008
BONDS DEPOSITS/LOANS OTHER
Figure 17: Composition of Net Foreign Liabilities: Local Banks. Note: Scaled by total
assets. Author�s calculations based on Central Bank of Ireland dataset.
34

4
0
4
8
12
16
20
24
28
32
I II III IV I II III IV I II III IV I II III IV I II III IV I II III
2003 2004 2005 2006 2007 2008
BONDSS DEPOSITS/LOANS OTHER
Figure 18: Composition of Net Foreign Liabilities: Foreign-Owned Banks. Note: Scaled
by total assets. Author�s calculations, based on Central Bank of Ireland data.
35

24
26
28
30
32
34
I II III IV I II III IV I II III IV I II III IV I II III IV I II III IV I
2002 2003 2004 2005 2006 2007
LOCALSHARE_BIS
Figure 19: Share of Local Banks in Aggregate External Liabilities of Resident Banks. Note:
Author�s Calculations based on data from BIS and Central Bank of Ireland.
36

18
20
22
24
26
28
I II III IV I II III IV I II III IV I II III IV I II III IV I II III IV I
2002 2003 2004 2005 2006 2007
Figure 20: Share of External Liabilities Owed to NonBanks. Note: Author�s calculations
based on Central Bank dataset.
37

70
72
74
76
78
80
82
84
I II III IV I II III IV I II III IV I II III IV I II III IV I II III IV
2003 2004 2005 2006 2007 2008
Figure 21: InterBank Share in External Deposit Liabilities. Note: Author�s calculations
based on Central Bank of Ireland data.
38

30
40
50
60
70
80
II III IV I II III IV I II III IV I II III IV I II III IV
2004 2005 2006 2007 2008
INTEROFFICE SHARE IN INTERBANK EXTERNAL DEPOSIT LIABILITIES
Figure 22: Inter-O¢ ce Share in Inter-Bank External Deposit Liabilities. Note: Author�s
calculations based on Central Bank of Ireland data.
39

30
32
34
36
38
40
42
44
46
I II III IV I II III IV I II III IV I II III IV I II III IV I II III IV I
2002 2003 2004 2005 2006 2007
EUROSHARE_LIAB
Figure 23: Share of External Liabilities Denominated in Euro. Note: Author�s calculations
based on Central Bank data.
40

15
20
25
30
35
40
45
50
I II III IV I II III IV I II III IV I II III IV I II III IV I II III IV I II
2002 2003 2004 2005 2006 2007 2008
EUROSHARE_LIABUSDSHARE_LIABGBPSHARE_LIAB
Figure 24: Currency Shares in External Liabilities. Note: Author�s Calculations based on
Central Bank data.
41
24
28
32
36
40
44
48
II III IV I II III IV I II III IV I II III IV I II III IV
2004 2005 2006 2007 2008
EURO SHARE IN INTERBANK EXTERNAL DEPOSIT LIABILITIES
Figure 25: Euro Share in Inter-Bank External Deposit Liabilities. Note: Author�s calcula-
tions based on Central Bank of Ireland data.
42

10
12
14
16
18
20
22
II III IV I II III IV I II III IV I II III IV I II III IV
2004 2005 2006 2007 2008
EURO SHARE IN INTEROFFICE EXTERNAL DEPOSIT LIABILITIES
Figure 26: Euro Share in Inter-O¢ ce External Deposit Liabilities. Note: Author�s calcu-
lations based on Central Bank of Ireland dataset.
43

36
40
44
48
52
56
IV I II III IV I II III IV I II III IV I II III IV
2004 2005 2006 2007 2008
Euro Share in External Bond Liabilities to Foreign Banks
Figure 27: Euro Share in External Bond Liabilities to Foreign Banks. Note: Author�s
calculations based on data from Central Bank of Ireland.
44

0
200
400
600
800
1,000
I II III IV I II III IV I II III IV I II III
2007 2008 2009 2010
SENIOR_AIB SENIOR_BOISENIOR_ANGLO SENIOR_ILP
Figure 28: Spreads on Credit Default Swaps (5 year senior bonds). Note: Author�s
calculations based on data sourced from Datastream.
45

0
400
800
1,200
1,600
2,000
2,400
2,800
I II III IV I II III IV I II III IV I II III
2007 2008 2009 2010
SUB_AIB SUB_BOISUB_ANGLO SUB_ILP
Figure 29: Spreads on Credit Default Swaps (5 year subordinated bonds). Note: Author�s
calculations based on data sourced from Datastream.
46

0
2,000
4,000
6,000
8,000
10,000
12,000
IV I II III IV I II III IV I II III IV
2007 2008 2009 2010
MFI OFI NONFINANCIAL
Figure 30: German Holdings of Irish Bank Bonds. Source: Author�s calculations based on
Bundesbank data.
47

Table 1: Net Foreign Liabilities of the Irish Banking System, 2003.1-2008.9
(1) (2) (3) (4)TOTAL DL BONDS OTHER
� 2.6 0.23 0.17 0.16(.87)*** (.30) (.09)* (.11)
NFLkt�1 0.77 0.95 0.97 0.93(.08)*** (.04)*** (.03)*** (.05)***
LIQDUM 0.33 0.68 -0.55 -0.11(.25) (.26)** (.20)*** (.12)
R2 0.73 0.90 0.94 0.83DW 2.22 2.5 1.64 2.25
Note: Irish banking system refers to the group of Irish-headquartered domestically-active
banks. NFLk refers to net foreign liabilities in category k (TOTAL, DEPOSITS/LOANS
(DL), BONDS, OTHER), scaled by total assets. ***,**,* denote signi�cance at 1, 5 and
10 percent levels respectively.
48