
THE FRESNEL LENS OPTICAL LANDING SYSTEM Leonard … · 0 NAMRL - 1323 THE RETINAL IMAGE OF' THE 1...
37
0 NAMRL - 1323 THE RETINAL IMAGE OF' THE 1 FRESNEL LENS OPTICAL LANDING SYSTEM Leonard A. Temme and William A. Monaco SOF OTIC .$---CTF, , •September 1986 L~LJ U. Approved for public release; distribution unlimited. 87 1. 2~ Q 2 • ''tkaf.2 ... ''. ."J;,,,",'.-;".-J"-" v...;-.. .. ".". i." a • . ._ . .. ". . . ".".•:".".". . • -. X...- ' .,,-." ' ,
Transcript of THE FRESNEL LENS OPTICAL LANDING SYSTEM Leonard … · 0 NAMRL - 1323 THE RETINAL IMAGE OF' THE 1...

0 NAMRL - 1323
THE RETINAL IMAGE OF' THE
1 FRESNEL LENS OPTICAL LANDING SYSTEM
Leonard A. Temme and William A. Monaco
SOF
OTIC
.$---CTF,
, •September 1986
L~LJU.
Approved for public release; distribution unlimited.
87 1. 2~ Q 2• ''tkaf.2 ... ''. ."J;,,,",'.-;".-J"-" v...;-.. .. ".". i." a • . ._ . .. ". . . ".".•:".".". . • -.
X...- ' .,,-." ' ,

- Y1W1A 1116 I _14N C r It..q W-,_ IF I Y•
SEZUR ITY LASSIFICATION OF THIS PAGE
REPORT DOCUMENTATION PAGEIa. R.PORT SECURI7Y CLASSIFICATION lb RESTRICTIVE MARKINGS
UN~CLASSIFIED_________________________
2a. SECURITY CLASSIFICATION AUTHORITY 3. DISTRIBUTION/AVAILABILITY OF REPORT
Approved for public release; distribution2b. DECLASSIFICATION / DOWNGRADING SCHEDULE unlimited.
4. PERFORMING ORGANIZATION REPORT NUMBER(S) i. MONITORING ORGANIZAT ION REPORT NUMBER(S)NAMRL - 1323
6a. NAME OF PERFORMING ORGANIZATION 6b. OFFICE SYMBOL 7a. NAME OF MONITORING ORGANIZATIONNaval Aerospace Medical (If applicable) Naval Medical Research and DevelopmentResearch Laboratory Code 23 Command (NMRDC)
6c. ADDRESS (O'ty, State, and ZIPCode) 7b. ADDRESS (City, State, and ZIP Code)
Naval Air Station Naval Medical Command, National Capital RegionS Pensacola, FL 32508-5700 Bethesda, MD 20814-50h)4
8a. NAME OF FUND)ING/SPONSORING 8b OFFICFE SYMBOL 9. PROCUREMENT INSTRUMENT IDENTIFICATION NUMBERORGANIZATION (If applicable)
NMRDC
c•. ADDRESS (City, State,and ZIP Code) 10, SOURCE OF FUNDING NUMBERS
OROGRAM PROJECT TASK WORK UNITELEMENT NO. NO NO AT ION NO.
- 63706N M0096 01 ibN57760411. TITLE (Include Security Classification)THE RETINAL IMAGE OF THE FRESNFL LENS OPTTCA'1 LANDING SYSTEM (UNCLASSIFIED)
12. PERSONAL AUTHOR(S)
Temnl;. Leonard A.. and Monaco, Williaml A.13a. TYPE OF REPORT 113b TIME COVERED 14. DATE OF REPORT (Year, Month, Day) i15" PAGE COUNTInterim - FROM TO I 1986, September 19 , 3716. SUPPLEMENTARY NOTATION
17. COSATI CODES 18 SUBJECT TERMS (Continue on reverse if necessary and identify by block number)
FIELD GROUP SUB-GROUP. Fresnel lens Geometric opticsOptical landing aids Physiological optics
( 19. ABSTRACT (Continue on reverse if necessary and identsfy by block number)".> The theory and geometry by which the Fresnel Lens O)ptical Landing 'ystem (FLOLS) provides
glideslope information to the pilot attempting a carrier landinr is described. From thetheory, geometry, and the linear spatial dimensions of the FT,(US, the imape it generates onthe retina of the pilot is calculated. S'ince the dimensions of the retinal image are a func-tion of the distance of the eye from the F.foh,, dimensions are calculated for distances of1.0, 0.5, 0.25, and 0.125 nautical miles from, the carrier ramp and at the ramp itself. Thesedimensions are also considered as a function of time in seconds to the ramp, assuming an air-
craft airspeed of 125 knots. "'he dimensions of the retinal iwage of the FlO1' vary with theFLThS position on the carrier. CalculationsI are reported for the 1155 TFXTNGT 0 N (AVT-16) and
-the UJSS KITTY HAWK (Cv-63). The retina! imire of the FTS is discussed as a visual stimulus *"" for acuity discriminations and compared to acuity ,easured ir the laboratory. The impact of
the addition of the rate descent arrows, AV\I,•', , on FT.']l visibility is discussed in terms o'the cal'iulated dimensions cf the retinal imare and known neurophysiology. i modification of
20 DISTRIBUTION /AVAILABILITY OF ABSrRACT 21 ABSTRACT SECURITY CLASSIFILf. lION
W• UNCLASSIFIED/UNLIMITED 0 SAME AS RPT C3 DTIC USERS LI'C], ]XM FIEFD
22A NAME OF RESPONSDiLE INDIVIDUAL 22b TELEPHONF (Include Area Code) 22c OFFICE SYMBOL 0" J. 0. HLouLhton, CAPT, MC4, USN (n01 )1 h52-3286 rode 00
D FORM 1473, 84 MAR 83 API editon may be used ur'' exhaultepd SECURITY CLASSIFICATION OF TH - '
All other editions are ubuete S hECURITYCLASj~JS2IFICATON ") PAGEýoz4 w ' ' 4 Offk: IKAm-W4t.4" -"
%i% %! *
S..-- .*V,. . C*-,- . .. -

I 19. ABSTRACT :
~the current FLOLS display is suggested, which would increase its visibility, gain, and
usable range.• •
//
'F~l
a'

Approved for public release; distribution unlimited.
THE RETINAL IMAGE OF THE
FRESNEL LENS OPTICAL LANDING SYSTEM
Leonard A. Temme and William A. Monaco AcCesion ForNTIS CRAWI •,DTIc TAB ••l:Unannounced tJ
Justification
...................
Distribution ( --- 'w
Availability Codes
Dist Avail and/orSpecial
Naval Medical Research and Development Command
63706N M0096.01
Reviewed by: Approved and Released by:
F. E. Guedry, Jr., Fn.D. Captain J. 0. Houghton, MF, USHChief Scientist Camyvuding Officer
19 SepteWter 1986
NAVAL AEROSP1"E ME)ICAL RESEARCH LABOMRTORYNAVAL AIR STATION
MISACOLA, FLORIDA 32508-5700
. % .y ,

SUMMARY PAGE
THE PROBLFP
The Fresnel Lens Optical Landing System (FLOLS) is the primary sourceof glideslope information to a pilot during the last mile of a nightcarrier-landing. The purpose of the present report is to define and quan-tify the spatial dimensions of the FLOLS image on the xetina of the pilotand to determine how the dimensions change with distance during the lastmile of approach. These dimensions are needed to design a stimulus in alaboratory setting to study the response of the visual system to thisstimulus display.
This report describes the theory and geometry by which the FLOLSencodes glideslope information and the spatial dimensions of the stimulusconfiguration on the retina of the pilot. Since the position of the FLOLSon the carrier is a factor that affects these dimensions, the FLOLS imageis separately calculated and reported for the USS LEXINGTON and the USSKITTY HAWK. The retinal image of the FLOLS is discussed as a visual acuitystimulus and compared to acuities reported in the literature.
FINDINGS
We conclude:
I. The retinal image a pilot uses to evaluate and control approachearly on glideslope is at the minimal limits of visual resolution atdistances beyond about 0.50 n mi. tr
2. The largest and most rapid changes in stimulus size occur withinSthe last qatrof amile from the carrier rmaot7 sfrom therap
Up to that point, stimulus size changes little, even with apprc-:iabledeviations from glideslope.
3. Because differences in carrier size aftect FLOLS position relativeto the ramp, the image presented to the pilot during the last mile of theapproach is smaller on the USS KITTY HAWK than on the USS LEXINGTON.
4. When the pilot is from 0.25 to 0.5 n mi from the carrier ramp, therange of distance between the retinal images of the meatball and the datumlines is from about 2.6 to 7.0 min of arc. Based upon known rpUinalneurophysiology, the image of the datum lines may be expected to interferewith the visibility of the meLatball image over the range of distances.
5. Retinal neurophysiology also suggests that the proposed ratedescent arrows, AVCARS, may affect the visibility of the meatball if theAVCARS array is insta led such that the distanze between its image and themeatball image is in the range fr~m 2.6 to 7.0 min of ar-.
RECOMMENDATIONS
I. The effects of the meatball datut- line distance upon meatball ,
visibility and the ability to align meatball with the datum lines should beevaluated. In this way, a distance which optimizes visibility may beidentlfied.
rii r
.. J 4 ~ ~-~ .

2. The effects of the position of the rate descent arrows, Y'ZARS,upon meatballs datum line alignments and meatball visibility should beevaluated. An optimal location in the OELS may then be identified.
3. The useful range of the FLOLS can be increased by a design altera-tion that positions the virtual image through the Fresnel lens further fromthe datum arms than the 150 ft now used. The feasibility and consequencesof this modification should be explored.
iv
V.
_.% .J.

EMTW AX- fl w w~ flnvw IV ' x
INTRODUCTION
The Fresnel Lens Optical Landing System (FLOLS) is a visual landingaid which provides the primary glideslope information to pilots attemptingcarrier landings. During the day, the pilot's evaluation of glideslope isaided by many stimuli, which are absent at night. Often, at night, theonly information available about glideslope is from the FLOLS. Nightcarrier-landing is often considered to be the most dangerous routi ) avia-tion task (3,4). From 1977 to 1982, for every major carrier mishap occur-ring during the day, eight occurred at night (6). The greater mishap -rateat night probably reflects a number of factors, including limitations inthe FLOLS itself (12). Among the limitations of the FLOLS are a lack ofrange and sensitivity; beyond a certain distance it does not provide a welldefined visual stimulus (4,6,12). The distance at which the FLOLS is ausable indicator of glideslope error in the final analysis depends upon thevision of the pilot using the FLOLS to perform the carrier landing (12).
This study was undertaken to determine the spatial dimensions of thevisual stimulus which the FLOLS provides to the pilot. This information isnecessary to design vision tests relevant to the demands of night carrierlandings. A review of the literature from 1951 to the present leads tofour conclusions: (1) the FLOLS provides the pilot a visual stimulus withwhich to monitor his deviation from glideslope but the st'.mulus requiresexcellent visual resolution (12); (2) the dimensions of the visual stimulusgenerated by the FLOLS were not available from the open literature althoughoccasion•i approximations appeared in print; (3) through the 1960's andearly 1970's, a great deal of research in visual landing aids was pub-lished; subsequently, interest in this field has declined, as reflected bythe small number of later reports; (4) the technical literature contains norecent discussion of the physiological optics or the psychophysical demandsof the visual stimulus to which the pilot attends.
The present report defines the spatial dimensions of the relevantaspects of the FLOLS-generated stimulus on the retina of the pilot per-forming a night carrier-landing. Different carriers present the pilot withdifferent stimulus configurations depending upon the position of the FLOLSrelative to the ramp and center line. Two carriers are discussed in thetext, the USS LEXINGTON (AVT-16) and the USS KITTY HAWK (CV-63).
FLOLS GEOMETRY
For the purposes of the present analysis, the FLOLS is composed ofthree p.irts: the Fresnel lens assemblies, which are a bank of five indi-cator lights mounted one above the other; and two horizontal arms oflights, one on either side of the bank of the Fresnel assemblies0 Thisconfiguration and its spatial dimensions are shown in Figure 1. The twohorizontal arms of lights produce the datum lines. The bank of fiveFresnel lens assemblies produces a narrow horizontal bar of light commonlycalled the meatball. The optics of the Fresnel system causes the meatballto act as if projected from a source 150 ft behind the assembly. Since theFLOLS faces the rear of the carrier, the virtual image appears to be 150 ftforward of the assembly. To the pilot of the, approaching aircraft, themeatball on t'.e face of the Fresnel indicator lamp assemblies anpears tomove smoothly up or down the face of the lamp assembly as the aircraftdeviates from glideslope. When the aircraft is on glideslope, the meatball
. %, ,•. -

appears to be on the same line as the horizontal datum lines on either sideof it. When the aircraft is above glideslope, the meatball appears on theface of the indicator assemblies to be above the horizontal of the datumlines. When the aircraft is below glidescope, the meatball appears on theface of the indicator assemblies to be below the horizu.,tal of the datumlines. The FLOLS, therefore, encodes deviations of the aircraft fromglideslope as deviations of the meatball fr(im the horizontal of the datumlines. The geometry of this relationship is diagrammed in Figure 2.
For purposes of the present di'icussion, the standard 3.50 glideslopeis assumed; however, for ease of illustration, the glideslope is exagger-ated in Figure 2. The virtual image of the meatball is at the intersectionof the 3.50 glideslope with the vertical plane 150 ft forward of the datumlines. The virtual image is below the horizontal plane of the datum lines.The case of the aircraft above glideslope is demonstrated in Figure 2.Angle "e," which is made by the meatball, the pilot's eye, and the datumlines, is the aspect of the visual display that the pilot uses to judge theapproach relative to glideslope.
The size of angle "e" depends upon the magnitude of the deviation fromglideslope, the distance of the pilot's eye from the FLOLS, and the dis-tance of the virtual image from the datum arms. This last parameter is aconstant for all FLOLS now in use.
The trigonometric relationships of the FLOLS and the approachingaviator's view are shown in Figure 3. The ramp of the carrier is indicatedby A; FLOLS location on the side of the carrier deck is B. Location C isbehind the carrier directly below the pilot's eye in the aircraft. TheFLOLS virtual image is at D, 150 ft forward of the FLOLS and below thehorizontal plane of the datum lines by the amount determined by glideslopeangle. Distance A-B depends upon the particular carrier installation;distance A-C is the distance the perpendicular below the aircraft is behindthe carrier. For the present analysis, distance A-C is assigned values of1.0, 0.5, 0.25, 0.125, and 0 n mi. The location of the aircraft is P; Q ksthe intersection of the glideslope with the perpendicular from aircraft P;R is the intersection of the pe'ýgendicular from aircraft P with the level%of the ramp. Distance Q-R is the height a point on glideslope is above thelevel of the deck. Distance P-Q is the deviation from the 3.50 glideslopewhich, for each of the distances behind the carrier ramp, is assigned avalue of 5, 10, 15, 20, 25, and 30 ft. Angle "e," the aspect of the visualdi-play upon which the pilot judges the approachi relative to glidepath, isthe arithmetic difference between angles "a" and 'b:' Angle "a" is formedby BPR, and angle "b" is formed by DPC.
in addition to determining •he angular subtense of the meatball-datumline disparity on the pilot's retina, a number of other stimulus parametersof the FLOLS display were calculated. The length of the datum arm, dis-tance between dLitum lights, size of datum lights, distance between themeatball and the datum arm, the size o. the meatball, and the distance thewhole FLOLS display is from the carrier centerline are presented here ioterms of visual angle.
2
% PIZ'ý 'ý ýZý%V F

THE RETINAL STIMULUS
The anr'cuar subtense on tne pilot's retina of the deviation of themeatball above or below the horizontal datum lines is shown in Figure 4 asa function of the distance the aircraft is behind the ramp of the USSLEXINGTON (AVT-16). This angular subtense, in minutes of arc, is theaspect of the stimulus display that provides glideslope information to thepilot, angle "e." The subtense of angle "e" was calculated for six dif-ferent deviations from glideslope, at 5-ft increments from 5 to 30 ft; eachwas plotted as a different curve. The size of the retinal image is thesame for deviations above or below glideslope.
The horizontal axis at the top of Figure 4 represents the time inseconds to the ramp, from 1.0 n mi behind the ramp, assuming a closingairspeed of 125 knots. For a deviation of as much as 30 ft from glide-slope, the size of the visual stimulus increases from seconds of visualangle at a distance of 1.0 n mi to less than 5 min of arc at a distanceof 0.25 n mi, which is 7 s approach time to the ramp. The figure shows,therefore, that the cues to which the pilot is attending early on theglideslope are or. the order of seconds of arc and that the size of thestimulus increases very little from 1.0 to 0.25 n mi. During the 3.5 sfrom 0.25 n mi to 0.125 n mi from the ramp, the stimulus increases morethan it increases during the first three-quarters of the approach. Duringthe last 0.125 n mi, or 3.5 s of the approach, the visual angle increasesfrom 11 to 78.4 min of arc. Data in this figure lead to three generalconclusions: Firstly, an angular deviation of the meatball from the datumline by a given amount indicates different amounts of deviations fromglideslope depending upon the distance of the aircraft from the FLOLS.Secondly, the stimulus sizes with which the pilot evaluates deviationsearly on glideslope are of dimensions that are at the minimal limits ofvisual resolution. Thirdly, the greatest changes in stimulus size occurrapidly and late on glideslope where corrections generally cannot salvage apoorly begun approach.
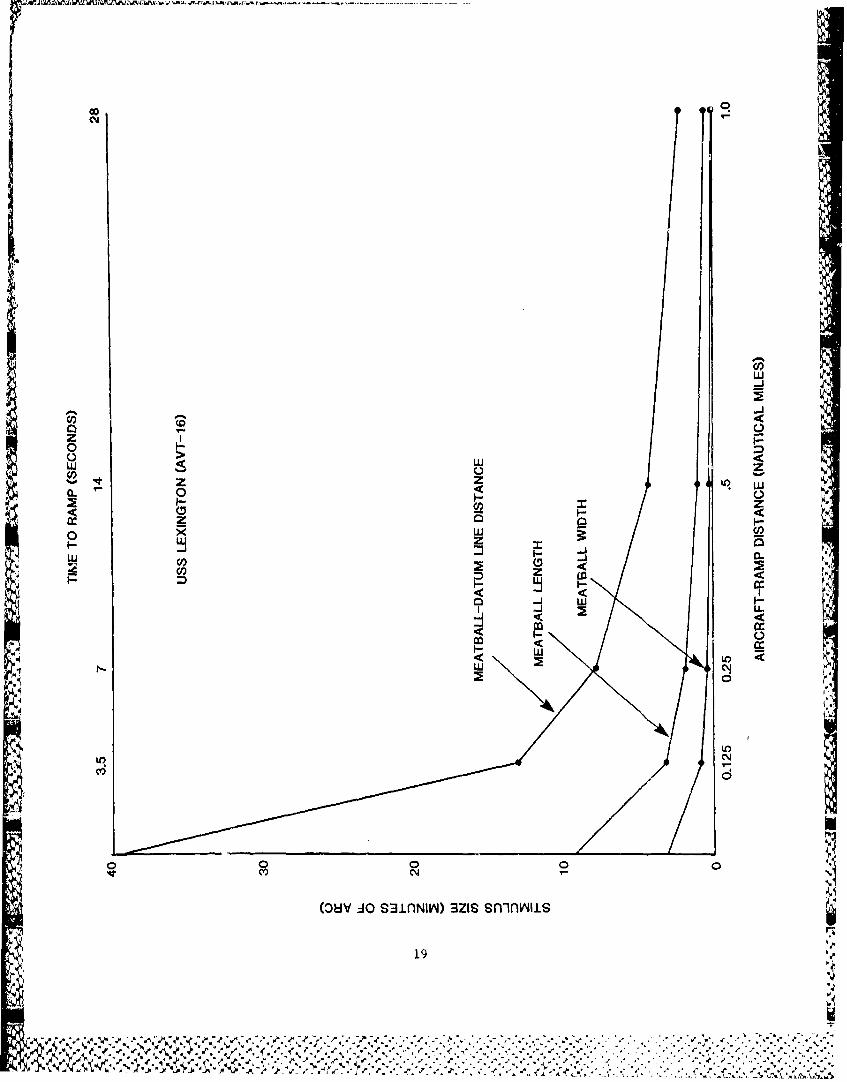
As a function of the distance from the ramp, Vigure 5 shows the lengthand width of the meatball and the distance between the meatball and thedatum lines when they are aligned, that is with 0 error in glideslope.Tnese functions hain the same characteristics as those of the previousfigure. The distance on the ret 4na between the images of the meatball andthe dat,.nm line increases from about 2.25 min of arc at 1.0 n mi to about 13min of arc at 0.125 n n'i. Figure 6 depicts the thickness and the length of"Lhe retinal image of the datum line as a function of the distance from theramp up to 1.0 1 mi.
The FLOLS is laterally displaced from the carrier lanJing deck centerline by an amount characteristic of the carrier. The angle subtended bythe distance between the center line and the FLOLS is plotted in Figure 7as a function of the distance behind the ramp. At 1.0 n mi, the FLOLS isalmost 10 from the center lineý at 0.5 n mi it is 1.80; at 0.25 n rri it is3.250; and at 0.125 n mi it is about 5.50 from center; while at th? ramp itis about 160 from center.
Figures 8 through 11 depict the results of comparable calculations forthe USS KITTY HAWK (CV-63). Differences between the USS KITTY HAWK and theUSS LEXING; JN are becaur-ý the FLOLS is placed on the USS KITTY HAWK 127 ft
3

further from the ramp than on the USS LEXINGTON. Consequently, the stim-ulus display generated by the FLOLS is smaller on the USS KITTY HAWK thanon the USS LEXINGTON. Figure 8 shows the angular deviations of the meat-ball from the datum line as a function of the distance in nautical milesthe aircraft is behind the ramp. These have been calculated for glideslopedeviations of from 5 to 30 ft in 5-ft increments. Note that the scale ofthe ordinate in this figure is the same as that of Figure 4 in whichcomparable results from the USS LEXINGTON are shown. The relationshipbetween aircraft-ramp distance and the size of the visual angle is, ingeneral, the same as shown in Figure 4 except that the visual stimulus issmaller. The visual angles subtended on the pilot's retina of meatballwidth, length, and its distance from the datum lines in the absence ofglideslope error are shown in Figure 9. Figure 10 shows datum line thick-ness and length. Figure 11 shows the angular subtense on the retina ofFLOLS displacement from the carrier center line.
DISCUS•SION
These stimulus dimensions are needed to generate a comparable stimulusdisplay in the laboratory to study the role of such visual factors asacuity, accommodation1 , night vision, etc., for night carrier landings.Several points should 'be made about visual acuity and the calculated dimen-sions of the FLOLS-generated visual stimulus. Normal best-corrected cen-tral acuity under daylight conditions is nominally described as the abilityto resolve one minute of arc on the retina or 20/20 (2). The angulardeviation in minutes arc of the meatball image from the horizontal datumline is presented in Table I. These deviations are shown for a range of
TABLE I
Minutes of ARC deviation of the meatball from the horizontal of the datumlines for the USS LEXINGTON.
DEVIATION FROM GLIDESLOPE (FEET)
5 19 15 20 25 30DISTANCE BEHIND RAMP
(nautical miles)
1.0 0.055 0.115 0.175 0.235 0.295 0.356
0.5 0.200 0.411 0.622 0.833 1.043 1.253
0.25 0. 6,* 1.306 1.986 2.629 3.289 3.949
0.125 1.730 3.488 5.243 6.995 8.749 10.492
0 12.939 25.900 38.800 51.621 64.368 77.025
4
r Wk:l

distances up to 1 n mi from the ramp of the USS LEXINGTON for glideslopeerrors of 5 to 30 ft (also, see Fig. 4). Table I is divided by a lineabove which are the viewing conditions requiring an acuity greater than20/20 to resolve the vertical deviations of the meatball from the datumline horizontal. This line could be considered to reflect the limits ofthe average useful range of the FLO:LS for normal daytime central vision.
The standard 1 min of arc visual resolution is a generalization from aparticular type of acuity measurement with a stimulus designed for clinicalpurposes. Spatial resolution is determined by a number of stimulus param-eters including spatial configuration, luminance, and the retinal locusstimulated (5'. Each of these is an important determinant of the visi-bility of "he FLOLS image.
Th. Lmulus configurations used to study acuity in the laboratorydif'er 1: those generated by the FLOLS. The alignment of the meatballbetween 1,A two datum lines requires a visual judgment different from adiscrimination of letters on a standard acuity chart or the identificationof the location of the gap in the standard Landolt C stimulus. Meatballalignient may be more closely related to a test of vernier acuity, which inthe laboratory results in much finer acuities then the letter-type acuities(15). Studies of vernier acuity in the laboratory have used stimuli re-quiring the alignment of two points or two adjacent line segments, but theFLOLS requires the alignment of a point between two horizontal lines. Thehorizontal orientation of the FLOtS is likely to be a significant determi-nant of spatial vision since central visual acuity is greater for verticalthan for horizontal targets (1). Furthermore, the separation distancebetween the meatball and the two datum lines on either side of it is likelyto be a significant factor limiting acuity. This hypothesis is derivedfrom a number of studies in which retinal sensitivity as well as acuitywere altered by the proximity of elements in the visual display (14,16).For example, a study of vernier acuity with vertical bar stimuli showed
that the presence of flanking lines degraded acuity' when the flanking lineswere from 2.5 to 7.5 min of arc away from the acuity stimuli. Closer than2.5 and further than 7.5 min of arc, the flanking bars had no effect uponacuity (15). Inspection of Table I shows that the range from 2.5 to 7.5min of arc covers a large part of the most important range of the FLOLS.This effect upon vernier acuity is most likely a consequence of the neuro-physiological characteristics of retinal neuronal processing and not simplysome effect that could be overcome by a change in observer attitude orattention. This last point suggests that the distance between the datumline and the meatball is a factor determining how well the alignment of the
meatbaLl with the datum lines can be seen and that there is an idealseparation that could optimize visibility over the most critical range ofthe approach. If the measurements of vernier acuity cited above are usedas a guide, then the distance between meatball and datum lines should be noless than 7.b min of arc. 'This is an extrapolation from data obtained withstimulus conditions vastly different from those of the operational env'ron-ment and needs a thorough empirical validation. .
The hypothesized dependence of meatball alignment upon meatball-datumline separation is relevant to the current plans of the Navy to modify theFLOLS by adding AVCARS. These are two sets of additional lights to beplaced above and below the horizontal of the datum line. The AVCARS systemis designed to supply the pilot with information about the speed at which
5

the aircraft is moving toward or away from glideslope. It does not provileinformation already directly available from meatball-datum line displ ace-ment, but it does add information to the FLOLS display about the rate atwhich the aircraft is moving perpendicular to glideslope. At the presenttime, AVCARS has not been implemented.
The effectiveness of AVCARS was established in a set of studies ofnight carrier-landings conducted with a simulator (7,10). For these tests,the two sets of AVCARS vertical rate lights were positioned on either sideof the meatball, between it and the datum lines. Based on the visionscience literature (16), the placement of the AVCARS in this position maydecrease the visibility of the meatball-datum line alignment. Conse-quently, other positions for the AVCARS rate lights should be considered.This issue needs further clarification, preferably before the installationof AVCARS.
Meatball-datum line visibility during night carrier-landings is likelyto be affected by "dark focus" (8,11). As the visual environment becomespoorer (provides fewer or degraded visual stimuli), the accommodativemechanism(s) of the eye tend toward some intermediate resting level. Theliterature reports an average dark focus value of about 1.5 diopters ofmyopia for U. S. Air Force recruits and college students (9,13). Approxi-mate expected Snellen acuity can be calculated for various amounts ofmyopia, and for 1.0 diopters of myopia, an acuity of from 2.5 to 4.0 min ofarc can be expected in the normal population. Dark focus may therefore bean important factor affecting an individual's ability to land an aircraftat night.
The above discussion has focused upon a number of visual factors thatcould affect the spatial resolution of the pilot. Glideslope informationin the FLCLS derives from the fact that the virtual image of the indicatorlight is at a point 150 ft behind the datum arms. If the virtual image isdesigned to be further than 151l ft forward of the datum arms, then the
FLOLS display would generate a larger signal to the pilot for a given errorin giideslope. in effect, positioning the virtual image more than 150 ftforward of the datum arms increases the gain of the error signal of theFLOLS. The visual angle between the meatball and the datum lines wasrecalculated with the virtual image of the meatball at 200 ft from thedatum lines. With this change in the stimulus display, there is an in-creased error signal generated on the pilot's retina for a given glideslopedeviation. For example, at 1.0 n mi from the ramp of the USS KITTY HAWK,the signal generated for a given amount of glideslope error is 25% largerthan the signal as it is now generated. At the ramp, the proposed modifi-cation will result in a 20% larger signal. This modification might thentesult in improved boarding rates and pilot safety during night carrier-landings. The feasibility and consequences of this modification should beexplored.
6
I,:;y ,. . ,.• . , , . ;.. .. ,.-,.,.,. . . •> .... -. I .,.+ . ..2 , • . , . 2.• ., .• • .:%• , ..• ,•. •

WONCLUSIONS
1. The retinal image a pilot uses to evaluate and control approachearly on glideslope is at the minimal limits of visual resolution atdistances beyond about 0.50 n mi.
2. The larqest and most rapid changes in stimulus size occur withinthe last quartei of a mile from the carrier ramp, about 7 s from the ramp.Up to that point, stimulus size changes little, even with appreciabledeviations frcxn glideslope.
3. Because differences in carrier size affect FLOLS position relativeto the ramp, the image presented to the pilot during the last mile of theapproach is smaller on the USS KITTY HAWK than on the USS LEXINGTON.
4. When the pilot is from 0.25 to 0.5 n mi from the carrier ramp, therange of distance between the retinal images of the meatball and the datumlines is prom about 2.6 to 7.0 min of arc. Based upon known retinalneuro]-hysiology, the image of the datum lines may be expected to interferewith the visibility of the meatball image over the range of distances.
5. Retinal neurophysiology also suggests that the proposed ratedescent arrowsc AVCAR', may affect the visibility of the meatball if the
AVCARS array is installed such that the distance between its image and themeatball image is in the range from 2.6 to 7.0 min of arc.
RFOOMMENATIONS
1. The effects of the meatball datum line distance upon meatballvisibility and the ability to align meatball with the datum lines should beevaluated. In this way, a distance which optimizes visibility may beidentifial.
2. The effects of the position of the rate descent arrows, AVCARS,upon meatballs datum line a'Aigrients and meatball visibility should beevaluated. An optimal location in the FLOLS may then be identified.
3. The useful range of the FLOLS can be increased by a design altera-tion that positions the virtual image through the Fresnel lens further fromthe datum arms than the 150 ft now used. The feasibility and consequencesof this modification should be explored.
II
7y % %

REFER~ENES
1. Appelle, S. 1982. Perception and discrimination as a function ofstimulus orientation: The oblique effect in man and animals.Psychological Bulletin 78:266-278.
2. Borish, I. M. 1970. Clinical Refraction. Chicago, IL: TheProfessional Press, pp. 345-422.
3. Brictson, C. A. 1966. Measures of pilot performance: Comparativeanalysis of day and night carrier recoveries. DynLad and Associates,Inc., AD 636433, ONR Contract NONR 4984.
4. Durand, T. S. 1967. Carrier landing analyses. ST1 TechnicalReport 137-2. Systems Technology, Inc., Hawthorne, CA.
5. Graham, C. H. (Editor). 1965. Vision and Visual Performance.New York: Wiley, p. 637.
6. Holt, P., and Carver, E. 1984. Study of functional requirements forvisual landing aids. NAEC 91-8052. Lakehurst, N.J.: Naval AirEngineering Center.
7. Kaul, C. E., Collyer, S. C., and Linter, G. 1980. Glideslopedescent-rate cuing to aid carrier landing. NAVTRAEQUIPCEN IH-322.Orlando, FL: Naval Training Equipment Center.
8. LeiV.owitz, H. W., and Owens, D. A. 1975. Anamolous myopias and theintermediate dark focus of accommc3ation. Science 189:646-648.
9. Leibowitz, H. W, and Owens, D. A. 1979. New evidence for theintermediate position of relaxed accommodation. WocumentaOphthalmologica 46:133-147.
10. Lintern, G., Kaul, C. E., and Collyer, S. C. 1984. Glideslopedescent-rate cuing to aid carrier landings. Human Factors 26:667-
11. Owens, D. A. 1984. The resting state of the eye. AmericanScientist 72:378-387.
12. Perry, B. L. 1967. Optical guidance systems: Analysis design, anddevelopment on night carrier landings. NFL Report 6581, NavalResearch Laboratory, Washington, DC.at
13. Simonell, N. M. 1979. The dark focus of visual accommodation: itsexistence, its measurement, its effects. Technical Report BEL-79-3/AFOSR-79-7, Behavioral Engineering Laboratory, New Mexico StateUniversity, Las Cruces, NM.
14. Westheimer, G. 1967. Spatial interaction in human cone vision.Journal of Physiology (Cambridge) 190:139-154.
15. Westheimer, G., and Hauske, G. 1975. Temporal and spatial inter-ference with vernier acuity. vision Research, 15:1137-1141.
8
A % %

I- i~ S N4 --
I16. Wescheimer, C. 1979. The spatial sense of the eye. Investi-
Sgative Ophthalmology and Visual Science 18:893-911.K
hii4
It
'41 4

0
10
4,0
0i
4.".

0m
Clil w
wCY)
zww
"0~C*44
0

-odi
t)
"44
" El
.412
"-wd

CC00
0
0 -
00
ILM0. 0
o 0.4 -1 9
11
o wJzwI
w'
> 0C.
wxw
0 w
v-7..

4)Wd rA0 #
0 60
4 'o
41 4
"" W
144
to 0
~14

I
,CL
.00
0
Ic
w0L
C',O
150,,,,,I
15

44 10 4 iii0
044
"0~44 44*
to 0U 0P
4)pf 4) co
0 0 ..0
*4 Ow
16 S
"4 k
~ .. 9.-~ -, 0 ~v ~.Qj (0 la.

c'J
0 I(0 v0
w 0
0
o 0 I0
/: 00'Ir.U) U.1
'-9L
ci0
00 ---------
(DJ O S3.nmy4) X1ONV 3Nn1 vflivo-1rvs6vy
17

fA F-4
-4 43
h4
18
14 -. A
CC',
0w
-A-
- (0
z I I-
iz z0. 0 w
I-LC 0) 0.
z 0 oo x P
Z L
-JN
0 -I W
Cf- 0
M 4W

411'44
.4 .4 U) a
0 0d0-4-
20
~~AL
-% -
%. % ~~-

ivyr N 2 ALW .M. n
aD.CM;
CO)
bK/
* S O
< LII
zz
4-1
Ui C~ U
* ~21
(0I PO -ANlIVJ NZSSlf~l

oil
4,44
(0 4
3 vO
to ta u~s
22 4

ww
0 w
w L-
0
J. Y . ZI

- -- . 'r w-n;rtrTTFJVIWJ rc~vf~r~ ~Ar~rv~&u44Al
4440~0
E1I44 4
hi 4-W
Goo60 44
LM 0 0
4"14
24 t
to f-4 w
P7t<>-4N8 • to' ',44~ W~.¾

00
co 41w c wa.a
CO Cm
ww zz
0.0
z0 0 a.
wlwCC.)
14:
C'14
(3OdV :30 S31nlNIVO) 31E)NV 3N11 vi~nflVG-*11V81V3V4
25

44 44 ,
A 10
d~ C6 a
r~ *i
44:~'M (A 4U44 to44 "IIL
26 ow
44 g -

I It
V) w
0CLU
zz
0 ow.
0~ 0
iU
LU
(0V:1 31NV WIS s-in i
LU Co .~27

,Ufr~w-kla-rT 1 WI WV r W1 P{V¶bfl )CmA1LKf
inr4V
A11X'44
44y
144IQ 4
28

00I w-I01 0
0w a.
00
IC4
I- 0
Cff
I It
(Da, Ao ICnI0 I n-n
29z

I4)
0
447
30

0
wICi
z
0 (
w
CC,
4 0 4
04
Ct)M
(08V 40 S33U03G) 30NViSI0 3NI-1831N30-SIOI-
31