THE FOSCHINI GROUP LIMITED RESULTS PRESENTATION · • Phase Eight 542 outlets and Whistles 121...
32
THE FOSCHINI GROUP LIMITED RESULTS PRESENTATION FOR THE YEAR ENDED 31 MARCH 2016
Transcript of THE FOSCHINI GROUP LIMITED RESULTS PRESENTATION · • Phase Eight 542 outlets and Whistles 121...

THE FOSCHINI GROUP LIMITEDRESULTS PRESENTATION
FOR THE YEAR ENDED 31 MARCH 2016


TFG | MARCH 2016 RESULTS PRESENTATION 1
TFG RESULTS PRESENTATION FOR THE YEAR ENDED 31 MARCH 2016
2
− Economy and retail environment Doug Murray
− Business overview Doug Murray
− Review of the year Doug Murray
− Financial review Anthony Thunström
− TFG Financial Services Jane Fisher
− International expansion Doug Murray
− Key performance indicators Doug Murray
− Outlook Doug Murray
AGENDA
RESULTS PRESENTATION FOR THE YEAR ENDED 31 MARCH 2016

TFG | MARCH 2016 RESULTS PRESENTATION2
TFG RESULTS PRESENTATION FOR THE YEAR ENDED 31 MARCH 2016
4
GLOBAL ECONOMY REMAINS UNCERTAIN
− Brexit − US elections and economy − Concerns remain with regards to the Chinese economy
DOMESTIC ECONOMY
− Outlook for consumer spending a concern – impact of: • Rising inflation • Interest rate hikes • Unemployment • Low consumer confidence
− Political uncertainty − Rand extremely volatile − Threat of ratings downgrade − Increase in CPI during 2nd half of our financial year
• 6,6% at end March 2016 vs 4,6% at end September 2015 • Potentially above target range until mid 2017
− GDP growth outlook for 2016 at 0,4% (BER) • Outlook for 2017 at 1,3% (BER)
THE ECONOMY AND RETAIL ENVIRONMENT
ECONOMY AND RETAIL ENVIRONMENT

TFG | MARCH 2016 RESULTS PRESENTATION 3
TFG RESULTS PRESENTATION FOR THE YEAR ENDED 31 MARCH 2016
6
TRADING ENVIRONMENT
Source of graphs: BER Economic Snapshot May 2016
TFG RESULTS PRESENTATION FOR THE YEAR ENDED 31 MARCH 2016
5
TRADING ENVIRONMENT
Source of graphs: BER Economic Snapshot May 2016
TFG | MARCH 2016 RESULTS PRESENTATION4
TFG RESULTS PRESENTATION FOR THE YEAR ENDED 31 MARCH 2016
8
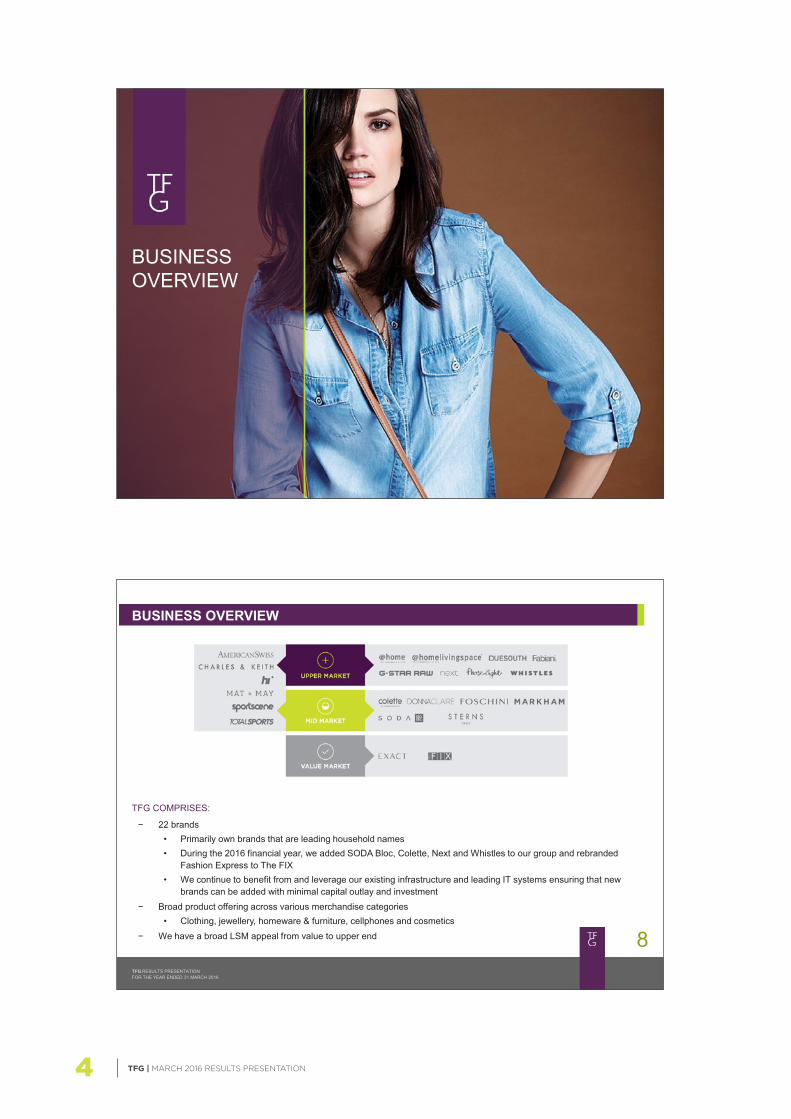
BUSINESS OVERVIEW
TFG COMPRISES:
− 22 brands • Primarily own brands that are leading household names • During the 2016 financial year, we added SODA Bloc, Colette, Next and Whistles to our group and rebranded
Fashion Express to The FIX • We continue to benefit from and leverage our existing infrastructure and leading IT systems ensuring that new
brands can be added with minimal capital outlay and investment − Broad product offering across various merchandise categories
• Clothing, jewellery, homeware & furniture, cellphones and cosmetics − We have a broad LSM appeal from value to upper end
BUSINESS OVERVIEW
TFG | MARCH 2016 RESULTS PRESENTATION 5
TFG RESULTS PRESENTATION FOR THE YEAR ENDED 31 MARCH 2016
10
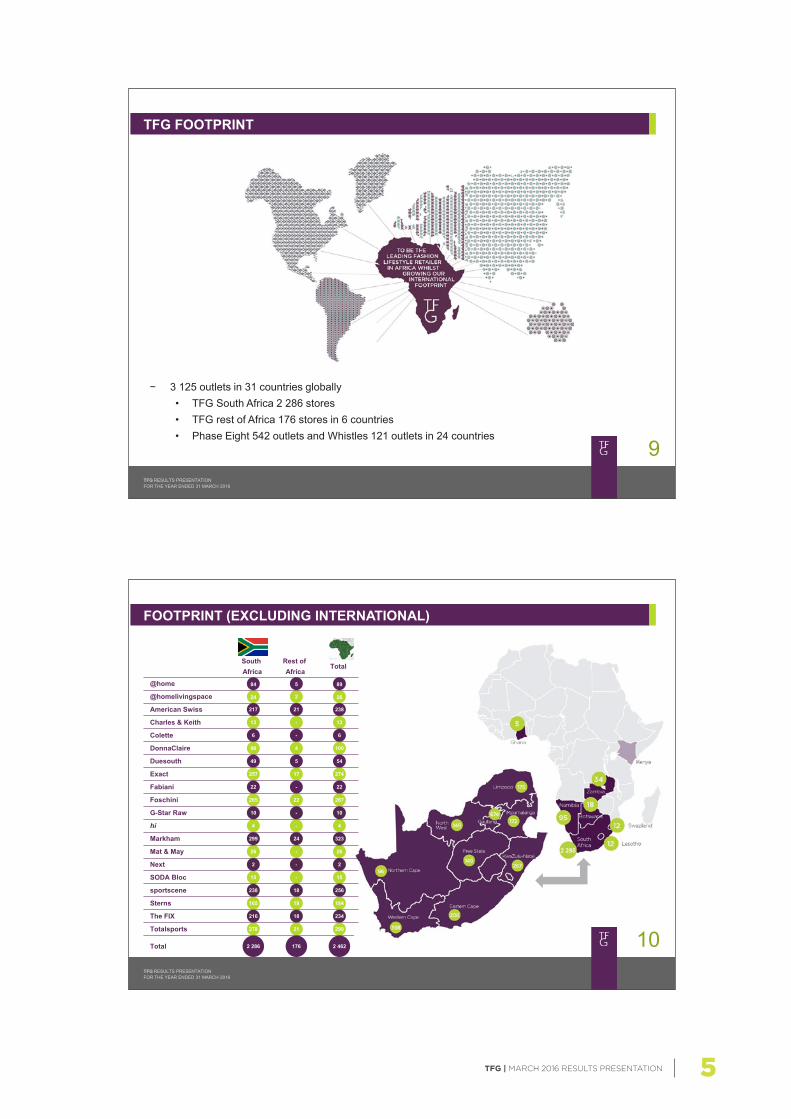
FOOTPRINT (EXCLUDING INTERNATIONAL)
South Africa
84
Rest of Africa
Total
24
217
13
6
96
49
257
22
216
265
10
4
299
26
2
15
238
165
278
2 286
@home
@homelivingspace
American Swiss
Charles & Keith
Colette
DonnaClaire
Duesouth
Exact
Fabiani
The FIX
Foschini
G-Star Raw
hi
Markham
Mat & May
Next
SODA Bloc
sportscene
Sterns
Totalsports
Total
5
2
21
-
-
4
5
17
-
18
22
-
-
24
-
-
-
18
19
21
176
89
26
238
13
6
100
54
274
22
234
287
10
4
323
26
2
15
256
184
299
2 462
TFG RESULTS PRESENTATION FOR THE YEAR ENDED 31 MARCH 2016
9
TFG FOOTPRINT
− 3 125 outlets in 31 countries globally • TFG South Africa 2 286 stores • TFG rest of Africa 176 stores in 6 countries • Phase Eight 542 outlets and Whistles 121 outlets in 24 countries

TFG | MARCH 2016 RESULTS PRESENTATION6
TFG RESULTS PRESENTATION FOR THE YEAR ENDED 31 MARCH 2016
12
FOOTPRINT: INTERNATIONAL
Germany
Switzerland
Bahrain
Kuwait
Qatar
Singapore
Sweden
United Arab Emirates
Australia
Belgium
Hong Kong
Mexico
154
322
Malaysia
Netherlands
Norway
Saudi Arabia
USA UK & Ireland
Italy*
Japan*
Latvia*
Estonia*
Stores Concessions Total outlets
476
2
12
-
-
-
-
1
-
-
-
-
-
-
2
-
-
-
1
-
-
-
39 41
32 44
1
1
2
1
1
1
2
6
8
8
4
1
1
2
1
6
9
8
4
1
13
8
-
12
7
16
4
7
16
4
4
12
1
13
1
8
1
1
* New countries for 2016 financial year
France * -
2 2
TFG RESULTS PRESENTATION FOR THE YEAR ENDED 31 MARCH 2016
11
− All stores in rest of Africa are corporate stores − Rest of Africa 176 stores in 6 countries
• 31 stores opened during the year − 16,6% turnover growth
• Excluding Namibia, 31,6% turnover growth with 14,6% same store turnover growth
− Namibia impacted by: • Angolan oil-dependent economy slump
− Further expansion • Kenya (2017)
− Target for 2021: approximately 330 stores
FOOTPRINT: REST OF AFRICA
TFG | MARCH 2016 RESULTS PRESENTATION 7
TFG RESULTS PRESENTATION FOR THE YEAR ENDED 31 MARCH 2016
14
TURNOVER: MERCHANDISE CATEGORY CONTRIBUTION
Clothing & footwear - Sport
18,8%
Clothing & footwear - Phase Eight 17,1%
Clothing & footwear - Value
11,0%
7,0% Jewellery
7,9% Cellphones
6,4% Homeware &
furniture
5,2% Cosmetics
73,5% Clothing and footwear
Clothing & footwear – Fashion 26,6%
TFG RESULTS PRESENTATION FOR THE YEAR ENDED 31 MARCH 2016
13
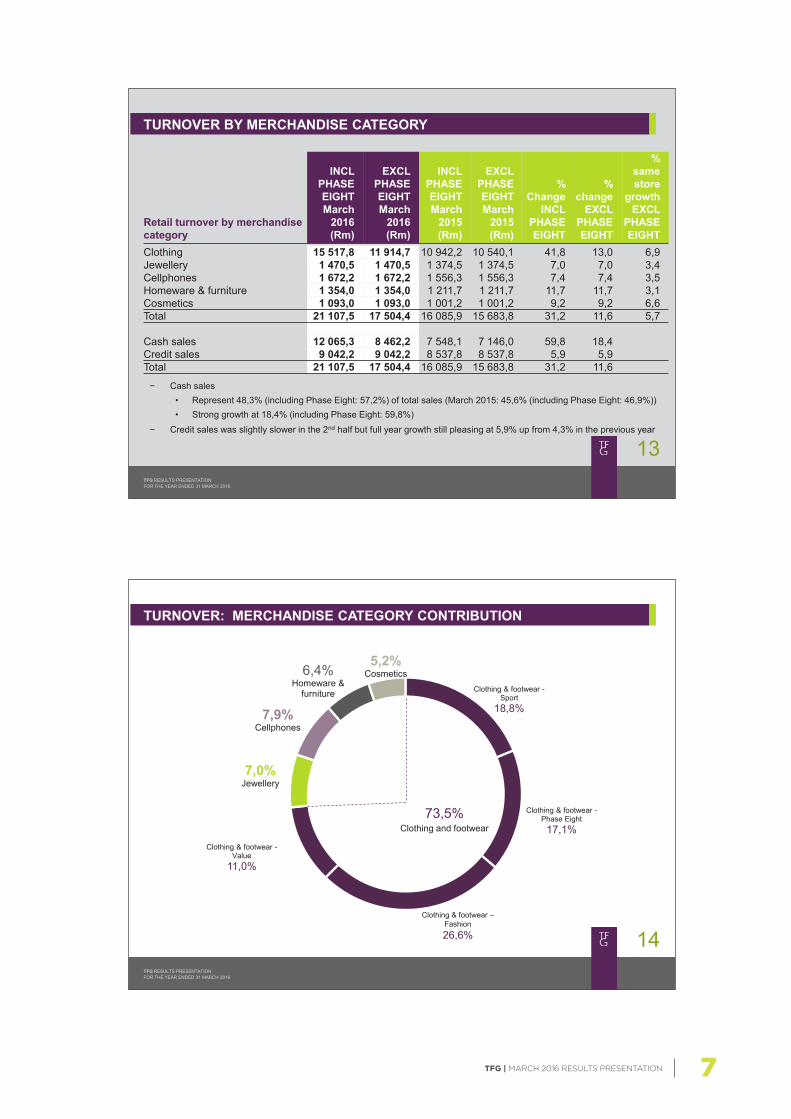
− Cash sales • Represent 48,3% (including Phase Eight: 57,2%) of total sales (March 2015: 45,6% (including Phase Eight: 46,9%)) • Strong growth at 18,4% (including Phase Eight: 59,8%)
− Credit sales was slightly slower in the 2nd half but full year growth still pleasing at 5,9% up from 4,3% in the previous year
TURNOVER BY MERCHANDISE CATEGORY
Retail turnover by merchandise category
INCL PHASE EIGHT March
2016 (Rm)
EXCL PHASE EIGHT March
2016 (Rm)
INCL PHASE EIGHT March
2015 (Rm)
EXCL PHASE EIGHT March
2015 (Rm)
% Change
INCL PHASE EIGHT
% change
EXCL PHASE EIGHT
% same store
growth EXCL
PHASE EIGHT
Clothing 15 517,8 11 914,7 10 942,2 10 540,1 41,8 13,0 6,9 Jewellery 1 470,5 1 470,5 1 374,5 1 374,5 7,0 7,0 3,4 Cellphones 1 672,2 1 672,2 1 556,3 1 556,3 7,4 7,4 3,5 Homeware & furniture 1 354,0 1 354,0 1 211,7 1 211,7 11,7 11,7 3,1 Cosmetics 1 093,0 1 093,0 1 001,2 1 001,2 9,2 9,2 6,6 Total 21 107,5 17 504,4 16 085,9 15 683,8 31,2 11,6 5,7
Cash sales 12 065,3 8 462,2 7 548,1 7 146,0 59,8 18,4 Credit sales 9 042,2 9 042,2 8 537,8 8 537,8 5,9 5,9 Total 21 107,5 17 504,4 16 085,9 15 683,8 31,2 11,6

TFG | MARCH 2016 RESULTS PRESENTATION8
REVIEW OF THE YEAR
TFG RESULTS PRESENTATION FOR THE YEAR ENDED 31 MARCH 2016
15
CASH VS CREDIT TURNOVER GROWTH (EXCLUDING PHASE EIGHT)
EXCLUDING PHASE EIGHT
15.8
%
20.6
%
18.4
%
19.6
%
6.8%
5.1%
5.9%
4.3%
0.0%
5.0%
10.0%
15.0%
20.0%
25.0%
April 2015 - Sept 2015 Oct 2015 - March 2016 FY 2016 FY 2015
Gro
wth
in s
ales
(%)
GROWTH IN CASH SALES GROWTH IN CREDIT SALES
10,8% 12,3% 11,6% 10,8%

TFG | MARCH 2016 RESULTS PRESENTATION 9
TFG RESULTS PRESENTATION FOR THE YEAR ENDED 31 MARCH 2016
18
MARCH 2016: SALIENT FEATURES
Retail turnover R21,1 bn
Retail turnover growth +31,2%
Gross margin 49,7%
Net bad debt / closing debtors’ book 13,4%
ROE 23,9%
Debt / equity – recourse 55,6%
Debt / equity - total 73,5%
TFG RESULTS PRESENTATION FOR THE YEAR ENDED 31 MARCH 2016
17
CHANGES IN GROUP STRUCTURE DURING THE YEAR
• Phase Eight: 12 months’ trading included (acquired January 2015) • Acquired franchise rights for Colette and Next • Launched SODA Bloc • Rebranded Fashion Express to The FIX • Acquired Whistles in March 2016
CHANGES IN E-COMMERCE
• Launched Sports division online selling during the year (sportscene, Totalsports and Duesouth)
CHANGES IN LEGISLATION AND OPERATING ENVIRONMENT
• Affordability Regulations mid September 2015
CHANGES IN INTEREST RATE ENVIRONMENT
• Repo rate increases in July 2015 (25 bps), November 2015 (25 bps), January 2016 (50bps) and March 2016 (25bps)
REVIEW OF THE YEAR
TFG | MARCH 2016 RESULTS PRESENTATION10
FINANCIAL REVIEW
TFG RESULTS PRESENTATION FOR THE YEAR ENDED 31 MARCH 2016
19
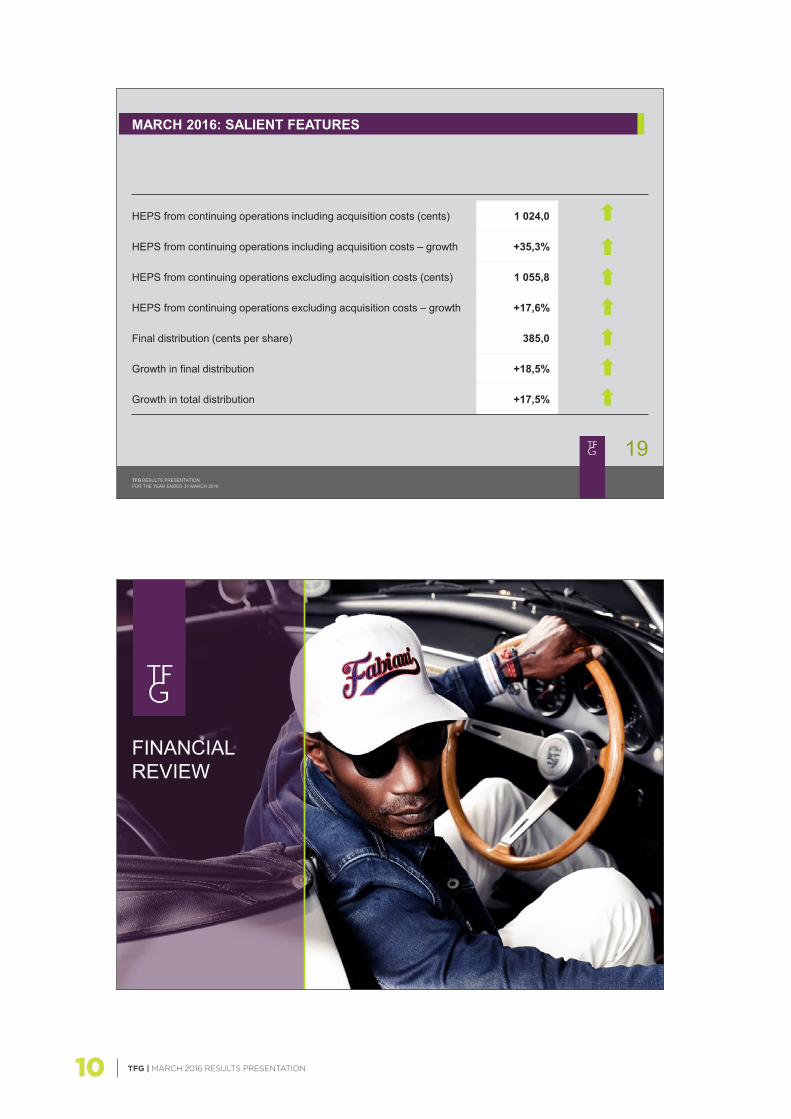
MARCH 2016: SALIENT FEATURES
HEPS from continuing operations including acquisition costs (cents) 1 024,0
HEPS from continuing operations including acquisition costs – growth +35,3%
HEPS from continuing operations excluding acquisition costs (cents) 1 055,8
HEPS from continuing operations excluding acquisition costs – growth +17,6%
Final distribution (cents per share) 385,0
Growth in final distribution +18,5%
Growth in total distribution +17,5%
TFG | MARCH 2016 RESULTS PRESENTATION 11
TFG RESULTS PRESENTATION FOR THE YEAR ENDED 31 MARCH 2016
22
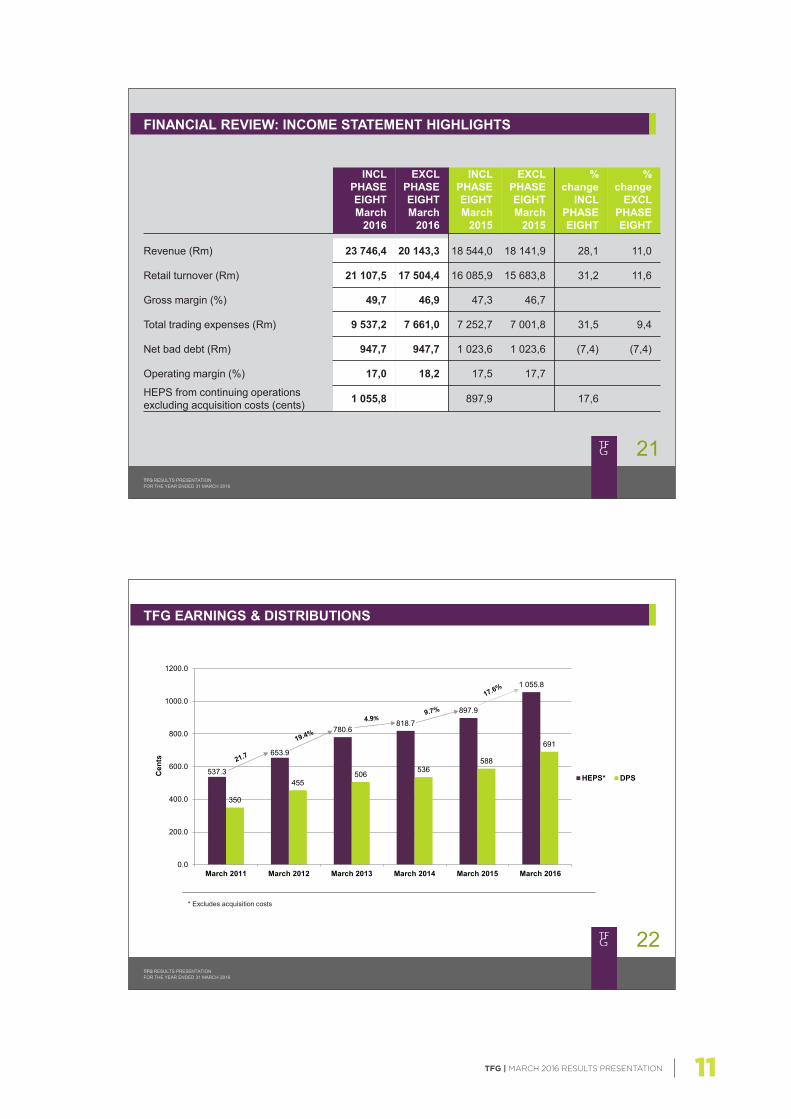
TFG EARNINGS & DISTRIBUTIONS
CONTINUING OPERATIONS
537.3
653.9
780.6 818.7
897.9
1 055.8
350
455 506 536
588
691
0.0
200.0
400.0
600.0
800.0
1000.0
1200.0
March 2011 March 2012 March 2013 March 2014 March 2015 March 2016
Cen
ts
HEPS* DPS
* Excludes acquisition costs
TFG RESULTS PRESENTATION FOR THE YEAR ENDED 31 MARCH 2016
21
FINANCIAL REVIEW: INCOME STATEMENT HIGHLIGHTS
INCL PHASE EIGHT March
2016
EXCL PHASE EIGHT March
2016
INCL PHASE EIGHT March
2015
EXCL PHASE EIGHT March
2015
% change
INCL PHASE EIGHT
% change
EXCL PHASE EIGHT
Revenue (Rm) 23 746,4 20 143,3 18 544,0 18 141,9 28,1 11,0
Retail turnover (Rm) 21 107,5 17 504,4 16 085,9 15 683,8 31,2 11,6
Gross margin (%) 49,7 46,9 47,3 46,7
Total trading expenses (Rm) 9 537,2 7 661,0 7 252,7 7 001,8 31,5 9,4
Net bad debt (Rm) 947,7 947,7 1 023,6 1 023,6 (7,4) (7,4)
Operating margin (%) 17,0 18,2 17,5 17,7
HEPS from continuing operations excluding acquisition costs (cents) 1 055,8 897,9 17,6
TFG | MARCH 2016 RESULTS PRESENTATION12
TFG RESULTS PRESENTATION FOR THE YEAR ENDED 31 MARCH 2016
24
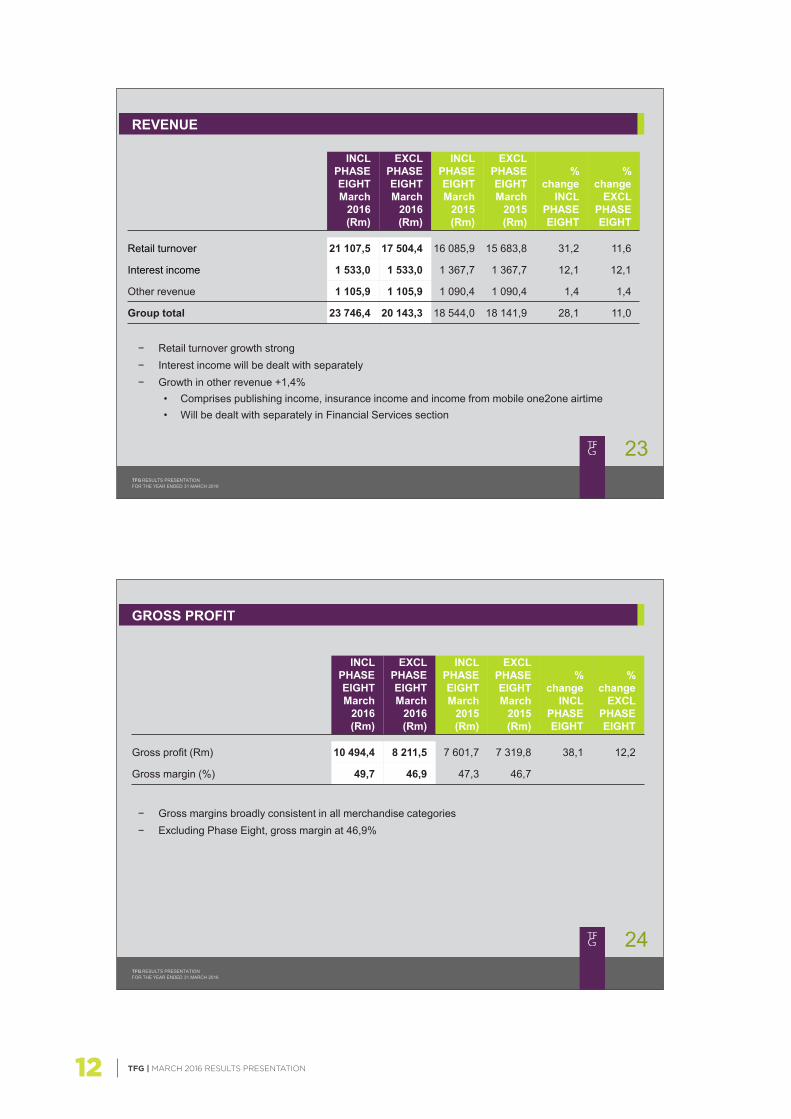
− Gross margins broadly consistent in all merchandise categories − Excluding Phase Eight, gross margin at 46,9%
GROSS PROFIT
INCL PHASE EIGHT March
2016 (Rm)
EXCL PHASE EIGHT March
2016 (Rm)
INCL PHASE EIGHT March
2015 (Rm)
EXCL PHASE EIGHT March
2015 (Rm)
% change
INCL PHASE EIGHT
% change
EXCL PHASE EIGHT
Gross profit (Rm) 10 494,4 8 211,5 7 601,7 7 319,8 38,1 12,2
Gross margin (%) 49,7 46,9 47,3 46,7
TFG RESULTS PRESENTATION FOR THE YEAR ENDED 31 MARCH 2016
23
− Retail turnover growth strong − Interest income will be dealt with separately − Growth in other revenue +1,4%
• Comprises publishing income, insurance income and income from mobile one2one airtime • Will be dealt with separately in Financial Services section
REVENUE
INCL PHASE EIGHT March
2016 (Rm)
EXCL PHASE EIGHT March
2016 (Rm)
INCL PHASE EIGHT March
2015 (Rm)
EXCL PHASE EIGHT March
2015 (Rm)
% change
INCL PHASE EIGHT
% change
EXCL PHASE EIGHT
Retail turnover 21 107,5 17 504,4 16 085,9 15 683,8 31,2 11,6
Interest income 1 533,0 1 533,0 1 367,7 1 367,7 12,1 12,1
Other revenue 1 105,9 1 105,9 1 090,4 1 090,4 1,4 1,4
Group total 23 746,4 20 143,3 18 544,0 18 141,9 28,1 11,0

TFG | MARCH 2016 RESULTS PRESENTATION 13
TFG RESULTS PRESENTATION FOR THE YEAR ENDED 31 MARCH 2016
26
− Expenses before bad debt growing at 12,3% − Employee costs growth at 15,4%
• Annual salary and promotional increases approx 7,5% • New stores • Strategic initiatives i.e. e-Commerce, analytics, new
brands, African expansion, etc − Store occupancy costs up 13,6%
• Normal lease escalations average 7%, balance is new stores
TRADING EXPENSES
INCL PHASE EIGHT March
2016 (Rm)
EXCL PHASE EIGHT March
2016 (Rm)
EXCL PHASE
EIGHT % to
turnover March
2016
INCL PHASE EIGHT March
2015 (Rm)
EXCL PHASE EIGHT March
2015 (Rm)
EXCL PHASE
EIGHT % to
turnover March
2015
% change INCL
PHASE EIGHT
% change EXCL
PHASE EIGHT
Depreciation and amortisation (464,7) (347,1) 2,0 (428,1) (412,7) 2,6 8,5 (15,9) Employee costs (3 210,8) (2 595,5) 14,8 (2 325,2) (2 248,5) 14,3 38,1 15,4 Occupancy costs (2 043,2) (1 758,7) 10,0 (1 585,0) (1 548,0) 9,9 28,9 13,6 Other net operating costs (2 870,8) (2 012,0) 11,5 (1 890,8) (1 769,0) 11,3 51,8 13,7 - comp (1 819,2) (1 769,0) 2,8 - non-comp (192,8) - -
Trading expenses before net bad debt (8 589,5) (6 713,3) 38,4 (6 229,1) (5 978,2) 38,1 37,9 12,3
Net bad debts (947,7) (947,7) 5,4 (1 023,6) (1 023,6) 6,5 (7,4) (7,4)
Total trading expenses (9 537,2) (7 661,0) 43,8 (7 252,7) (7 001,8) 44,6 31,5 9,4
− Other net operating costs increased by 13,7% • Like-for-like costs approximately 3% • Investment in marketing, rewards programme,
international merchandise consultants, new account cards, etc
− Bad debts will be dealt with by Jane Fisher
TFG RESULTS PRESENTATION FOR THE YEAR ENDED 31 MARCH 2016
25
− Interest income from retail debtors’ book up 12,9% • Repo rate increases during the year • Book growth of 8% (March to March movement) • 89,0% of balances remain interest-bearing as customers favour longer term credit plans (March
2015: 89,0%)
INTEREST INCOME
March 2016 (Rm)
March 2015 (Rm) % change
Trade receivables – retail 1 510,7 1 337,7 12,9
Sundry 22,3 30,0 (25,7)
Total interest income 1 533,0 1 367,7 12,1

TFG | MARCH 2016 RESULTS PRESENTATION14
TFG RESULTS PRESENTATION FOR THE YEAR ENDED 31 MARCH 2016
28
− Excluding Phase Eight & Whistles, stock up by 25,9% − Impact of:
• New stores • Inflation 8% - 9% • New brands • Investment in faster growing and repositioned brands
− No concern over quality of stock and levels of markdown
STOCK
March 2016 (Rm)
March 2015 (Rm) % change
Stock 5 116,1 3 813,9 34,1
TFG RESULTS PRESENTATION FOR THE YEAR ENDED 31 MARCH 2016
27
− Level of finance cost in line with management’s expectation and interest rate environment • 4 interest rate increases during this financial year along with increased level of term funding
resulted in higher average cost of borrowings • Political uncertainty resulted in higher interest rate spreads • Impact of inclusion of UK debt for full year
− Working capital and capex investment resulted in higher average borrowing levels
FINANCE COST
INCL PHASE EIGHT March
2016 (Rm)
EXCL PHASE EIGHT March
2016 (Rm)
INCL PHASE EIGHT March
2015 (Rm)
EXCL PHASE EIGHT March
2015 (Rm)
% change
INCL PHASE EIGHT
% change
EXCL PHASE EIGHT
Finance cost (509,0) (409,5) (228,1) (211,3) 123,1 93,8
TFG | MARCH 2016 RESULTS PRESENTATION 15
TFG RESULTS PRESENTATION FOR THE YEAR ENDED 31 MARCH 2016
30
− Net borrowings up by R1 billion primarily due to working capital investment which had supported the group’s growth
− TFG recourse debt 55,6% • Including non-recourse international subsidiaries: gearing of 73,5%
BORROWINGS
March 2016 (Rm)
March 2015 (Rm)
Interest-bearing debt 8 165,7 7 042,5
Less: Cash (888,8) (800,4)
Net borrowings TFG including international subsidiaries* 7 276,9 6 242,1
Less: International subsidiaries* net borrowings (non-recourse) (1 770,1) (1 639,2)
TFG borrowings excluding international subsidiaries* 5 506,8 4 602,9 * International subsidiaries: Phase Eight and Whistles
TFG RESULTS PRESENTATION FOR THE YEAR ENDED 31 MARCH 2016
29
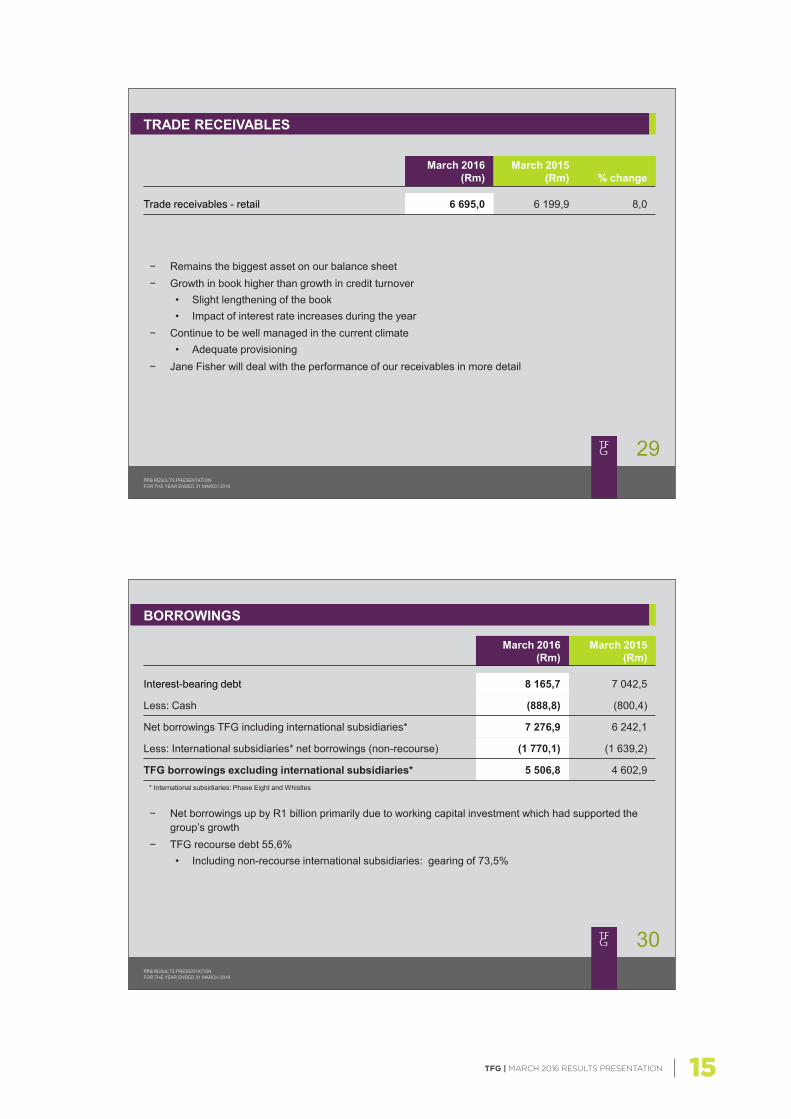
− Remains the biggest asset on our balance sheet − Growth in book higher than growth in credit turnover
• Slight lengthening of the book • Impact of interest rate increases during the year
− Continue to be well managed in the current climate • Adequate provisioning
− Jane Fisher will deal with the performance of our receivables in more detail
TRADE RECEIVABLES
March 2016 (Rm)
March 2015 (Rm) % change
Trade receivables - retail 6 695,0 6 199,9 8,0
TFG | MARCH 2016 RESULTS PRESENTATION16
TFG RESULTS PRESENTATION FOR THE YEAR ENDED 31 MARCH 2016
32
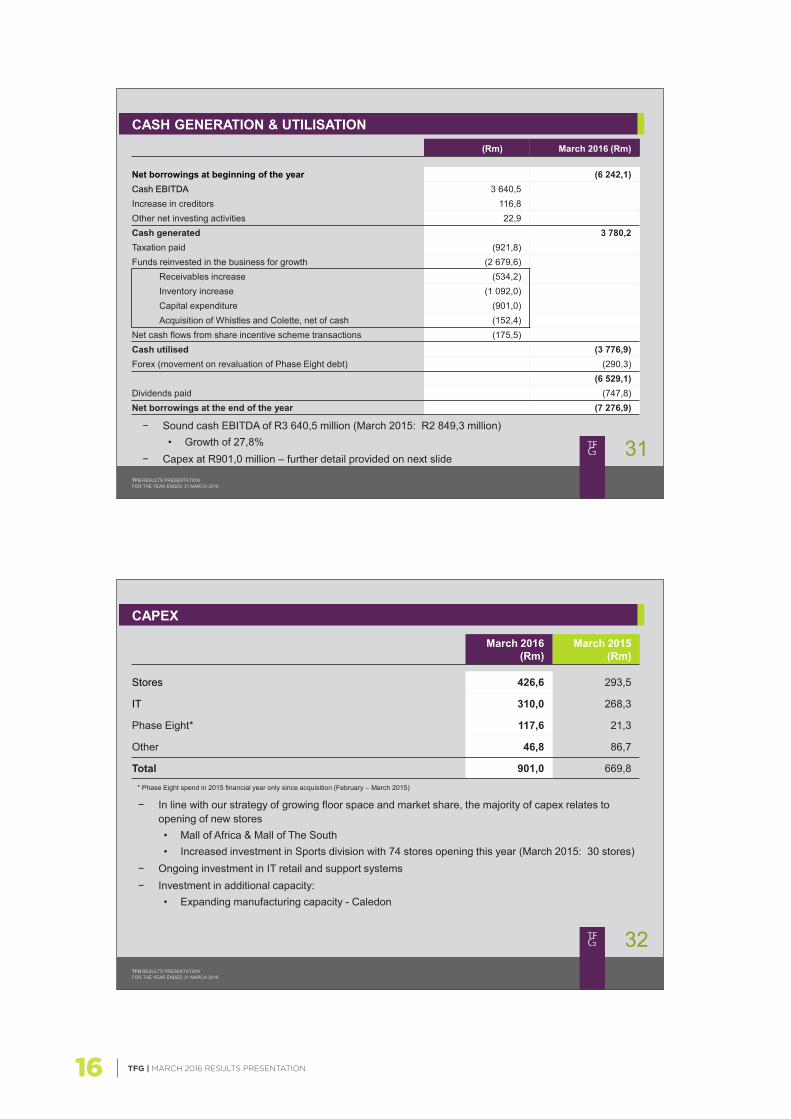
− In line with our strategy of growing floor space and market share, the majority of capex relates to opening of new stores • Mall of Africa & Mall of The South • Increased investment in Sports division with 74 stores opening this year (March 2015: 30 stores)
− Ongoing investment in IT retail and support systems − Investment in additional capacity:
• Expanding manufacturing capacity - Caledon
CAPEX
March 2016 (Rm)
March 2015 (Rm)
Stores 426,6 293,5
IT 310,0 268,3
Phase Eight* 117,6 21,3
Other 46,8 86,7
Total 901,0 669,8
* Phase Eight spend in 2015 financial year only since acquisition (February – March 2015)
TFG RESULTS PRESENTATION FOR THE YEAR ENDED 31 MARCH 2016
31 − Sound cash EBITDA of R3 640,5 million (March 2015: R2 849,3 million)
• Growth of 27,8% − Capex at R901,0 million – further detail provided on next slide
CASH GENERATION & UTILISATION (Rm) March 2016 (Rm)
Net borrowings at beginning of the year (6 242,1) Cash EBITDA 3 640,5 Increase in creditors 116,8 Other net investing activities 22,9 Cash generated 3 780,2 Taxation paid (921,8) Funds reinvested in the business for growth (2 679,6)
Receivables increase (534,2) Inventory increase (1 092,0) Capital expenditure (901,0) Acquisition of Whistles and Colette, net of cash (152,4)
Net cash flows from share incentive scheme transactions (175,5) Cash utilised (3 776,9) Forex (movement on revaluation of Phase Eight debt) (290,3)
(6 529,1) Dividends paid (747,8) Net borrowings at the end of the year (7 276,9)

TFG | MARCH 2016 RESULTS PRESENTATION 17
TFG RESULTS PRESENTATION FOR THE YEAR ENDED 31 MARCH 2016
34
− Consumer credit index dropped below 50%, reflection of the stress of credit customers − Absolute value of household disposable incomes
remained higher than in 2014 − Subsequent interest rate increases and
inflationary pressures have led to sustained pressure on consumers
− Key economic factors expected going forward: – Increasing interest rate environment – Reduced disposable income and increased
unemployment – Increased inflationary pressures – Flat GDP growth
− Proof of Income and Affordability requirements have negatively impacted on our new account growth
TFG FINANCIAL SERVICES: INDUSTRY REVIEW
TFG FINANCIAL SERVICES
TFG | MARCH 2016 RESULTS PRESENTATION18
TFG RESULTS PRESENTATION FOR THE YEAR ENDED 31 MARCH 2016
36
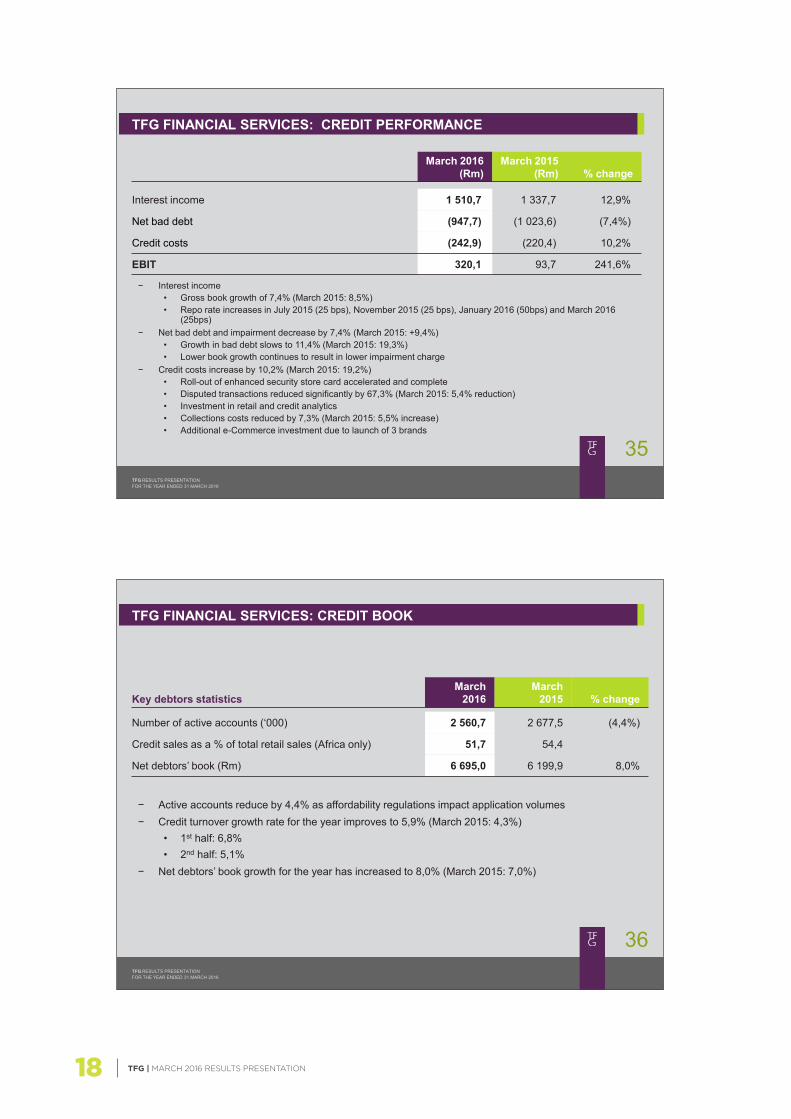
− Active accounts reduce by 4,4% as affordability regulations impact application volumes − Credit turnover growth rate for the year improves to 5,9% (March 2015: 4,3%)
• 1st half: 6,8% • 2nd half: 5,1%
− Net debtors’ book growth for the year has increased to 8,0% (March 2015: 7,0%)
TFG FINANCIAL SERVICES: CREDIT BOOK
Key debtors statistics March
2016 March
2015 % change
Number of active accounts (‘000) 2 560,7 2 677,5 (4,4%)
Credit sales as a % of total retail sales (Africa only) 51,7 54,4
Net debtors’ book (Rm) 6 695,0 6 199,9 8,0%
TFG RESULTS PRESENTATION FOR THE YEAR ENDED 31 MARCH 2016
35
− Interest income • Gross book growth of 7,4% (March 2015: 8,5%) • Repo rate increases in July 2015 (25 bps), November 2015 (25 bps), January 2016 (50bps) and March 2016
(25bps) − Net bad debt and impairment decrease by 7,4% (March 2015: +9,4%)
• Growth in bad debt slows to 11,4% (March 2015: 19,3%) • Lower book growth continues to result in lower impairment charge
− Credit costs increase by 10,2% (March 2015: 19,2%) • Roll-out of enhanced security store card accelerated and complete • Disputed transactions reduced significantly by 67,3% (March 2015: 5,4% reduction) • Investment in retail and credit analytics • Collections costs reduced by 7,3% (March 2015: 5,5% increase) • Additional e-Commerce investment due to launch of 3 brands
TFG FINANCIAL SERVICES: CREDIT PERFORMANCE
March 2016 (Rm)
March 2015 (Rm) % change
Interest income 1 510,7 1 337,7 12,9%
Net bad debt (947,7) (1 023,6) (7,4%)
Credit costs (242,9) (220,4) 10,2%
EBIT 320,1 93,7 241,6%
TFG | MARCH 2016 RESULTS PRESENTATION 19
TFG RESULTS PRESENTATION FOR THE YEAR ENDED 31 MARCH 2016
38
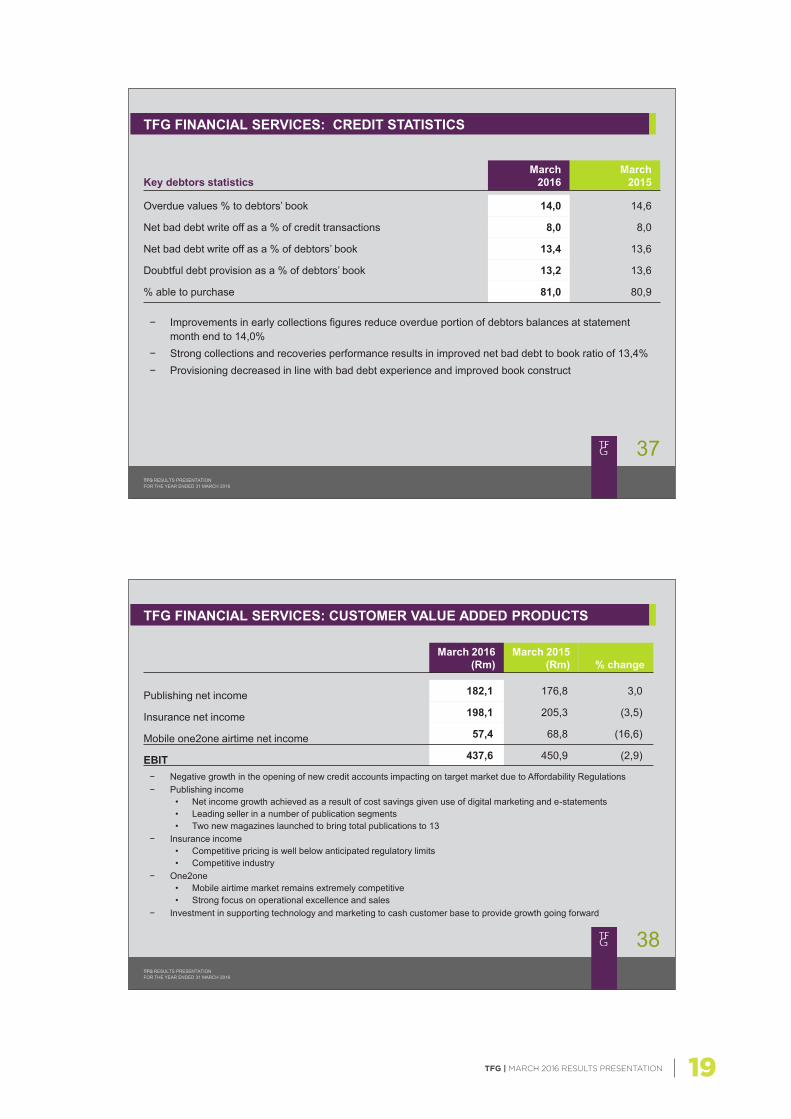
− Negative growth in the opening of new credit accounts impacting on target market due to Affordability Regulations − Publishing income
• Net income growth achieved as a result of cost savings given use of digital marketing and e-statements • Leading seller in a number of publication segments • Two new magazines launched to bring total publications to 13
− Insurance income • Competitive pricing is well below anticipated regulatory limits • Competitive industry
− One2one • Mobile airtime market remains extremely competitive • Strong focus on operational excellence and sales
− Investment in supporting technology and marketing to cash customer base to provide growth going forward
TFG FINANCIAL SERVICES: CUSTOMER VALUE ADDED PRODUCTS
March 2016 (Rm)
March 2015 (Rm) % change
Publishing net income 182,1 176,8 3,0
Insurance net income 198,1 205,3 (3,5)
Mobile one2one airtime net income 57,4 68,8 (16,6)
EBIT 437,6 450,9 (2,9)
TFG RESULTS PRESENTATION FOR THE YEAR ENDED 31 MARCH 2016
37
− Improvements in early collections figures reduce overdue portion of debtors balances at statement month end to 14,0%
− Strong collections and recoveries performance results in improved net bad debt to book ratio of 13,4% − Provisioning decreased in line with bad debt experience and improved book construct
TFG FINANCIAL SERVICES: CREDIT STATISTICS
Key debtors statistics March
2016 March
2015
Overdue values % to debtors’ book 14,0 14,6
Net bad debt write off as a % of credit transactions 8,0 8,0
Net bad debt write off as a % of debtors’ book 13,4 13,6
Doubtful debt provision as a % of debtors’ book 13,2 13,6
% able to purchase 81,0 80,9

TFG | MARCH 2016 RESULTS PRESENTATION20
INTERNATIONAL EXPANSION
TFG RESULTS PRESENTATION FOR THE YEAR ENDED 31 MARCH 2016
39
TFG FINANCIAL SERVICES: STRATEGY
Challenge Strategy
Regulatory environment − Increasing use of digital applications system − Continual process improvement to increase
ease of account opening
Credit sales and new account growth − Invitational mailings to credit unaware population − Investment in analytics and credit capabilities to
target growth − Rewards initiatives specifically for credit
customers
Cost of doing business increased − Improve efficiencies to fund strategic projects − Introduction of monthly service fee
Value added product growth − Target cash customer base − Bundled product offerings

TFG | MARCH 2016 RESULTS PRESENTATION 21
TFG RESULTS PRESENTATION FOR THE YEAR ENDED 31 MARCH 2016
42
PHASE EIGHT − Y1 deliverables: all strategic initiatives achieved
• Continued UK and international roll-out with 108 new outlets opening during the year including 4 new countries (10 outlets closed)
• Successful launch of One Stock • Launch of Studio 8 • Development of wholesale model • Bedding down of integration of people and processes • Delivery of hard-currency growth
− Performance for the year: • Revenue = R3,6bn • Operational EBITDA = £26m (2015 = £24,6m) • Earnings accretive in constant currency Y1 • Currently trading out of 542 outlets in 23 countries
− Strategy & outlook: • Continued UK and international roll-out • Launch of TFG Jewellery in UK • Integration of Whistles management team and roll-out of Phase Eight model into Whistles
INTERNATIONAL EXPANSION (CONTINUED)
TFG RESULTS PRESENTATION FOR THE YEAR ENDED 31 MARCH 2016
41
VISION − To be the leading fashion retailer in Africa whilst growing our international footprint
WHY
− Constantly looking for profitable growth opportunities • Limited meaningful acquisition opportunities in South Africa
− Leveraging 92 years of retail experience, systems, infrastructure and brands
INTERNATIONAL EXPANSION STRATEGY
Underpinned by the strict application of the following criteria: − Businesses with a competitive advantage
• Product uniqueness • Business model
− Clear international roll-out strategy − High quality management team that is committed to future growth
BENEFITS OF GROWING OUR INTERNATIONAL FOOTPRINT
− Creating value for our shareholders through: • Diversification • Leveraging our retail experience • Additional profit and value created • ZAR hedge
INTERNATIONAL EXPANSION

TFG | MARCH 2016 RESULTS PRESENTATION22
KEY PERFORMANCE INDICATORS
TFG RESULTS PRESENTATION FOR THE YEAR ENDED 31 MARCH 2016
43
WHISTLES − Rationale:
• Strong brand equity • Opportunistic acquisition • Unique product proposition • Clear growth opportunity • Obvious synergies with Phase Eight
− Overview of business: • A leading British contemporary fashion brand for men and women • Established in 1974 and headquartered in London, United Kingdom • The company currently operates through 121 outlets internationally
− Transaction detail: • Purchase price = £4,6m (R100,8m) • Enterprise value = £8,8m (R191,1m) • Ownership – 100% through UK subsidiary, Phase Eight
− Strategy • Realise synergies and economies of scale • Leverage existing Phase Eight management and business model
INTERNATIONAL EXPANSION CONTINUED
TFG | MARCH 2016 RESULTS PRESENTATION 23
OUTLOOK
TFG RESULTS PRESENTATION FOR THE YEAR ENDED 31 MARCH 2016
45
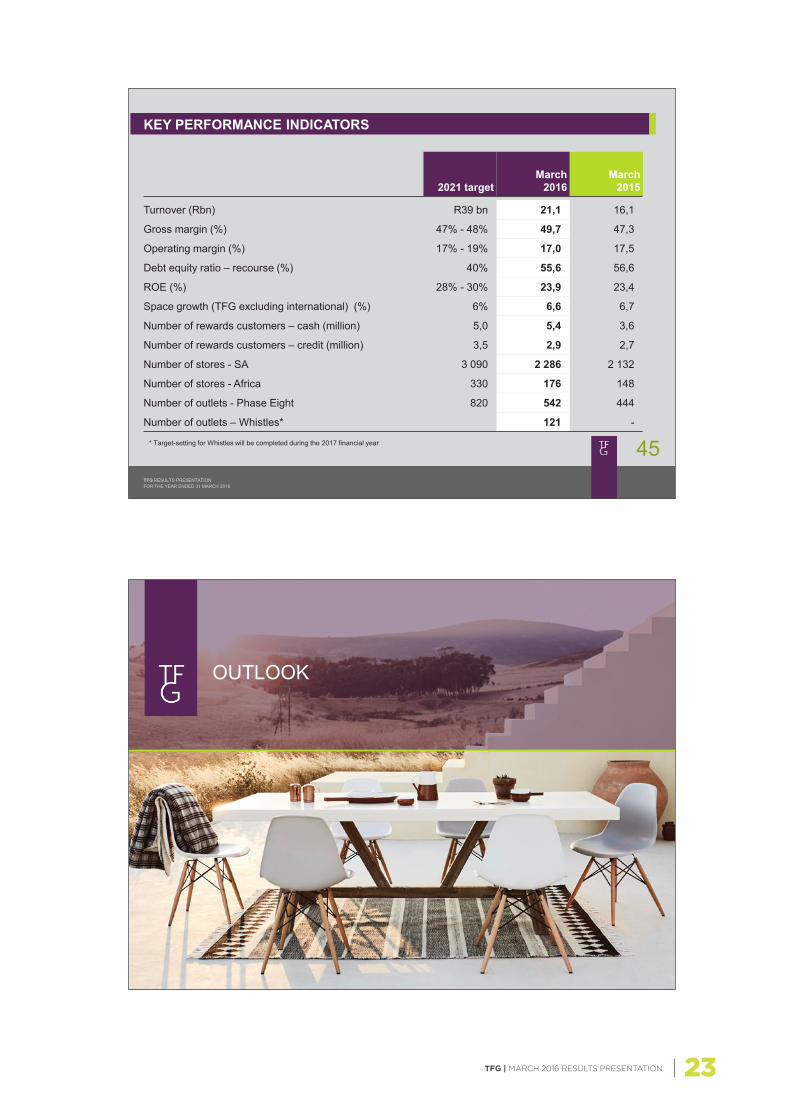
KEY PERFORMANCE INDICATORS
2021 target March
2016 March
2015
Turnover (Rbn) R39 bn 21,1 16,1
Gross margin (%) 47% - 48% 49,7 47,3
Operating margin (%) 17% - 19% 17,0 17,5
Debt equity ratio – recourse (%) 40% 55,6 56,6
ROE (%) 28% - 30% 23,9 23,4
Space growth (TFG excluding international) (%) 6% 6,6 6,7
Number of rewards customers – cash (million) 5,0 5,4 3,6
Number of rewards customers – credit (million) 3,5 2,9 2,7
Number of stores - SA 3 090 2 286 2 132
Number of stores - Africa 330 176 148
Number of outlets - Phase Eight 820 542 444
Number of outlets – Whistles* 121 -
* Target-setting for Whistles will be completed during the 2017 financial year
TFG | MARCH 2016 RESULTS PRESENTATION24
THANK YOU
TFG RESULTS PRESENTATION FOR THE YEAR ENDED 31 MARCH 2016
47
− Cash sales • Expected to continue at current levels
− Credit sales • Environment likely to remain challenging • Impact of the Affordability Regulations will inhibit new account growth
− Gross margin to be maintained • Product inflation anticipated to be around 8% - 9%
− Continued focus on costs and working capital − Space growth
• In excess of 150 stores planned for 2017 (Africa only) – Approximately 6% floor space growth
• Phase Eight - approximately 50 new outlets planned for 2017 • Whistles – approximately 20 new outlets planned for 2017
− Continued focus on key strategic initiatives − Omni-channel roll-out remains on track with Markham, Fabiani, @home furniture and Foschini cosmetics
due to launch online in 2017 − Excluding Phase Eight and Whistles, the turnover growth for the first 7 weeks of the current financial
year is at similar levels to last year and broadly in line with management’s expectations. Both Phase Eight and Whistles are trading ahead of last year and within management’s expectations
OUTLOOK & GUIDANCE FOR 2017
TFG | MARCH 2016 RESULTS PRESENTATION 25
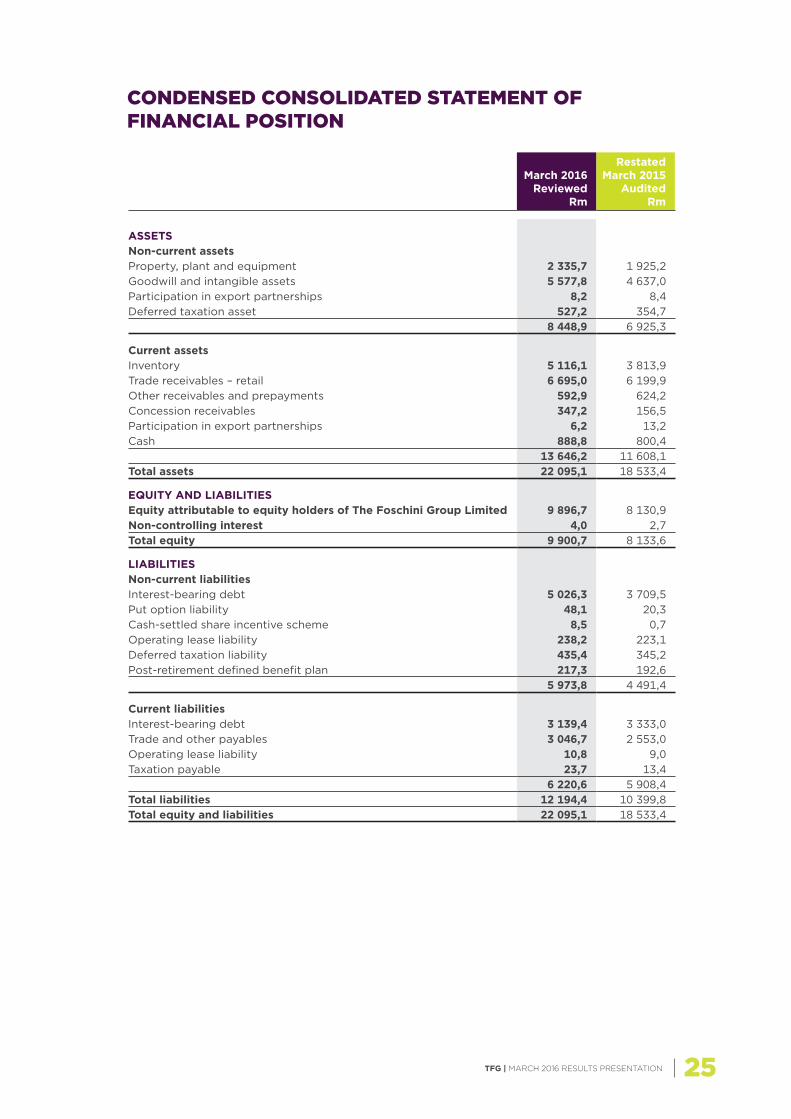
CONDENSED CONSOLIDATED STATEMENT OF FINANCIAL POSITION
March 2016 Reviewed
Rm
Restated March 2015
Audited Rm
ASSETSNon-current assetsProperty, plant and equipment 2 335,7 1 925,2Goodwill and intangible assets 5 577,8 4 637,0Participation in export partnerships 8,2 8,4Deferred taxation asset 527,2 354,7
8 448,9 6 925,3
Current assetsInventory 5 116,1 3 813,9Trade receivables – retail 6 695,0 6 199,9Other receivables and prepayments 592,9 624,2Concession receivables 347,2 156,5Participation in export partnerships 6,2 13,2Cash 888,8 800,4
13 646,2 11 608,1Total assets 22 095,1 18 533,4
EQUITY AND LIABILITIESEquity attributable to equity holders of The Foschini Group Limited 9 896,7 8 130,9Non-controlling interest 4,0 2,7Total equity 9 900,7 8 133,6
LIABILITIESNon-current liabilitiesInterest-bearing debt 5 026,3 3 709,5Put option liability 48,1 20,3Cash-settled share incentive scheme 8,5 0,7Operating lease liability 238,2 223,1Deferred taxation liability 435,4 345,2Post-retirement defined benefit plan 217,3 192,6
5 973,8 4 491,4
Current liabilitiesInterest-bearing debt 3 139,4 3 333,0Trade and other payables 3 046,7 2 553,0Operating lease liability 10,8 9,0Taxation payable 23,7 13,4
6 220,6 5 908,4Total liabilities 12 194,4 10 399,8Total equity and liabilities 22 095,1 18 533,4

TFG | MARCH 2016 RESULTS PRESENTATION26
CONDENSED CONSOLIDATED INCOME STATEMENT
Continuing operations
Year ended 31 March
2016 Reviewed
Rm
Year ended 31 March
2015 Audited
Rm%
change
Revenue 23 746,4 18 544,0Retail turnover 21 107,5 16 085,9 31,2Cost of turnover (10 613,1) (8 484,2)Gross profit 10 494,4 7 601,7Interest income 1 533,0 1 367,7Other income 1 105,9 1 090,4Trading expenses (9 537,2) (7 252,7)Operating profit before once-off acquisition costs and finance costs 3 596,1 2 807,1 28,1Once-off acquisition costs (65,9) (292,4)Finance costs (509,0) (228,1)Profit before tax 3 021,2 2 286,6Income tax expense (863,9) (748,8)Profit from continuing operations 2 157,3 1 537,8 40,3Discontinued operationsProfit from discontinued operations, net of tax - RCS Group – 86,2Profit on disposal of discontinued operation - RCS Group – 273,2Profit for the year 2 157,3 1 897,2 13,7
Attributable to:Continuing operations 2 155,6 1 537,4Discontinued operations – 320,6Equity holders of The Foschini Group Limited 2 155,6 1 858,0Non-controlling interest 1,7 39,2Profit for the year 2 157,3 1 897,2
Earnings per ordinary share (cents)
Continuing operations (excluding once-off acquisition costs)Basic 1 073,3 893,3 20,2Headline 1 055,8 897,9 17,6Diluted (basic) 1 063,4 885,7 20,1Diluted (headline) 1 046,0 890,3 17,5
TotalBasic 1 041,5 909,4 14,5Headline 1 024,0 780,3 31,2Diluted (basic) 1 031,9 901,7 14,4Diluted (headline) 1 014,5 773,7 31,1
Weighted average ordinary shares in issue (millions) 207,0 204,3

NOTES

TFG | MARCH 2016 RESULTS PRESENTATION28
TFG RESULTS PRESENTATION FOR THE YEAR ENDED 31 MARCH 2016
49
THIS ANNOUNCEMENT CONTAINS CERTAIN FORWARD-LOOKING STATEMENTS WITH RESPECT TO THE FINANCIAL CONDITION AND RESULTS OF OPERATIONS OF THE FOSCHINI GROUP LIMITED AND ITS SUBSIDIARIES, WHICH BY THEIR NATURE INVOLVE RISK AND UNCERTAINTY BECAUSE THEY RELATE TO EVENTS AND DEPEND ON CIRCUMSTANCES THAT MAY OCCUR IN THE FUTURE.
DISCLAIMER