The Five-S Framework for Site Conservationassets.panda.org/downloads/5S-v2-1.pdf · 2005-11-02 ·...
22
The Five-S Framework for Site Conservation Appendices Volume II Second Edition June 2000
Transcript of The Five-S Framework for Site Conservationassets.panda.org/downloads/5S-v2-1.pdf · 2005-11-02 ·...

The Five-S Frameworkfor Site Conservation
Appendices
Volume IISecond Edition
June 2000
The Five-S Framework for Site Conservation:A Practitioner’s Handbook for Site Conservation Planningand Measuring Conservation Success
© 2000 by The Nature Conservancy
Front cover photographs (from left to right): Harold E. Malde, PhotoDisc, PhotoDisc, and Greg Miller/TNC
Back cover photographs (from left to right): PhotoDisc, Jez O’Hare, Harold E. Malde, and Diana Wagner/TNC Photo Contest
The mission of The Nature Conservancy is to preserve
the plants, animals, and natural communities that
represent the diversity of life on Earth by protecting
the lands and waters they need to survive.

Practitioner’s Handbook
Preface ............................................................................................................... i
I. Introduction ........................................................................................................ I-1
II. Standards for Site Conservation Planning................................................................ II-1
III. The “Five-S” Framework for Site Conservation ......................................................... III-1
IV. Systems ........................................................................................................... IV-1
V. Stresses ............................................................................................................V-1
VI. Sources ........................................................................................................... VI-1
VII. Conservation Strategies ..................................................................................... VII-1
VIII. Measures of Conservation Success ..................................................................... VIII-1
Appendices
A. A Step-by-Step Approach to Systems, Stresses, Sources, and Measures ofConservation Success ........................................................................................ A-1
B. Descriptions and Illustrative Examples of Systems ..................................................... B-1
C. Illustrative Lists of Stresses and Sources .................................................................. C-1
D. A Step-by-Step Approach to Developing Conservation Strategies ............................... D-1
E. A Step-by-Step Approach to Assessing Conservation Capacity ................................... E-1
Table of Contents
▼ ▼ ▼ ▼ ▼ ▼ ▼ ▼ ▼ ▼ ▼ ▼ ▼ ▼ ▼ ▼ ▼ ▼ ▼ ▼ ▼ ▼ ▼ ▼ ▼ ▼ ▼ ▼ ▼ ▼ ▼ ▼ ▼ ▼ ▼ ▼ ▼ ▼ ▼ ▼ ▼ ▼ ▼ ▼ ▼ ▼ ▼ ▼ ▼ ▼ ▼ ▼ ▼


▼A-1
Use the attached Systems Viability Worksheet (see the Illustrative Example); or use the analogous
automated worksheet template on the Viability sheet of the Microsoft Excel workbook entitled
Site Conservation/Measures of Conservation Success Workbook.
IDENTIFY THE SYSTEMS.Select no more than eight systems (i.e., focal conservation targets) to be the focus of planning and
measuring success. See Appendix B (Descriptions and Illustrative Examples of Systems) for examples
and worksheets.
The steps for identifying focal conservation targets (as described in Chapter IV) include:
1. Define the ecological systems and species groups (coarse, intermediate, and local scale, as
appropriate) that occur at the site.
A. Identify all ecological systems that characterize the terrestrial, aquatic, and marine components
of the site, as appropriate (i.e., top-down approach).
B. Consolidate individual species and ecological communities into major groupings and
ecological systems, respectively (i.e., bottom-up approach).
2. Identify specific ecological communities, species, or species groups that occur at the site and
have ecological attributes or conservation requirements not adequately captured within the
previously defined ecological systems or species groups.
A. Individual species or species groups that disperse, travel, or otherwise use resources across
different ecological systems.
B. Important attributtes of regional-scale species (or species groups) that should be conserved
at the site.
C. Individual species and ecological com-munities that have special conservation or management
requirements.
3. Of the conservation targets identified through the first two steps, identify the eight that best
meet the following criteria:
• Reflect ecoregional conservation goals
• Represent the biodiversity at the site
• Are highly threatened
4. Check the list of eight focal conservation targets to ensure that all biodiversity targets identified
A Step-by-Step Approach to Systems, Stresses, Sources,and Measures of Conservation Success
Systems/Biodiversity HealthInstructions
✎
Appendix A
▼ ▼ ▼ ▼ ▼ ▼ ▼ ▼ ▼ ▼ ▼ ▼ ▼ ▼ ▼ ▼ ▼ ▼ ▼ ▼ ▼ ▼ ▼ ▼ ▼ ▼ ▼ ▼ ▼ ▼ ▼ ▼ ▼ ▼ ▼ ▼ ▼ ▼ ▼ ▼ ▼ ▼ ▼ ▼ ▼ ▼ ▼ ▼ ▼ ▼ ▼ ▼ ▼

The Five-S Framework for Site Conservation—Appendices
A-2▼
through ecoregional planning are adequately represented, and revise the focal targets as warranted.
ASSESS THE VIABILITY OF THE FOCAL CONSERVATION TARGETS.Rank each focal target for size, condition, and landscape context, using the following scale:
• “Very Good” or 4.0
• “Good” or 3.5
• “Fair” or 2.5
“Poor” or 1.0
The ranking of size, condition, and landscape context should be based on global EO rank
specifications, if available, or otherwise on site-specific specifications, as described in Chapter IV of
the handbook. If desired, size, condition, and landscape context can be weighted on a scale of 1.0,
0.75, 0.5, and 0.
It is important to document the rationale for the size, condition, and landscape context rankings
you assign, and what changes would have to occur for the assigned rank to be upgraded or down-
graded by one rank. The Systems Viability Worksheet of the Excel workbook has fields for including
this documentation.
For each focal target, compute the average value of the numeric scores for size, condition, and
landscape context. The simple average is used when all factors have equal weight; a weighed average
is used if the factors have unequal weight. Determine the viability rank using the following table:
✎
✎
>= 3.75 Very Good3.0 – 3.74 Good1.75 – 2.99 Fair
< 1.75 Poor
(Note: the viability rank, based on size, condition, and landscape context, is computed automatically in
the Systems Viability Worksheet of the Excel workbook.)
DETERMINE BIODIVERSITY HEALTH FOR THE SITE.Assign a numeric score to the viability rank for each target: Very Good=4.0, Good=3.5, Fair=2.5,
Poor 1.0. Compute the simple average of the scores and assign Biodiversity Health based on the
average, using the same table as in the previous step.
(Note: the average viability score is computed and Biodiversity Health assigned automatically in the
Systems Viability Worksheet of the Excel workbook.)
Appendix A
▼A-3
AVERAGE VIABILITY SCORE =
BIODIVERSITY HEALTH =
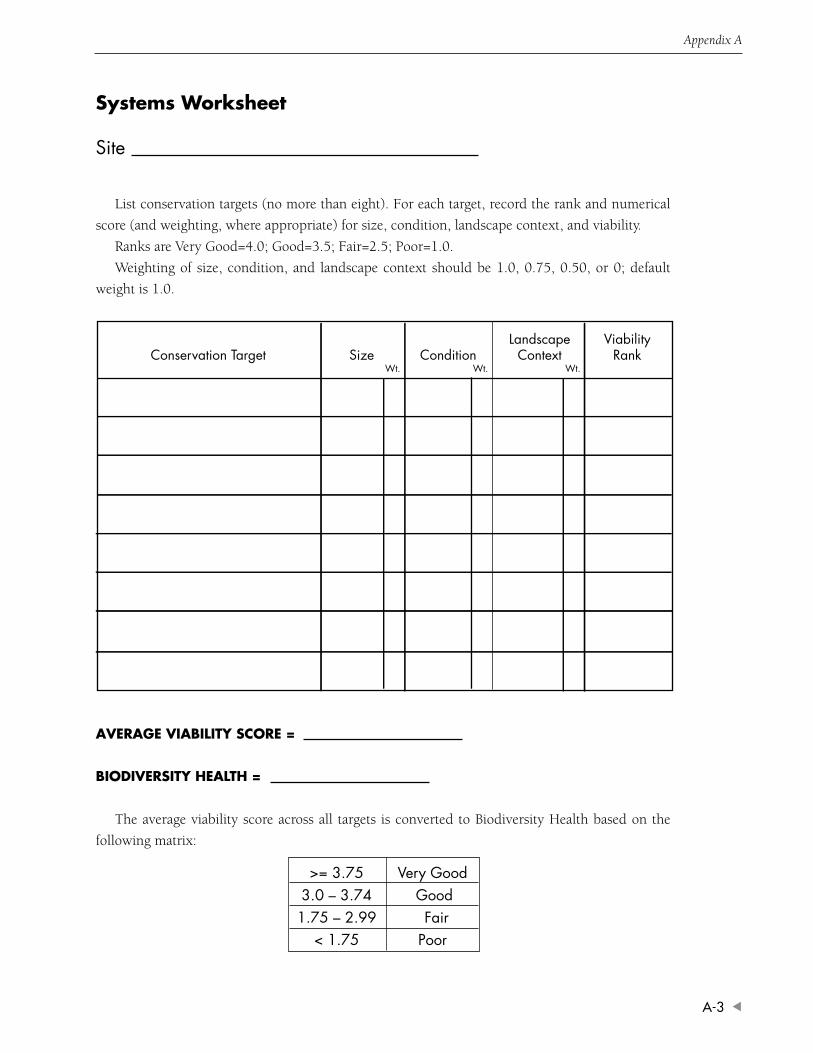
The average viability score across all targets is converted to Biodiversity Health based on the
following matrix:
Systems Worksheet
Site
List conservation targets (no more than eight). For each target, record the rank and numerical
score (and weighting, where appropriate) for size, condition, landscape context, and viability.
Ranks are Very Good=4.0; Good=3.5; Fair=2.5; Poor=1.0.
Weighting of size, condition, and landscape context should be 1.0, 0.75, 0.50, or 0; default
weight is 1.0.
Conservation Target Size ConditionLandscape
ContextViability
RankWt. Wt. Wt.
>= 3.75 Very Good3.0 – 3.74 Good1.75 – 2.99 Fair
< 1.75 Poor
The Five-S Framework for Site Conservation—Appendices
A-4▼
AVERAGE VIABILITY SCORE =
BIODIVERSITY HEALTH =
The average viability score across all targets is converted to Biodiversity Health based on the
following matrix:
Conservation Target Size ConditionLandscape
ContextViability
RankWt. Wt. Wt.
Vernal pools/mounded prairie
Vernal pool fairy shrimp
Lomatium cookii
Limanthes species
Chaparral
Pine - Oak
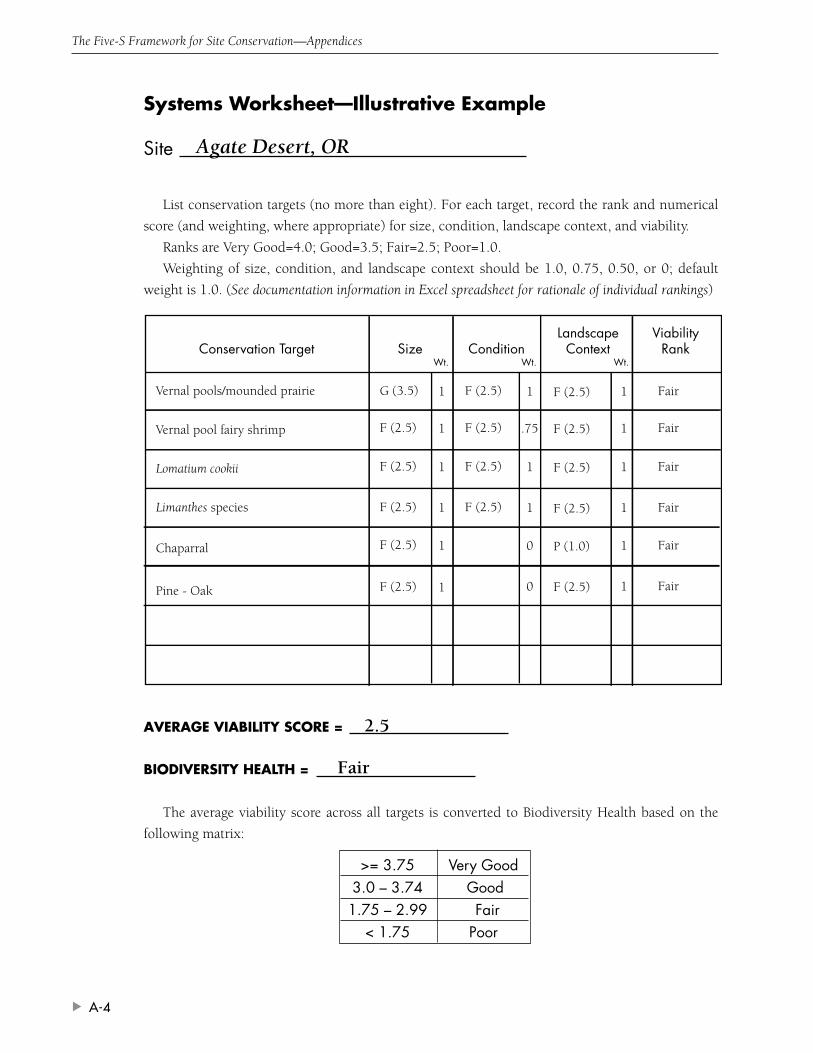
Systems Worksheet—Illustrative Example
Site Agate Desert, OR
List conservation targets (no more than eight). For each target, record the rank and numerical
score (and weighting, where appropriate) for size, condition, landscape context, and viability.
Ranks are Very Good=4.0; Good=3.5; Fair=2.5; Poor=1.0.
Weighting of size, condition, and landscape context should be 1.0, 0.75, 0.50, or 0; default
weight is 1.0. (See documentation information in Excel spreadsheet for rationale of individual rankings)
G (3.5)
F (2.5)
F (2.5)
F (2.5)
F (2.5)
F (2.5)
F (2.5)
F (2.5)
F (2.5)
F (2.5)
P (1.0)
F (2.5)
Fair
Fair
Fair
Fair
Fair
Fair
F (2.5)
F (2.5)
F (2.5)
F (2.5)
1
1
1
1
1
1
1
.75
1
1
0
0
1
1
1
1
1
1
2.5
Fair
>= 3.75 Very Good3.0 – 3.74 Good1.75 – 2.99 Fair
< 1.75 Poor

Appendix A
▼A-5
Use the enclosed Stresses/Sources Worksheet (refer to the Illustrative Example); or use the
analogous automated worksheet templates in each of the eight individual conservation target
sheets of the Microsoft Excel workbook entitled Site Conservation/Measures of Conservation
Success Workbook. Prepare one work-sheet for focal conservation target.
LABEL THE WORKSHEET with the name of the site, and the conservation target (taken
from the Systems worksheet; this is done automatically in the Excel workbook) and provide a brief
description of the system.
IDENTIFY THE STRESSES TO EACH SYSTEM.In the Stress table, list up to eight stresses for each system. You do not need to include every
conceivable stress, but only those which are current (or likely to become a problem within the next
ten years), proximate, and cause particular concern. Avoid listing stresses to a given system that are
largely redundant (e.g. habitat destruction; habitat fragmentation; habitat degradation). Use the
Illustrative List of Stresses in Appendix C as an aide, but also please consider other stresses that may
be relevant and significant.
RANK THE STRESSES.Rank each stress you identified according to the following scale of significance:
• “Very High”
• “High”
• “Medium”
• “Low”
Please rank each stress based on an assessment of both severity and scope. The attached Stress
Ranking Guidelines provide a set of benchmarks for ranking the severity and scope of stresses. The set
of rules for determining a stress ranking, as a function of severity and scope, is also provided in table
form. (Note: the stress rank, based on severity and scope, is computed automatically in the Stresses/Sources
Worksheets of the Excel worksheet.)
It is important to document the rationale for selecting stresses, and for the severity and scope
rankings you assign. The Stresses/Sources Work-sheets of the Excel workbook have fields for including
this documentation. See Appendix C for examples.
StressesInstructions
✎
✎
✎

The Five-S Framework for Site Conservation—Appendices
A-6▼
Very High
High
Medium
Low
Stress Ranking Guidelines
Stress Ranking Table
Very High
High
Medium
Low
Medium
Medium
Medium
Low
High
High
Medium
Low
Low
Low
Low
—
Very High High Medium LowSEVERITYSCOPE➞
Severity of Damage — What level of damage over at least some portion of the target occurrencecan reasonably be expected within 10 years under current circumstances (given the continuation of theexisting management/conservation situation)
Very High The stress is likely to destroy or eliminate the conservation target over someportion of the target’s occurrence at the site
High The stress is likely to seriously degrade the conservation target over some portionof the target’s occurrence at the site
Medium The stress is likely to moderately degrade the conservation target over someportion of the target’s occurrence at the site
Low The stress is likely to only slightly impair the conservation target over someportion of the target’s occurrence at the site
Scope of Damage — What is the geographic scope of impact on the conservation target at thesite that can reasonably be expected within 10 years under current circumstances (given the continuationof the existing situation)
Very High The stress is likely to be very widespread or pervasive in its scope, and affect theconservation target throughout the target’s occurrences at the site
High The stress is likely to be widespread in its scope, and affect the conservationtarget at many of its locations at the site
Medium The stress is likely to be localized in its scope, and affect the conservation targetat some of the target’s locations at the site
Low The stress is likely to be very localized in its scope, and affect the conservationtarget at a limited portion of the target’s location at the site

Appendix A
▼A-7
Use the enclosed Stresses/Sources Worksheets you have prepared for each system (refer to theIllustrative Example); or use the analogous automated worksheets each of the individual conser-vation target pages of the Microsoft Excel workbook entitled Site Conservation/Measures ofConservation Success Workbook.
LIST THE STRESSES TO THE SYSTEM.As column headings in the Sources of Stress table, list the stresses to the conservation target from the
Stresses table in the previous step. (This is done automatically in the Excel worksheet)
IDENTIFY THE SOURCES FOR EACH STRESS.In the Sources of Stress table, list up to eight sources for the stresses to each system. Use the Illustrative
List of Sources in Appendix C as an aide, but also please consider other sources that may be relevant
and significant and cause particular concern. (Note: a source may contribute to more than one stress.)
Also, indicate whether the source is “active” (i.e., expected to contribute additional stress to the conser-
vation target within the next ten years) or “historical” (i.e., expected to contribute no additional stress
to the conservation target wihin the next ten years).
RANK THE SOURCES.Rank each source you identified according to the following scale of significance:
• “Very High”
• “High”
• “Medium”
• “Low”
Please rank each source based on an assessment of both contribution and irreversibility. The attached
Sources-of-Stress Ranking Guidelines provide a set of benchmarks for ranking the contribution and irrever-
sibility of a source to a stress. If a source does not contribute to a stress, leave the cell blank. The set
of rules for determining the Source rank, as a function of contribution and irreversibility, is also provided
in table form. (Note: the Source rank, based on contribution and irreversibility, is determined automatically in
the Stresses/Sources Worksheets of the Excel workbook.)
It is important to document the rationale for selecting sources of stress, and for the contribution
and irreversibility rankings you assign. The Stresses/SourcesWorksheets of the Excel workbook have
fields for including this documentation. See Appendix C for examples.
DETERMINE THREAT RANK FOR EACH SOURCE-STRESS COMBINATION.A Threat rank for each stress-source combination is determined based on the individual Stress and
Source ranks. The Threat rank may be lower than or equal to, but not higher than, the Stress rank,
i.e., the Stress rank serves as an upper limit for the Threat rank. For example, a “Very High” source
of a “Medium” stress is only considered a “Medium” threat. The Individual Threat Ranking Guidelines
Sources of StressInstructions
✎
✎
✎
✎

The Five-S Framework for Site Conservation—Appendices
A-8▼
(page A-10) provide the set of rules, in table form, for ranking individual threats based on Stress and
Source ranks. (Note: the Individual Threat ranks, based on Stress and Source ranks, are determined auto-
matically in the Excel worksheet).
ENTER A THREAT-TO-SYSTEM RANK.The Threat-to-System rank is the summary ranking of all threats associated with a particular
source of stress for a conservation target. Each Threat-to-System rank summarizes the individual
threat ranks shown in each stress column. The Threat-to-System rank is found in the far right
column of the “Sources of Stress” table in each of the Stresses-Sources-Strategies worksheets. You
can use the Threat-to-System Ranking Guidelines (pg. A-10) as an aide to determine these ranks
manually.
Note: Threat-to-System Ranks are determined automatically in the Stresses-Sources-Strategies worksheets
of the Excel workbook.
✎

Appendix A
▼A-9
Irreversibility — Reversibility of the stress caused by the source of stress
Very High The source produces a stress that is not reversible, for all intents and purposes(e.g. wetland converted to shopping center)
High The source produces a stress that is reversible, but not practically affordable(e.g. wetland converted to agriculture)
Medium The source produces a stress that is reversible with a reasonable commitment ofadditional resources (e.g. ditching and draining of wetland)
Low The source produces a stress that is easily reversible at relatively low cost (e.g.ORVs trespassing in wetland)
Source-of-Stress Ranking Guidelines
Contribution — Expected contribution of the source, acting alone, to the full expression of a stress(as determined in the stress assessment) under current circumstances (i.e., given the continuation of theexisting management/conservation situation)
Very High The source is a very large contributor of the particular stress
High The source is a large contributor of the particular stress
Medium The source is a moderate contributor of the particular stress
Low The source is a low contributor of the particular stress
Very High
High
Medium
Low
Very High
Very High
High
High
High
Medium
Medium
Low
High
High
Medium
Medium
Medium
Medium
Low
Low
Very High High Medium LowIRREVERSIBILITYCONTRIBUTION➞
Source Ranking Table

The Five-S Framework for Site Conservation—Appendices
A-10▼
Individual Threat Ranking GuidelinesDetermine the Individual Threat Rank for each Stress-Source combination, based on the following
table:
Very High
High
Medium
Low
Very High
High
Medium
Low
High
Medium
Low
Low
Very High
High
Medium
Low
Medium
Low
Low
—
Very High High Medium Low
STRES
SSOURCE
Threat-to-System Ranking GuidelinesThe Threat-to-System rank is determined by combining the individual ranks to which the source
contributes using the following rules:
Threat-to-System rank is never less than the highest Individual Threat Rank associated with a
particular source of stress. For example, if any one of the threats associated with a source of
stress is ranked Medium, the Threat-to-System rank will be at least Medium.
3-5-7 Rule
If there are multiple Individual Threat ranks for the same source of stress, the Threat-to-
System rank may be adjusted upwards by using the “3-5-7” rule as follows:
Three High ranks equal a Very High 3H = 1VHFive Medium ranks equal a High 5M = 1HSeven Low ranks equal a Medium 7L = 1M
For example, assume you have the following Individual Threat ranks associated with a source of
stress: two High’s and five Medium’s. The rules would be used to resolve the Threat-to-System
rank as follows:
The Threat-to-System rank must be at least “High”. However, you must also determine if
the presence of five Medium’s elevates the rank. Apply the “3-5-7” rule to find out.
2H + 5M Given
2H + 1H = 3H Because 5M = 1H according to the “3-5-7” Rule
= 1VH Because 3H =1VH according to the “3-5-7” Rule
Yes, five Medium Individual Threat ranks increase the Threat-to-System rank from “High”
to “Very High”.
Here are some other combinations and their “solutions”. If the application of the rule is unclear,
try to resolve these:
Individual Threat Ranks Threat-to System Rank
One Medium and Seven Low’s Medium
Four Medium’s and Seven Low’s High
One Very High and Anything Very High
▲▲

Appendix A
▼A-11
Stresses/Sources Worksheet
Site
Name of System
Description:
Stresses
List stresses and provide stress ranks below.
Note: Sources of Stress continued on next page.
StressStress Severity Scope Rank

Stre
sses
Sourc
esof
Stre
ss
Thre
at-
to-
Syst
emRank
Con
tribu
tion
Irrev
ersi
bilit
y
Sour
ce
Con
tribu
tion
Irrev
ersi
bilit
y
Sour
ce
Con
tribu
tion
Irrev
ersi
bilit
y
Sour
ce
Con
tribu
tion
Irrev
ersi
bilit
y
Sour
ce
Con
tribu
tion
Irrev
ersi
bilit
y
Sour
ce
Con
tribu
tion
Irrev
ersi
bilit
y
Sour
ce
Con
tribu
tion
Irrev
ersi
bilit
y
Sour
ce
Con
tribu
tion
Irrev
ersi
bilit
y
Sour
ce
CO
LUM
NS:
Lis
t as
col
umn
head
ings
the
str
esse
s to
the
sys
tem
from
the
Str
ess
tabl
e on
the
pre
viou
s pa
ge.
RO
WS:
Lis
t up
to
eigh
t so
urce
s in
the
firs
t co
lum
n. R
ecor
d C
ontr
ibut
ion,
Irr
ever
sibi
lity,
and
Sou
rce
rank
s (l
eft
of d
ivid
er)
and
Th
reat
ran
k (
righ
t of
div
ider
) fo
r ea
ch s
ourc
e in
the
sub
se-
quen
t co
lum
ns. T
hrea
t-to
-Sys
tem
ran
k fo
r ea
ch s
ourc
e is
rec
orde
d in
the
last
col
umn.
Stre
sses
/Sourc
es W
ork
shee
t (p
age
2):
Sour c
es o
f St
ress
Act
ive/
His
toric
al
Act
ive/
His
toric
al
Act
ive/
His
toric
al
Act
ive/
His
toric
al
Act
ive/
His
toric
al
Act
ive/
His
toric
al
Act
ive/
His
toric
al
Act
ive/
His
toric
al

Appendix A
▼A-13
Stresses/Sources Worksheet—Illustrative Example
Site
Name of System
Description:
Agate Desert, OR
Vernal pools/mounded prairie
StressesList stresses and provide stress ranks below.
Note: Sources of Stress continued on next page.
StressStress Severity Scope Rank
Habitat destruction or conversion
Altered composition/structure
Extraordinary competition for resources
Habitat disturbance
Excessive herbivory
Nutrient loading
Extraordinary predation/disease
Very High
High
High
High
High
Medium
Medium
High
High
High
Medium
High
Medium
Medium
High
High
High
Medium
High
Medium
Medium

Prim
ary
hom
ede
velo
pmen
t (A
ctiv
e)
Com
mer
cial
/in
dust
rial
deve
lopm
ent
(Act
ive)
Gra
zing
pra
ctic
es(A
ctiv
e)
Fire
Sup
pres
sion
(Act
ive)
Wet
land
Fill
(His
tori
cal)
Inva
sive
/alie
n sp
ecie
s(A
ctiv
e)
Was
tew
ater
trea
tmen
t(A
ctiv
e)
Con
vers
ion
toag
ricu
ltur
e(A
ctiv
e)
Hab
itat
Des
tru
ctio
n/
Con
vers
ion
Alt
ered
Com
pos
itio
n/
Stru
ctu
re
Com
pet
itio
nfo
rR
esou
rces
Hab
itat
Dis
turb
ance
Hig
h
Hig
h
Hig
h
Med
ium
Med
ium
Hig
h
Low
Hig
h
M VH H M VH H L H M H H H
Exc
essi
veH
erbi
vory
Med
ium
H H H
Stre
sses
Sourc
esof
Stre
ss
Thre
at-
to-
Syst
emRank
Con
tribu
tion
Irrev
ersi
bilit
y
Sour
ce
Con
tribu
tion
Irrev
ersi
bilit
y
Sour
ce
Con
tribu
tion
Irrev
ersi
bilit
y
Sour
ce
Con
tribu
tion
Irrev
ersi
bilit
y
Sour
ce
Con
tribu
tion
Irrev
ersi
bilit
y
Sour
ce
Con
tribu
tion
Irrev
ersi
bilit
y
Sour
ce
Con
tribu
tion
Irrev
ersi
bilit
y
Sour
ce
Con
tribu
tion
Irrev
ersi
bilit
y
Sour
ce
CO
LUM
NS:
Lis
t as
col
umn
head
ings
the
str
esse
s to
the
sys
tem
from
the
Str
ess
tabl
e on
the
pre
viou
s pa
ge.
RO
WS:
Lis
t up
to
eigh
t so
urce
s in
the
firs
t co
lum
n. R
ecor
d C
ontr
ibut
ion,
Irr
ever
sibi
lity,
and
Sou
rce
rank
s (l
eft
of d
ivid
er)
and
Th
reat
ran
k (
righ
t of
div
ider
) fo
r ea
ch s
ourc
e in
the
sub
se-
quen
t co
lum
ns. T
hrea
t-to
-Sys
tem
ran
k fo
r ea
ch s
ourc
e is
rec
orde
d in
the
last
col
umn.
Stre
sses
/Sourc
es W
ork
shee
t (p
age
2):
Sour c
es o
f St
ress
—Ill
ust
rative
Ex
am
ple
Hig
h
H H H
Hig
h
H H H
Hig
h
H H H
M M M H M M
Med
ium
Med
ium
Med
ium
Med
ium
M M M M M M
Low
M L L
Med
ium
H H H
Low
L L L
Hig
h
VH M H
Low
M L L
Low
M M M
Low
L M L
Nu
trie
nt
Loa
din
gE
xtra
ord
inar
yP
red
atio
n
Med
ium
Hig
h
Hig
h
Hig
h

Appendix A
▼A-15
Use the attached Threat SummaryWorksheets (refer to the Illustrative Example); or use the
analogous worksheet templates on the sum-mary sheet of the Microsoft Excel workbook entitled
Site Conservation/Measures of Conservation Success Workbook. Note that there is a separate
Threat Summary Worksheet for “active” and “historical” sources of stress, respectively. (Note:
all steps described on this page are completed automatically by the Threat Summary Worksheets in the
Excel workbook.)
LABEL THE WORKSHEET with the name of the site. Fill in the sources of stress and their
Threat-to-System ranks for each system (taken from the Stresses/Sources worksheets). Active sources
of stress should be listed in the Threat Summary for Active Sources table; historical sources of stress
should be listed in the Threat Summary for Historical Sources table.
DETERMINE OVERALL THREAT RANK FOR EACH SOURCE OF STRESS.The Overall Threat Rank (far right column of worksheet) for a given source of stress is determined
by combining the Threat-to-System ranks for that source across all the identified systems at the site.
Overall Threat ranks can be determined manually by applying the following rules.
If a source threatens multiple systems, apply the “3-5-7” rule to aggregate the Threat-to-
System ranks of the source. (See page A-10 for an explanation of this rule.)
Apply the “2 prime” rule to further aggregate the ranks.
Two Very High threat rankings yield an Overall Threat Rank of Very High
One Very High or two High threat rankings yield an Overall Threat Rank of High
One High or two Medium threat rankings yield an Overall Threat Rank of Medium
Less than two Medium threat rankings yield an Overall Threat Rank of Low
Further description of these rules can be found in the Scoring Worksheet of the Excel spreadsheet.
DETERMINE THE “THREAT STATUS” OF THE SITE.The Threat Status of the site is determined by applying the 2-Prime Rule, as described above, to the
Overall Threat ranks of the eight highest-ranked active sources.
On the Summary Worksheet for Active Sources, aggregate the Overall Threat ranks of the
eight highest-ranked active sources using the Prime Rule: three “High” threats are equivalent
to one “Very High” threat; five “Medium” threats are equivalent to one “High” threat; and
seven “Low” threats are equivalent to one “Medium” threat.
Next, examine the aggregated Overall Threat ranks. If there are at least two “Very High”
ranks, the Threat Status is “Very High”; at least two “High” ranks (or one “Very High” and
one “High”), the Threat Status is “High”; at least two “Medium” ranks (or one “High” and
one “Medium”), the Threat Status is “Medium.”
Overall Threat RanksInstructions
▲▲
✎
✎
✎

Syste
mO
neSy
stem
Two
Syste
mTh
ree
Syste
mFo
urSy
stem
Five
Syste
mSi
xSy
stem
Seve
nSy
stem
Eigh
t
Thre
at
Sum
mary
Work
shee
t—A
ctiv
e So
urc
es
Site
Fill
in t
he T
hrea
t-to
-Sys
tem
ran
k fo
r ea
ch S
yste
m-S
ourc
e co
mbi
nati
on,
and
dete
rmin
e th
e O
vera
ll T
hrea
t ra
nk f
or e
ach
Act
ive
Sour
ce u
sing
the
2-Pr
ime
Rul
e.
Ove
rall
Thre
at
Rank
Sourc
es
Det
erm
ine
Thr
eat
Stat
us b
y ap
plyi
ng t
he 2
-Pri
me
Rul
e to
the
eig
ht h
ighe
st-r
anke
d O
vera
ll T
hrea
ts.
Thre
at
Statu
s and A
bate
men
t =

Syste
mO
neSy
stem
Two
Syste
mTh
ree
Syste
mFo
urSy
stem
Five
Syste
mSi
xSy
stem
Seve
nSy
stem
Eigh
t
Thre
at
Sum
mary
Work
shee
t—H
isto
rica
l Sourc
es
Site
Fill
in t
he T
hrea
t-to
-Sys
tem
ran
k fo
r ea
ch S
yste
m-S
ourc
e co
mbi
nati
on, a
nd d
eter
min
e th
e O
vera
ll T
hrea
t ra
nk f
or e
ach
His
tori
cal S
ourc
e us
ing
the
2-Pr
ime
Rul
e.
Ove
rall
Thre
at
Rank
Sourc
es

The Five-S Framework for Site Conservation—Appendices
A-18▼
Com
mer
cial
/indu
stri
al d
evel
opm
ent
Con
vers
ion
to a
gric
ultu
re o
r si
lvic
ultu
re
Gra
zing
pra
ctic
es
Prim
ary
hom
e de
velo
pmen
t
Inva
sive
/alie
n sp
ecie
s
Fire
sup
pres
sion
Poac
hing
or
com
mer
cial
col
lect
ing
(sna
gs &
logs
)
Was
tew
ater
tre
atm
ent
Log
deck
deb
ris
Ove
rall
Thre
ats
Work
shee
t—A
ctiv
e So
urc
es:
Illust
rative
Ex
am
ple
Site
Fill
in th
e T
hrea
t-to
-Sys
tem
ran
k fo
r ea
ch S
yste
m-S
ourc
e co
mbi
nati
on, a
nd d
eter
min
e th
e O
vera
ll T
hrat
ran
k fo
r ea
ch S
ourc
e us
ing
the
2-Pr
ime
Rul
e.
Ove
rall
Thre
at
Rank
Sourc
es
Det
erm
ine
Thr
eat
Stat
us b
y ap
plyi
ng t
he 2
-Pri
me
Rul
e to
the
eig
ht h
ighe
st-r
anke
d O
vera
ll T
hrea
ts.
Thre
at
Statu
s and A
bate
men
t =
Hig
h
Hig
h
Hig
h
Hig
h
Hig
h
Med
ium
Low
Med
ium
Hig
h
Med
ium
Med
ium
Med
ium
Low
Low
Med
ium
Med
ium
Hig
h
Med
ium
Med
ium
Med
ium
Hig
h
Hig
h
Hig
h
Med
ium
Med
ium
Med
ium
Med
ium
Med
ium
Low
Med
ium
Low
Med
ium
Vern
al p
ools
/m
ound
edpr
airi
e
Vern
al p
ool
fair
y sh
rim
p.Lo
mat
ium
cook
iiLi
mna
nthe
ssp
ecie
sC
hapa
rral
Hig
h
Hig
h
Hig
h
Hig
h
Med
ium
Med
ium
Med
ium
Low
Low
Aga
te D
eser
t, O
R
Hig
h
Pine
- O
ak
Hig
h
Hig
h
Med
ium
Med
ium
Hig
h